
Research on the Efficiency of China’s Fiscal Expenditure Structure under the Goal of Inclusive Green Growth


Abstract
:1. Introduction
2. Related Theoretical Explanation and Model Construction
2.1. The Theoretical Explanation of Inclusive Green Growth
2.2. The Internal Relationship between Fiscal Expenditure Structure and Inclusive Green Growth
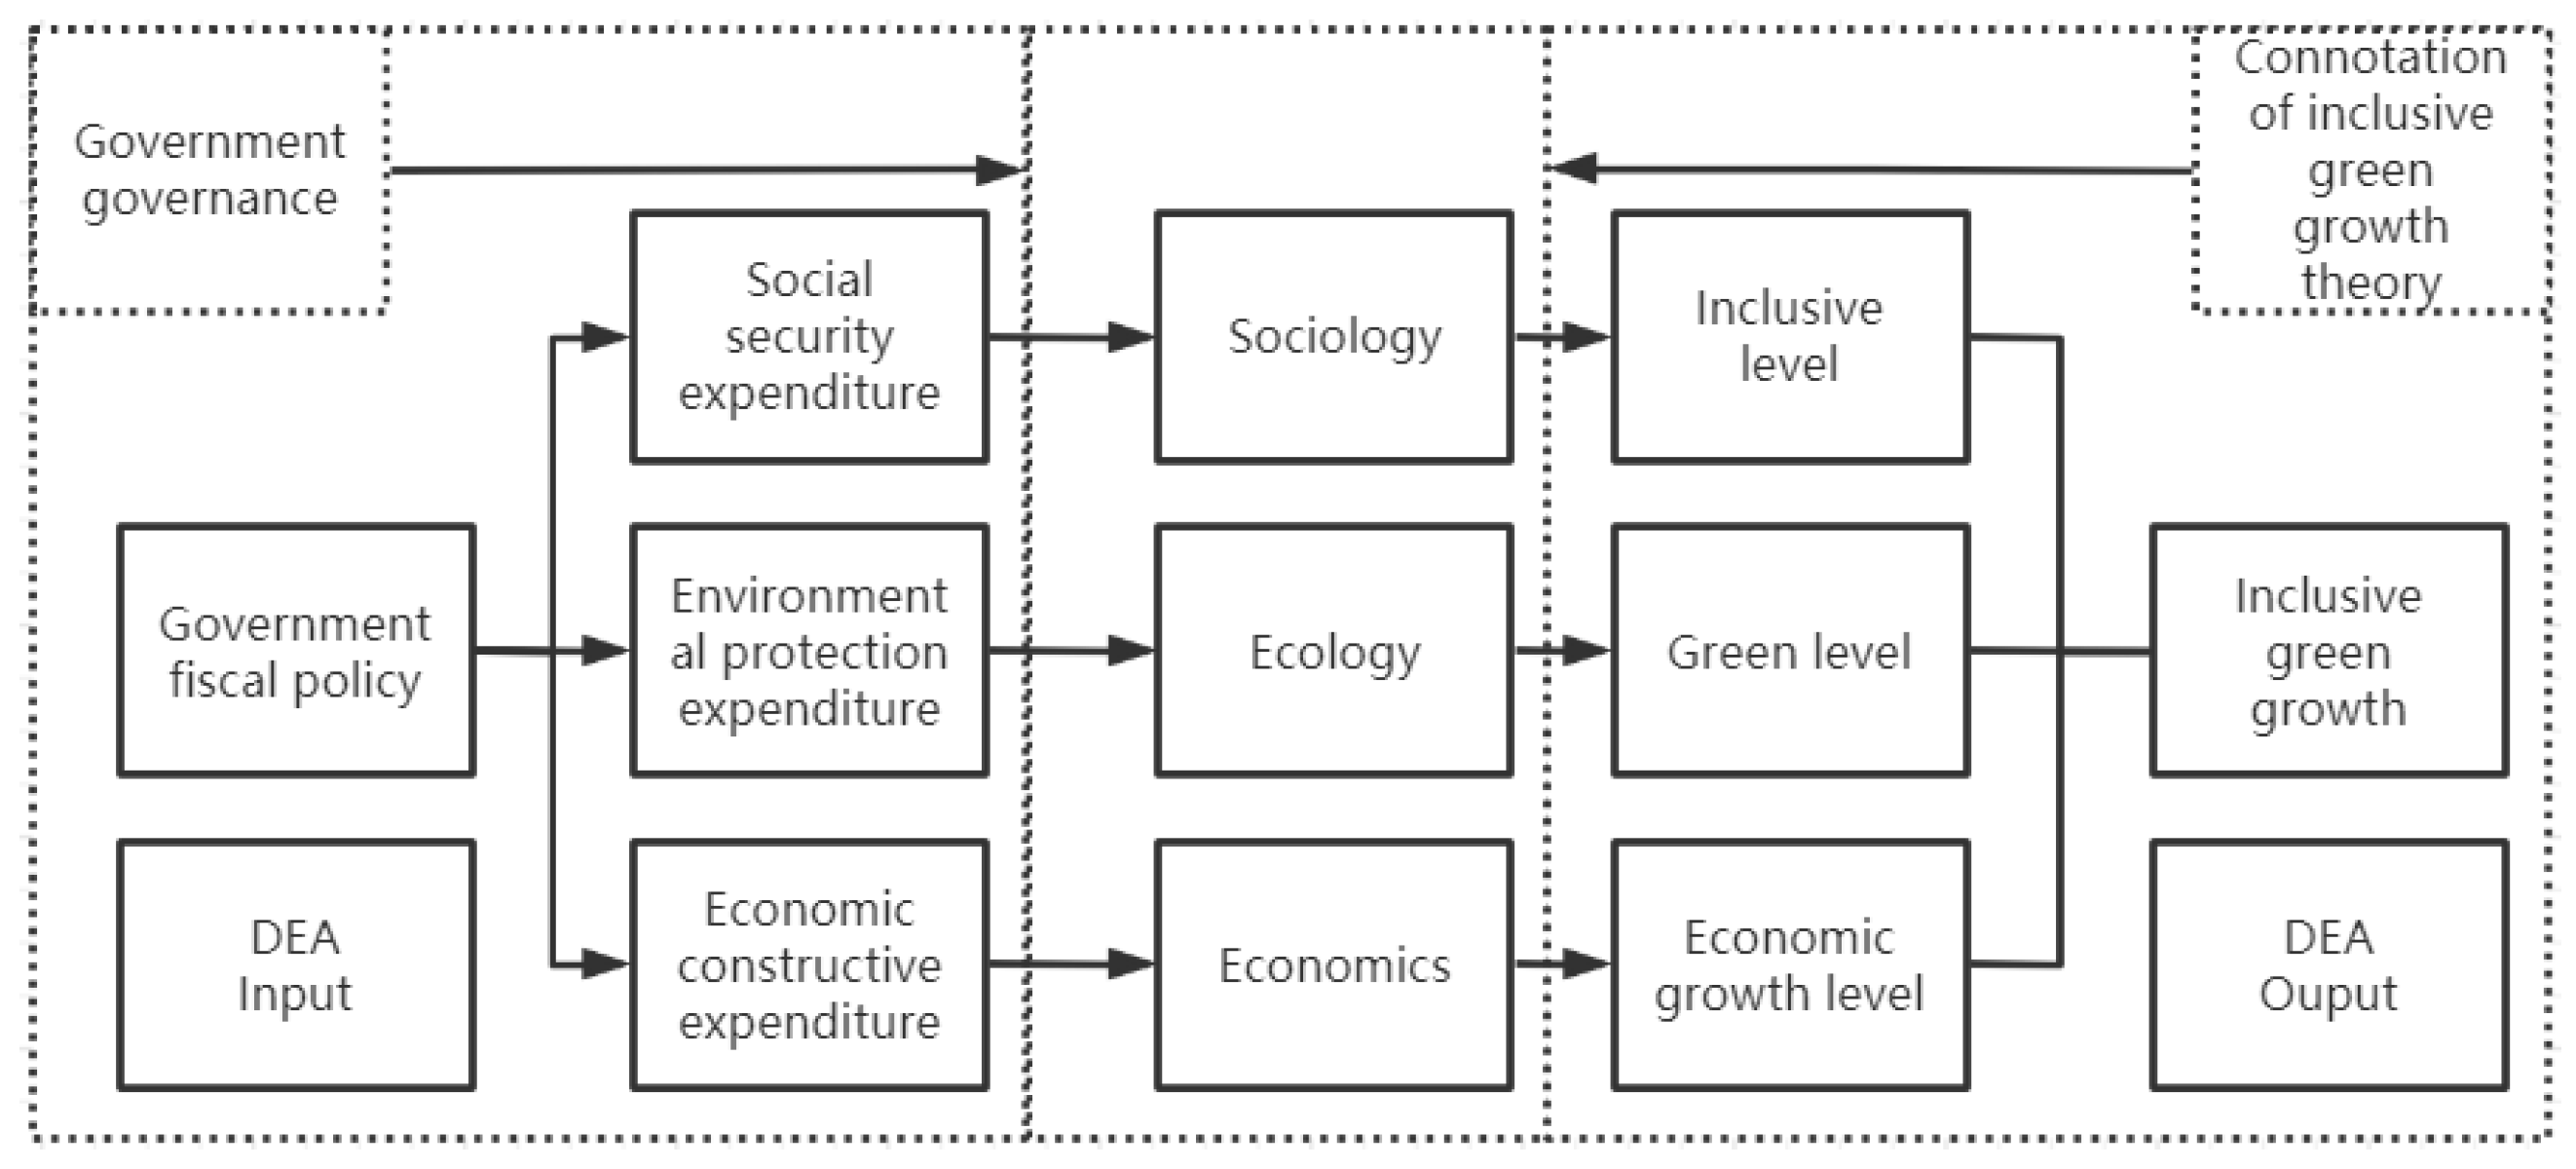
2.3. Theoretical Model Construction
3. The Construction of Inclusive Green Growth Index System and the Analysis of Spatial and Temporal Heterogeneity
3.1. The Dimension Setting of Inclusive Green Growth Indicators
3.1.1. Dimension Setting of Inclusion Level
3.1.2. Dimension Setting of Green Level
3.1.3. Dimension Setting of Economic Development Level
3.2. Calculation and Analysis of Index Weight of Inclusive Green Growth
3.2.1. Data Sources
3.2.2. Weight Processing Method and Calculation
3.2.3. Weight System Analysis
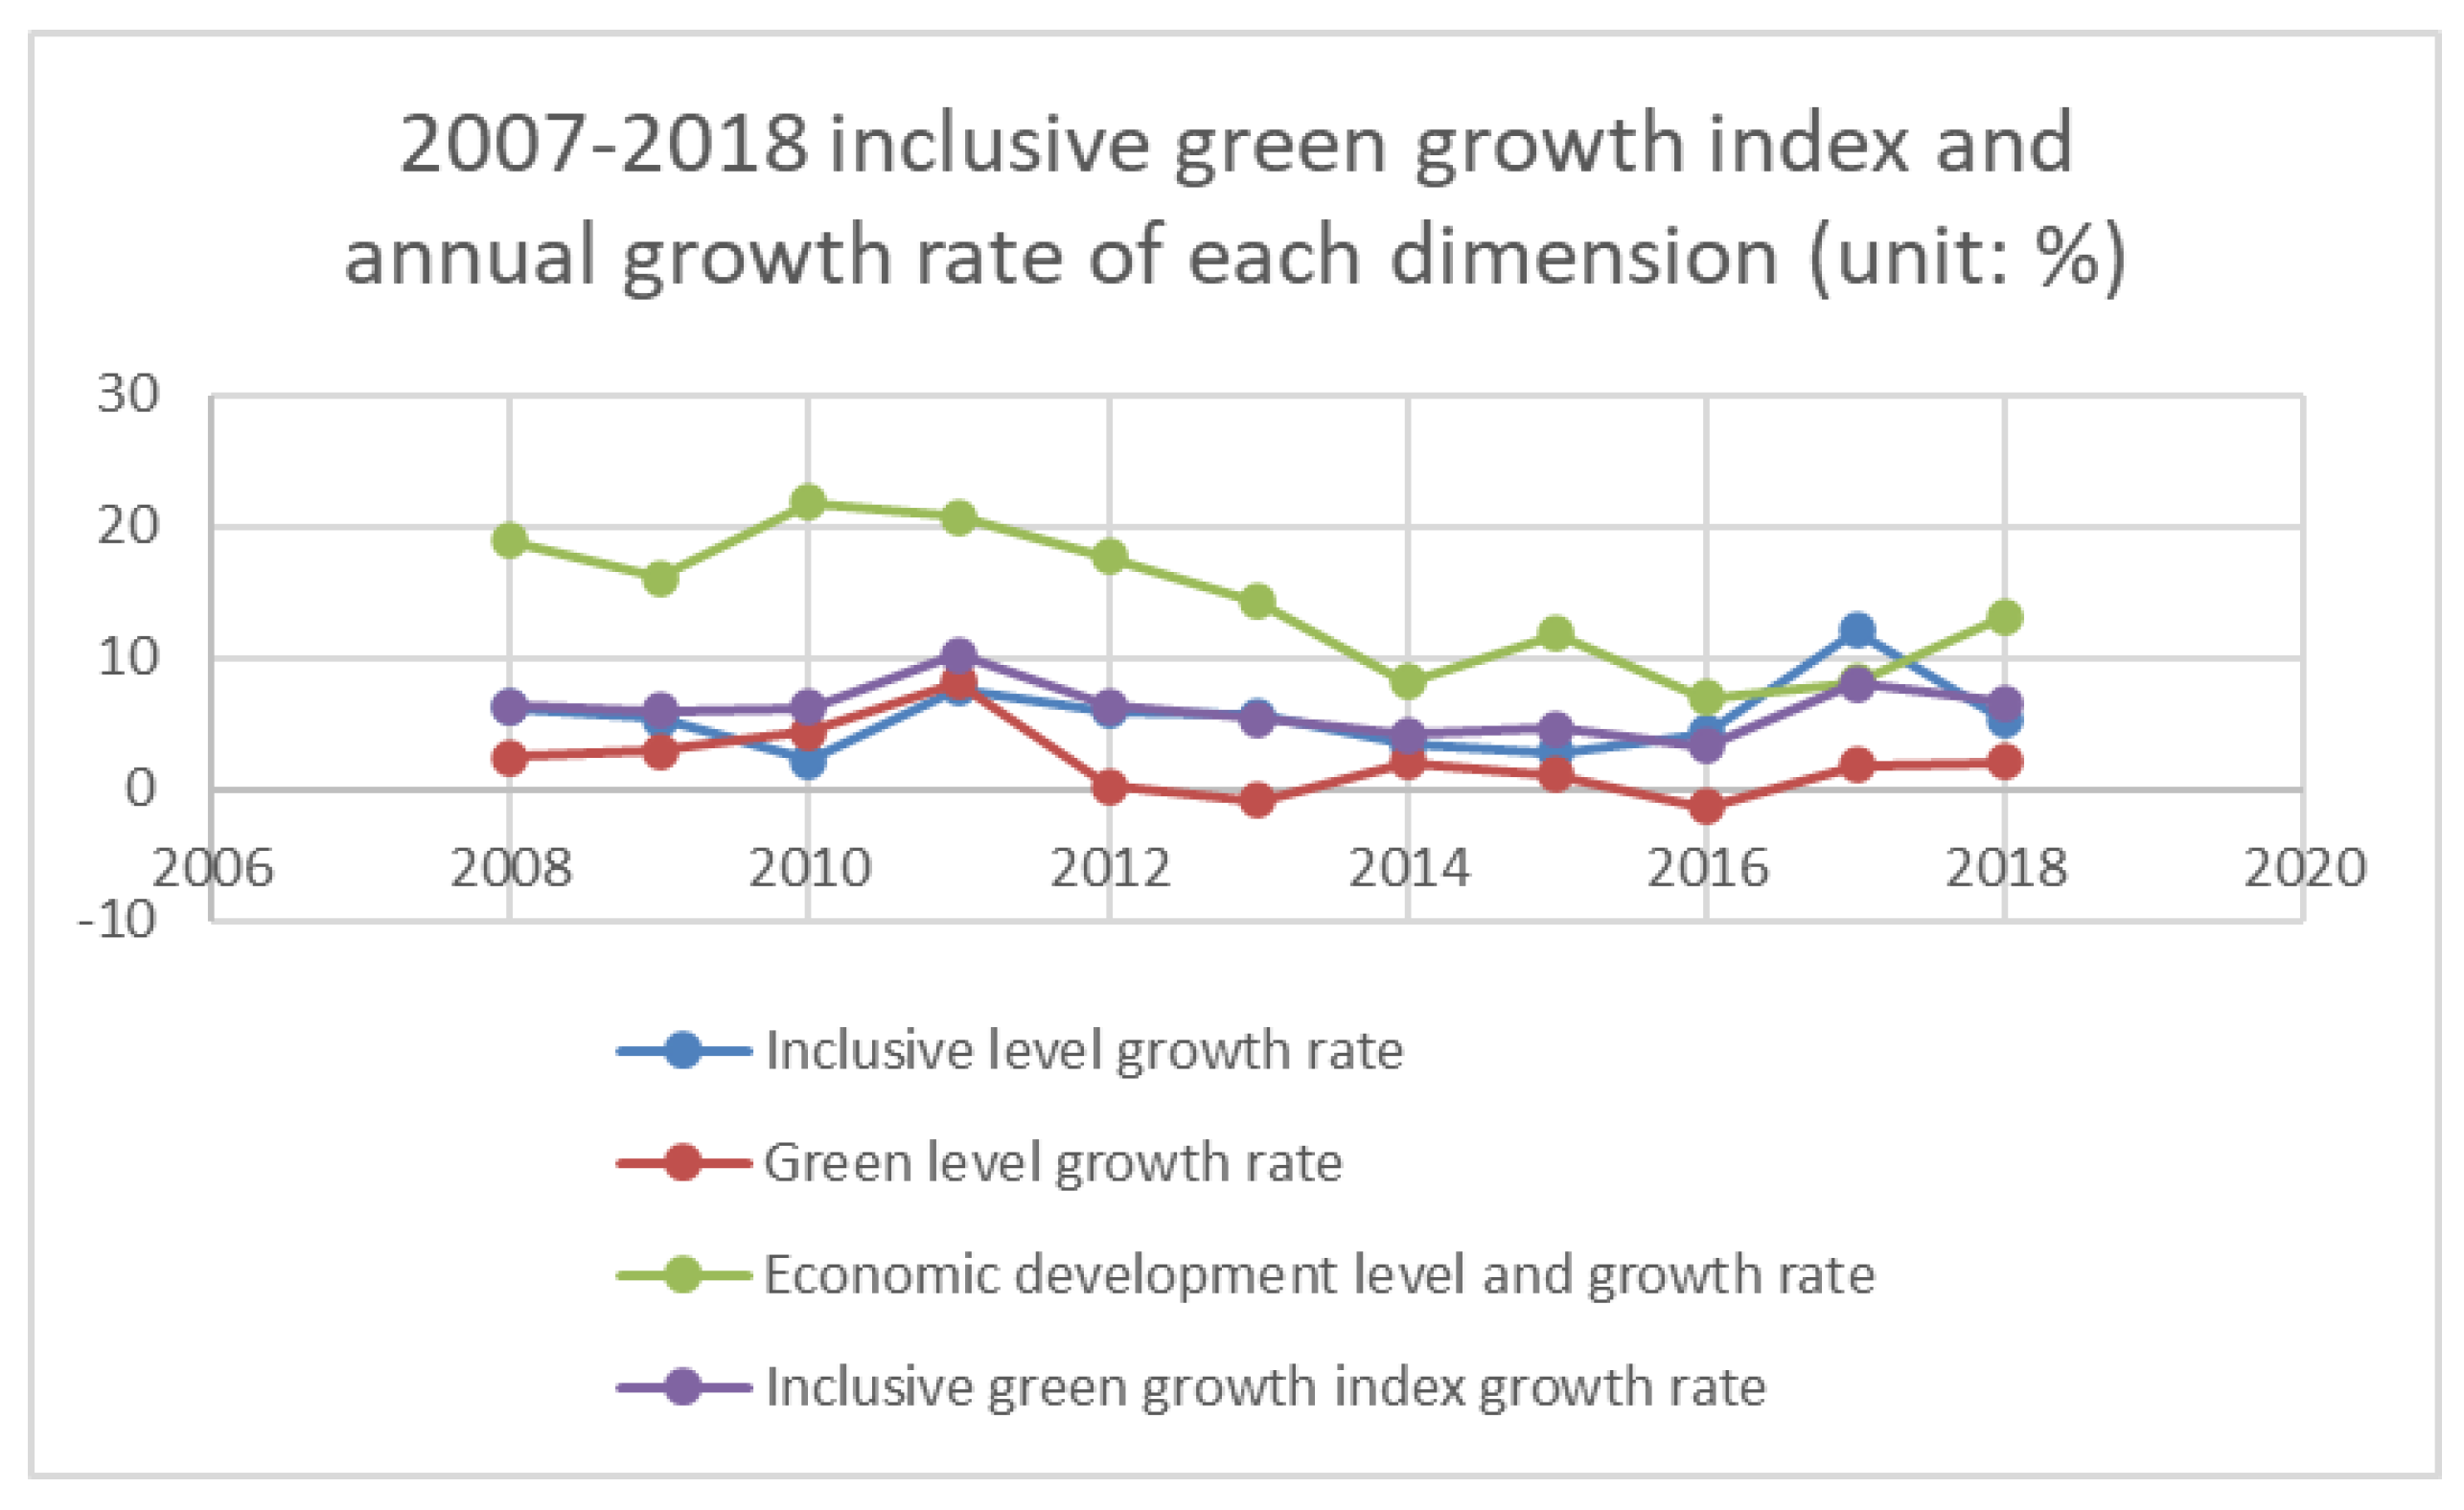
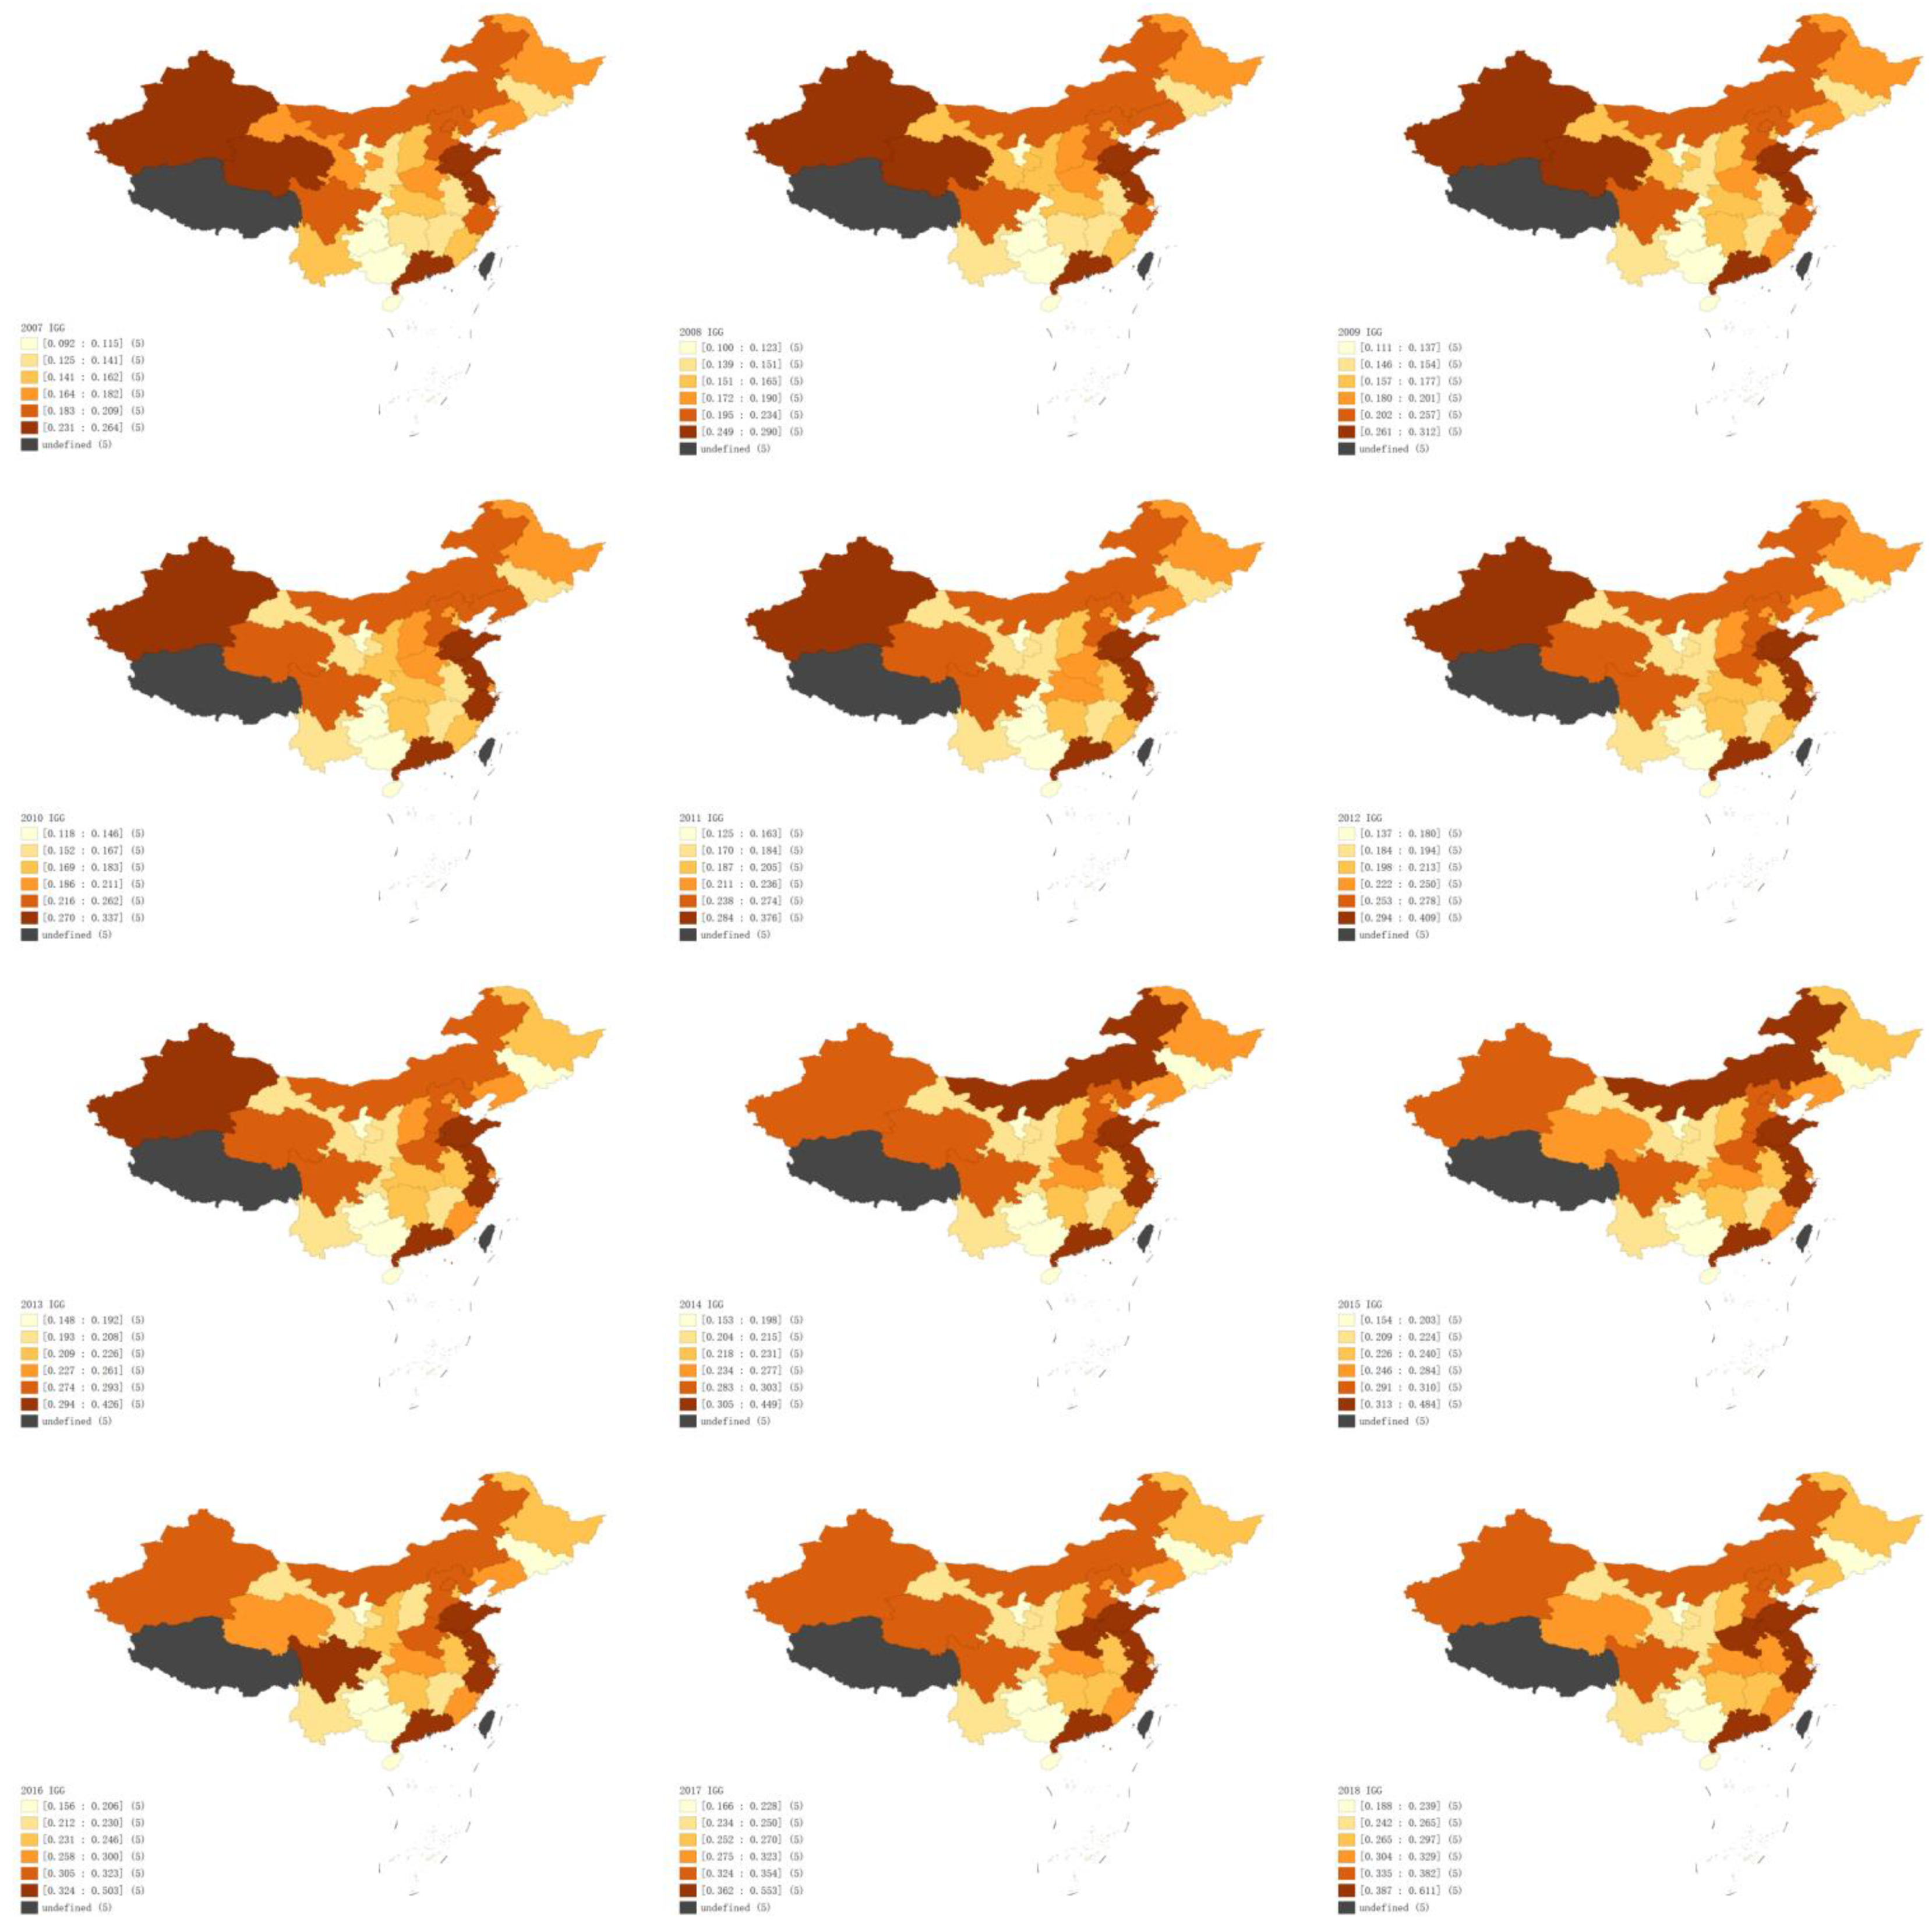
3.3. Measurement and Analysis of the Change Rate of Inclusive Green Growth index
4. Relative Efficiency and Temporal Spatial Difference of Government Expenditure Structure under the Goal of Inclusive Green Growth
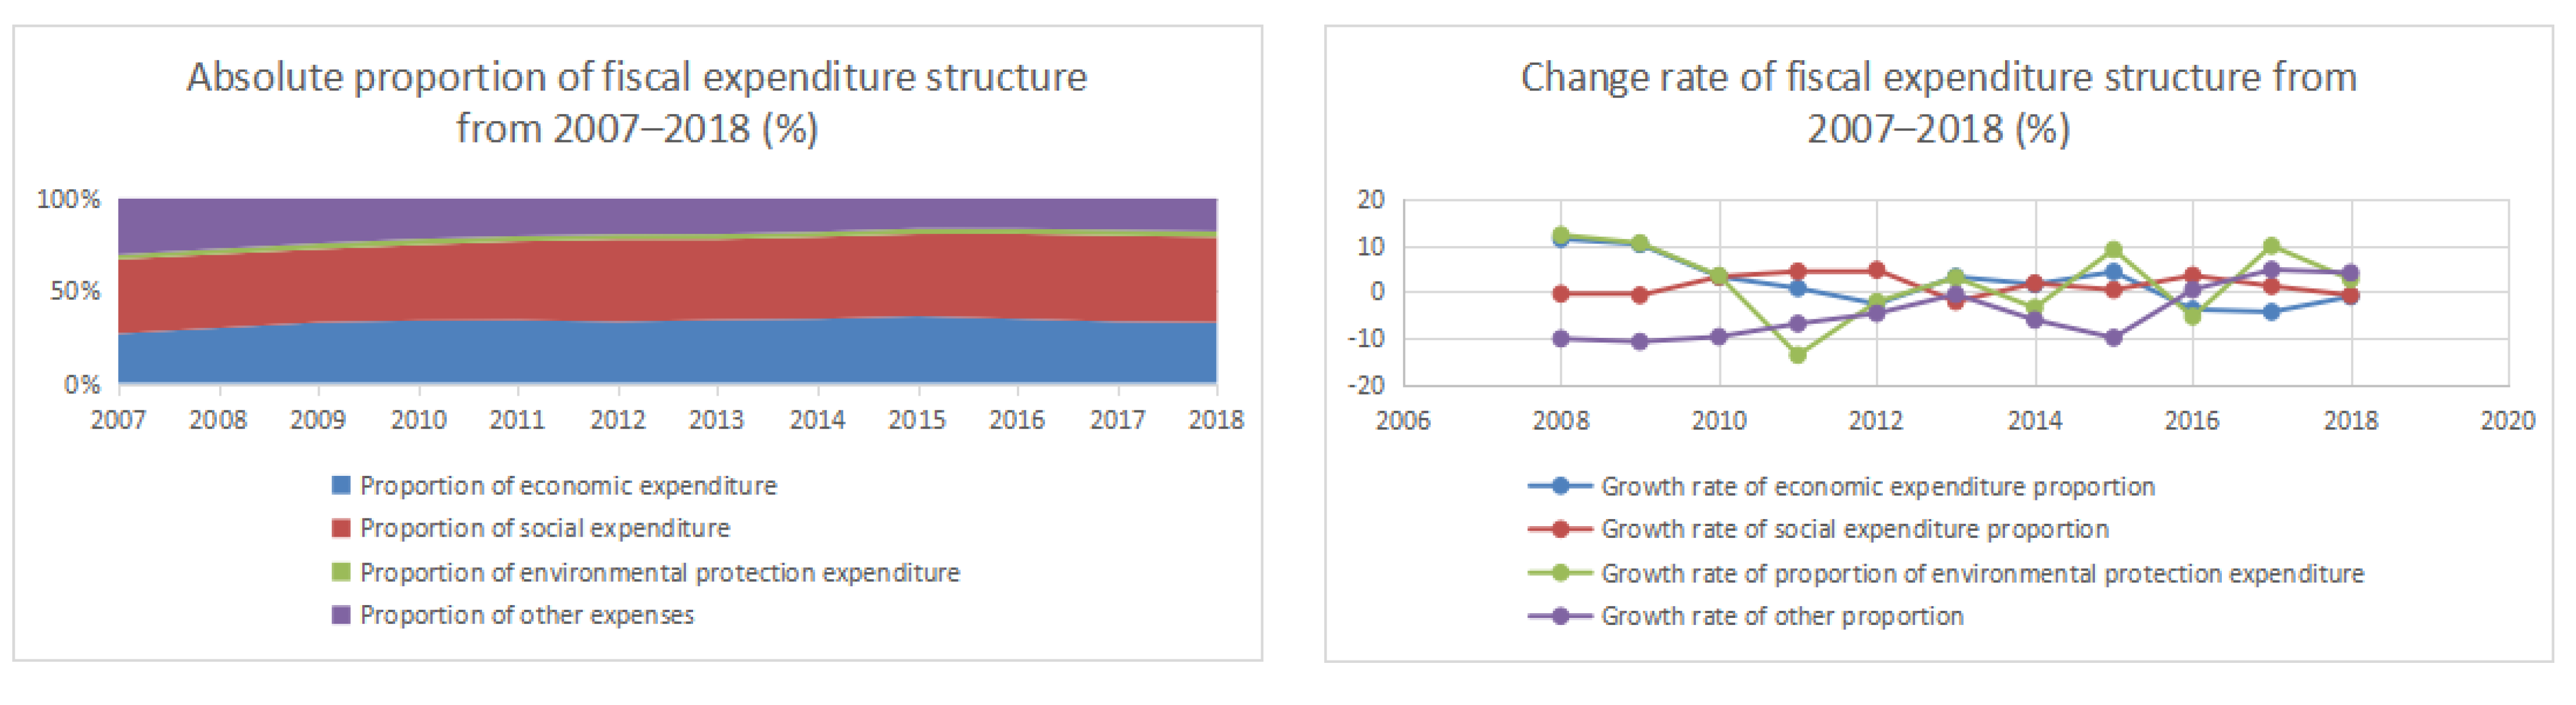
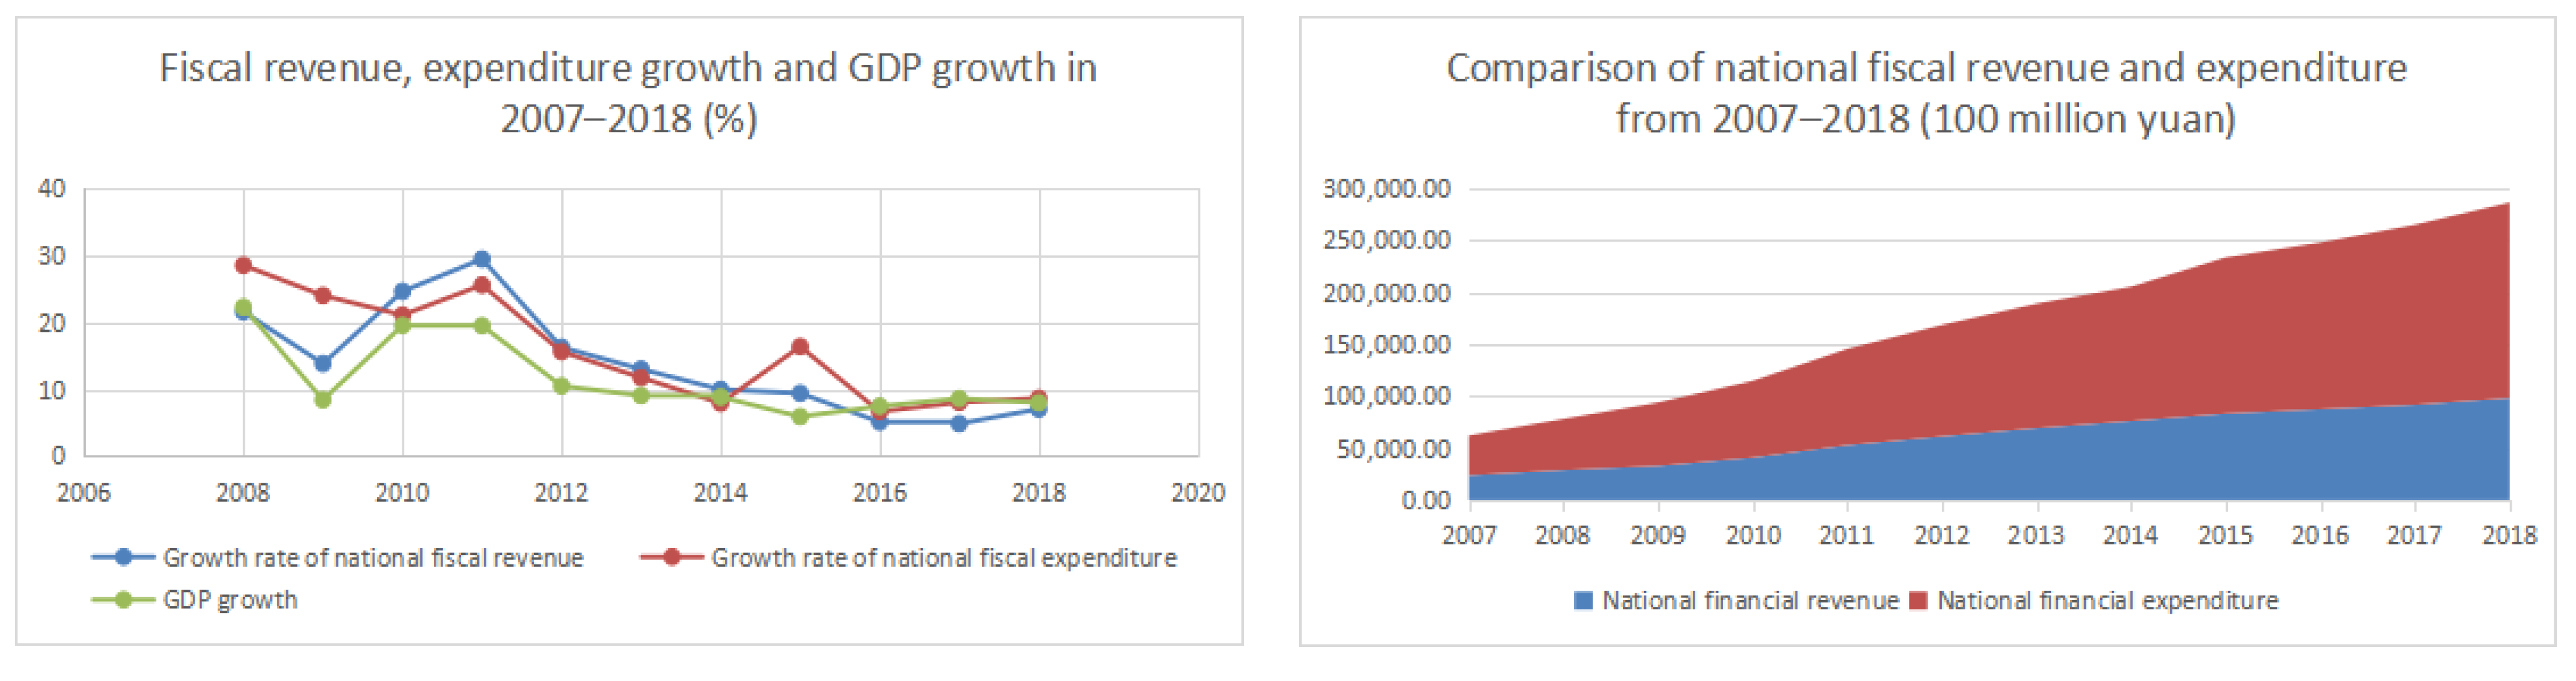
4.1. The Changing Trend of Fiscal Expenditure Structure
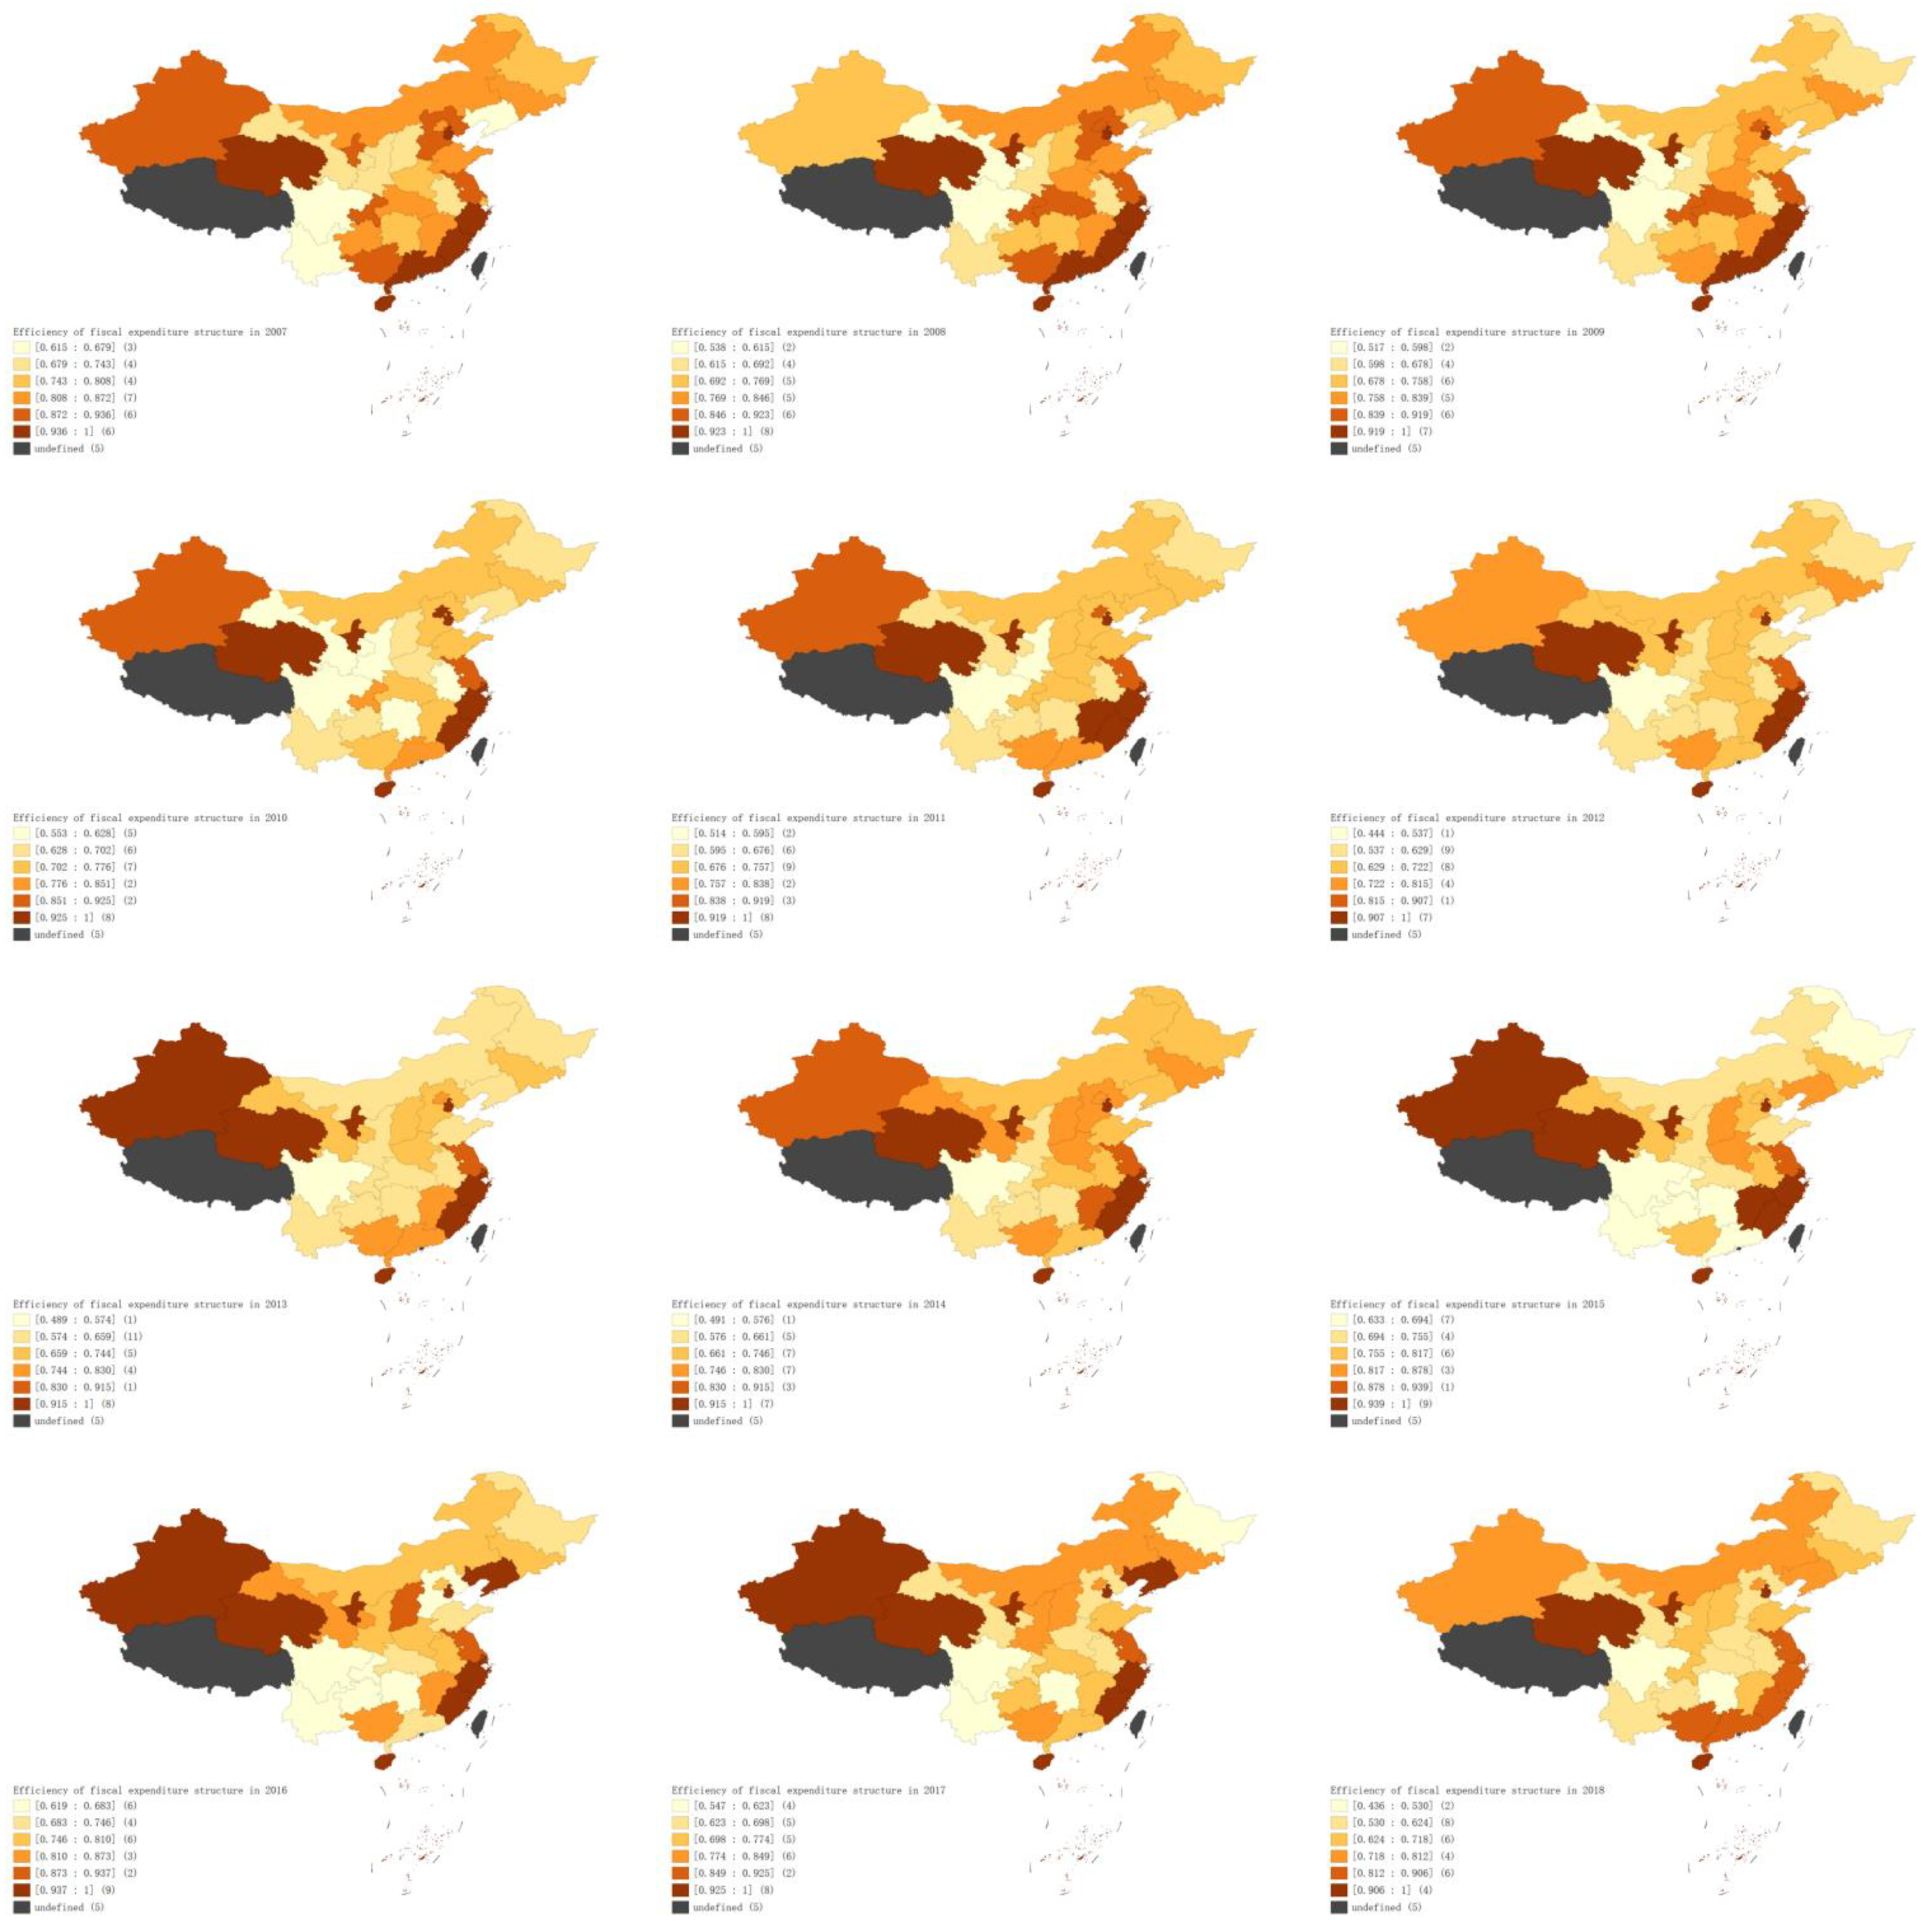
4.2. Static Efficiency and Spatial Heterogeneity of Fiscal Expenditure Structure under Inclusive Green Growth Target
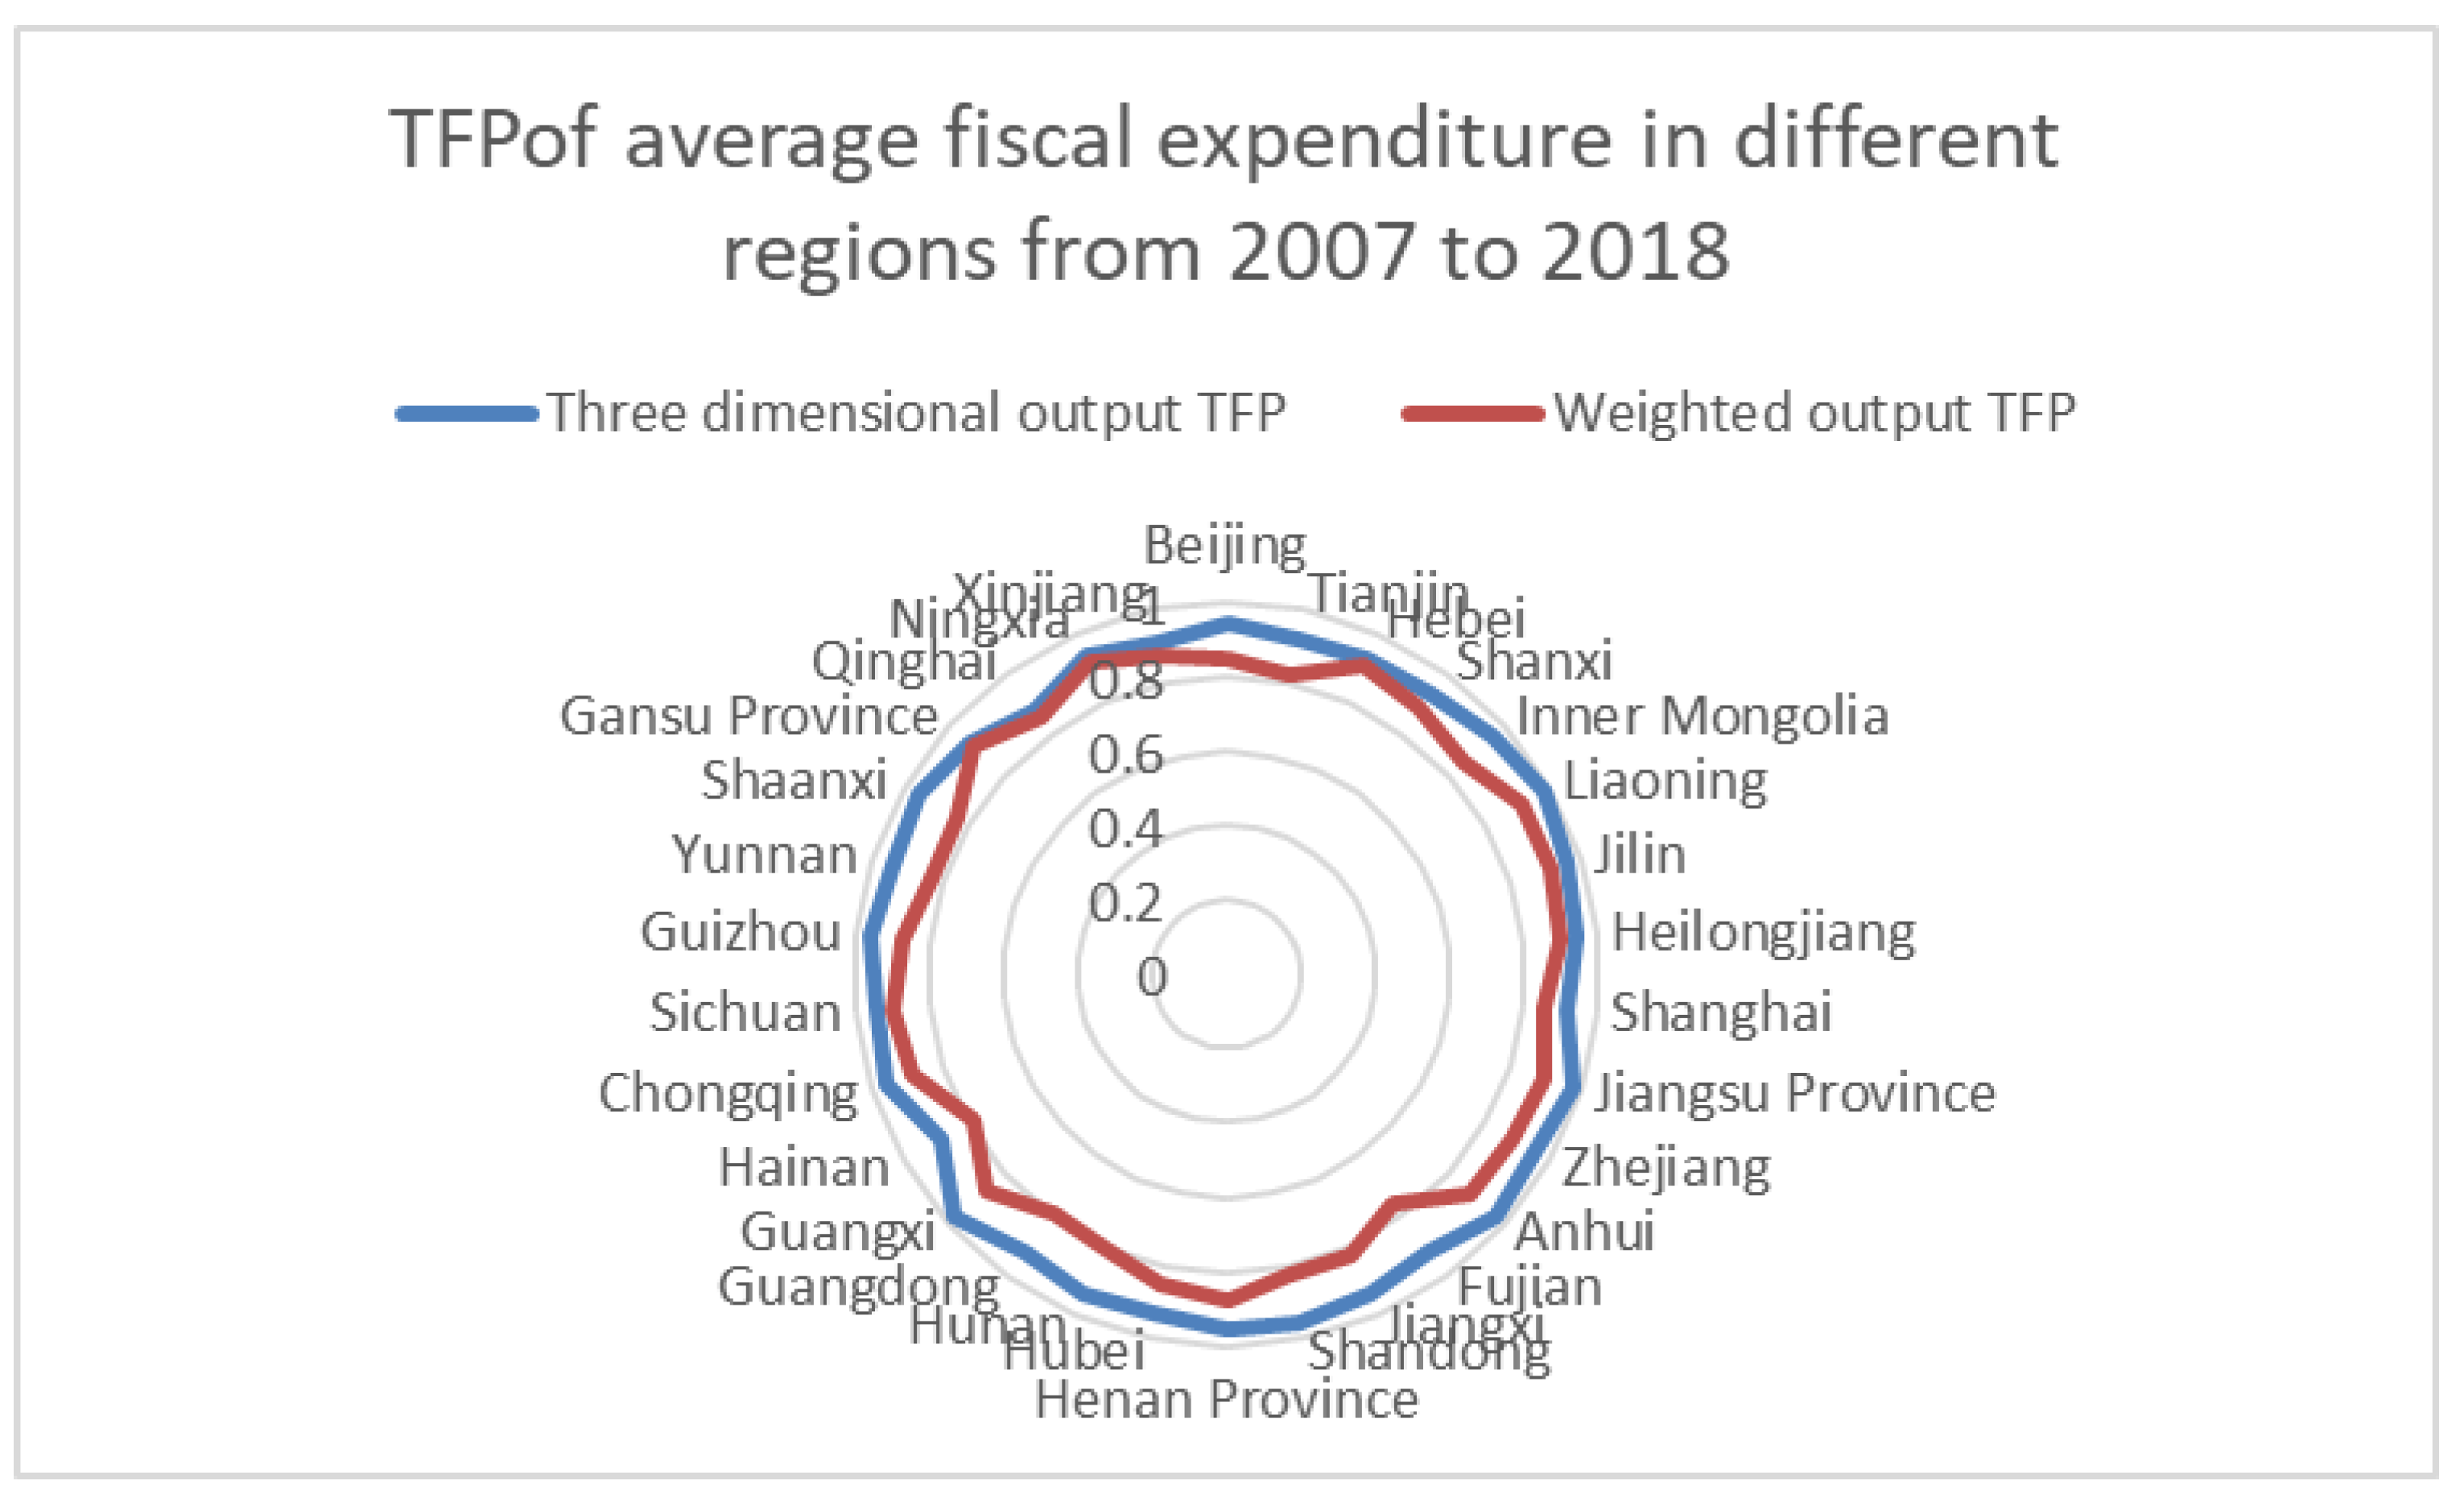
4.3. Dynamic Efficiency of Fiscal Expenditure Structure under the Goal of Inclusive Green Growth
5. Main Conclusions and Research Prospect
- (1)
- Different from the previous research results of Inclusive Green Growth from the perspective of counties (Li et al., 2021) [34] and counties (Chen et al., 2020) [33] or a few indicators (Sun et al., 2020) [41], this paper constructs an evaluation index system covering multiple dimensions from the perspective of regions, and it expands the application of Inclusive Green Growth at the provincial level. In particular, for China’s fiscal policy system, the measurement results of Inclusive Green Growth at the provincial level can well match the regional fiscal expenditure. The fiscal expenditure efficiency is calculated, which provides a basis for the study of regional heterogeneity. The growth rate of the Inclusive Green Growth index shows a downward trend year by year under the background of the new normal economy. After the implementation of the supply-side structural reform in 2016, the downward trend of the growth rate has eased. The recovery of the overall index growth rate benefits from the increase in the growth rate of the inclusive level, while the growth rate of the green level has had little change in recent years. Therefore, at a time when the international trade is not optimistic, the domestic economy has great downward resistance, and the technological revolution has not yet arrived, the government should focus on technological breakthrough, social equity, and environmental protection, continue to deepen the supply-side structural reform, and do a good job in the internal adjustment of the country, so as to lay the foundation for the next economic boom.
- (2)
- The efficiency of fiscal expenditure structure with the goal of Inclusive Green Growth has a large space–time difference in the study period, and the difference has gradually expanded in recent years. The result is different from that of the traditional fiscal expenditure structure with GDP as output (Li, 2010) [12]. It is also different from the fiscal expenditure structure efficiency of green growth considering environmental factors (Qi and Zhao, 2020) [48] and inclusive growth considering social equity (Liu, 2020) [49] in recent years. The fundamental reason is that this paper studies inclusive green growth as a whole system. Without considering social equity and green environment, the efficiency of the fiscal expenditure structure measured only by GDP almost completely tends to increase the proportion of economic construction expenditure. China’s eastern, central, and western regions should adopt this fiscal policy under the traditional thinking. However, the infrastructure construction in some areas of China is relatively perfect, and the problems of income distribution and environmental protection are becoming more and more prominent. The efficiency evaluation results of fiscal expenditure structure with Inclusive Green Growth as the new development goal show regional heterogeneity, and the tendency of fiscal expenditure structure in different regions should be different. For the eastern region, the average change rate of TFP of the fiscal expenditure structure under the Inclusive Green Growth goal is lower than that of other regions, and the fiscal expenditure structure should be inclined to social expenditure and green expenditure. In order to maintain the frontier of efficiency, the financial expenditure structure should focus on economic expenditure. There are great differences in the total factor productivity level of the central region’s fiscal expenditure structure. Benchmarking cities should be set up to promote the demonstration effect.
Author Contributions
Funding
Institutional Review Board Statement
Informed Consent Statement
Data Availability Statement
Conflicts of Interest
References
- World Bank. Inclusive Green Growth: The Pathway to Sustainable Development; World Bank Publication: Washington, DC, USA, 2012. [Google Scholar] [CrossRef]
- Worthington, A.C. Cost efficiency in Australian local government: A comparative analysis of mathematical programming anf econometrical approaches. Financ. Account. Manag. 2000, 16, 201–223. [Google Scholar] [CrossRef] [Green Version]
- Afonso, A.; Fernandes, S. Measuring local government spending efficiency: Evidence for the Lisbon region. Reg. Stud. 2006, 40, 39–53. [Google Scholar] [CrossRef]
- Afonso, A.; Fernandes, S. Assessing and explaining the relative efficiency of local government. J. Socio-Econ. 2008, 37, 1946–1979. [Google Scholar] [CrossRef]
- Gupta, S.; Verhoeven, M. The efficiency of government expenditure: Experiences from Africa. J. Policy Model. 2001, 23, 433–467. [Google Scholar] [CrossRef] [Green Version]
- Lavado, R.F.; Cabanda, E.C. The efficiency of health and education expenditures in the Philippines. Cent. Eur. J. Oper. Res. 2009, 17, 275–291. [Google Scholar] [CrossRef]
- Bardhan, P. Decentralization of governance and development. J. Econ. Perspect. 2002, 16, 185–205. [Google Scholar] [CrossRef] [Green Version]
- Mikušová, P. Measuring the efficiency of the Czech public higher education institutions: An application of DEA. J. Effic. Responsib. Educ. Sci. 2017, 10, 58–63. [Google Scholar] [CrossRef] [Green Version]
- Wang, P. Analysis of the efficiency of public environmental expenditure based on data envelopment analysis (DEA)-Tobit model: Evidence from Central China. Nat. Environ. Pollut. Technol. 2018, 17, 43–48. [Google Scholar] [CrossRef] [PubMed]
- Zhang, J.; Qu, Y.; Zhang, Y.; Li, X.; Miao, X. Effects of FDI on the efficiency of government expenditure on environmental protection under fiscal decentralization: A spatial econometric analysis for China. Int. J. Environ. Res. Public Health 2019, 16, 2496. [Google Scholar] [CrossRef] [Green Version]
- Brueckner, J.K. Property values, local public expenditure and economic efficiency. J. Public Econ. 1979, 11, 223–245. [Google Scholar] [CrossRef]
- Li, Y.Y. The evolution of China’s fiscal expenditure structure and its efficiency. Economics 2010, 9, 307–332. (In Chinese) [Google Scholar] [CrossRef]
- Deng, Q.Z.; Shi, J.; Wu, H. Efficiency evaluation of Chinese local government expenditure under the background of high-quality development. J. Nanchang Univ. 2019, 43, 429–434. (In Chinese) [Google Scholar] [CrossRef]
- Loikkanen, H.A.; Susiluoto, I. Cost Efficiency of Finnish Municipalities in Basic Service Provision 1994–2002. 2005. Available online: http://hdl.handle.net/10419/117399 (accessed on 5 June 2021).
- Hauner, D.; Kyobe, A. Determinants of government efficiency. World Dev. 2010, 38, 1527–1542. [Google Scholar] [CrossRef]
- Zhang, Y.B.; Zhao, J.F. Quality of China’s Economic and Social Development and Its Impact on Building a Moderately Prosperous Society in All Respects: The Theoretical and Empirical Analysis Based on ”Five Development Concepts”. Financ. Trade Res. 2017, 28, 1–10. (In Chinese) [Google Scholar] [CrossRef]
- Fan, Q.F.; Wang, L.Y. Total Factor Energy Efficiency and Regional Difference in China—Based on BCC and Malmquist Model. Ind. Technol. Econ. 2018, 37, 61–69. (In Chinese) [Google Scholar]
- Liu, J.M.; Qin, Y.Q.; Hong, Y. The Influence Mechanism and Effect of Fiscal Efficiency on Regional Total Factor Productivity: A Perspective Based on Comprehensive Financial Efficiency. Financ. Res. 2021, 41–55. (In Chinese) [Google Scholar] [CrossRef]
- Zhang, J.; Gao, C.Y. Efficiency of Fiscal Environmental Protection Expenditures in the Yangtze River Delta from the Perspective of Integrated Development. East China Econ. Manag. 2021, 35, 28–36. (In Chinese) [Google Scholar] [CrossRef]
- Bank, W. World Development Report 1990: Poverty. Popul. Dev. Rev. 2001, 2, 1–189. [Google Scholar] [CrossRef]
- OECD. Rising to the global challenge: Partnership for reducing world poverty. In Proceedings of the Statement by the DACs High-Level Meeting, Paris, France, 25–26 April 2001. [Google Scholar]
- Pearce, D.; Markandya, A.; Barbier, E. Blueprint 1: For a Green Economy; Routledge: London, UK, 2013. [Google Scholar] [CrossRef]
- Dinda, S.; Inclusive Green Growth and Sustainable Development through Productive Consumption. MPRA Paper. 2013. Available online: https://mpra.ub.uni-muenchen.de/50574/ (accessed on 5 June 2021).
- Bartelmus, P. The future we want: Green growth or sustainable development? Environ. Dev. 2013, 7, 165–170. [Google Scholar] [CrossRef]
- Bass, S.; Wang, S.S.; Ferede, T.; Fikreyesus, D. Making Growth Green and Inclusive: The Case of Ethiopia; OECD Green Growth Papers 2013-07; OECD Publishing: Paris, France, 2013. [Google Scholar] [CrossRef]
- Alfredsson, E.; Wijkman, A.; The Inclusive Green Economy. Shaping Society to Serve Sustainability—Minor Adjustments or a Paradigm Shift. 2014. Available online: https://www.mistra.org/wp-content/uploads/2018/01/Mistra_Prestudy_TheInclusiveGreenEconomy_April20141-1.pdf (accessed on 5 June 2021).
- Bouma, J.; Berkhout, E. Inclusive Green Growth; PBL Netherlands Environmental Assessment Agency; PBL Publication: The Hague, The Netherlands, 2015; Volume 17, p. 8. Available online: https://www.pbl.nl/en/publications/inclusive-green-growth (accessed on 5 June 2021).
- Oginni, O. Reforming Fiscal Policy towards Inclusive Growth in Africa: From Brown Growth to Green Economy. OIDA Int. J. Sustain. Dev. 2016, 9, 11–28. Available online: https://ssrn.com/abstract=2806798 (accessed on 5 June 2021).
- Jha, S.; Sandhu, S.C.; Wachirapunyanont, R. Inclusive Green Growth Index: A New Benchmark for Quality of Growth; Asian Development Bank: Manila, Philippines, 2018. [Google Scholar] [CrossRef]
- Kararach, G.; Kararach, G.; Nhamo, G.; Nhamo, G.; Mubila, M.; Mubila, M.; Nhamo, S.; Nhamo, S.; Nhemachena, C.; Nhemachena, C.; et al. Reflections on the Green Growth Index for developing countries: A focus of selected African countries. Dev. Policy Rev. 2018, 36, O432–O454. [Google Scholar] [CrossRef]
- Xiaoliang, Z.; Wulin, W. The Measurement and Analysis of the Inclusive Green Growth in China. J. Quant. Tech. Econ. 2018, 8. [Google Scholar] [CrossRef]
- Cooper, A.; Mukonza, C.; Fisher, E.; Mulugetta, Y.; Gebreeyesus, M.; Onuoha, M.; Massaquoi, A.-B.; Ahanotu, K.C.; Okereke, C. Mapping Academic Literature on Governing Inclusive Green Growth in Africa: Geographical Biases and Topical Gaps. Sustainability 2020, 12, 1956. [Google Scholar] [CrossRef] [Green Version]
- Chen, G.; Yang, Z.; Chen, S. Measurement and Convergence Analysis of Inclusive Green Growth in the Yangtze River Economic Belt Cities. Sustainability 2020, 12, 2356. [Google Scholar] [CrossRef] [Green Version]
- Li, M.; Zhang, Y.; Fan, Z.; Chen, H. Evaluation and Research on the Level of Inclusive Green Growth in Asia-Pacific Region. Sustainability 2021, 13, 7482. [Google Scholar] [CrossRef]
- Ahmad, E. Multilevel financing of sustainable infrastructure in China—Policy options for inclusive, resilient and green growth. J. Infrastruct. Policy Dev. 2021, 5, 1251. [Google Scholar] [CrossRef]
- Zhou, X.L. Inclusive Green Development: Theoretical Interpretation and Institutional Support System. Acad. Mon. 2020, 52, 41–54. (In Chinese) [Google Scholar] [CrossRef]
- International Monetary Fund. Government Finance Statistics Manual 2014; International Monetary Fund: Washington, DC, USA, 2014. [Google Scholar]
- The Ministry of finance of the people’s Republic of China. Classification of Government Revenue and Expenditure in 2007; China finance and Economics Press: Dalian, China, 2006. [Google Scholar]
- Solow, R.M. A contribution to the theory of economic growth. Q. J. Econ. 1956, 70, 65–94. [Google Scholar] [CrossRef]
- Barro, R.J. Government Spending in a Simple Model of Endogeneous Growth. J. Political Econ. 1990, 98, S103–S125. [Google Scholar] [CrossRef] [Green Version]
- Sun, Y.; Ding, W.; Yang, Z.; Du, J. Measuring China’s regional Inclusive Green Growth. Sci. Total Environ. 2020, 713, 136367. [Google Scholar] [CrossRef]
- Ali, I.; Son, H.H. Measuring inclusive growth. Asian Dev. Rev. 2007, 24, 11. Available online: http://citeseerx.ist.psu.edu/viewdoc/download?doi=10.1.1.177.3311&rep=rep1&type=pdf (accessed on 5 June 2021).
- Ali, I.; Zhuang, J.; Inclusive growth toward a prosperous Asia: Policy implications. ERD Working Paper Series. 2007. Available online: https://www.adb.org/sites/default/files/publication/28210/wp097.pdf?__cf_chl_jschl_tk__=pmd_XpICaYyXJkb4DP24ytqvGJ3OLwWVf8Lb4zEiJfrdbgg-1630038216-0-gqNtZGzNAhCjcnBszQfR (accessed on 5 June 2021).
- China Green Development Index Report 2011; Springer Science & Business Media: Berlin, Germany, 2012. [CrossRef]
- Charnes, A.; Cooper, W.W.; Rhodes, E. Measuring the efficiency of decision making units. Eur. J. Oper. Res. 1978, 2, 429–444. [Google Scholar] [CrossRef]
- Banker, R.D.; Charnes, A.; Cooper, W.W. Some models for estimating technical and scale inefficiencies in data envelopment analysis. Manag. Sci. 1984, 30, 1078–1092. [Google Scholar] [CrossRef] [Green Version]
- Färe, R.; Grosskopf, S.; Norris, M.; Zhang, Z. Productivity growth, technical progress, and efficiency change in industrialized countries. Am. Econ. Rev. 1994, 66–83. Available online: https://www.jstor.org/stable/2117971 (accessed on 5 June 2021).
- Qi, L.; Zhao, W.X. Fiscal expenditure structure and green high quality development. Environ. Econ. Res. 2020, 5, 93115. [Google Scholar] [CrossRef]
- Liu, W. Public transfer payment, labor supply and rural inclusive growth. Res. World 2020, 56–61. [Google Scholar] [CrossRef]


| Second-Level Indicators | Third-Level Indicators | Fourth-Level Indicators | Index Weight | Positive Negative |
|---|---|---|---|---|
| Inclusive level(33.243) | Social equity (17.755) | PGDP | 3.118 | + |
| Per capita income ratio of rural residents | 1.558 | + | ||
| Number of health technicians per 10,000 people | 3.486 | + | ||
| Number of beds per 10,000 people in health institutions | 3.719 | + | ||
| The number of primary schools per 10,000 people | 3.716 | + | ||
| The number of ordinary middle schools per 10,000 people | 2.158 | + | ||
| Social welfare (7.58) | Road mileage per capita | 3.272 | + | |
| Urban road area per capita | 1.647 | + | ||
| Public transport vehicles per 10,000 people | 2.661 | + | ||
| Social security (7.907) | Urban gas penetration rate | 0.756 | + | |
| Endowment insurance coverage | 3.477 | + | ||
| Medical insurance coverage | 3.675 | + | ||
| Green level (32.134) | Green production (0.687) | Industrial SO2 emission per unit output value | 0.211 | − |
| Volatile phenol emission per unit output value | 0.063 | − | ||
| COD emission per unit output value | 0.159 | − | ||
| Solid waste production per unit output value | 0.254 | − | ||
| Green consumption (1.724) | Per capita electricity consumption | 0.483 | − | |
| Water consumption per capita | 1.018 | − | ||
| Gas supply per capita | 0.223 | − | ||
| Environmental governance (29.723) | Per capita public green space area | 1.842 | + | |
| Area of nature reserve | 13.110 | + | ||
| Number of wastewater treatment facilities | 5.468 | + | ||
| Number of waste gas treatment facilities | 4.821 | + | ||
| Comprehensive utilization of general solid waste | 4.483 | + | ||
| Economic development level (34.623) | Economic output (12.15) | Gross Regional Product | 5.064 | + |
| Per capita disposable income of urban residents | 3.566 | + | ||
| Per capita income of rural residents | 3.520 | + | ||
| Growth momentum (22.473) | Number of domestic three patents authorized | 12.329 | + | |
| Capital stock | 6.257 | + | ||
| Number of urban employment | 3.887 | + |
| Year Region | 2007 Index | 2018 Index | 2008 Growth Rate | 2010 Growth Rate | 2012 Growth Rate | 2014 Growth Rate | 2016 Growth Rate | 2018 Growth Rate | Regional Average Growth rate |
|---|---|---|---|---|---|---|---|---|---|
| Beijing | 0.183 | 0.335 | 4.235 | −1.599 | 7.987 | 8.197 | 4.962 | 3.551 | 5.243 |
| Tianjin | 0.143 | 0.242 | 5.634 | 7.998 | 6.486 | 2.121 | 4.314 | −2.956 | 4.562 |
| Hebei | 0.187 | 0.359 | 9.412 | 10.333 | 3.711 | 3.057 | 7.331 | 4.585 | 5.634 |
| Shanxi | 0.162 | 0.265 | 6.706 | 5.241 | 8.438 | 0.291 | −0.493 | 5.154 | 4.300 |
| Inner Mongolia | 0.207 | 0.345 | 5.278 | 6.517 | 2.826 | 4.755 | 1.840 | 2.324 | 4.370 |
| Liaoning | 0.179 | 0.297 | 8.695 | 7.521 | 5.766 | 3.465 | −3.774 | 7.998 | 4.366 |
| Jilin | 0.130 | 0.234 | 6.853 | 7.929 | 5.373 | 3.227 | 1.327 | 10.956 | 5.022 |
| Heilongjiang | 0.164 | 0.270 | 7.177 | 4.525 | 4.871 | 3.899 | 1.906 | 4.183 | 4.264 |
| Shanghai | 0.182 | 0.304 | −1.086 | 2.670 | −4.980 | 5.396 | 5.465 | 4.115 | 4.525 |
| Jiangsu | 0.232 | 0.560 | 9.761 | 9.744 | 10.487 | 3.066 | 2.483 | 7.037 | 7.686 |
| Zhejiang | 0.209 | 0.466 | 11.661 | 10.932 | 11.349 | 4.299 | 8.533 | 8.109 | 6.994 |
| Anhui | 0.128 | 0.309 | 10.987 | 7.867 | 7.888 | 5.822 | 2.677 | 15.941 | 7.692 |
| Fujian | 0.153 | 0.320 | 7.862 | 1.783 | 10.363 | 1.688 | 4.614 | 8.650 | 6.396 |
| Jiangxi | 0.125 | 0.281 | 12.696 | 6.659 | 4.841 | 2.796 | 2.584 | 4.154 | 7.077 |
| Shandong | 0.231 | 0.492 | 8.116 | 8.993 | 6.189 | 4.345 | 3.721 | 4.625 | 6.563 |
| Henan | 0.171 | 0.387 | 5.884 | 5.624 | 8.001 | 5.862 | 3.568 | 6.879 | 7.095 |
| Hubei | 0.143 | 0.311 | 7.877 | 6.413 | −3.002 | 6.052 | 4.067 | 5.787 | 6.813 |
| Hunan | 0.139 | 0.286 | 8.274 | 6.859 | 6.106 | 6.079 | 1.173 | 5.907 | 6.233 |
| Guangdong | 0.260 | 0.611 | 11.635 | 8.115 | 8.710 | 5.253 | 4.010 | 10.480 | 7.451 |
| Guangxi | 0.115 | 0.239 | 7.631 | 6.349 | 7.480 | 2.759 | 1.751 | 4.671 | 6.391 |
| Hainan | 0.098 | 0.188 | 8.906 | 5.605 | 4.548 | 2.735 | 1.488 | 13.461 | 5.692 |
| Chongqing | 0.108 | 0.245 | 12.722 | 5.776 | 18.643 | 3.410 | 1.546 | 3.729 | 7.220 |
| Sichuan | 0.203 | 0.382 | 4.928 | 5.893 | 6.821 | 1.861 | 4.446 | 7.800 | 5.421 |
| Guizhou | 0.092 | 0.232 | 8.284 | 8.072 | 9.731 | 6.999 | 2.112 | 22.755 | 8.123 |
| Yunnan | 0.141 | 0.261 | −0.620 | 3.709 | 2.987 | 5.448 | 4.679 | 6.226 | 5.443 |
| Shaanxi | 0.141 | 0.265 | 8.082 | 16.230 | 4.785 | 5.271 | 4.293 | 13.037 | 5.518 |
| Gansu | 0.168 | 0.251 | −4.419 | 2.448 | 4.919 | 7.764 | 0.878 | 2.539 | 3.515 |
| Qinghai | 0.264 | 0.329 | 0.598 | 0.657 | 1.491 | 2.068 | 5.536 | 1.733 | 1.899 |
| Ningxia | 0.096 | 0.192 | 6.261 | 3.065 | 17.882 | 5.293 | 2.188 | 3.914 | 6.064 |
| Xinjiang | 0.260 | 0.349 | 0.248 | 2.279 | 3.591 | 3.182 | 2.683 | 6.465 | 2.509 |
| Annual average | 0.167 | 0.320 | 6.676 | 6.140 | 6.476 | 4.215 | 3.064 | 6.794 | 5.669 |
| DMU | Crste | Vrste | Scale | DMU | Crste | Vrste | Scale | ||
|---|---|---|---|---|---|---|---|---|---|
| Beijing | 0.729 | 0.985 | 0.74 | drs | Henan Province | 0.571 | 0.976 | 0.585 | drs |
| Tianjin | 1 | 1 | 1 | - | Hubei | 0.546 | 0.89 | 0.613 | drs |
| Hebei | 0.524 | 0.894 | 0.587 | drs | Hunan | 0.458 | 0.916 | 0.5 | drs |
| Shanxi | 0.551 | 0.827 | 0.666 | drs | Guangdong | 0.827 | 1 | 0.827 | drs |
| Inner Mongolia | 0.714 | 0.899 | 0.795 | drs | Guangxi | 0.823 | 0.946 | 0.87 | drs |
| Liaoning | 0.781 | 0.978 | 0.799 | drs | Hainan | 1 | 1 | 1 | - |
| Jilin | 0.589 | 0.845 | 0.697 | drs | Chongqing | 0.538 | 0.853 | 0.63 | drs |
| Heilongjiang | 0.469 | 0.806 | 0.582 | drs | Sichuan | 0.42 | 0.961 | 0.436 | drs |
| Shanghai | 0.723 | 0.824 | 0.878 | drs | Guizhou | 0.509 | 0.871 | 0.584 | drs |
| Jiangsu Province | 0.873 | 1 | 0.873 | drs | Yunnan | 0.446 | 0.795 | 0.561 | drs |
| Zhejiang | 0.898 | 1 | 0.898 | drs | Shaanxi | 0.563 | 0.894 | 0.63 | drs |
| Anhui | 0.52 | 0.84 | 0.619 | drs | Gansu Province | 0.482 | 0.822 | 0.586 | drs |
| Fujian | 0.854 | 0.99 | 0.863 | drs | Qinghai | 1 | 1 | 1 | - |
| Jiangxi | 0.571 | 0.837 | 0.682 | drs | Ningxia | 1 | 1 | 1 | - |
| Shandong | 0.711 | 1 | 0.711 | drs | Xinjiang | 0.797 | 0.998 | 0.798 | drs |
| 2007 Financial Expenditure Structure Efficiency | |||
|---|---|---|---|
| Located at or Near the Efficiency Front | Far from the Efficiency Front | ||
| 2018 financial expenditure structure efficiency | Located at or near the efficiency front | Tianjin, Zhejiang, Fujian, Guangdong, Hainan, Qinghai, Ningxia, Xinjiang, Shandong, Jiangsu, Guangxi | Shanghai, Liaoning, Inner Mongolia, Beijing |
| Far from the efficiency front | Chongqing, Hebei, Hubei, Jiangxi | Jilin, Shanxi, Shaanxi, Anhui, Gansu, Henan, Guizhou, Heilongjiang, Yunnan, Hunan, Sichuan | |
| Year | Effch | Techch | Pech | Sech | Tfpch |
|---|---|---|---|---|---|
| 2008 | 1.27 | 0.597 | 1.099 | 1.156 | 0.759 |
| 2009 | 1.272 | 0.835 | 0.935 | 1.36 | 1.062 |
| 2010 | 0.888 | 0.632 | 1.02 | 0.87 | 0.561 |
| 2011 | 1.004 | 1.087 | 0.84 | 1.195 | 1.091 |
| 2012 | 1.193 | 0.573 | 1.29 | 0.925 | 0.684 |
| 2013 | 0.816 | 0.98 | 0.846 | 0.964 | 0.8 |
| 2014 | 0.98 | 1.019 | 1.161 | 0.844 | 0.999 |
| 2015 | 0.854 | 1.399 | 0.922 | 0.927 | 1.195 |
| 2016 | 1.349 | 0.506 | 1.048 | 1.288 | 0.682 |
| 2017 | 0.73 | 1.673 | 0.824 | 0.886 | 1.221 |
| 2018 | 1.213 | 0.59 | 1.29 | 0.94 | 0.716 |
| mean | 1.031 | 0.835 | 1.012 | 1.019 | 0.861 |
| Weighted Total Index Output TFP | |||
|---|---|---|---|
| On Average or Above | Below Average | ||
| Three-dimensional output TFP | On average or above | Liaoning, Jilin, Heilongjiang, Jiangsu, Zhejiang, Anhui, Henan, Guangxi, Chongqing, Sichuan, Guizhou | Beijing, Inner Mongolia, Jiangxi, Shandong, Yunnan, Shaanxi |
| Below average | Hebei, Shanxi, Gansu, Ningxia and Xinjiang | Tianjin, Shanghai, Fujian, Hubei, Hunan, Guangdong, Hainan and Qinghai | |
| Three-Dimensional Output | Effch | Techch | Pech | Sech | Tfpch |
|---|---|---|---|---|---|
| Eastern Region | 0.9949 | 0.9430 | 1.0018 | 0.9933 | 0.9383 |
| Central Region | 0.9970 | 0.9509 | 1.0209 | 0.9769 | 0.9479 |
| Western Region | 1.0082 | 0.9357 | 1.0211 | 0.9873 | 0.9431 |
| Weighted Output | effch | techch | pech | sech | tfpch |
| Eastern Region | 1.0235 | 0.8258 | 1.0178 | 1.0051 | 0.8450 |
| Central region | 1.0411 | 0.8329 | 1.0138 | 1.0269 | 0.8671 |
| Western Region | 1.0344 | 0.8455 | 1.0070 | 1.0273 | 0.8745 |
Publisher’s Note: MDPI stays neutral with regard to jurisdictional claims in published maps and institutional affiliations. |
© 2021 by the authors. Licensee MDPI, Basel, Switzerland. This article is an open access article distributed under the terms and conditions of the Creative Commons Attribution (CC BY) license (https://creativecommons.org/licenses/by/4.0/).
Share and Cite
Wu, Y.; Zhou, X. Research on the Efficiency of China’s Fiscal Expenditure Structure under the Goal of Inclusive Green Growth. Sustainability 2021, 13, 9725. https://doi.org/10.3390/su13179725
Wu Y, Zhou X. Research on the Efficiency of China’s Fiscal Expenditure Structure under the Goal of Inclusive Green Growth. Sustainability. 2021; 13(17):9725. https://doi.org/10.3390/su13179725
Chicago/Turabian StyleWu, Yanghong, and Xiaoliang Zhou. 2021. "Research on the Efficiency of China’s Fiscal Expenditure Structure under the Goal of Inclusive Green Growth" Sustainability 13, no. 17: 9725. https://doi.org/10.3390/su13179725
APA StyleWu, Y., & Zhou, X. (2021). Research on the Efficiency of China’s Fiscal Expenditure Structure under the Goal of Inclusive Green Growth. Sustainability, 13(17), 9725. https://doi.org/10.3390/su13179725