Article

Integrated Seismic and Energy Retrofit Interventions on a URM Masonry Building: The Case Study of the Former Courthouse in Fabriano

1
Department of Geosciences, University of Padova, 35131 Padova, Italy
2
Department of Industrial Engineering, University of Padova, 35131 Padova, Italy
*
Author to whom correspondence should be addressed.
Sustainability 2021, 13(17), 9592; https://doi.org/10.3390/su13179592
Submission received: 30 June 2021 / Revised: 6 August 2021 / Accepted: 15 August 2021 / Published: 26 August 2021

Abstract

:
Following the 2016 central Italy earthquakes, the high seismic vulnerability of existing buildings is once again at the center of the debate. Indeed, the majority of the Italian building stock (around 60%) was built before adopting the first seismic provisions (1974) and in a territory entirely characterized by medium to high levels of seismic hazard. On the other hand, the first provisions addressing thermal performance criteria were introduced in 1976 but with limited impact. A consistent reduction in energy consumption was further achieved in 1991, when even more buildings were erected. As a consequence, the Italian building stock is characterized by reduced seismic capacity and poor energy efficiency and, to optimize the available resources, combined retrofit interventions approaches are required. In this context, a synergic strategy for the seismic and energy retrofit of a unreinforced masonry (URM) building was proposed. The former Courthouse in Fabriano (Ancona, Marche), a strategic, three-story, unreinforced masonry building in the network of permanent monitoring systems of the Italian Department of Civil Protection, was selected as a case study. The overall effectiveness of various solutions of combined structural refurbishment and energy retrofit interventions, having different levels of invasiveness on the building, was assessed. In addition, a common methodology based on the expected annual losses allowed evaluating the financial feasibility of the proposed integrated interventions and estimating the changes in the return of the retrofitting investment in various seismic and climate zones. The results also show how the payback period could be significantly reduced by incentives and regulatory frameworks that currently favour the execution of integrated interventions.

1. Introduction

According to ISTAT data (Italian National Institute of Statistic), 60% of the Italian building stock was built before the first seismic regulation (1974), and 88% of the built stock precedes the first important energy provision (1991). In addition, despite the decreased construction of masonry buildings over the years, a large amount of relevant and strategic Italian constructions is made of masonry, and it is very often found in heritage buildings. These masonry buildings, due to their specific features and vulnerabilities, are particularly damage prone in case of seismic actions.
The latest seismic events affecting Italian territory revealed that the poor seismic performance of masonry buildings resulted in high damage and losses (i.e., central Italy, 2016 [1,2], including also the positive effects of preventive actions [3], Emilia 2012 [4,5], L’Aquila 2009 [6,7], Molise 2002 [8,9,10], and Umbria and Marche 1997 [11,12]). The recent seismic risk assessment of residential buildings in Italy also demonstrated the significant economic loss and loss of human lives connected to the performance of existing, and particularly masonry, buildings [13,14].
On the other hand, the low energy performance of the buildings, which increases their energy consumption, makes them responsible for 40% of EU final energy consumption. In this scenario, it is undoubted that the major part of the Italian building stock needs a comprehensive refurbishment in both seismic and energy aspects to achieve adequate requirements.
Until the last decade, seismic and energy retrofitting were considered objectives to be achieved separately. Although different researches concerning seismic retrofitting [15,16,17,18,19,20] or energy retrofitting [21,22,23,24,25,26] are available in the literature, only in the last years have the researchers’ interest focused on the integration of the two fields. Indeed, seismic retrofit does not improve the thermal comfort of the residents, an energy retrofit alone also does not lead to a reduction of seismic vulnerabilities, and the energy retrofit itself may be lost in case of earthquakes. Nevertheless, several barriers limit an extensive application of combined retrofit actions; these barriers concern different aspects [27]: (i) technical barriers (e.g., unfeasibility and/or ineffectiveness of conventional retrofit solutions and the need for regulatory simplification); (ii) financial barriers (e.g., high renovation costs, “split-incentive”/”landlord-tenant dilemma”, and insufficient incentives and subsidies); (iii) organizational barriers (e.g., need for occupants’ and/or activities’ temporary relocation, consensus in case of condominium ownership, excessive time to obtain building permits); (iv) cultural/social barriers (insufficient information and skills and lack of adequate policy measures to promote renovation actions).
To overcome technical barriers, in recent years, researchers investigated new integrated technologies, aiming to enhance seismic and energy performance with a single intervention. A suitable approach for R.C. structure may be the use of exoskeletons or double-skins [28,29,30,31,32]. Other approaches for R.C. buildings involve the enhancement [33,34,35,36] or the replacement of infill walls [37,38,39]. Different methods are now available for masonry structures mostly involving the implementation of multi-layers interventions, combining the seismic-resistant layer (e.g., Textile-Reinforced Mortar TRM, Fiber-Reinforced Cementitious Matrix FRCM, Glass Fiber-Reinforced Polymer GFRP) with the insulation layer (e.g., stone wool panels, sheep wool, EPS) [40,41,42,43,44]. Other methods suitable for both R.C. and masonry structures involve the use of timber-based technologies. In particular, thanks to their features (i.e., high structural strength, thermal insulation, sound absorption, low weight, and ease of assembly), the use of Oriented Strand Board (OSB) and Cross Laminated Timber (CLT) panels as a combined intervention has rapidly spread in the last years [45,46,47,48,49].
To overcome financial barriers, in Italy, a series of fiscal incentives were recently launched in order to promote the implementation of both seismic and energy retrofitting of residential buildings. These incentives are the so-called “Ecobonus” [50] for energy retrofit, “Sismabonus” [51,52,53] for seismic retrofit, and “Superbonus” [54], which increases the incentive value up to 110% of the cost incurred, reducing the citizen’s monetary disbursement to almost zero. To evaluate the economic feasibility, a common strategy involves the use of Economic Annual Loss (EAL) [33,35,55,56,57], also accounting for, in specific cases, for the indirect costs caused by the building and activity disruption due to a possible earthquake [52]. EAL is based on the annual exceedance probability of the earthquake, and it may be used as index to assess the cost-effectiveness of retrofit interventions.
In this context, starting from a case-study, the aim of the paper is to propose a design methodology for combined interventions that implement both seismic and energy retrofit by intervening on the same scale of dimensions and structural elements of the building (vertical structures, horizontal structures, entire building) in order to optimize the intervention procedures and, if possible, reduce the building disruption time. The case study, the former courthouse in Fabriano (Ancona, Marche), has the typical seismic and energy vulnerabilities of masonry structures. The paper discusses the possible interventions, considering their structural/thermal effectiveness alone and the cost-effectiveness of the proposed intervention strategies. Lastly, a parametric analysis to check the effectiveness of the proposed solutions when changing the seismic hazard and energy demand of the building location is also carried out.

2. The Case Study: The Former Courthouse in Fabriano

The case study building (Figure 1) is the former courthouse in Fabriano (Ancona, Marche). The structure presents a “T” plan, and it is isolated from nearby structures except for the east side. It was built around 1940 as a secondary school, and in 1950, an additional floor was added. After the Umbria-Marche earthquakes of 1997, the building was subjected to a series of seismic and energy retrofitting interventions starting from 1999. However, it has been analyzed in the as-built condition before retrofitting to match the project goal.
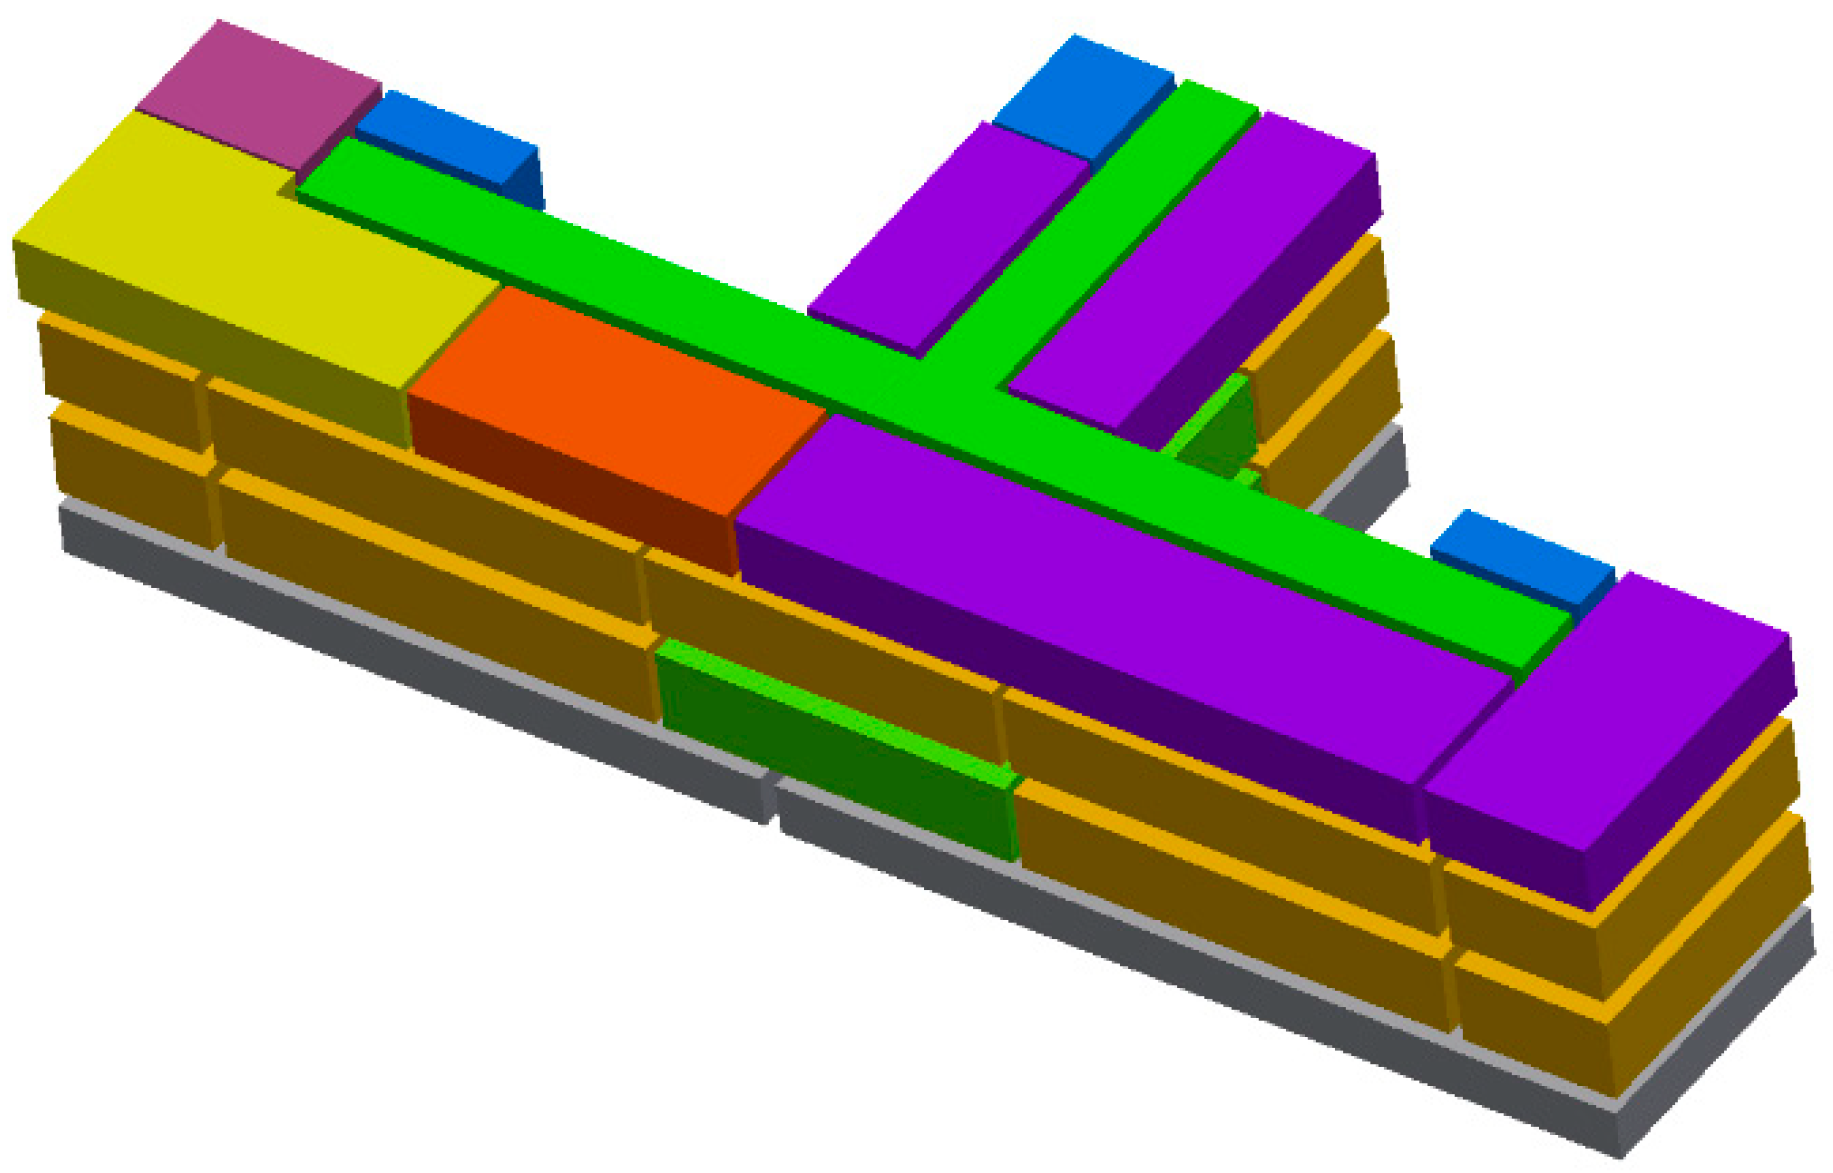
The building is on four levels: three above the ground level and a basement, for a maximum height of 16.8 m. The average floor area is about 1300 m2, for a total volume of about 22,000 m3. The internal distribution is almost the same for each floor, with a long corridor along the main body (Figure 2a). There are two stairs in the building: the original one inside the building in the short wing and an external one built more recently for fire safety reasons. The elevations are simple, with a regular repetition of the openings (Figure 2b). A facing brick cladding characterizes the ground floor and the first floor. The symmetry of the elevations is interrupted only by the new external stairs, easily recognizable thanks to the use of different materials.
The building is a strategic structure corresponding to the class of use IV in the Italian Building Code [58,59], with a reference period for the seismic actions of 100 years. With the stratigraphic and topographic properties of the site, it is possible to define the seismic parameters for the calculation of the response spectrum as:   T R , S L V = 949   years   a g / g = 0.228 , F 0 = 2.513 , T C = 0.333   s .

2.1. Structural Elements

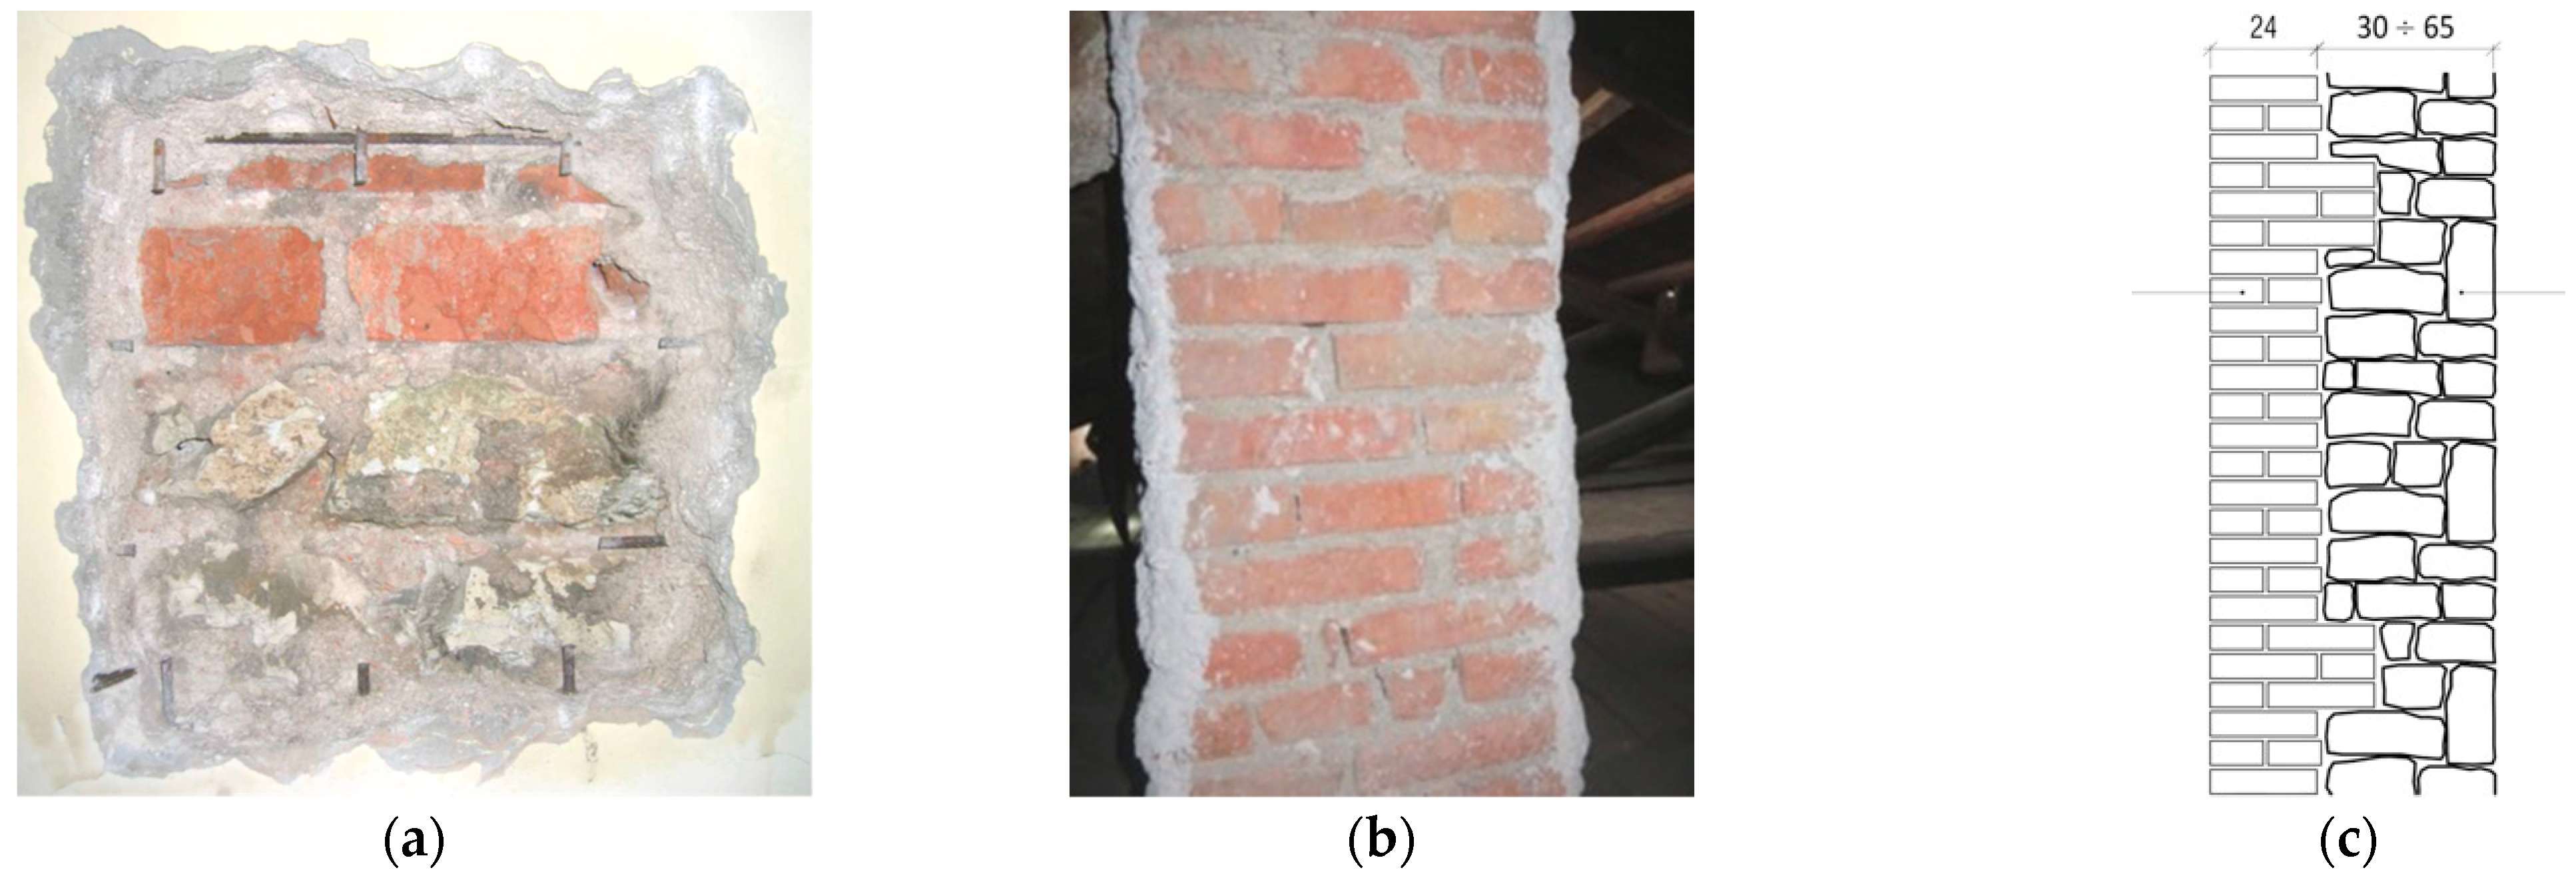
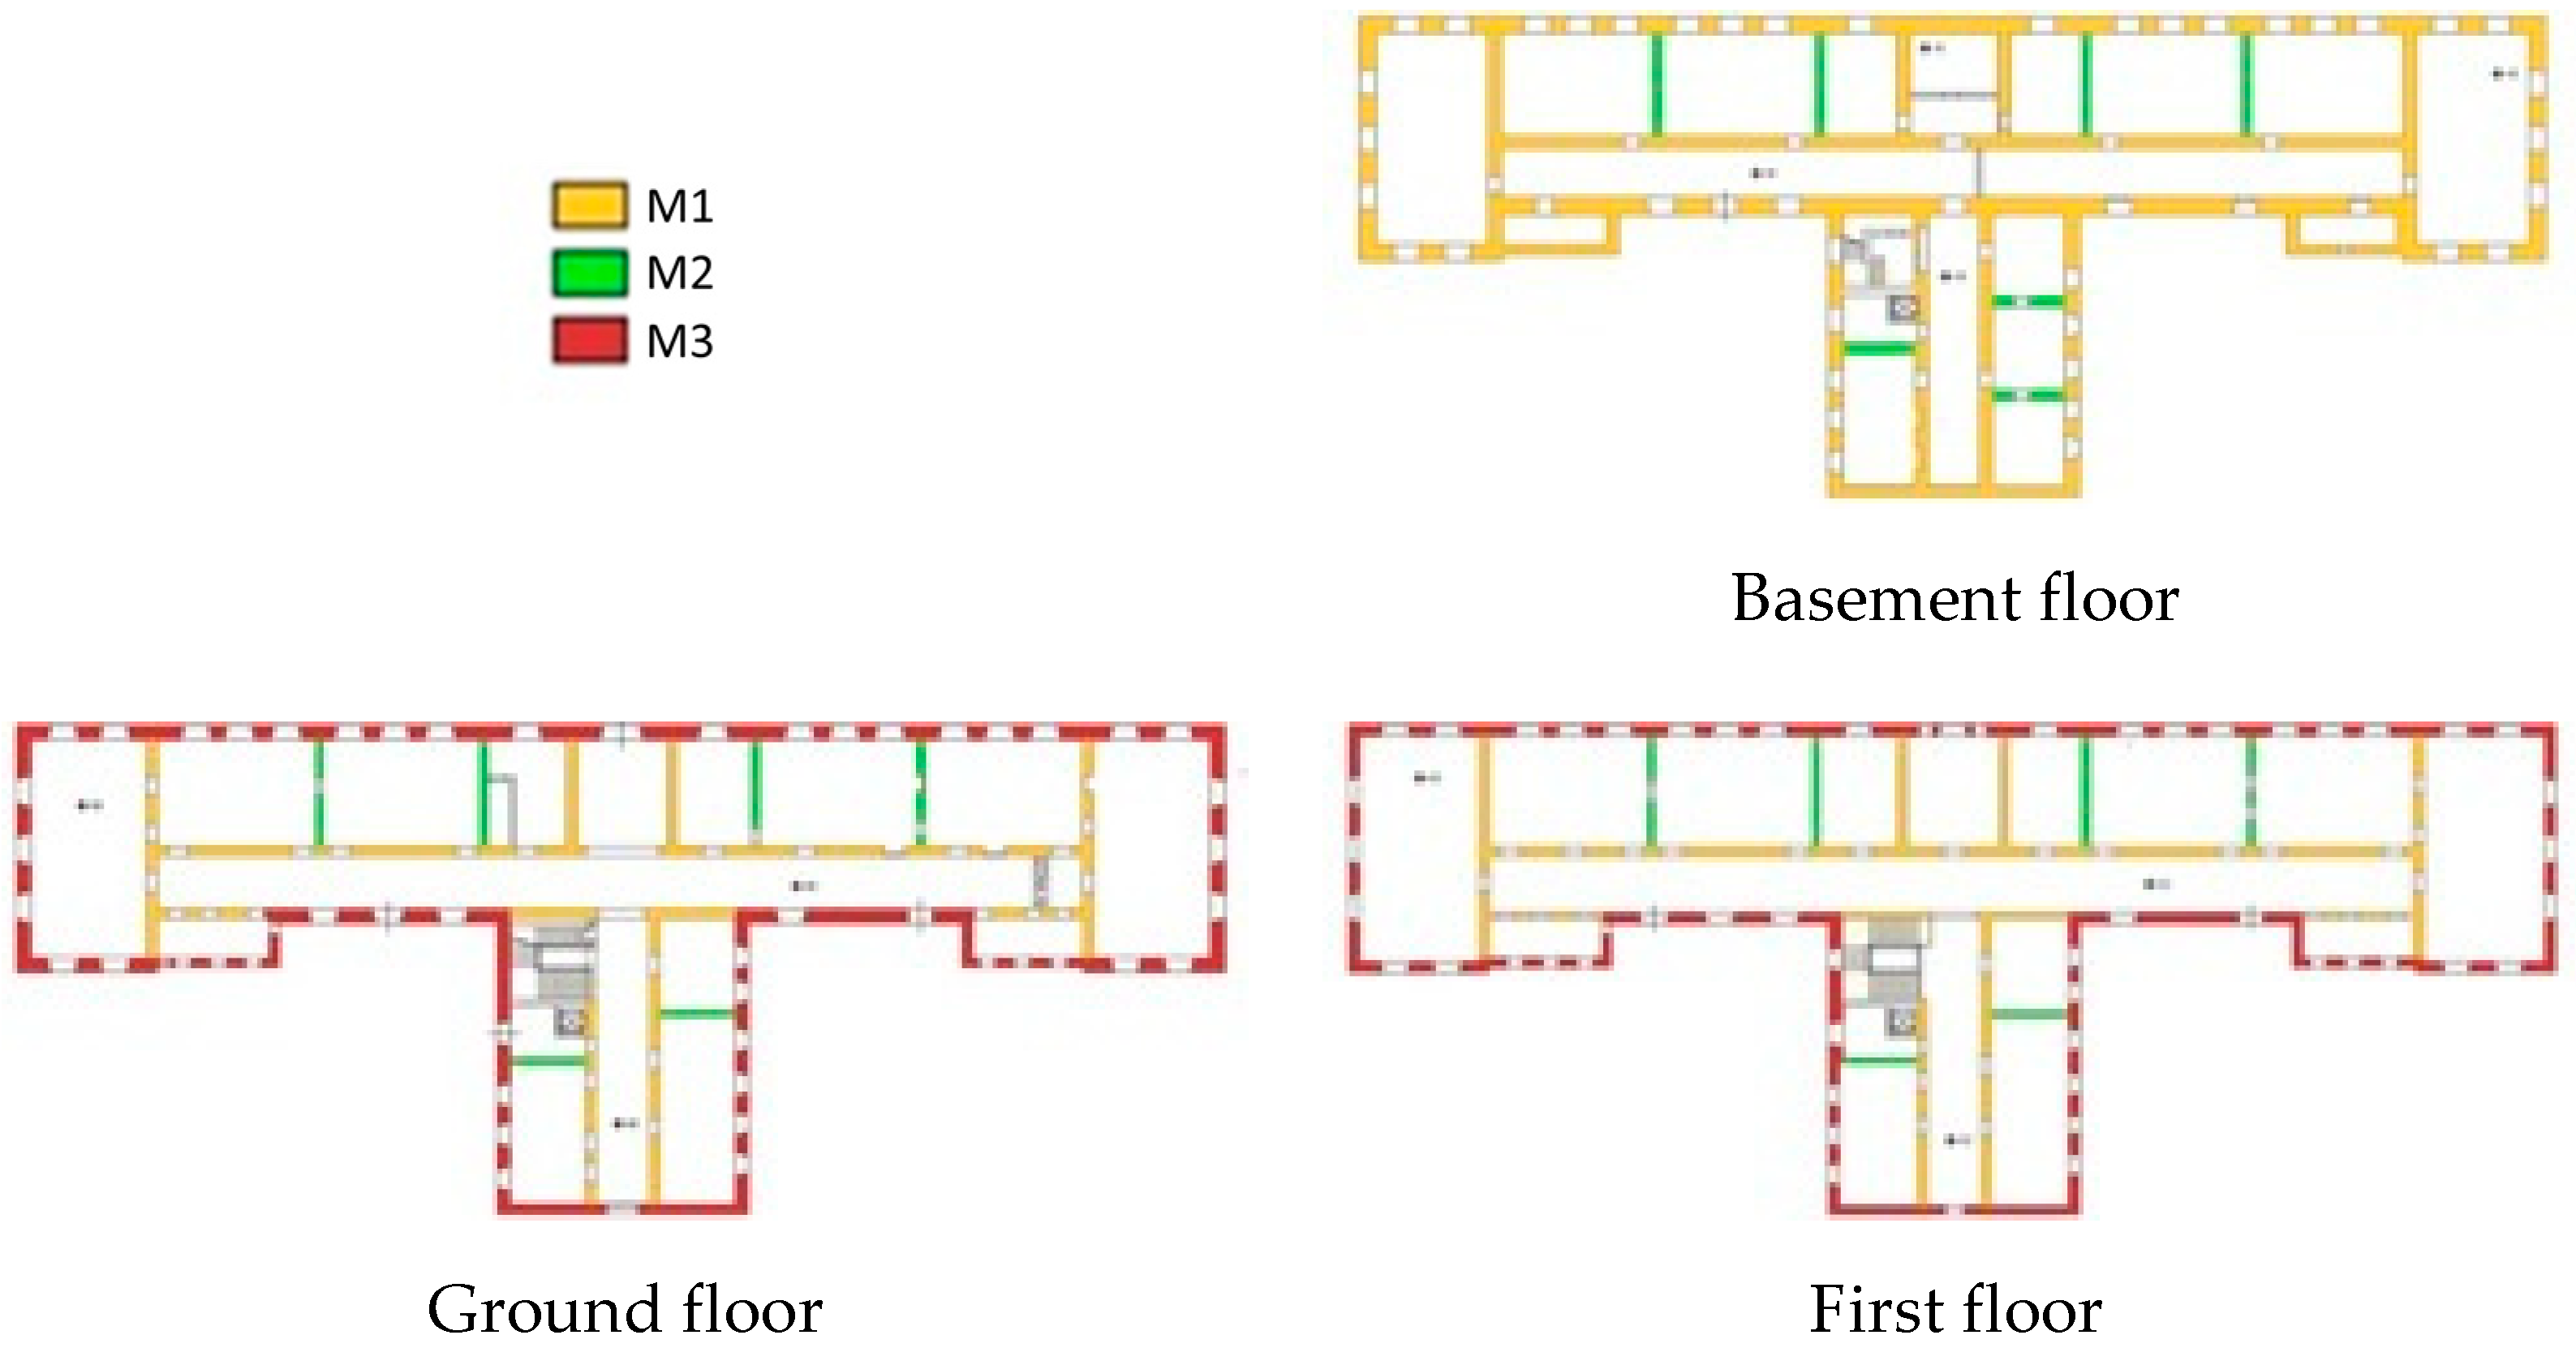
The building load-bearing masonry walls are mainly made of regularly cut stone. Walls develop along the entire height of the building, giving a good regularity in elevation to the structure. The wall thickness varies between 80 and 110 cm on the ground floor, whereas at the upper levels, the thickness varies between 30 and 90 cm. It is possible to identify three masonry types (Figure 3 and Figure 4):
  • M1: it is the most common. It is characterized by regularly cut stone with a thickness between 50 and 110 cm.
  • M2: it is characterized by solid bricks with a thickness between 25 and 45 cm. It can be found in the attic floor and some internal walls at the lowest levels.
  • M3: it is the masonry type of the external walls of the ground and first floor. It consists of two coupled leaves: the inner one is made of regularly cut stone, while the external one is made of facing bricks.
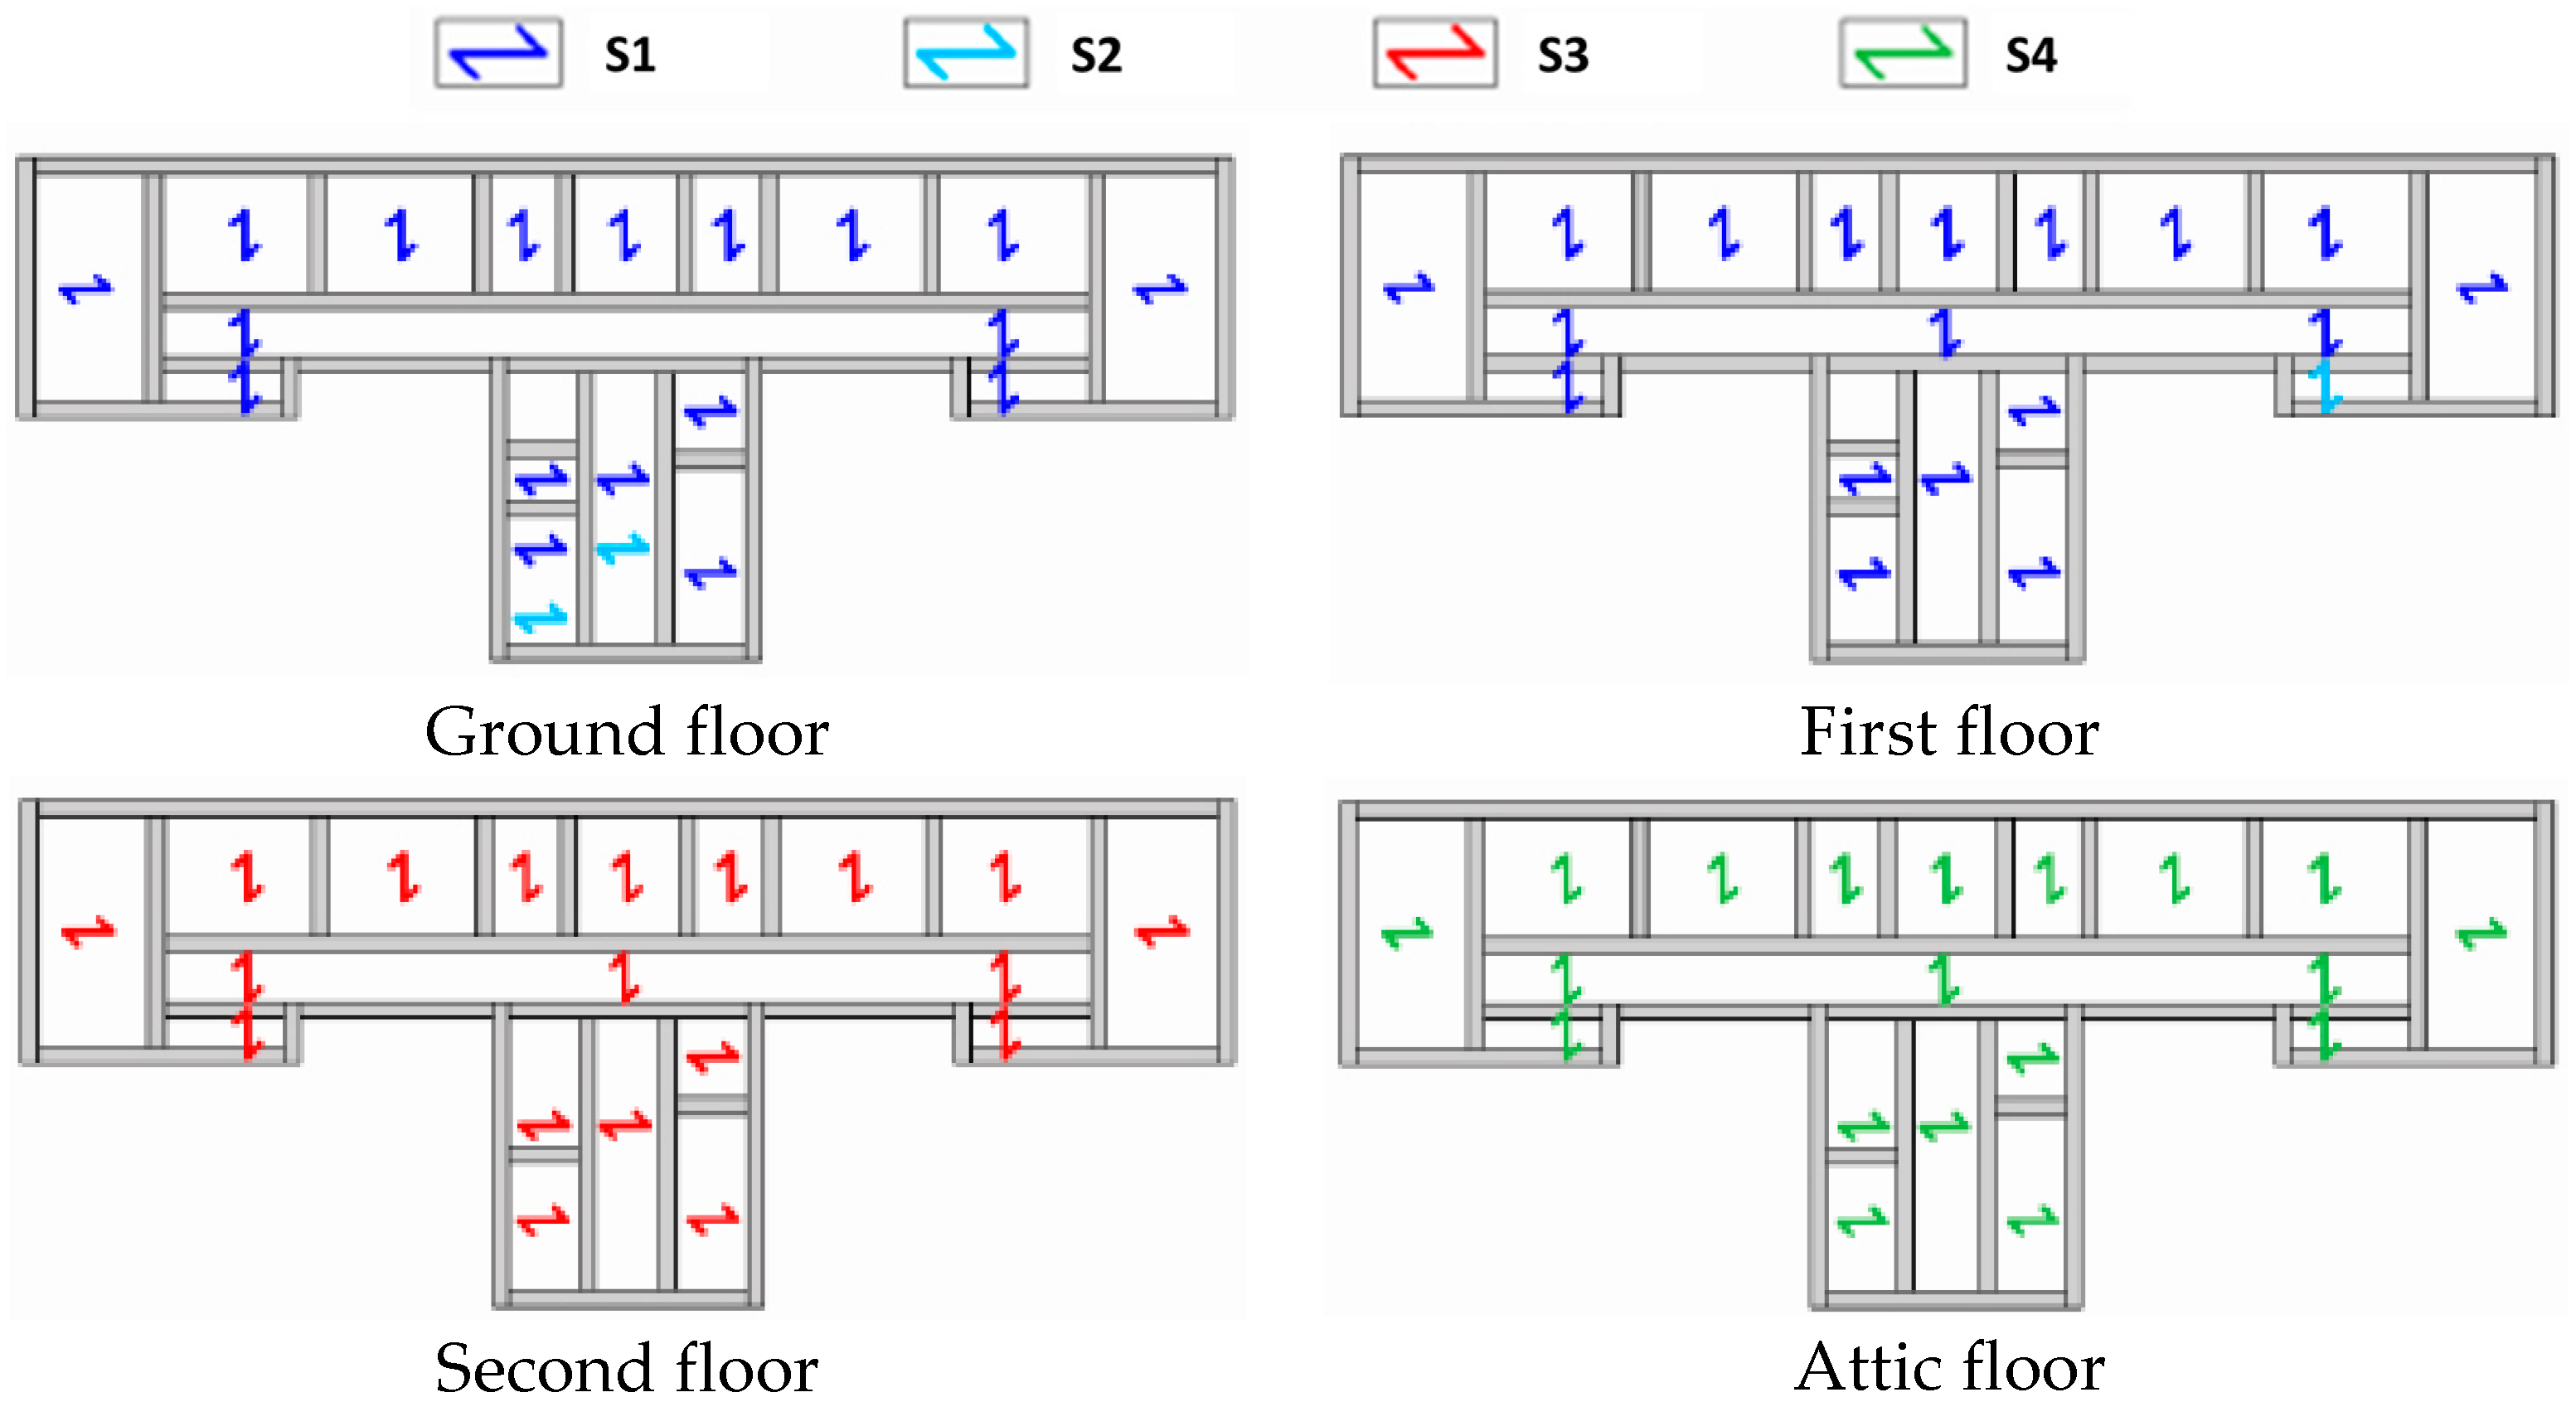
The building presents various types of horizontal diaphragms, probably due to the different construction phases (Figure 5). It is possible to identify five floor types:
  • S1–2: it is the floor of the ground and the first levels. It is made of steel beams with a span of 80 cm and hollow tile vaults.
  • S3: it is the floor of the second levels. It is a hollow brick and concrete floor without reinforced concrete slab.
  • S4: it is the floor of the attic floor. It is made of Ω steel beams with a span of 145 cm and a wooden plank 3.5-cm thick.

2.2. Energy Components

Since the external walls have no insulation, the thermal transmittance ranges between 1.5 and 3 W/m2·K depending on the thickness and type of walls. For the S1–2 and S3 floor types, the thermal transmittance can be assumed between 2.3 and 3.1 W/m2·K. The S4 floor type is made of a wooden plank with a thermal transmittance of 2.7 W/m2·K, while for the roof, it was calculated that the value of thermal transmittance is equal to 0.8 W/m2·K. Thermal transmittances were calculated based on the existing stratigraphy defined during onsite surveys, the properties defined in the standard UNI EN ISO 6946:2008, and from the database given by the tool EDILCLIMA, used in this work for the quasi-steady-state calculations. The fenestration surfaces are single-pane windows with wood frames, with a value of thermal transmittance equal to 5 W/m2·K, as according to the EU project TABULA [60] and verified with national limitations related to standards. The heat-generation system is a traditional gas boiler with 89% of nominal efficiency. The system supplies both the domestic hot water (DHW) and the radiators, operating at an average supply temperature of 70 °C. Considering the typical usage of the building, the intended use has been assumed as an office for all the levels, thus load fractions have been defined for occupancy, lighting, and appliances for office use according to the guidelines of standard BS ISO 18523 [61]. The schedules are derived by the use of the building, and heating (20 °C) and cooling (26 °C) setpoints are based on the real use of the building.

3. Seismic and Energy Analysis of the As-Built Condition

3.1. Structural Analysis

The assessment of the seismic vulnerability of a masonry structure must take into account, besides the global behavior of the building, the analysis of the eventual local collapse mechanisms. The latter is generally carried out on the basis of limit analysis principles. For the case study, considering the fairly good quality of masonry and the good degree of connection of the walls, it was assumed that the most likely collapse mechanism is vertical bending. This mechanism occurs by formation of three horizontal cylindrical hinges that divide the wall into two blocks that rotate reciprocally out of plane. The extreme hinges are located in correspondence of floors that act as a restraint for the out-of-plane overturning. In particular, it was assumed that the constraint at the base is represented by the ground level, and the upper constraint is represented by the R.C. floor at the second level, whereas the intermediate diaphragm level is not able to exert effective constraint actions. Seismic verification of the identified macro-elements was performed through the kinematic approach of the limit analysis. For all the considered mechanisms, the safety seismic verifications were satisfied. For this reason, the seismic analysis presented hereinafter takes into account only the global behavior of the building, evaluating the in-plane seismic capacity of masonry walls.
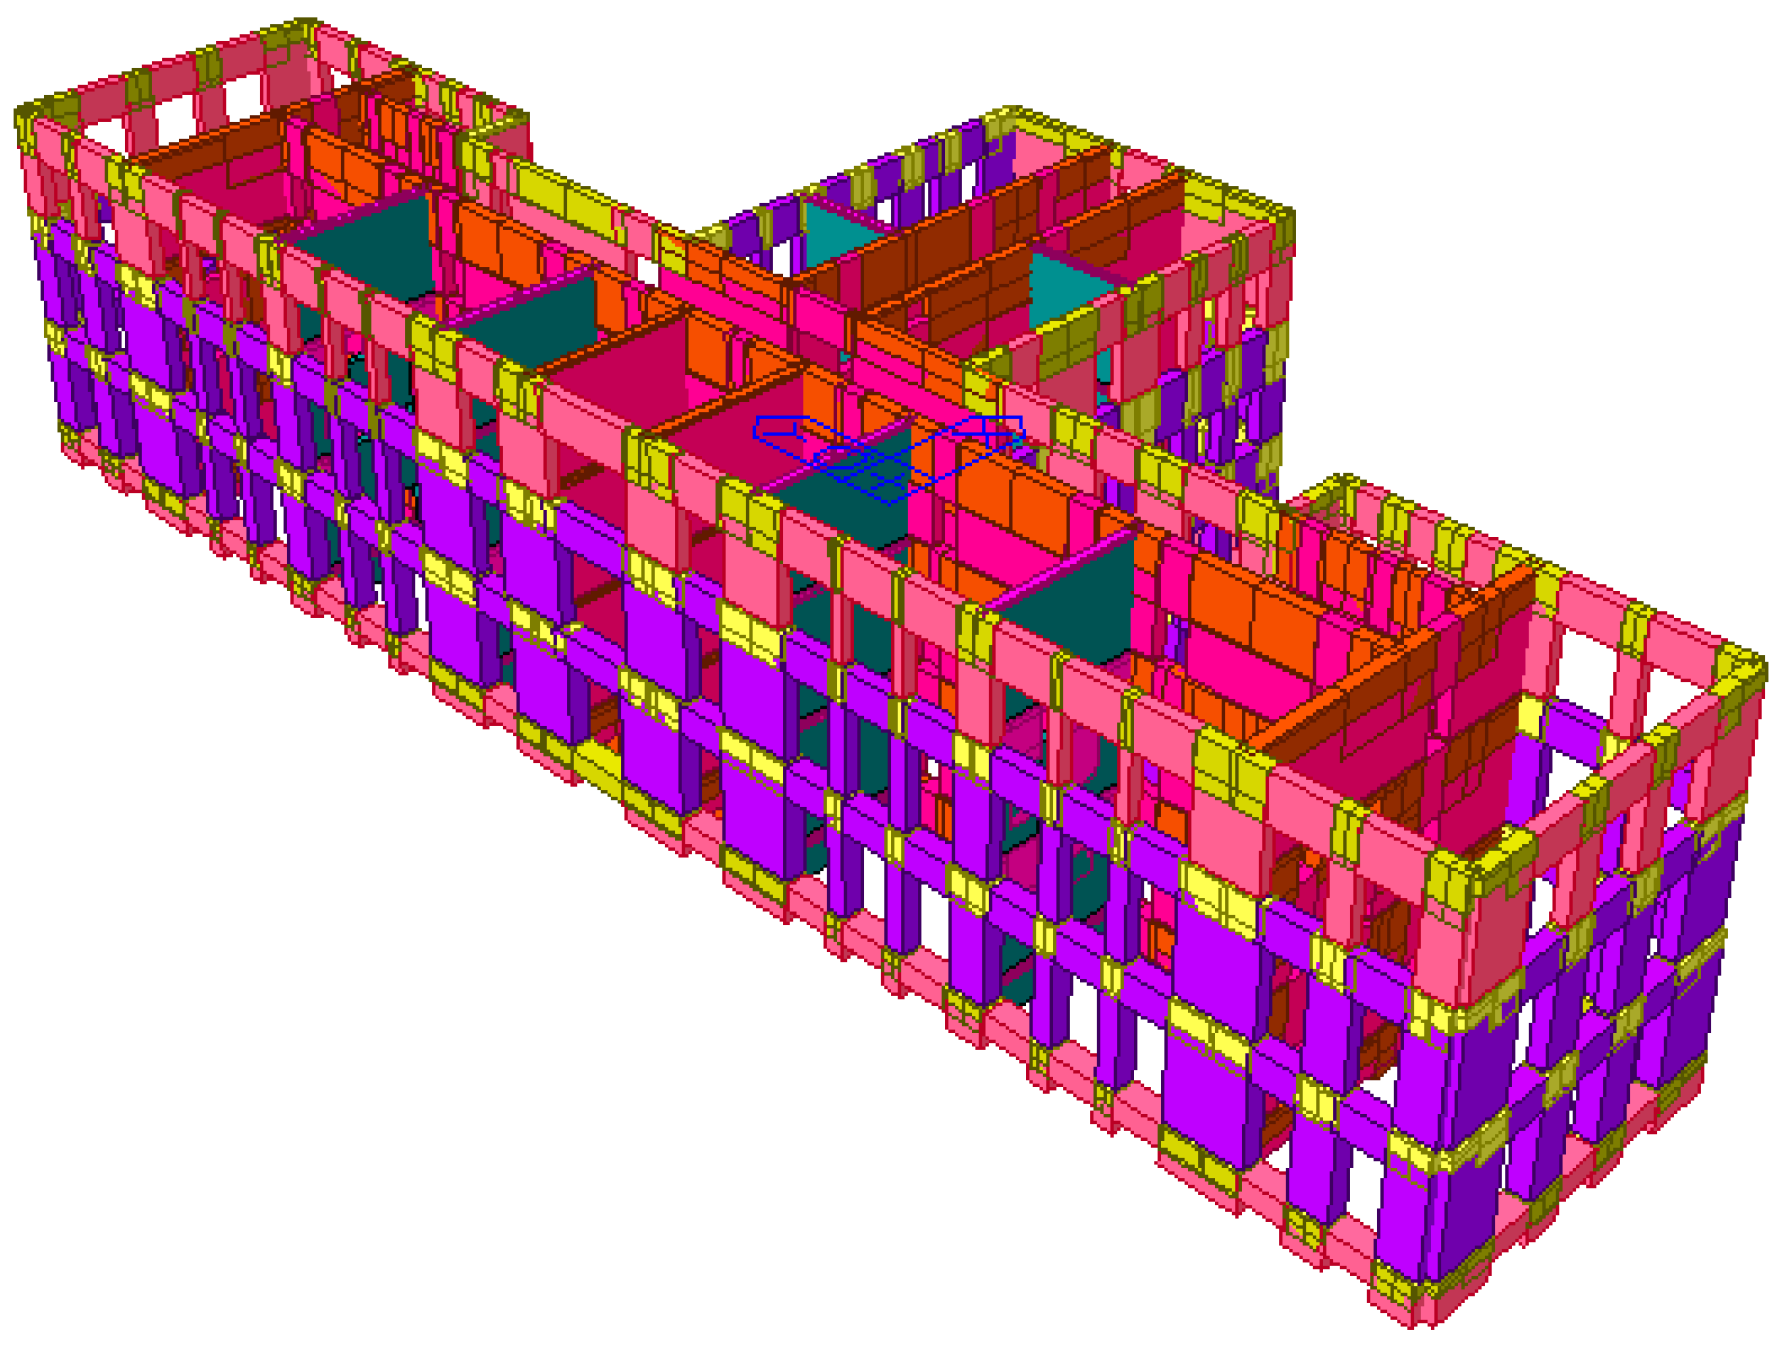
The global modelling of masonry buildings presents different approaches depending on the purpose of the analysis [62,63,64,65]. For buildings with fairly good quality of masonry and geometric regularity, as in this case study, the use of equivalent frame modelling (EFM) methods is very common [66,67,68,69,70,71]. Since its first formulation, EFM has attracted a great attention in scientific and professional fields because of the several simplifications that it allows. In this approach, the seismic response of masonry buildings is studied by using mono-dimensional elements connected by rigid end offsets (Figure 6).
The elements of interest are identified as follows:
  • Piers, corresponding to the parts of walls between two horizontally aligned openings. They are the main vertical resistant elements carrying both vertical and lateral load.
  • Spandrels, corresponding to the parts of walls between two vertically aligned openings. They couple two adjacent piers.
  • Rigid node, corresponding to the intersections between piers and spandrels. They are supposed as not subject to damage.
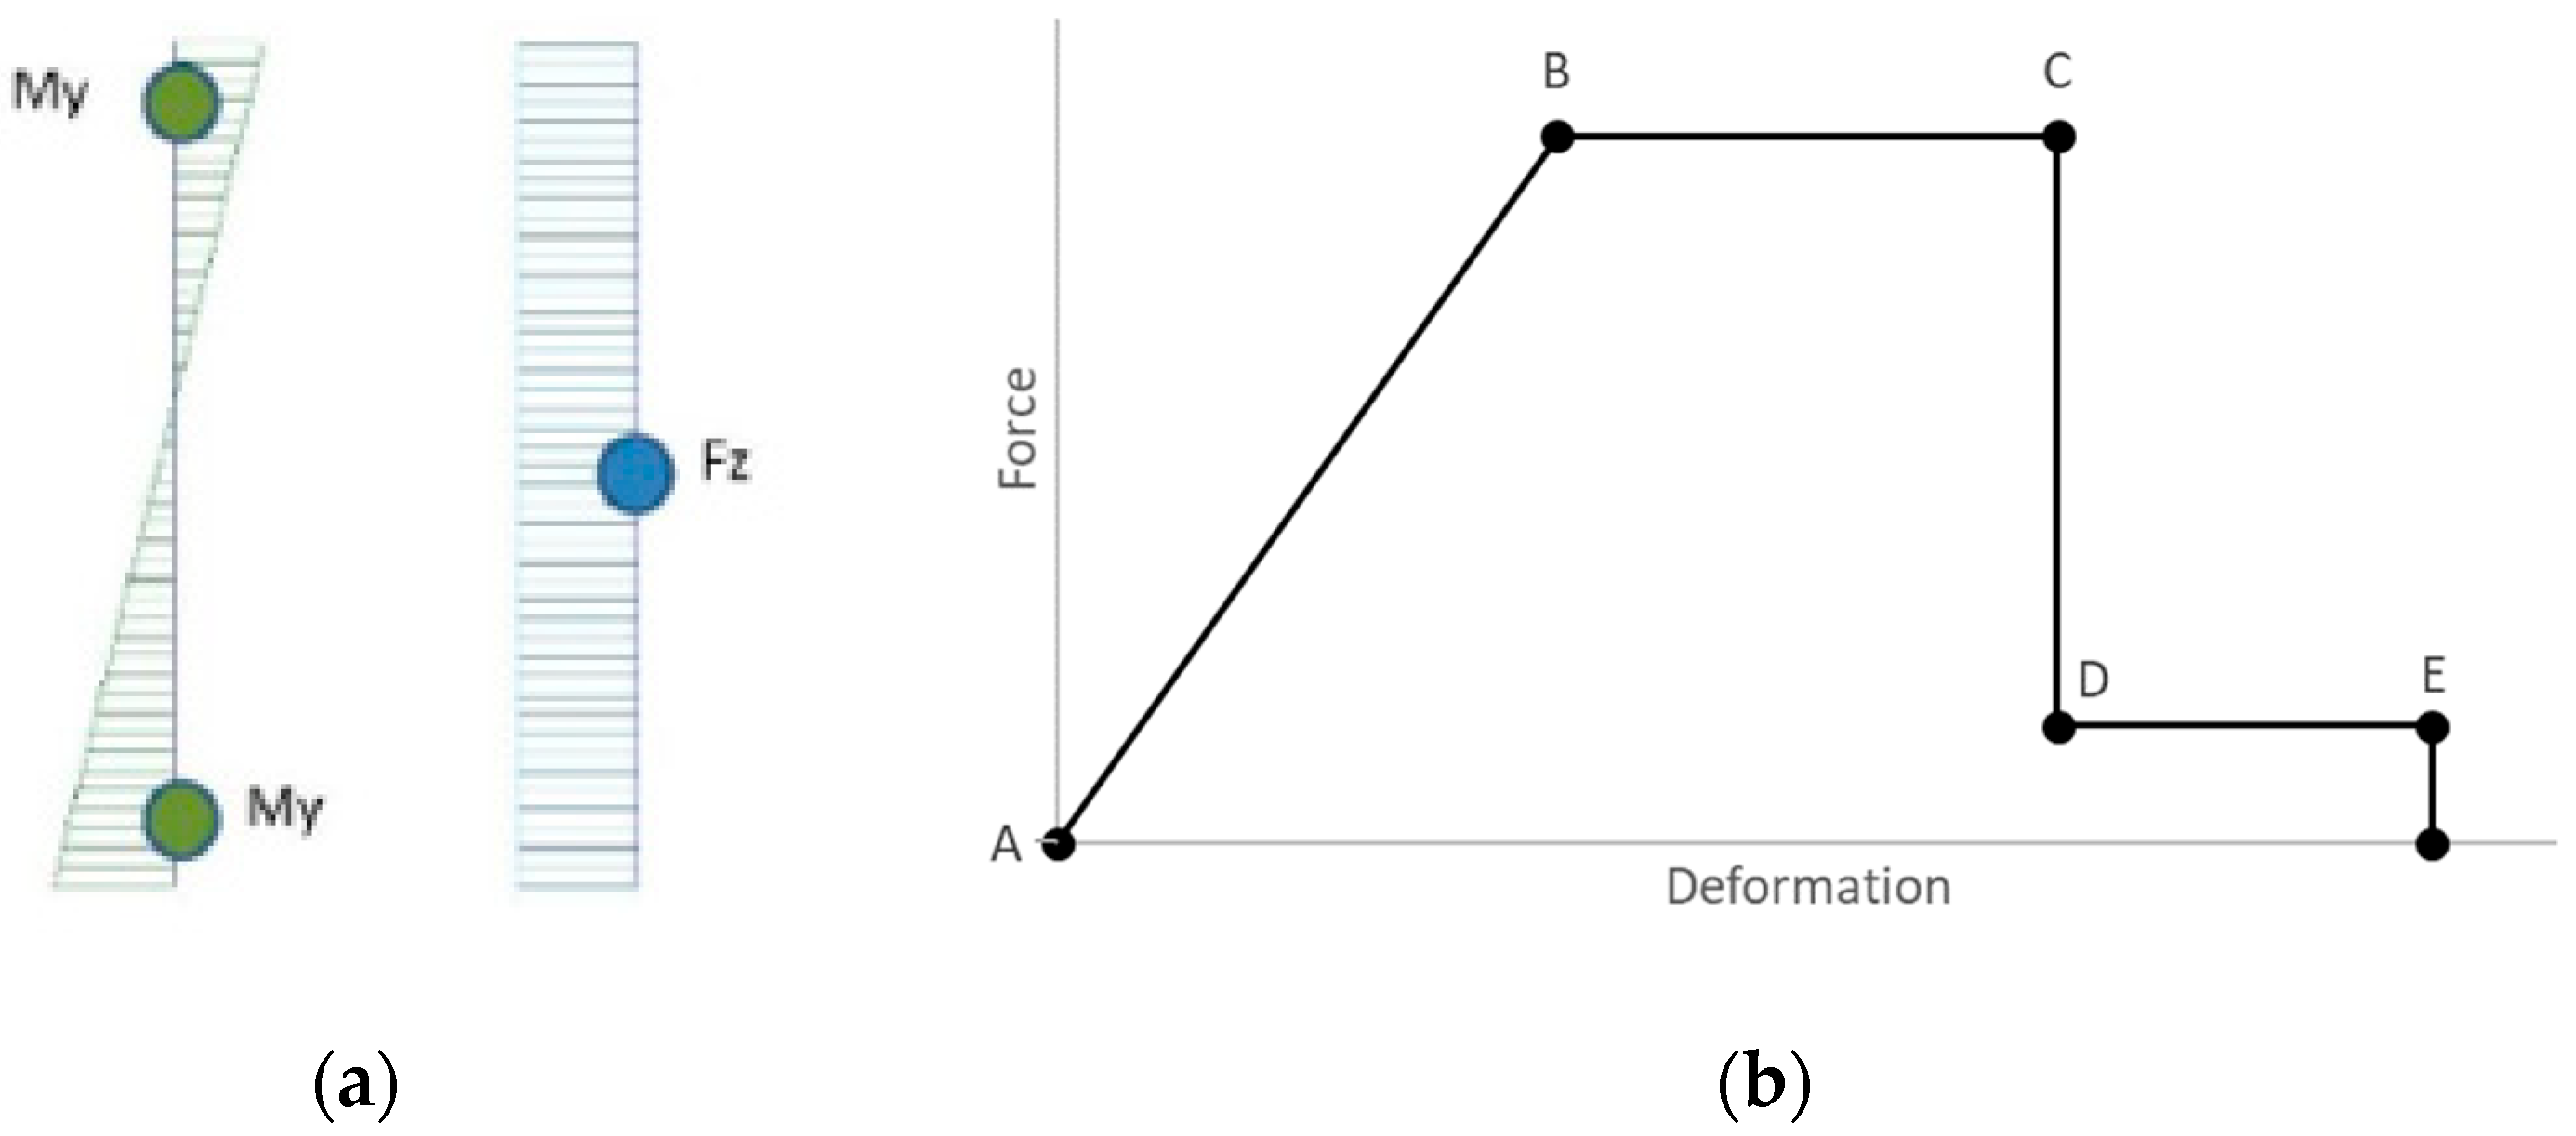
In this case, the structural analysis was realized by Equivalent Frame (EF) modelling through the software Midas GEN. The macro-elements were modelled as 1D beam elements fixed at the base. The ultimate strength of the macro-elements corresponding to both flexural (My in Figure 7a) and shear mechanisms (Fz in Figure 7a) were evaluated according to the Italian Building Code [58,59] and Eurocode [73,74], assigning plastic hinges (A–E) with nonlinear constitutive laws for piers and spandrels (Figure 7b). Non-linear static analysis (pushover analysis) was chosen for the seismic analysis and was performed by applying an incremental horizontal load along the two principal directions of the structures (X-Y). As the building under analysis had been monitored since 2010 by the Italian Structural Seismic Monitoring Network (the so-called, in Italian, Osservatorio Sismico delle Strutture [75]), it has been also thoroughly characterized under the point of view of dynamic identification. Based on available experimental data derived from on-site testing campaign and a dynamic monitoring system, a very comprehensive validation and calibration of adopted numerical models was possible by means of other software [76].

3.1.1. Results of the Global Analyses

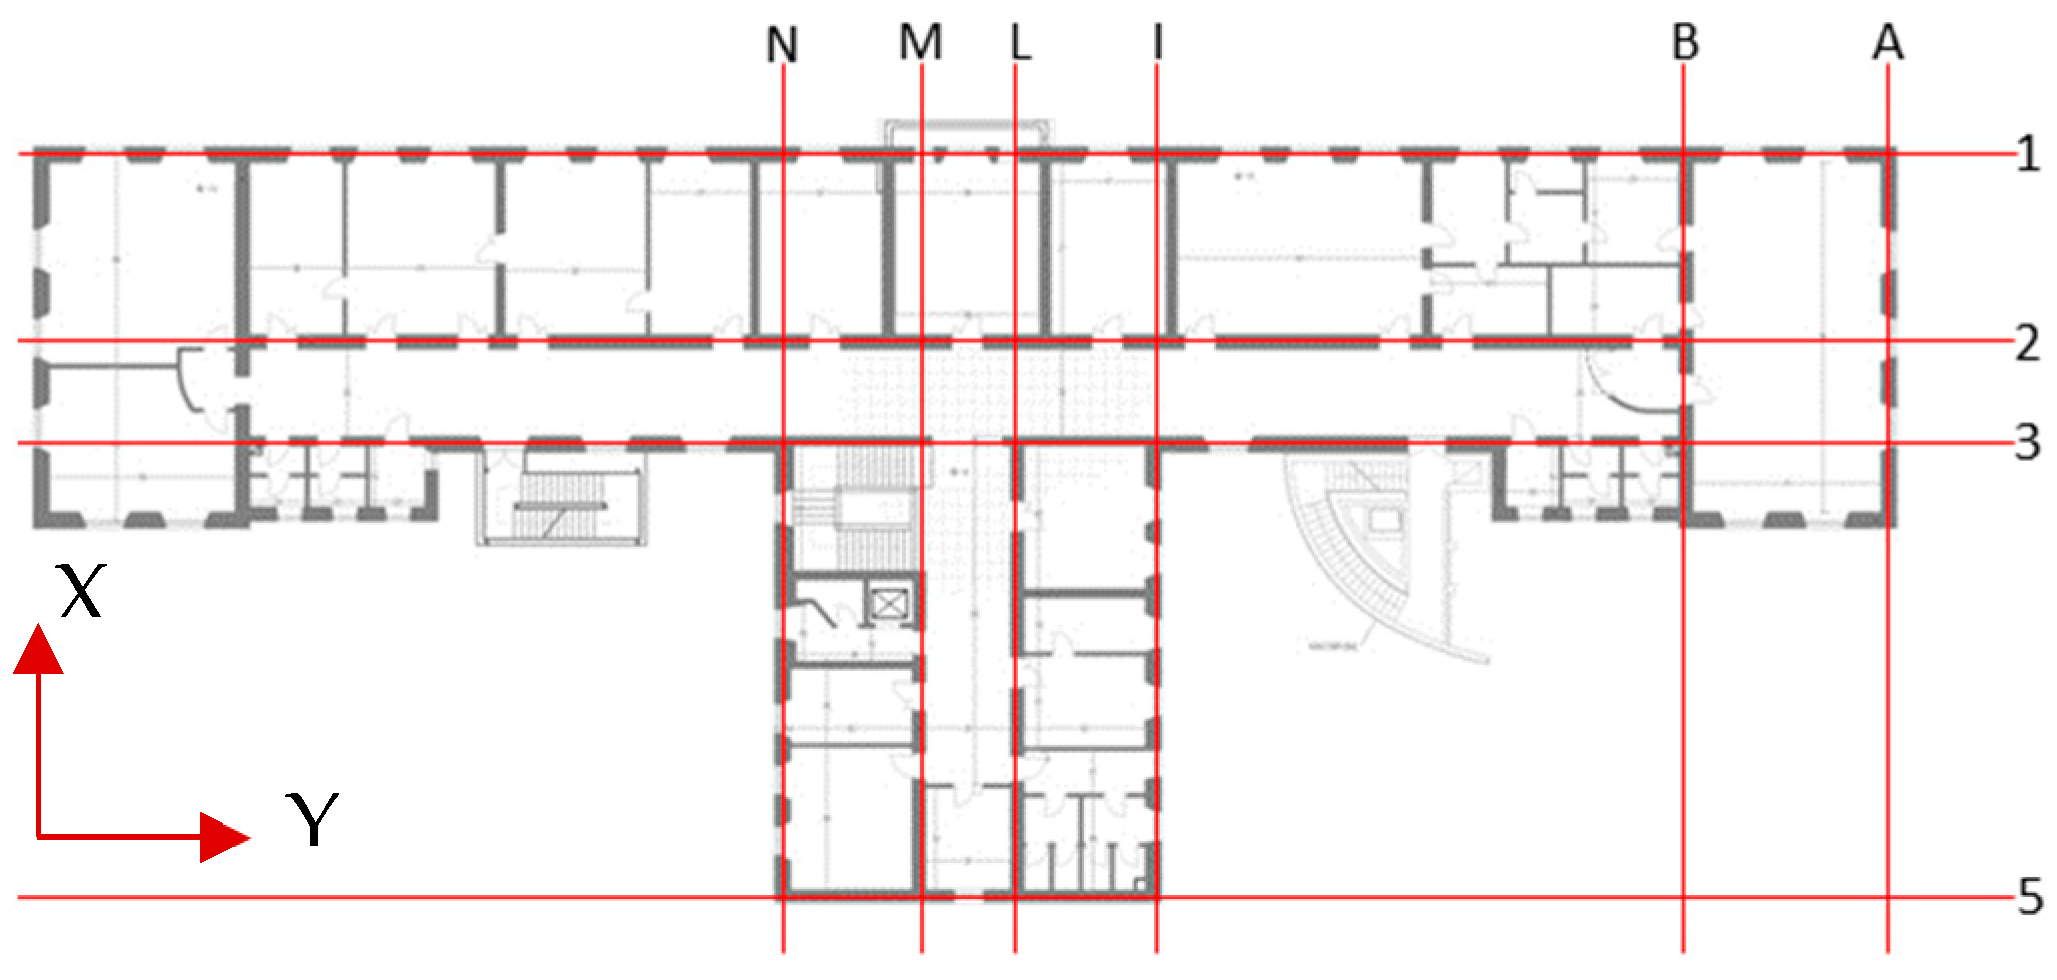
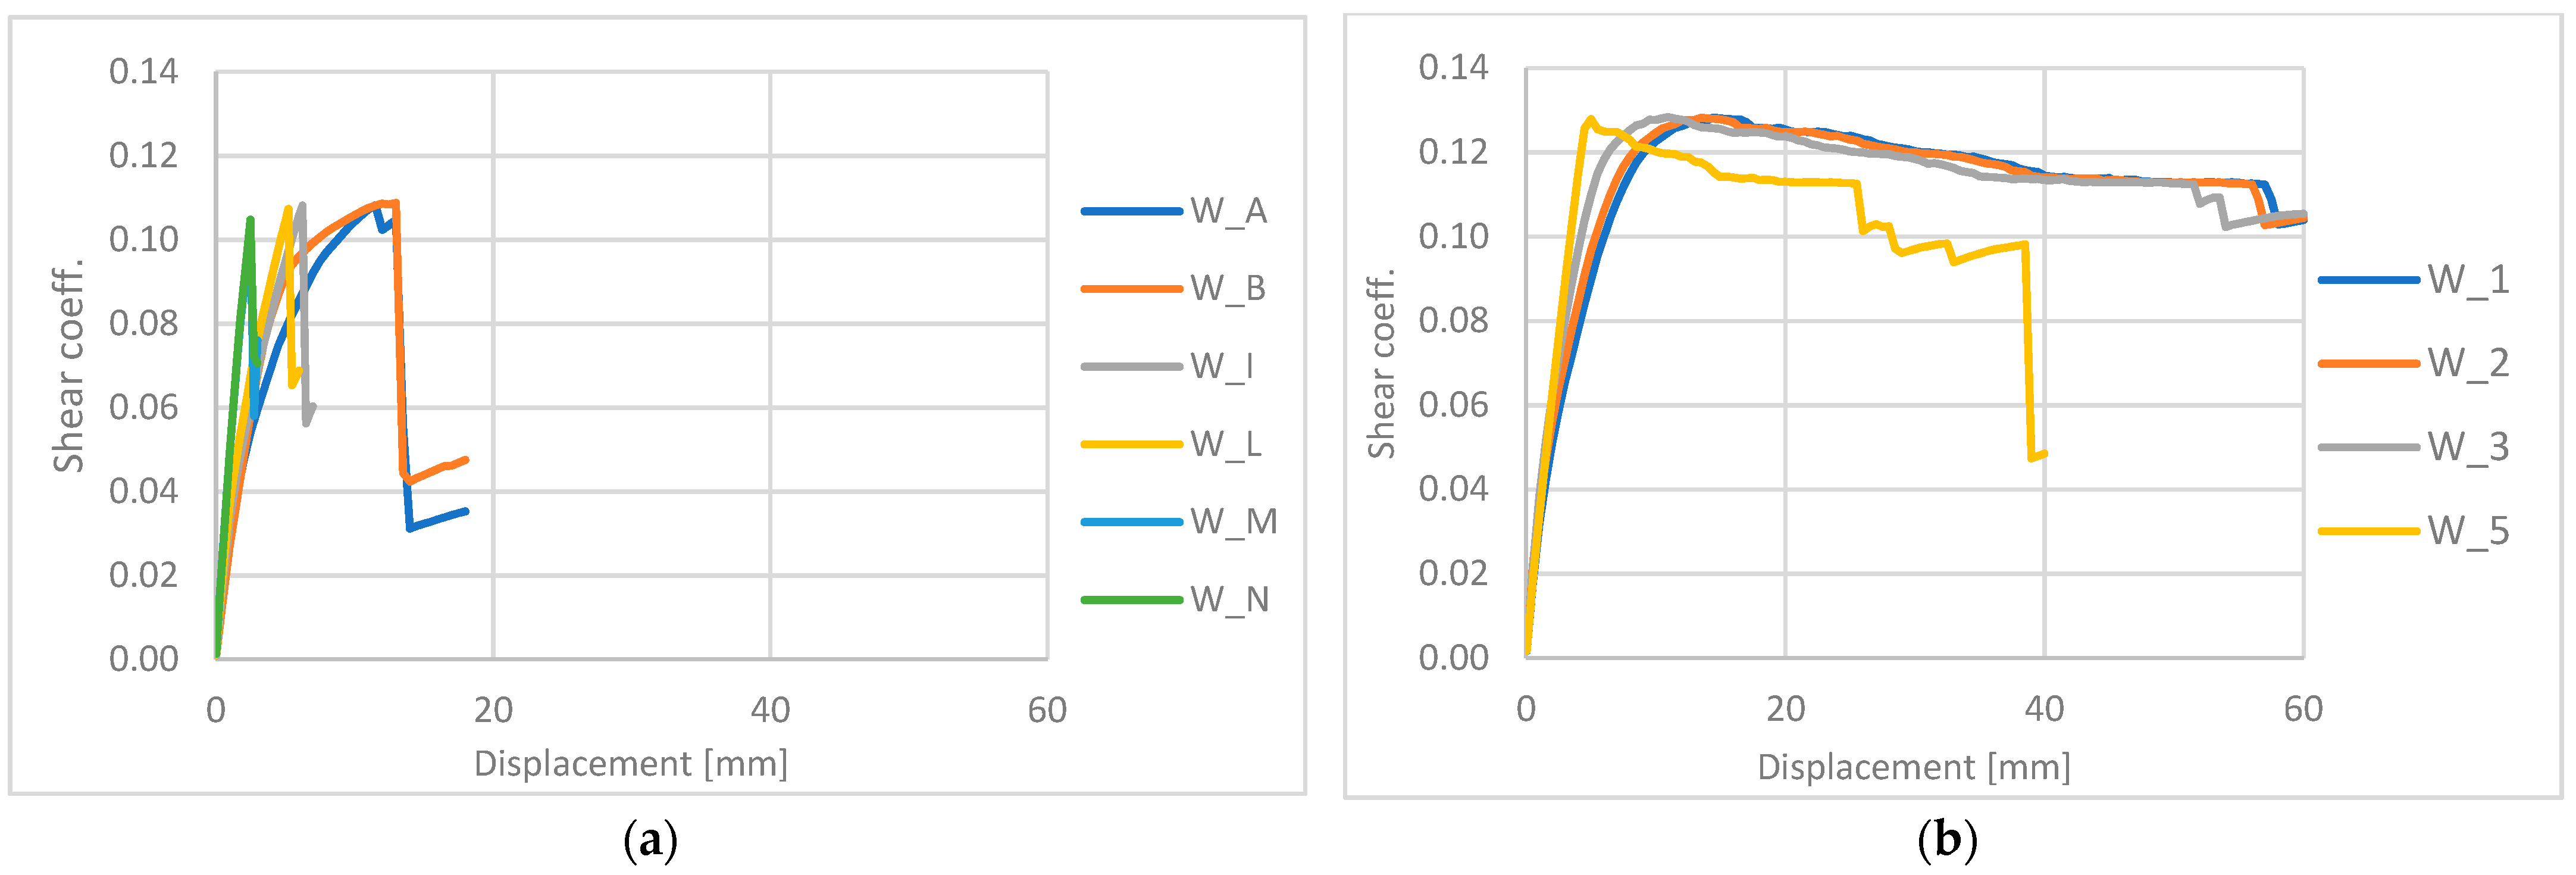
Since the building in the as-built condition has no rigid diaphragms, there is not an adequate distribution of the seismic actions, and each wall alignment presents an almost independent behaviour. To identify the most vulnerable elements, the control point of the pushover analysis (the point in which the maximum displacement is measured during the analysis) was moved on different walls for both principal directions of the earthquake, represented by the wall alignments A–N and 1–5 (Figure 8). Pushover curves are presented in terms of shear coefficient (ratio between the lateral load capacity and the total weight) and top displacement of each planar wall alignment.
Figure 9 shows that, given the irregular plan shape of the building, the longitudinal direction (Y) shows a better seismic response both in terms of base shear and displacement capacity (Figure 9b). Along this direction, the long masonry walls are able to activate energy dissipation mechanisms, whereas in the transversal direction (X), the behaviour is more brittle, with limited capacity (Figure 9a). The absence of rigid diaphragms significantly influences the different response in the two directions. The minimum value of the ratio between the lateral load capacity and the seismic demand ( ξ e ) , obtained by means of these analyses, is equal to 0.11.

3.1.2. Seismic Risk Category Assessment

According to the conventional method presented in the Italian guidelines [51,52,53], the seismic risk category depends on two parameters:
  • Safety index IS-V: defined as the ratio between the building capacity, in terms of Peak Ground Acceleration (PGA) that allows reaching the life-safety limit state, and the demand, i.e., the PGA, that the Italian Building Code [58,59] indicates for the site.
  • Expected Annual Loss EAL (PAM in Italian): defined as the cost for repairing the damage caused by all the seismic events that may happen during the building’s lifetime, annually divided and expressed as a percentage of the construction cost. EAL/PAM can be assessed as the area underlying the curve representing direct economic losses, according to the average annual frequency of exceedance of events that cause the achievement of a certain limit state for the structure.
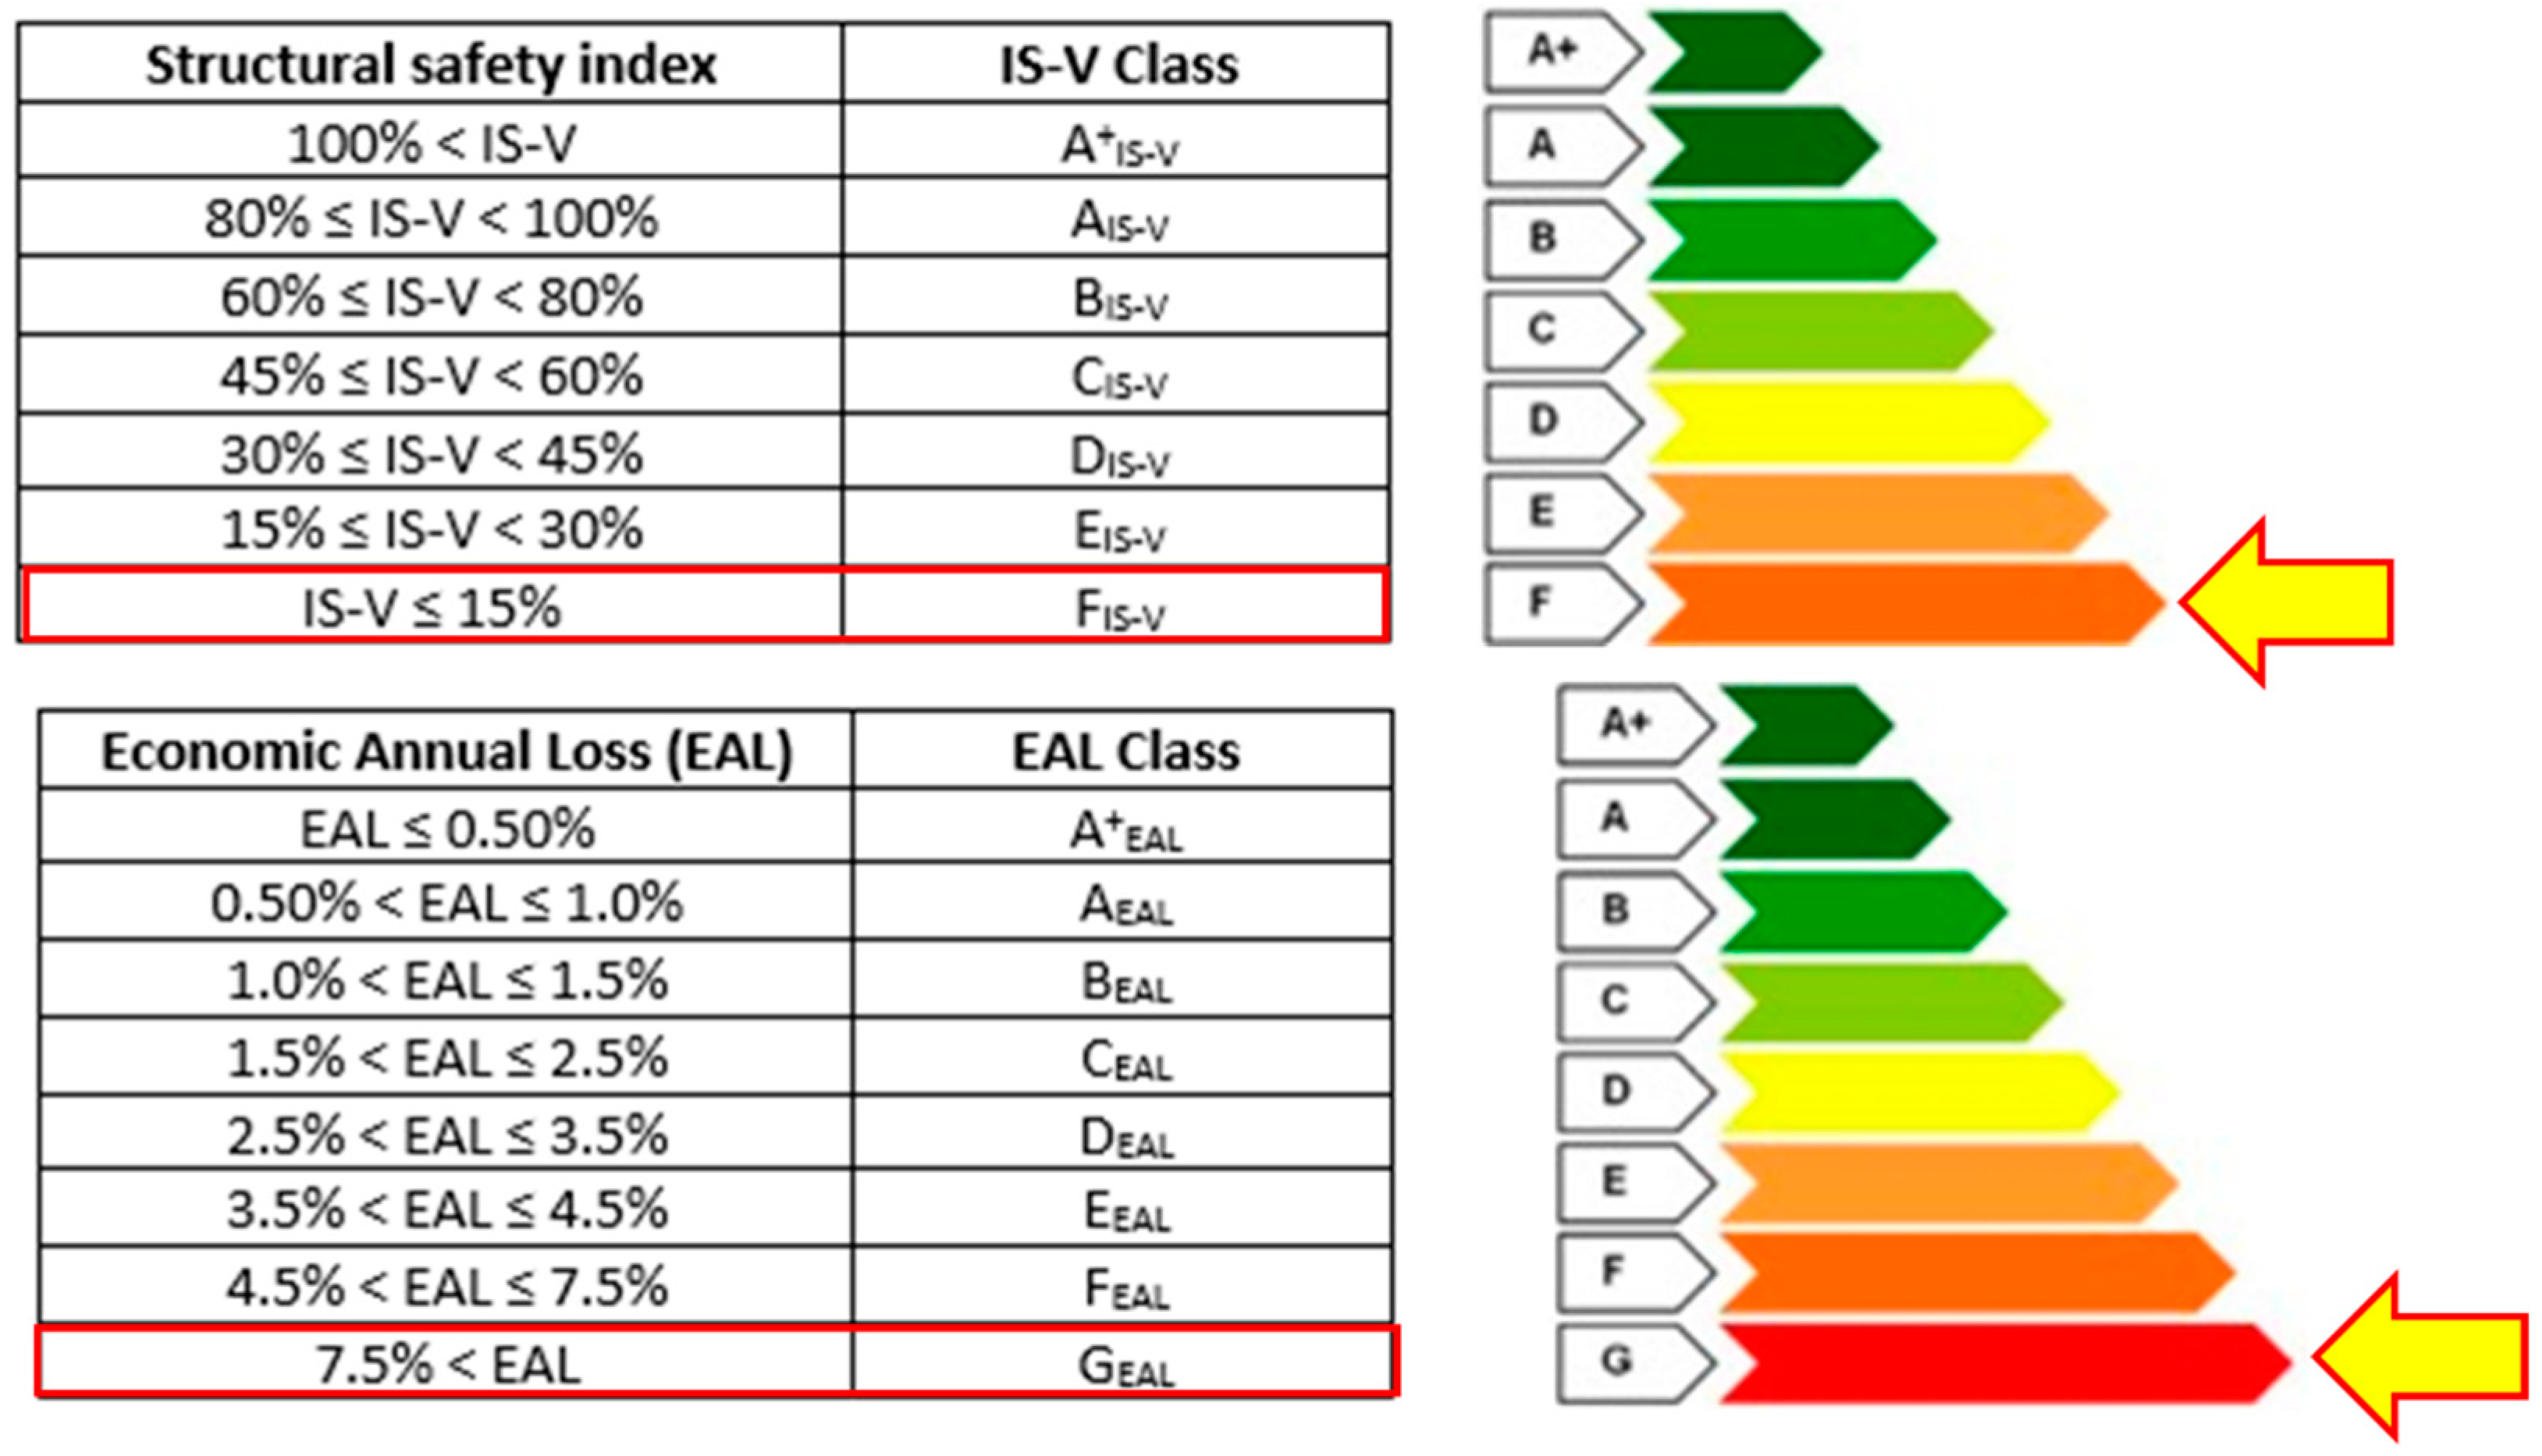
Following the above-described conventional method, the case study presents a seismic risk category G, according to the lowest parameter obtained between the IS-V and EAL/PAM score (Figure 10).

3.2. Energy Analysis

The energy performance of buildings is presented as the total energy per unit area in a time span of one year (kWh/m2 y). The energy performance certificate (APE in Italian) provides a subdivision into energy classes according to the needs of the building. The scale goes from letter G (less efficient) to letter A (more efficient) and is further divided into four subcategories, including the nearly Zero Energy Building (nZEB) indicator. The energy class of the building is obtained by comparing the primary energy needs of the building with the reference building. The standard governing the estimation of non-renewable primary energy requirements is UNI TS 11300 [77]. The calculation method required by the legislation is a quasi-steady-state type that is implemented in different commercial software (EDILCLIMA, in this specific case [78]). Even though a detailed model is not necessary according to the current regulation, a dynamic simulation of the building allows more precise results. For this reason, a dynamic model was created with the software TRNSYS [79], which is designed to simulate the transient performance of multi-zone building models.

3.2.1. Energy Performance Certificate APE

The energy performance certificate (APE in Italian) is mandatory for public buildings, and it is also required for renovation interventions. The building is classified according to the overall energy performance index. Global primary energy is the sum of energy requirements for:
  • Winter air conditioning,
  • Summer air conditioning,
  • Domestic hot water,
  • Air ventilation,
  • Lighting, and
  • Transports.
The results of quasi-steady-state model are presented in (Table 1).
The overall primary energy requirement also considers renewable energy inputs. In this case, the only renewable energy component is derived from the electricity conversion factor that refers to the national generation obtained by renewable energy sources. The need for non-renewable primary energy is therefore lower than the overall:
E P g l , n r e n = 176 [ k W h m 2   y ]
The corresponding energy class is the class G, which is the lowest.

3.2.2. Dynamic Model

A dynamic simulation (Figure 11) involves the calculation for short time intervals (usually hour). Compared to quasi-steady-state models, the results obtained are more accurate, especially in summer, when solar inputs are predominant. In order to ensure a sufficient level of detail in the results, several input data were needed to define external climatic conditions, room occupancy, lighting, electrical appliances, and internal thermal loads in general. To perform a dynamic simulation, the building was divided into thermal zones, which are portions of the building with the same thermal properties (orientation and intended use). The heat exchange through zone surfaces was calculated with the z-transfer function method developed by Stephenson and Mitalas [80].
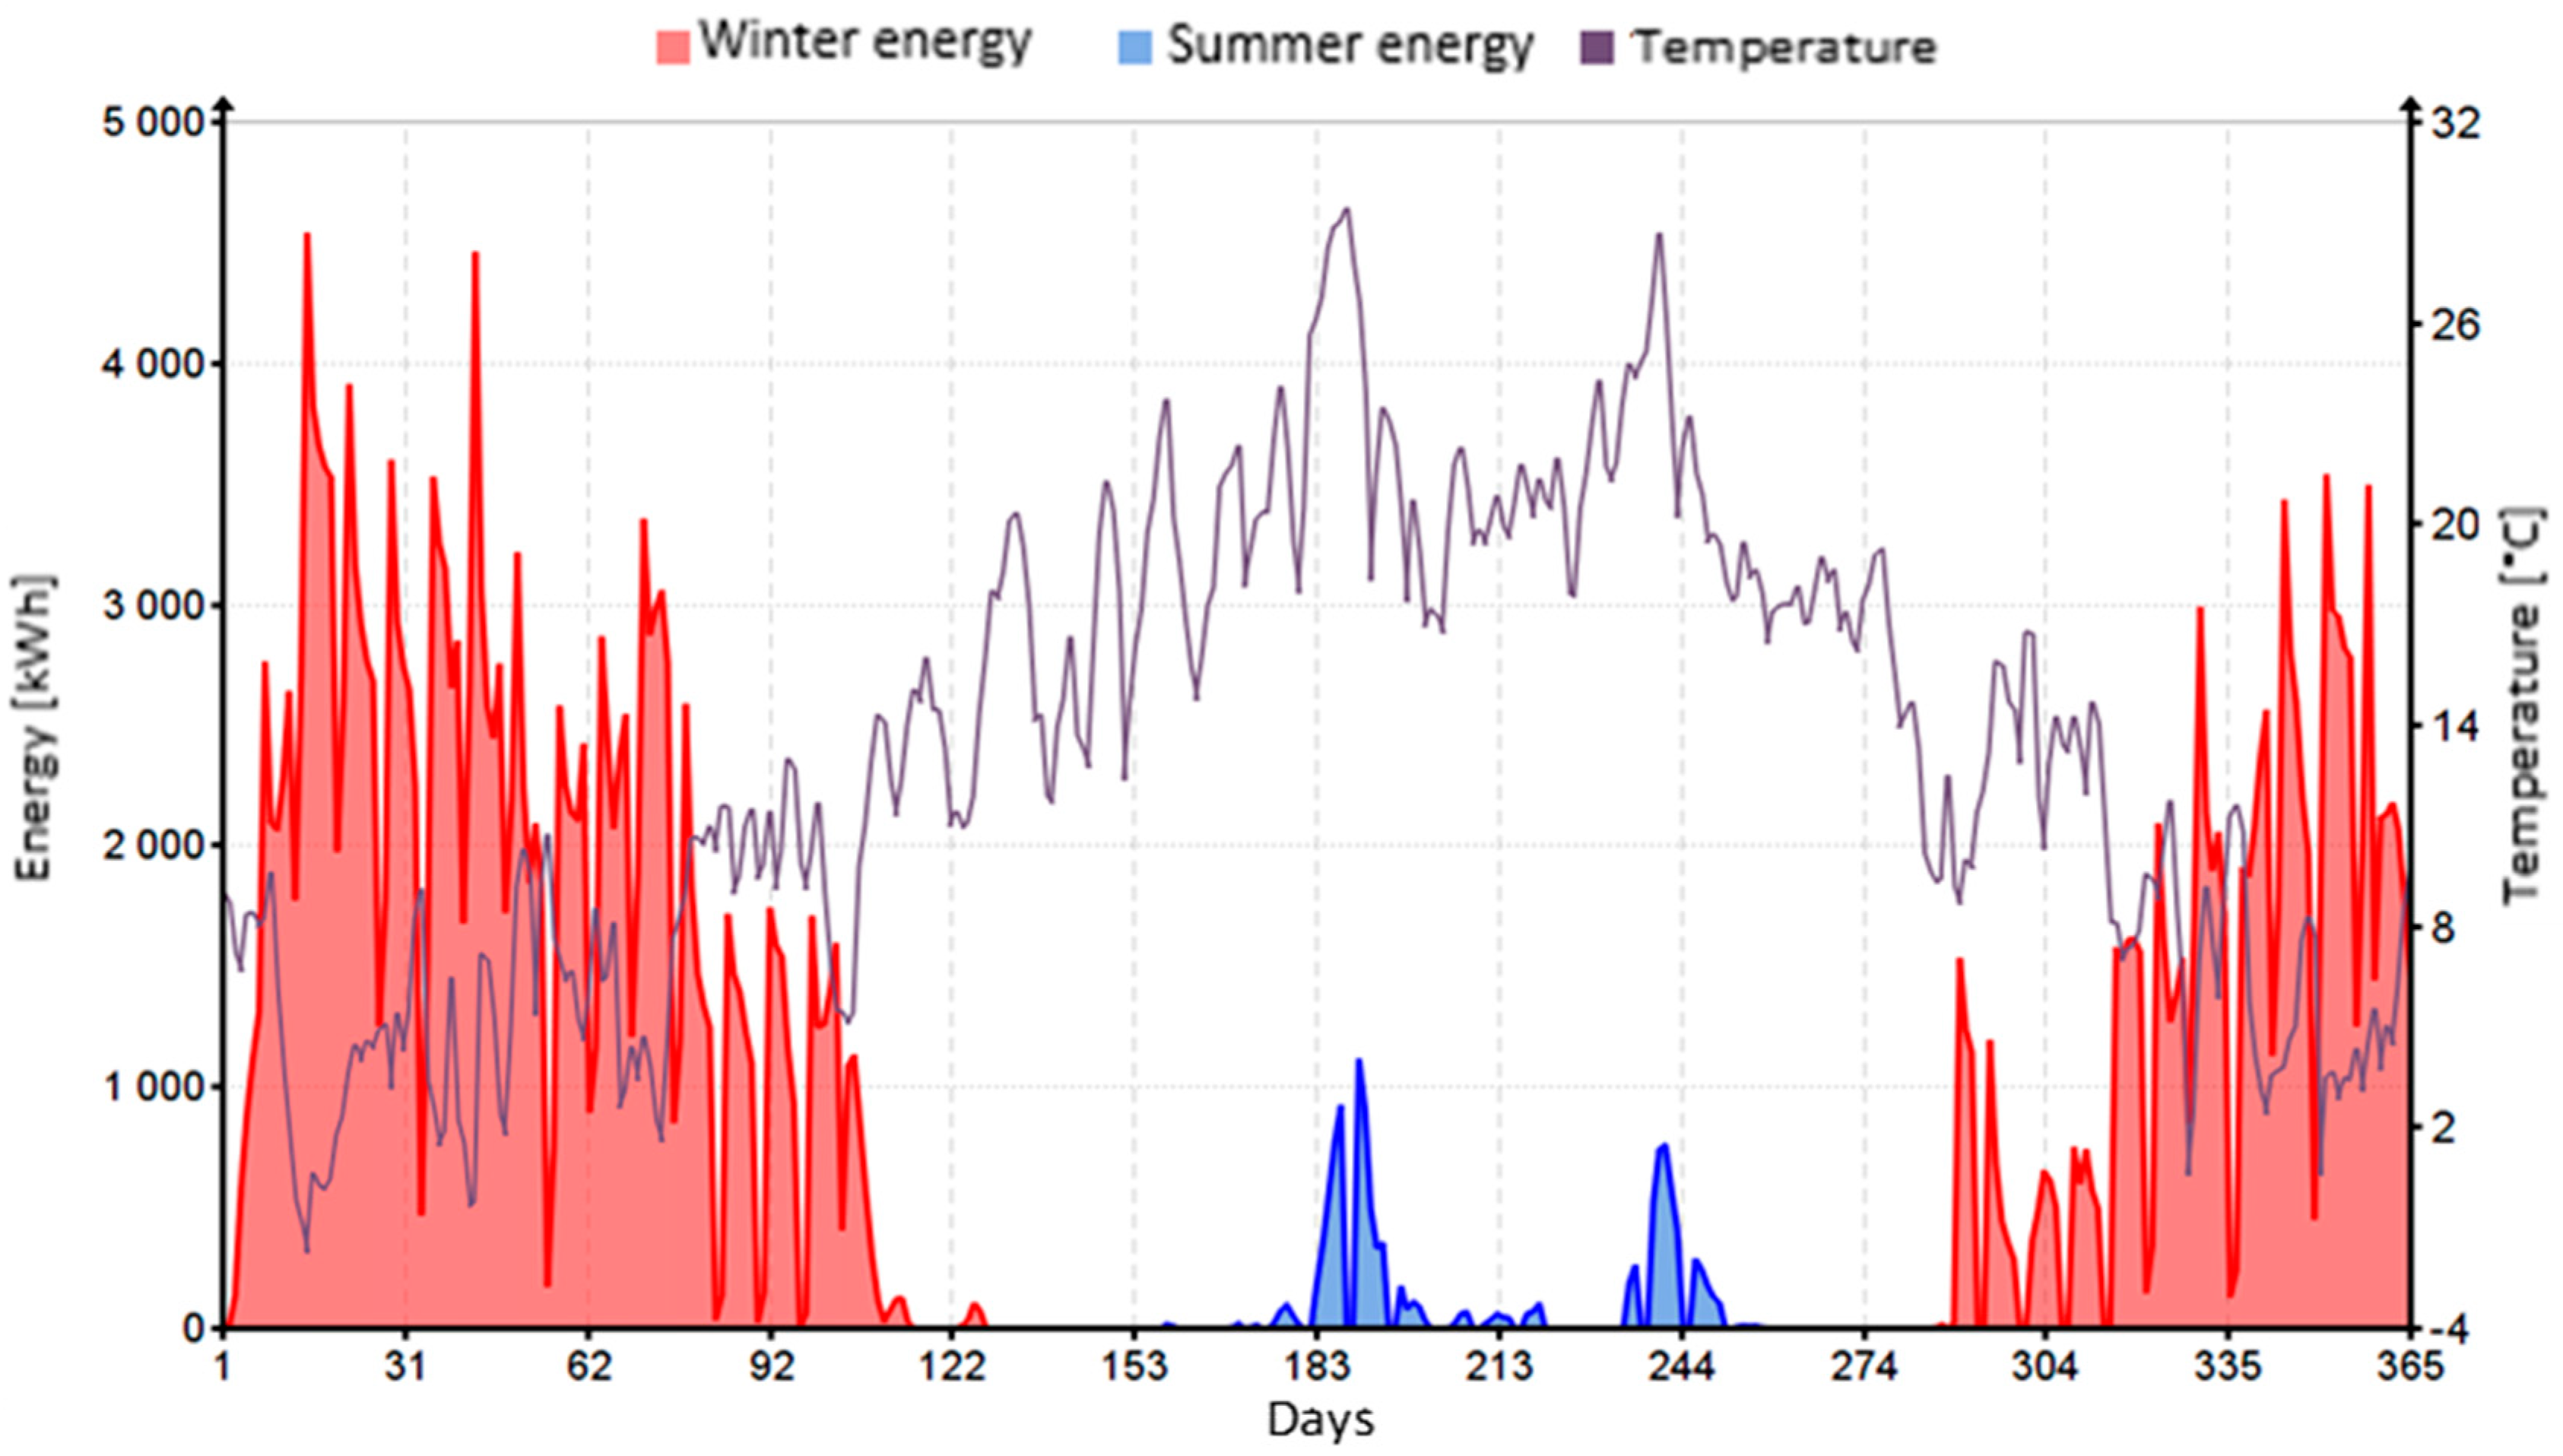
The main results of a dynamic simulation include the hourly indoor and operative air temperatures and the energy needed by each thermal zone for space heating and cooling, as shown in Figure 12. Considering that the outdoor air temperature is not higher than 26 °C very often, the heating energy demand is significantly greater than the cooling demand, as expected for the climate of Fabriano, which is typical of the zone E. Even though a validation with gas bills was not possible, the total energy required for space heating is 317 MWh and is coherent with the properties of the building.

4. Seismic and Energy-Integrated Retrofit Strategies

4.1. Seismic Retrofit Interventions

For the case study, it was estimated that the conditions sufficient to prevent local mechanisms were already provided, thanks to the quality and thickness of walls, and for the presence of good wall-to-wall connections. Therefore, taking as a reference the classification of interventions proposed by the Italian Building Code [58,59], local interventions, such as insertion of ties, are not necessary. On the contrary, high vulnerability was evaluated due to the absence of diaphragms with an adequate in-plane stiffness, which are able to provide a distribution of the seismic forces and thus increase the seismic capacity. For these reasons, intervention strategies aimed at strengthening and improving the structural behavior of walls and/or horizontal elements (or jointly on both elements) were designed.
The seismic retrofitting interventions on vertical walls (Table 2) consisted of the application of reinforced cement coating on both side of the inner walls and grout injections on all the stone masonry walls of the building, which are typical interventions in case of existing stone and brick masonry walls [18]. Since the external façades of the building are protected, in case of the external walls, the use of reinforced cement coating was not taken into account.
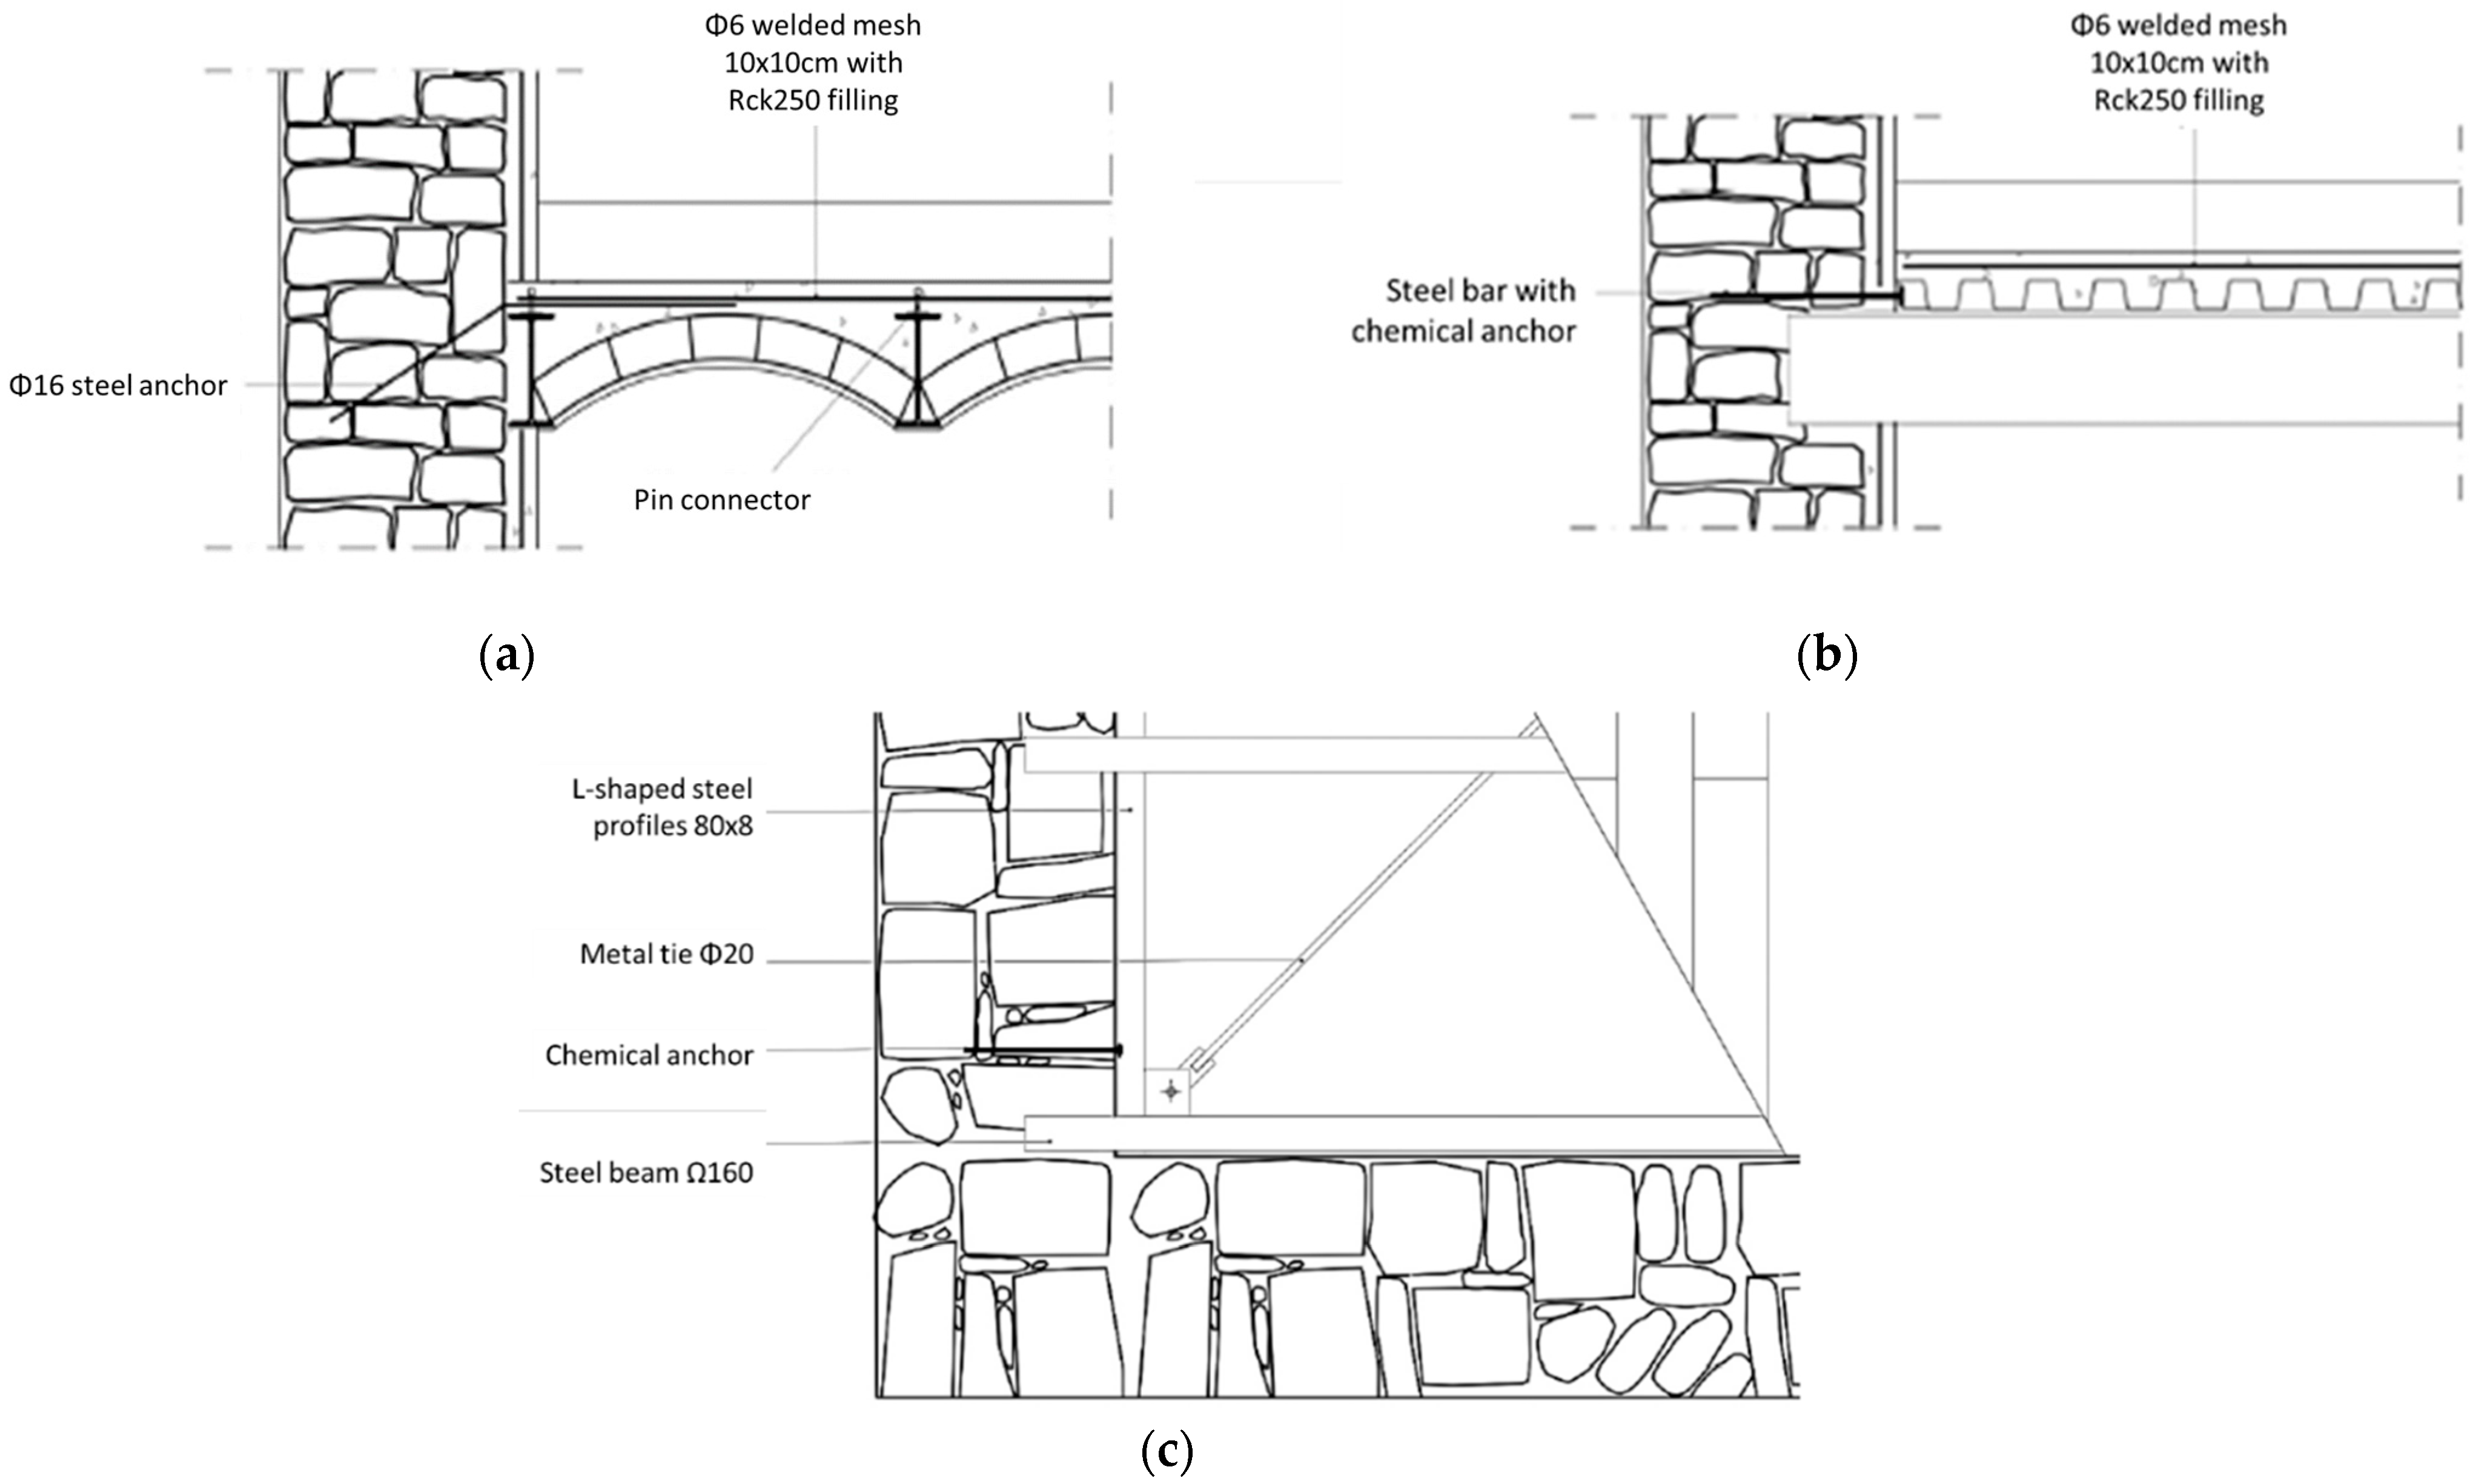
The seismic retrofitting interventions on horizontal floors varied according to the floor type (see Figure 13):
  • S1–2 (Figure 13a): creation of a collaborating 6-cm thick concrete slab by welding pin connectors on steel profiles, application of a 6-mm welded mesh 10 × 10 cm, and subsequent filling with concrete Rck 250 for a thickness of about 6 cm. To ensure the connection with the masonry walls, every 60 cm throughout the perimeter, 16-mm steel anchors were added in 30-mm holes with mortar or resin filling.
  • S3 (Figure 13b): complete replacement of the floor with a new steel-concrete slab made of IPE steel beams, metal sheet, 5-mm welded mesh 10 × 10 cm, and subsequent filling with concrete Rck 250. To ensure the connection with the masonry, steel bars linked to the walls by means of chemical anchors were added.
  • S4 (Figure 13c): addition of a diagonal steel bracing made of L-shaped steel profiles throughout the perimeter and diagonal metal ties. To ensure the connection with the masonry, steel bars linked to the walls by means of chemical anchors were added.

4.2. Energy Retrofit Interventions

The main targets of the energy efficiency interventions were improving the building envelope, which was linked to the non-optimal performance of the opaque perimeter structures and the obsolescence of transparent surfaces (windows); upgrading the energy systems with new generation heat pump systems with possible insertion of mechanical ventilation; and installing systems for the production of energy from renewable sources, to reduce emissions.
In this perspective, the energy retrofitting interventions consisted of:
  • Thermal insulation of opaque surfaces on the inner side with 13–15 cm of stone wool, Uwall = 0.22 W/(m2·K);
  • Replacement of fenestrations with windows with triple low-emissive glass, Uframe = 1.2 W/(m2·K) e Uglass = 0.6 W/(m2·K);
  • Replacement of radiators with radiant floor.
  • Replacement of the boiler with an air-water heat pump, operating even in summer cooling;
  • Installation of ventilation equipment;
  • Thermal insulation of floors for the non-air-conditioned areas;
  • False ceiling in order to reduce the air-conditioned volume; and
  • Installation of photovoltaic system for renewable energy production.

4.3. Seismic and Energy Integration

The methodology proposed aims at implementing retrofit strategies that combine both energy and seismic interventions applied to the same building component (vertical structures, horizontal structures, entire building). In order to optimize the management of the construction site, demolitions, and finishing, interventions implying simultaneous or immediately sequential operations on the same structural elements were combined. The integration between seismic and energy interventions was estimated to be 25% cheaper than carrying out both retrofits separately [36]. As shown in Table 3, four different operational levels were implemented:
  • LEVEL 1. This level concerns simultaneous seismic and energy retrofitting interventions applied on the vertical elements. The structural interventions consist of grout injections and reinforced cement coating, as previously discussed. The energy interventions consist of thermal insulation of perimetral walls and replacement of fenestrations (points 1 and 2 of Section 4.2).
  • LEVEL 2. This level concerns simultaneous seismic and energy retrofitting interventions applied on the horizontal elements. The structural interventions consist of the seismic retrofitting interventions on horizontal floors, as described in Section 4.1. The energy interventions consist of replacement of radiators with radiant floors, replacement of the boiler with an air-water heat pump, installation of ventilation equipment, thermal insulation of floors, and installation of a false ceiling (points from 3 to 7 of Section 4.2).
  • LEVEL 3. This level consists of the combination of Level 1 and Level 2.
  • LEVEL nZEB. This level is a variant of Level 3, with the additional installation of a photovoltaic system for energy production.

4.4. Comparative Analysis of Retrofit Strategies

Table 4 and Figure 14 show the dynamic response of the structure in terms of frequency, mode shape, and participating mass for the first three modes for the building in the various conditions (as built and after the interventions of Level 1, Level 2, and Level 3). It can be noted that the as-built condition and Level 1 strategy are characterized by the presence of local modes due to the diaphragm’s insufficient in-plane stiffness that cannot ensure an adequate distribution of lateral actions and a sufficient connection between the different wall alignments. On the other hand, the in-plane strengthening of floors carried out by Level 2 and Level 3 strategies deeply modified the behaviour of the structure, with local modes replaced by global modes involving the entire structure.
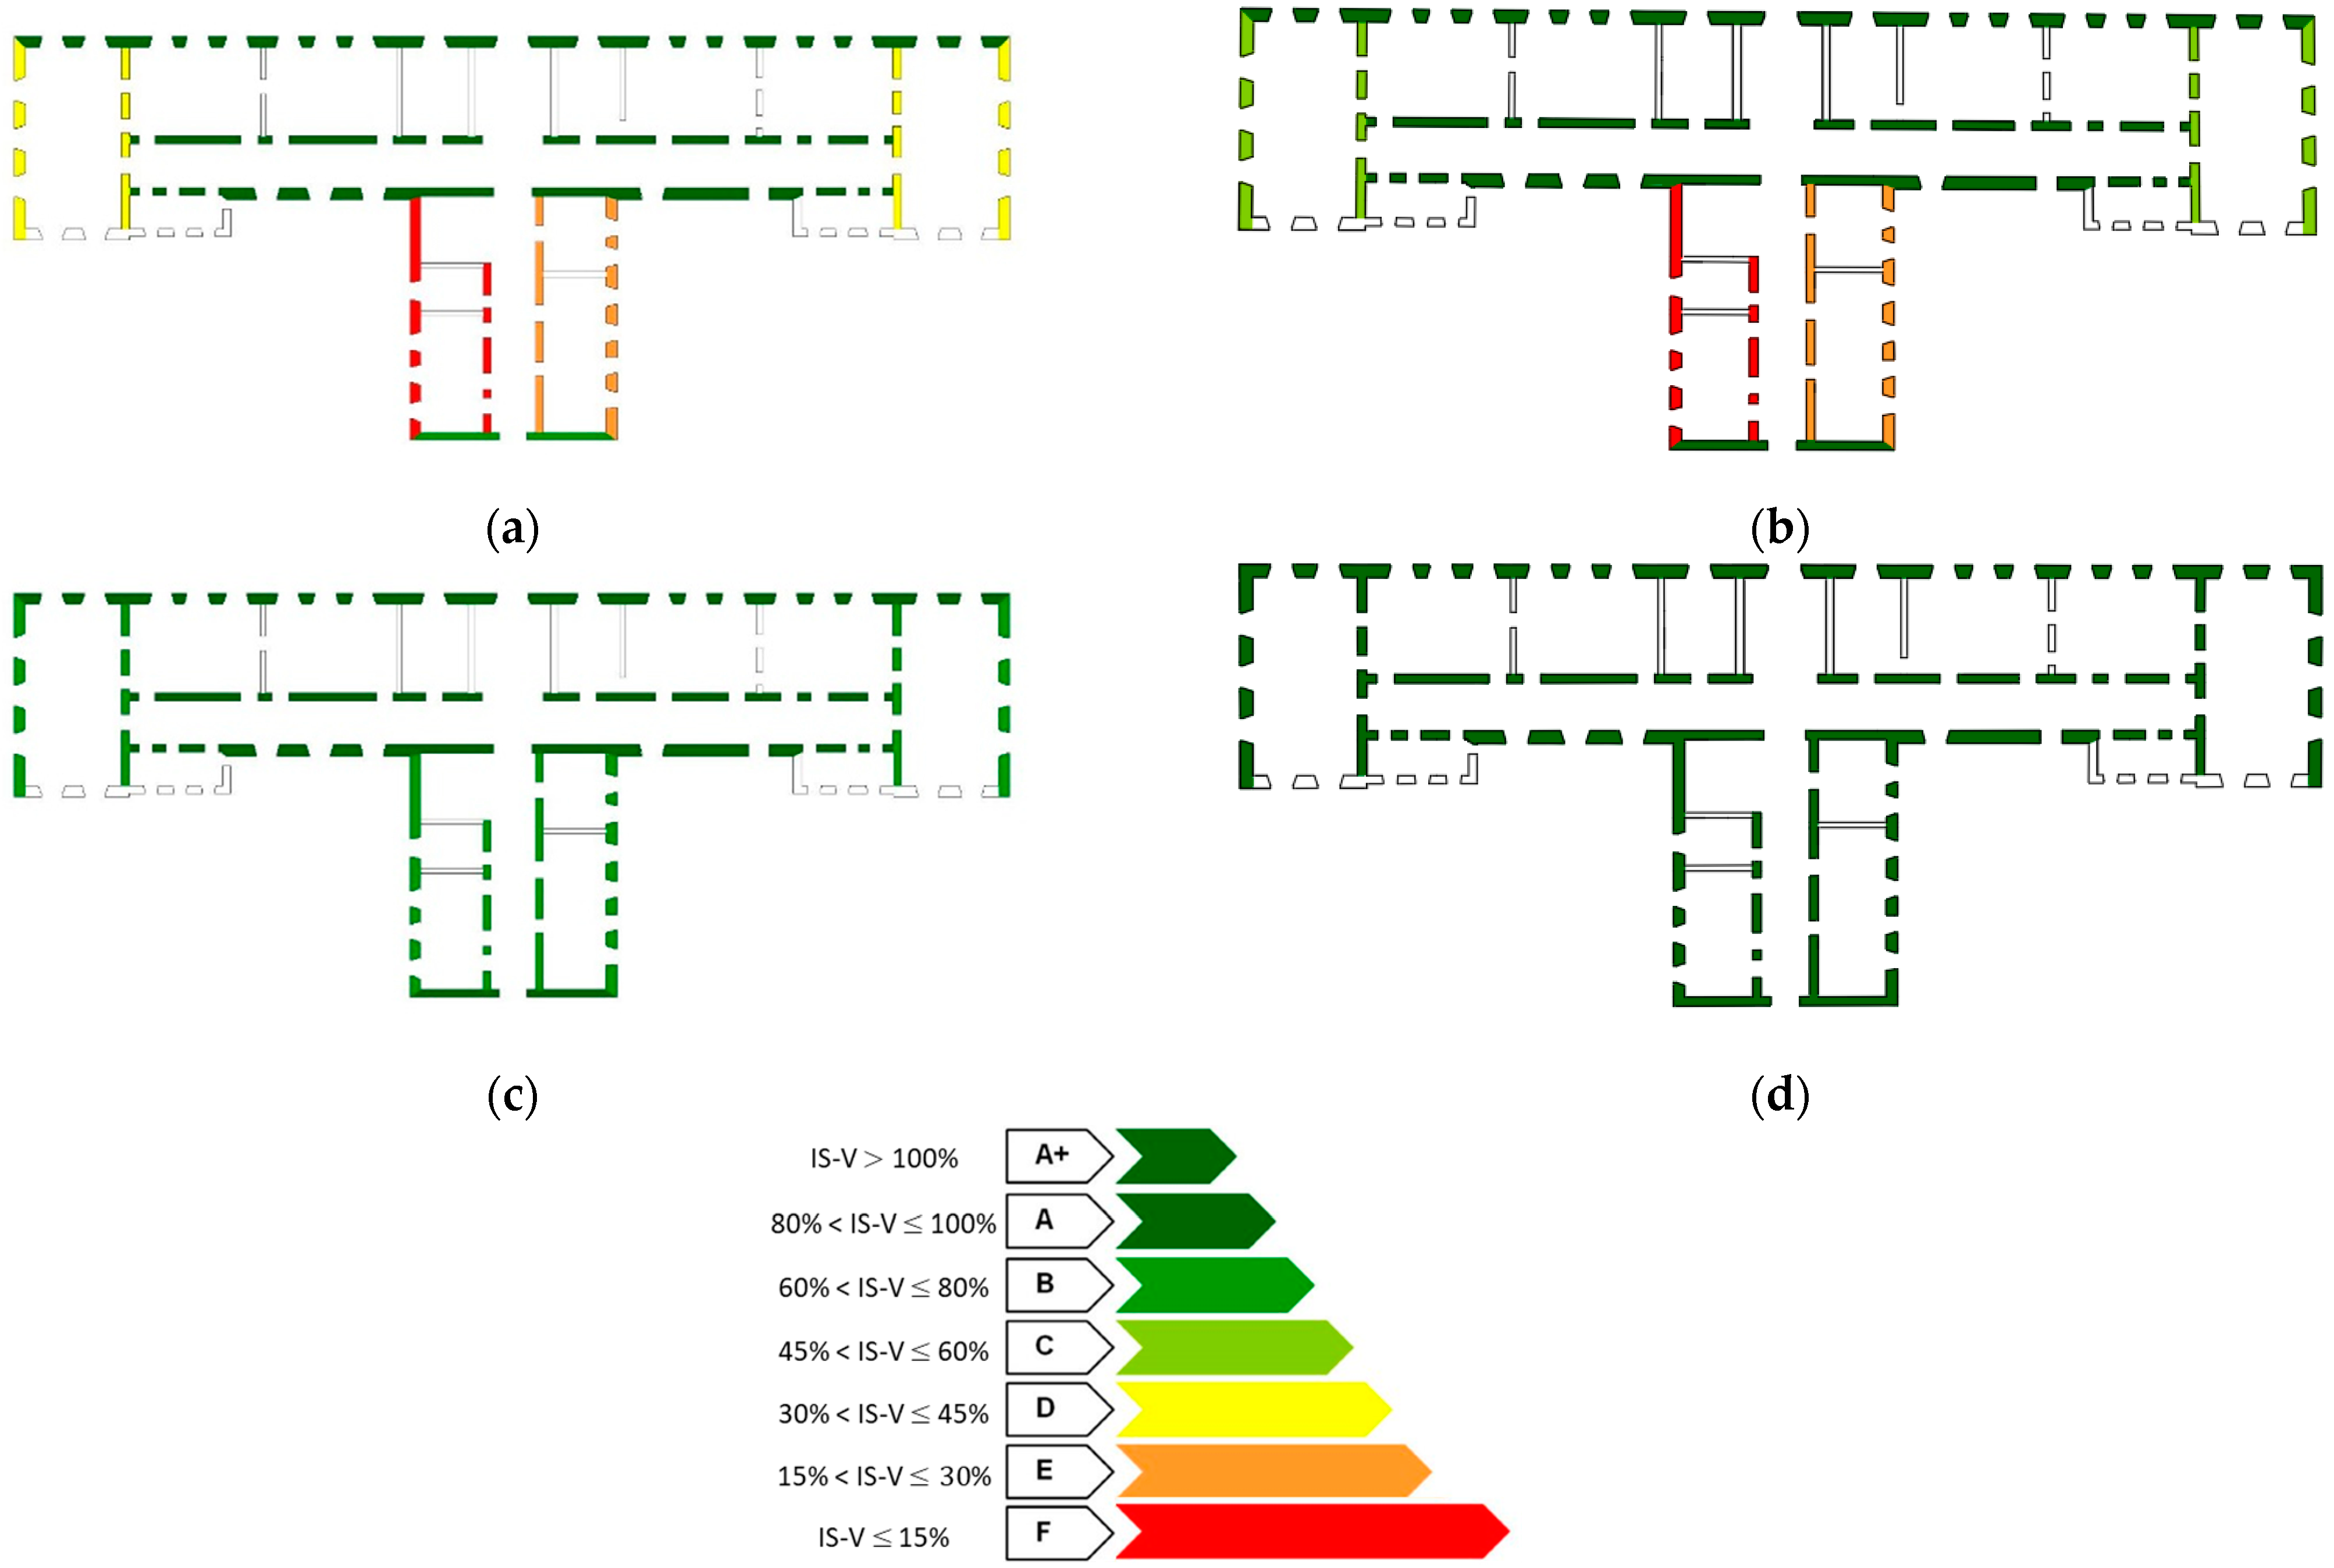
Figure 15 shows the structural safety index of the wall alignments for the different conditions. It can be noted, as in the as-built condition and in Level 1 strategy, that all of the wall alignments in the transversal direction have an insufficient structural safety level, with the wall alignments of the short wing presenting the most vulnerable behavior. In Level 2 and Level 3 strategies, the redistribution of lateral actions, thanks to the in-plane strengthening interventions carried out on the floors, allows a better exploitation of the lateral load resistance of the elements.
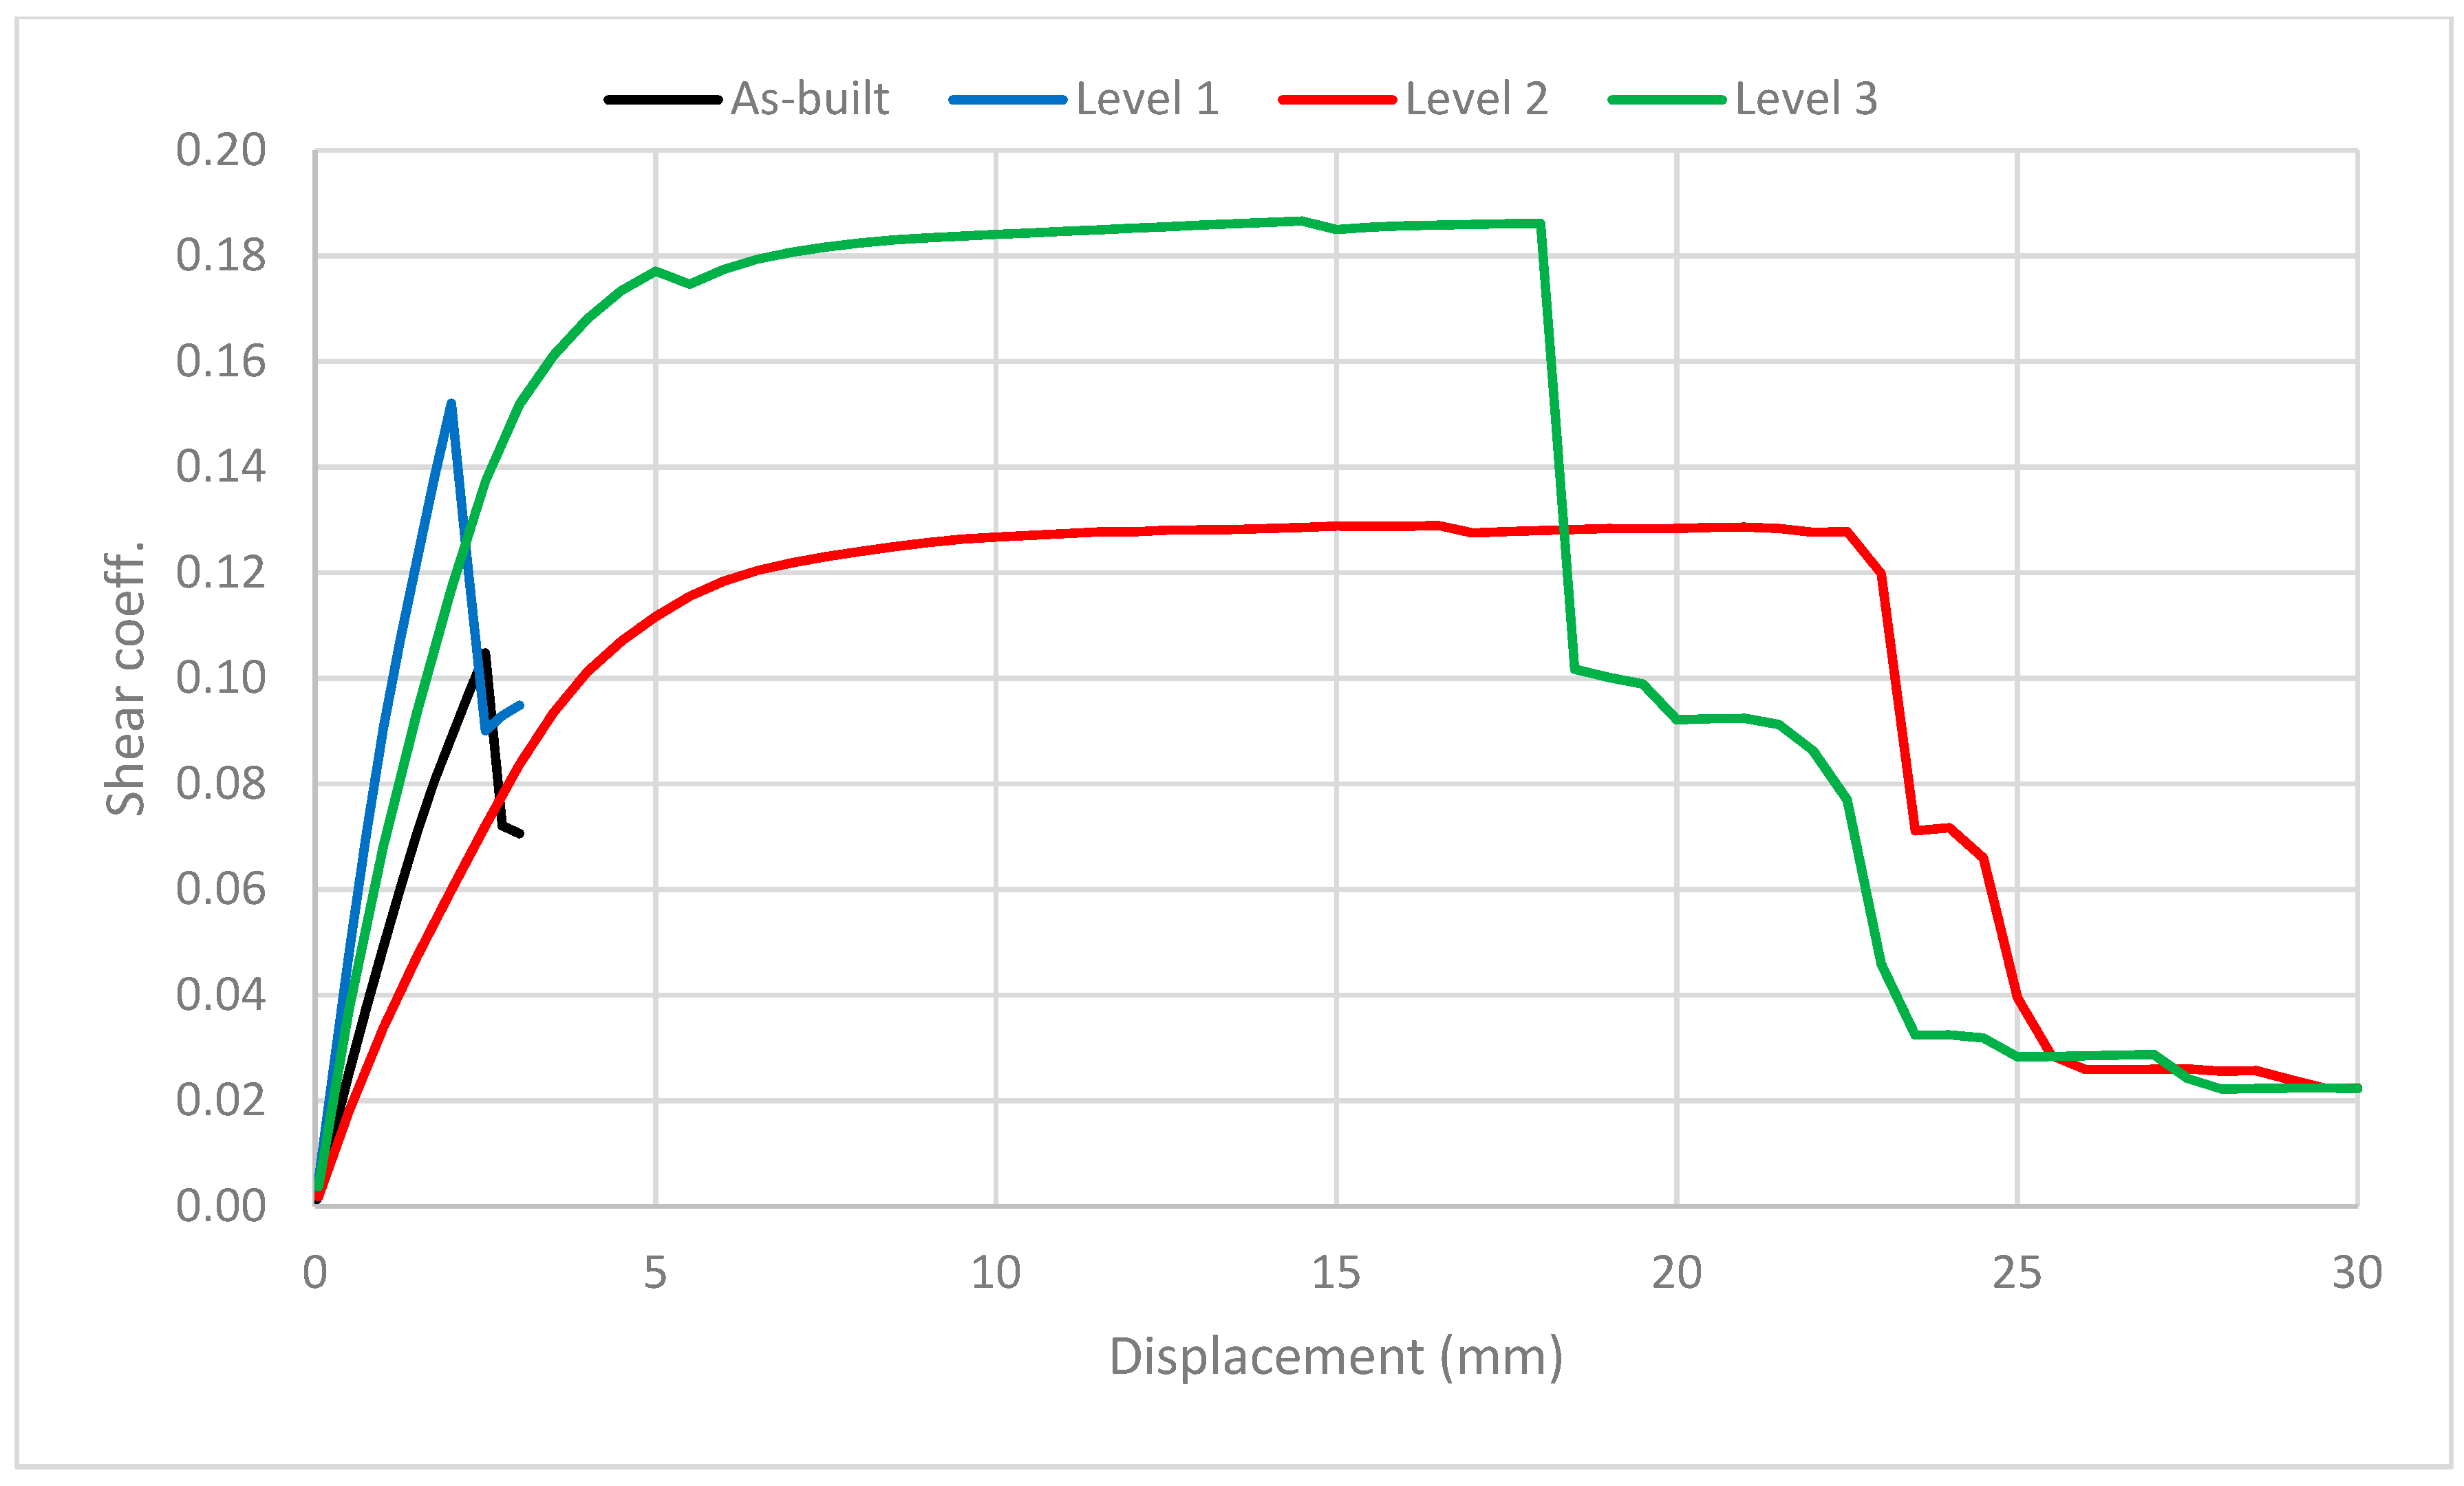
Figure 16 shows the capacity curves of the most vulnerable wall alignment (W_N) with and without the various retrofit strategies. Level 1 strategy improves the strength of the wall but does not change the overall seismic behavior, which remains quite brittle also after the application of the intervention. Conversely, Level 2 does not increase the lateral load capacity of the wall, but it deeply modifies the seismic behavior of the entire building, allowing a more adequate redistribution of the seismic action on the walls. The resulting behavior of the various wall alignments changes from brittle to a more ductile one. Level 3 strategy combines both benefits of Level 1 and Level 2, increasing the lateral load capacity of the wall and also providing a behavior that is more ductile than that of the as-built condition.
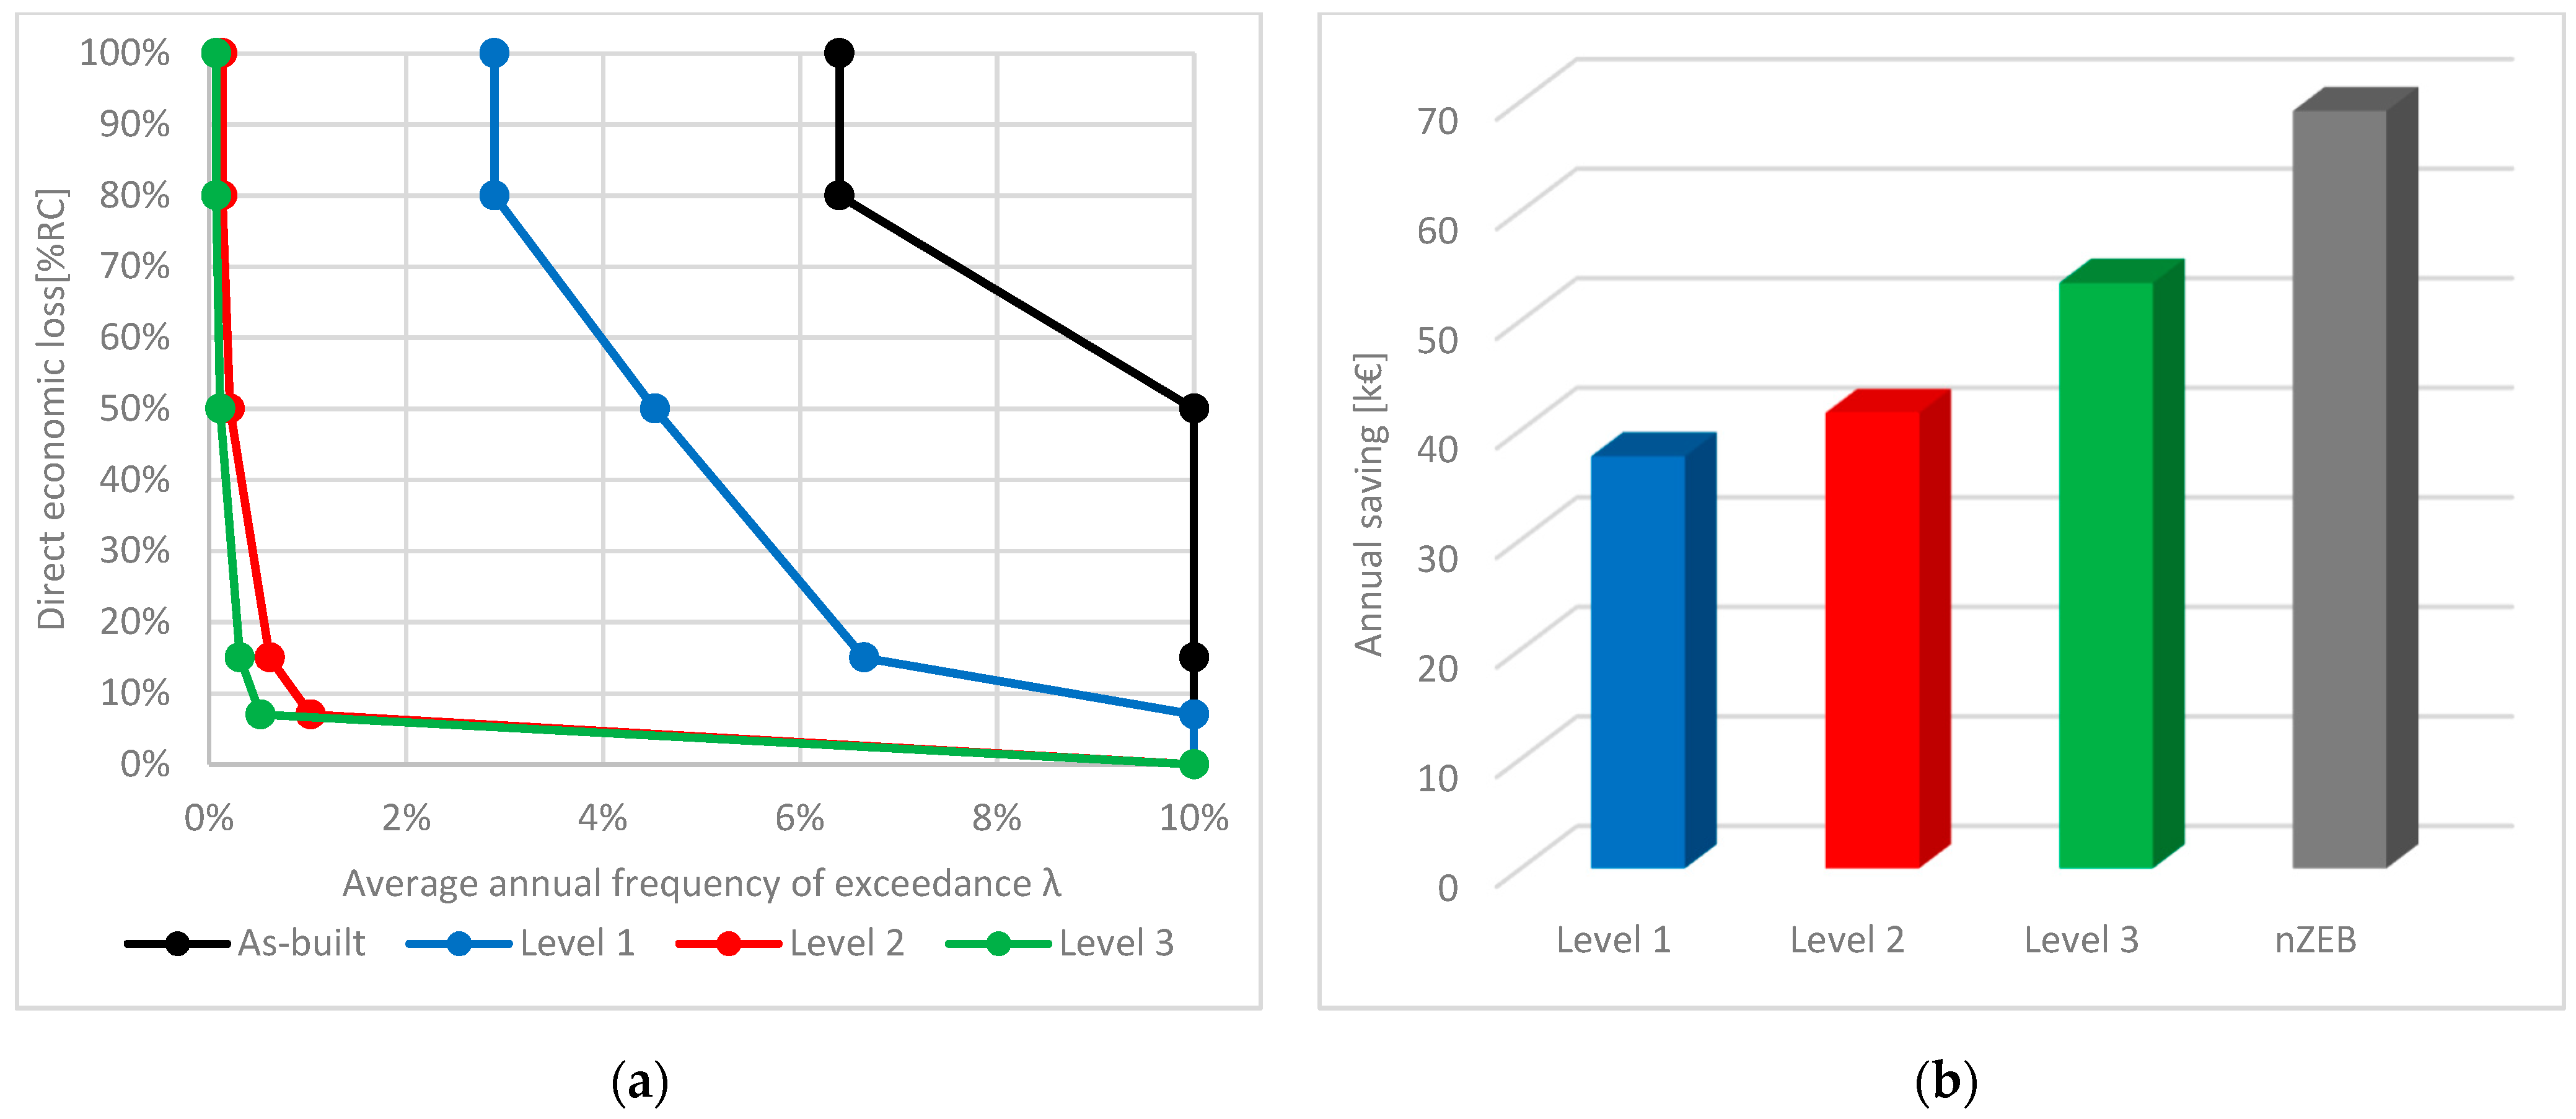
Figure 17a shows the EAL curves for all the retrofit strategies. It can be noted that the Level 2 and Level 3 drastically reduce the area under the curve.
Figure 17b shows the annual saving generated by the retrofit strategies. The annual saving generated by Level 1 and Level 2 is basically the same, while it increases for Level 3 (+25%) and for nZEB (+68%).
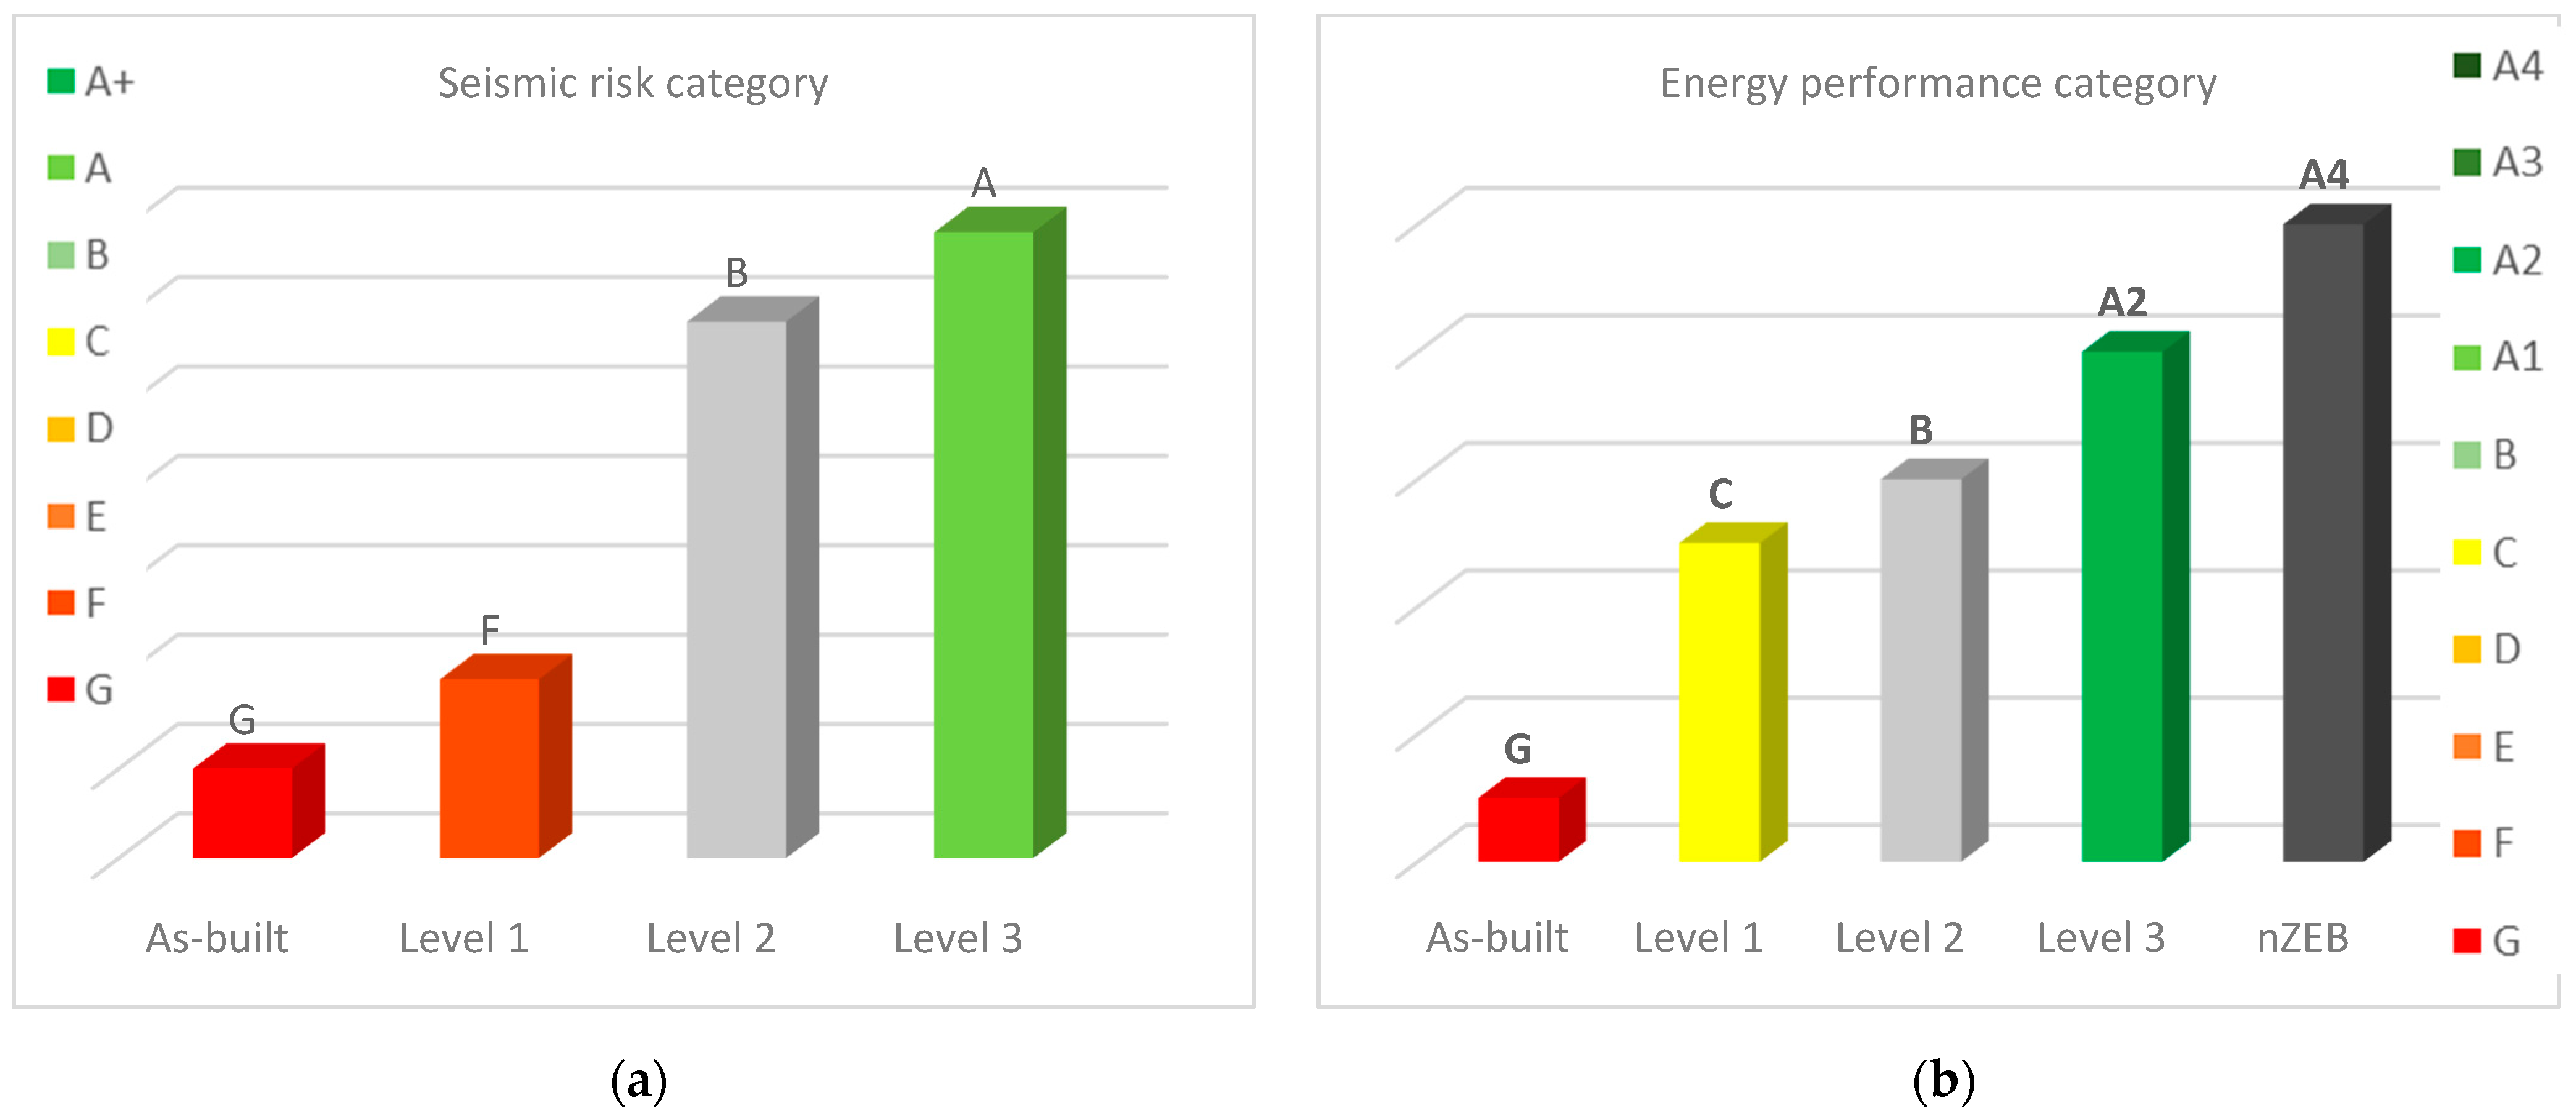
From a structural point of view, the Level 1 strategy allows to reach a seismic risk category F, i.e., the seismic behavior of the building improves by only one risk class (Figure 18a). The minimum value of ξ e , measured on the various wall alignments (considering that the floors are still not stiff in their plane, hence not able to exert an effective lateral load redistribution) is equal to 0.14. Thanks to the effect of the interventions on the floors, Level 2 strategy allows to reach a seismic risk category B. The corresponding value of ξ e is 0.74, i.e., the applied interventions can be defined, according to the Italian Building Code, as “seismic improvement interventions” ( ξ e > 0.6 ). This first outcome confirms that the key intervention for this building is to improve the floor stiffness given the high thickness of walls and the fairly good masonry quality that also characterize the building in its as-built conditions. Following this evidence, the seismic capacity of the building increases drastically when stiff diaphragms are introduced. Level 3 strategy allows to reach a seismic risk category A, with a value of ξ e equal to 0.97, comparable to the seismic performance of a “seismically upgraded” building ( ξ e > 0.8 ) .
From an energy point of view, the energy and economic savings are strictly related to the type of intervention, as shown in Figure 18b and Table 5. The envelope insulation has the highest impact compared to the baseline case (as-built) because of the wider area of interest (Level 1). However, it is also responsible for a small increase of the cooling energy demand when including roof and floor insulation (Level 2). Replacing radiators with low-temperature radiant systems that can be coupled with more efficient heat pumps and combining the envelope retrofit (Level 3), eventually integrating photovoltaic panels (leading to nZEB level), finally reduces the energy demand, and the economic saving increases inversely.

4.5. Cost-Benefit Analysis

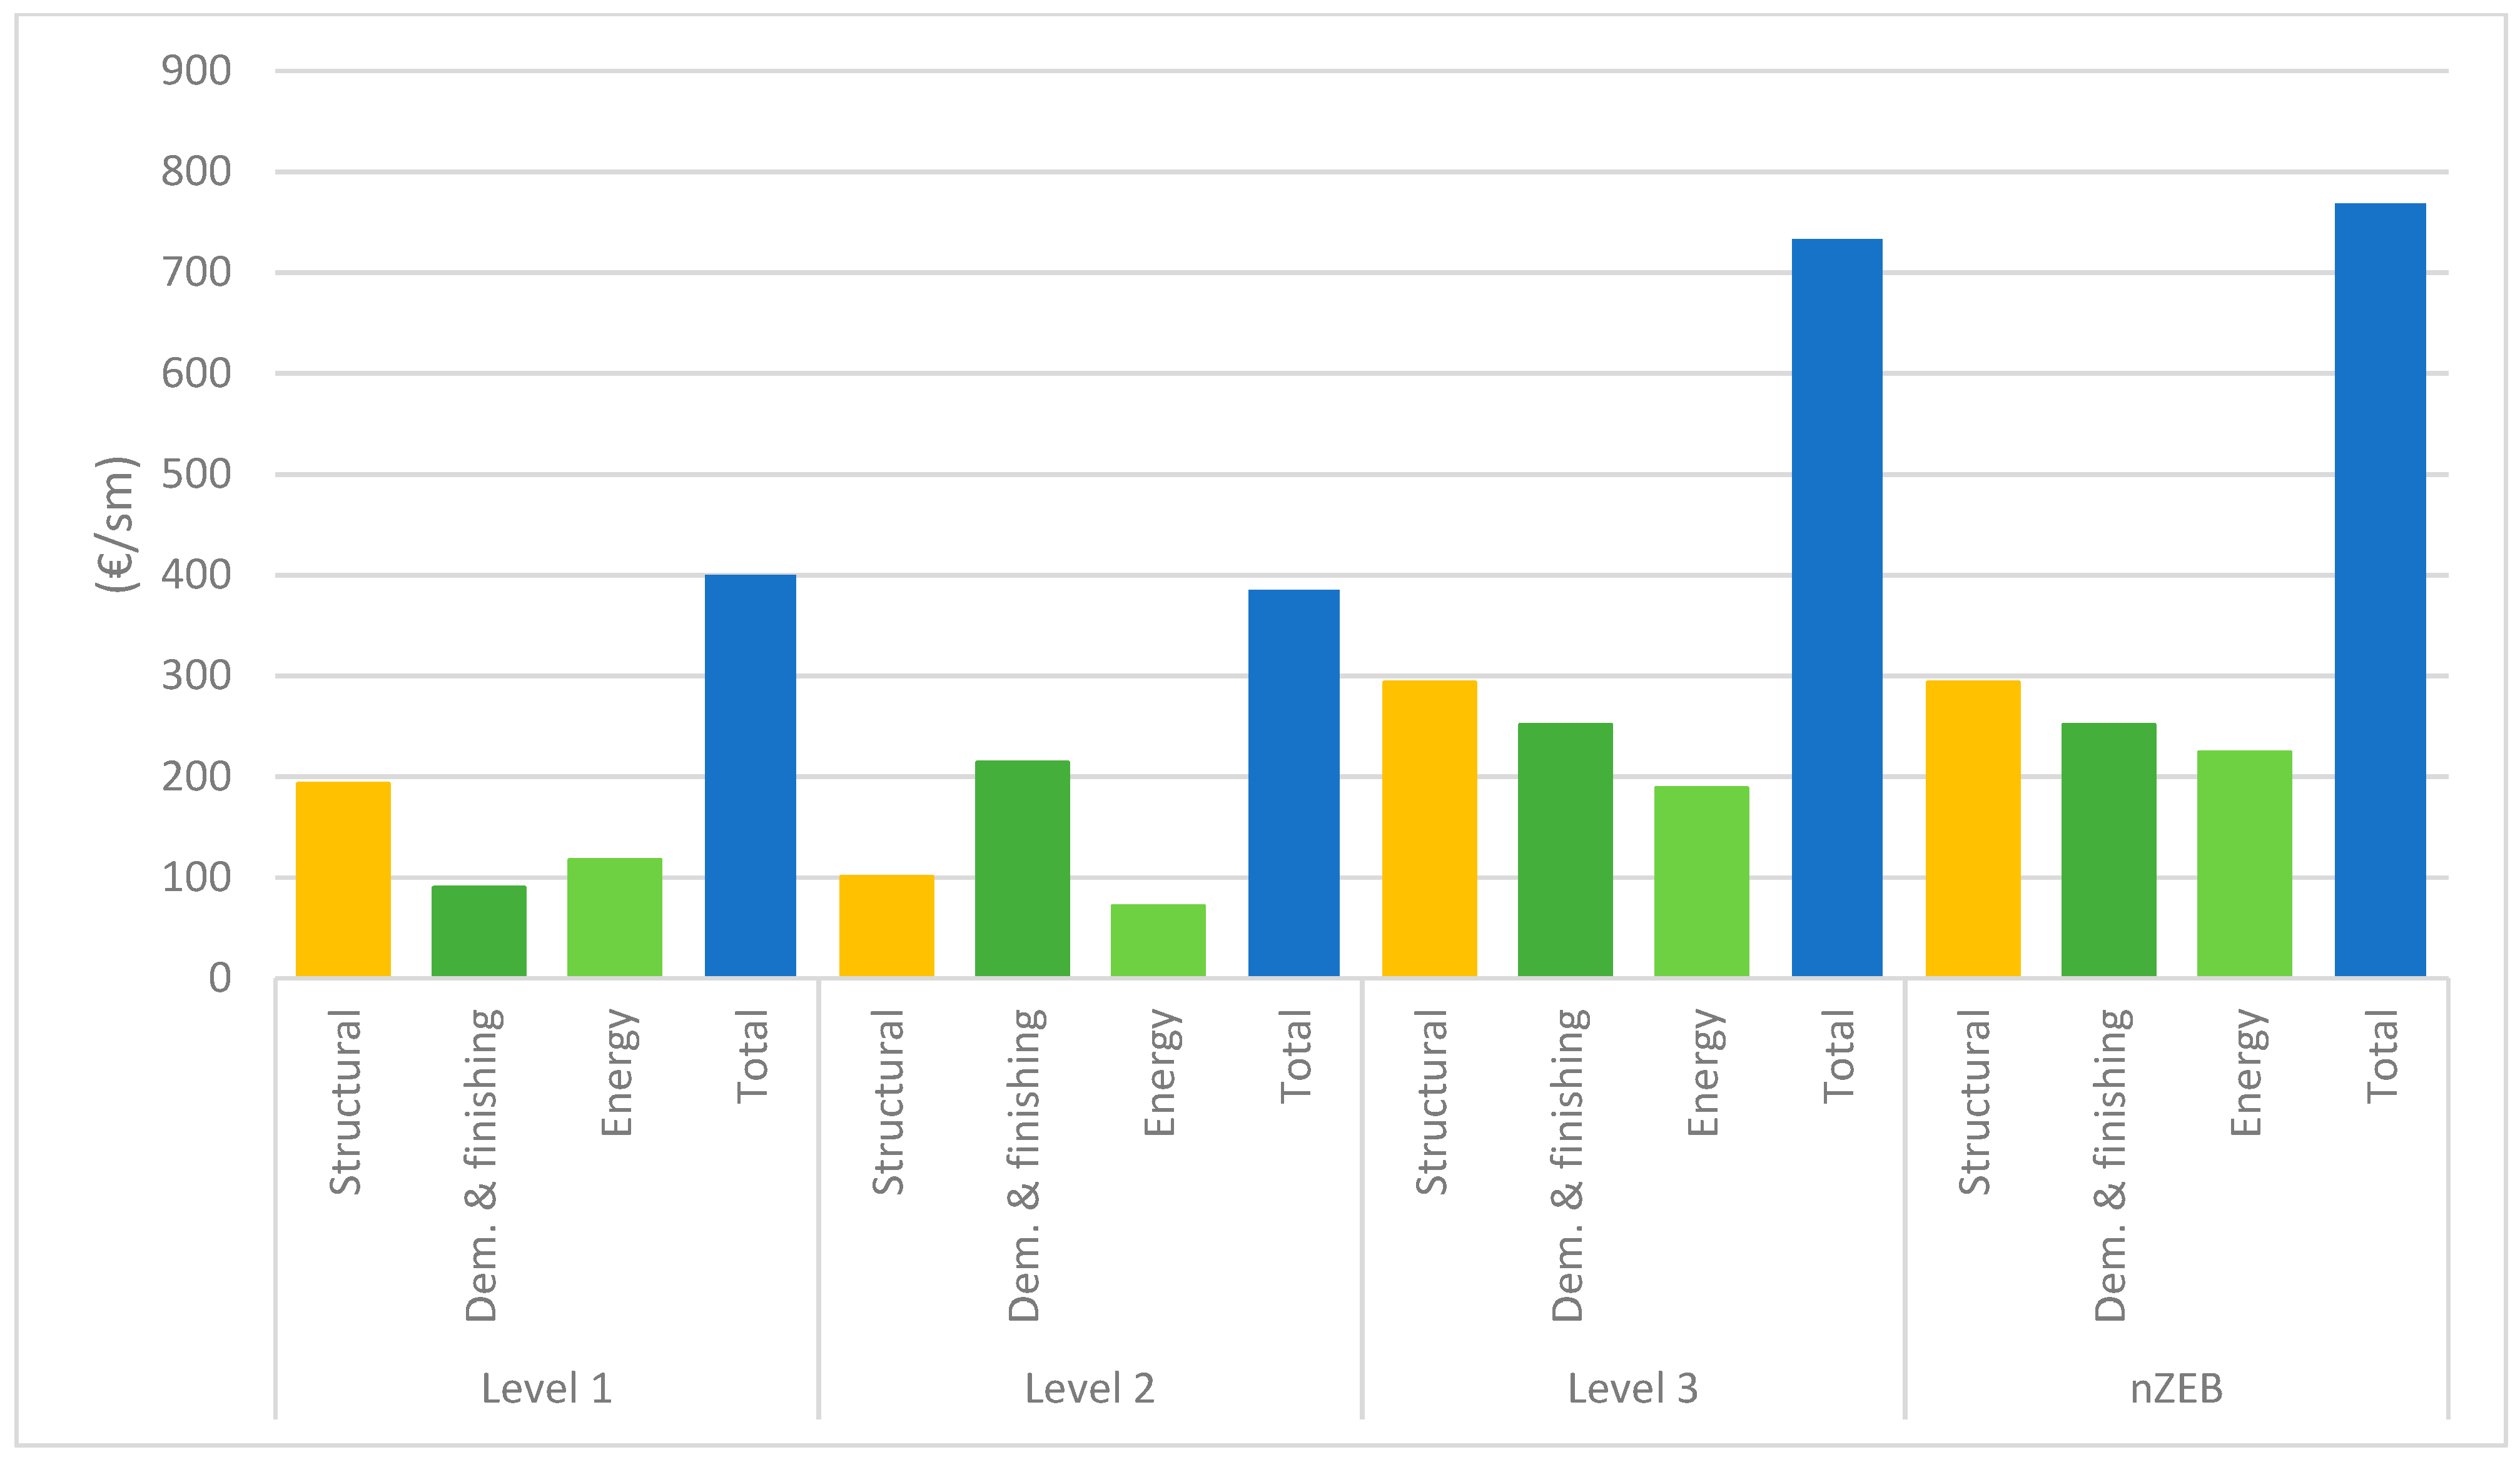
In order to perform a cost-benefit analysis, an evaluation of the costs of the retrofit strategies was developed by an expert working in the seismic and energy retrofit sector (based on the regional building price list for public works), splitting the cost voices in structural interventions, demolition and finishing, and energy interventions as explained in Figure 19. Structural and energy cost-benefit analyses were carried out separately due to the different nature of the parameters used for the analyses.

4.5.1. Structural Interventions

Since structural interventions do not produce a concrete cash-flow that can be compared to the costs incurred, economic evaluations about their effectiveness are not easy to be complete. It is possible to assess the cost effectiveness of a retrofit strategy using the expected annual loss (EAL). EAL is the percentage of the total economic value of the building that is lost each year. Any intervention that allows a decrease of EAL represents, substantially, an economic saving (Equation (1)).
Δ EAL   [ ] = ( EAL a s b u i l t EAL r e t r o f i t t e d ) × B u i l d i n g   v a l u e
The cost effectiveness of retrofit interventions can be evaluated by means of the payback period (PBP), which corresponds to the number of years after which the benefit generated by the interventions is equal to the costs incurred. If the PBP is lower than the remaining service life of the building, the retrofit intervention can be considered economically convenient. To identify the PBP, it is necessary to draw the net present value curve (NPV) of the retrofit interventions calculated with Equation (2); the PBP is the number of years necessary to obtain a value of the NPV equal to zero.
NPV = t = 1 T Δ EAL [ ] ( 1 + r ) t C  
where t is the time, r is the interest rate assumed equal to 1%, and C is the cost of the intervention, T is the residual life assumed equal to 50 years.
As shown in Figure 20 and presented more in detail in Table 6, all the proposed retrofit strategies are economically viable considering the low PBP compared to the life span of the building and the related reduction of seismic risk. This result is highly influenced by the high seismic hazard of the zone and by the high seismic vulnerability of the as-built condition. This is particularly significant considering that, for public buildings, the Italian legislation does not consider regular incentives in case of seismic retrofitting, but the possibility of acquiring public funds depends on the participation to tender. In this case, the benefit of carrying out the works is quite evident, although this effect might be slightly overestimated due to the conservative assumptions that are generally implied in seismic assessment of existing buildings.

4.5.2. Energy Interventions

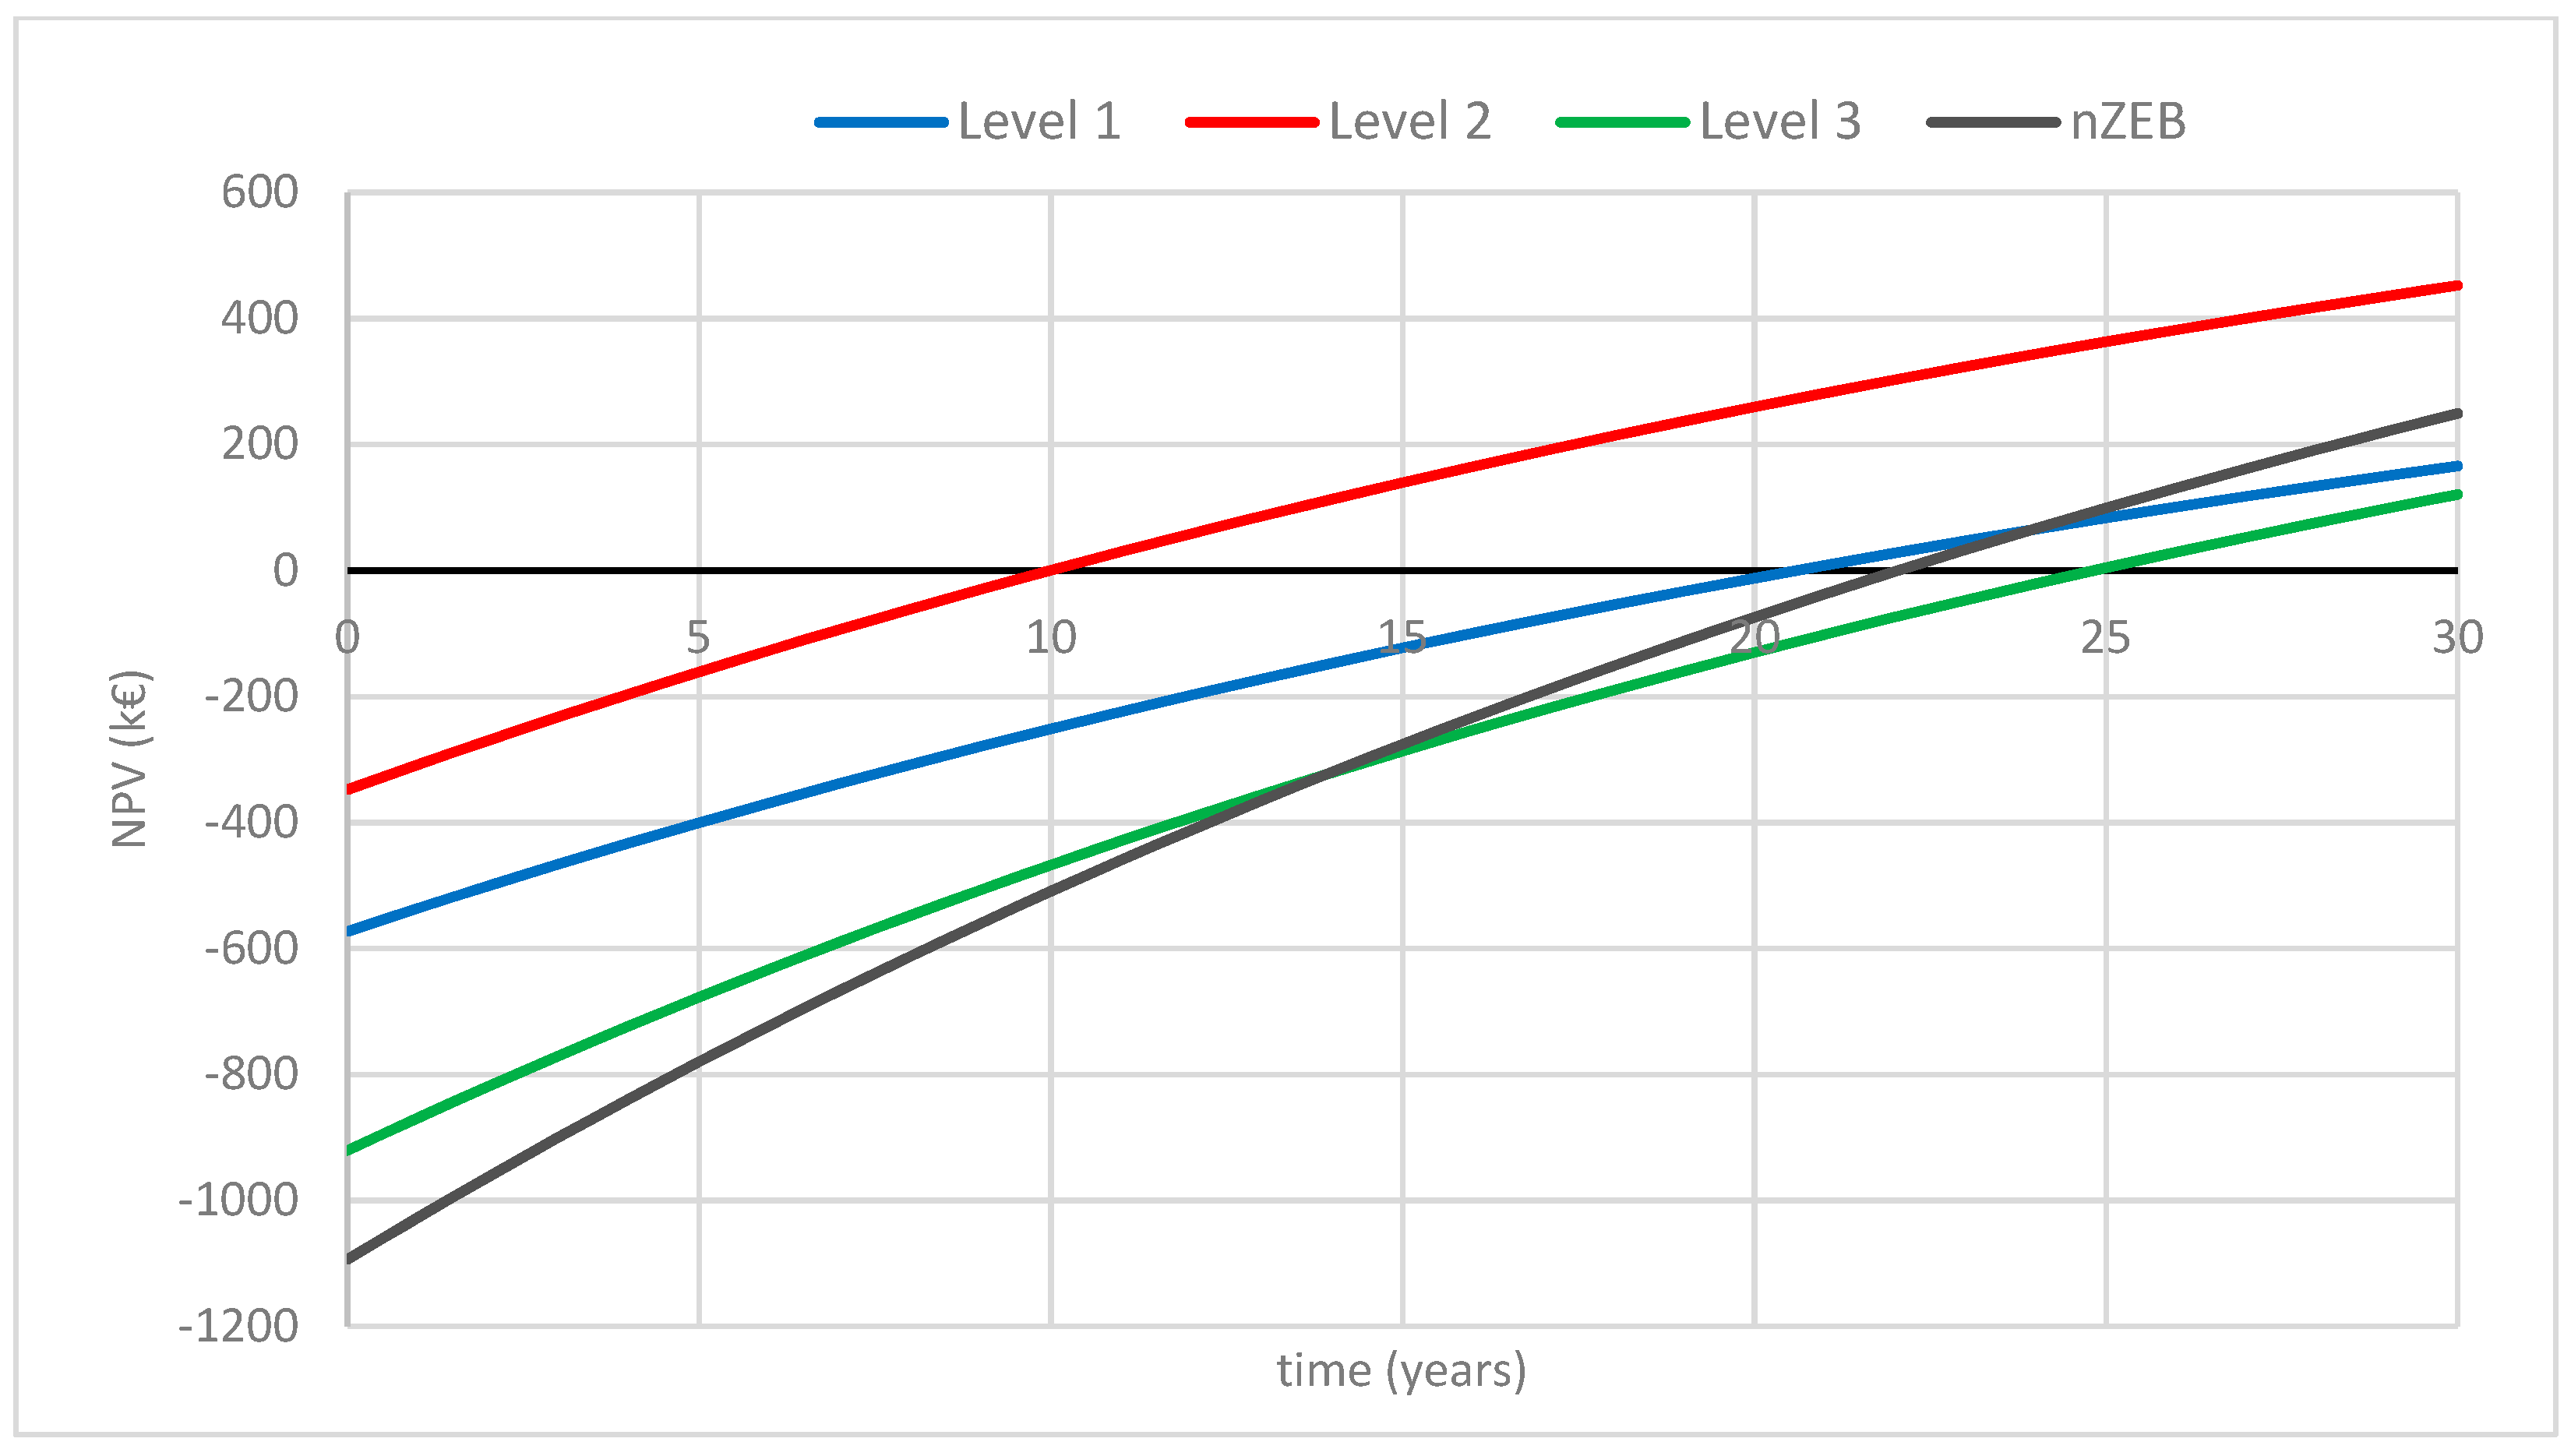
To estimate the economic advantages that would result from the reduced energy usage of the building, the energy costs were estimated considering average national prices, in particular 0.11 €/kWh for the gas supply and 0.22 €/kWh for the electric energy. The excess energy from the PV system is sold to the grid because it is not self-used or stock in a storage and thus can provide an economic gain of 0.06 €/kWh, according to the national guidelines. To assess the cost effectiveness of energy retrofitting, EAL is defined as the total cost incurred for energy consumption. In this case, ΔEAL represents the annual savings generated by the retrofitting. The cost effectiveness can be evaluated using the payback period and the net present value, with an interest rate of 3% (a), the initial investment cost (I0), and the life span (n). As in the case of structural interventions, it is possible to evaluate the economic viability of the energy efficiency interventions using the Net Present Value (NPV) as shown in Equation (3), considering the actual cash flow generated by the energy savings (R) and considering the year in which the NPV is zeroed as the payback time (PBT).
NPV = I 0 + R j = 1 n 1 ( 1 + a ) j
As shown in Figure 21 and more in detail in Table 7, the payback periods of Level 1, Level 3, and nZEB stand on 20–25 years, while the payback period of Level 2 is about 10 years.
For public buildings, Italian legislation provides for incentives in case of energy retrofitting [81] to support the energy-use reduction. In particular, interventions to increase energy efficiency in existing buildings and interventions for small-scale production of renewable sources are eligible for incentives. For the case study, the interventions of the different retrofit levels eligible for incentives are:
  • Wall insulation,
  • Floor insulation,
  • Upgrading of fenestration,
  • Substitution of the boiler with a heat pump, and
  • Transformation of the building into nZEB.
The calculation method for the incentives is the same for every case:
I t o t = % c o s t × C × S i n t
where I t o t is the total of the incentive, % c o s t is the percentage of the costs incurred, C is the cost incurred, and S i n t is the surface involved by interventions. The total value of the incentive depends on the percentage of the costs incurred, which is different for every kind of interventions and for the different climatic zones. For example, the insulation of walls provides a value of the percentage of the costs incurred eligible for incentives equal to 50–55%, whereas the transformation of the building into nZEB provides a value of the percentage eligible for incentives of 65%.
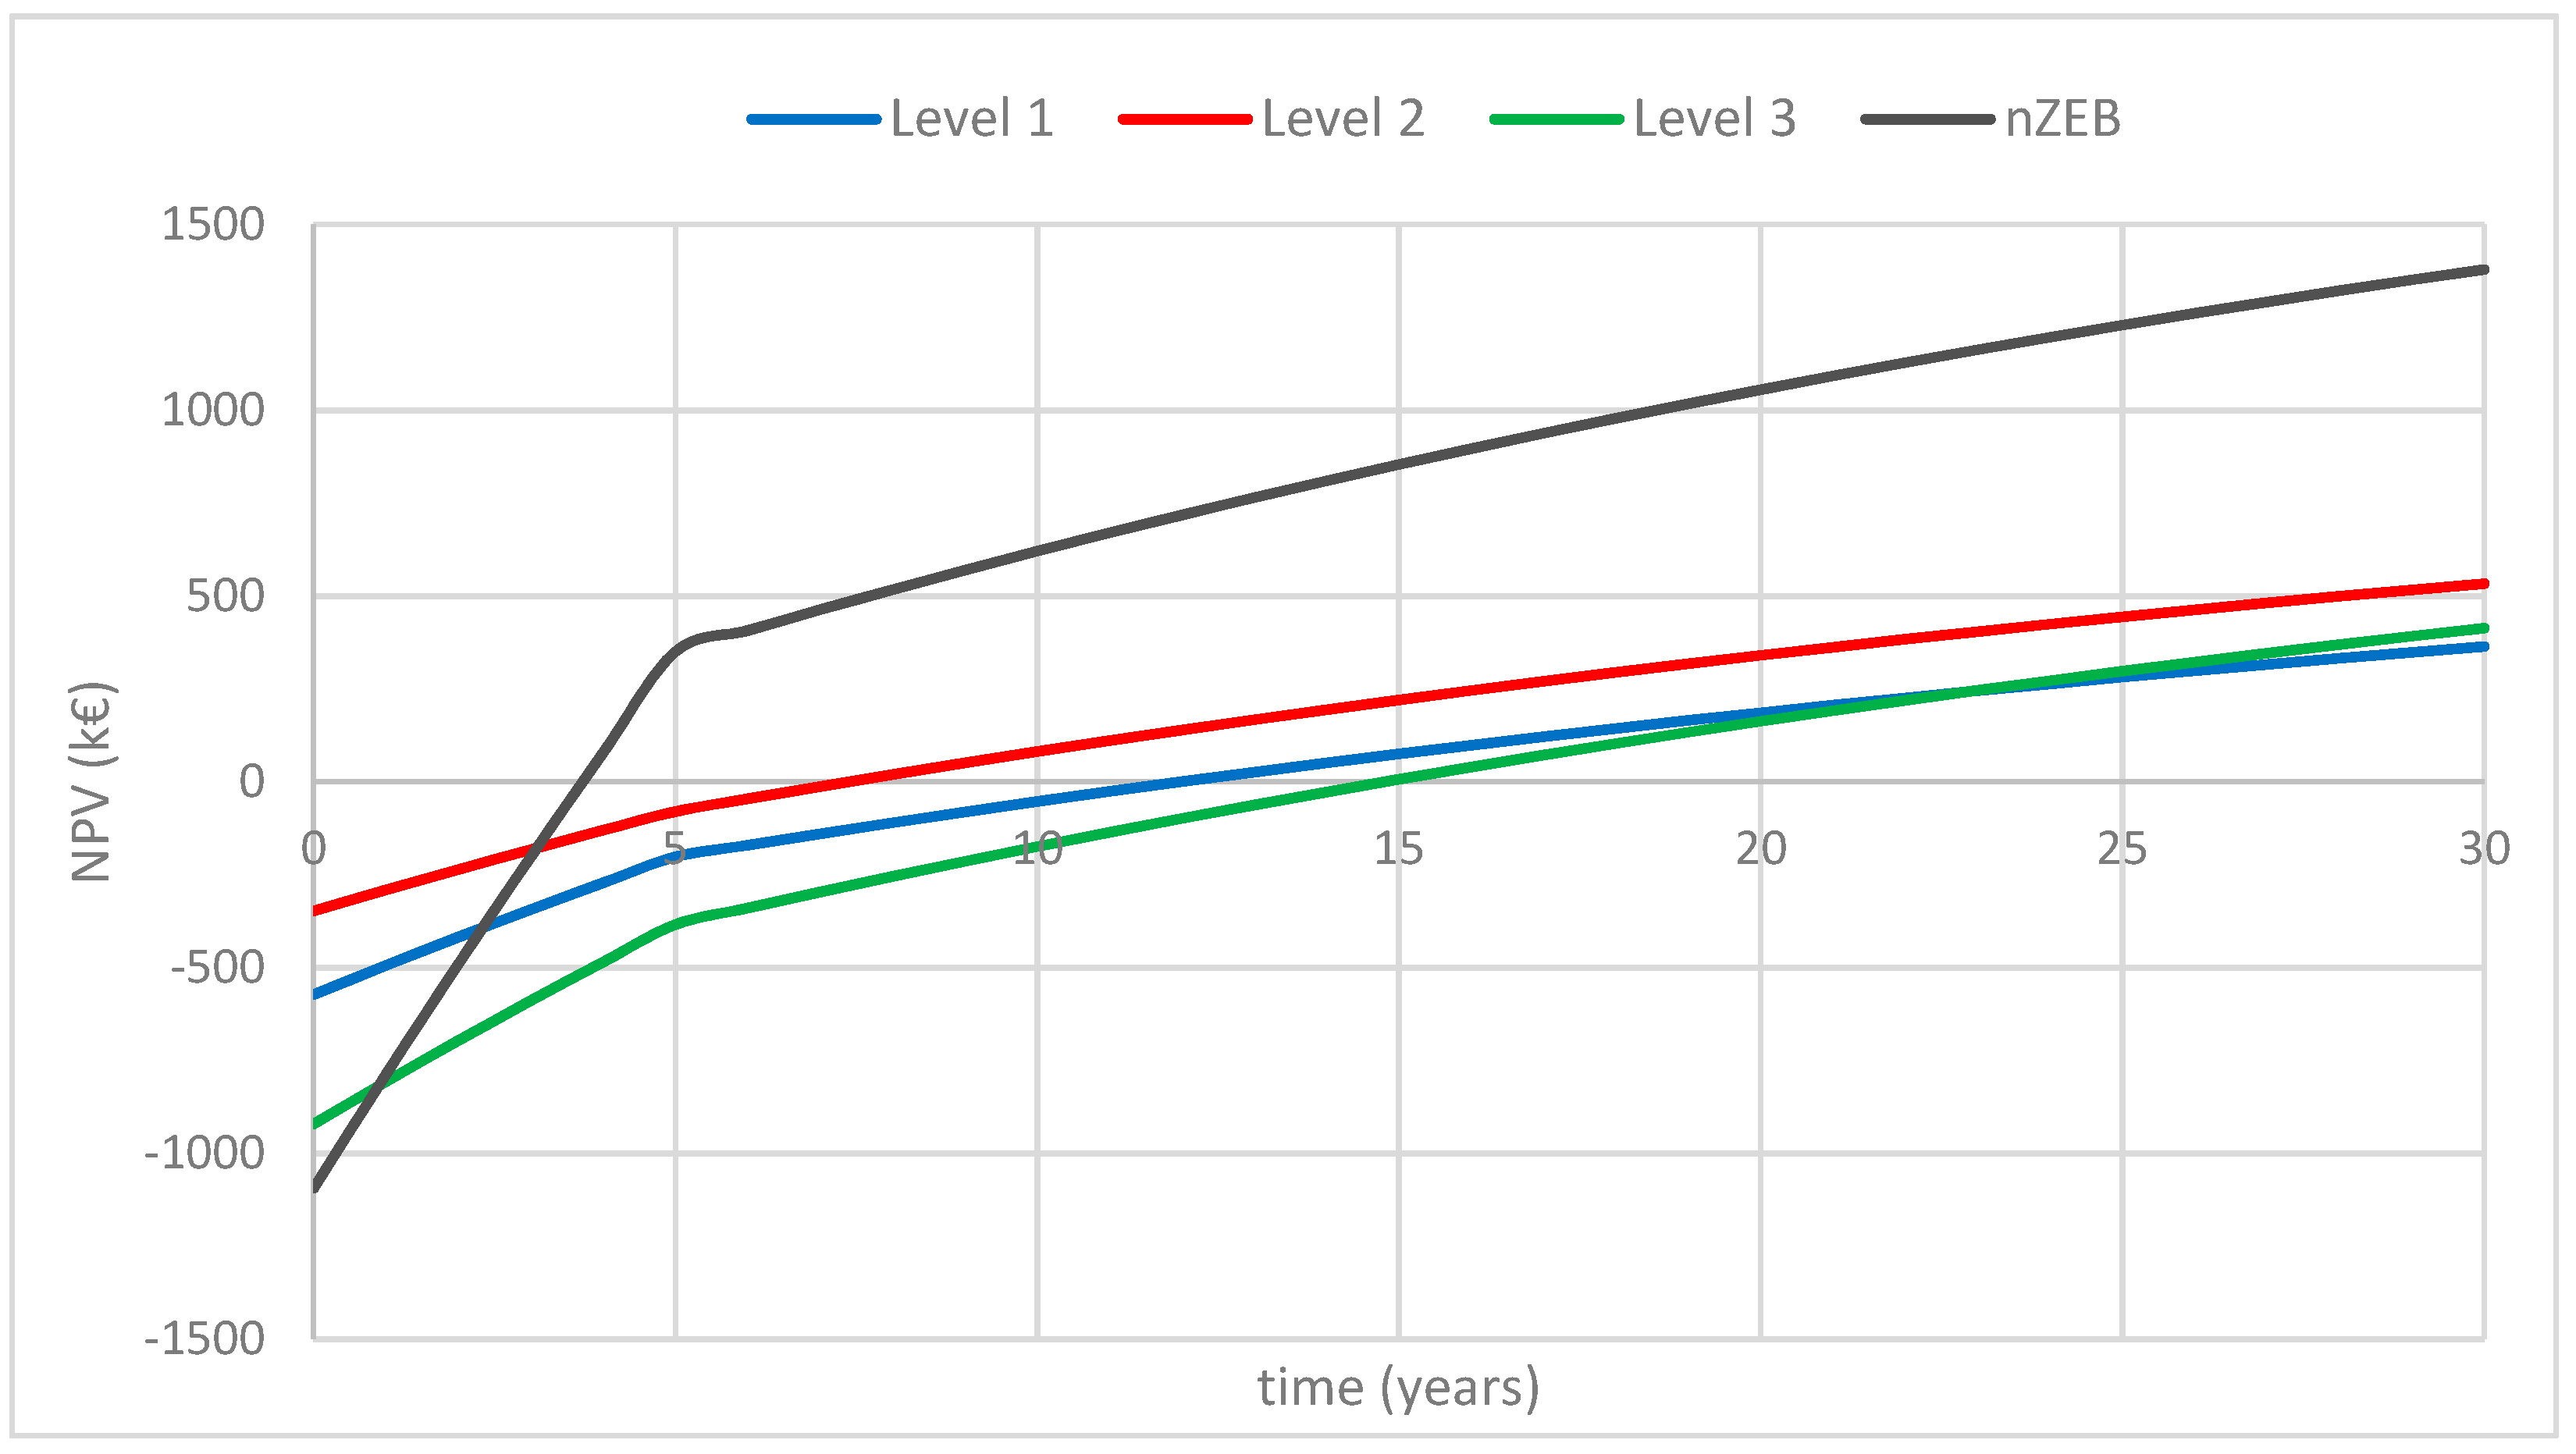
Considering the values calculated for the incentives (Table 8), it is possible to update the cash-flow curves previously shown, taking into account that incentives are usually granted in five annual instalments, shown in Figure 22.
It is possible to notice that all the strategies are economically viable, with payback periods ranging from four years of nZEB strategy up to 15 years of Level 3 strategy. The different payback periods are related to the balance between energy savings and investment costs. The highest energy savings obtained by the nZEB strategies better balances the initial costs, obtaining the lowest and more attractive PBP for investors. Many energy refurbishment strategies also require deep actions on the structural elements, particularly in the case of interventions on floors and roofs. Since the incentive policy includes demolition and finishing works in the eligible costs, the nZEB strategy is the most effective both in terms of energy savings and in terms of investments, combining energy interventions with seismic ones and reducing the overall costs.

4.6. Time for Execution and Disruption Time

A complete evaluation of the cost-effectiveness of retrofit interventions cannot disregard the assessment of the time for execution and the disruption time, which could increase the real costs due to residents’ relocation or business downtime. For every retrofit strategy, the time for execution was evaluated considering the use of a “working team”, composed of two skilled workers (with different levels of specialization) and one unskilled worker and is presented in Table 9.
All of the presented strategies are based on deep retrofit; for this reason, execution is quite time consuming. Level 2 seems to be the most cost-effective strategy taking into account also the relatively shorter execution times; in any case, it implies a disruption time, in the average condition, of 8.5 months. Intervening on floors implicates high invasiveness, but it is possible to make some considerations:
  • The retrofit interventions planned for the floors of ground and first level involve numerous activities of demolition and finishing, thus Table 10 shows that those activities represent about 75% of the total time needed. A viable alternative to the intervention proposed in this study (that is also similar to the one that was actually carried out after 1997), could be the implementation of a steel bracing system welded on the intrados of the steel beams. In this way, the demolition and finishing activities would be drastically reduced. However, in this case, the simultaneous implementation of most of the Level 2 energy retrofit would not be possible, losing the integration between structural and energy enhancement.
  • The retrofit interventions planned for the second floor (complete substitution of the pre-existing floor) represent about 40% of the total execution time. A more detailed knowledge of the original conditions (that was not possible in the present study due to the fact that the slab substitution had already been carried out after 1997) may have led to a more conservative and less invasive/more rapid intervention, although this is very often awkward for the typical hollow bricks and concrete floor without the R.C. slabs of the middle 20th Century.
  • The attic floor is not accessible. For this reason, the planned retrofit intervention may be carried out with the remaining part of the structure already in use, reducing the overall business downtime of the Level 2 strategy of about 25%.

5. Parametric Analyses Varying Seismic Hazard and Climatic Conditions

5.1. Variation of Seismic Hazard

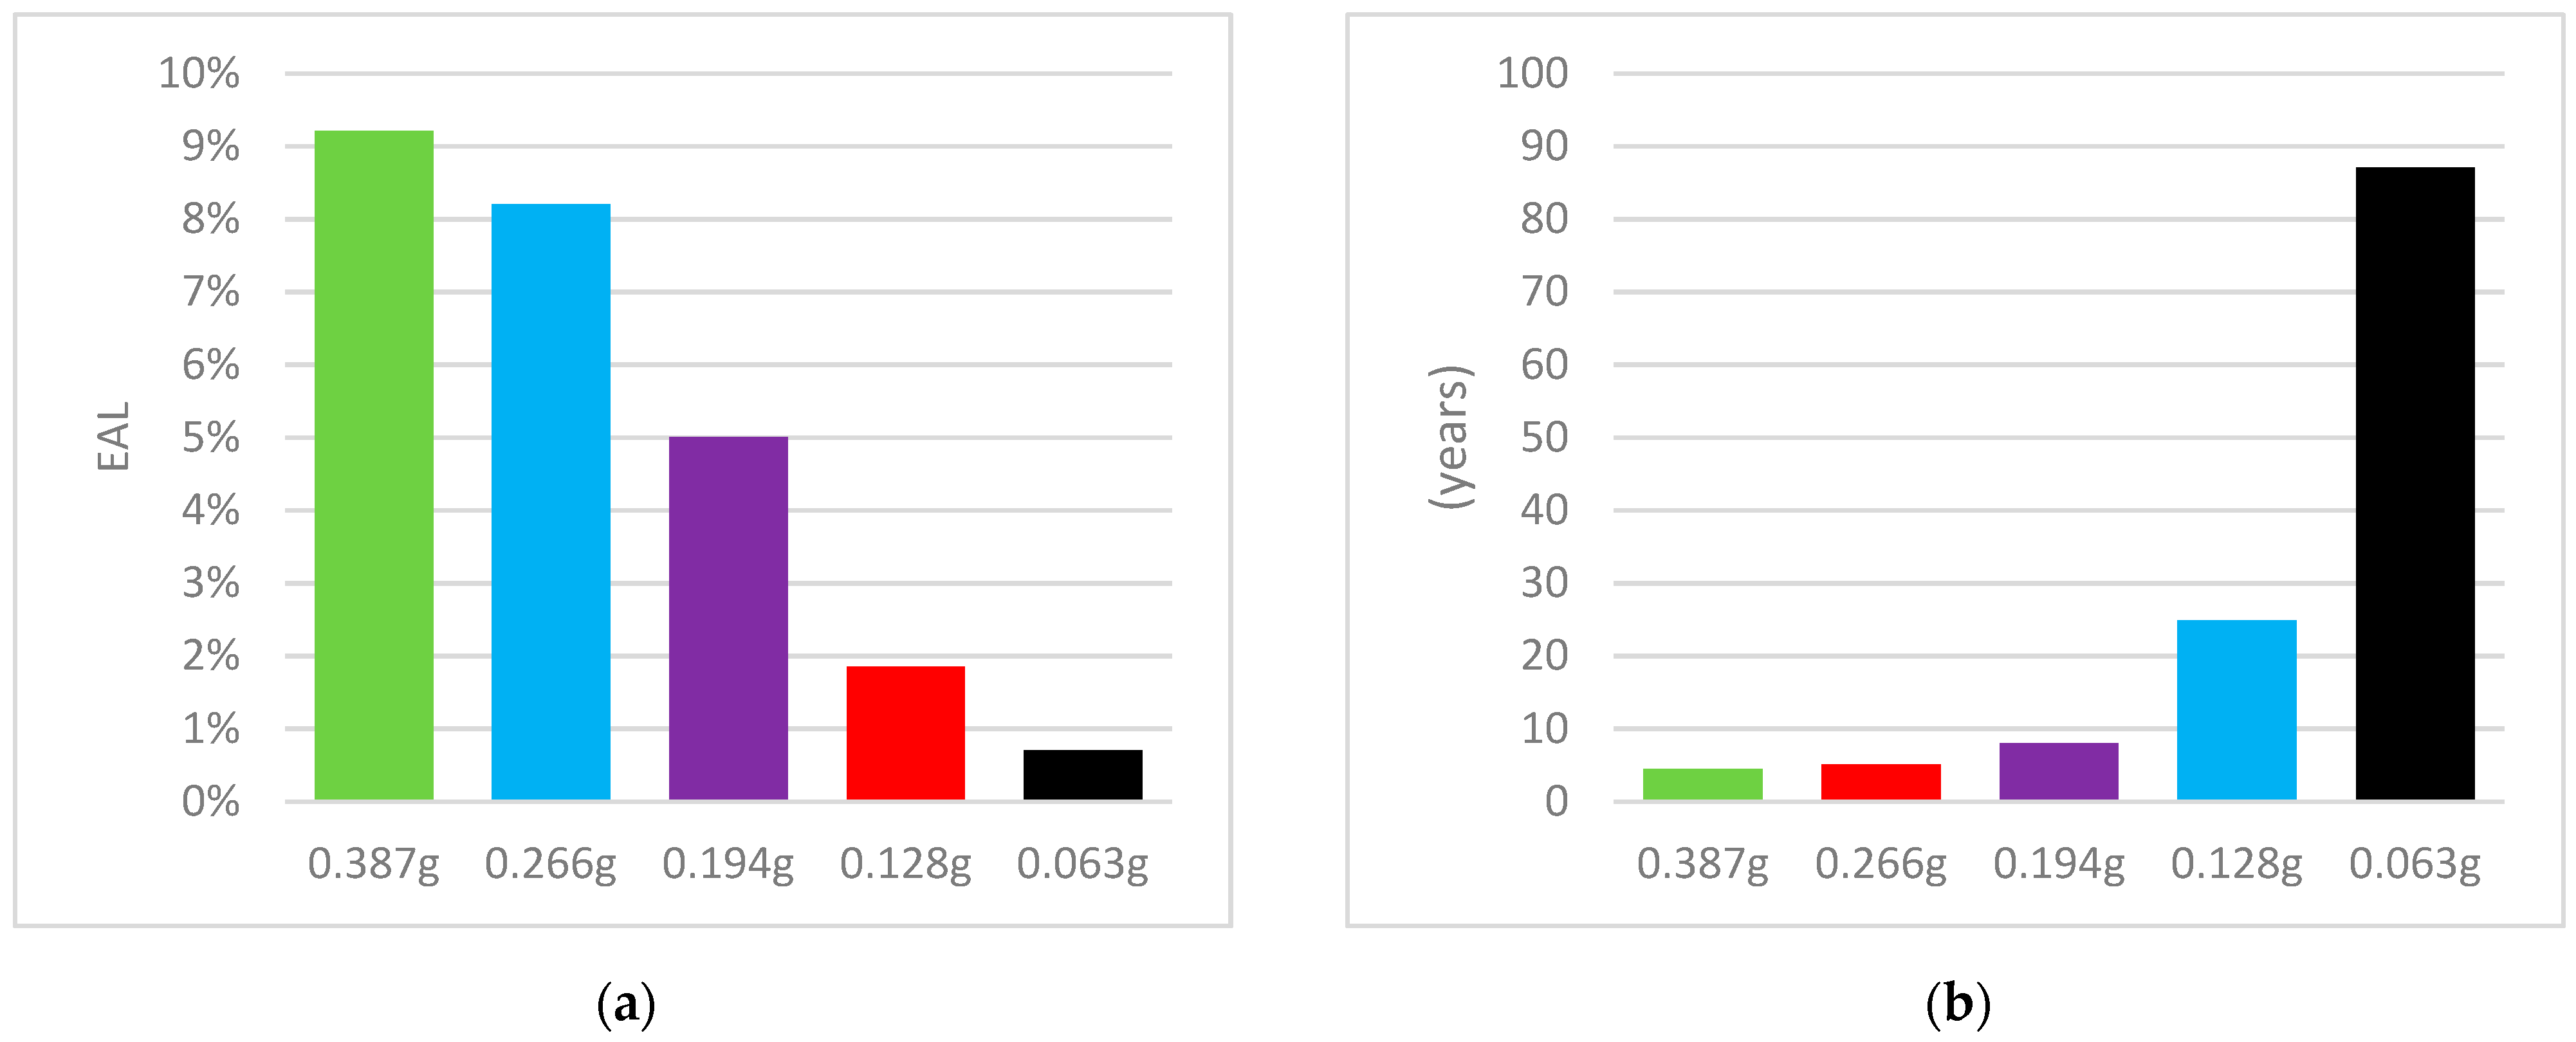
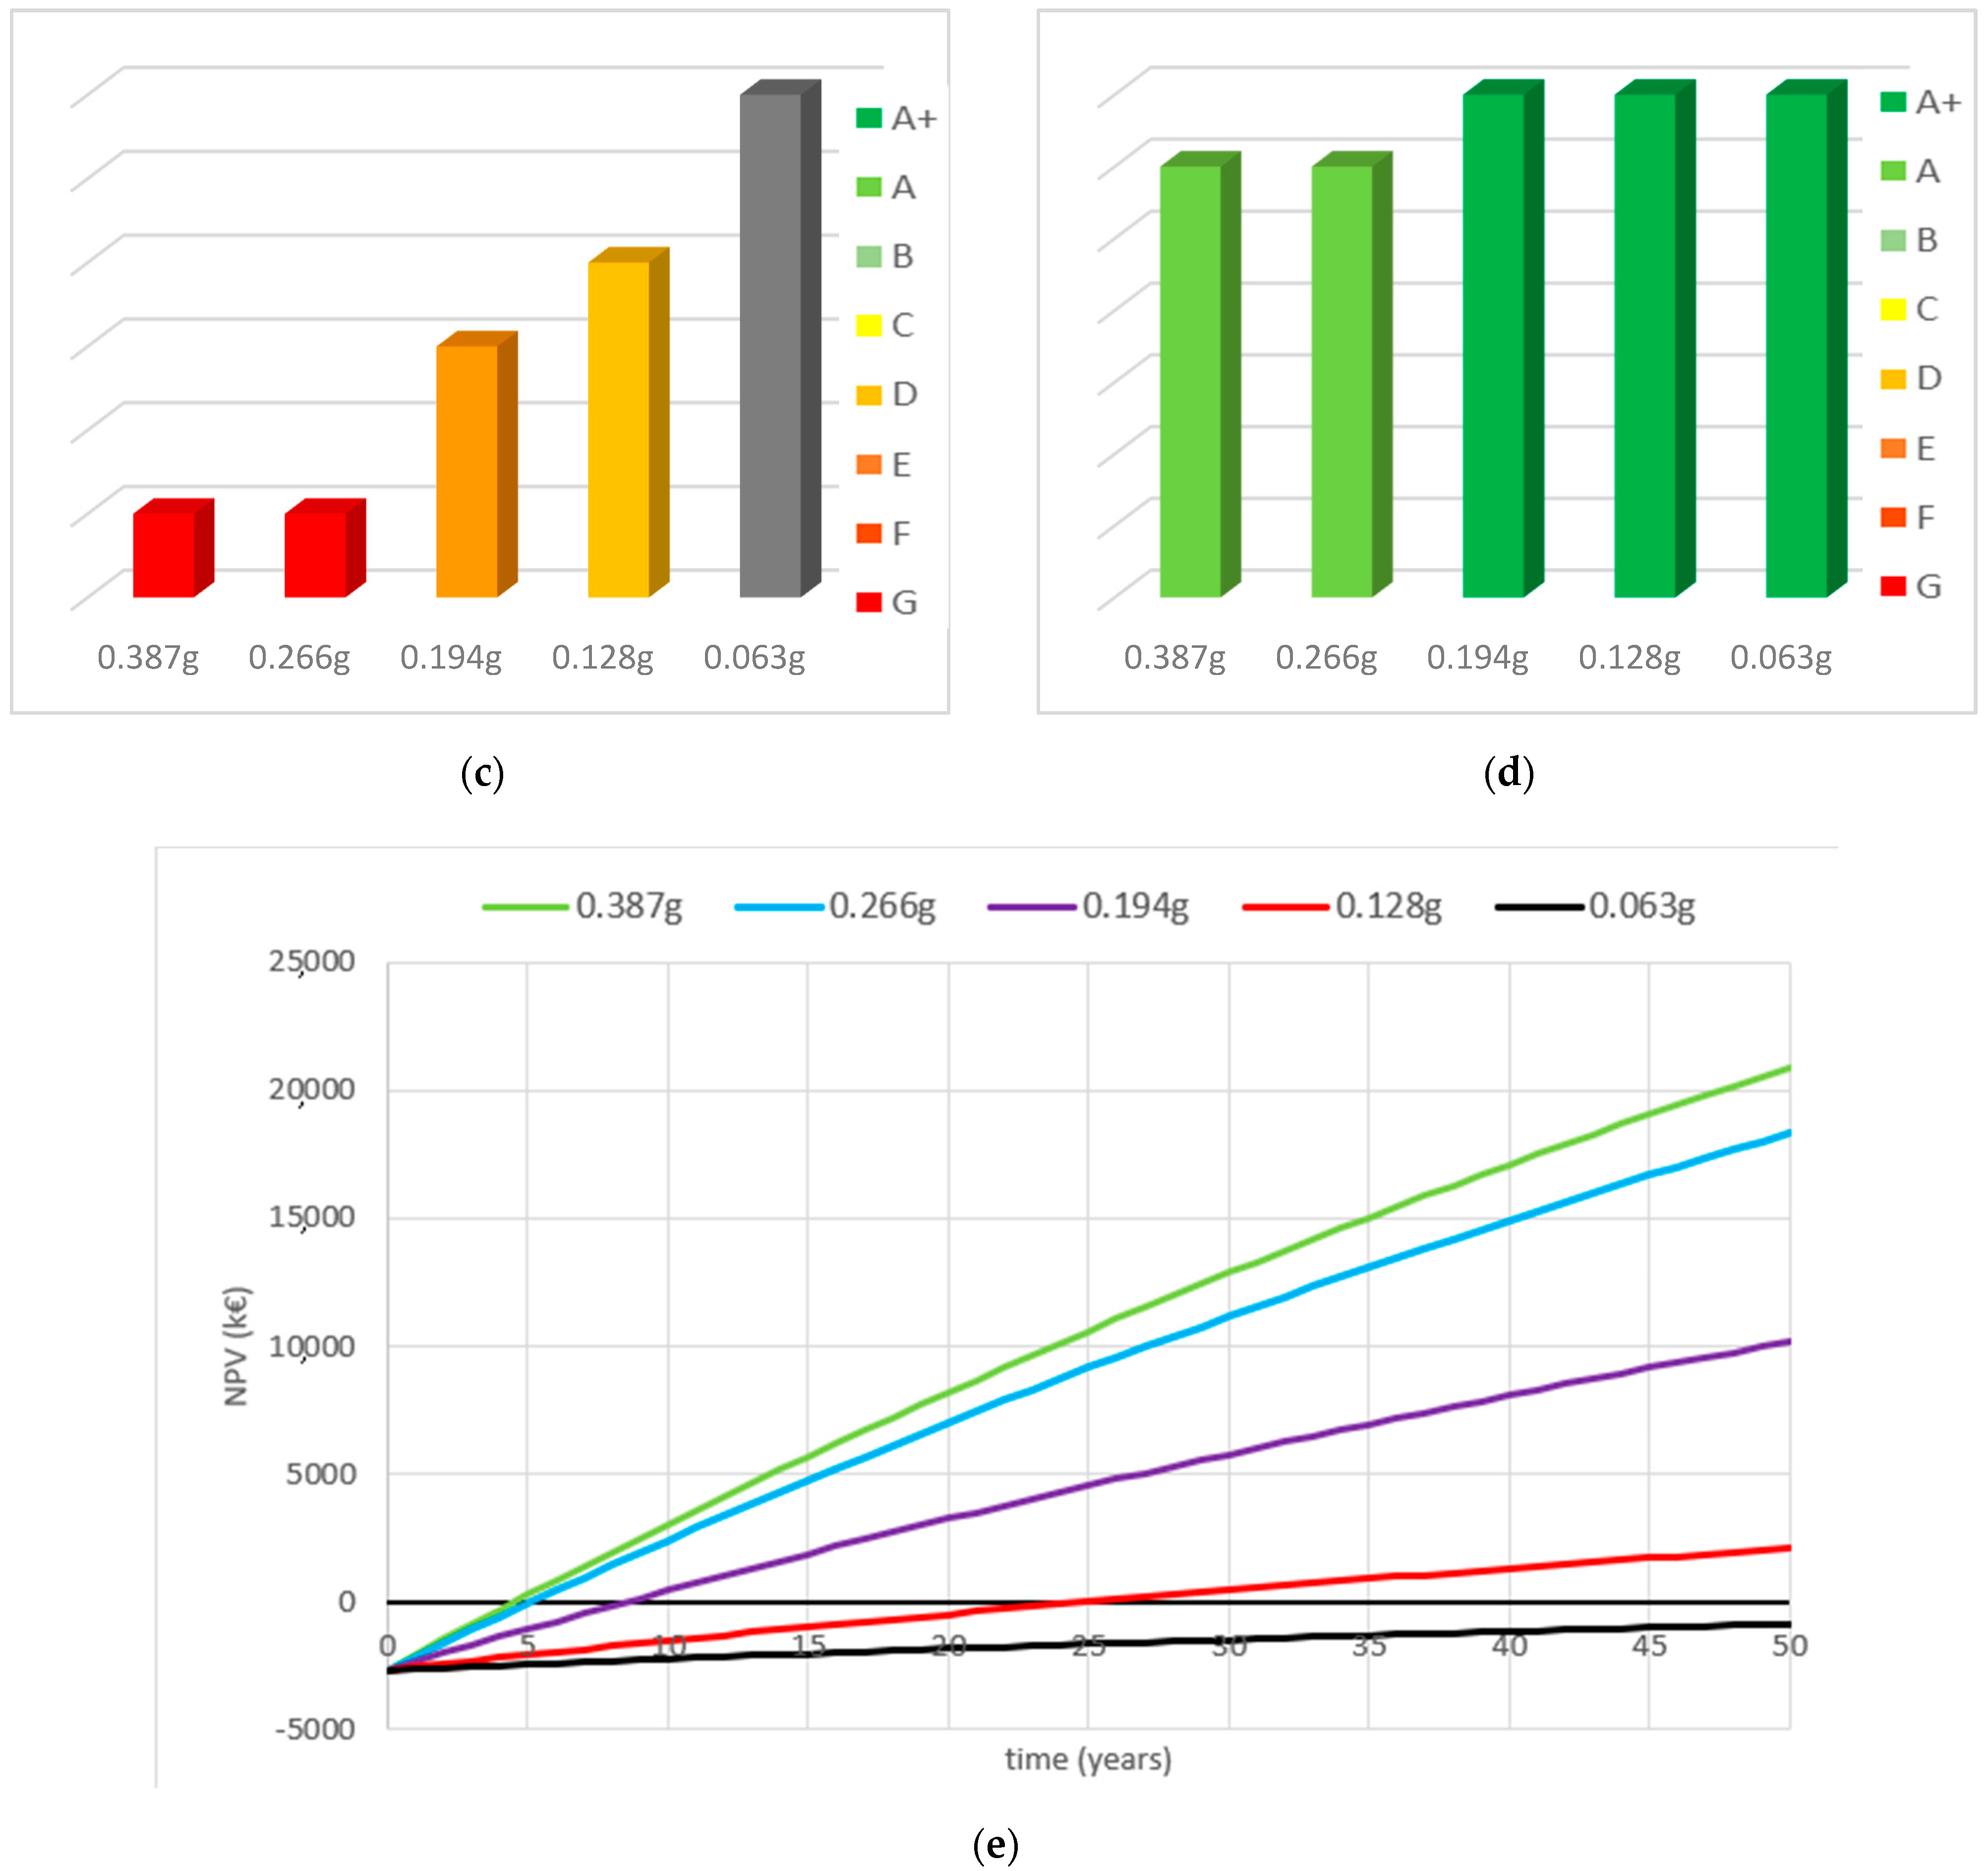
All the implemented strategies are cost-efficient, presenting high values of ΔEAL (%) and low values of payback period (from three to seven years). According to the economic analyses, therefore, all the strategies seem to be viable retrofit options. However, the structural analysis and seismic risk categories of the strategies show that Level 1 strategy gives a poor seismic improvement, and for this reason, it may not be considered a viable option in terms of structural safety.
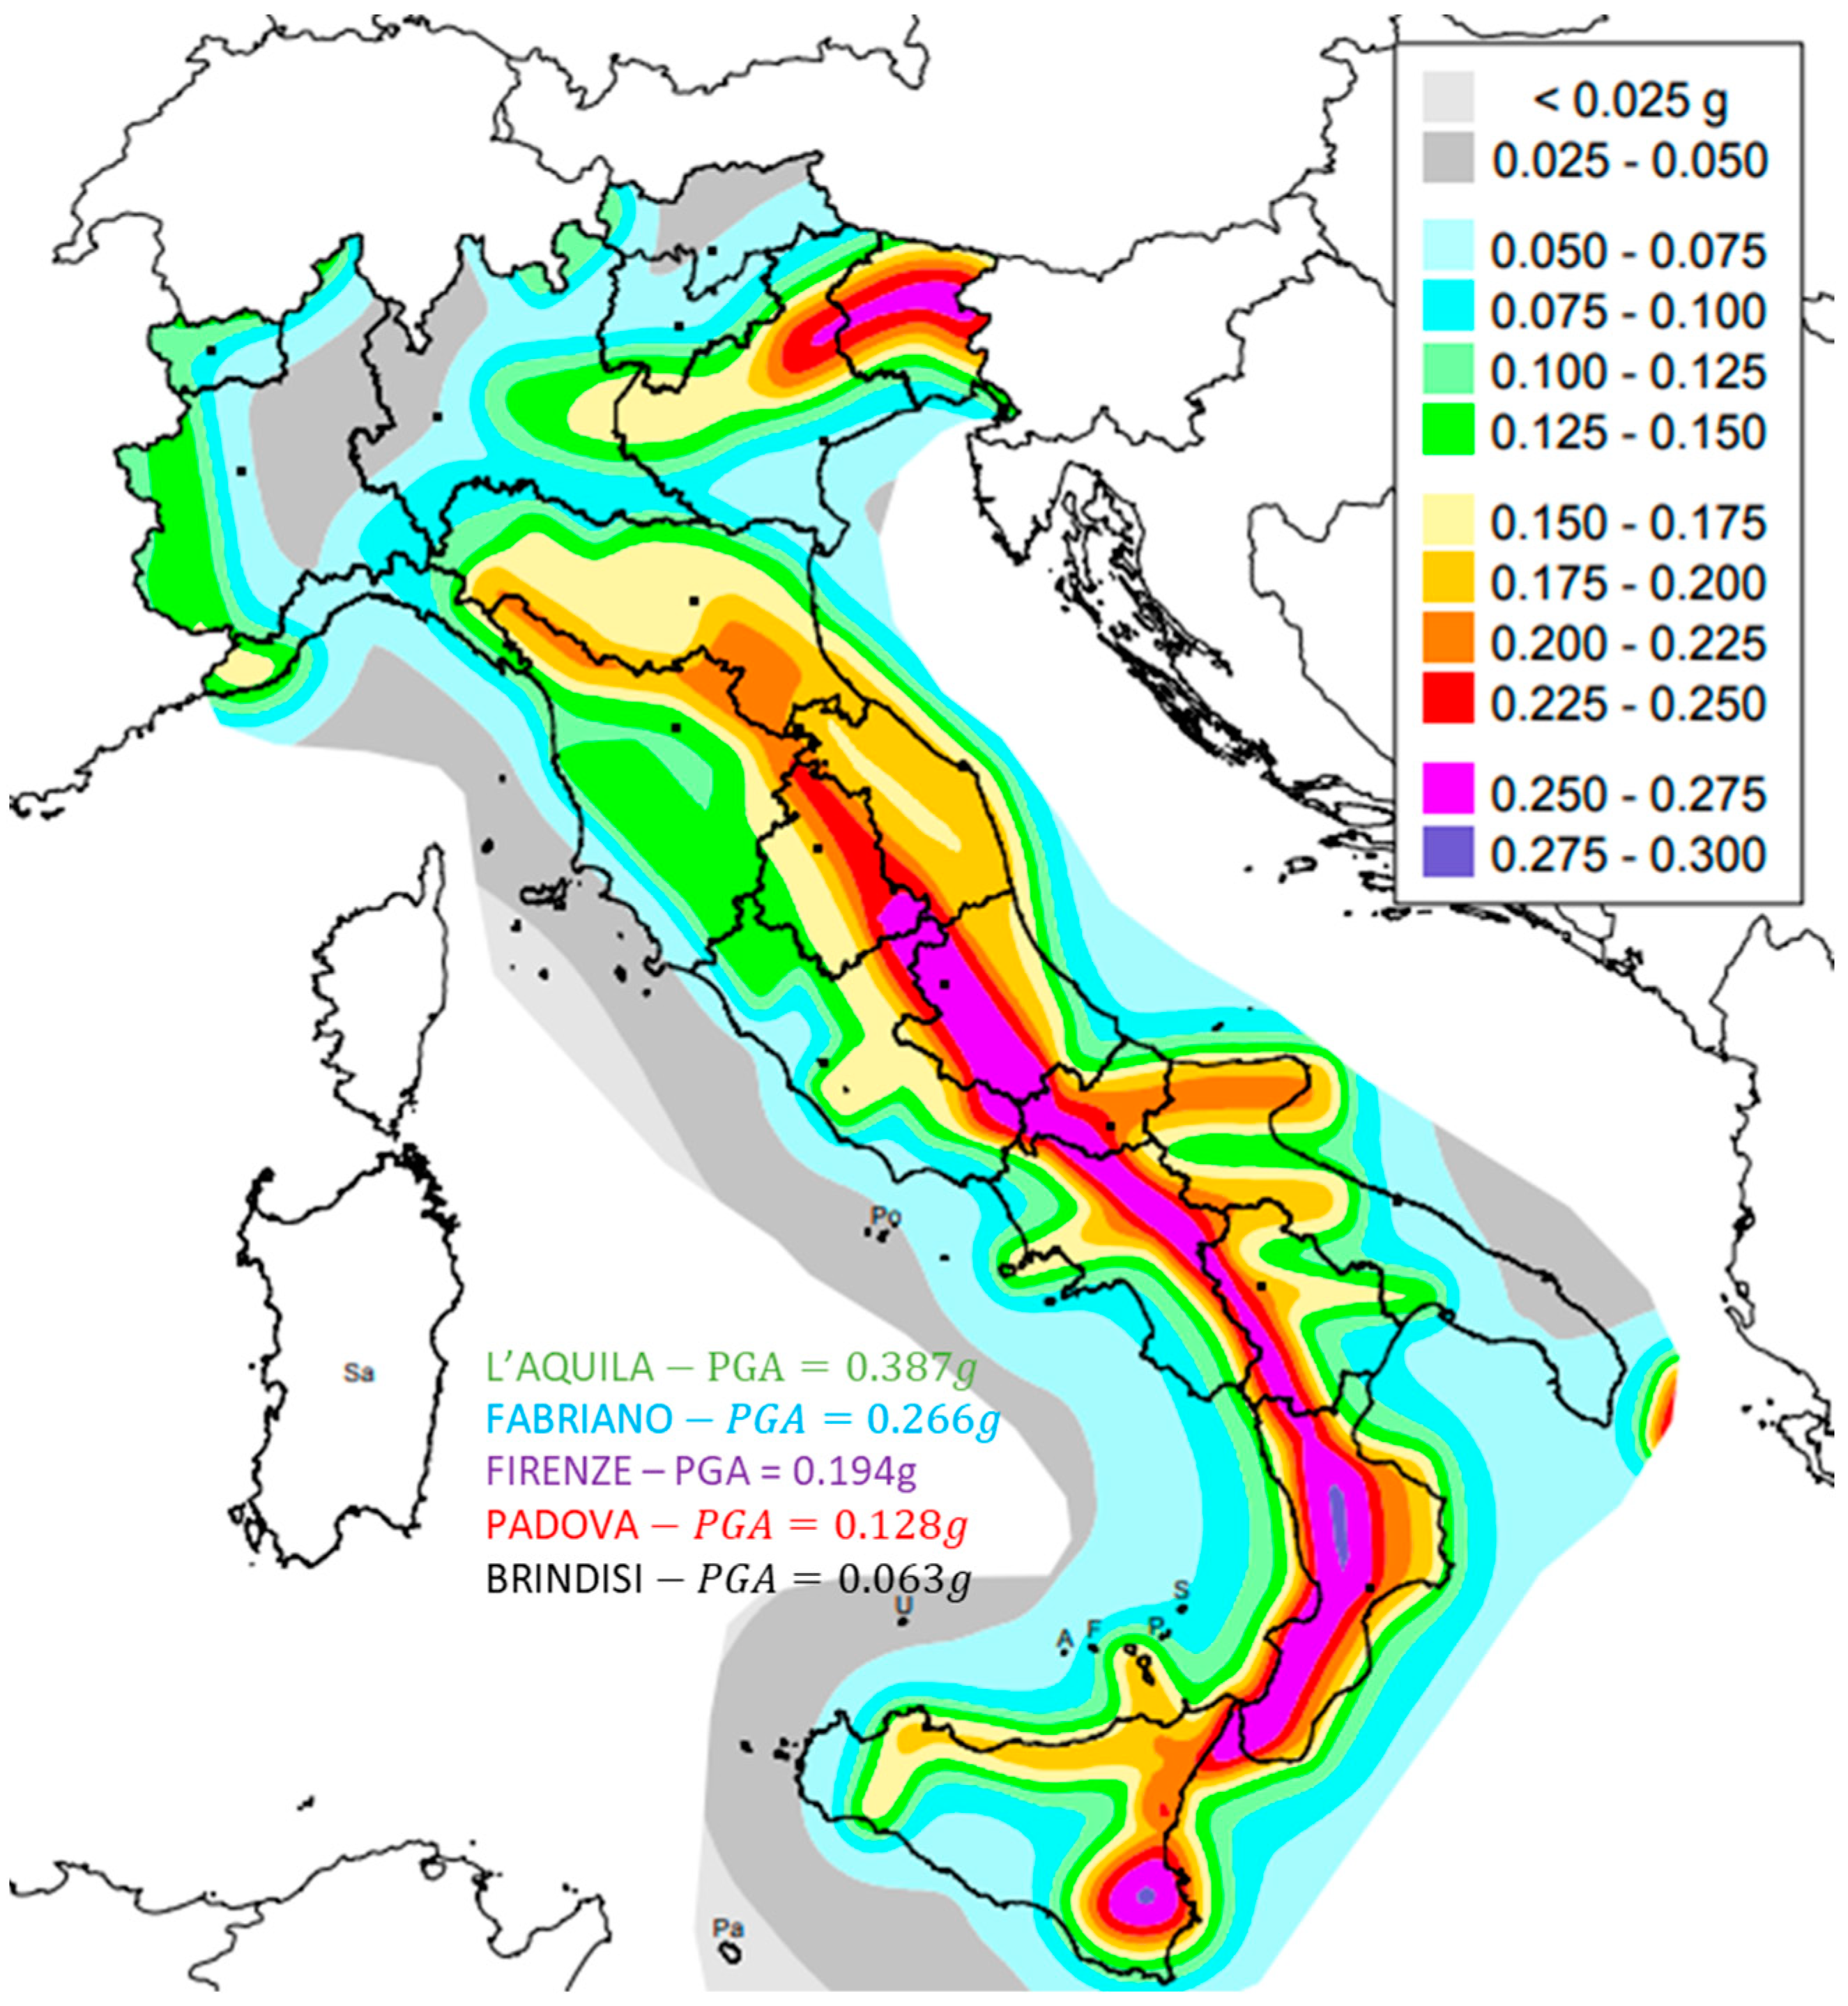
As a consequence, it can be noted that structural and economic benefits often do not coincide. This discrepancy is emphasized by the seismicity of the site, which affects the use of EAL as economic parameter, leading to an overestimation of the cost-effectiveness. To validate this hypothesis, it was assumed to vary the building location, choosing four cities with differing PGA values (Figure 23). To optimize the computations, the shape of the seismic spectrum was assumed constant; in this way, the maximum horizontal acceleration a g was the only varying parameter. For all the new cities, referring only to the Level3 strategy, the economic analyses were re-performed.
Figure 24 shows that the cost-effectiveness of the intervention drops drastically for a value of the PGA equal to 0.128 g, with a PBP value of 25 years; in any case, considering a building’s residual life of 50 years, the retrofit strategy could be still economically convenient. For a value of the PGA equal to 0.063 g, instead, it is clear that there is not economic convenience. In this case, the as-built condition has an initial seismic category of B that makes the intervention not necessary even though the retrofitted condition achieves a seismic category of A+. For the latter case, the PBP value of 87 years is higher than the residual life of 50 years, and the strategy is never economically convenient.

5.2. Variation of Climatic Conditions

From the energy point of view, the analysis shown for the Court of Fabriano, which belongs to the climatic zone E, demonstrates that the upgrading of the building to nZEB is the most convenient when considering the availability of national incentives. Moreover, considering that both national and international agencies are moving towards the support of deep retrofit strategies to combine the benefits of both energy and seismic interventions, further parametric analyses were carried out for other climatic zones to show the advantages of applying the nZEB strategy.
The Presidential Decree 412/1993 divides the peninsula into six climatic zones from “A” to “F” based on heating degree days (HDD). Representative cities were chosen for each HDD ranges:
-
Messina (Zone B, HDD 601–990)
-
Naples (Zone C, HDD 991–1400)
-
Florence (Zone D, HDD 1400–2100)
-
Turin (Zone E, HDD 2100–3000)
-
Tarvisio (Zone F, HDD > 3000)
The climatic zone A (HDD < 600) was excluded by this analysis since it covers only very few locations and is characterized by very low seismic risk.
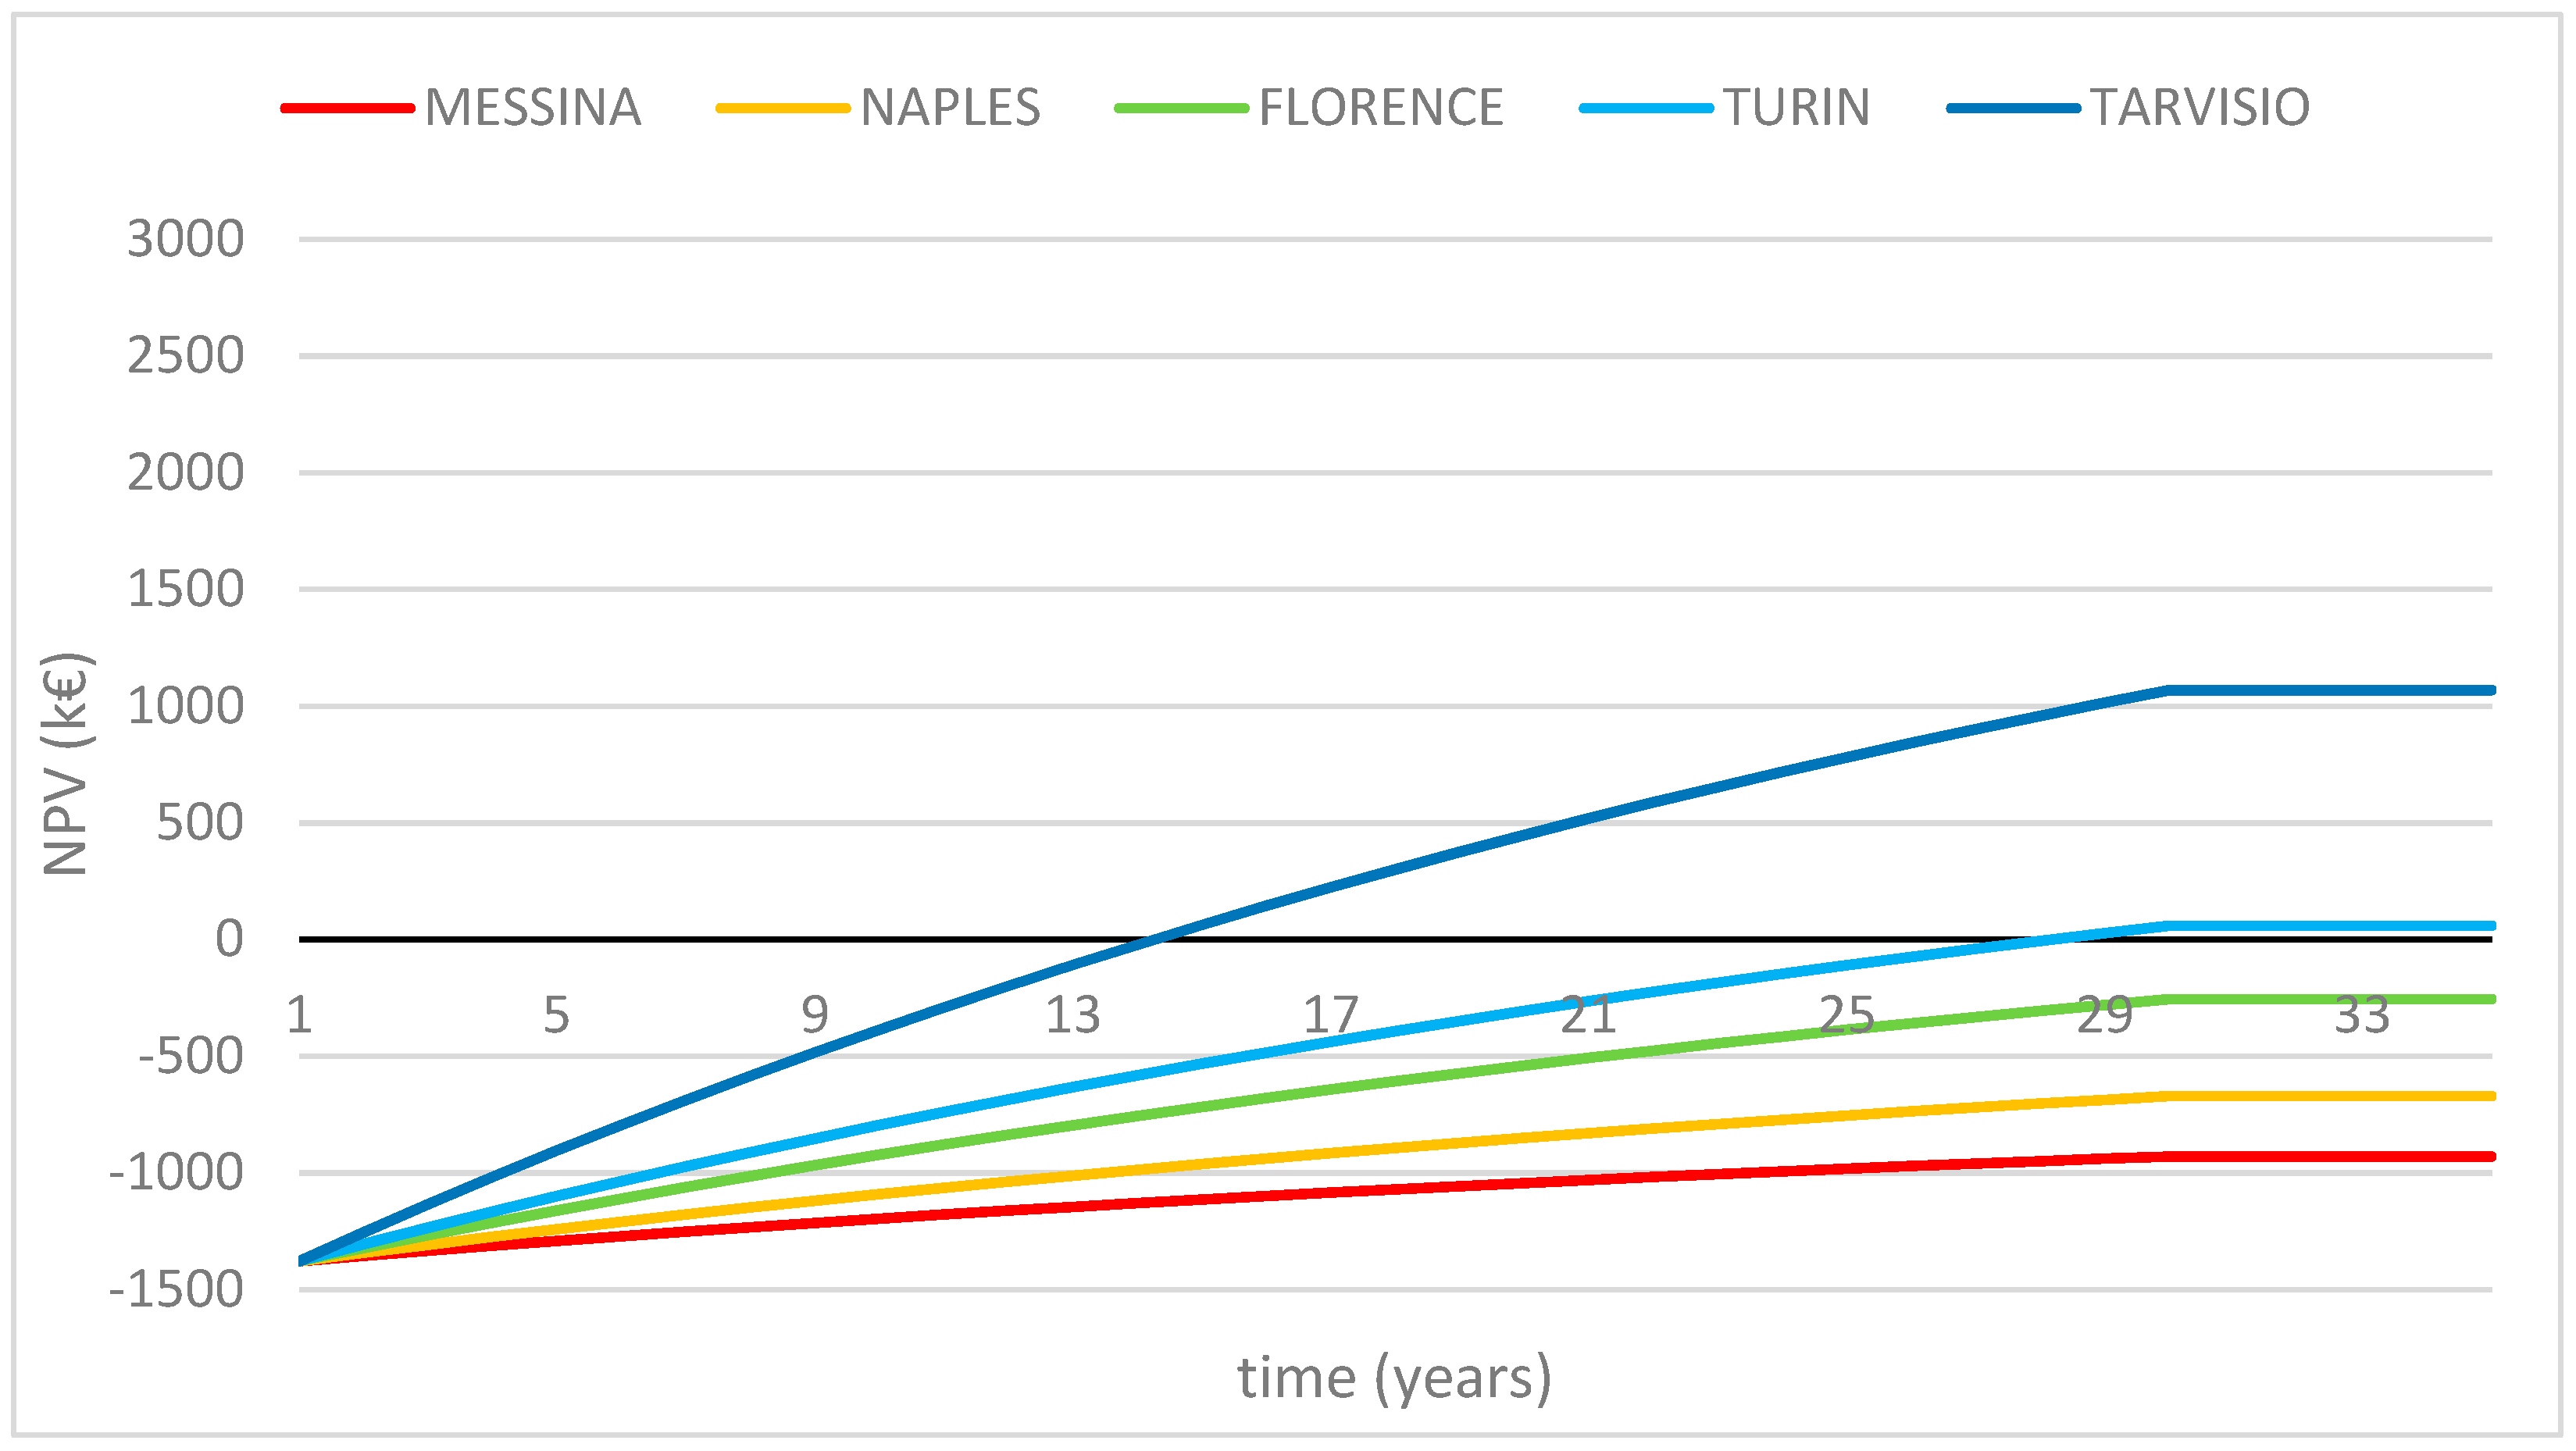
When excluding the national incentives, Figure 25 shows that the coldest climate (Tarvisio) has the lowest PBP due to the low cooling energy demand and the high benefits obtained in terms of heating energy-demand reduction due to the envelope insulation.
On the contrary, considering the high cooling energy demand and the lower benefits obtained from the envelope interventions on the cooling energy demand, the warmest climates will have no return on the investment costs. The application of the PV system to help the transition to nZEB increases the investment costs, and the energy produced depends on the latitude of the considered location. Even though the nZEB strategy reduces the energy required from the grid and thus the related costs, the warm climates show a slight increase of the cooling energy demand due to the insulation of the envelope; therefore, compared to the cold climates that have no cooling energy demand and an important reduction of the heating energy demand, the trend of the NPV for warmer climates is realistic.
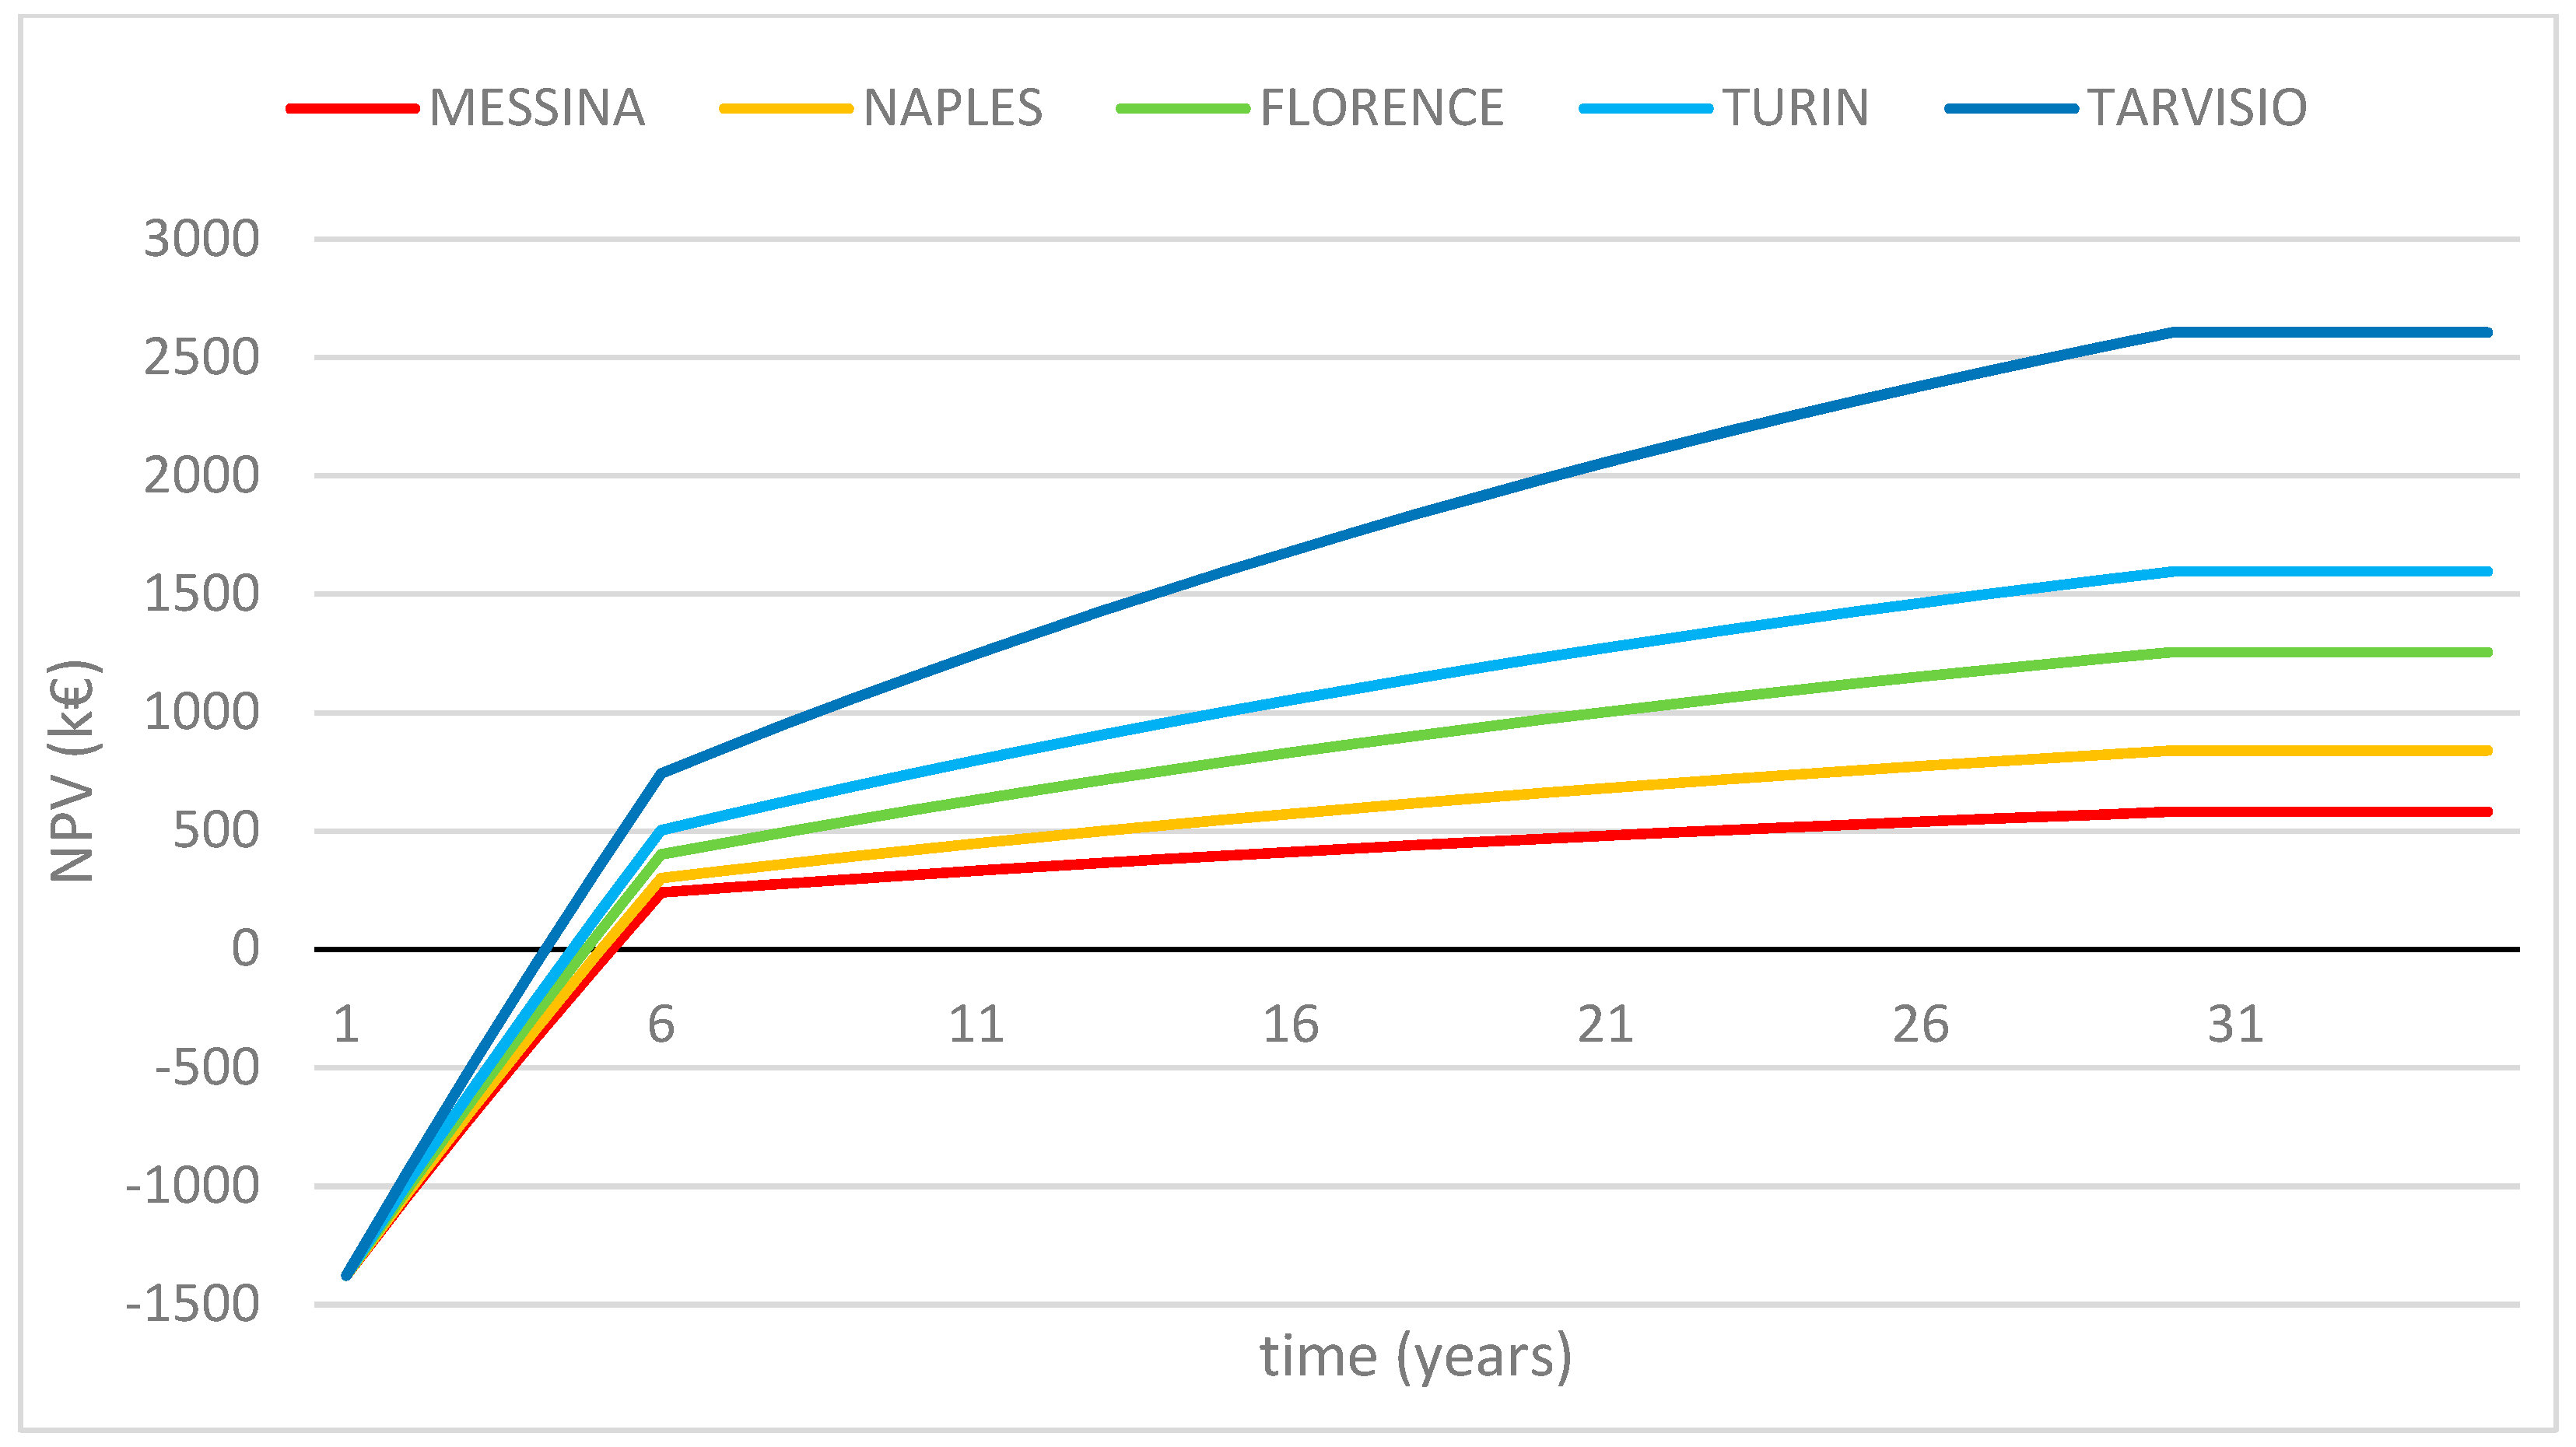
Applying the national economic benefits for the nZEB retrofit strategies allows a significant reduction of the PBT, as shown in Figure 26. With this hypothesis, the PBP ranges between four and five years, which is extremely convenient if compared to the natural time span of the building. The lowest PBP is still related to cold climates due to the massive reduction of the heating energy demand. However, this strategy is attractive also for warm climates, such as Naples and Messina, for instance, which are characterized by a significant seismic hazard. Indeed, as already mentioned, the incentive policies that support nZEB retrofit include the demolition and finishing works, allowing the combination with structural reinforcements and reducing the overall investment costs. Therefore, even though deep retrofit seems to be extreme in warm climates, because of the lower energy demand that is concentrated in the summer season only, with these analyses, the nZEB strategy turns out to be the most efficient solution both from the energy and the costs point of view, and it also reduces the CO2 emissions.

6. Conclusions and Future Challenges

Considering the high seismic vulnerability of Italy, the research proposes, on a case study base, a design methodology for combined interventions that implement both seismic and energy retrofit carried out on the same building components. To assess the effectiveness of the interventions, both non-linear structural analysis and energy analysis were conducted on the as-built conditions. Subsequently, four retrofit strategies including interventions on vertical structures (Level 1), horizontal structures (Level 2), on the entire building (Level 3), and combining envelope and HVAC system retrofit with renewable energy production (nZEB) were proposed and analyzed.
The obtained results showed that:
-
Due to the particular as-built condition of the building (very thick masonry walls of fairly good quality, good degree of connection between walls, and deformable horizontal diaphragms), Level 2 was proven to be the most cost-effective strategy, assuring an adequate enhancement in terms of both seismic behavior (seismic risk class B) and energy performance (energy class B).
-
Level 1, despite being still quite convenient under the energy efficiency point of view (energy performance increased to energy class C) and despite having still reasonable pay-back periods for both the structural and energy intervention costs, including also an execution time similar to that of Level 2, produces an insufficient enhancement of the seismic behavior (seismic class E). This demonstrates that it is always very useful to carry out separate evaluations on the results of the performed analyses to properly evaluate the best intervention for the specific case.
-
Level 3, a combination of Level 1 and Level 2, presented the highest enhancement of both seismic behavior and energy performance even though with a considerable increase of costs and execution times. However, thanks to overall works management, both cost and execution times are slightly lower than the mere sum of Level 1 and Level 2; this strategy appears to be less cost effective than Level 2.
-
nZEB strategy produces an increase of costs and execution times compared to Level 3, which is definitely small. Indeed, including the implementation of PV systems, the building reaches an energy class A4, and also thanks to the highest value of available incentives, it turns out to be the most economically viable option.
-
When varying the seismic hazard and climatic conditions of the location where the structure is built, with all the limitations due to the oversimplification connected to the regional distribution of building typologies and to the possible combination of interventions, it is evident that seismic intervention is still quite effective also for medium to low (but not very low) value of seismic hazard, whereas the energy interventions are not effective for a wide range of climatic areas. The cost effectiveness and possible integration of the interventions is thus strongly dependent on the two variables investigated.
-
Although Level 3 strategy strongly reduces its effectiveness for the warmer climatic areas, as expected, the nZEB strategy continues to be cost effective thanks to the higher percentage of available incentives and to the eligibility of structural interventions as well. In addition, this strategy helps reduce the CO2 emissions of the building.
An important outcome for future challenges concerns the need of homogenization of EAL parameters used for both seismic and energy economic analyses. Currently, the different nature of seismic EAL and energy EAL does not allow a complete integration of the analyses that are not immediately comparable. On the contrary, their integration and the development of combined procedures for the energy and seismic analysis would support designers and investors to promote refurbishment actions taking into account sound cost-effectiveness parameters. Another aspect that should be implemented as an integrated decision-support tool is the estimation of the CO2 emission reduction, which is necessary to achieve the European decarbonization targets for 2030 and 2050. It should also be underlined that in this work, we did not deal with issues related to the application of interventions on historical masonry buildings, as the former Fabriano courthouse does not constitute an applicable case of listed cultural heritage sites. Moreover, considering the specific case, we proposed a series of interventions that are jointly applied on the same building components. As a matter of fact, more work is needed in the future to define integrated interventions that could, with a single technology, improve both the energy and seismic behaviour of the buildings while preserving their external appearance, as mandated in this case. Despite the aforementioned limitations, this work has proposed a methodology to define the most effective and cost effective structural and energy interventions, paying particular attention to their possible integration, thus proposing a practical tool to assist designers and investors.
Lastly, from the analyses carried out, the building retrofit incentive system turned out to be of basic importance in the evaluation of the interventions. It also has a significant impact in promoting refurbishment actions. However, in the case of public buildings in Italy, there is an asymmetric formulation of the incentives related to the seismic and energy interventions and a partial integration of the two only in case of nZEB energy retrofit. These shortcomings should be overcome in order to boost an effective renovation of the Italian built heritage, also taking into account the medium to high seismic hazard that characterizes the country and the need to concurrently improve the energy efficiency and safety level of the existing building stock.

Author Contributions

Conceptualization and supervision, F.d.P. and M.D.C.; validation, F.L. and L.C., formal analysis and data curation, A.C. and L.F.; writing—original draft preparation, A.C. and L.C.; writing—review and editing, F.L. and F.d.P. All authors have read and agreed to the published version of the manuscript.

Funding

This study has been supported by a program funded by the Presidency of the Council of Ministers Department of Civil Protection (2019–2021 DPC-ReLUIS).

Institutional Review Board Statement

Not applicable.

Informed Consent Statement

Not applicable.

Data Availability Statement

All the resulting data are contained in this article.

Conflicts of Interest

The authors declare no conflict of interest. The funders had no role in the design of the study; in the collection, analyses, or interpretation of data; in the writing of the manuscript, or in the decision to publish the results.

References

  1. Sorrentino, L.; Cattari, S.; Da Porto, F.; Magenes, G.; Penna, A. Seismic behaviour of ordinary masonry buildings during the 2016 central Italy earthquakes. Bull. Earthq. Eng. 2019, 17, 5583–5607. [Google Scholar] [CrossRef] [Green Version]
  2. Lorenzoni, F.; Calabria, A.; De Conto, N.; da Porto, F. Assessment of the dynamic response of monitored masonry buildings after the central Italy earthquake swarm in 2016. In Proceedings of the 7th International Conference on Computational Methods in Structural Dynamics and Earthquake Engineering Methods in Structural Dynamics and Earthquake Engineering, Crete, Greece, 24–26 June 2019; pp. 24–26. [Google Scholar]
  3. Sisti, R.; Di Ludovico, M.; Borri, A.; Prota, A. Damage assessment and the effectiveness of prevention: The response of ordinary unreinforced masonry buildings in Norcia during the Central Italy 2016–2017 seismic sequence. Bull. Earthq. Eng. 2019, 17, 5609–5629. [Google Scholar] [CrossRef]
  4. Penna, A.; Morandi, P.; Rota, M.; Manzini, C.F.; Da Porto, F.; Magenes, G. Performance of masonry buildings during the Emilia 2012 earthquake. Bull. Earthq. Eng. 2014, 12, 2255–2273. [Google Scholar] [CrossRef]
  5. Marco, A.; De Falco, A.; Giresini, L.; Sassu, M. Structural damage in the cities of Reggiolo and Carpi after the earthquake on May 2012 in Emilia Romagna. Bull. Earthq. Eng. 2014, 12, 2445–2480. [Google Scholar]
  6. Modena, C.; Casarin, F.; da Porto, F.; Munari, M. L’Aquila 6th April 2009 Earthquake: Emergency and Post-emergency Activities on Cultural Heritage Buildings. In Earthquake Engineering in Europe; Garevski, M., Ansal, A., Eds.; Springer: Dordrecht, The Netherlands, 2010; pp. 495–521. [Google Scholar]
  7. D’Ayala, D.F.; Paganoni, S. Assessment and analysis of damage in L’Aquila historic city centre after 6th April 2009. Bull. Earthq. Eng. 2011, 9, 81–104. [Google Scholar] [CrossRef]
  8. Maffei, J.; Bazzurro, P. The 2002 Molise, Italy, Earthquake. Earthq. Spectra 2004, 20, 1–22. [Google Scholar] [CrossRef]
  9. Goretti, A.; Di Pasquale, G. Building Inspection and Damage Data for the 2002 Molise, Italy, Earthquake. Earthq. Spectra 2004, 20, 167–190. [Google Scholar] [CrossRef]
  10. Decanini, L.; De Sortis, A.; Goretti, A.; Langenbach, R.; Mollaioli, F.; Rasulo, A. Performance of Masonry Buildings during the 2002 Molise, Italy, Earthquake. Earthq. Spectra 2004, 20, 191–220. [Google Scholar] [CrossRef]
  11. Dolce, M.; Masi, A.; Goretti, A. Damage to buildings due to 1997 Umbria-Marche earthquake. In Seismic Damage to Masonry Buildings, 1st ed.; Springer: Cham, Switzerland, 2018; pp. 71–80. [Google Scholar]
  12. Spence, R.; D’Ayala, D. Damage Assessment and Analysis of the 1997 Umbria-Marche Earthquakes. Struct. Eng. Int. 1999, 9, 229–233. [Google Scholar] [CrossRef]
  13. Dolce, M.; Prota, A.; Borzi, B.; da Porto, F.; Lagomarsino, S.; Magenes, G.; Moroni, C.; Moroni, C.; Penna, A.; Polese, M.; et al. Seismic risk assessment of residential buildings in Italy. Bull. Earthq. Eng. 2021, 19, 2999–3032. [Google Scholar] [CrossRef]
  14. da Porto, F.; Donà, M.; Rosti, A.; Rota, M.; Lagomarsino, S.; Cattari, S.; Borzi, B.; Onida, M.; de Gregorio, D.; Speranza, E.; et al. Comparative analysis of the fragility curves for Italian residential masonry and RC buildings. Bull. Earthq. Eng. 2021, 19, 3209–3252. [Google Scholar] [CrossRef]
  15. Calvi, G.M. Choices and Criteria for Seismic Strengthening. J. Earthq. Eng. 2013, 17, 769–802. [Google Scholar] [CrossRef]
  16. Thermou, G.E.; Pantazopoulou, S.J.; Elnashai, A.S. Design Methodology for Seismic Upgrading of Substandard Reinforced Concrete Structures. J. Earthq. Eng. 2007, 11, 582–606. [Google Scholar] [CrossRef]
  17. Caterino, N.; Iervolino, I.; Manfredi, G.; Cosenza, E. Multi-Criteria Decision Making for Seismic Retrofitting of RC Structures. J. Earthq. Eng. 2008, 12, 555–583. [Google Scholar] [CrossRef]
  18. da Porto, F.; Valluzzi, M.R.; Munari, M.; Modena, C.; Arêde, A.; Costa, A.A. Strengthening of stone and brick masonry buildings. In Strengthening and Retrofitting of Existing Structures; Springer: Berlin/Heidelberg, Germany, 2018; pp. 59–84. [Google Scholar]
  19. Babatunde, S.A. Review of strengthening techniques for masonry using fiber reinforced polymers. Compos. Struct. 2017, 161, 246–255. [Google Scholar] [CrossRef]
  20. Corradi, M.; Di Schino, A.; Borri, A.; Rufini, R. A review of the use of stainless steel for masonry repair and reinforcement. Constr. Build. Mater. 2018, 181, 335–346. [Google Scholar] [CrossRef]
  21. Corrado, V.; Ballarini, I. Refurbishment trends of the residential building stock: Analysis of a regional pilot case in Italy. Energy Build. 2016, 132, 91–106. [Google Scholar] [CrossRef]
  22. Salvalai, G.; Sesana, M.M.; Iannaccone, G. Deep renovation of multi-storey multi-owner existing residential buildings: A pilot case study in Italy. Energy Build. 2017, 148, 23–36. [Google Scholar] [CrossRef]
  23. Ma, Z.; Cooper, P.; Daly, D.; Ledo, L. Existing building retrofits: Methodology and state-of-the-art. Cool Roofs Cool Pavements Cool Cities Cool World 2012, 55, 889–902. [Google Scholar] [CrossRef]
  24. Carnieletto, L.; Emmi, G.; Artuzzi, M.; Piazza, M.C.; Zarrella, A.; De Carli, M. Retrofit solutions for an historic building integrated with geothermal heat pumps. In E3S Web of Conferences; EDP Sciences: Ulis, France, 2019; Volume 111, p. 03055. [Google Scholar]
  25. Akkurt, G.G.; Aste, N.; Borderon, J.; Buda, A.; Calzolari, M.; Chung, D.; Costanzo, V.; del Pero, C.; Evola, G.; Huerto-Cardenas, H.E.; et al. Dynamic thermal and hygrometric simulation of historical buildings: Critical factors and possible solutions. Renew. Sustain. Energy Rev. 2020, 118, 109509. [Google Scholar] [CrossRef]
  26. Huerto-Cardenas, H.E.; Leonforte, F.; Aste, N.; Del Pero, C.; Evola, G.; Costanzo, V.; Lucchi, E. Validation of dynamic hygrothermal simulation models for historical buildings: State of the art, research challenges and recommendations. Build. Environ. 2020, 180, 107081. [Google Scholar] [CrossRef]
  27. La Greca, P.; Margani, G. Seismic and Energy Renovation Measures for Sustainable Cities: A Critical Analysis of the Italian Scenario. Sustainability 2018, 10, 254. [Google Scholar] [CrossRef] [Green Version]
  28. Manfredi, V.; Masi, A. Seismic Strengthening and Energy Efficiency: Towards an Integrated Approach for the Rehabilitation of Existing RC Buildings. Buildings 2018, 8, 36. [Google Scholar] [CrossRef] [Green Version]
  29. Pertile, V.; De Stefani, L.; Scotta, R. Development and characterization of a system for the seismic and energy retrofit of existing buildings. In Proceedings of the Xiv International Conference On Building Pathology And Constructions Repair, Florence, Italy, 20–22 June 2018. [Google Scholar]
  30. Labò, S.; Passoni, C.; Marini, A.; Belleri, A.; Camata, G.; Riva, P.; Spacone, E. Diagrid Solutions for a Sustainable Seismic, Energy, and Architectural Upgrade of European RC Buildings. In Proceedings of the XII International Conference on Structural Repair and Rehabilitation, Porto, Portugal, 26–29 October 2016. [Google Scholar]
  31. Marini, A.; Belleri, A.; Feroldi, F.; Passoni, C.; Preti, M.; Riva, P.; Giuriani, E.; Plizzari, G. Coupling energy refurbishment with structural strengthening in retrofit interventions. In SAFESUST Workshop; SAFESUST: Ispra, Italy, 2015. [Google Scholar]
  32. Marini, A.; Passoni, C.; Belleri, A.; Feroldi, F.; Preti, M.; Metelli, G.; Riva, P.; Giuriani, E.; Plizzari, G. Combining seismic retrofit with energy refurbishment for the sustainable renovation of RC buildings: A proof of concept. Eur. J. Environ. Civ. Eng. 2017, 1–20. [Google Scholar] [CrossRef]
  33. Bournas, D.A. Concurrent seismic and energy retrofitting of RC and masonry building envelopes using inorganic textile-based composites combined with insulation materials: A new concept. Compos. Eng. 2018, 148, 166–179. [Google Scholar] [CrossRef]
  34. Pohoryles, D.A.; Bournas, D.A. Seismic retrofit of infilled RC frames with textile reinforced mortars: State-of-the-art review and analytical modelling. Compos. Eng. 2020, 183, 107702. [Google Scholar] [CrossRef]
  35. Pohoryles, D.A.; Maduta, C.; Bournas, D.A.; Kouris, L.A. Energy performance of existing residential buildings in Europe: A novel approach combining energy with seismic retrofitting. Energy Build. 2020, 223, 110024. [Google Scholar] [CrossRef]
  36. Gkournelos, P.D.; Bournas, D.A.; Triantafillou, T.C. Combined Seismic and Energy Upgrading of Existing Reinforced Concrete Buildings Using TRM Jacketing and Thermal Insulation. Earthq. Struct. 2019, 16, 625–639. [Google Scholar]
  37. Da Porto, F.; Verlato, N.; Guidi, G.; Modena, C. The INSYSME project: Innovative construction systems for earthquake resistant masonry infill walls. In Proceedings of the 16th International Brick and Block Masonry Conference, Padova, Italy, 26–30 June 2016; CRC Press: Boca Raton, FL, USA, 2016. [Google Scholar]
  38. Verlato, N.; Guidi, G.; da Porto, F.; Modena, C. Innovative systems for masonry infill walls based on the use of deformable joints: Combined in-plane/out-of-plane tests. In Proceedings of the 16th International Brick and Block Masonry Conference, Padova, Italy, 26–30 June 2016; CRC Press: Boca Raton, FL, USA, 2016. [Google Scholar]
  39. Morandi, P.; Milanesi, R.R.; Magenes, G. Innovative solution for seismic-resistant masonry infills with sliding joints: In-plane experimental performance. Eng. Struct. 2018, 176, 719–733. [Google Scholar] [CrossRef]
  40. Borri, A.; Corradi, M.; Sisti, R.; Buratti, C.; Belloni, E.; Moretti, E. Masonry wall panels retrofitted with thermal-insulating GFRP-reinforced jacketing. Mater. Struct. 2016, 49, 3957–3968. [Google Scholar] [CrossRef] [Green Version]
  41. Giaretton, M.; Dizhur, D.; Garbin, E.; Ingham, J.M.; da Porto, F. In-Plane Strengthening of Clay Brick and Block Masonry Walls Using Textile-Reinforced Mortar. J. Compos. Constr. 2018, 22, 04018028. [Google Scholar] [CrossRef]
  42. Longo, F.; Cascardi, A.; Lassandro, P.; Sannino, A.; Aiello, M.A. Mechanical and Thermal Characterization of FRCM-Matrices. Key Eng. Mater. 2019, 817, 189–194. [Google Scholar] [CrossRef]
  43. Triantafillou, T.C.; Karlos, K.; Kapsalis, P.; Georgiou, L. Innovative Structural and Energy Retrofitting System for Masonry Walls Using Textile Reinforced Mortars Combined with Thermal Insulation: In-Plane Mechanical Behavior. J. Compos. Constr. 2018, 22, 04018029. [Google Scholar] [CrossRef]
  44. Triantafillou, T.C.; Karlos, K.; Kefalou, K.; Argyropoulou, E. An innovative structural and energy retrofitting system for URM walls using textile reinforced mortars combined with thermal insulation: Mechanical and fire behavior. Constr. Build. Mater. 2017, 133, 1–13. [Google Scholar] [CrossRef]
  45. Valluzzi, M.R.; Saler, E.; Vignato, A.; Salvalaggio, M.; Croatto, G.; Dorigatti, G.; Turrini, U. Nested Buildings: An Innovative Strategy for the Integrated Seismic and Energy Retrofit of Existing Masonry Buildings with CLT Panels. Sustainability 2021, 13, 1188. [Google Scholar] [CrossRef]
  46. Stazi, F.; Serpilli, M.; Maracchini, G.; Pavone, A. An experimental and numerical study on CLT panels used as infill shear walls for RC buildings retrofit. Constr. Build. Mater. 2019, 211, 605–616. [Google Scholar] [CrossRef]
  47. Margani, G.; Evola, G.; Tardo, C.; Marino, E.M. Energy, Seismic, and Architectural Renovation of RC Framed Buildings with Prefabricated Timber Panels. Sustainability 2020, 12, 4845. [Google Scholar] [CrossRef]
  48. Giongo, I.; Rizzi, E.; Riccadonna, D.; Piazza, M. On-site testing of masonry shear walls strengthened with timber panels. Proc. Inst. Civ. Eng. Struct. Build. 2021, 174, 389–402. [Google Scholar] [CrossRef]
  49. Dalla Mora, T.; Righi, A.; Peron, F.; Romagnoni, P. Functional, Energy and Seismic Retrofitting in Existing Building: An Innovative System Based on xlam Technology. Energy Procedia 2015, 82, 486–492. [Google Scholar] [CrossRef] [Green Version]
  50. Italian Parliament Law 205/2017. Bilancio di Previsione dello Stato per l’anno Finanziario 2018 e Bilancio Pluriennale per il Triennio 2018–2020; Gazzetta Ufficiale: Rome, Italy, 2017. [Google Scholar]
  51. Ministerial Decree n.58, Sisma Bonus: Linee Guida per la Classificazione del Rischio Sismico Delle Costruzioni Nonché le Modalità per l’attestazione, da parte di Professionisti Abilitati, dell’efficacia Degli Interventi Effettuati. Available online: https://mit.gov.it/comunicazione/news/sismabonus-edilizia-residenziale-pubblica-ristrutturazione/sisma-bonus-linee (accessed on 26 July 2021).
  52. Ministerial Decree n.65, Sisma Bonus—Linee Guida per la Classificazione del Rischio Sismico Delle Costruzioni e i Relativi allegati. Modifiche all’articolo 3 Del Decreto Ministeriale Numero 58 Del 28/02/2017. Available online: https://www.mit.gov.it/normativa/decreto-ministeriale-numero-65-del-07032017 (accessed on 26 July 2021).
  53. Ministerial Decree n.24, Sisma Bonus—Linee Guida per la Classificazione del Rischio Sismico delle Costruzioni Nonché le modalità per l’attestazione, da parte di Professionisti Abilitati, dell’efficacia degli Interventi Effettuati. Modifiche al DM 58 del 28/02/2017. Available online: http://www.mit.gov.it/normativa/decreto-ministeriale-numero-24-del-09012020 (accessed on 26 July 2021).
  54. Misure Urgenti in Materia di Salute, Sostegno al Lavoro e all’economia, Nonche’ di Politiche Sociali Connesse all’emergenza Epidemiologica da COVID-19. Modifiche al DM 128 del 19/05/2020. 2020. Available online: https://www.gazzettaufficiale.it/eli/id/2020/05/19/20G00052/sg (accessed on 26 July 2021).
  55. Calvi, G.M.; Sousa, L.; Ruggeri, C. Energy Efficiency and Seismic Resilience: A Common Approach. In Multi-hazard Approaches to Civil Infrastructure Engineering; Gardoni, P., LaFave, J., Eds.; Springer: Cham, Germany, 2016; pp. 165–208. [Google Scholar]
  56. Donà, M.; Bizzaro, L.; Carturan, F.; da Porto, F. Effects of Business Recovery Strategies on Seismic Risk and Cost-Effectiveness of Structural Retrofitting for Business Enterprises. Earthq. Spectra 2019, 35, 1795–1819. [Google Scholar] [CrossRef]
  57. Mastroberti, M.; Bournas, D.; Vona, M.; Manganelli, B.; Palermo, V. Combined seismic plus energy retrofitting for existing RC buildings: Economic feasibility. In Proceedings of the 16 European Conference on Earthquake Engineering, Thessaloniki, Greece, 18–21 June 2018. [Google Scholar]
  58. dei Trasporti, M.D.I. NTC2018 Aggiornamento Delle Norme Tecniche per le Costruzioni; Official Gazette of the Italian Republic: Rome, Italy, 2018. [Google Scholar]
  59. Ministero delle Infrastrutture e dei Trasporti Circolare 21 Gennaio 2019 no.7. Istruzioni per l’applicazione dell’Aggiornamento delle “Norme Tecniche Per le Costruzioni” di cui al Decreto Ministeriale 17 Gennaio 2018. Modifiche al DM 35 del 11/02/2019. 2019. Available online: https://www.gazzettaufficiale.it/eli/id/2019/02/11/19A00855/sg (accessed on 26 July 2021).
  60. IEE Project TABULA. Consultato 26 luglio 2021. Available online: https://episcope.eu/iee-project/tabula/ (accessed on 26 July 2021).
  61. International Standard Organisation—ISO. ISO 18523-1:2016 Energy Performance of Buildings—Schedule and Condition of Building, Zone and Space Usage for Energy Calculation; ISO: Geneva, Switzerland, 2016. [Google Scholar]
  62. Lourenço, P.B. Computations on historic masonry structures. Prog. Struct. Eng. Mater. 2002, 4, 301–319. [Google Scholar] [CrossRef]
  63. Roca, P.; Cervera, M.; Gariup, G. Structural Analysis of Masonry Historical Constructions. Classical and Advanced Approaches. Arch. Comput. Methods Eng. 2010, 17, 299–325. [Google Scholar] [CrossRef] [Green Version]
  64. D’Altri, A.M.; Sarhosis, V.; Milani, G.; Rots, J.; Cattari, S.; Lagomarsino, S.; Sacco, E.; Tralli, A.; Castellazzi, G.; de Miranda, S. Modeling Strategies for the Computational Analysis of Unreinforced Masonry Structures: Review and Classification. Arch. Comput. Methods Eng. 2020, 27, 1153–1185. [Google Scholar] [CrossRef]
  65. Endo, Y.; Pelà, L.; Roca, P.; Da Porto, F.; Modena, C. Comparison of seismic analysis methods applied to a historical church struck by 2009 L’Aquila earthquake. Bull. Earthq. Eng. 2015, 13, 3749–3778. [Google Scholar] [CrossRef] [Green Version]
  66. Magenes, G.; Morandi, P. Metodi Semplificati per l’analisi Sismica non Lineare di Edifici in Muratura; Braggio, C., Ed.; CNR-Gruppo Nazionale per la Difesa dai Terremoti: Rome, Italy, 2000. [Google Scholar]
  67. Magenes, G.; Fontana, A.D. Simplified non-linear seismic analysis of masonry buildings. Proc. Br. Mason. Soc. 1998, 8, 190–195. [Google Scholar]
  68. Quagliarini, E.; Maracchini, G.; Clementi, F. Uses and limits of the Equivalent Frame Model on existing unreinforced masonry buildings for assessing their seismic risk: A review. J. Build. Eng. 2017, 10, 166–182. [Google Scholar] [CrossRef]
  69. Siano, R.; Sepe, V.; Camata, G.; Spacone, E.; Roca, P.; Pelà, L. Analysis of the performance in the linear field of Equivalent-Frame Models for regular and irregular masonry walls. Eng. Struct. 2017, 145, 190–210. [Google Scholar] [CrossRef] [Green Version]
  70. Siano, R.; Roca, P.; Camata, G.; Pelà, L.; Sepe, V.; Spacone, E.; Petracca, M. Numerical investigation of non-linear equivalent-frame models for regular masonry walls. Eng. Struct. 2018, 173, 512–529. [Google Scholar] [CrossRef]
  71. Lagomarsino, S.; Penna, A.; Galasco, A.; Cattari, S. TREMURI program: An equivalent frame model for the nonlinear seismic analysis of masonry buildings. Eng. Struct. 2013, 56, 1787–1799. [Google Scholar] [CrossRef]
  72. Midas GEN. Available online: https://globalsupport.midasuser.com/helpdesk/ (accessed on 26 June 2021).
  73. EN 1998-3. Eurocode 8, Design of Structures for Earthquake Resistance—Part 3: Assessment and Retrofitting of Buildings; CEN: Brussels, Belgium, 2005. [Google Scholar]
  74. EN 1998-1. Eurocode 8. Design of Structures for Earthquake Resistance—Part 1: General Rules, Seismic Actions and Rules for Buildings; CEN: Brussels, Belgium, 2005. [Google Scholar]
  75. Dolce, M.; Nicoletti, M.; De Sortis, A.; Marchesini, S.; Spina, D.; Talanas, F. Osservatorio sismico delle strutture: The Italian structural seismic monitoring network. Bull. Earthq. Eng. 2017, 15, 621–641. [Google Scholar] [CrossRef] [Green Version]
  76. Cattari, S.; Degli Abbati, S.; Alfano, S.; Brunelli, A.; Lorenzoni, F.; da Porto, F. Dynamic calibration and seismic validation of numerical models of URM buildings through permanent monitoring data. Earthq. Eng. Struct. Dyn. 2021, 50, 2690–2711. [Google Scholar] [CrossRef]
  77. Ente Italiano di Uniicazione (UNI). UNI TS 11300:2014—Energy Performance of Buildings; Italian National Unification Body: Milan, Italy, 2008. [Google Scholar]
  78. EDILCLIMA. Available online: https://www.edilclima.it/ (accessed on 26 June 2021).
  79. TRNSYS. Available online: http://www.trnsys.com/ (accessed on 26 June 2021).
  80. Stephenson, D.G.; Mitalas, G.P. Calculation of Heat Conduction Transfer Functions for Multi-Layer Slabs. ASHRAE Trans. 1971, 77, 117–126. [Google Scholar]
  81. Conto Termico—Aggiornamento della Disciplina per l’Incentivazione di Interventi di Piccole Dimensioni per l’incremento dell’effi Cienza Energetica e per la Produzione di Energia Termica da Fonti Rinnovabili. Modifiche al DM 51 del 02/03/2016. 2016. Available online: https://www.gazzettaufficiale.it/eli/gu/2016/03/02/51/sg/pdf (accessed on 26 July 2021).
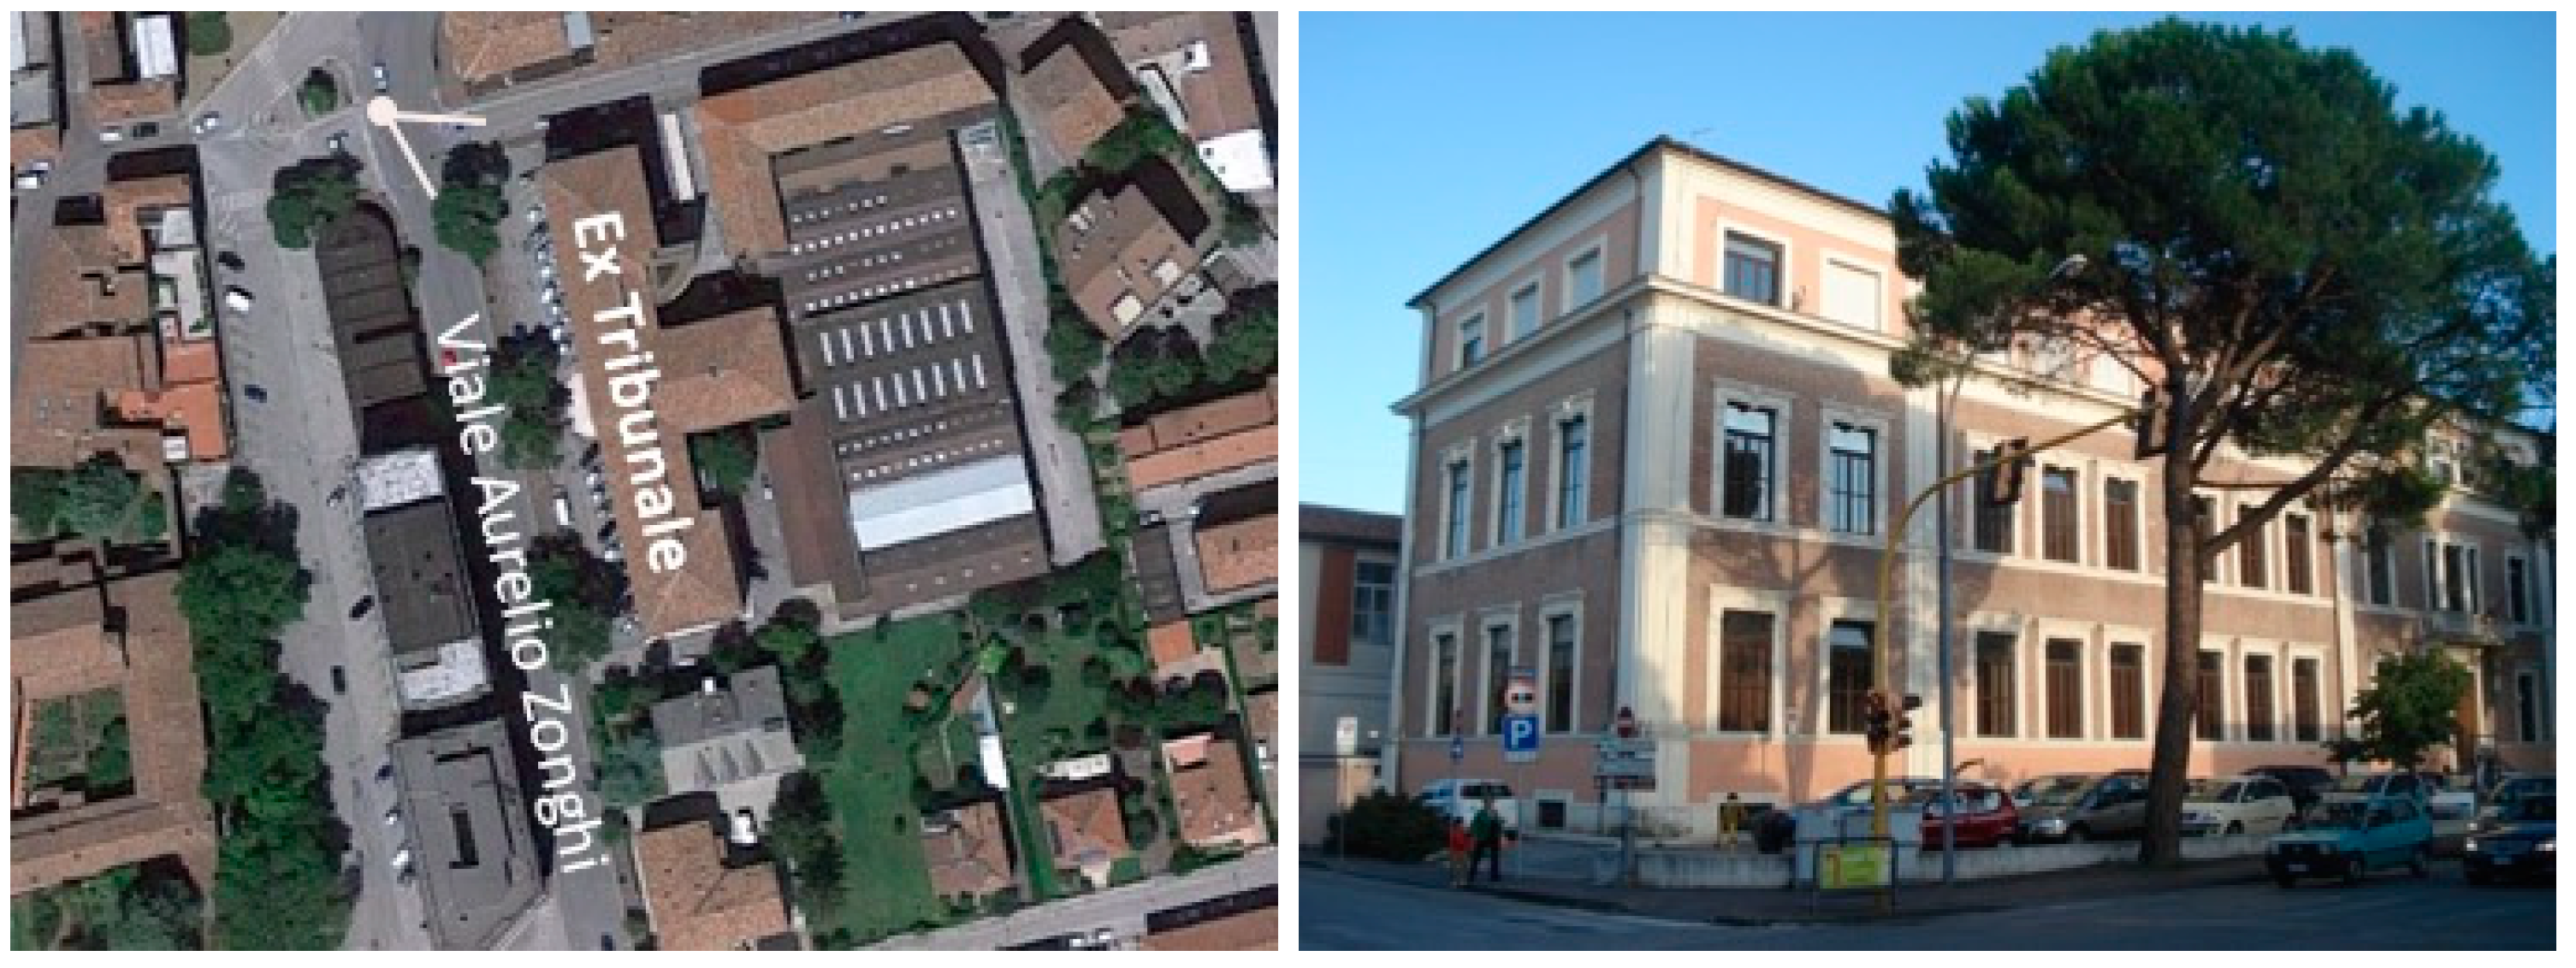
Figure 1. View of the case study building.
Sustainability 13 09592 g001
Figure 2. (a) Type plan of the building; (b) elevations of the building.
Sustainability 13 09592 g002
Figure 3. (a) M1 masonry type, (b) M2 masonry type, (c) M3 masonry type.
Sustainability 13 09592 g003
Figure 4. In-plan distribution of masonry types.
Sustainability 13 09592 g004aSustainability 13 09592 g004b
Figure 5. Distribution of floor types.
Sustainability 13 09592 g005
Figure 6. Global model of the building for seismic analysis in Midas GEN [72].
Sustainability 13 09592 g006
Figure 7. (a) Positions and (b) behavior of the plastic hinges assigned to piers and spandrels.
Sustainability 13 09592 g007
Figure 8. Walls analyzed in the pushover analysis in the X and Y directions.
Sustainability 13 09592 g008
Figure 9. Pushover curves in the (a) X direction and (b) Y direction.
Sustainability 13 09592 g009
Figure 10. IS-V and PAM seismic risk categories of the case study building.
Sustainability 13 09592 g010
Figure 11. Dynamic model in TRNSYS.
Sustainability 13 09592 g011
Figure 12. Results of the dynamic simulation.
Sustainability 13 09592 g012
Figure 13. Retrofit interventions on the floors: (a) S1–2, (b) S3, and (c) S4.
Sustainability 13 09592 g013
Figure 14. First 3 mode shapes for the (a) as-built condition and Level 1 and (b) Level 2 and Level 3 retrofit strategies.
Sustainability 13 09592 g014
Figure 15. Structural safety index for (a) as-built condition, (b) Level 1, (c) Level 2, and (d) Level 3 strategy.
Sustainability 13 09592 g015
Figure 16. Pushover curves of W_N with the various seismic retrofit strategies.
Sustainability 13 09592 g016
Figure 17. (a) EAL curves of the seismic retrofit strategies; (b) annual savings of the energy retrofit strategies.
Sustainability 13 09592 g017
Figure 18. (a) Seismic risk categories and (b) energy performance categories of the various retrofit strategies.
Sustainability 13 09592 g018
Figure 19. Total costs (in €/m2) of the retrofit strategies.
Sustainability 13 09592 g019
Figure 20. NPV curves for structural interventions of the various retrofit strategies.
Sustainability 13 09592 g020
Figure 21. NPV curves for energy interventions of the various retrofit strategies.
Sustainability 13 09592 g021
Figure 22. NPV curves with incentives for energy interventions of the various retrofit strategies.
Sustainability 13 09592 g022
Figure 23. Chosen cities for seismic analysis.
Sustainability 13 09592 g023
Figure 24. Seismic and economic analyses varying the PGA of the site: (a) ΔEAL (%); (b) payback period; (c) as-built PAM seismic category; (d) retrofitted PAM seismic category; and (e) NPV curves.
Sustainability 13 09592 g024aSustainability 13 09592 g024b
Figure 25. NPV curves without incentives for nZEB energy interventions for each climatic zone.
Sustainability 13 09592 g025
Figure 26. NPV curves with incentives for nZEB energy interventions for each climatic zone.
Sustainability 13 09592 g026
Table 1. Global primary energy requirements.
Specific Primary Energy
[kWh/m2 y]
Heating 155
Domestic hot water 3
Cooling
Lighting 22
Transport 0.65
Total 180
Table 2. Seismic retrofitting interventions on walls.
Masonry TypeLocationGrout InjectionsReinforced Cement Coating
M1M1A (inner)XX
M1B (External)X
M2Inner X
M3ExternalX
Table 3. Integrated retrofit strategies.
Seismic RetrofitEnergy Retrofit
Level 1Strengthening of masonry walls with grout injections and reinforced cement coatingThermal insulation of perimetral walls and replacement of fenestrations
Level 2Strengthening of steel beam/clay tile floors; substitution of hollow brick/concrete floor; bracing of the attic floorsInstallation of radiant floors, air-water heat pump, ventilation equipment; thermal insulation of floors, installation of false ceilings
Level 3Combination of Level 1 and Level 2Combination of Level 1 and Level 2
nZEBSame as Level 3Same as Level 3 with the addition of a photovoltaic system
Table 4. Dynamic response of the structure for the different conditions.
ModeConditionFrequency (Hz)Participating Mass
(%)
Type of Mode
Mode1As-built1.956.16Local
Level 12.335.79Local
Level 23.2152.7Global—Torsional
Level34.2263.94Global—Torsional
Mode2As-built1.970.15Local
Level 12.350.12Local
Level 23.2952.36Global—Trans X
Level34.4463.44Global—Trans X
Mode3As-built2.323.49Local
Level 12.792.75Local
Level 23.8265.75Global—Trans Y
Level35.1866.23Global—Trans Y
Table 5. Summary of the energy and economic benefits obtained with the retrofit strategies.
As-BuiltLevel 1Level 2Level 3nZEB
Energy Performance Index
[kWh/m2 y]
216741136622
Annual costs [k€/y]763929237
Annual saving [k€/y]038475369
Energy classGCBA2A4
Table 6. Cost effectiveness for structural interventions of the various retrofit strategies.
ΔEAL (%)PBP (Years)
Level 13.177
Level 28.063
Level 38.225
Table 7. Cost effectiveness for energy interventions of the various retrofit strategies.
ΔEAL (k€)PBP (Years)
Level 137.6121
Level 241.5710
Level 353.4425
nZEB69.1322
Table 8. Interventions and related incentives.
InterventionsIncentive
(k€)
Level 1Level 2Level 3nZEB
Wall insulation 50%119.8X--
Slab insulation 50%137.5---
Window replacements 40%96.7X--
Wall insulation 55%131.7--XX
Slab insulation 55%151.3-XXX
Windows replacement 55%100-XXX
Heat pump63.1-XXX
PV1233.4---X
Total (k€)-216.4314.41679.5
Table 9. Time for execution of the different retrofit strategies.
DescriptionWorking Days
3 Teams for Structural Works
and 2 for Energy Works
4 Teams for Structural Works
and 2 for Energy Works
5 Teams for Structural Works
and 2 for Energy Works
Level 1Structural retrofit172.57129.42103.54
Demolition and finishing80.4060.3048.24
Energy retrofit116.3658.1858.18
Safety and construction site22.6522.6522.65
Total13 months9 months8 months
Level 2Structural retrofit89.9867.4853.99
Demolition and finishing191.42143.57114.85
Energy retrofit52.3726.1825.37
Safety and construction site40.9620.4820.48
Total12.5 months8.5 months7.5 months
Level 3Structural retrofit262.55196.91157.53
Demolition and finishing224.98168.74134.99
Energy retrofit171.1585.5885.58
Safety and construction site43.8821.9421.94
Total23.5 months16 months13.5 months
nZEBStructural retrofit262.55196.91157.53
Demolition and finishing224.98168.74134.99
Energy retrofit196.7398.3798.37
Safety and construction site43.8821.9421.94
Total24 months16 months14 months
Table 10. Breakdown of execution time of Level 2, considering 5 teams.
Structural Retrofit
Structural
Interventions
Demolition and
Finishing
Total
Basement floor---9.199.19
Ground floor6.1220.6726.80
First floor6.4421.8228.26
Second floor24.5040.2064.70
Attic floor16.9222.9739.89
Energy retrofit
Civil worksInstallation worksTotal
Entire building1.6223.7525.37
Costs for safety
Entire building--20.48
Total214
Publisher’s Note: MDPI stays neutral with regard to jurisdictional claims in published maps and institutional affiliations.