
Research and Development Talents Training in China Universities—Based on the Consideration of Education Management Cost Planning


Abstract
:1. Introduction
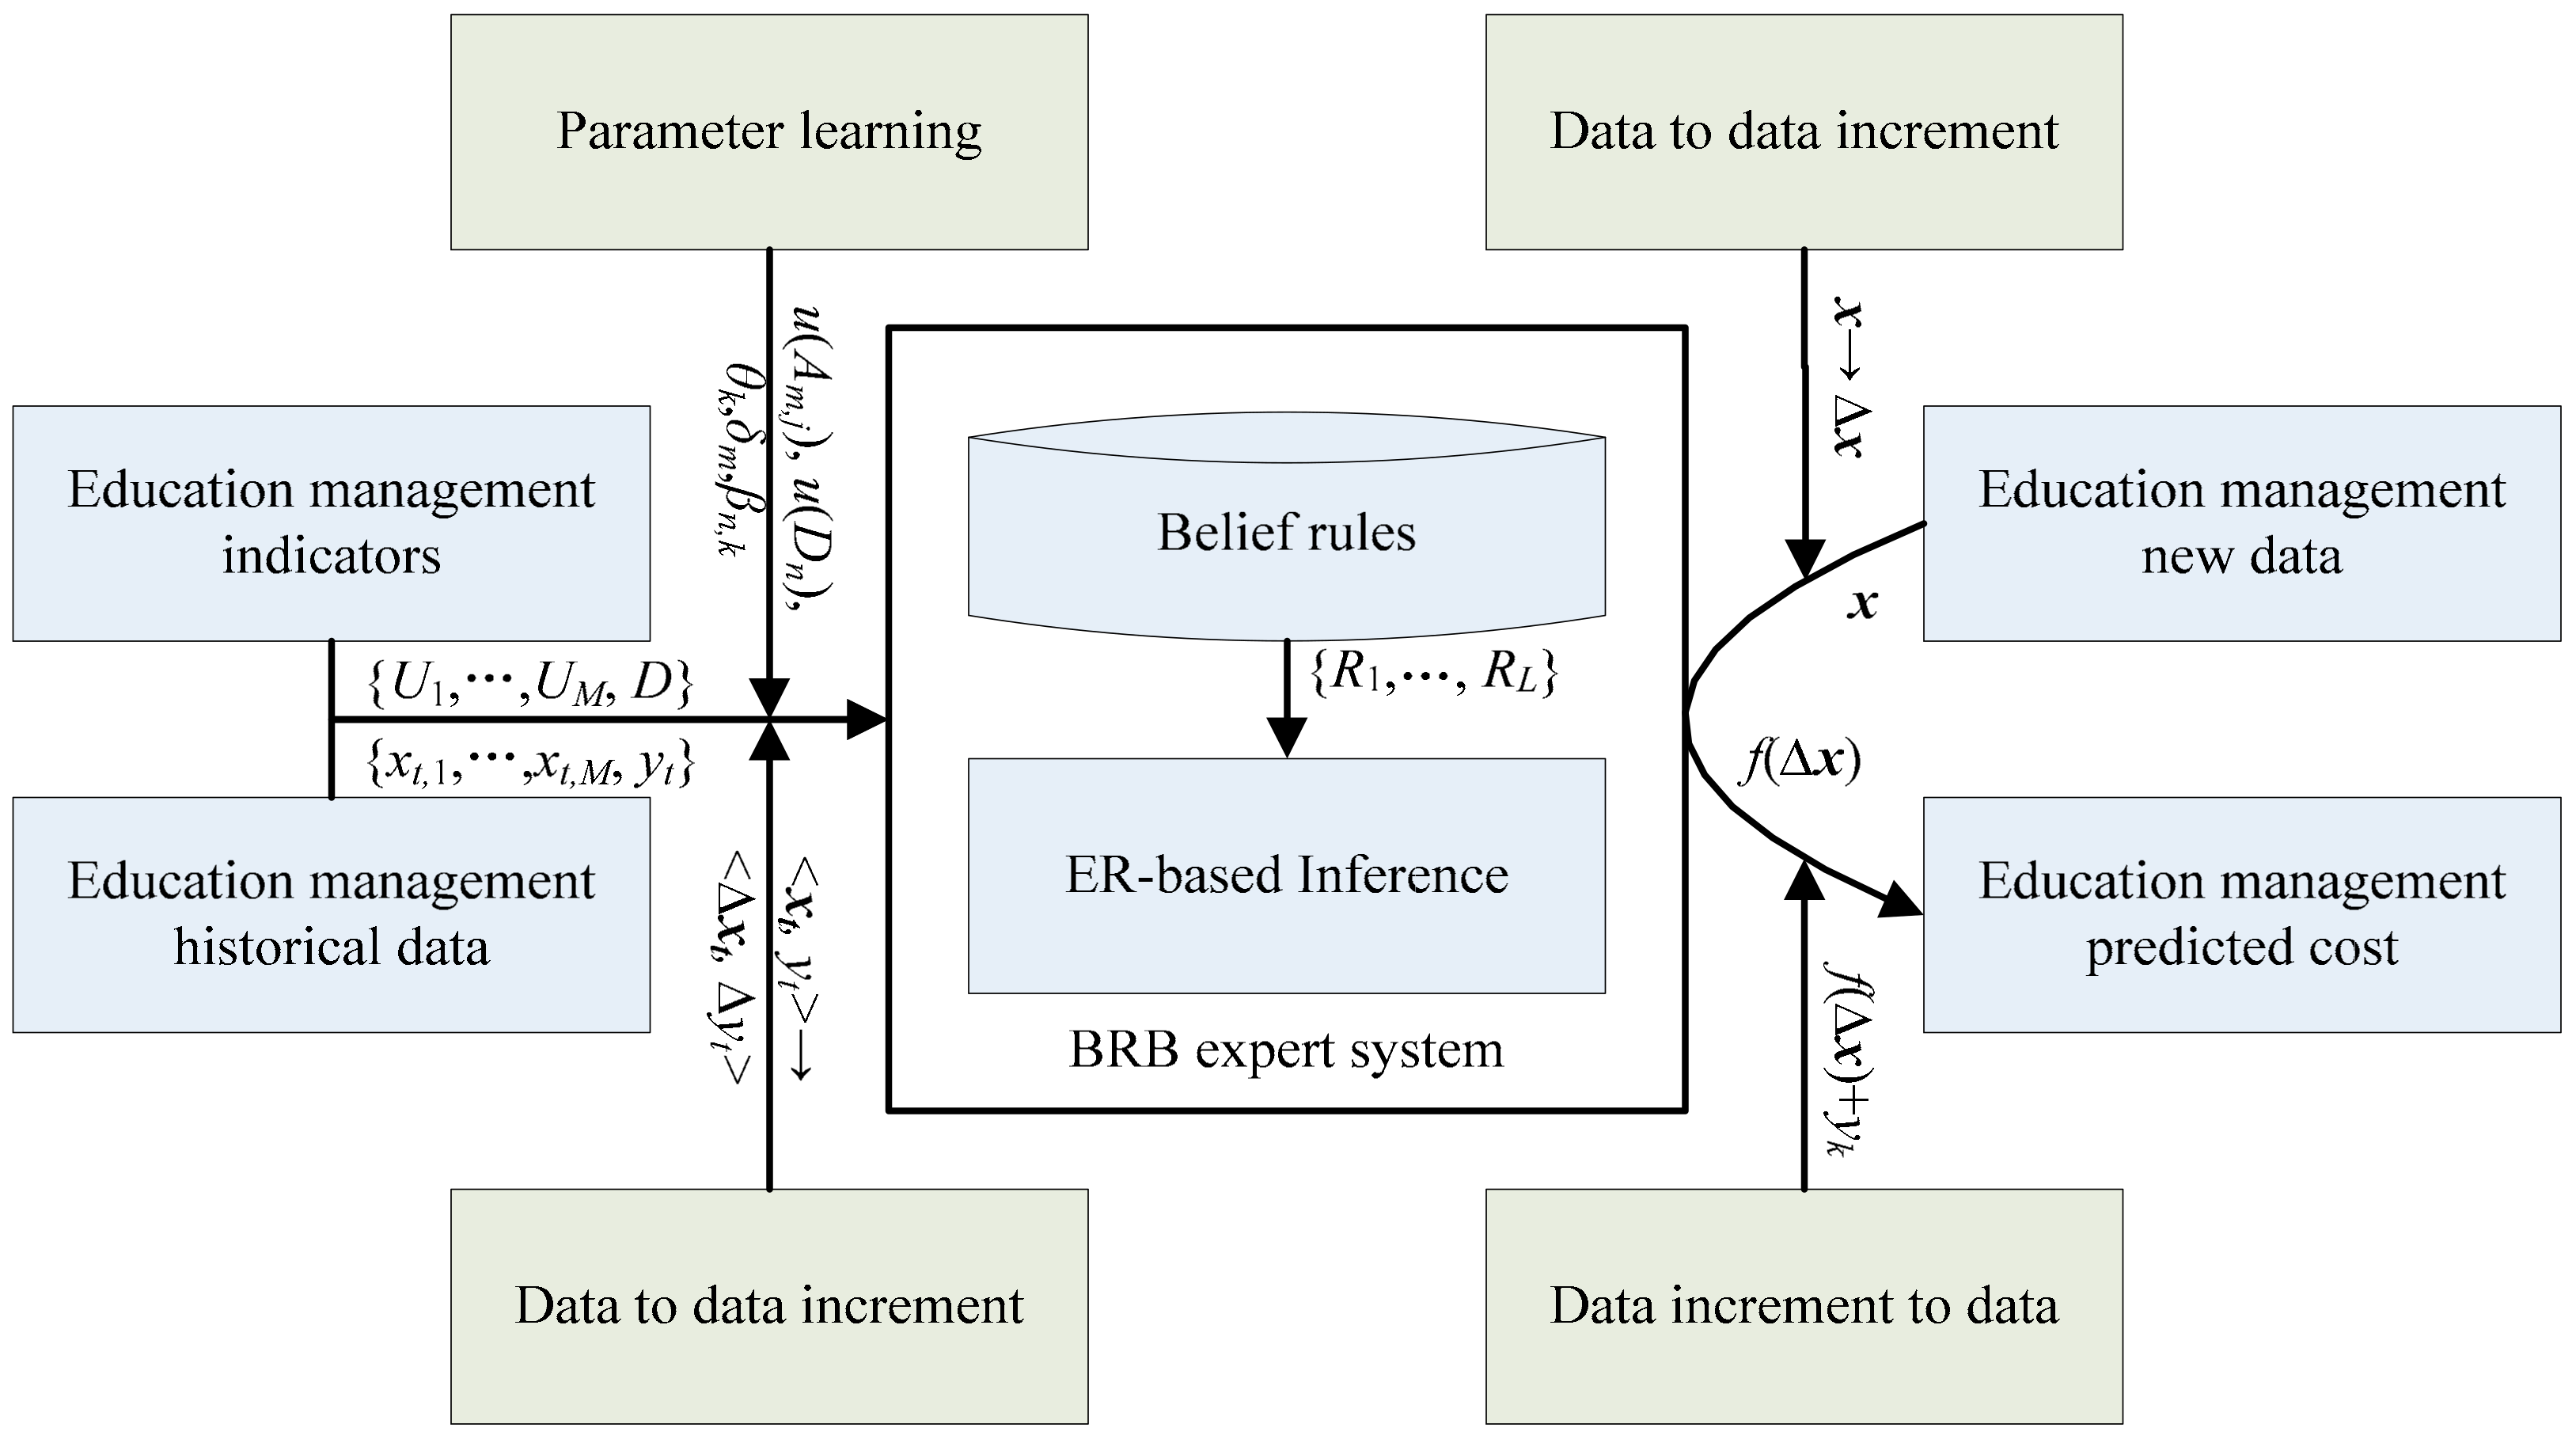
- The BRB expert system takes into consideration the IF-THEN rule with embedding belief structure into THEN part for knowledge representation, in which the IF- THEM rule is one of the most common forms for expressing various types of know- ledge [10]; therefore, it makes the EBRB expert system more powerful in keeping human knowledge. Moreover, the use of belief structure further extends the ability of traditional IF-THEN rules to represent a variety of uncertain information [11].
- The BRB expert system is a data-driven, knowledge-driven, or hybrid-driven model, and its rule base is constructed using historical data and expert knowledge. Meanwhile, the BRB expert system takes the ER algorithm [12] as an inference engine for rule reasoning; therefore, it can not only achieve knowledge fusion with uncertain information but also have transparent rule integration process. All these components form a powerful expert system for handling complex practical problems.
- The BRB expert system belongs to a “white box” model, which mainly refers to the visible modeling and inference processes, especially because of the fact that domain experts can participate in these processes. The inferential results of the BRB expert system have good traceability and interpretability so that decision makers can fully understand and explain its working principle more easily when applying BRB expert systems.
2. Preliminaries for Education Management Cost Prediction
2.1. Brief Review of the BRB Expert System
2.2. Optimization of BRB Expert System
2.3. Inference of BRB Expert System
3. Education Management Cost Prediction Based on the BRB Expert System
4. Empirical Analysis on China Education Management Cost Planning
4.1. Data Collection and Indicator Explanation
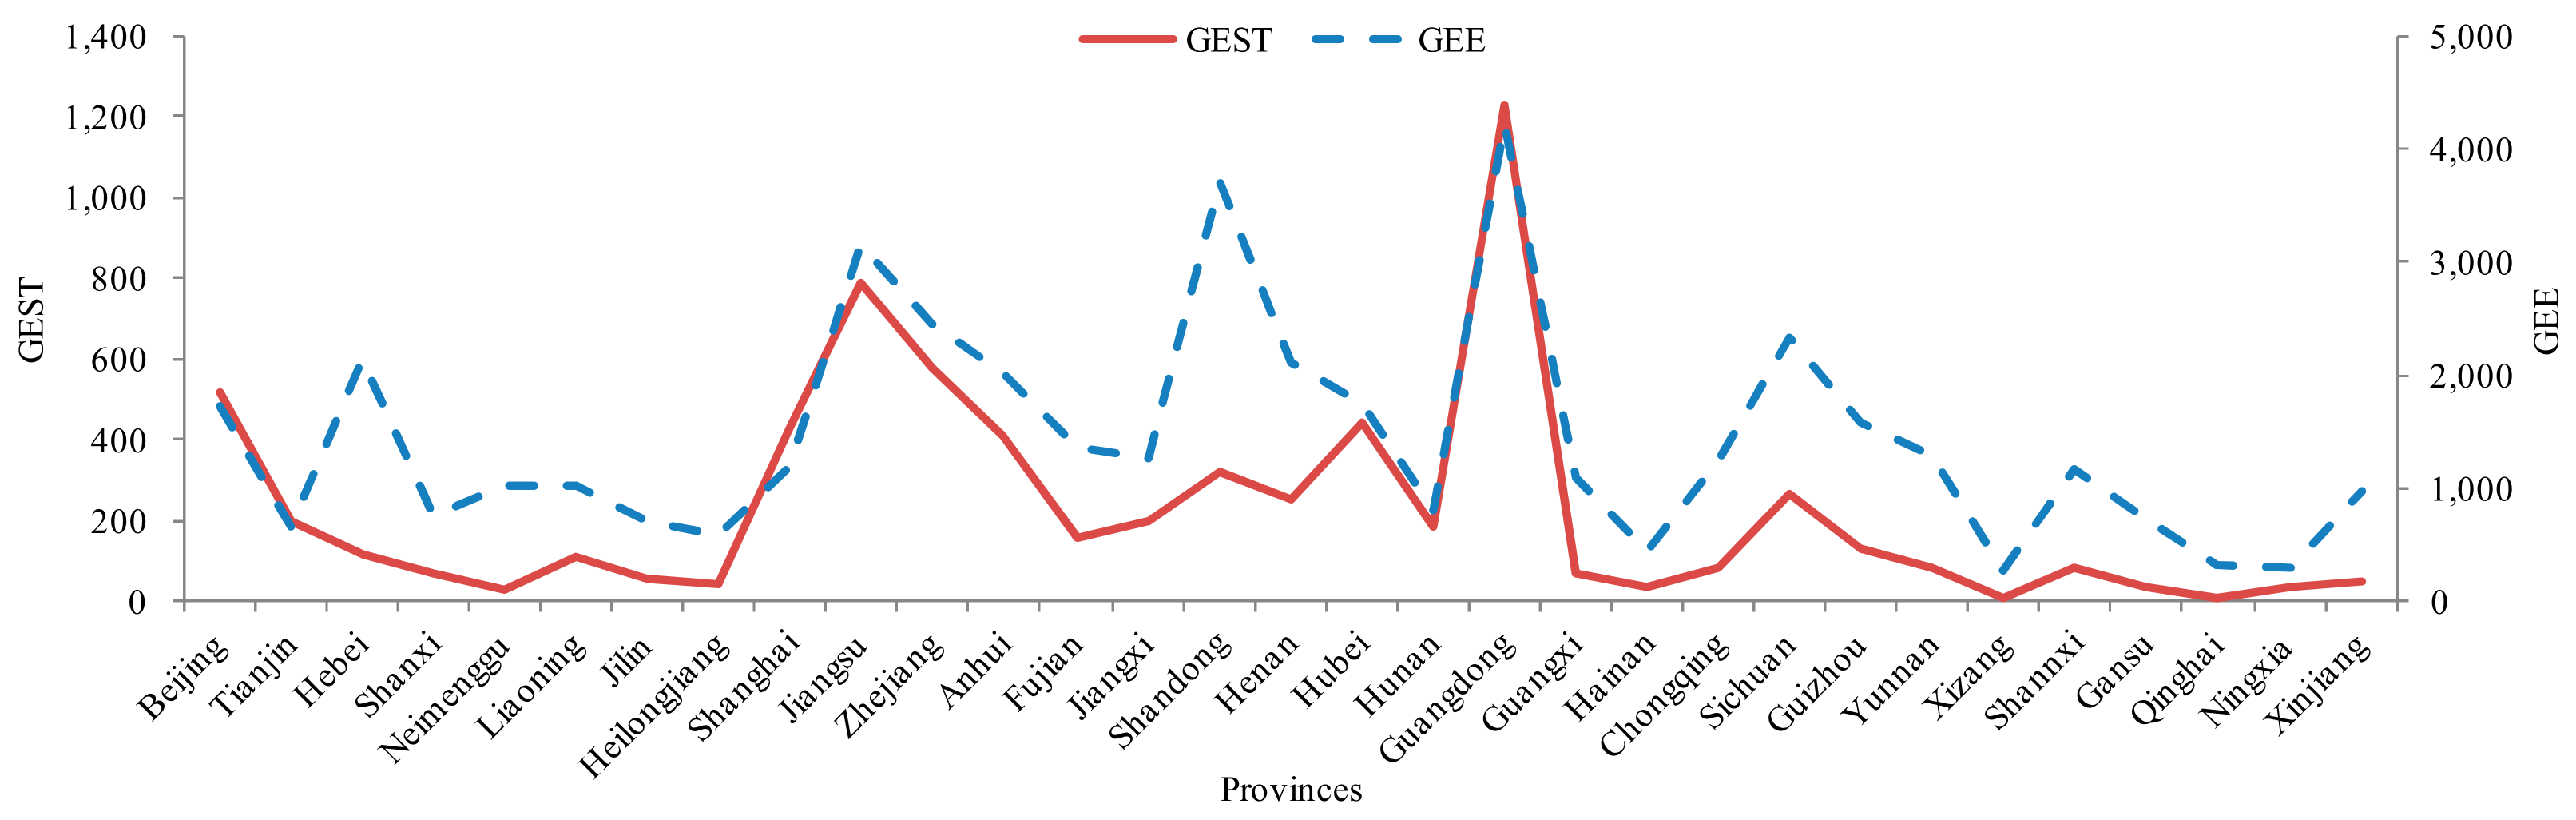
4.2. Analysis of Education Management Cost Investments during 2001–2019
4.3. Verification of BRB Expert System for Cost Prediction
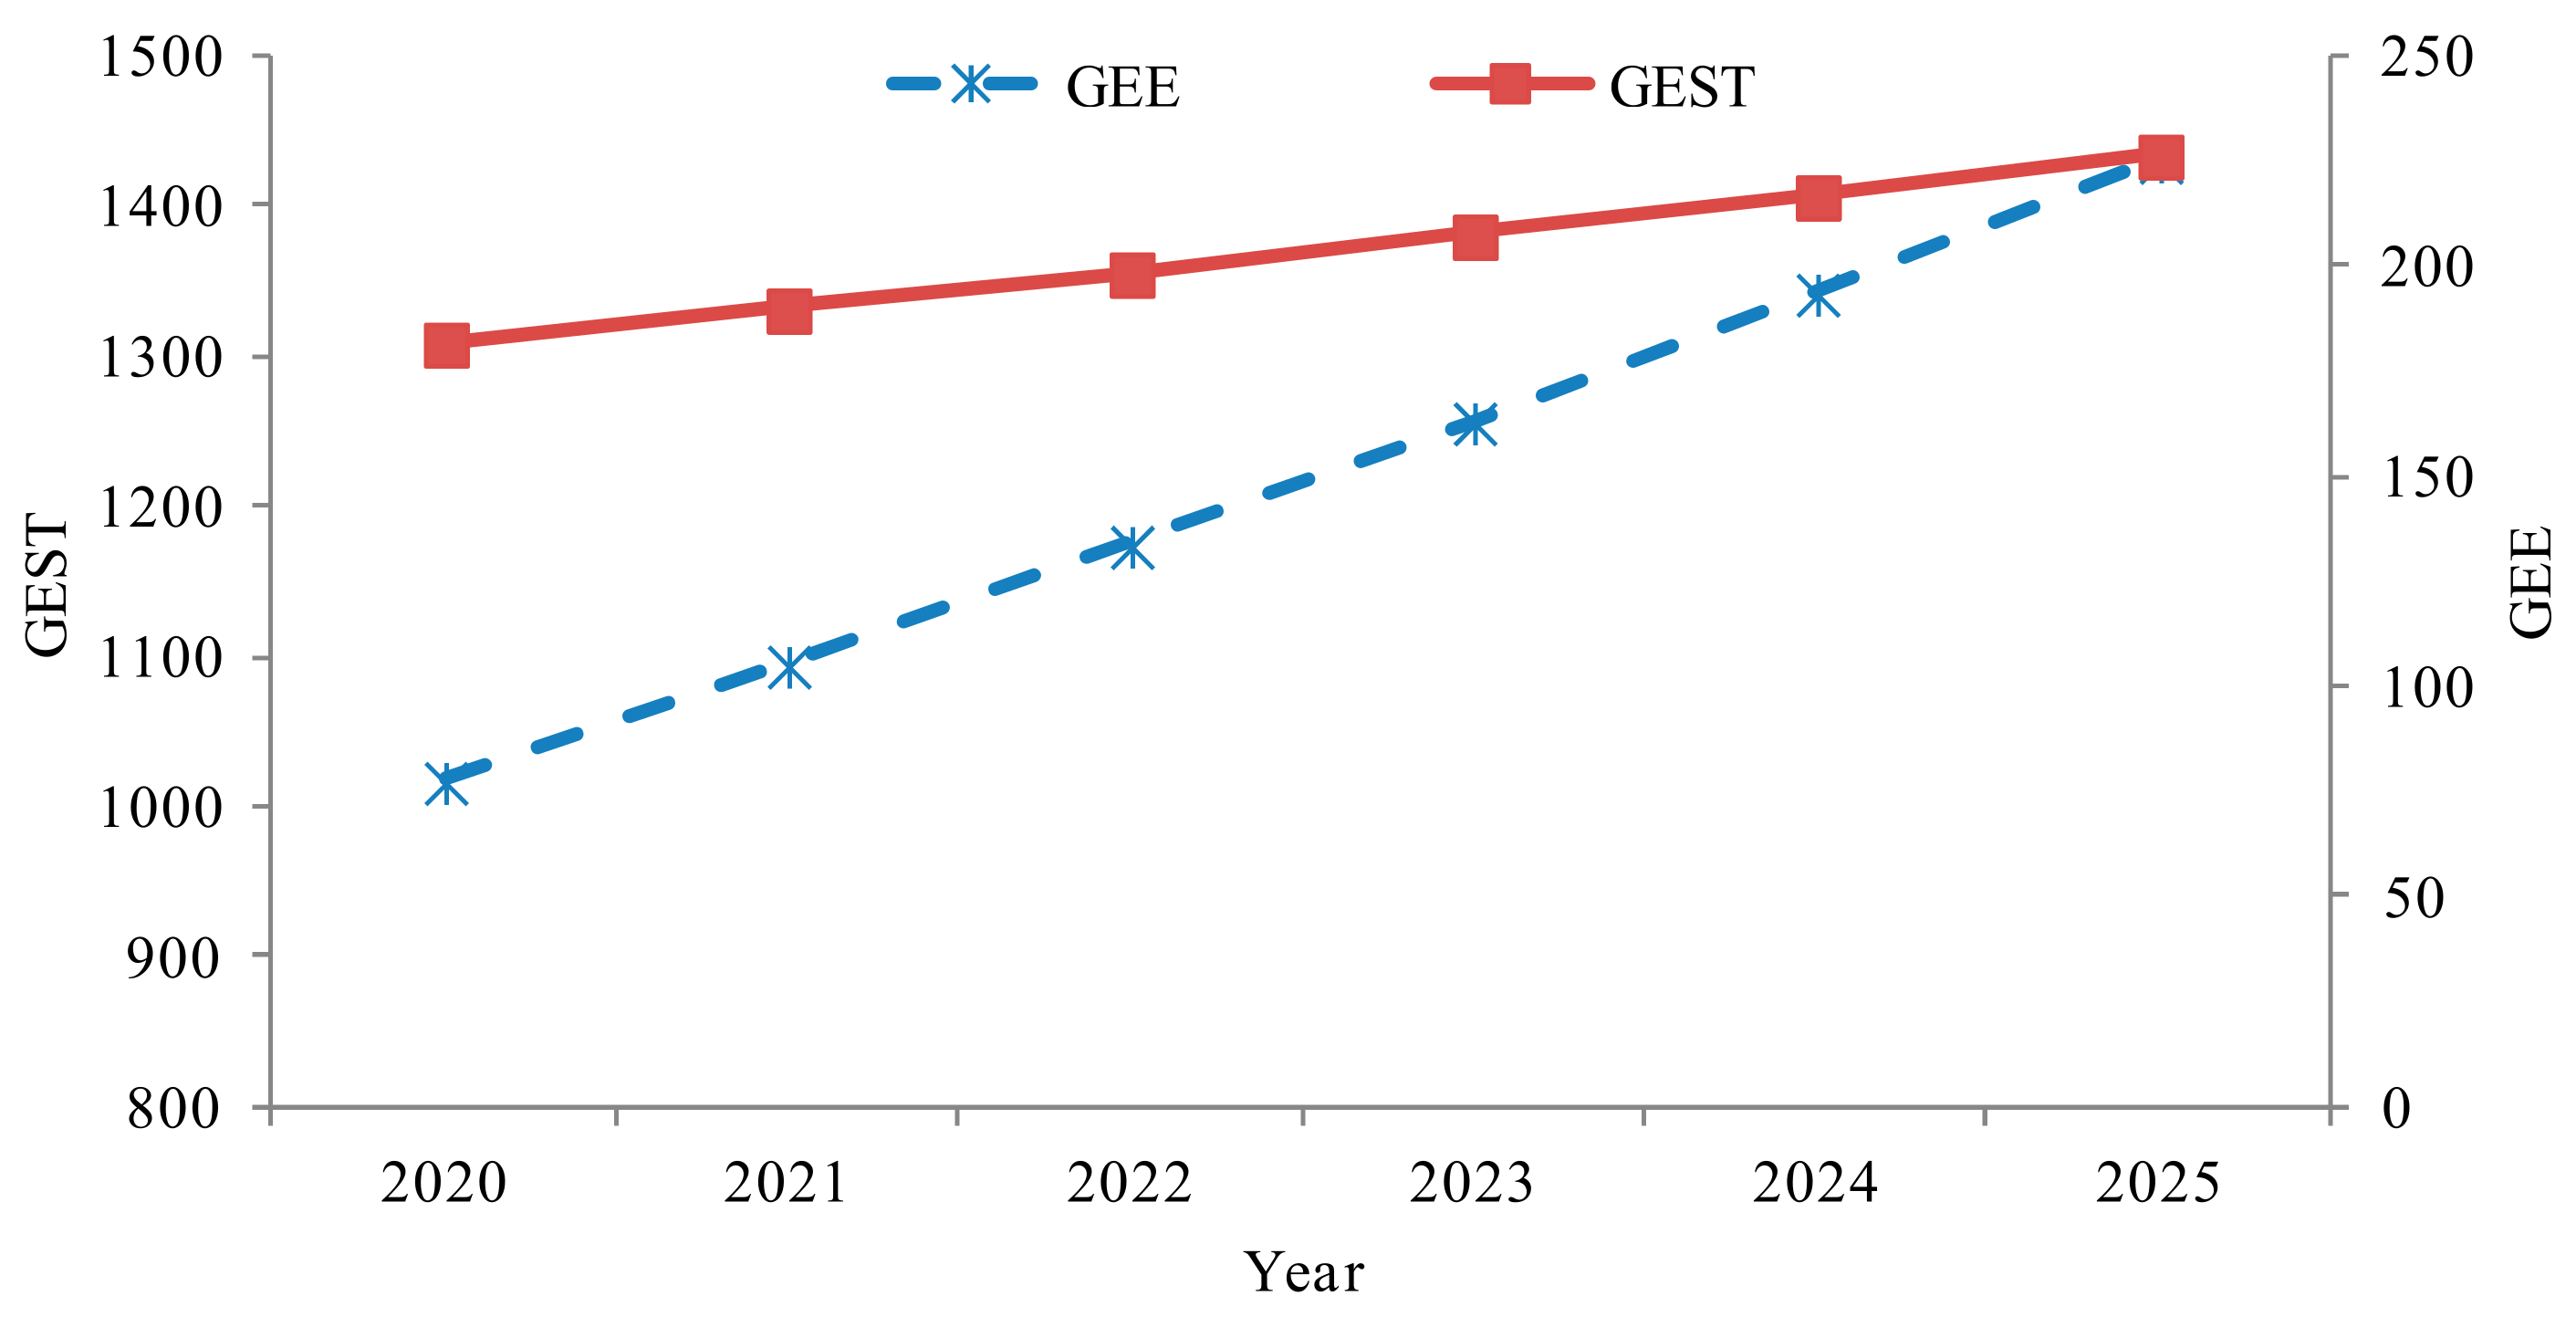
4.4. Analysis of Future Education Management Cost Planning
5. Discussions
6. Conclusions
6.1. Theoretical Implications
- (1)
- Due to the problem of sparse data in the field of education management cost prediction, the system modeling has to suffer from the over-fitting problem. The data increment of education management input and output indicators were used to enrich data for modeling expert system, and the resulting BRB expert system is able to overcome the over-fitting problem.
- (2)
- To overcome the subjectivity of parameters given by experts, the global parameter learning model was introduced to enhance the BRB expert system construction, so that the parameter values of the BRB expert system can be optimized according to the historical education management input and output data.
- (3)
- The results of comparative studies demonstrated that the data increment and parameter learning could effectively improve the performance of the BRB expert system. The government expenditures on education, science, and technology predicted by the BRB expert system were much lower than the other prediction models.
6.2. Policy Suggestions
- (1)
- To optimize the setting of professional knowledge learning in universities based on the demand of economic market and social development, the course learning in universities for R&D talents should be improved and designed according to the current market environment and industry demand, so that they can better understand the market demand and master relevant professional technology through school–enterprise cooperation and exchange, so as to make up for the shortage of professional technicians in relevant fields in the market.
- (2)
- To advocate expanding teaching and to cultivate R&D talents’ basic quality and professional skills for social practice by relying on the practice carrier outside the universities professional classroom, so that they can train professional skills and improve practical ability in expanding teaching.
- (3)
- To establish a diversified training mode for R&D talents, and adopt a variety of talent training methods to improve the innovation of scientific and technological capability is an important strategy for R&D talents training in China universities. Decision makers of education management should also pay attention to improve the professional and technical level of R&D talents so as to ensure that the talents trained in universities can be truly applicable to new products and technologies innovation of actual economic activities.
6.3. Limitations and Future Researches
Author Contributions
Funding
Institutional Review Board Statement
Informed Consent Statement
Data Availability Statement
Conflicts of Interest
References
- China National Bureau of Statistics. Available online: http://www.stats.gov.cn/tjsj/ndsj/ (accessed on 25 August 2021).
- Wang, H.; Wei, A.M. Talent Demand and Training Strategy of Oceangoing Cruise Company Based on Customized Talent Development Model. J. Coast. Res. 2020, 106, 233–236. [Google Scholar] [CrossRef]
- Zheng, C.B.; Zhou, W.R. Research on Information Construction and Management of Education Management Based on Data Mining. J. Phys. Conf. Ser. 2021, 1881, 042073. [Google Scholar] [CrossRef]
- Narendra, U.P.; Prabhakar, M.; Pradeep, B.S. Framework for knowledge management on education. Int. J. Adv. Sci. Technol. 2020, 129, 2122–2128. [Google Scholar]
- Alexandra, G.R.; Lauren, L.; Jesse, D. Training across the academy: The impact of R&D funding on graduate students. Res. Policy 2021, 50, 104224. [Google Scholar]
- Kim, W.J.; Hoi, T.V.; Tuan, L.N.; Trung, N.N. R&D, training and accessibility to finance for innovation: A case of Vietnam, the country in transition. Asian J. Technol. Innov. 2019, 27, 172–193. [Google Scholar]
- Chang, L.L.; Zhang, L.M. Explainable data-driven optimization for complex systems with non-preferential multiple outputs using belief rule base. Appl. Soft Comput. 2021, 110, 1–13. [Google Scholar] [CrossRef]
- Zhou, Z.J.; Hu, G.Y.; Hu, C.H.; Wen, C.L.; Chang, L.L. A Survey of Belief Rule-Base Expert System. IEEE Trans. Syst. Man Cybern. Syst. 2021, 51, 4944–4958. [Google Scholar] [CrossRef]
- Yang, J.B.; Liu, J.; Wang, J.; Sii, H.S.; Wang, H.W. Belief rule-base inference methodology using the evidential reasoning approach—RIMER. IEEE Trans. Syst. Man Cybern. Part A Syst. Hum. 2006, 36, 266–285. [Google Scholar] [CrossRef]
- Sun, R. Robust Reasoning: Integrating Rule-Based and Similarity-Based Reasoning. Artif. Intell. 1995, 75, 241–295. [Google Scholar] [CrossRef]
- Cao, Y.; Zhou, Z.J.; Hu, C.H.; He, W.; Tang, S.W. On the interpretability of belief rule based expert systems. IEEE Trans. Fuzzy Syst. 2021, 1. [Google Scholar] [CrossRef]
- Wang, Y.M.; Yang, J.B.; Xu, D.L. Environmental impact assessment using the evidential reasoning approach. Eur. J. Oper. Res. 2006, 174, 1885–1913. [Google Scholar] [CrossRef]
- Saura, J.R. Using Data Sciences in Digital Marketing: Framework, methods, and performance metrics. J. Innov. Knowl. 2021, 6, 92–102. [Google Scholar] [CrossRef]
- Saura, J.R.; Paracios-Marques, D.; Iturricha-Fernandez, A. Ethical design in social media: Assessing the main performance measurements of user online behavior modification. J. Bus. Res. 2021, 129, 271–281. [Google Scholar] [CrossRef]
- Wang, S.; Ye, F.F. Environmental Governance Cost Prediction of Transportation Industry by Considering the Technological Constraints. Symmetry Basel 2020, 12, 1352. [Google Scholar] [CrossRef]
- Tang, X.L.; Xiao, M.Q.; Liang, Y.-J.; Zhu, H.Z.; Li, J.F. Online updating belief-rule-base using Bayesian estimation. Knowl. Based Syst. 2019, 171, 93–105. [Google Scholar] [CrossRef]
- Chang, L.L.; Fu, C.; Zhu, W.; Liu, W.-Y. Belief rule mining using the evidential reasoning rule for medical diagnosis. Int. J. Approx. Reason. 2021, 130, 273–291. [Google Scholar] [CrossRef]
- Yang, L.H.; Wang, S.; Ye, F.F.; Liu, J.; Wang, Y.M.; Hu, H. Environmental investment prediction using extended belief rule-based system and evidential reasoning rule. J. Clean. Prod. 2021, 289, 1–19. [Google Scholar] [CrossRef]
- Mohamad, Y.N.; Said, R.; Hook, L.S. Do cost of training, education level and R&D investment matter towards influencing labour Productivity? J. Ekon. Malays. 2014, 48, 133–142. [Google Scholar]
- Ye, F.F.; Yang, L.H.; Wang, Y.M. Fuzzy rule based system with feature extraction for environmental governance cost prediction. J. Intell. Fuzzy Syst. 2019, 37, 2337–2349. [Google Scholar] [CrossRef]
- Ye, F.F.; Yang, L.H.; Wang, Y.M. Cost forecast method of environmental governance based on input-output relationship and efficiency. Control Decis. 2020, 35, 993–1003. [Google Scholar]
- Chen, L.; Wang, Y.-M.; Lai, F.-J.; Feng, F. An investment analysis for China’s sustainable development based on inverse data envelopment analysis. J. Clean. Prod. 2017, 142, 1638–1649. [Google Scholar] [CrossRef]
- Kujal, P.; Juan, R. Cost effectiveness of R&D and strategic trade policy. J. Econ. Anal. Policy 2007, 1, 9–50. [Google Scholar]
- Martínez, N.A.; García, C.E. Innovation performance feedback and technological alliance portfolio diversity: The moderating role of firms’ R&D intensity. Res. Policy 2021, 50, 21–35. [Google Scholar]
- Zhao, B. Strategic Policy on the Development of Higher Education in China. Learn. Educ. 2020, 9, 22–32. [Google Scholar]
- Fomby, P.; KravitzWirtz, N. Family Systems and Parents’ Financial Support for Education in Early Adulthood. Demography 2019, 56, 1875–1897. [Google Scholar] [CrossRef] [PubMed]
- Jeanette, F.; Kristinn, H. Social origin and the financial feasibility of going to university: The role of wage penalties and availability of funding. Stud. High. Educ. 2019, 44, 2025–2040. [Google Scholar]
- Colegrave, A.D.; Giles, M.J. School cost functions: A meta-regression analysis. Econ. Educ. Rev. 2007, 27, 688–696. [Google Scholar] [CrossRef]
- Zheng, W.X. Profit Expectation, Cost Perception, Risk Assessment, and Decision-making for the Integration of Industry and Education. Front. Sustain. Dev. 2021, 1, 1–15. [Google Scholar]
- Zhao, X.J. An Analysis of College Education Cost Accounting under the New Government Accounting System. Front. Educ. Res. 2020, 3, 1–20. [Google Scholar]
- Gao, B. Discussion on The Accounting Method of Students’ Education Cost in Colleges and Universities. Int. J. Educ. Econ. 2020, 3, 22–37. [Google Scholar]
- Pouragha, B.; Arasteh, M.T.; Zarei, E.; Abdolahi, M.; Sheikhbardsiri, H. Cost analysis of education for students in the School of Health of Alborz University of Medical Sciences: An application of activity-based costing technique. J. Educ. Health Promot. 2020, 9, 165. [Google Scholar] [PubMed]
- Saura, J.R.; Ribeiro-Soriano, D.; Palacios-Matques, D. From user-generated data to data-driven innovation: A research agenda to understand user privacy in digital markets. Int. J. Inf. Manag. 2021, 60, 1–13. [Google Scholar] [CrossRef]
- Ribeiro-Navarrete, S.; Saura, J.R.; Palacios-Marques, D. Towards a new era of mass data collection: Assessing pandemic surveillance technologies to preserve user privacy. Technol. Forecast. Soc. Chang. 2021, 167, 1–14. [Google Scholar] [CrossRef] [PubMed]


| Rule No. | Rule Weight | Antecedent Attributes (Weights) | Belief Distribution of Consequent Attribute | |||
|---|---|---|---|---|---|---|
| TMTV (δ1) | NNP (δ2) | Low | Middle | High | ||
| R1 | θ1 | Low | Low | β1,1 | β2,1 | β3,1 |
| R2 | θ2 | Low | Middle | β1,2 | β2,2 | β3,2 |
| R3 | θ3 | Low | High | β1,3 | β2,3 | β3,3 |
| R4 | θ4 | Middle | Low | β1,4 | β2,4 | β3,4 |
| R5 | θ5 | Middle | Middle | β1,5 | β2,5 | β3,5 |
| R6 | θ6 | Middle | High | β1,6 | β2,6 | β3,6 |
| R7 | θ7 | High | Low | β1,7 | β2,7 | β3,7 |
| R8 | θ8 | High | Middle | β1,8 | β2,8 | β3,8 |
| R9 | θ9 | High | High | β1,9 | β2,9 | β3,9 |
| Indicator Name | Abbr. | Corresponding Relationship |
|---|---|---|
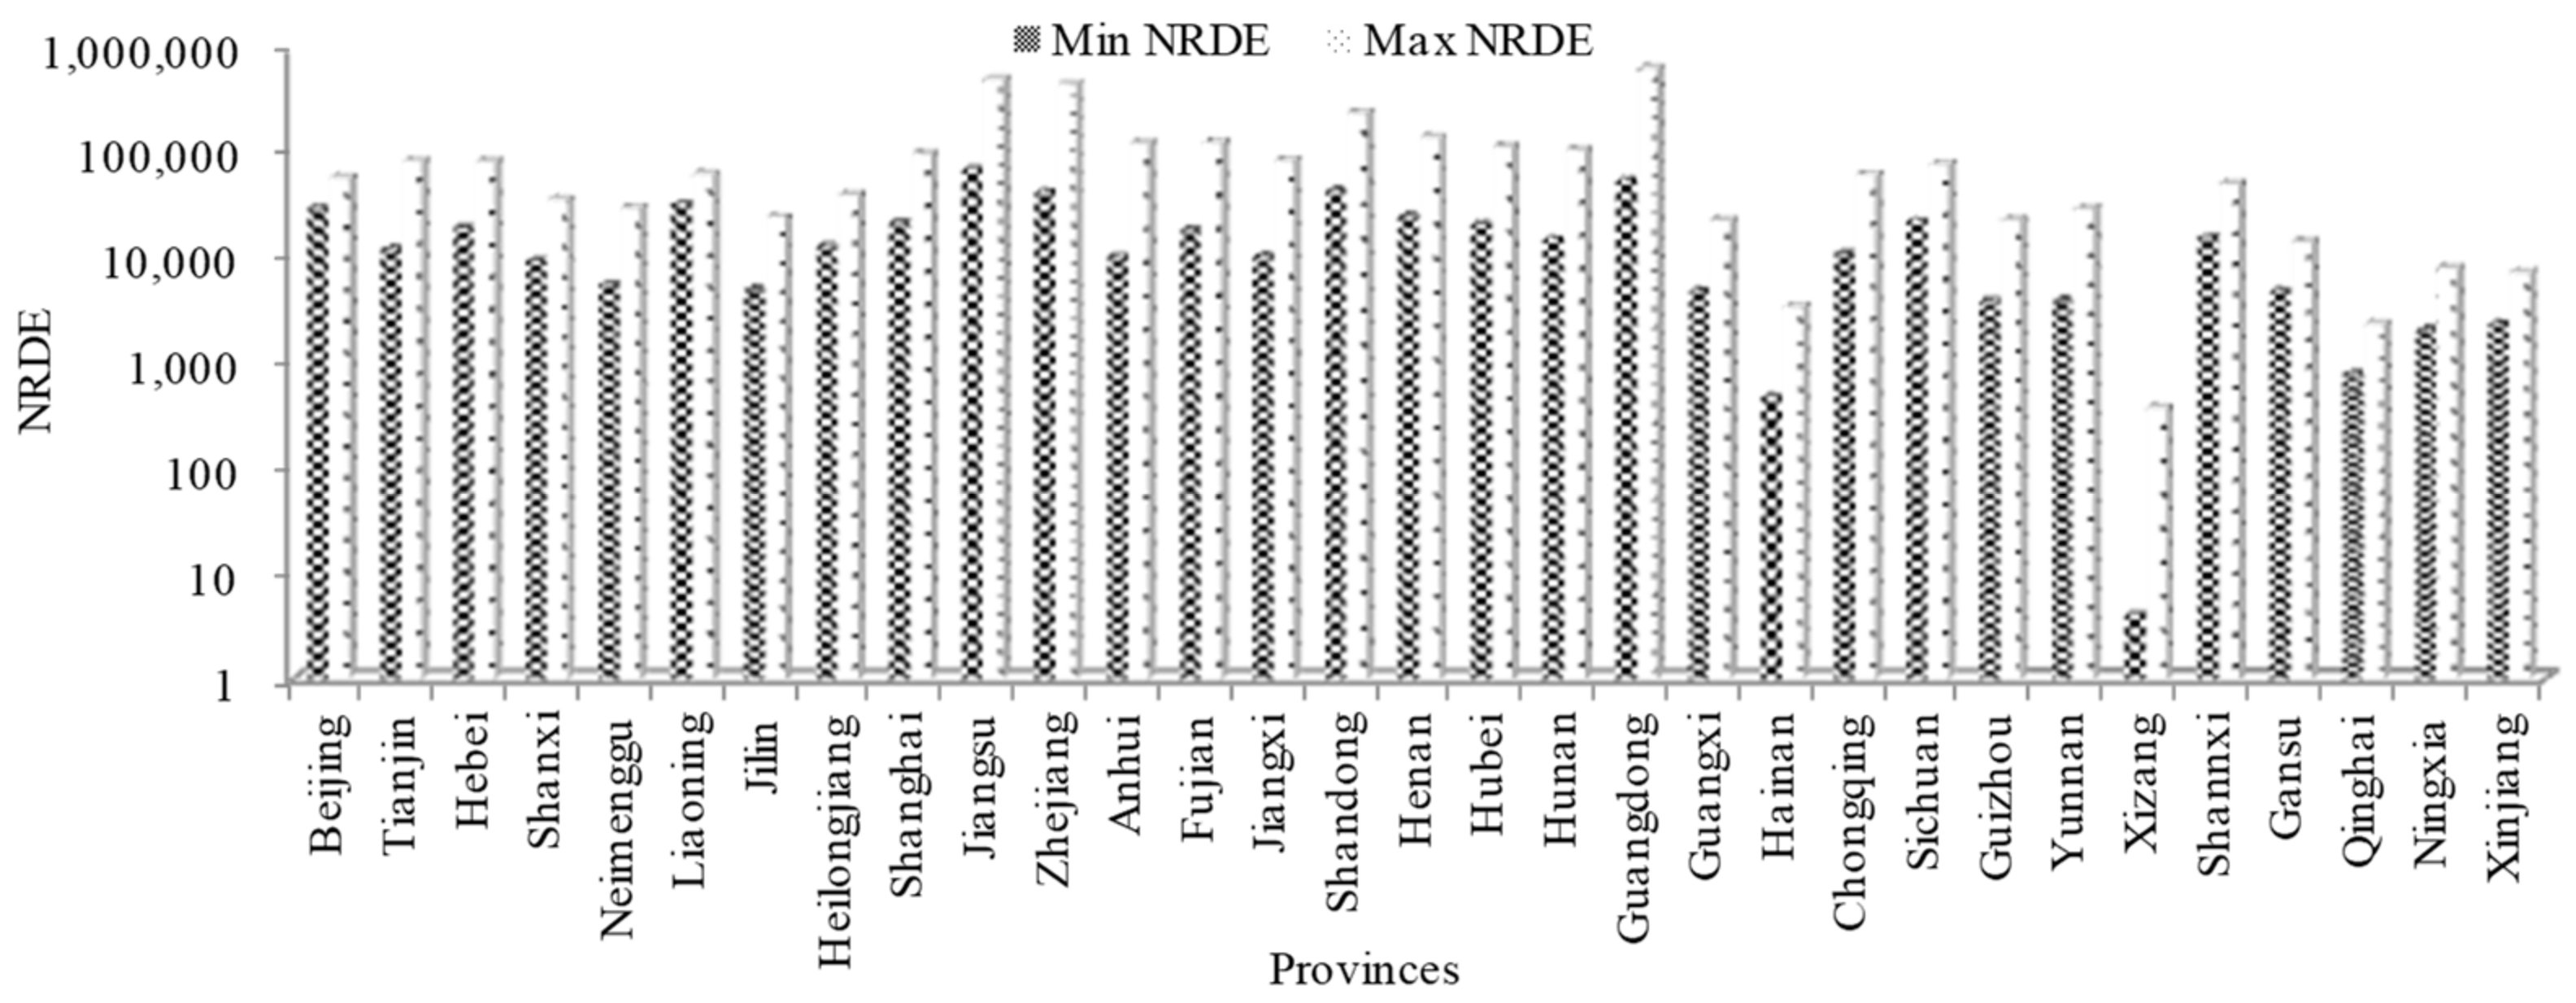
| Number of R&D employees | NRDE | Antecedent |
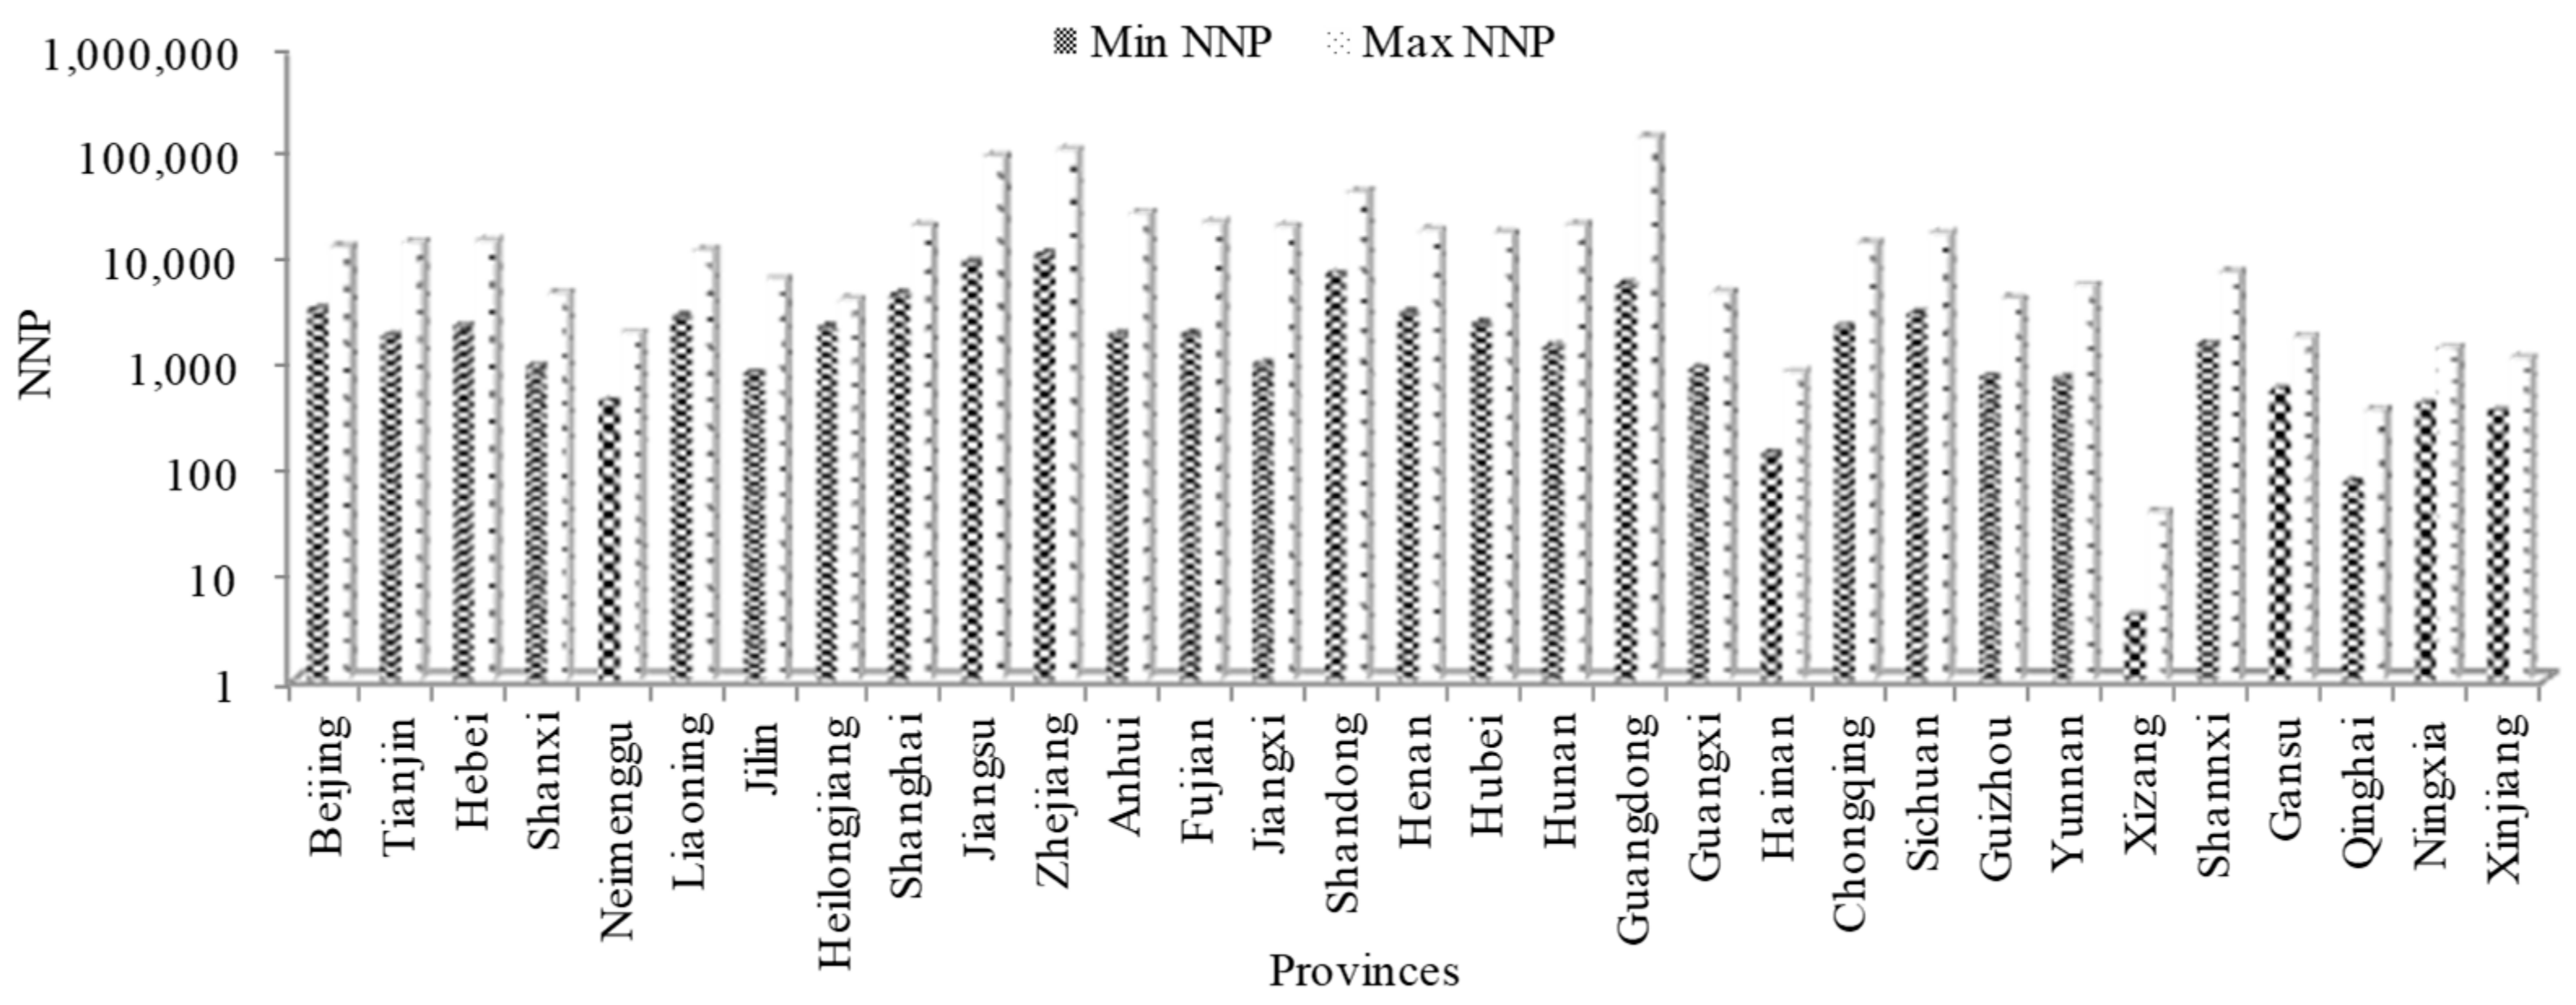
| Number of new products | NNP | Antecedent |
| Number of invention patent applications | NIPA | Antecedent |
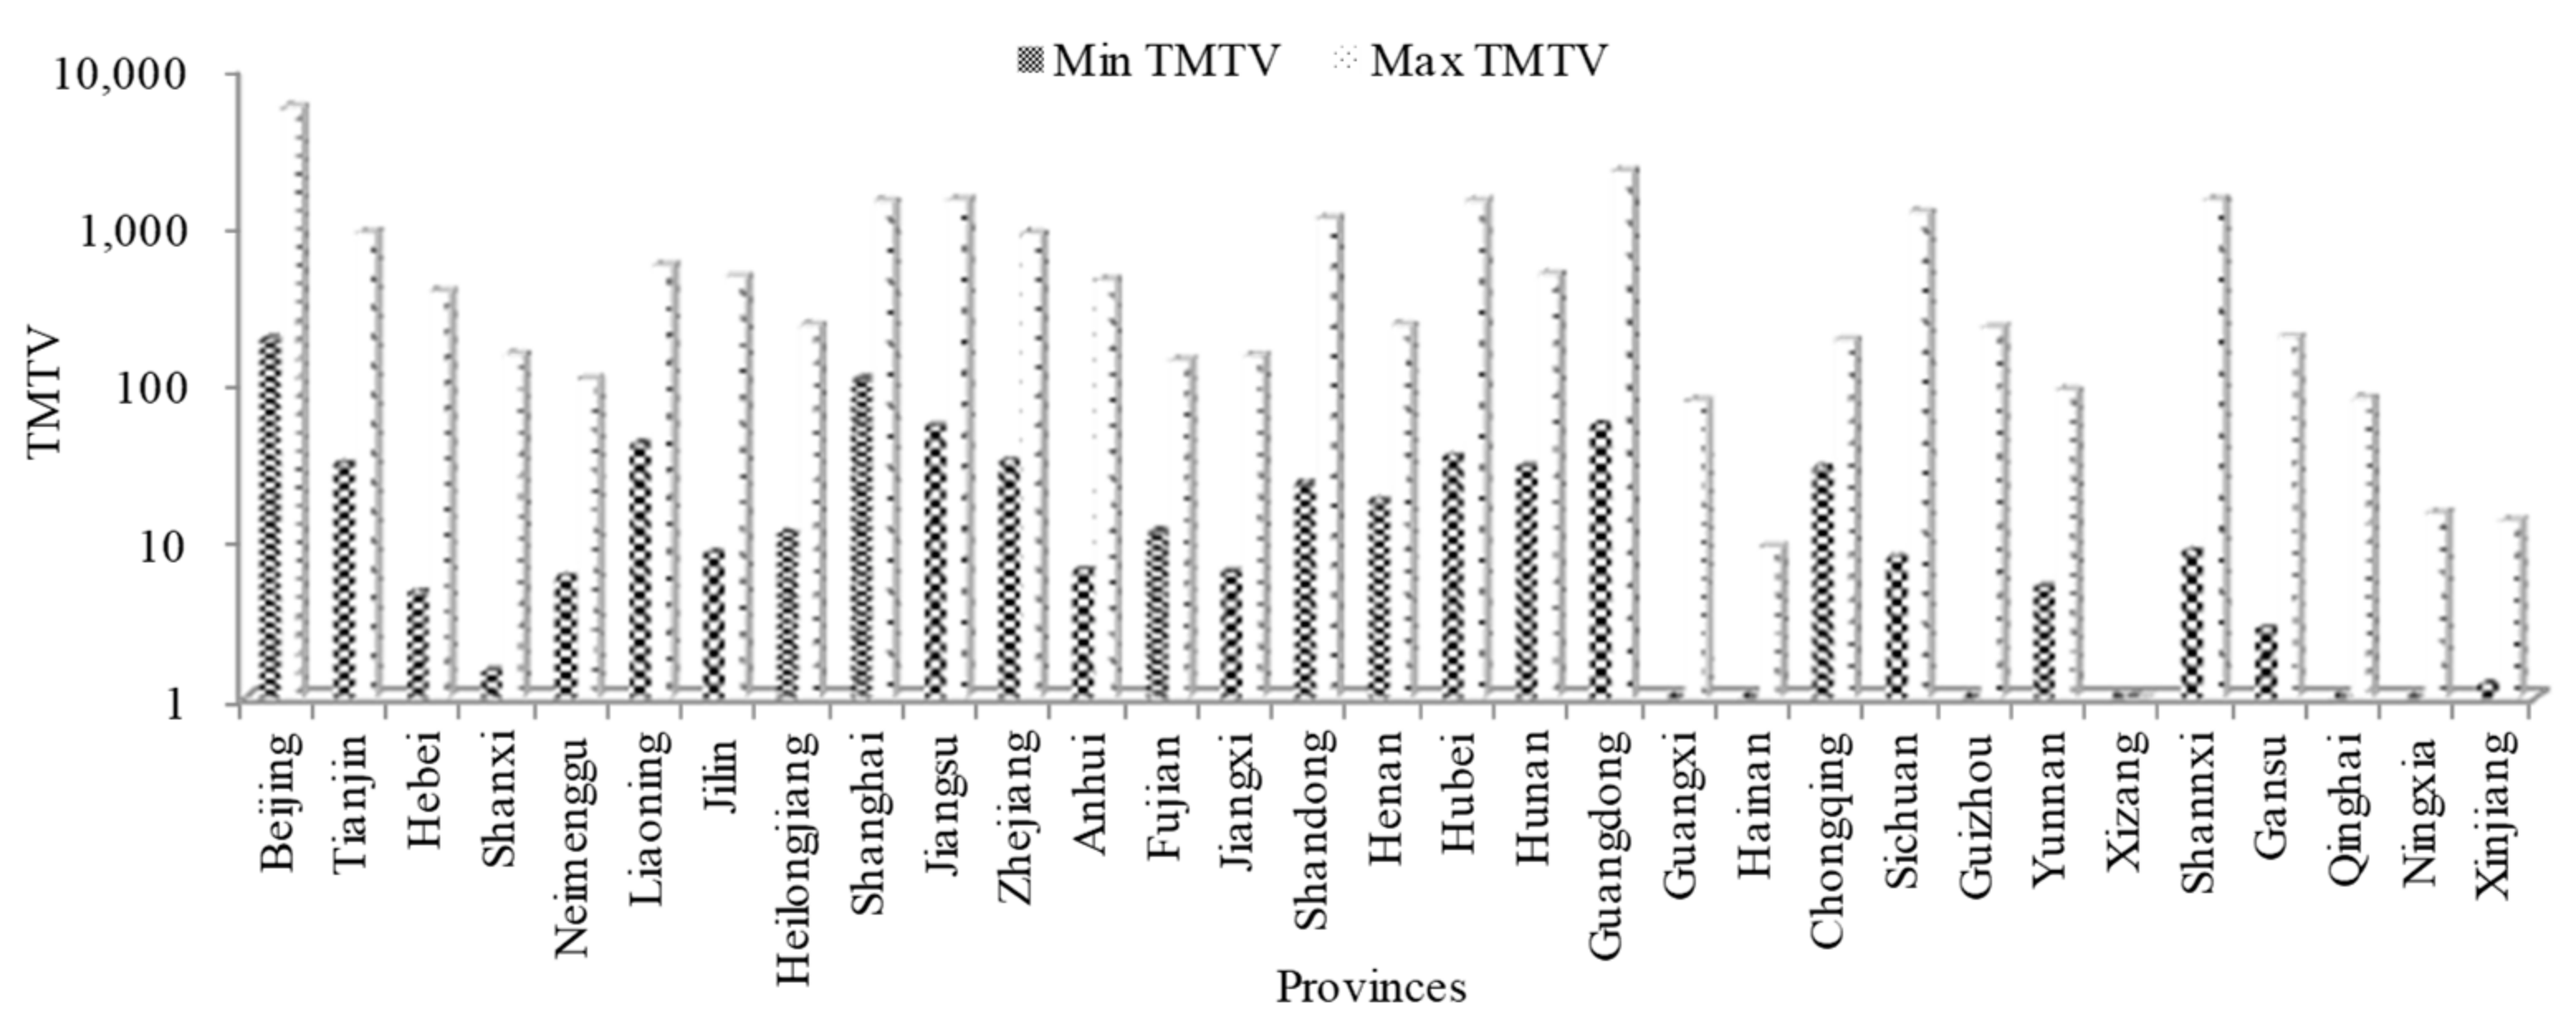
| Technical market transaction volume | TMTV | Antecedent |
| Government expenditure on education | GEE | Consequent |
| Government expenditure on science and technology | GEST | Consequent |
| Predicted Costs | MAE | MAPE | ||||
|---|---|---|---|---|---|---|
| BRB | FRBS | ANFIS | BRB | FRBS | ANFIS | |
| GEE | 82.40 (1) | 164.17 (2) | 2683.36 (3) | 9.62% (1) | 17.57% (2) | 400.76% (3) |
| GEST | 18.59 (1) | 38.81 (2) | 446.91 (3) | 12.99% (1) | 22.74% (2) | 245.18% (3) |
| Predicted Costs | MAE | MAPE | ||||||
|---|---|---|---|---|---|---|---|---|
| BRB | AR | MA | GM | BRB | AR | MA | GM | |
| GEE | 82.40 (2) | 56.27 (1) | 384.16 (4) | 256.94 (3) | 9.62% (2) | 4.45% (1) | 35.22% (4) | 27.43% (3) |
| GEST | 18.59 (1) | 25.27 (2) | 76.82 (4) | 54.86 (3) | 12.99% (1) | 13.21% (2) | 36.92% (4) | 23.09% (3) |
Publisher’s Note: MDPI stays neutral with regard to jurisdictional claims in published maps and institutional affiliations. |
© 2021 by the authors. Licensee MDPI, Basel, Switzerland. This article is an open access article distributed under the terms and conditions of the Creative Commons Attribution (CC BY) license (https://creativecommons.org/licenses/by/4.0/).
Share and Cite
Yang, L.-H.; Liu, B.; Liu, J. Research and Development Talents Training in China Universities—Based on the Consideration of Education Management Cost Planning. Sustainability 2021, 13, 9583. https://doi.org/10.3390/su13179583
Yang L-H, Liu B, Liu J. Research and Development Talents Training in China Universities—Based on the Consideration of Education Management Cost Planning. Sustainability. 2021; 13(17):9583. https://doi.org/10.3390/su13179583
Chicago/Turabian StyleYang, Long-Hao, Biyu Liu, and Jun Liu. 2021. "Research and Development Talents Training in China Universities—Based on the Consideration of Education Management Cost Planning" Sustainability 13, no. 17: 9583. https://doi.org/10.3390/su13179583
APA StyleYang, L.-H., Liu, B., & Liu, J. (2021). Research and Development Talents Training in China Universities—Based on the Consideration of Education Management Cost Planning. Sustainability, 13(17), 9583. https://doi.org/10.3390/su13179583