Article

Factors Affecting the Organizational Adoption of Blockchain Technology: Extending the Technology–Organization–Environment (TOE) Framework in the Australian Context

1
School of Engineering, IT and Physical Sciences, Federation University Australia, Mount Helen, VIC 3350, Australia
2
Department of Information Systems, Carnegie Mellon University, Doha P.O. Box 24866, Qatar
*
Author to whom correspondence should be addressed.
Sustainability 2021, 13(16), 9404; https://doi.org/10.3390/su13169404
Submission received: 21 June 2021 / Revised: 14 August 2021 / Accepted: 17 August 2021 / Published: 21 August 2021

Abstract

:
Blockchain technology (BCT) has been gaining popularity due to its benefits for almost every industry. However, despite its benefits, the organizational adoption of BCT is rather limited. This lack of uptake motivated us to identify the factors that influence the adoption of BCT from an organizational perspective. In doing this, we reviewed the BCT literature, interviewed BCT experts, and proposed a research model based on the TOE framework. Specifically, we theorized the role of technological (perceived benefits, compatibility, information transparency, and disintermediation), organizational (organization innovativeness, organizational learning capability, and top management support), and environmental (competition intensity, government support, trading partners readiness, and standards uncertainty) factors in the organizational adoption of BCT in Australia. We confirmed the model with a sample of adopters and potential adopter organizations in Australia. The results show a significant role of the proposed factors in the organizational adoption of BCT in Australia. Additionally, we found that the relationship between the influential factors and BCT adoption is moderated by “perceived risks”. The study extends the TOE framework by adding factors that were ignored in previous studies on BCT adoption, such as perceived information transparency, perceived disintermediation, organizational innovativeness, organizational learning capability, and standards uncertainty.

1. Introduction

Blockchain technology (BCT) is a new type of distributed and decentralized database that is managed by the participating entities called nodes. The entities manage the data without the involvement of any central controlling authority. Each node over the BCT network stores the same copy of the entire database. The network is run by the mutual consensus among the connected nodes. Initially, this novel and unique way of storing and managing data was developed to solve the double-spending problem in virtual currencies [1]. Later, many different use cases of BCT were proposed, e.g., electronic voting, network security, healthcare, human resource management (HRM), internet of things (IoT), cloud computing, music, supply chain, banking and finance, industry 4.0, and money laundering [2,3,4]. Recently, BCT has disrupted the global economy with the use of cryptocurrencies such as Bitcoin and Ethereum [5]. By using cryptocurrencies, organizations can transfer funds globally without the need for any formal intermediaries such as banks [6]. Many IT and digital experts suggest that BCT will reshape every industry in the future. This is also endorsed by renowned and reliable firms such as Gartner, PwC, Wintergreen, and IDC. They predicted that the BCT market would reach USD 176 billion to USD 3.1 trillion between 2025 and 2030 [7]. According to Underwood [8] and Tapscott and Tapscott [9], BCT has several operational and strategic benefits for organizations. Mohammed, Potdar and Yang [7] and Alzahrani and Daim [10] consider the adoption of BCT a great source of competitive advantage for organizations. Surprisingly, despite all the benefits, actual organizational adoption of BCT all over the globe has not reached a significantly high level [11,12,13,14,15,16]. This lack of uptake motivated us to initiate this research to investigate the factors that influence BCT adoption among Australian organizations. We chose Australian organizations due to their low adoption despite the availability of sufficient technological infrastructure and strong support for BCT from the Australian government and private associations [17,18]. To the best of our knowledge, to date, there is a lack of in-depth empirical research about the factors that influence organizations’ intentions to adopt BCT in Australia [18,19]. Although some prior studies examined the organizational adoption of BCT, their focus was on non-Oceania countries such as Ireland, Malaysia, Germany, etc. [20,21,22]. However, the findings of a study undertaken in one context, e.g., country, cannot be generalized to any other context because every context has its unique characteristics, for instance, technology readiness, networked readiness index, and uncertainty avoidance index [23] as shown in Table 1. Technology readiness and networked readiness indexes represent the level of readiness of a country in terms of the technological infrastructure to adopt new technology whereas uncertainty avoidance refers to how individuals, groups of people, or organizations of a specific country make decisions in new and risky situations. The higher value of the technology readiness index for Australia indicates that Australia is more ready to adopt new technology compared with the other countries. At the same time, it is a more fearful country due to the higher value of uncertainty avoidance.
According to Chandra and Kumar [24], findings of a study conducted in one context serve as a starting point for a study in another context. They further asserted, “it is imperative to study the specific contexts aligned from a firm’s perspective”. Thus, this study aims to answer the key research question:
What are the key factors influencing the adoption intention of BCT among Australian organizations?
To answer this research question, we employed a quantitative research approach based on the Technology–Organization–Environment (TOE) framework. An online survey questionnaire, coined under the TOE categories, was sent to the appropriate Australian organizations. The TOE framework has been used in many past studies on BCT adoption, which reflects its suitability for this study. The past studies report various technological, organizational, and environmental factors, e.g., relative advantages, compatibility, complexity, top management support, and competitive pressure that influence BCT adoption. However, the studies provide varying results for the same factor. For example, Clohessy and Acton [22] and Orji, et al. [25] found top management support as a critical factor for the organizational adoption of BCT whereas, Wong, Leong, Hew, Tan and Ooi [21] reported an insignificant effect of the top management support for BCT adoption. Likewise, De Castro, et al. [26] reported the favorable role of government regulations towards the organizational adoption of BCT, whereas, Albrecht, et al. [27] stated that government regulations prevent BCT adoption. This inconstancy in results could be due to the presence of hidden factor(s) that moderate the cause–effect (causal) relationship between the factors [28]. This aspect has not been addressed in previous studies that used the TOE framework for BCT adoption. Baron and Kenny [29] recommend the addition of a moderating variable(s) when the findings of different studies vary for the same variable. They asserted that the moderating variable enhances the understanding of problem and prevents any misleading conclusions. Moreover, the past BCT studies lack the impact of many factors that seem relevant to BCT adoption, for instance, disintermediation and information transparency that are considered the core features of BCT. To address the limitations of the past studies, we extend the traditional TOE framework by incorporating the following new factors:
(i)
Technological factors: information transparency and disintermediation;
(ii)
Organizational factors: organization innovativeness, organizational learning capability;
(iii)
Environmental factors: standards uncertainty, and
(iv)
Moderating factor: perceived risks.
The relevance of the above factors to the organizational adoption of BCT in Australia was found by conducting semi-structured interviews of BCT experts and decision makers from different Australian organizations that had adopted or were in the process of adopting BCT (potential adopters). These factors were further underpinned with the secondary data including the extant literature on BCT adoption, different organizations’ websites, government reports, and white papers. Definitions and further explanations of the above factors are provided in Section 3 of this paper.
The rest of the paper is organized as follows. We provide a literature review on the adoption of BCT, theoretical background including research model and hypotheses, research methodology, and the empirical results followed by a discussion on the findings. The paper concludes with the key findings and their theoretical and practical contributions, presents limitations of the research, and suggests directions for future research.

2. Literature Review

2.1. Adoption of Blockchain Technology

The adoption of BCT brings a significant change to an organization’s internal and external operations [18]. Therefore, the organizational adoption of BCT has gained significant interest from researchers [22]. They have taken the deterministic approach to examine the organizational adoption of BCT. This approach assumes that an organization’s intention to adopt BCT is influenced by a certain number of factors. For example, De Castro, Tanner and Johnston [26] investigated the adoption of BCT in the asset and wealth management industry in South Africa. They found that the relative advantages, computability, complexity, supportive technological environment, characteristics of the industry, and regulations are the main deterministic factors that influence the organizational adoption of BCT; Orji, Kusi-Sarpong, Huang and Vazquez-Brust [25], Dobrovnik, et al. [30], Barnes III and Xiao [31], and Kühn, et al. [32] evaluated the factors that influence BCT adoption in the logistics industry. They identified that the availability of specific BCT tools, infrastructural facility, and government policy and support are the main significant factors for BCT adoption; Wong, et al. [33], Wong, Leong, Hew, Tan and Ooi [21], Bai and Sarkis [34], Kouhizadeh, et al. [35], Ghode, et al. [36], and Kalaitzi, et al. [37] investigated BCT adoption for the supply chain industry. They found relative advantages, complexity, upper management support, cost, market dynamics, competitive pressure, and regulatory support as the influencing factors; Clohessy and Acton [22] found that BCT awareness, top management support, and organization size influence BCT adoption in Ireland. Loklindt, et al. [38], Mohammed, Potdar and Yang [7], Post, et al. [39], Hoxha and Sadiku [40], and Holotiuk and Moormann [20] investigated BCT adoption for the different industries including shipping and land record management. They showed that easy verification of transactions, data accuracy and reliability, and cost reduction influence an organization’s decision to adopt BCT; Kulkarni and Patil [41] and Koster and Borgman [42] mentioned that the firm scope, learning culture, top management, customer readiness, competitive pressure, and government policies influence BCT adoption in banking and the public sector. Moreover, Albrecht, Reichert, Schmid, Strüker, Neumann and Fridgen [27] studied the post-decision stage of the BCT adoption. They found that market power, regulation, transaction speed, transparency and costs, confidentiality, and interoperability were the prominent factors that influence BCT implementation in the energy sector.
During this literature review process, we noted that the factors that influence BCT adoption can be grouped into the TOE categories, namely, technological, organizational, and environmental contexts. Table 2 provides a summary of the factors reported in the published literature on BCT adoption.

2.2. Research Gaps Found in the Published Literature

The following research gaps were observed in the past studies:
(i)
Most of the research on BCT adoption has been conducted in non-Oceania countries and there is little research in the context of the Oceania region, particularly in Australia. Since the countries differ from each other in terms of their contextual and demographic characteristics such as GDP, union density, trade laws, and gender, therefore the findings of studies conducted in other countries cannot be applied in the Australian context.
(ii)
There is an identified inconsistency in the results of the past studies. The studies report a linear relationship between the influencing factors and BCT adoption and ignore the impact of any intervening factor causing that inconsistency in findings.
To overcome these gaps of the past studies, the current study aims to investigate the factors affecting the adoption of BCT among Australian organizations. Moreover, the study inspects the impact of a moderating variable on the relationship between the factors and an organization’s intention to adopt BCT.

2.3. Blockchain Technology in Australia

Australia is a BCT-friendly country where both government and private associations promote the adoption of BCT [43]. Australia started working with BCT when the Standards Australia submitted a proposal to the International Organization for Standardization (ISO) to develop BCT standards in 2016 [44]. Afterward, the Australian government put significant efforts to foster BCT adoption within the country. The most recent initiative of the Australian government is the issuance of the national roadmap for BCT [45]. The CSIRO’s Data61, an Australian research agency, has been working to develop a national BCT network to enhance coordination among the public organizations [46]. The ASX, Australia’s biggest stock exchange, partnered with “Digital Asset Holdings” to develop a private blockchain for the Australian equity market [47]. Blockchain Australia, a private association, has actively been working to encourage the use of BCT among Australian organizations [48]. Australia has all the technological infrastructure that organizations require to embrace innovation such as BCT [49,50]. Gunasekera and Valenzuela [18] and Maroun and Daniel [19] found in their study that the adoption of BCT could enhance the productivity of Australian industries such as finance, grain, and supply chain by 8–10%, resulting in a 2.6% rise in GDP. Garrard and Fielke [51] and Cao, et al. [52] mentioned that the beef sold under an Australian label in different countries is not Australian. To protect Australia’s reputation, they suggested using shipment tracking with BCT to overcome this meat fraud. Monroe, et al. [53] recommended the use of BCT to empower consumers for peer-to-peer energy trading. They asserted that the BCT-enabled energy trading system could enhance the sharing economy in Australia. According to Foth and McQueenie [54], BCT can create many unexpected jobs in regional Australia. Australia is a land of innovators, early adopters, and avid users of innovation [55].
Considering this strong support and potential of BCT, it appears essential for Australian organizations to consider adopting BCT to enhance their business value and performance. However, recent documents issued by the Australian government and renowned firms indicate that Australian organizations have not adopted BCT heavily [49,56,57]. Therefore, the identification of the factors influencing the organizational adoption of BCT in Australia seems important.

3. Research Model and Hypotheses
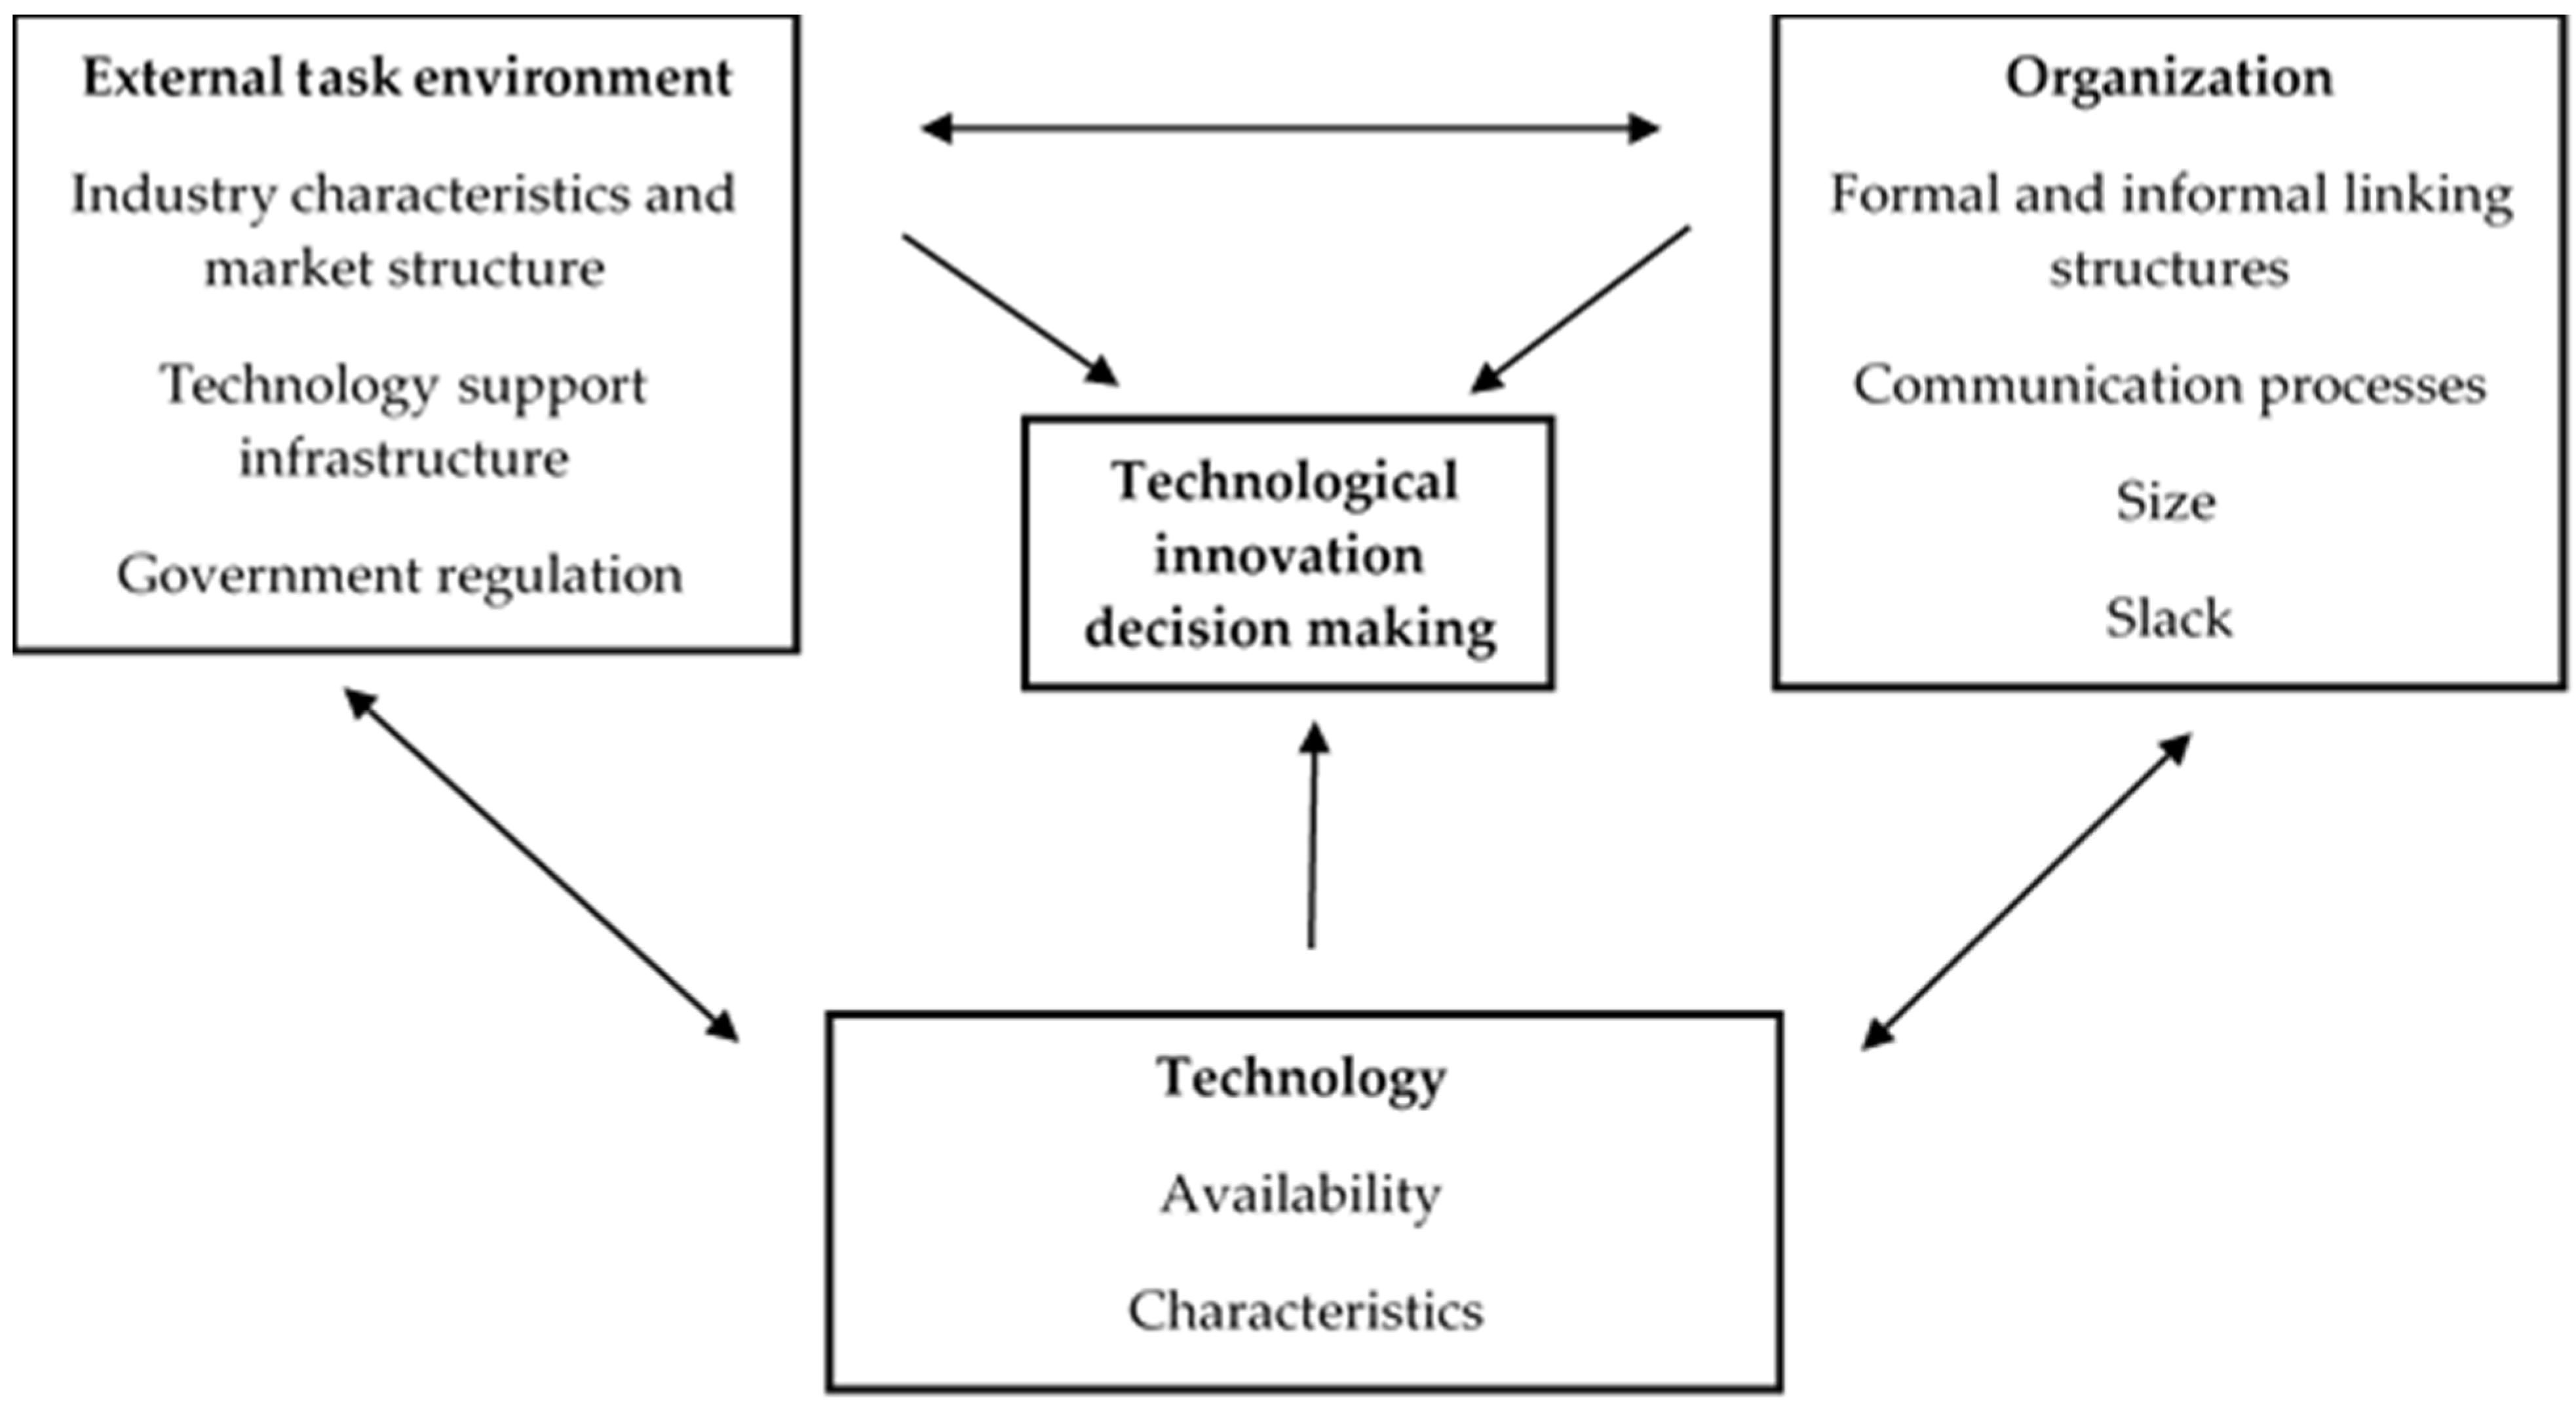
3.1. TOE Framework

From the various options available in the IS literature, we chose the Technology–Organization–Environment (TOE) framework [58] as an underpinning theory to investigate BCT adoption. The TOE framework proposes that an organization’s intention to adopt new technology is influenced by three contextual factors, namely, technology, organization, and the environment as depicted in Figure 1.
The technology context refers to the characteristics of technology that influence its adoption process. The organizational context describes the influence of an organization’s features and resources on innovation adoption decisions. Environmental context states the influence of the external and inter-organizational environment in which an organization operates its business.

Rationale for Choosing the TOE Framework

Although other theories exist that have extensively been used to examine the adoption of different technological innovations at the organizational level [59], such as Diffusion of Innovation (DoI) [60] and Institutional Theory [61], the TOE framework has more explanatory power as explained below:
  • Most of the available IT adoption theories at the organizational level are variants of the TOE framework that either divide or extend its dimensions. For example, the Institutional Theory [61] describes the influence of the environmental perspective on technology adoption that is already part of the TOE framework. Similarly, the DoI theory [60] contains technology and organizational aspects, which are also part of the TOE framework.
  • Since the context is an important aspect of technology adoption, the TOE provides a useful starting point to examine the adoption process where it takes place [62].
  • The TOE is the most validated theory to examine the adoption of new technologies at the organization level [59].
Due to these advantages of the TOE framework, many studies have used it to investigate the organizational adoption of different technologies such as electronic data interchange (EDI), enterprise resource planning (ERP), supply chain management (SCM), customer relationship management (CRM) systems, cloud computing, and e-commerce [59,62]. Thus, the TOE framework was an appropriate choice for this study. The extended version of the TOE framework prepared for this study is presented in Figure 2.
Grouped into the technological, organizational, and environmental contexts of the TOE framework, the following sections explain the factors and their relevant hypotheses developed for this study.

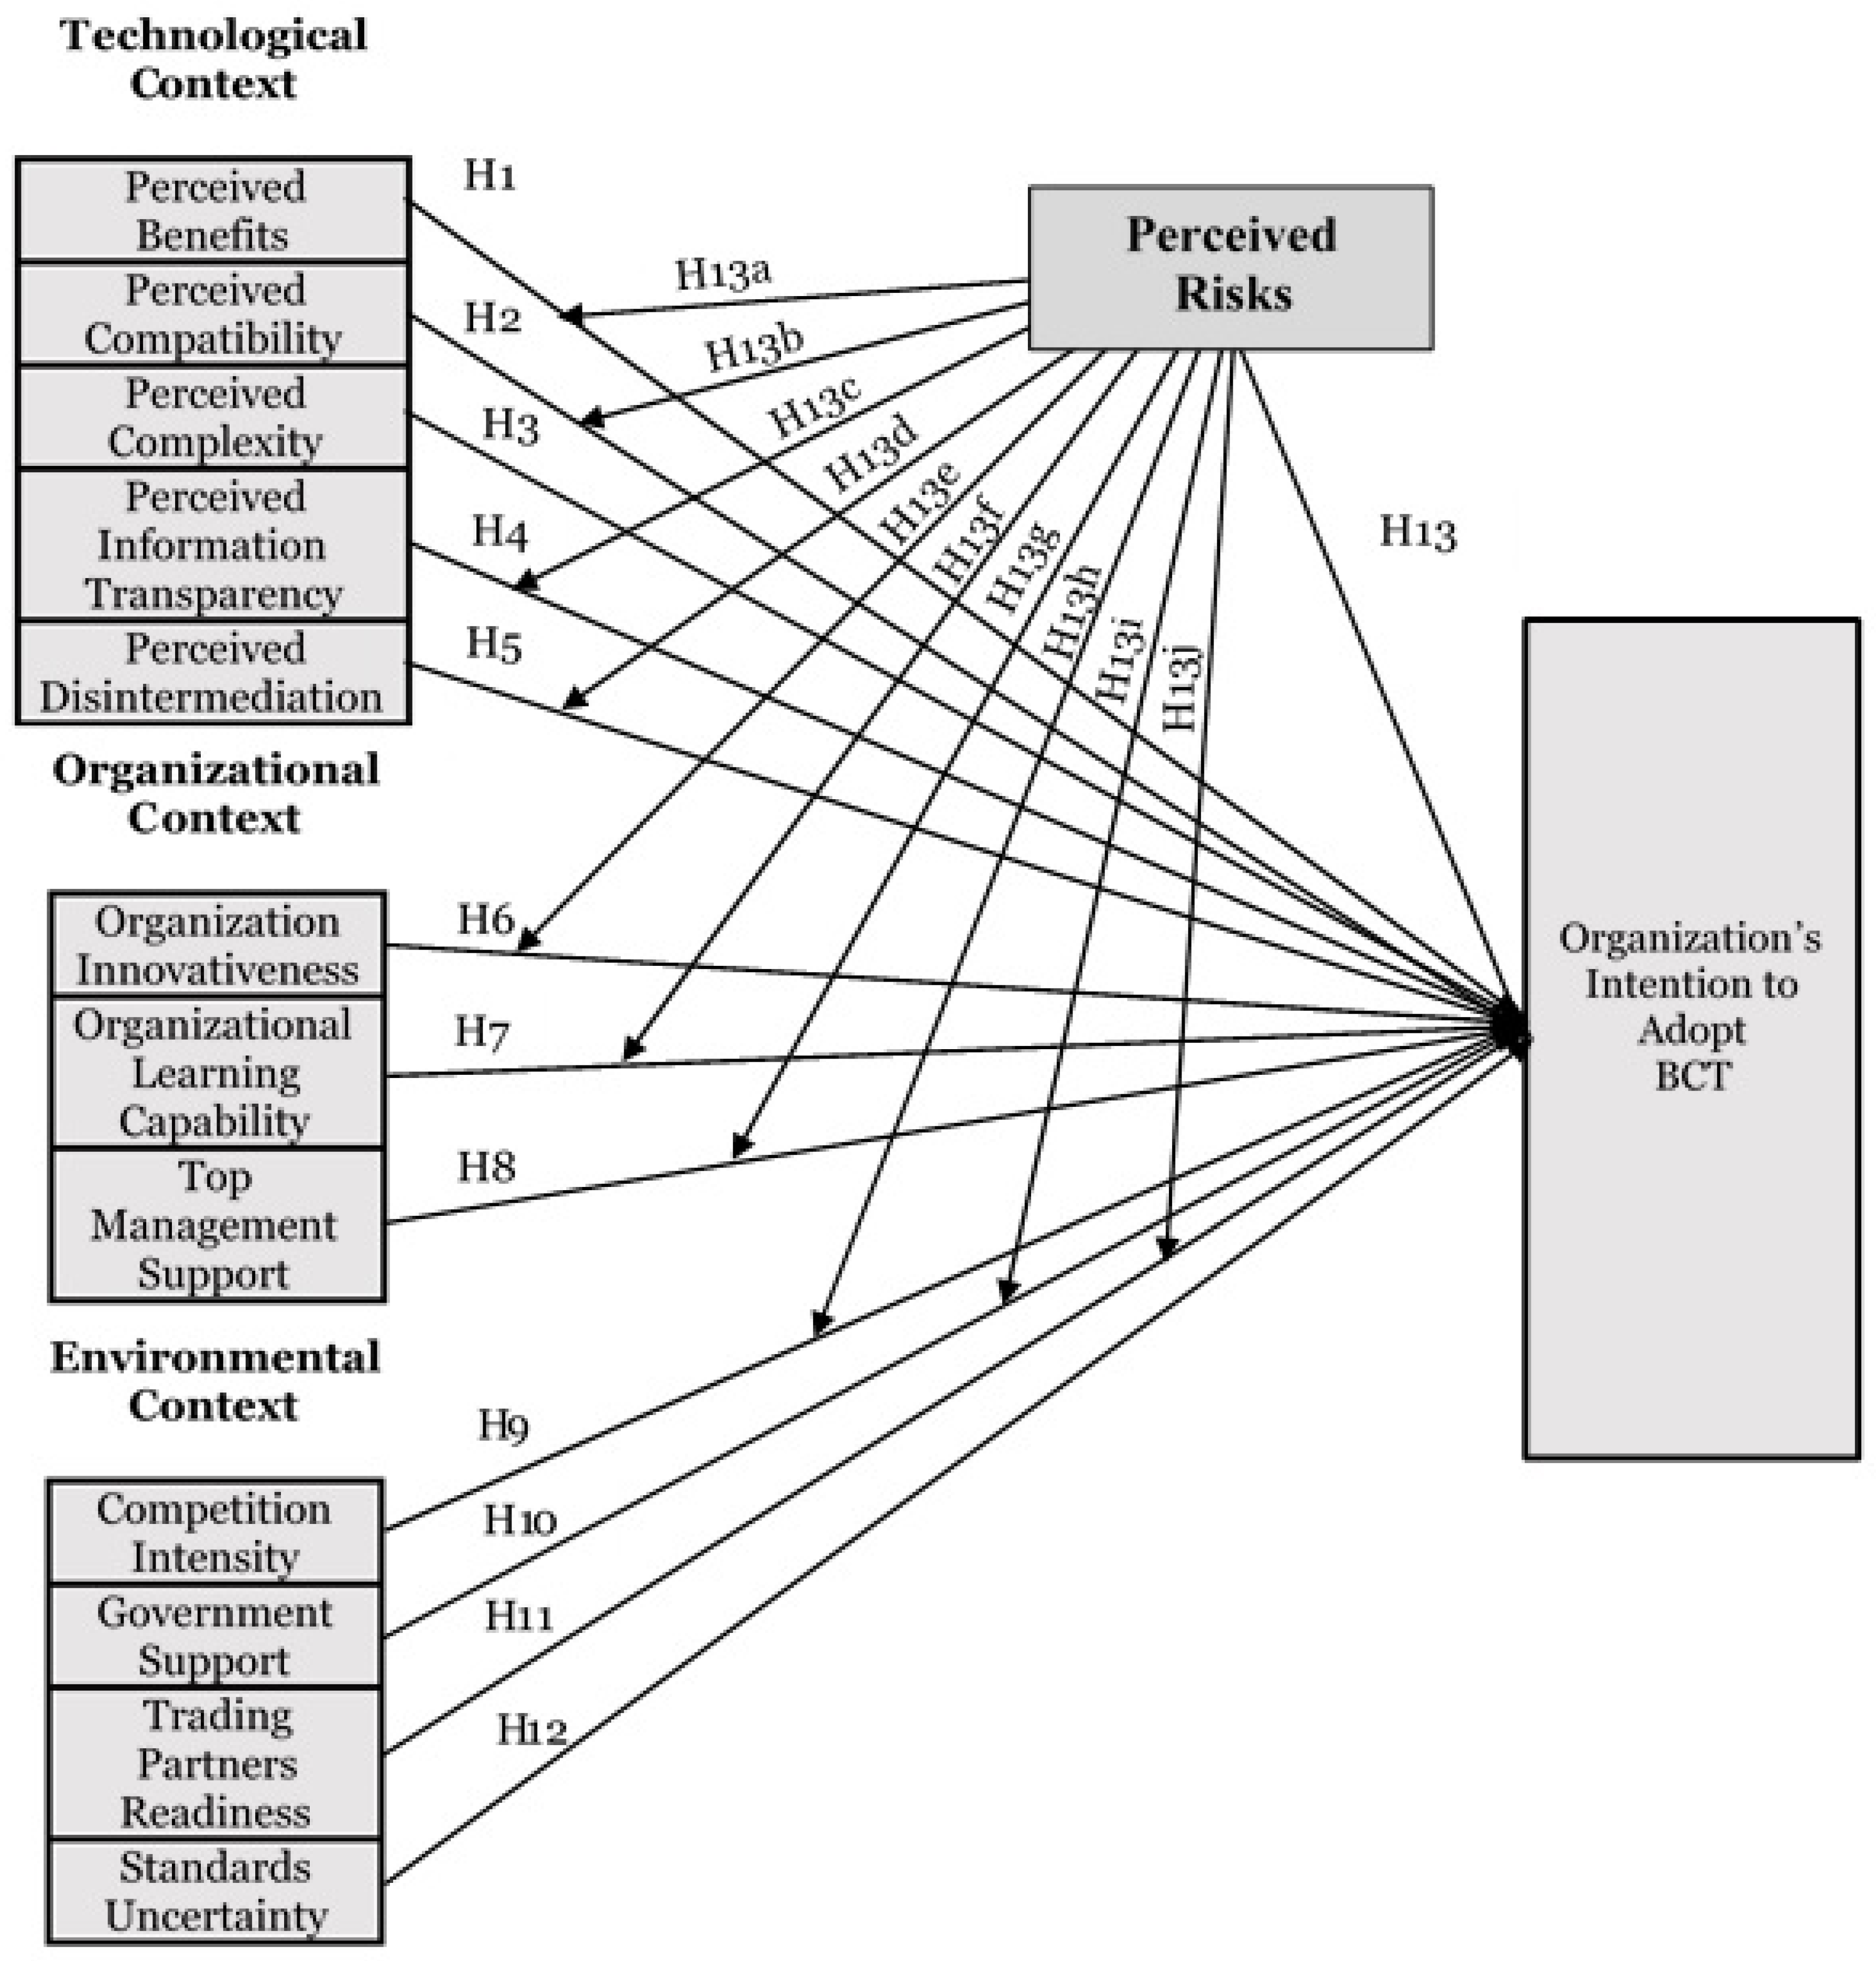
3.2. Technology Context

3.2.1. Perceived Benefits (PB)

Perceived benefits refer to the extent to which organizations perceive an innovation would be beneficial for their business [60]. BCT has many benefits such as improved auditing, cost reduction, enhanced data provenance, and trust that encourage organizations to its adoption [25]. De Castro, Tanner and Johnston [26] stated a positive role of perceived benefits in the adoption of BCT among organizations working in the wealth management industry. Therefore, it can be hypothesized that:
Hypothesis 1 (H1).
Perceived benefits positively influence an organization’s intention to adopt BCT.

3.2.2. Perceived Compatibility (PC)

Perceived compatibility refers to an organization’s perception of how technology would be aligned with its business objectives [60]. De Castro, Tanner and Johnston [26] stated organizations become more inclined to adopt BCT when they perceive it as compatible with their IT infrastructure. On the other hand, organizations feel anxious about BCT adoption when they do not find it compatible with their business operations [21]. Therefore, it can be hypothesized that:
Hypothesis 2 (H2).
Perceived compatibility positively influences an organization’s intention to adopt BCT.

3.2.3. Perceived Complexity (PCM)

Perceived complexity can be defined as the degree to which organizations perceive BCT as difficult to understand and use [26]. Wong, Leong, Hew, Tan and Ooi [21] reported complexity as a barrier for BCT adoption. Technicalities involved in BCT such as the use of public and private keys and hashing of blocks are complex processes that make organizations reluctant to its adoption [63]. Clohessy and Acton [22] reported that the perceived complexity of BCT hinders organizations from its adoption. Therefore, it can be hypothesized that:
Hypothesis 3 (H3).
Perceived complexity negatively influences an organization’s intention to adopt BCT.

3.2.4. Perceived Information Transparency (PIT)

Information transparency refers to the easy availability and verification of information for everyone [64]. Resultantly, it reduces information asymmetry and increases the traceability of information [40]. The organizations that value information transparency are more inclined to adopt technology that brings transparency within their business operations [64]. In BCT, every participant holds the same copy of data, and all the transactions are validated through a mutual consensus among the participants. This creates a transparent environment wherein the business stakeholders feel more confident while taking any decision [65]. BCT maintains an unchangeable history of the information (money, documents, and so on) that enhances trust among the stakeholders. Wamba, et al. [66] stated that information transparency plays a significant role in organizational intention to adopt BCT. Therefore, it can be hypothesized that:
Hypothesis 4 (H4).
Perceived information transparencypositively influences an organization’s intention to adopt BCT.

3.2.5. Perceived Disintermediation (PD)

Disintermediation refers to the removal of an intermediary to run business operations [67]. Disintermediation is a core feature of BCT that enables organizations to have peer–peer transactions without the need for intermediaries, which saves economic costs, removes risks associated with the intermediaries, and improves business performance [68]. Organizations could readily interact, send approvals, and trace records when there is no third party involved. The disintermediation helps organizations to directly reach out to their customers. Consequently, they save overhead expenses, time, and earn customer loyalty. O’Dair [69] reported a positive impact of disintermediation of BCT in the music industry. Therefore, it can be hypothesized that:
Hypothesis 5 (H5).
Perceived disintermediationpositively influences an organization’s intention to adopt BCT.

3.3. Organizational Context

3.3.1. Organization Innovativeness (OI)

Organization innovativeness can be defined as the willingness and openness of an organization to adopt new and novel ideas regardless of the risks associated with them [70]. Considering the newness and novelty of BCT, organization innovativeness seems vital for its adoption. Thong and Yap [71] reported organizational innovativeness as an essential factor towards the adoption of new technology. Similarly, Lin, et al. [72] mentioned that innovativeness is extensively linked to an organization’s decision to adopt and implement innovations. They claimed that higher organizational innovativeness leads to a greater organizational transformation, which results in the adoption of new technology. Since BCT is an innovative technology, it can be expected that an organization open to new ideas which considers BCT a source of opportunities is more likely to adopt BCT. Nuryyev, et al. [73] found a statistically significant effect of innovativeness on the organizational adoption of BCT. Therefore, it can be hypothesized that:
Hypothesis 6 (H6).
Organization innovativeness positively influences an organization’s intention to adopt BCT.

3.3.2. Organizational Learning Capability (OLC)

Organization learning capability refers to an organization’s ability to acquire, store, share, and implement new knowledge in its business decisions. We adapted this concept from the organizational learning theory proposed by Argyris and Schon [74]. To sustain in a turbulent business world, organizations are highly necessitated to capture new knowledge about the contemporary technological trends happening in the world and apply this knowledge to their business decisions. Organizational learning brings novelty that could motivate organizations to adopt an innovation such as BCT. Woiceshyn [75] stated that when organizations acquire new knowledge from their environment, it leads them to adopt new ideas. Organizational change and innovation come through organizational learning. Kulkarni and Patil [41] stated that the organization’s learning significantly influences BCT adoption. Therefore, it can be hypothesized that:
Hypothesis 7 (H7).
Organizational learning capability positively influences an organization’s intention to adopt BCT.

3.3.3. Top Management Support (TMS)

Top management support is an integral part of an organization’s decision to adopt new technology. The lack of leadership support reduces the chances of adopting an innovation such as BCT [42]. De Castro, Tanner and Johnston [26] found that an organization adopts BCT when its leadership provides required resources. Clohessy and Acton [22] recommended top management support essential for the adoption of BCT. Therefore, it can be hypothesized that:
Hypothesis 8 (H8).
Top management support positively influences an organization’s intention to adopt BCT.

3.4. Environment Context

3.4.1. Competition Intensity (CI)

Competition intensity, also known as competitive or external pressure, is the extent to which organizations feel a fear of losing competitive advantage. Competition intensity has been recognized as an essential factor in the organizational adoption of BCT [33]. When an organization adopts BCT, its competitors also follow suit to maintain their competitive position. Wong, Leong, Hew, Tan and Ooi [21] said that competitive pressure catalyzes an organization’s decision to adopt BCT. Therefore, it can be hypothesized that:
Hypothesis 9 (H9).
Competitive intensity positively influences an organization’s intention to adopt BCT.

3.4.2. Government Support (GS)

Government support refers to a government’s policies, initiatives, and incentives to foster adoption of technology. According to Koster and Borgman [42], government support works as a major driving force to speed up the adoption process of BCT. De Castro, Tanner and Johnston [26] stated that when a government does not provide proper support such as establishment of regulations, widespread adoption of BCT among organizations remains impossible. Kulkarni and Patil [41] and Wong, Leong, Hew, Tan and Ooi [21] reported government support as a critical factor for the adoption of BCT. Therefore, it can be hypothesized:
Hypothesis 10 (H10).
Government support positively influences an organization’s intention to adopt BCT.

3.4.3. Trading Partner Readiness (TPR)

Trading partner readiness refers to the preparedness of the partners of an organization to embrace new technology. Similar to any inter-organizational system, BCT requires strong collaboration and interaction among the trading partners [76]. When trading partners do not have adequate technical and financial resources, an organization alone cannot decide on the adoption of BCT [32]. Bai and Sarkis [34] claimed that the willingness of trading partners is essential for the organizational adoption of BCT. Therefore, it can be hypothesized:
Hypothesis 11 (H11).
Trading partner readinesspositively influences an organization’s intention to adopt BCT.

3.4.4. Standards Uncertainty (SU)

Standards uncertainty refers to the unpredictability and unavailability of formal standards and regulations, generally enforced by government institutions, for a technology. The absence of the relevant standards creates doubts and uncertainties among organizations about the benefits of new technology [77]. On the other hand, well-developed standards guide or even force organizations to invest in innovations. This is also true for the BCT [78]. Given the nascent nature, relevant standards for BCT are still missing, causing organizations to be doubtful about its future development [79]. Therefore, it can be hypothesized that:
Hypothesis 12 (H12).
Standards uncertaintynegatively influences an organization’s intention to adopt BCT.

3.5. Direct and Moderating Effect of Perceived Risks

As stated in the research conducted by Peter and Ryan [80], Bauer is the first person that proposed the concept of perceived risks. Afterward, many studies were conducted to measure the effect of perceived risks on technological innovations. According to Peter and Ryan [80], perceived risks refer to the nature and amount of risk perceived by an organization when deciding an action in an unknown situation. In the IT adoption literature, perceived risks are negatively associated with the adoption of new technologies [81,82,83]. The existing literature reports different facets of perceived risks such as performance risk, financial risk, time risk, physical risk, social risk, psychological risk, and privacy risk for the adoption of different technologies, e.g., e-services, mobile commerce, social robot, and smartphones [84]. In the case of BCT, it is not free from the risks such as privacy, high data storage, and “51% attack” that hinder organizations from its adoption [63]. Yoo, et al. [85] mentioned perceived risks as a barrier to the organizational adoption of BCT. The risks cause doubt among organizations towards BCT adoption [86,87]. Therefore, it can be hypothesized that:
Hypothesis 13 (H13).
Perceived risks negatively influence an organization’s intention to adopt BCT.
As stated above, the past studies report a direct negative effect of perceived risks on the adoption of technological innovations. The moderating role of perceived risks when applying the TOE framework to examine the organizational adoption of BCT has yet to receive attention in the information system research. The reasons to choose perceived risks as a moderating variable in this study are given below:
(i)
As previously mentioned in Section 1 of this paper, semi-structured interviews with the BCT experts were conducted to identify the factors influencing BCT adoption in Australia. The experts highlighted the moderating role of perceived risks in BCT adoption.
(ii)
The past literature reports the moderating role of perceived risks in the adoption of different technological innovations. For example, Shen and Chiou [88] found that the perceived risks moderates the relationship between perceived ease of use and intention towards using internet services. Similarly, Khaksar, Khosla, Singaraju and Slade [84] reported the moderating role of perceived risks in the adoption of social assistive technology.
(iii)
Given the higher value of the “uncertainty avoidance index” for Australia in Table 1, anecdotally it can be assumed that the perceived risks would moderate the relationship between the influential factors and organizations’ intention to adopt new technology such as BCT.
Therefore, the following hypotheses are proposed for the moderating effect of perceived risks on the adoption of BCT among Australian organizations.
Hypothesis 13a (H13a).
Perceived risks moderate the relationship between perceived benefits and an organization’s intention to adopt BCT.
Hypothesis 13b (H13b).
Perceived risks moderate the relationship between perceived compatibility and an organization’s intention to adopt BCT.
Hypothesis 13c (H13c).
Perceived risks moderate the relationship between perceived information transparency and an organization’s intention to adopt BCT.
Hypothesis 13d (H13d).
Perceived risks moderate the relationship between perceived disintermediation and an organization’s intention to adopt BCT.
Hypothesis 13e (H13e).
Perceived risks moderate the relationship between organization innovativeness and an organization’s intention to adopt BCT.
Hypothesis 13f (H13f).
Perceived risks moderate the relationship between organizational learning capability and an organization’s intention to adopt BCT.
Hypothesis 13g (H13g).
Perceived risks moderate the relationship between top management support and an organization’s intention to adopt BCT.
Hypothesis 13h (H13h).
Perceived risks moderate the relationship between competition intensity and an organization’s intention to adopt BCT.
Hypothesis 13i (H13i).
Perceived risks moderate the relationship between government support and an organization’s intention to adopt BCT.
Hypothesis 13j (H13j).
Perceived risks moderate the relationship between trading partner readiness and an organization’s intention to adopt BCT.
Since the perceived risks per se have a negative impact on BCT adoption, we hypothesized its moderating effects for those factors that have a positive impact on BCT adoption.

4. Research Methodology

The study uses a positivist research approach with a quantitative methodology to collect and analyze the research data.

4.1. Research Method

We employed a survey method to collect data for this study. A licensed version of the Qualtrics online survey tool was utilized. The online survey is useful to collect data from a larger population to measure and test multiple variables and hypotheses [89]. Furthermore, the survey method is cost and time-effective, requires less effort to manage, and is free from respondent prejudice [90]. Thus, it was used in this study.

4.2. Unit of Analysis and Unit of Observation

A unit of analysis refers to the entity that a researcher states their findings are about at the end of the research. It can be an individual, group, or organization depending upon the nature and context of a study [91]. On the other hand, a unit of observation is an entity, which a researcher observes while investigating something about the unit of analysis [92,93]. For this study, the unit of analysis was the Australian organizations, and the unit of observation was the individuals that should be working as CEO, or the senior IT people such as CTO, IT directors/managers, and had a minimum of three years of BCT-related knowledge and experience. This cohort of senior management and IT people were selected because they are always well informed about the organization’s strategies and decisions such as adopting new technology [71].
To automatically filter out the unwanted unit of analysis and the unit of observation, screening questions were incorporated at the start of the online survey. The screening questions help to keep survey data relevant and free from respondent bias [94,95]. The screening questions used in this study are provided in Appendix B.

4.3. Target Population and Sampling

BCT adopters and potential adopter organizations in Australia were the target population for this study. To find the total population, we used multiple online sources including the Australian securities exchange directory, Blockchain Australia, Google, LinkedIn, and BCT-related websites such as “VentureRadar”, “Crunchbase”, and “Coindesk”. According to the data collected from these online sources, the total population size obtained was 917 organizations belonging to different industries that made the target population diverse.
For the sampling, we used the proportionate stratified random sampling technique that is appropriate when the target population is heterogeneous as in our study [90]. This technique requires dividing the total population into homogeneous subgroups known as strata. We randomly selected a sample proportionate to the size of each stratum. This technique allows researchers to reduce selection bias and overall variance in the sample, which in turn increases the generalizability of research findings. For this study, an industry type was taken as a stratum. We obtained a sample size of 500, which is acceptable in social science research [89]. According to Sekaran and Bougie [89], a sample size between 30 and 500 is acceptable. Table 3 provides sampling details.

4.4. Questionnaire Designing

Several measures were taken to design a reliable questionnaire for this study:
  • We used validated measuring items for the perceived compatibility, perceived complexity, perceived information transparency, top management support, organization innovativeness, organizational learning capability, government support, trading partner readiness, competition intensity, standards uncertainty, and perceived risks from the existing peer-reviewed literature on information systems research. The items were adapted and modified to meet the requirement of this study. Table 4 provides detail about the measuring items for each factor and their sources. Measuring items for perceived disintermediation were not found in the existing literature, hence we developed it for this study by following the guidelines of MacKenzie, et al. [96].
  • Use of duplicate and long questions, technical and specialized terms were avoided.
  • Feedback from the senior academic and researchers working in the information system domain was sought to evaluate instrument relevance and content clarity in order to avoid any difficulty or non-response that the respondents might have faced while completing the survey.
  • The questionnaire was sent to language experts for proofreading including review of grammatical errors and wording.
The questionnaire is provided in Appendix A.

4.5. Measurement Scale

The 5- and 7-point are the two main versions of the Likert scale that are frequently used in information systems research. However, the 7-point scale outperforms the 5-point scale in terms of providing more flexibility and options to respondents, which increases the reliability and accuracy of the research findings [109,110]. Therefore, the 7-point Likert scale was considered more appropriate for the present study. We used response options from “1—strongly disagree” to “7—strongly agree”.

4.6. Pilot Testing

The reliability and validity of the instrument were confirmed through a pilot study using data from 25 completed surveys. The sample for the pilot study was drawn from the same sample frame used for the main study.

4.7. Data Collection Process

The survey link along with the research objectives was emailed to the target organizations. To collect accurate information, every organization was requested to forward the survey to the CEO, or senior IT staff such as the CTO and IT directors/managers having BCT experience and knowledge. A follow-up email was sent to the non-respondent organizations. During the entire data collection period, ethical protocols were observed.
A total of 196 anonymous completed surveys were received, yielding a response rate of 39.2%, which is considered acceptable in online survey research [111].

4.8. Data Analysis Technique

To analyze the survey data, the PLS-SEM technique with SmartPLS 3 software was used. Despite the availability of other data analysis techniques such as correlation, regression, and analysis of variance, PLS-SEM is widely used for quantitative data analysis [112]. It allows researchers to analyze the relationship of the observed (measured) and unobserved variables (latent constructs) while the traditional techniques can analyze measured variables only [113]. Additionally, the moderator effects can be directly incorporated and computed into the model with the PLS-SEM [112]. Thus, the PLS-SEM was used in this study. In the PLS-SEM process, data is analyzed in the form of a measurement model and structural model. The measurement model measures latent variables whereas the structural model measures the hypotheses based on the path analysis.

5. Data Analysis and Results

5.1. Preliminary Data Analysis

Before proceeding to the SEM analysis, a preliminary data analysis confirmed the absence of missing values, selection bias, non-response bias, multicollinearity, and common method bias. Such biases in data reduce the validity of findings. Therefore, we confirmed that the data were free from these biases.
Nonresponse Bias: Nonresponse bias occurs when some respondents of the chosen sample are unable or unwilling to participate in the survey [114]. The respondents who fail to respond may be different from the rest of the population. Consequently, the true representation of the target population is not reflected in the survey data. The inferences derived from the collected data may be false and the validity of the research is compromised [115]. The nonresponse bias is introduced when the recruitment of the respondents is based on self-selection [115,116]. The participants voluntarily decide to participate in a survey. To assure that the collected data is free from self-selection bias and it truly represents the target population, we performed the comparison of the sample population and the respondents who completed the survey as shown in Table 3. From the comparison, it is clear that the actual respondents truly reflect the target and sample population, which confirms that no selection bias was present in the collected data. Furthermore, we checked the non-response bias with Levene’s test for equality of variances [117] and independent-samples t-test, for all the factors. We divided the respondents between early respondents (who responded before the reminder, 45.5%) and late respondents (who responded after the reminder, 54.5%). The equal variance significance values for all the factors were found to be higher than the significance level of 0.05, which implies that both groups, early and late respondents, have the same variance. Thus, non-response bias was not found in the data.
Multicollinearity: We assessed multicollinearity for every exogenous factor through the value of variance inflation factor (VIF) as suggested by Hair Jr, et al. [118]. The VIF value of five shows high collinearity. For this study, the VIF values for all the factors were found between 1.123 and 1.953. Thus, no multicollinearity was found among the independent factors.
Common Method Bias: We performed the Harman one-factor test to confirm common bias as suggested by Podsakoff, et al. [119]. The test yielded fourteen factors. The largest factor showed 29.313% of the total variance. A value less than 50% implies that common method bias was not present in data [120].

5.2. Demographic

The demographic data indicated that most of the organizations were from the banking/finance, education, IT, and supply chain industries. These industries seem to be most appropriate for BCT. Regarding the respondents, females were 42.9% and males 57.1%. The age of most respondents was between 26 and 50 years. In the educational qualification of the respondents, postgraduate degree was highest, undergraduate second, and college certificate third. Most of the respondents were CEO (15.3%), CTO (23%), and IT directors (16.8%). Others included IT manager, technology strategy manager, database administrator, supply chain manager, and finance director/manager.

5.3. Measurement Model

The study assessed the reliability of the measurement model by calculating Cronbach’s alpha, composite reliability (CR), average variance extracted (AVE); discriminant validity through the square root of the AVE, and cross-loadings. The minimum acceptable values of outer-loadings, Cronbach’s alpha, and CR should be equal or greater than 0.7, and for the AVE, it should be greater than 0.5 [121]. Similarly, for the square root of the AVE of every construct, the value should exceed all the correlations among the constructs in the same block of the factor correlation matrix. Overall, the statistical results for the measurement model were above the minimum acceptable values as depicted in Table 5 and Table 6. Hence, the reliability and validity criteria for this study were achieved. The values for the cross-loadings were according to the recommendations of Fornell and Larcker [122]. Each measuring item of every construct was loaded higher than the indicators of any other off-diagonal construct.

5.4. Structural Model

To determine the significance of path coefficients, a standard bootstrapping procedure with 500 samples and 196 cases was performed. The structural model was evaluated with the values of coefficients of determination (R2), effect size (f2), predictive relevance coefficient (Q2), and the path coefficients [118,123].
The value of R2 is the extent to which the independent constructs explain the variance in the dependent constructs [118]. The bigger value of R2 reflects that the model has more predictive power. We found R2 = 0.822, which implies that perceived benefits (PB), perceived compatibility (PC), perceived complexity (PCM), perceived information transparency (PIT), perceived disintermediation (PD), top management support (TMS), organization innovativeness (OI), organization learning capability (OLC), government support (GS), competition intensity (CI), trading partner readiness (TPR), standards uncertainty (SU), and perceived risks (PR) accounted for 88.2% variance of the intention to adopt blockchain (INT).
The value of f2 represents the strength of the effect of a particular independent construct on the dependent construct in the structural model [124,125]. Cohen, et al. [126] states f2= 0.02; f2 = 0.15, and f2= 0.35 as small, medium, and large effects, respectively. Our results for f2 were found between 0.016 and 0.608. The perceived benefits (PB), perceived information transparency (PIT), perceived disintermediation (PID), and trading partner readiness (TPR) were reported to have a large effect size, whereas, perceived complexity (PC), perceived risks (PR), organization innovativeness (OI), organization learning capability (OLC), top management support (TMS), competition intensity (CI), and standards uncertainty (SU) were reported with medium effect. However, perceived complexity (PCM) and government support (GS) showed small effects. According to Chin, et al. [127], even the smallest value of f2 for a construct is important because it reflects that the construct at least has some effect.
In addition to R2, we performed the predictive relevance test (Stone–Geisser’s Q2) to evaluate the predictive validity of the models [128,129,130]. The higher value of Q2 for a dependent construct indicates that the model has predictive relevance for that construct [131]. In our case, the dependent construct is “intention to adopt blockchain” (INT). We performed the blindfolding procedure to obtain the cross-validated redundancy value for INT, which was Q2 = 0.526 indicating a high predictive relevance of the model for the INT.
To test the hypotheses, we performed the significance test for path coefficients. According to Chin, Marcolin and Newsted [127], the path coefficients should have a “t-value” greater than 1.645 at a significance level of 0.05 and more than 2 at a significance level of 0.01. Table 7 shows the significance test of the path coefficients.
From the obtained results, it is clear that the hypotheses H1–H13 possess more than the accepted threshold of the “t-value” [127]. The path coefficient of perceived benefits (PB), perceived compatibility (PC), perceived information transparency (PIT), perceived disintermediation (PD), organization innovativeness (OI), organization learning capability (OLC), top management support (TMS), competition intensity (CI), government support (GS), and trading partner readiness (TPR) has a positive value, which implies that they have a positive relationship with intention to adopt blockchain (INT), whereas, perceived complexity (PCM), standards uncertainty (SU), and perceived risks (PR) have a negative value, which means they have an adverse relationship with INT. In other words, the higher the complexity, risks, and uncertainty of the BCT are, the lower the organization’s intention to adopt BCT in Australia.

5.5. Measuring the Moderating Effects

To examine the moderating effects of PR on the relationship between PB, PC, PIT, PD, OI, OLC, TMS, CI, GS, and TPR with INT, we used the product indicator approach [132]. The results showed that PR has significant moderating effects on the relationship of PC, PIT, PD, OI, CI, and INT that confirms the hypotheses H13b, H13d, H13e, and H13h. However, no moderating effects of PR were found on the relationship between PB, OLC, TMS, GS, and TRP with INT, which implies that the hypotheses H13a, H13f, H13g, H13i, and H13j are not supported.
Additionally, we evaluated the performance of the model with and without adding PR as a moderating variable. It was noted that the significance level of the relationship between the dependent and independent variables significantly changes. For example, the TPR becomes insignificant at p < 0.01. However, it remains significant at p < 0.05.

6. Discussion

The study aims to find the factors that influence the adoption of BCT among Australian organizations. Based on the TOE framework, we found that different technological, organizational, and environmental factors affect the organizational adoption of BCT in Australia. The results support all the hypotheses, H1–H13, developed in this study. In addition to that, the results confirm that the variable perceived risks (PR) moderates the relationship between influential factors and BCT adoption. The results of this study extend the TOE framework by adding the new factors: perceived information transparency (PIT), perceived disintermediation (PD), organization innovativeness (OI), organization learning capability, competition intensity (CI), trading partner readiness (TPR), and standards uncertainty (SU) under its technological, organizational, and environmental contexts. Furthermore, the TOE framework has been extended with the inclusion of the perceived risks (PR) as a moderating variable.
In the context of the TOE framework, the results and their interpretation and comparison with the past studies are presented below. The implications of the study are also presented.

6.1. Technology Context

The technological factors are perceived benefits, compatibility, information transparency, and disintermediation positively influence the adoption of BCT, whereas the perceived complexity has a negative influence. The effect of perceived disintermediation is a new insight that was not reported in the past studies on BCT adoption. When organizations perceive that they could run their business without the involvement of any intermediary, they are attracted to adopt BCT. The disintermediation reduces the transaction cost and speedy payments [67,133], which motivates organizations to adopt BCT. However, Adams, et al. [134] pointed out that “blockchains may replace many firms across a wide number of sectors who currently (earn) profit from providing services (as an intermediary). Disintermediation may be painful for many (organizations) and have its own risks”. Therefore, we suggest the BCT community create opportunities for organizations providing their services as an intermediary. The findings show that the compatibility of BCT with an organization’s technological and financial needs significantly affects its adoption. This finding is consistent with Kim [135] but inconsistent with De Castro, Tanner and Johnston [26] that found BCT incompatible with the legacy infrastructure of the wealth management industry in South Africa. Therefore, we recommend organizations carefully evaluate and understand the compatibility of BCT with their business objectives before deciding on its adoption. The study found that the perceived complexity of BCT negatively impacts an organization’s decision to adopt BCT. The organizations that perceive BCT as difficult to use or understand feel fear of its adoption which ultimately contributes to the low BCT adoption in Australia. De Castro, Tanner and Johnston [26] found that people from non-IT backgrounds perceive BCT as more complex compared with those having IT know-how. Therefore, we suggest organizations develop a better understanding of BCT while deciding on its adoption. In this study, perceived transparency of information through BCT has been found to be an enabler of the organizational adoption of BCT, which is consistent with the study of Al-Jabri and Roztocki [64]. Information transparency enhances trust among the organizations involved in the BCT network, consequently, organizations coordinate and share information with full of confidence.

6.2. Organizational Context

Organizational factors are innovativeness, and organization learning capability were found to be significant to the adoption of BCT, which is similar to the findings of Johnson [136], Kulkarni and Patil [41], and Newby, Nguyen and Waring [70]. We found that the organizations that are capable of acquiring new knowledge, store and apply that knowledge; hence, they are deemed to be open to new ideas, and ready to take risks, meaning they are more likely to adopt BCT. Therefore, we suggest organizations should have a learning mechanism to remain aware of developments happening in the world that could be important for their business. Regarding the top management support, our findings are consistent with those of Orji, Kusi-Sarpong, Huang and Vazquez-Brust [25], and Clohessy and Acton [22], who found that without the support of top management, the organizational adoption of BCT is less likely. This is because the top leadership is the authority to approve strategic decisions such as the adoption of new technology and allocate resources for it. This finding contrasts with Wong, Leong, Hew, Tan and Ooi [21] who found an insignificant impact of top management support on BCT adoption. Anecdotally, this could be that the top management was not convinced or was not aware of the benefits of BCT. Therefore, we suggest educating top management about BCT while initiating the idea of its adoption.

6.3. Environmental Context

The environmental factors are competition intensity, government support, and trading partner readiness positively, whereas the standards uncertainty negatively influences the adoption of BCT. The positive impact of the competition intensity on BCT adoption implies that organizations want to remain competitive at the forefront of their rivals. Competition intensity encourages organizations to find ways to grow and sustain their competitive advantage. Prior studies have also established that the adoption of BCT is important for organizations to retain their competitiveness [21,33,34]. We found a significant effect of government support on the adoption of BCT. This means organizations are satisfied with the recent initiatives of the Australian government for BCT. This finding also confirms the results of Orji, Kusi-Sarpong, Huang and Vazquez-Brust [25] who reported that when a government shows support in terms of developing policies and regulations, it enhances organizations’ confidence and trust in the BCT. However, few studies reported that governments have not laid down specific regulations about BCT for different industries, so any change in regulations may adversely affect investment in BCT projects [45,137,138]. Therefore, we recommend that organizations check government regulations relevant to their industry before making any decision to adopt BCT. We found trading partner readiness has a significant influence on BCT adoption. This finding confirms the inter-organizational nature of BCT. Organizations can not adopt BCT until their trading partner are ready to adopt it. Any decision of BCT adoption without the willingness of trading partners would result in negative consequences [32,41]. We endorse the statement presented by Bai and Sarkis [34] wherein they suggested to ensure the willingness of multiple stakeholders to adopt BCT. The impact of standards uncertainty was identified as negative on the adoption of BCT, which implies that organizations are still seeking BCT-related industry standards. This finding is consistent with Guo and Liang [139] who reported that BCT adoption would be unsolved until the industry standards related to BCT are established. To accelerate the adoption of BCT, establishment of industry standards for BCT it is urgently needed [32,63,104]. This finding may help the relevant government and private industrial agencies to pay attention to the development of BCT standards.

6.4. Direct Effect of Perceived Risks

The direct impact of perceived risks is found to be negative causing organizations to be reluctant to adopt BCT. Resultantly, BCT adoption is not gaining attention among Australian organizations. This finding is aligned with the earlier study of Yoo, Bae, Park and Yang [85] that reported that the risks such as privacy disclosure, misuse of information, and un-scalability hinder organizations to adopt BCT. It suggests that organizations should carefully analyze the risks before deciding on the adoption of BCT.

6.5. Moderating Effect of Perceived Risks

We found that the perceived risks moderate the relationship between perceived compatibility (PC), perceived information transparency (PIT), perceived disintermediation (PD), organization innovativeness (OI), competition intensity (CI), and intention to adopt blockchain (INT), thereby supporting the hypotheses H13b–H13e, and H13h. These findings imply that irrespective of the compatibility of BCT with organizations’ business values—their expectations for information transparency through BCT, perceiving BCT disintermediation as an opportunity, being innovative, and feeling the intensity of competitiveness—organizations become reluctant to adopt BCT because of the risks linked with BCT. The moderating role of PR was not found for PB (perceived benefits), organization learning capability (OLC), top management support (TMS), government support (GS), and trading partner readiness (TPR). Thus, the hypotheses H13a, H13f, H13g, H13i, and H13j are not supported. This is contrary to our proposed hypotheses. A possible explanation for this might be that when the organizations consider the high level of perceived benefits, top management support, trading partner readiness, and government support, they feel more comfortable and are inclined towards BCT adoption. Moreover, if organizations are more knowledgeable about BCT through their learning capability, they know how to manage the risks.

6.6. Implications

The study outlines some important implications for both theory and practice, which are given below.

6.6.1. Theoretical Implications

First, according to the best of our knowledge, this is one of the first positivist studies that provides empirical evidence about the factors influencing organizational adoption of BCT in the Australian context. Most of the research on BCT is from its technical understanding and advancement perspective. Although the technological perspective of BCT is important for its future development, understanding its adoption is also critical for maximum value creation. Thus, first, this study theoretically contributes by establishing the foundation for future research in the Australian context. Second, the prior studies on the organizational adoption of BCT establish a linear relationship between the TOE factors and the intention to adopt BCT. This is one of the first studies that extends the TOE framework by introducing a moderating variable for the organizational adoption of BCT. Researchers can use this extended TOE model shown in Figure 2 as a starting point for future research to study organizations’ intentions to adopt any innovation in general and BCT in particular. With the addition of the new factors, the extended model has more explanatory power than the original TOE framework. Third, the study identifies the factors that influence the organizational adoption of BCT, particularly in Australia. Fourth, we extend the existing literature on different factors influencing BCT adoption in general. Future research can study these factors in-depth to expand the list. Fifth, the research presents a validated research model for the adoption of BCT at the organization level. This model can be used to study the adoption of other distributed inter-organizational technologies such as electronic data interchange (EDI). Finally, we have developed and validated a measuring scale for the perceived disintermediation, which would help researchers in their future studies on BCT.

6.6.2. Practical Implications

In addition to having theoretical implications, the study has various important implications for practice. First, our findings would provide guidelines to the policy and decision makers working with the Australian government to develop national policies to promote BCT adoption among Australian organizations. This also applies to the private associations such as “Blockchain Australia” that have actively been working to foster BCT adoption in Australia. Second, disintermediation is found to be a significant factor in BCT adoption. This finding urges the organizations working as an intermediary to redesign their business models to sustain in the market. Third, the findings could help consulting and marketing companies to consider factors identified in this study while providing their services to the potential adopters of BCT, saving time and effort. For example, it is useless to provide services to a customer whose trading partners are not ready to adopt BCT. Fourth, we have found that organizations feel reluctant to adopt BCT due to the lack of established standards of BCT. Therefore, this finding is important for governments and private regulatory bodies to develop relevant standards to remove the uncertainties hindering BCT adoption. Fifth, the study highlights the role of an organization’s top management in BCT adoption. Therefore, the organization’s top management should be determined and focused on the adoption of new technology. Top management’s clarity towards value creation is conducive to achieve successful adoption of BCT in their organization. Finally, the competition intensity is found positive for BCT adoption. Therefore, IT vendors develop BCT apps that provide a competitive advantage to their customers.

7. Conclusions

The BCT is an important technology that could bring several strategic and operational advantages to organizations. However, its adoption among organizations has not reached a significant level including in Australia. To examine this lack of uptake, this study aimed to find the factors influencing the adoption of BCT among Australian organizations. By following a quantitative approach, this study proposed and confirmed an extended TOE framework. In contrast to the earlier studies on the organizational adoption of BCT that establish a linear relationship between influential factors and an organization’s intention to adopt BCT, this study introduced a moderating variable. A data sample was collected from the Australian organization through an online survey. The PLS-SEM technique with SmartPLS software was used for the data analysis. The results of the study highlight that technological factors: perceived benefits, compatibility, information transparency, and disintermediation; organizational factors: organization innovativeness, organization learning capability, and top management support; and environmental factors: competition intensity, government support, trading partners readiness, and standards uncertainty play an important role in the organizational adoption of BCT in Australia. The findings of this study provide direction to decision makers and policymakers, BCT vendors, technology practitioners, and researchers to develop strategies that contribute to the successful adoption and value creation of BCT.
Although this study achieved its aim, additional empirical research will further enhance its applicability and validity. For example, at the moment, the study focuses on the Australian context that reduces its external validity. Future research can be conducted in other countries, which have different regulatory and technological developments, to enhance its generalizability. Further, the study is cross-sectional. There is a high likelihood of changes in findings as time progresses. In the future, we hope to develop a dynamic model capable of predicting an organizations’ intention to adopt BCT over time.

Author Contributions

Conceptualization, S.M. and M.C. (Mehmood Chadhar); methodology, S.M., M.C. (Mehmood Chadhar) and S.V.; software, S.M.; validation, M.C. (Mehmood Chadhar), S.V. and M.C. (Madhu Chetty); formal analysis, S.M.; investigation, M.C. (Mehmood Chadhar); resources, M.C. (Mehmood Chadhar) and M.C. (Madhu Chetty); data curation, S.M.; writing—original draft preparation, S.M.; writing—review and editing, M.C. (Mehmood Chadhar), S.V. and M.C. (Madhu Chetty); visualization, S.M., S.V. and M.C. (Mehmood Chadhar); supervision, M.C. (Mehmood Chadhar), S.V. and M.C. (Madhu Chetty); project administration, M.C. (Mehmood Chadhar), S.V. and M.C. (Madhu Chetty). All authors have read and agreed to the published version of the manuscript.

Funding

This research received no external funding.

Institutional Review Board Statement

The study was conducted according to the guidelines of the Australian National Statement on Ethical Conduct in Human Research 2007 and approved by the Human Research Ethics Committee (HREC), Federation University Australia, via Project No. B19-017.

Informed Consent Statement

Informed consent was obtained from all subjects involved in the study.

Data Availability Statement

All the relevant data has been included in this article. Additional information can be provided on request.

Conflicts of Interest

The authors declare no conflict of interest.

Appendix A

Survey Questionnaire
Please respond to each statement by indicating the degree of agreement or disagreement by using the following scale.
1 = Strongly Disagree
2 = Disagree
3 = Somewhat Disagree
4 = Neutral
5 = Somewhat Agree
6 = Agree
7 = Strongly Agree
FactorQuestions
Perceived benefits (PB)In my opinion, organizations adopt blockchain when they perceive that:
Blockchain reduces overhead expenses
Blockchain reduces data error rates
Blockchain reduces transaction costs while transferring funds
Blockchain saves time while accomplishing business tasks
Blockchain increases the organization’s overall productivity
Perceived compatibility (PC)In my opinion, organizations adopt blockchain when they perceive that:
Blockchain fits well with their business processes
Blockchain is compatible with their technological infrastructure
Blockchain fits well with their technological skills
Perceived complexity (PCM)In my opinion, organizations do not adopt blockchain when they perceive that it:
Blockchain requires extra technical skills to use
Blockchain is difficult to understand from a business perspective
Blockchain is conceptually difficult to understand from a technical perspective
Perceived information transparency (PIT)In my opinion, organizations adopt blockchain when they perceive that:
Blockchain enables them to have transparent access to information across the network
Blockchain enables them to have a transparent view of any activity in the data
Blockchain enables them to have a transparent flow of the entire data
Perceived disintermediation (PD)In my opinion, organizations adopt blockchain when they perceive that:
Blockchain enables them to store their data without the involvement of any intermediary
Blockchain enables them to access their data without the involvement of any intermediary
Blockchain enables them to share their data without the involvement of any intermediary
Blockchain enables them to audit without the involvement of any intermediary
Top management support (TMS)In my opinion, organizations adopt blockchain when:
Their top management provides the necessary resources for blockchain
Their top management considers blockchain as strategically important
Their top management is actively involved in IT-related decisions
Organizational innovativeness (OI)In my opinion, organizations adopt blockchain when:
They actively seek new ideas
They like to do things in new ways
They are open to taking risks
Organizational learning capability (OLC)In my opinion, organizations adopt blockchain when:
They have a mechanism to store new knowledge
They encourage their employees to acquire new knowledge and skills
Their employees share their work experiences, ideas, or learning with each other
They have practices to utilize new knowledge in their IT-related decisions
Government support (GS)In my opinion, organizations adopt blockchain when:
The Australian government supports the adoption of blockchain
The Australian government introduces economic incentives for blockchain adoption
The Australian government is active in setting up facilities to promote blockchain
Trading partner readiness (TPR)In my opinion, organizations adopt blockchain when:
Their trading partners are also willing to adopt blockchain
Their trading partners are also technologically ready to adopt blockchain
Their trading partners are also financially ready to adopt blockchain
Competitive intensity (CI)In my opinion, organizations adopt blockchain when:
They feel pressure when their competitors have adopted it
They feel the fear of losing a competitive advantage if they do not adopt it
They see their competitors benefiting from adopting it
Standards uncertainty (SU)In my opinion, organizations do not adopt blockchain when:
They see blockchain has not reached its maturity
They see blockchain still requires changes to become more efficient compared with existing technologies
They cannot predict that blockchain would become an industry standard in the near future
Perceived risks (PR)In my opinion, organizations do not adopt blockchain when they perceive that:
Blockchain is not secured
Their transactions’ information will be compromised while using blockchain
Blockchain will not provide its expected benefits
Intention to adopt blockchain (INT)In my opinion:
Organizations would adopt blockchain whenever they will have access to it in the future
Organizations would adopt blockchain in the future
Organizations would adopt blockchain frequently in the future

Appendix B

Screening Questions
Q1. Which country do you belong to? Please select from the list of countries given below.
(survey exits if a respondent selects a country other than Australia)
Q2. Which of the following age groups best describes you?
(survey exits if a respondent select age less than 18 years)
Q3. Please indicate which of the following technologies best describes your knowledge/experience?
B2B-Commerce
Blockchain Technology
Electronic Data Interchange (EDI)
Distributed DBMS
Other (please type)
(survey exits if a respondent does not select “Blockchain Technology”)
Q4. Please indicate which of the following technologies your organization has been involved with?
B2B-Commerce
Cloud Computing
RFID
Robotics
Internet of Things (IoT)
Blockchain Technology
Electronic Data Interchange (EDI)
Artificial Intelligence
Distributed DBMS
Social Media Technologies
Gaming
Other
(survey exits if a respondent does not select “Blockchain Technology”)
Q5. Please indicate which of the following job titles best describes your role?
Chief Executive Officer President Chairperson
Chief Technology Officer Chief Information Officer Chief Digital Officer
IT Manager
Business Development Manager
Other
IT Director
Technology Strategy Manager
Finance Director Finance Manager
Customer Service Manager
Database Administrator
Supply Chain Manager
Store Manager
Sales Manager
Other
(survey exits if a respondent does not select IT related job)
Q6. How many years of knowledge/experience of blockchain technology do you have?
Less than 3 years
3–4 years
5–7 years
8–10 years
Above 10 years
(survey exits if a respondent selects “Less than 3 years”)
Q7. How would you rate your knowledge of blockchain technology?
Little knowledge of blockchain technology
Good knowledge of blockchain technology
Excellent knowledge of blockchain technology
(survey exits if a respondent selects “Little knowledge of blockchain technology”)
Q8. What is/was the status of involvement of your organization with blockchain technology?
Currently interested in blockchain technology and actively seeking related information
Currently in the process of deciding adoption of blockchain technology
Currently implemented blockchain technology
Previously implemented blockchain technology, but currently not using
Q9. What is/was the size of your organization in terms of the number of employees?
Having employees between 1 and 4
Having employees between 5 and 19
Having employees between 20 and 199
Having employees more than 200
Q10. What is the annual revenue of your organization?
Less than $1 million
Between $1–5 million
Between $5–50 million
Above $50 million
Q11. Which of the following industries describes your organization?
Automotive
Electronics
Services
Chemical
Finance/Banking
Insurance
Construction
Manufacturing
Education
Consultancy
Pharmaceutical
Information Technology
Supply Chain
Real Estate
Government
Telecommunication
Retail
Transport
Legal
Other
Q12. What type of blockchain technology you have knowledge/experience of?
Public
Private
Hybrid
Other (please type)
Q13. What is the highest level of your education?
College Certificate
Undergraduate Degree
Postgraduate Degree or Higher
Professional Certificate/Diploma
Other (please type)
Q14. What is your gender?
Male
Female
Not Specified

References

  1. Nakamoto, S. Bitcoin: A peer-to-peer electronic cash system. Decentralized Bus. Rev. 2008. [Google Scholar] [CrossRef]
  2. Gorkhali, A.; Li, L.; Shrestha, A. Blockchain: A literature review. J. Manag. Anal. 2020, 7, 321–343. [Google Scholar] [CrossRef]
  3. Casino, F.; Dasaklis, T.K.; Patsakis, C. A systematic literature review of blockchain-based applications: Current status, classification and open issues. Telemat. Inform. 2019, 36, 55–81. [Google Scholar] [CrossRef]
  4. Alketbi, A.; Nasir, Q.; Talib, M.A. Blockchain for government services—Use cases, security benefits and challenges. In Proceedings of the 15th Learning and Technology Conference (L&T), Jeddah, Saudi Arabia, 25–26 February 2018; pp. 112–119. [Google Scholar]
  5. Ganne, E. Can Blockchain Revolutionize International Trade? World Trade Organization: Geneva, Switzerland, 2018. [Google Scholar]
  6. La Cava, A.; Naatus, M.K. Disrupting business as usual: Blockchain startups in the international remittance market. Int. J. Innov. Digit. Econ. 2020, 11, 47–54. [Google Scholar] [CrossRef] [Green Version]
  7. Mohammed, A.; Potdar, V.; Yang, L. Key factors affecting blockchain adoption in organizations. In Proceedings of the International Conference on Big Data and Security, Nanjing, China, 20–22 December 2019; pp. 455–467. [Google Scholar]
  8. Underwood, S. Blockchain beyond bitcoin. Commun. ACM 2016, 59, 15–17. [Google Scholar] [CrossRef]
  9. Tapscott, D.; Tapscott, A. How blockchain will change organizations. MIT Sloan Manag. Rev. 2017, 58, 10. [Google Scholar]
  10. Alzahrani, S.; Daim, T.U. Analysis of the cryptocurrency adoption decision: Literature review. In Proceedings of the Portland International Conference on Management of Engineering and Technology (PICMET), Portland, OR, USA, 25–29 August 2019; pp. 1–11. [Google Scholar]
  11. Chen, S.; Yan, J.; Tan, B.; Liu, X.; Li, Y. Processes and challenges for the adoption of blockchain technology in food supply chains: A thematic analysis. In Proceedings of the iConference, Washington, DC, USA, 31 March–3 April 2019. [Google Scholar]
  12. Xu, M.; Chen, X.; Kou, G. A systematic review of blockchain. Financ. Innov. 2019, 5, 27. [Google Scholar] [CrossRef] [Green Version]
  13. Lakhani, K.; Iansiti, M. The truth about blockchain. Harv. Bus. Rev. 2017, 95, 119–127. [Google Scholar]
  14. PwC. Global Blockchain Survey. Available online: https://www.pwccn.com/en/research-and-insights/publications/global-blockchain-survey-2018/global-blockchain-survey-2018-report.pdf (accessed on 23 July 2021).
  15. Deloitte. Global Blockchain Survey. Available online: https://www2.deloitte.com/content/dam/Deloitte/cz/Documents/financial-services/cz-2018-deloitte-global-blockchain-survey.pdf (accessed on 23 July 2021).
  16. Woodside, J.M.; Augustine, F.K., Jr.; Giberson, W. Blockchain technology adoption status and strategies. J. Int. Technol. Inf. Manag. 2017, 26, 65–93. [Google Scholar]
  17. ACS. Blockchain Challenges for Australia. Available online: https://www.acs.org.au/content/dam/acs/acs-publications/ACS-Blockchain-Technical-Whitepaper-2019.pdf (accessed on 23 July 2021).
  18. Gunasekera, D.; Valenzuela, E. Adoption of blockchain technology in the australian grains trade: An assessment of potential economic effects. Econ. Pap. 2020. [Google Scholar] [CrossRef]
  19. Maroun, E.; Daniel, J. Opportunities for use of blockchain technology in supply chains: Australian manufacturer case study. In Proceedings of the International Conference on Industrial Engineering and Operations Management (IEOM), Bangkok, Thailand, 5–7 March 2019. [Google Scholar]
  20. Holotiuk, F.; Moormann, J. Organizational adoption of digital innovation: The case of blockchain technology. In Proceedings of the European Conference on Information Systems (ECIS), Portsmouth, UK, 23–28 June 2018. [Google Scholar]
  21. Wong, L.-W.; Leong, L.-Y.; Hew, J.-J.; Tan, G.W.-H.; Ooi, K.-B. Time to seize the digital evolution: Adoption of blockchain in operations and supply chain management among Malaysian SMEs. Int. J. Inf. Manag. 2019, 52, 101997. [Google Scholar] [CrossRef]
  22. Clohessy, T.; Acton, T. Investigating the influence of organizational factors on blockchain adoption. Ind. Manag. Data Syst. 2019, 119, 1457–1491. [Google Scholar] [CrossRef]
  23. Hong, W.; Chan, F.K.; Thong, J.Y.; Chasalow, L.C.; Dhillon, G. A framework and guidelines for context-specific theorizing in information systems research. Inf. Syst. Res. 2013, 25, 111–136. [Google Scholar] [CrossRef]
  24. Chandra, S.; Kumar, K.N. Exploring factors influencing organisational adoption of augmented reality in e-commerce: Empirical analysis using Technology-Organisation-Environment model. J. Electron. Commer. Res. 2018, 19, 237–265. [Google Scholar]
  25. Orji, I.J.; Kusi-Sarpong, S.; Huang, S.; Vazquez-Brust, D. Evaluating the factors that influence blockchain adoption in the freight logistics industry. Transp. Res. Part E 2020, 141, 102025. [Google Scholar] [CrossRef]
  26. De Castro, P.; Tanner, M.; Johnston, K. Perceived factors influencing blockchain adoption in the asset and wealth management industry in the Western Cape, South Africa. In Proceedings of the International Development Informatics Association Conference, Macau, China, 25–27 March 2020; pp. 48–62. [Google Scholar]
  27. Albrecht, S.; Reichert, S.; Schmid, J.; Strüker, J.; Neumann, D.; Fridgen, G. Dynamics of blockchain implementation-a case study from the energy sector. In Proceedings of the 51st Hawaii International Conference on System Sciences, Waikoloa Village, HI, USA, 2–6 January 2018. [Google Scholar]
  28. Umrani, W.A.; Kura, K.M.; Ahmed, U. Corporate entrepreneurship and business performance. PSU Res. Rev. 2018. [Google Scholar] [CrossRef] [Green Version]
  29. Baron, R.M.; Kenny, D.A. The moderator–mediator variable distinction in social psychological research: Conceptual, strategic, and statistical considerations. J. Personal. Soc. Psychol. 1986, 51, 1173. [Google Scholar] [CrossRef]
  30. Dobrovnik, M.; Herold, D.M.; Fürst, E.; Kummer, S. Blockchain for and in logistics: What to adopt and where to start. Logistics 2018, 2, 18. [Google Scholar] [CrossRef] [Green Version]
  31. Barnes, B.W., III; Xiao, B. Organizational adoption of blockchain technology: An ecosystem perspective. In Proceedings of the Diffusion Interest Group In Information Technology, Munich, Germany, 15 December 2019. [Google Scholar]
  32. Kühn, O.; Jacob, A.; Schüller, M. Blockchain adoption at German logistics service providers. In Proceedings of the Artificial Intelligence and Digital Transformation in Supply Chain Management: Innovative Approaches for Supply Chains—Hamburg International Conference of Logistics (HICL), Hamburg, Germany, 25–27 September 2019; Volume 27, pp. 387–411. [Google Scholar]
  33. Wong, L.-W.; Tan, G.W.-H.; Lee, V.-H.; Ooi, K.-B.; Sohal, A. Unearthing the determinants of Blockchain adoption in supply chain management. Int. J. Prod. Res. 2020, 58, 2100–2123. [Google Scholar] [CrossRef] [Green Version]
  34. Bai, C.; Sarkis, J. A supply chain transparency and sustainability technology appraisal model for blockchain technology. Int. J. Prod. Res. 2020, 58, 2142–2162. [Google Scholar] [CrossRef]
  35. Kouhizadeh, M.; Saberi, S.; Sarkis, J. Blockchain technology and the sustainable supply chain: Theoretically exploring adoption barriers. Int. J. Prod. Econ. 2020, 231, 107831. [Google Scholar] [CrossRef]
  36. Ghode, D.; Yadav, V.; Jain, R.; Soni, G. Adoption of blockchain in supply chain: An analysis of influencing factors. J. Enterp. Inf. Manag. 2020, 33, 437–456. [Google Scholar] [CrossRef]
  37. Kalaitzi, D.; Jesus, V.; Campelos, I. Determinants of blockchain adoption and perceived benefits in food supply chain. In Proceedings of the Logistics Research Network (LRN), Northampton, UK, 4–6 September 2019. [Google Scholar]
  38. Loklindt, C.; Moeller, M.-P.; Kinra, A. How blockchain could be implemented for exchanging documentation in the shipping industry. In Proceedings of the International Conference on Dynamics in Logistics, Bremen, Germany, 20–22 February 2018; pp. 194–198. [Google Scholar]
  39. Post, R.; Smit, K.; Zoet, M. Identifying factors affecting blockchain technology diffusion. In Proceedings of the Americas Conference on Information Systems (AMCIS), New Orleans, LA, USA, 16–18 August 2018. [Google Scholar]
  40. Hoxha, V.; Sadiku, S. Study of factors influencing the decision to adopt the blockchain technology in real estate transactions in Kosovo. Prop. Manag. 2019, 37, 684–700. [Google Scholar] [CrossRef]
  41. Kulkarni, M.; Patil, K. Block chain technology adoption for banking services-model based on technology-organization-environment theory. SSRN 2020. [Google Scholar] [CrossRef]
  42. Koster, F.; Borgman, H. New kid on the block! Understanding blockchain adoption in the public sector. In Proceedings of the 53rd Hawaii International Conference on System Sciences, Maui, HI, USA, 7–10 January 2020. [Google Scholar]
  43. Choi, D.; Chung, C.Y.; Seyha, T.; Young, J. Factors affecting organizations’ resistance to the adoption of blockchain technology in supply networks. Sustainability 2020, 12, 8882. [Google Scholar] [CrossRef]
  44. Malik, S.; Chadhar, M.; Chetty, M.; Vatanasakdakul, S. An exploratory study of the adoption of blockchain technology among australian organizations: A theoretical model. In Proceedings of the European, Mediterranean, and Middle Eastern Conference on Information Systems, Dubai, United Arab Emirates, 25–26 November 2020; pp. 205–220. [Google Scholar]
  45. Yadav, V.S.; Singh, A.; Raut, R.D.; Govindarajan, U.H. Blockchain technology adoption barriers in the Indian agricultural supply chain: An integrated approach. Resour. Conserv. Recycl. 2020, 161, 104877. [Google Scholar] [CrossRef]
  46. Malik, M.S.; Chadhar, M.; Chetty, M. Factors Affecting the Organizational Adoption of Blockchain Technology: An Australian Perspective. In Proceedings of the 54th Hawaii International Conference on System Sciences, Kauai, HI, USA, 5–8 January 2021. [Google Scholar]
  47. Zhou, Y.; Soh, Y.S.; Loh, H.S.; Yuen, K.F. The key challenges and critical success factors of blockchain implementation: Policy implications for Singapore’s maritime industry. Mar. Policy 2020, 122, 104265. [Google Scholar] [CrossRef]
  48. Novak, M. Crypto-friendliness: Understanding blockchain public policy. J. Entrep. Public Policy 2019, 9, 165–184. [Google Scholar] [CrossRef]
  49. Australia, S. Roadmap for Blockchain Standards. Available online: https://www.standards.org.au/getmedia/ad5d74db-8da9-4685-b171-90142ee0a2e1/Roadmap_for_Blockchain_Standards_report.pdf.aspx (accessed on 24 July 2021).
  50. DISER. The National Blockchain Roadmap. Available online: https://www.industry.gov.au/sites/default/files/2020-02/national-blockchain-roadmap.pdf (accessed on 24 July 2021).
  51. Garrard, R.; Fielke, S. Blockchain for trustworthy provenances: A case study in the Australian aquaculture industry. Technol. Soc. 2020, 62, 101298. [Google Scholar] [CrossRef]
  52. Cao, S.; Powell, W.; Foth, M.; Natanelov, V.; Miller, T.; Dulleck, U. Strengthening consumer trust in beef supply chain traceability with a blockchain-based human-machine reconcile mechanism. Comput. Electron. Agric. 2020, 180, 105886. [Google Scholar] [CrossRef]
  53. Monroe, J.G.; Hansen, P.; Sorell, M.; Berglund, E.Z. Agent-based model of a blockchain enabled peer-to-peer energy market: Application for a neighborhood trial in Perth, Australia. Smart Cities 2020, 3, 53. [Google Scholar] [CrossRef]
  54. Foth, M.; McQueenie, J. Creatives in the country? Blockchain and agtech can create unexpected jobs in regional Australia. The Conversation, 12 June 2019. [Google Scholar]
  55. AUSTRADE. Australian Digital Innovation on the Rise. Available online: https://www.austrade.gov.au/international/invest/resources/publications (accessed on 5 June 2021).
  56. ACS. Blockchain 2030, A Look at the Future of Blockchain in Australia. Available online: https://www.acs.org.au/content/dam/acs/acs-publications/ACS-Data61-Blockchain-2030-Report.pdf (accessed on 5 August 2020).
  57. Ward, O.; Rochemont, S. Understanding Central Bank Digital Currencies. Available online: https://www.actuaries.org.uk/system/files/field/document/Understanding%20CBDCs%20Final%20-%20disc.pdf (accessed on 2 February 2021).
  58. Tornatsky, L.; Fleischer, M. The Process of Technology Innovation; Lexington Books: Lexington, MA, USA, 1990. [Google Scholar]
  59. Rogers, E.M. Diffusion of Innovations; Simon and Schuster: New York, NY, USA, 2003. [Google Scholar]
  60. DiMaggio, P.J.; Powell, W.W. The iron cage revisited: Institutional isomorphism and collective rationality in organizational fields. Am. Sociol. Rev. 1983, 48, 147–160. [Google Scholar] [CrossRef] [Green Version]
  61. Oliveira, T.; Martins, M.F. Literature review of information technology adoption models at firm level. Electron. J. Inf. Syst. Eval. 2011, 14, 110. [Google Scholar]
  62. Baker, J. The technology–organization–environment framework. In Information Systems Theory; Springer: Berlin/Heidelberg, Germany, 2012; pp. 231–245. [Google Scholar]
  63. Sadhya, V.; Sadhya, H. Barriers to adoption of blockchain technology. In Proceedings of the Americas Conference on Information Systems, New Orleans, LA, USA, 16–18 August 2018. [Google Scholar]
  64. Al-Jabri, I.M.; Roztocki, N. Adoption of ERP systems: Does information transparency matter? Telemat. Inform. 2015, 32, 300–310. [Google Scholar] [CrossRef]
  65. Rizal Batubara, F.; Ubacht, J.; Janssen, M. Unraveling transparency and accountability in blockchain. In Proceedings of the 20th Annual International Conference on Digital Government Research, Dubai, United Arab Emirates, 18–20 June 2019; pp. 204–213. [Google Scholar]
  66. Wamba, S.F.; Queiroz, M.M.; Trinchera, L. Dynamics between blockchain adoption determinants and supply chain performance: An empirical investigation. Int. J. Prod. Econ. 2020, 229, 107791. [Google Scholar] [CrossRef]
  67. Quiniou, M. Blockchain: The Advent of Disintermediation; Wiley Online Library: Hoboken, NJ, USA, 2019. [Google Scholar]
  68. Parekh, J.; Jaffer, A.; Bhanushali, U.; Shukla, S. Disintermediation in medical tourism through blockchain technology: An analysis using value-focused thinking approach. Inf. Technol. Tour. 2020, 23, 1–28. [Google Scholar] [CrossRef]
  69. O’Dair, M. The networked record industry: How blockchain technology could transform the consumption and monetisation of recorded music. Strateg. Chang. 2017, 26, 471–480. [Google Scholar] [CrossRef]
  70. Newby, M.; Nguyen, T.H.; Waring, T.S. Understanding customer relationship management technology adoption in small and medium-sized enterprises. J. Enterp. Inf. Manag. 2014, 27, 541–560. [Google Scholar] [CrossRef]
  71. Thong, J.Y.; Yap, C.-S. CEO characteristics, organizational characteristics and information technology adoption in small businesses. Omega 1995, 23, 429–442. [Google Scholar] [CrossRef]
  72. Lin, J.; Luo, Z.; Luo, X. Understanding the roles of institutional pressures and organizational innovativeness in contextualized transformation toward e-business: Evidence from agricultural firms. Int. J. Inf. Manag. 2020, 51, 102025. [Google Scholar] [CrossRef]
  73. Nuryyev, G.; Wang, Y.-P.; Achyldurdyyeva, J.; Jaw, B.-S.; Yeh, Y.-S.; Lin, H.-T.; Wu, L.-F. Blockchain technology adoption behavior and sustainability of the business in tourism and hospitality SMEs: An empirical study. Sustainability 2020, 12, 1256. [Google Scholar] [CrossRef]
  74. Argyris, C.; Schon, D.A. Organizational Learning: A Theory of Action Perspective; Addison-Wesley: New York, NY, USA, 1978. [Google Scholar]
  75. Woiceshyn, J. Technology adoption: Organizational learning in oil firms Jaana Woiceshyn. Organ. Stud. 2000, 21, 1095–1118. [Google Scholar] [CrossRef]
  76. Werner, F.; Basalla, M.; Schneider, J.; Hayes, D.; Vom Brocke, J. Blockchain adoption from an interorganizational systems perspective–a mixed-methods approach. Inf. Syst. Manag. 2020, 38, 1–16. [Google Scholar]
  77. Blind, K.; Petersen, S.S.; Riillo, C.A. The impact of standards and regulation on innovation in uncertain markets. Res. Policy 2017, 46, 249–264. [Google Scholar] [CrossRef]
  78. Cumming, D.J.; Johan, S.; Pant, A. Regulation of the crypto-economy: Managing risks, challenges, and regulatory uncertainty. J. Risk Financ. Manag. 2019, 12, 126. [Google Scholar] [CrossRef] [Green Version]
  79. Shanaev, S.; Sharma, S.; Ghimire, B.; Shuraeva, A. Taming the blockchain beast? Regulatory implications for the cryptocurrency Market. Res. Int. Bus. Financ. 2020, 51, 101080. [Google Scholar] [CrossRef]
  80. Peter, J.P.; Ryan, M.J. An investigation of perceived risk at the brand level. J. Mark. Res. 1976, 13, 184–188. [Google Scholar] [CrossRef]
  81. Luo, X.; Li, H.; Zhang, J.; Shim, J.P. Examining multi-dimensional trust and multi-faceted risk in initial acceptance of emerging technologies: An empirical study of mobile banking services. Decis. Support Syst. 2010, 49, 222–234. [Google Scholar] [CrossRef]
  82. Tseng, S.-Y.; Wang, C.-N. Perceived risk influence on dual-route information adoption processes on travel websites. J. Bus. Res. 2016, 69, 2289–2296. [Google Scholar] [CrossRef]
  83. Kesharwani, A.; Bisht, S.S. The impact of trust and perceived risk on internet banking adoption in India: An extension of technology acceptance model. Int. J. Bank Mark. 2012, 30, 303–322. [Google Scholar] [CrossRef]
  84. Khaksar, S.M.S.; Khosla, R.; Singaraju, S.; Slade, B. Carer’s perception on social assistive technology acceptance and adoption: Moderating effects of perceived risks. Behav. Inf. Technol. 2019, 40, 1–24. [Google Scholar] [CrossRef]
  85. Yoo, K.; Bae, K.; Park, E.; Yang, T. Understanding the diffusion and adoption of Bitcoin transaction services: The integrated approach. Telemat. Inform. 2019, 53, 101302. [Google Scholar] [CrossRef]
  86. Erturk, E.; Lopez, D.; Yu, W.Y. Benefits and risks of using blockchain in smart energy: A literature review. Contemp. Manag. Res. 2019, 15, 205–225. [Google Scholar] [CrossRef]
  87. Abramova, S.; Böhme, R. Perceived benefit and risk as multidimensional determinants of bitcoin use: A quantitative exploratory study. In Proceedings of the International Conference on Information Systems, Dublin, Ireland, 11–14 December 2016. [Google Scholar]
  88. Shen, C.-C.; Chiou, J.-S. The impact of perceived ease of use on Internet service adoption: The moderating effects of temporal distance and perceived risk. Comput. Hum. Behav. 2010, 26, 42–50. [Google Scholar] [CrossRef]
  89. Sekaran, U.; Bougie, R. Research Methods for Business: A Skill Building Approach; John Wiley and Sons: Hoboken, NJ, USA, 2016. [Google Scholar]
  90. Hair, J.F. Multivariate Data Analysis; Pearson: London, UK, 2009. [Google Scholar]
  91. Iacobucci, D. Structural equations modeling: Fit indices, sample size, and advanced topics. J. Consum. Psychol. 2010, 20, 90–98. [Google Scholar] [CrossRef]
  92. Yurdusev, A.N. ‘Level of analysis’ and ‘unit of analysis’: A case for distinction. Millennium 1993, 22, 77–88. [Google Scholar] [CrossRef]
  93. DeCarlo, M. Scientific Inquiry in Social Work; Open Social Work Education: Roanoke, VA, USA, 2018. [Google Scholar]
  94. Schonlau, M.; Ronald, D., Jr.; Elliott, M.N. Conducting Research Surveys Via E-Mail and the Web; Rand Corporation: Santa Monica, CA, USA, 2002. [Google Scholar]
  95. Schmidt, W.C. World-Wide Web survey research: Benefits, potential problems, and solutions. Behav. Res. Methods Instrum. Comput. 1997, 29, 274–279. [Google Scholar] [CrossRef]
  96. MacKenzie, S.B.; Podsakoff, P.M.; Podsakoff, N.P. Construct measurement and validation procedures in MIS and behavioral research: Integrating new and existing techniques. MIS Q. 2011, 35, 293–334. [Google Scholar] [CrossRef]
  97. Chwelos, P.; Benbasat, I.; Dexter, A.S. Empirical test of an EDI adoption model. Inf. Syst. Res. 2001, 12, 304–321. [Google Scholar] [CrossRef] [Green Version]
  98. Rawashdeh, A.; Al-namlah, L. Factors influencing electronic data interchange adoption among small and medium enterprises in Saudi Arabia. AJBA 2017, 10, 253–280. [Google Scholar]
  99. Moore, G.C.; Benbasat, I. Development of an instrument to measure the perceptions of adopting an information technology innovation. Inf. Syst. Res. 1991, 2, 192–222. [Google Scholar] [CrossRef] [Green Version]
  100. Atkinson, N.L. Developing a questionnaire to measure perceived attributes of eHealth innovations. Am. J. Health Behav. 2007, 31, 612–621. [Google Scholar] [CrossRef] [PubMed]
  101. Teo, H.-H.; Wei, K.K.; Benbasat, I. Predicting intention to adopt interorganizational linkages: An institutional perspective. MIS Q. 2003, 27, 19–49. [Google Scholar] [CrossRef] [Green Version]
  102. Terry Anthony Byrd, D.E.T. Measuring the flexibility of information technology infrastructure: Exploratory analysis of a construct. J. Manag. Inf. Syst. 2000, 17, 167–208. [Google Scholar]
  103. Soliman, K.S.; Janz, B.D. An exploratory study to identify the critical factors affecting the decision to establish Internet-based interorganizational information systems. Inf. Manag. 2004, 41, 697–706. [Google Scholar] [CrossRef]
  104. Igbaria, M.; Zinatelli, N.; Cragg, P.; Cavaye, A.L. Personal computing acceptance factors in small firms: A structural equation model. MIS Q. 1997, 21, 279–305. [Google Scholar] [CrossRef]
  105. Venkatesh, V.; Bala, H. Adoption and impacts of interorganizational business process standards: Role of partnering synergy. Inf. Syst. Res. 2012, 23, 1131–1157. [Google Scholar] [CrossRef] [Green Version]
  106. Muñoz-Pascual, L.; Curado, C.; Galende, J. How does the use of information technologies affect the adoption of environmental practices in SMEs? A mixed-methods approach. Rev. Manag. Sci. 2019, 15, 1–28. [Google Scholar] [CrossRef]
  107. Tan, M.; Teo, T.S. Factors influencing the adoption of Internet banking. J. Assoc. Inf. Syst. 2000, 1, 5. [Google Scholar] [CrossRef] [Green Version]
  108. Zhu, K.; Dong, S.; Xu, S.X.; Kraemer, K.L. Innovation diffusion in global contexts: Determinants of post-adoption digital transformation of European companies. Eur. J. Inf. Syst. 2006, 15, 601–616. [Google Scholar] [CrossRef]
  109. Zhu, K.; Kraemer, K.L.; Dedrick, J. Information technology payoff in e-business environments: An international perspective on value creation of e-business in the financial services industry. J. Manag. Inf. Syst. 2004, 21, 17–54. [Google Scholar] [CrossRef]
  110. Featherman, M.S.; Pavlou, P.A. Predicting e-services adoption: A perceived risk facets perspective. Int. J. Hum. Comput. Stud. 2003, 59, 451–474. [Google Scholar] [CrossRef] [Green Version]
  111. Kim, D.; Ammeter, T. Predicting personal information system adoption using an integrated diffusion model. Inf. Manag. 2014, 51, 451–464. [Google Scholar] [CrossRef]
  112. Lewis, J.R. Multipoint scales: Mean and median differences and observed significance levels. Int. J. Hum. Comput. Interact. 1993, 5, 383–392. [Google Scholar] [CrossRef]
  113. Cox, E.P., III. The optimal number of response alternatives for a scale: A review. J. Mark. Res. 1980, 17, 407–422. [Google Scholar] [CrossRef]
  114. Cavana, R.; Delahaye, B.; Sekeran, U. Applied Business Research: Qualitative and Quantitative Methods; John Wiley and Sons: Hoboken, NJ, USA, 2001. [Google Scholar]
  115. Urbach, N.; Ahlemann, F. Structural equation modeling in information systems research using partial least squares. J. Inf. Technol. Theory Appl. 2010, 11, 5–40. [Google Scholar]
  116. Ramli, N.A.; Latan, H.; Nartea, G.V. Why should PLS-SEM be used rather than regression? Evidence from the capital structure perspective. In Partial Least Squares Structural Equation Modeling; Springer: Berlin/Heidelberg, Germany, 2018; pp. 171–209. [Google Scholar]
  117. Cuddeback, G.; Wilson, E.; Orme, J.G.; Combs-Orme, T. Detecting and statistically correcting sample selection bias. J. Soc. Serv. Res. 2004, 30, 19–33. [Google Scholar] [CrossRef]
  118. Hair, J.F., Jr.; Hult, G.T.M.; Ringle, C.; Sarstedt, M. A Primer on Partial Least Squares Structural Equation Modeling (PLS-SEM); Sage Publications: Thousand Oaks, CA, USA, 2016. [Google Scholar]
  119. Podsakoff, P.M.; MacKenzie, S.B.; Lee, J.-Y.; Podsakoff, N.P. Common method biases in behavioral research: A critical review of the literature and recommended remedies. J. Appl. Psychol. 2003, 88, 879. [Google Scholar] [CrossRef]
  120. Podsakoff, P.M.; MacKenzie, S.B.; Podsakoff, N.P. Sources of method bias in social science research and recommendations on how to control it. Annu. Rev. Psychol. 2012, 63, 539–569. [Google Scholar] [CrossRef] [Green Version]
  121. Hair, J.F.; Ringle, C.M.; Sarstedt, M. PLS-SEM: Indeed a silver bullet. J. Mark. Theory Pract. 2011, 19, 139–152. [Google Scholar] [CrossRef]
  122. Fornell, C.; Larcker, D.F. Evaluating structural equation models with unobservable variables and measurement error. J. Mark. Res. 1981, 18, 39–50. [Google Scholar] [CrossRef]
  123. Vatanasakdakul, S.; Aoun, C.; Putra, Y.H.S. Social media in micro-enterprises: Exploring adoption in the indonesian retail sector. J. Glob. Inf. Manag. (JGIM) 2020, 28, 184–203. [Google Scholar] [CrossRef]
  124. Chin, W.W. The partial least squares approach to structural equation modeling. Mod. Methods Bus. Res. 1998, 295, 295–336. [Google Scholar]
  125. Cohen, J. Statistical Power Analysis for the Behavioral Sciences; Academic Press: Cambridge, MA, USA, 2013. [Google Scholar]
  126. Cohen, J.; Cohen, P.; West, S.G.; Aiken, L.S. Applied Multiple Regression/Correlation Analysis for the Behavioral Sciences; Routledge: Abingdon-on-Thames, UK, 2013. [Google Scholar]
  127. Chin, W.W.; Marcolin, B.L.; Newsted, P.R. A partial least squares latent variable modeling approach for measuring interaction effects: Results from a Monte Carlo simulation study and an electronic-mail emotion/adoption study. Inf. Syst. Res. 2003, 14, 189–217. [Google Scholar] [CrossRef] [Green Version]
  128. Gastwirth, J.L.; Gel, Y.R.; Miao, W. The impact of Levene’s test of equality of variances on statistical theory and practice. Stat. Sci. 2009, 24, 343–360. [Google Scholar] [CrossRef] [Green Version]
  129. Stone, M. Cross-validatory choice and assessment of statistical predictions. J. R. Stat. Soc. Ser. B 1974, 36, 111–133. [Google Scholar] [CrossRef]
  130. Geisser, S. The predictive sample reuse method with applications. J. Am. Stat. Assoc. 1975, 70, 320–328. [Google Scholar] [CrossRef]
  131. Chin, W.W. How to write up and report PLS analyses. In Handbook of Partial Least Squares; Springer: Berlin/Heidelberg, Germany, 2010; pp. 655–690. [Google Scholar]
  132. Henseler, J.; Chin, W.W. A comparison of approaches for the analysis of interaction effects between latent variables using partial least squares path modeling. Struct. Equ. Modeling 2010, 17, 82–109. [Google Scholar] [CrossRef]
  133. Chin, W.W. Bootstrap cross-validation indices for PLS path model assessment. In Handbook of Partial Least Squares; Springer: Berlin/Heidelberg, Germany, 2010; pp. 83–97. [Google Scholar]
  134. Adams, R.; Parry, G.; Godsiff, P.; Ward, P. The future of money and further applications of the blockchain. Strateg. Chang. 2017, 26, 417–422. [Google Scholar] [CrossRef]
  135. Kim, S.H. A study on blockchain technology adoption and intention of logistics firms in Korea. J. Korea Soc. Comput. Inf. 2020, 25, 231–239. [Google Scholar]
  136. Johnson, V. Organizational Learning through Disruptive Digital Innovation. A Blockchain Implementation. Available online: https://scholarworks.gsu.edu/bus_admin_diss/118/ (accessed on 23 July 2021).
  137. Stratopoulos, T.C.; Wang, V.X.; Ye, J. Blockchain technology adoption. SSRN 2020. [Google Scholar] [CrossRef]
  138. Chalmers, D.; Matthews, R.; Hyslop, A. Blockchain as an external enabler of new venture ideas: Digital entrepreneurs and the disintermediation of the global music industry. J. Bus. Res. 2019, 125, 577–591. [Google Scholar] [CrossRef]
  139. Guo, Y.; Liang, C. Blockchain application and outlook in the banking industry. Financ. Innov. 2016, 2, 24. [Google Scholar] [CrossRef] [Green Version]
Figure 1. The TOE framework [58].
Sustainability 13 09404 g001
Figure 2. Extended TOE framework for the organizational adoption of BCT in the Australian context.
Sustainability 13 09404 g002
Table 1. Comparison of Australia with other countries for the contextual characteristics [23].
CountryCharacteristics
Technology
Readiness Index
Networked Readiness IndexUncertainty
Avoidance Index
Germany9.1562577.4865
Ireland8.0312572.1335
Malaysia7.4687561.4336
Australia9.7187575.0951
Table 2. Factors affecting the organizational adoption of BCT.
TOE ContextsFactorsSources
Technological factorsComplexity, compatibility, cost, relative advantages, security, privacy, scalability, availability of specific BCT tools, trialability, observability, immutability, transactions speed, perceived novelty, disintermediation, perceived benefits, computability, infrastructural facility, increase in data availability, reduction of information asymmetry, easy verification of transactions, comprehensibility of the transactions, data accuracy and reliability, exclusion of false information from contractual information, hacking attempts system denials, high-security encryption, contract conclusion with a reasonable fee, transparency, integrity, confidentiality, interoperability, perceived challenges, hype, trust, storage capacity, decentralization, inclusiveness, territoriality, maturity[7,18,21,25,26,27,30,37,38,40,41,42,43,44,45]
Organizational factorsTop management support, top management knowledge/awareness, firm size, capability of human resources, financial resources, presence of training facilities, organizational culture, supportive technological environment, perceived risk of vendor lock-in, perceived efforts in collaboration, organization learning capability, organization innovativeness, IT governance, huge resources (energy, infrastructure), high need for process harmonization, firm scope, existing infrastructure, learning culture[22,25,26,32,37,41,42,43,44,46]
Environmental factorsRegulations, competitive pressure, government policy/support, stakeholder pressure, customer pressure, trading partner readiness, legal/standards uncertainties, institutional-based trust, technology progress in the industry, support from the community, professional consultation and assistance, perceived constraint of infrastructure, market turbulence, market power, market dynamics, customer readiness, consensus among trading partners, characteristics of industry[21,25,26,27,32,37,41,42,43,44,46,47]
Table 3. Summary of the stratified random sampling and response rate.
Type of IndustryTotal PopulationSamplePercentage (Out of 917)ResponsePercentage (Out of 500)
Automotive17111.271.4
Construction1180.8730.6
Consultancy56303.27142.8
Education117616.65214.2
Electronics28161.7471.4
Finance80444.8132.6
Government320.2210.2
IT21911212.21438.6
Insurance56303.27122.4
Manufacturing38232.51112.2
Pharmaceutical46262.8491.8
Retail29171.8581.6
Supply chain145758.18295.8
Telecommunication24151.6471.4
Transport33202.1881.6
Legal15101.0930.6
Total91750054.5319639.2
Table 4. Factor, their measuring items, and source.
FactorMeasuring ItemsSource
Perceived benefits (PB)Blockchain reduces overhead expenses[97,98]
Blockchain reduces data error rates
Blockchain reduces transaction costs while transferring funds
Blockchain saves time while accomplishing business tasks
Blockchain increases the organization’s overall productivity
Perceived compatibility (PC)Blockchain fits well with business processes[99,100]
Blockchain is compatible with technological infrastructure
Blockchain fits well with technological skills
Perceived complexity (PCM)Blockchain requires extra technical skills to use[99]
Blockchain is difficult to understand from a business perspective
Blockchain is conceptually difficult to understand from a technical perspective
Perceived information transparency (PIT)Access to information across the blockchain[101]
View of any activity with the data in the blockchain
See the flow of the entire data in the blockchain
Perceived disintermediation (PD)Store data without the involvement of any intermediaryAuthors
Access data without the involvement of any intermediary
Share data without the involvement of any intermediary
Audit without the involvement of any intermediary
Top management support (TMS)Provides the necessary resources for blockchain[102,103]
Considers blockchain as strategically important
Actively involved in IT-related decisions
Organizational innovativeness (OI)Actively seek new ideas[104]
Like to do things in new ways
Are open to taking risks
Organizational learning capability (OLC)Have a mechanism to store new knowledge[105]
Encourage their employees to acquire new knowledge and skills
Employees share their work experiences, ideas, or learning with each other
Have practices to utilize new knowledge in their IT-related decisions
Government support (GS)Policies support the adoption of blockchain[98]
Introduces economic incentives for blockchain adoption
Is active in setting up the facilities to promote blockchain
Trading partner readiness (TPR)Willing to adopt blockchain[97]
Technologically ready to adopt blockchain
Financially ready to adopt blockchain
Competitive intensity (CI)Feel pressure when competitors have adopted blockchain[106]
Feel the fear of losing a competitive advantage if they do not adopt it
See competitors benefiting from adopting blockchain
Standards uncertainty (SU)See blockchain has not reached its maturity[104]
See blockchain still requires changes to become more efficient compared with existing technologies
Cannot predict that blockchain would become an industry standard in the near future
Perceived risks (PR)It is not secured[107]
Transactions’ information will be compromised while using it
It will not provide its expected benefits
Intention to adopt blockchain (INT)Adopt blockchain whenever they will have access to it in the future[108]
Adopt blockchain in the future
Adopt blockchain frequently in the future
Table 5. Reliability of constructs and their measuring items.
Construct with Measuring ItemsOuter LoadingsCRAVECronbach’s Alpha
Competitive Intensity (CI) 0.8630.6780.761
CI10.754
CI20.879
CI30.831
Perceived Complexity (PCM) 0.8940.7380.823
CMP10.829
CMP20.869
CMP30.878
Government Support (GS) 0.9000.7490.833
GS10.863
GS20.846
GS30.887
Intention to adopt BCT (INT) 0.8810.7110.796
INT10.786
INT20.858
INT30.883
Organization Innovativeness (OI) 0.8870.7240.810
OI10.829
OI20.856
OI30.868
Organization Learning Capability (OLC) 0.8870.6630.831
OLC10.778
OLC20.860
OLC30.782
OLC40.834
Perceived Benefits (PB) 0.9050.7040.859
PB10.776
PB20.871
PB30.851
PB40.856
Perceived Compatibility (PC) 0.8990.7490.833
PC10.866
PC20.847
PC30.883
Perceived Disintermediation (PD) 0.8790.6450.816
PD10.744
PD20.847
PD30.814
PD40.804
Perceived Information Transparency (PIT) 0.9290.8140.887
PIT10.889
PIT20.903
PIT30.914
Perceived Risks (PR) 0.8800.7110.797
PR10.834
PR20.806
PR30.887
Standards Uncertainty (SU) 0.8790.7080.793
SU10.777
SU20.876
SU30.867
Top Management Support (TMS) 0.8860.7220.807
TMS10.827
TMS20.875
TMS30.846
Trading Partner Readiness (TPR) 0.8860.7220.805
TPR10.773
TPR20.914
TPR30.857
Table 6. Correlation of constructs compared with the square root of AVEs.
ConstructsCIPCMGSINTOIOLCPBPCPDPITPRSUTMSTPR
CI0.823 *
PCM0.6820.859 *
GS0.0430.4110.866 *
INT0.3270.5810.5880.843 *
OI0.1590.3820.5050.2230.851 *
OLC0.2040.2220.1100.1950.6380.814 *
PB0.4100.5000.2250.5890.4350.2700.839 *
PC0.2900.0410.4810.5020.5770.5880.1630.865 *
PD0.5650.4900.1950.3230.0670.4840.2440.5680.803 *
PIT0.5000.6030.3650.0630.2170.1660.4570.4850.3480.902 *
PR0.2350.1110.4020.6840.3590.4050.3260.2150.6670.5180.843 *
SU0.1750.2990.0250.2700.1680.3830.0380.1300.5140.4630.6510.841 *
TMS0.2880.6200.3190.6010.5000.1470.5300.5010.0730.2190.1200.5980.850 *
TPR0.3040.3210.5400.3010.1010.0730.6310.0900.2970.3360.4750.2080.5330.850 *
* square root of AVEs.
Table 7. Path coefficient analysis.
HypothesisRelationshipPath Coefficientt-ValueDecision
H1PB→INT0.2593.947 *Supported
H2PC→INT0.1783.158 **Supported
H3CMP→INT−0.1653.859 **Supported
H4PIT→INT0.1633.713 *Supported
H5PD→INT0.3576.341 *Supported
H6OI→INT0.2734.770 *Supported
H7OLC→INT0.0562.371 **Supported
H8TMS→INT0.1243.102 *Supported
H9CI→INT0.2654.538 *Supported
H10GS→INT0.0412.337 *Supported
H11TPR→INT0.2103.950 *Supported
H12SU→INT−0.1703.185 *Supported
H13PR→INT−0.1462.506 *Supported
H13aPB→PR→INT−0.1040.951 **Not Supported
H13bPC→PR→INT−0.1632.204 *Supported
H13cPIT→PR→INT0.0871.995 *Supported
H13dPD→PR→INT0.1752.583 *Supported
H13eOI→PR→INT−0.2092.925 *Supported
H13fOLC→PR→INT−0.1021.252 **Not Supported
H13gTMS→PR→INT0.0260.458 **Not Supported
H13hCI→PR→INT0.3803.561 *Supported
H13iGS→PR→INT0.0080.265 **Not Supported
H13jTPR→PR→INT−0.0130.190 **Not Supported
** p < 0.01, * p < 0.05.
Publisher’s Note: MDPI stays neutral with regard to jurisdictional claims in published maps and institutional affiliations.

