
Regional Assessment of Land and Water Carrying Capacity and Utilization Efficiency in China


Abstract
:1. Introduction
2. Literature Review
3. Research Methods and Data Sources
3.1. Evaluation System for the Water and Land Resource Comprehensive Carrying Capacity
3.1.1. Constructing Index System
3.1.2. Determination of Index Weight
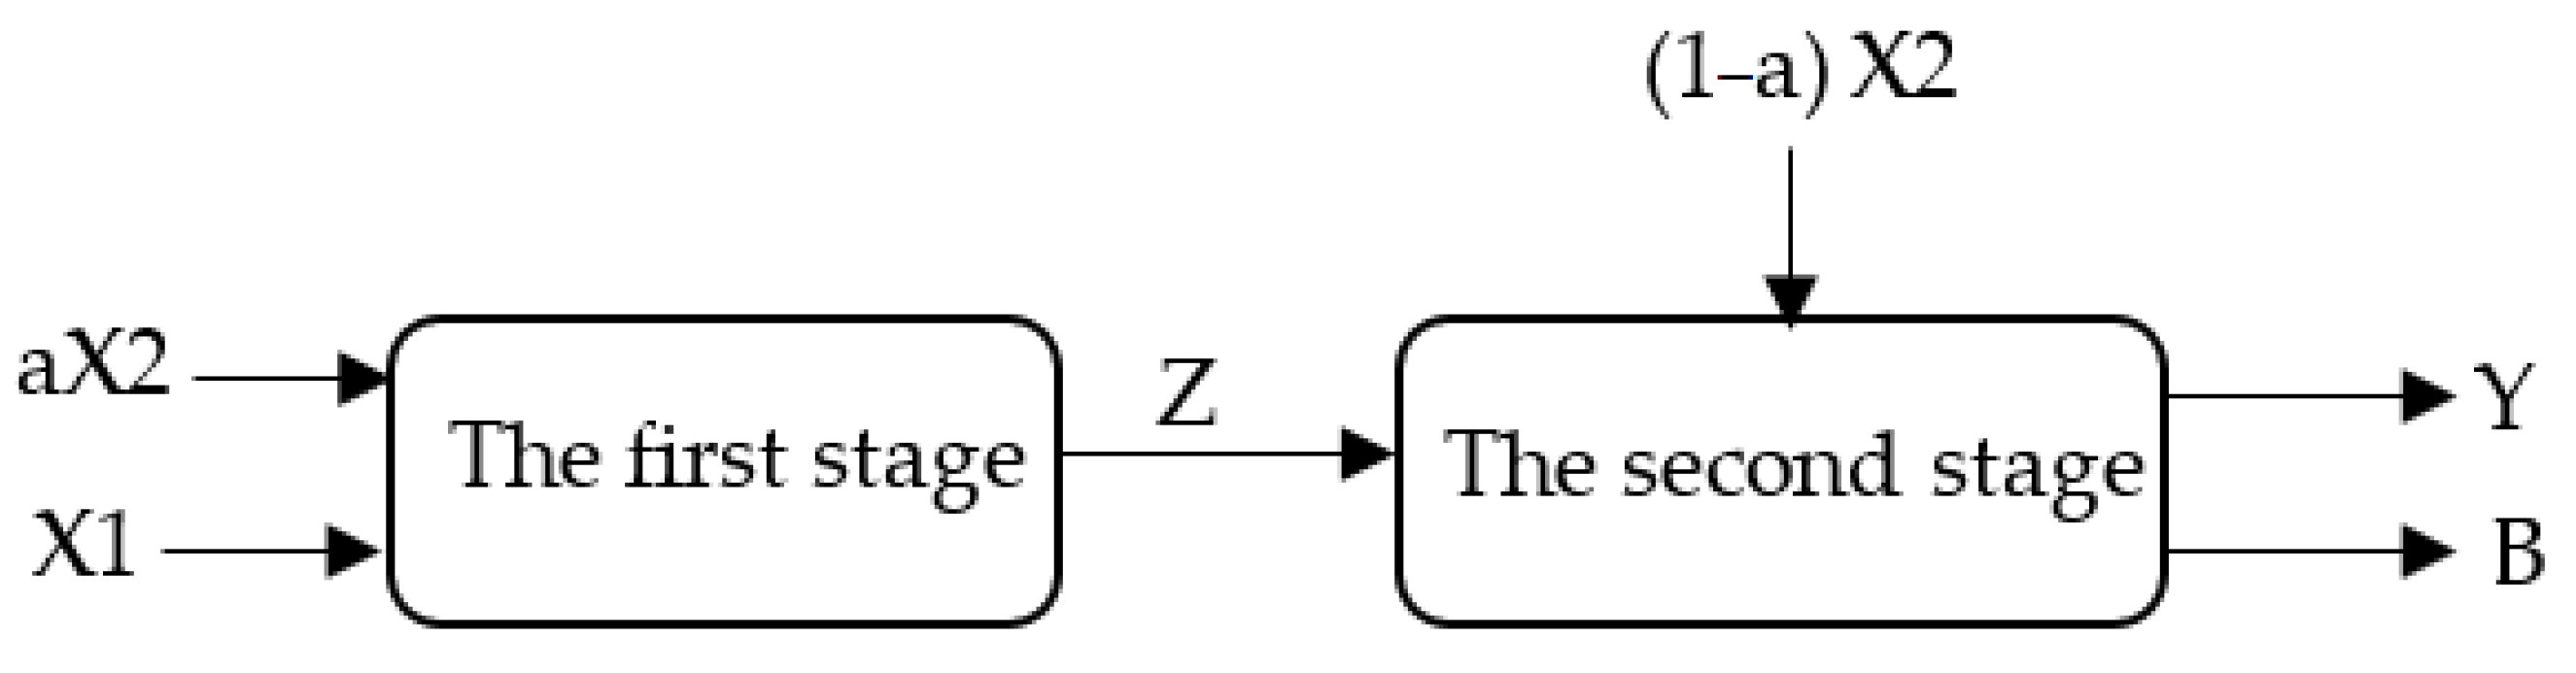
3.2. Two-Stage Network DEA Model with Undesirable Outputs
3.3. The Data Source and Illustration of Variables
4. Results and Discussion
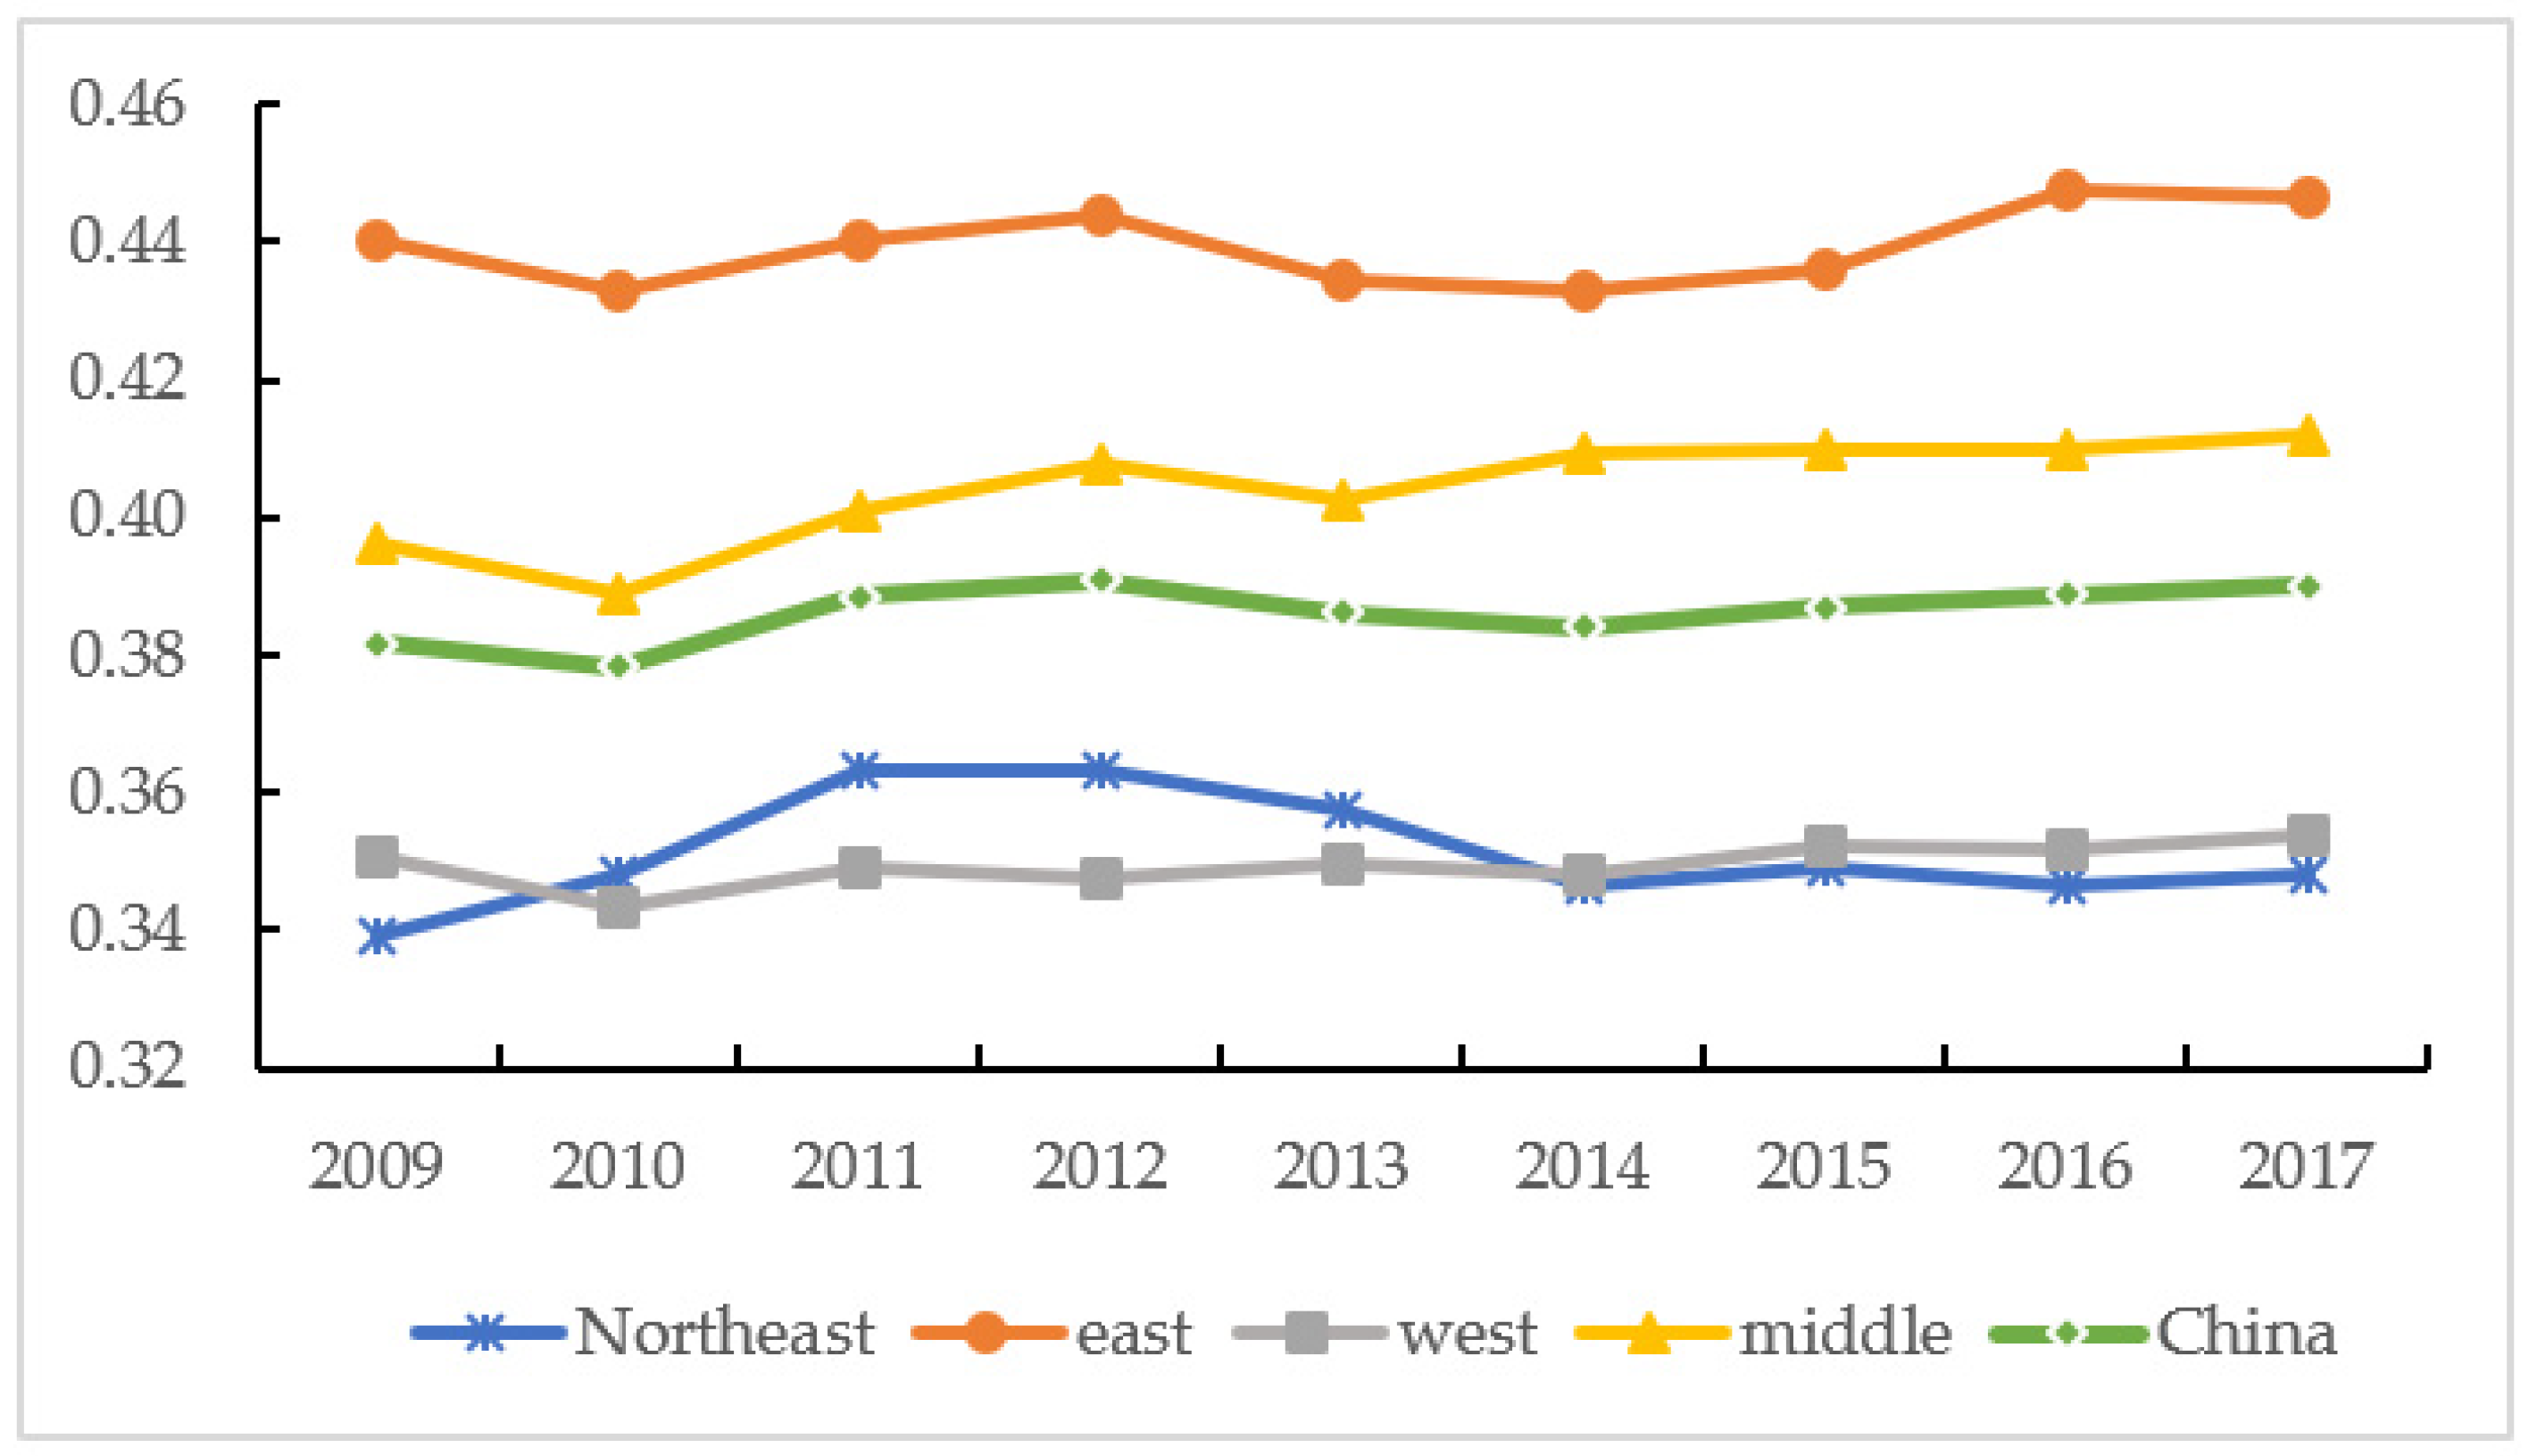
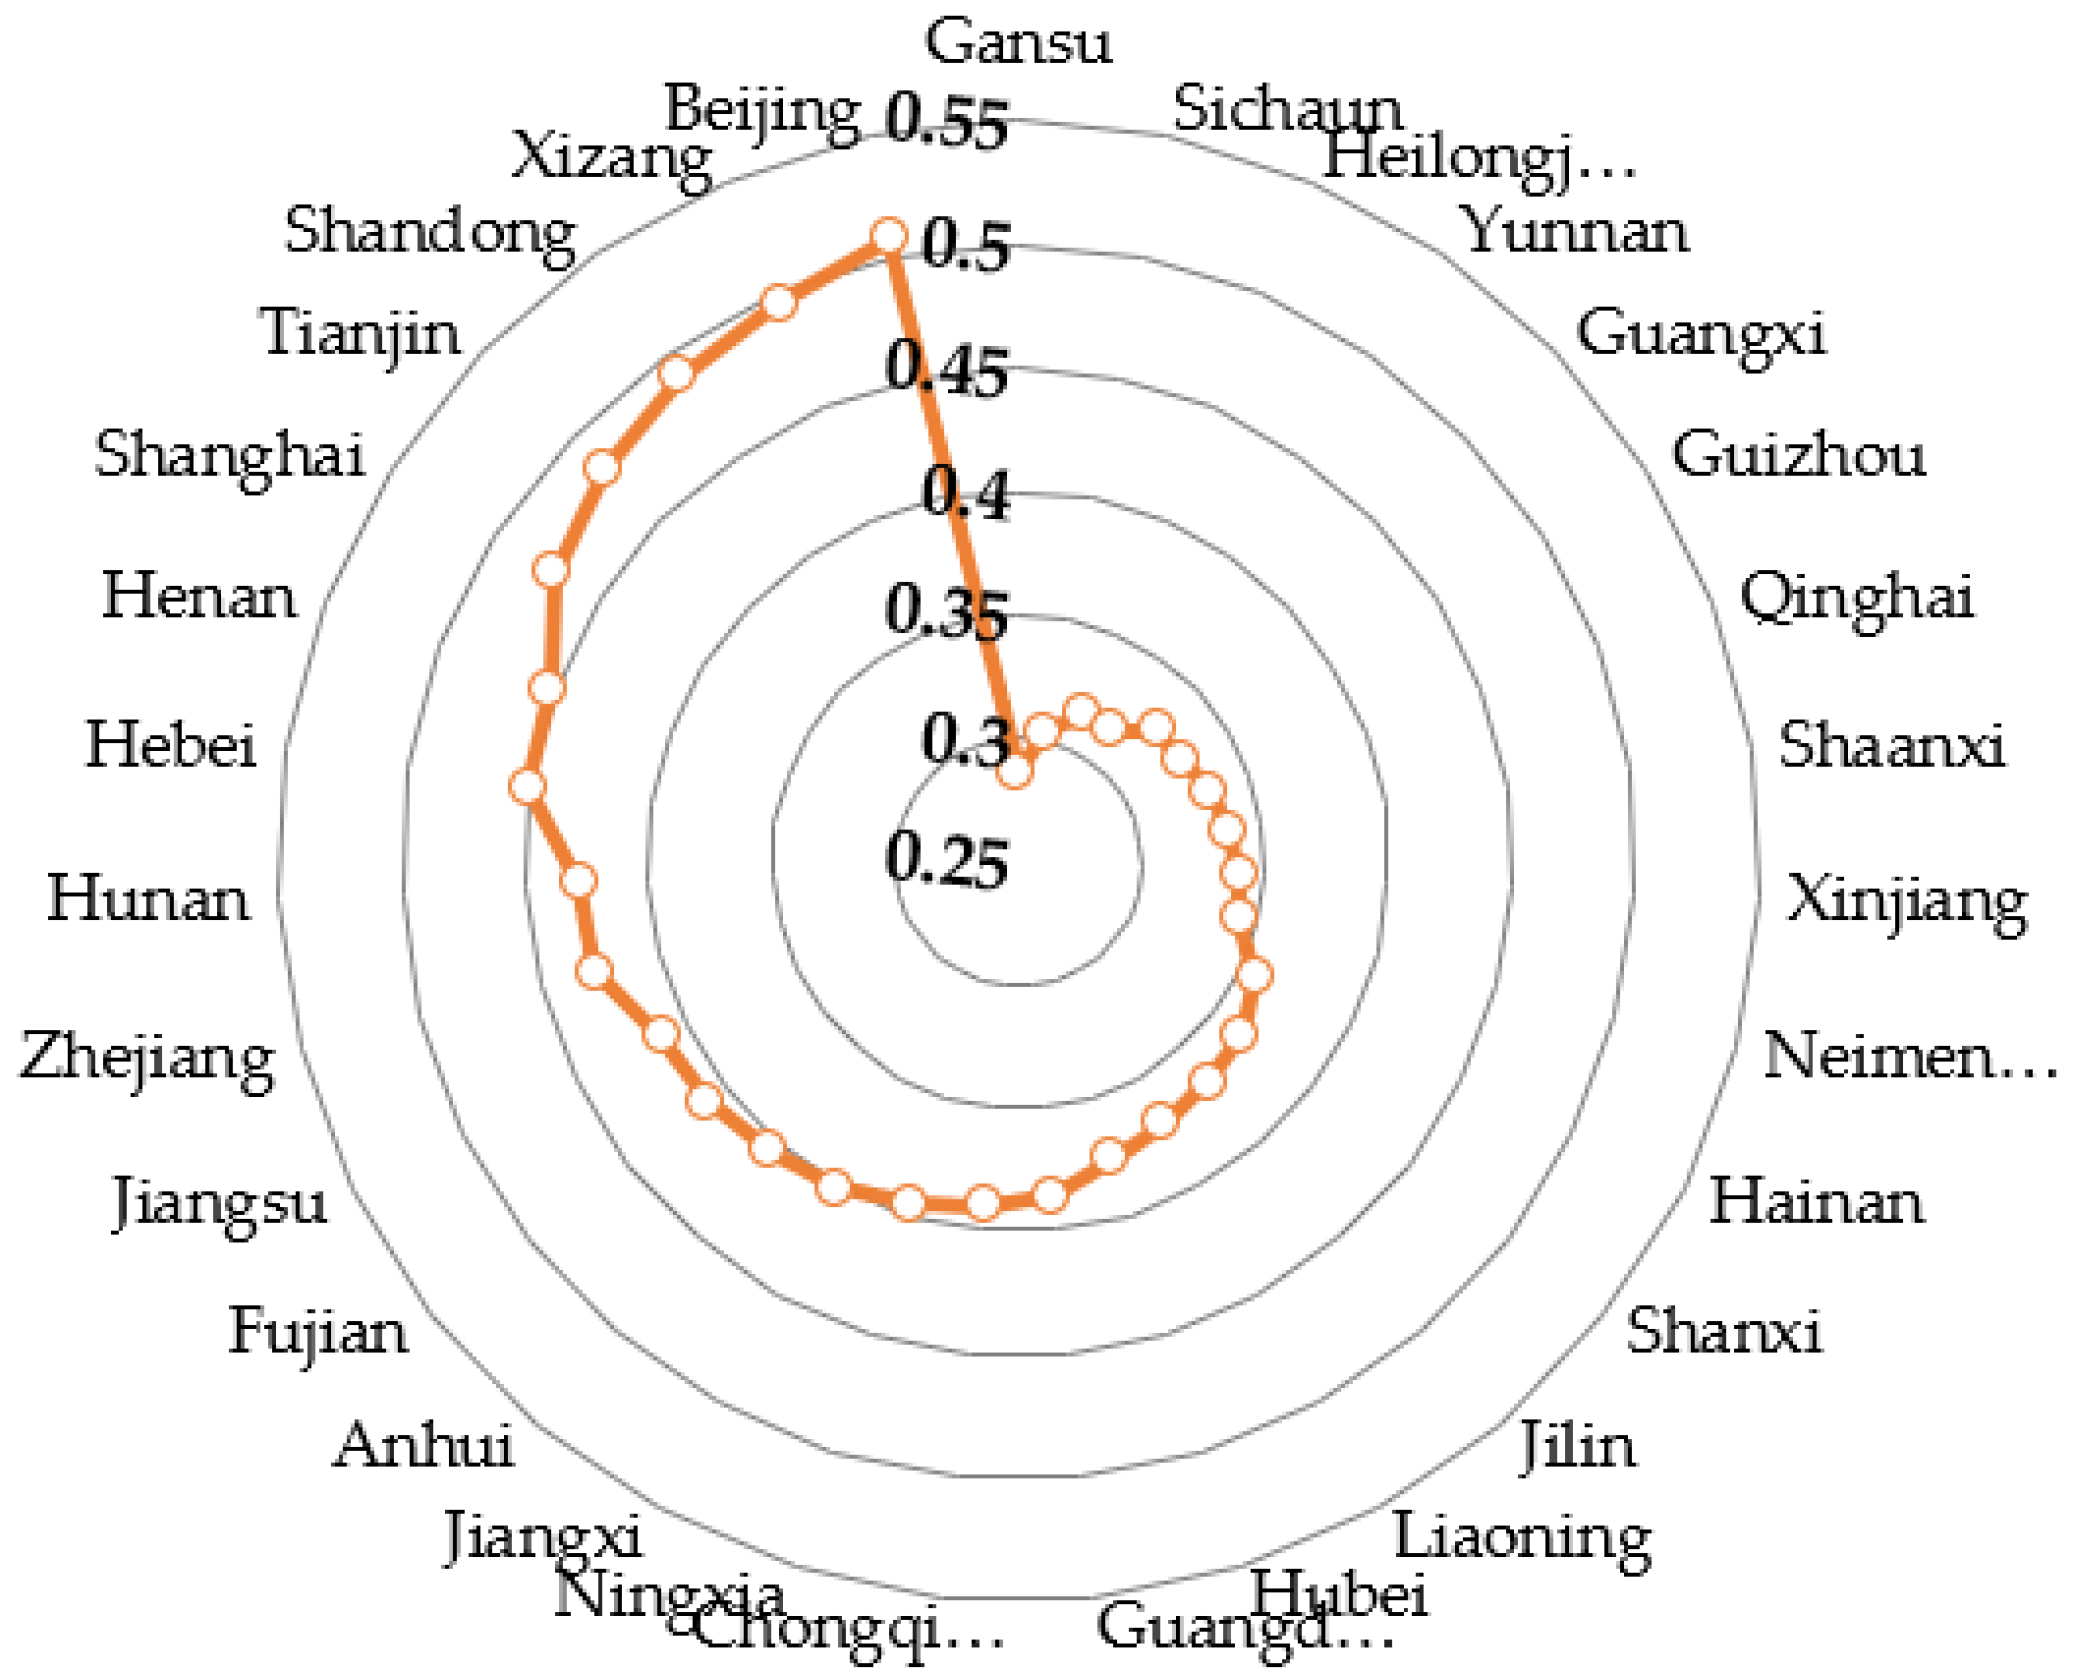
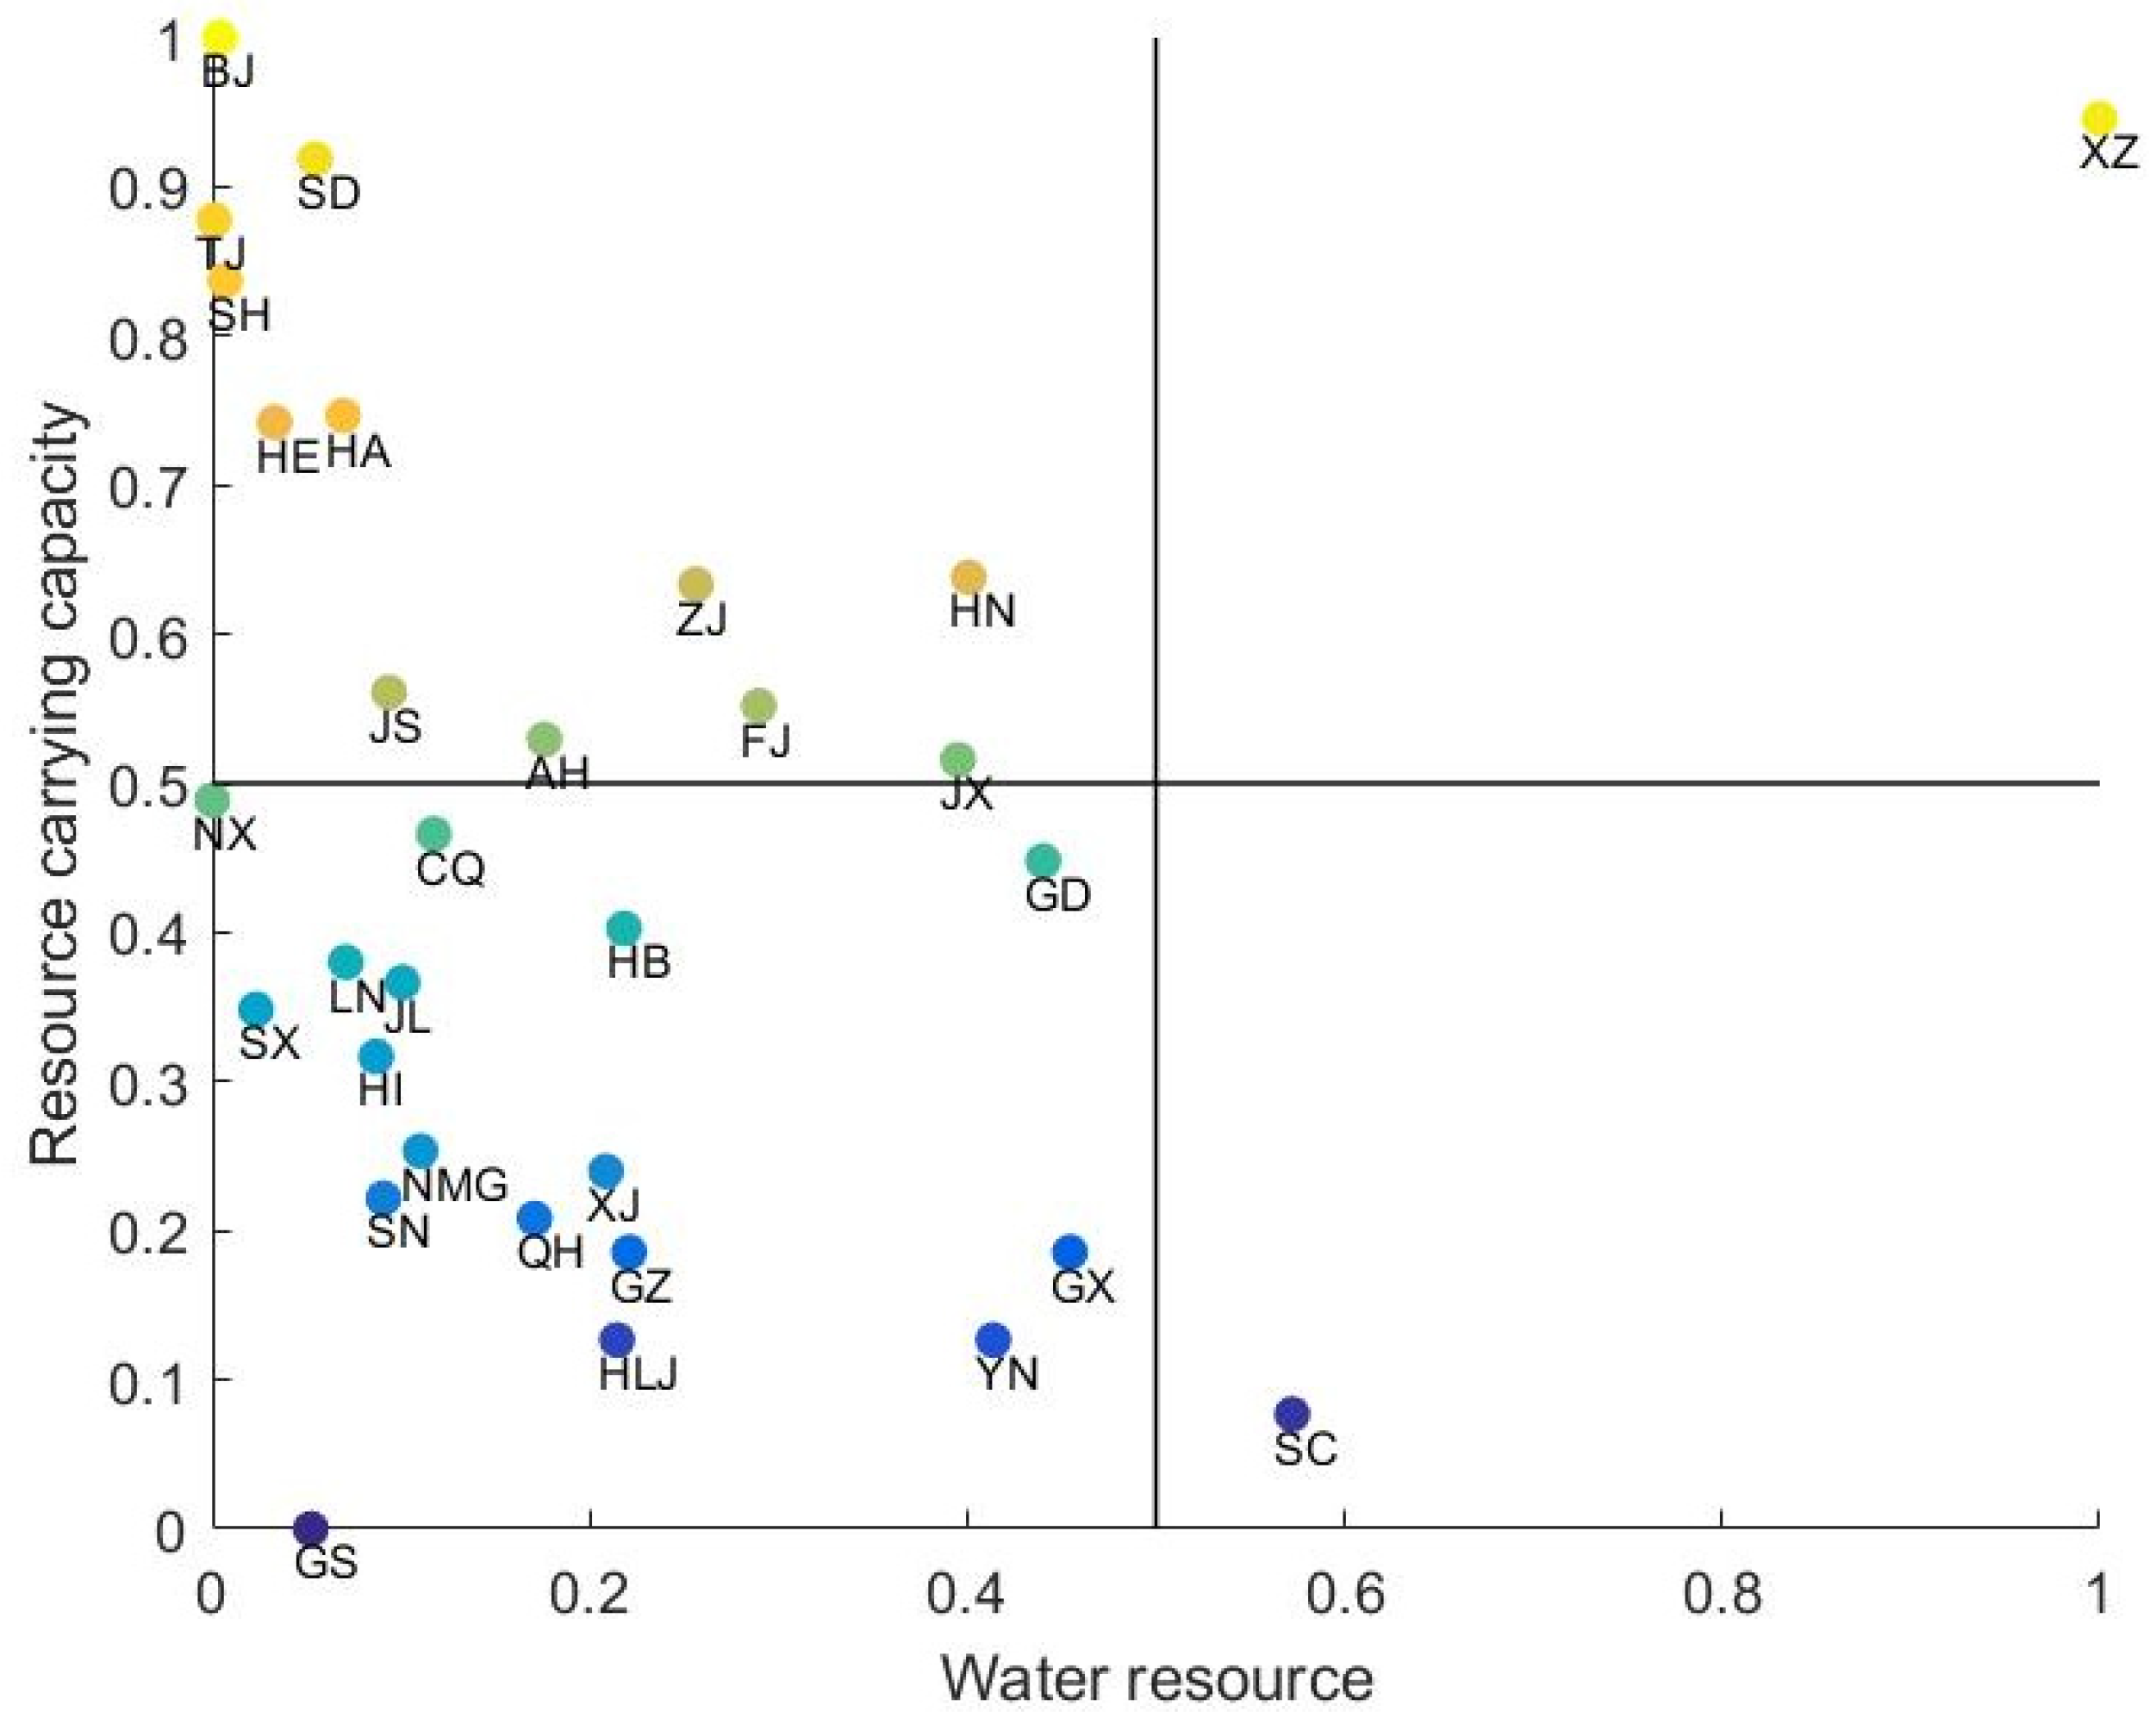
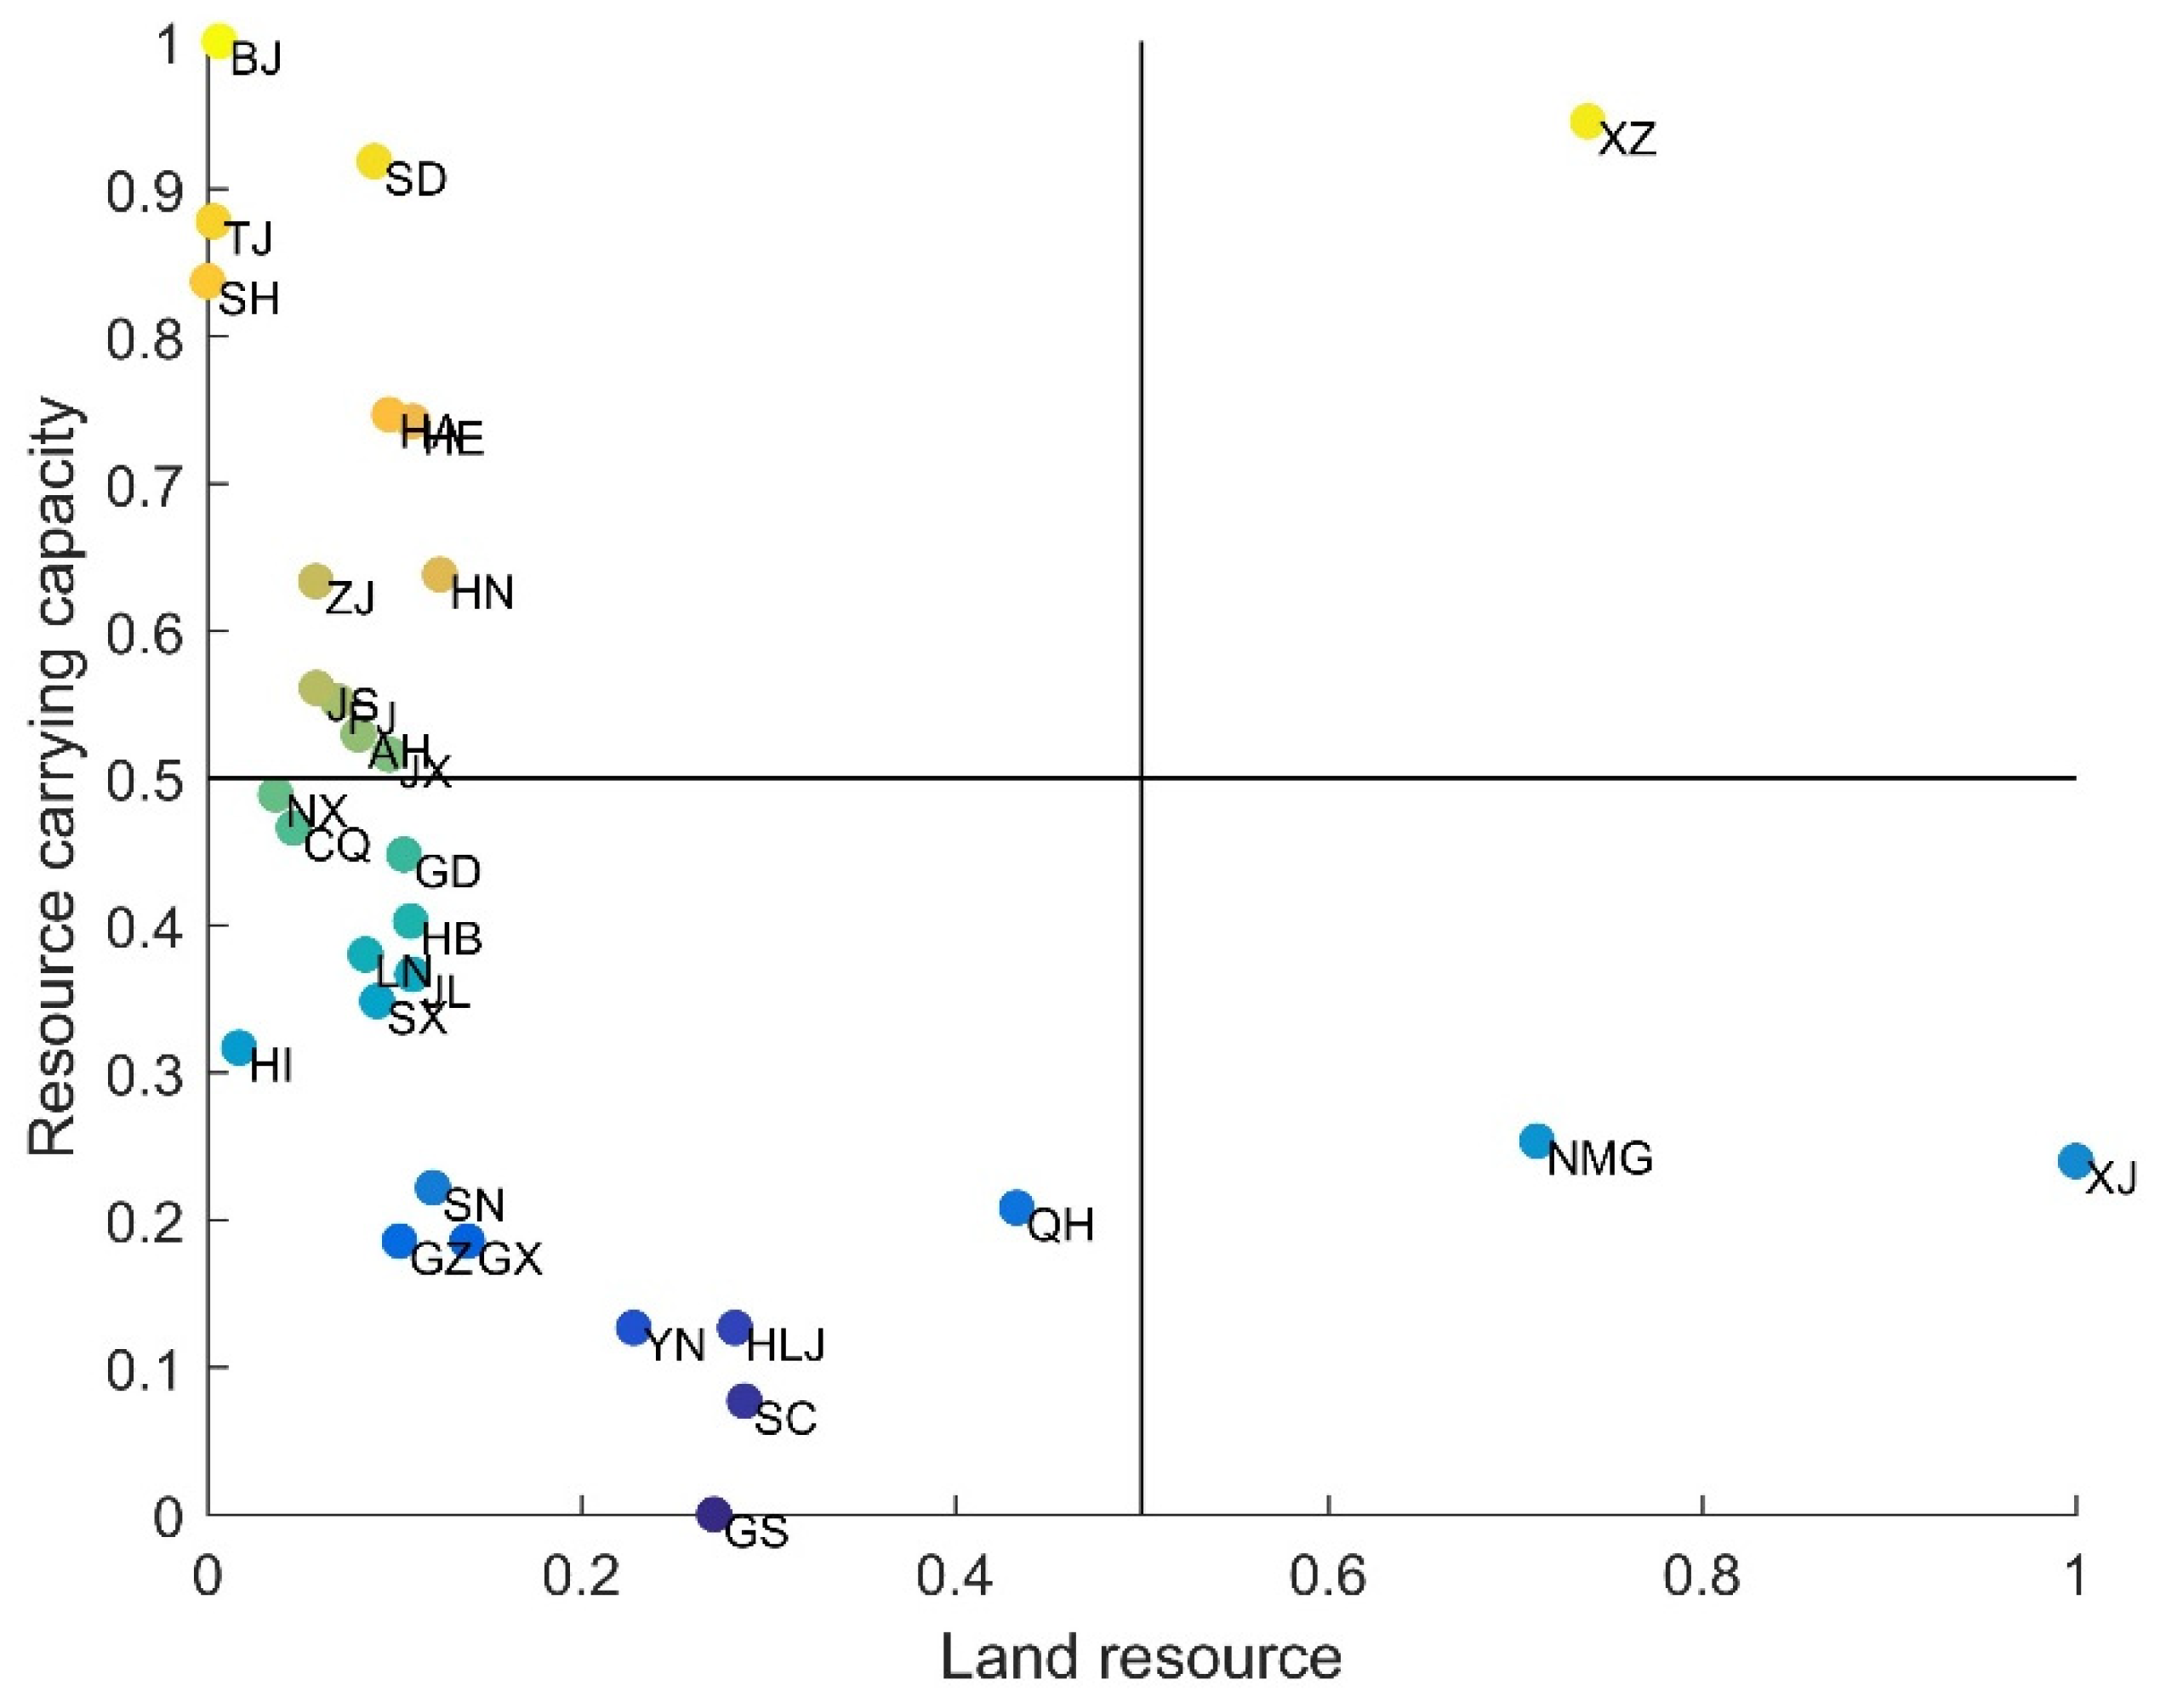
4.1. Analysis on the Results of Carrying Capacity of Water and Land Resources
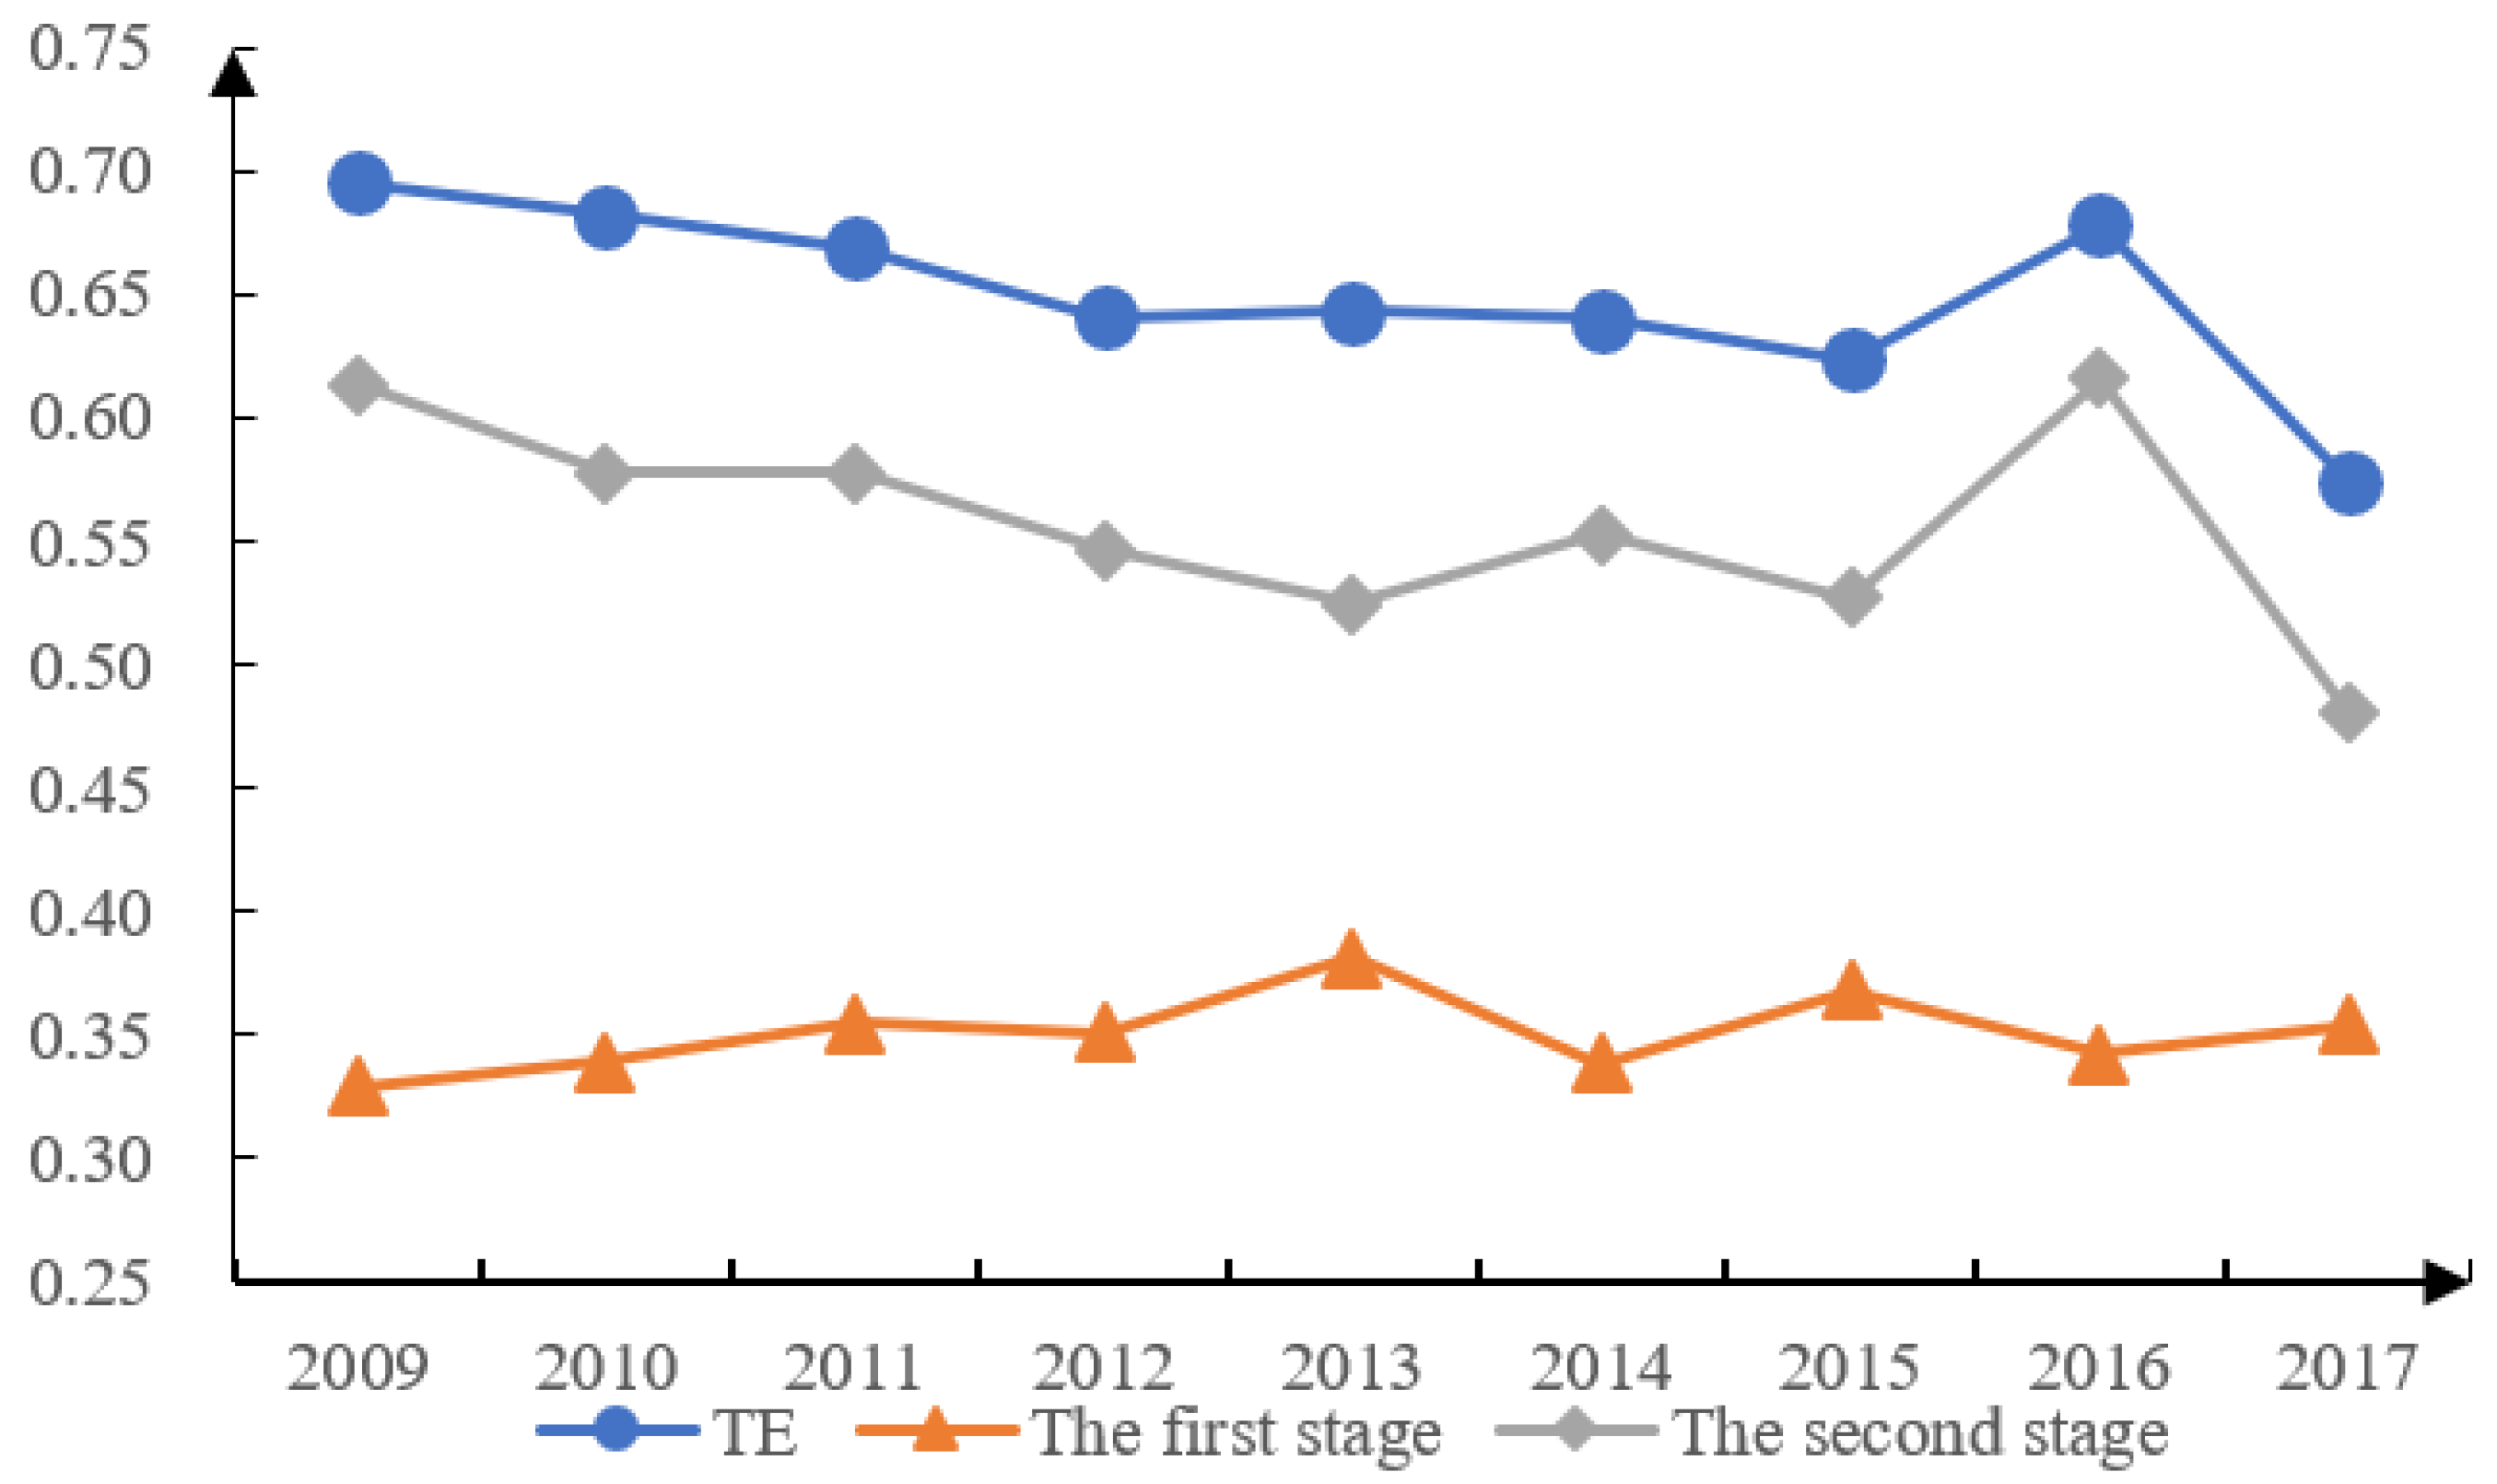
4.2. Analysis of the Results of Utilization Efficiency of Water and Land Resources
5. Conclusions and Suggestions
5.1. The Main Conclusions of This Paper
5.2. Policy and Recommendations
Author Contributions
Funding
Institutional Review Board Statement
Informed Consent Statement
Data Availability Statement
Acknowledgments
Conflicts of Interest
References
- Wang, S.; Yang, F.L.; Xu, L.; Du, J. Multi-scale analysis of the water resources carrying capacity of the Liaohe Basin based on ecological footprints. J. Clean. Prod. 2013, 53, 158–166. [Google Scholar] [CrossRef]
- Yang, J.; Lei, K.; Khu, S.; Meng, W. Assessment of Water Resources Carrying Capacity for Sustainable Development Based on a System Dynamics Model: A Case Study of Tieling City, China. Water Resour. Manag. 2015, 29, 885–899. [Google Scholar] [CrossRef]
- Chen, S.; Tang, X. Where is the way for China’s economic sustainable development. Acad. Mon. 2017, 49, 179–184. [Google Scholar]
- Wang, Y.; Wang, Y.; Su, X.; Qi, L.; Liu, M. Evaluation of the comprehensive carrying capacity of interprovincial water resources in China and the spatial effect. J. Hydrol. 2019, 575, 794–809. [Google Scholar] [CrossRef]
- Fu, J.; Zang, C.; Zhang, J. Economic and resource and environmental carrying capacity trade-off analysis in the Haihe River basin in China. J. Clean. Prod. 2020, 270, 122271. [Google Scholar] [CrossRef]
- Ren, C.; Guo, P.; Li, M.; Li, R. An innovative method for water resources carrying capacity research e metabolic theory of regional water resources. J. Environ. Manag. 2016, 167, 139–146. [Google Scholar] [CrossRef]
- Carey, D.I. Development based on carrying capacity: A strategy for environmental protection. Glob. Environ. Chang. 1993, 3, 140–148. [Google Scholar] [CrossRef]
- Dou, M.; Ma, J.; Li, G.; Zuo, Q. Measurement and assessment of water resources carrying capacity in Henan Province, China. Water Sci. Eng. 2015, 8, 102–113. [Google Scholar] [CrossRef] [Green Version]
- Deng, L.; Yin, J.; Tian, J.; Li, Q.; Guo, S. Comprehensive Evaluation of Water Resources Carrying Capacity in the Han River Basin. Water 2021, 13, 249. [Google Scholar] [CrossRef]
- Luo, W.; Ren, Y.; Shen, L. An evolution perspective on the urban land carrying capacity in the urbanization era of China. J. Sci. Total Environ. 2020, 744, 140827. [Google Scholar] [CrossRef]
- Xue, Q.; Yang, X.; Wu, F. A three-stage hybrid model for the regional assessment, spatial pattern analysis and source apportionment of the land resources comprehensive supporting capacity in the Yangtze River Delta urban agglomeration. J. Sci. Total Environ. 2020, 711, 134428. [Google Scholar] [CrossRef]
- Bosseboeuf, D.; Chateau, B.; Lapillonne, B. Cross-Country Comparison on Energy Efficiency Indicators: The on-Going European Effort towards a Common Methodology. Energy Policy 1997, 25, 673–682. [Google Scholar] [CrossRef]
- Ali, M.K.; Klein, K.K. Water use efficiency and productivity of the irrigation districts in Southern Alberta. Water Resour. Manag. 2014, 28, 2751–2766. [Google Scholar] [CrossRef]
- Xie, X.; Fang, B.; Xu, H.; He, S.; Li, X. Study on the coordinated relationship between Urban Land use efficiency and ecosystem health in China. Land Use Policy 2021, 102, 105235. [Google Scholar] [CrossRef]
- Magri, A.; Berezowska-Azzag, E. New tool for assessing urban water carrying capacity (WCC) in the planning of development programs in the region of Oran, Algeria. Sustain. Cities Soc. 2019, 48, 101316. [Google Scholar] [CrossRef]
- Widodo, B.; Lupyanto, R.; Sulistiono, B.; Harjito, D.A.; Hamidin, J.; Hapsari, E.; Yasin, M.; Ellinda, C. Analysis of environmental carrying capacity for the development of sustainable settlement in Yogyakarta urban area. Procedia Environ. Sci. 2015, 28, 519–527. [Google Scholar] [CrossRef] [Green Version]
- Zheng, Z. The Conceptual Model and Its Empirical Studies of Sustainable Carrying Capacity of Water Resources: A Case Study of China Mainland. J. Resour. Ecol. 2019, 10, 9–20. [Google Scholar] [CrossRef]
- Zhang, J.; Zhang, C.; Shi, W.; Fu, Y. Quantitative evaluation and optimized utilization of water resources-water environment carrying capacity based on nature-based solutions. J. Hydrol. 2019, 568, 96–107. [Google Scholar] [CrossRef]
- Li, Z.; Zhang, Q.; Liao, H. Efficient-equitable-ecological evaluation of regional water resource coordination considering both visible and virtual water. Omega 2019, 83, 223–235. [Google Scholar] [CrossRef]
- Zyoud, S.H.; Kaufmann, L.G.; Shaheen, H.; Samhan, S.; Fuchs-Hanusch, D. A framework for water loss management in developing countries under fuzzy environment: Integration of Fuzzy AHP with Fuzzy TOPSIS. Expert Syst. Appl. 2016, 61, 86–105. [Google Scholar] [CrossRef]
- De Jonge, V.N.; Pinto, R.; Turner, R.K. Integrating ecological, economic and social aspects to generate useful management information under the EU Directives’ ‘ecosystem approach’. Ocean Coast. Manag. 2012, 68, 169–188. [Google Scholar] [CrossRef] [Green Version]
- Tscherning, K.; Helming, K.; Krippner, B.; Sieber, S.; Paloma, S.G. Does research applying the DPSIR framework support decision making. Land Use Policy 2012, 29, 102–110. [Google Scholar] [CrossRef]
- Quevedo, J.M.D.; Uchiyama, Y.; Kohsaka, R. A blue carbon ecosystems qualitative assessment applying the DPSIR framework: Local perspective of global benefits and contributions. Mar. Policy 2021, 128, 104462. [Google Scholar] [CrossRef]
- Lewison, R.L.; Rudd, M.A.; Al-Hayek, W.; Baldwin, C.; Beger, M.; Lieske, S.N.; Jones, C.; Satumanatpan, S.; Junchompoo, C. How the DPSIR framework can be used for structuring problems and facilitating empirical research in coastal systems. Environ. Sci. Policy 2016, 56, 110–119. [Google Scholar] [CrossRef] [Green Version]
- Patrício, J.; Elliott, M.; Mazik, K.; Papadopoulou, K.N.; Smith, C.J. DPSIR—Two decades of trying to develop a unifying framework for marine environmental management? Front. Mar. Sci. 2016, 3, 177. [Google Scholar] [CrossRef]
- Ramos-Quintana, F.; Ortíz-Hernández, M.L.; Sánchez-Salinas, E.; Úrsula-Vázquez, E.; Guerrero, J.A.; Zamorano, M. Quantitative-qualitative assessments of environmental causal networks to support the DPSIR framework in the decision-making process. Environ. Impact Assess. Rev. 2018, 69, 42–60. [Google Scholar] [CrossRef]
- Jago-on, K.A.B.; Kaneko, S.; Fujikura, R.; Fujiwara, A.; Imai, T.; Matsumoto, T.; Zhang, J.; Tanikawa, H.; Tanaka, K.; Lee, B.; et al. Urbanization and subsurface environmental issues: An attempt at DPSIR model application in Asian cities. Sci. Total Environ. 2009, 407, 3089–3104. [Google Scholar] [CrossRef]
- Kristensen, P. The DPSIR Framework, Workshop on a Comprehensive/Detailed Assessment of the Vulnerability of Water Resources to Environmental Change in Africa Using River Basin Approach; UNEP Headquarters: Nairobi, Kenya, 2004. [Google Scholar]
- Kohsaka, R. Developing biodiversity indicators for cities: Applying the DPSIR model to Nagoya and integrating social and ecological aspects. Ecol. Res. 2010, 25, 925–936. [Google Scholar] [CrossRef]
- Gregory, A.J.; Atkins, J.P.; Burdon, D.; Elliott, M. A problem structuring method for ecosystem-based management: The DPSIR modelling process. Eur. J. Oper. Res. 2013, 227, 558–569. [Google Scholar] [CrossRef]
- Fang, F.; Qiao, L.L.; Ni, B.J.; Cao, J.S.; Yu, H.Q. Quantitative evaluation on the characteristics of activated sludge granules and flocs using a fuzzy entropy-based approach. Sci. Rep. 2017, 7, 42910. [Google Scholar] [CrossRef] [Green Version]
- An, Q.; Yan, H.; Wu, J.; Liang, L. Internal resource waste and centralization degree in two-stage systems: An efficiency analysis. Omega 2016, 61, 89–99. [Google Scholar] [CrossRef]
- Wu, J.; Xiong, B.; An, Q.; Sun, J.; Wu, H. Total-factor energy efficiency evaluation of Chinese industry by using two-stage DEA model with shared inputs. Ann. Oper. Res. 2017, 255, 257–276. [Google Scholar] [CrossRef]

| Indicator Layer | Units | Calculation Approach | |
|---|---|---|---|
| Driving force | Per capita cultivated land area | hm2 | Area of cultivated land of the year/total population of the year |
| Per capita GDP | Yuan | GDP of the year/total population of the year | |
| Population density | Person hm2 | Total population/land area of the year | |
| Water resources per capita | m3/person | Total water resources/total population of the year | |
| Proportion of natural wetland area | % | Current wetland area/land area | |
| Pressure | Total social water consumption | 100 million m3 | The total amount of industrial, agricultural, domestic, and ecological water of the year |
| Natural population growth rate | % | Natural population growth of the year/average population | |
| Water consumption rate of ecological environment | % | Eco environmental water consumption/average water resources | |
| Development and utilization rate of land resources | % | Cultivated land area/land area in current year | |
| Water consumption per capita | m3/person | Total social water consumption/total population of the year | |
| State | Matching coefficient of water and land resources | Ten thousand m3 hm2 | Total water resources/cultivated land area of the year |
| Proportion of effective irrigation area | % | Effective irrigation area/total sown area of the year | |
| Crop yield per unit area | Kg hm2 | Total crop yield/sown area | |
| Impact | Urbanization rate | % | Current urban population/total population |
| Multiple crop index | Total sown area/cultivated area | ||
| Response | Agricultural mechanization degree | Kw hm2 | Total power of agricultural machinery/cultivated land area |
| Proportion of afforestation area | % | Total afforestation area/land area in current year | |
| Agricultural water quota | m3·ten thousand yuan−1 | Agricultural water consumption/total agricultural output value |
| 2009 | 2010 | 2011 | 2012 | 2013 | 2014 | 2015 | 2016 | 2017 | Mean | ||
|---|---|---|---|---|---|---|---|---|---|---|---|
| Northeast | Liaoning | 0.357 | 0.363 | 0.392 | 0.397 | 0.389 | 0.367 | 0.363 | 0.357 | 0.356 | 0.371 |
| Jilin | 0.345 | 0.362 | 0.377 | 0.369 | 0.366 | 0.361 | 0.376 | 0.376 | 0.379 | 0.368 | |
| Heilongjiang | 0.316 | 0.319 | 0.321 | 0.324 | 0.317 | 0.311 | 0.309 | 0.306 | 0.309 | 0.315 | |
| East | Beijing | 0.523 | 0.501 | 0.527 | 0.548 | 0.533 | 0.488 | 0.475 | 0.485 | 0.494 | 0.508 |
| Tianjin | 0.518 | 0.499 | 0.492 | 0.477 | 0.462 | 0.465 | 0.453 | 0.476 | 0.488 | 0.481 | |
| Hebei | 0.453 | 0.441 | 0.45 | 0.456 | 0.451 | 0.458 | 0.444 | 0.463 | 0.447 | 0.451 | |
| Shanghai | 0.472 | 0.467 | 0.461 | 0.477 | 0.461 | 0.464 | 0.469 | 0.49 | 0.486 | 0.472 | |
| Jiangsu | 0.404 | 0.407 | 0.407 | 0.414 | 0.407 | 0.409 | 0.409 | 0.422 | 0.425 | 0.411 | |
| Zhejiang | 0.436 | 0.436 | 0.43 | 0.432 | 0.416 | 0.416 | 0.42 | 0.43 | 0.423 | 0.427 | |
| Fujian | 0.379 | 0.377 | 0.413 | 0.404 | 0.402 | 0.397 | 0.434 | 0.442 | 0.434 | 0.409 | |
| Shandong | 0.485 | 0.48 | 0.491 | 0.49 | 0.484 | 0.502 | 0.487 | 0.5 | 0.496 | 0.49 | |
| Guangdong | 0.37 | 0.374 | 0.378 | 0.384 | 0.373 | 0.378 | 0.411 | 0.404 | 0.405 | 0.386 | |
| Hainan | 0.362 | 0.347 | 0.355 | 0.358 | 0.356 | 0.349 | 0.359 | 0.365 | 0.365 | 0.357 | |
| West | Inner Mongolia | 0.341 | 0.335 | 0.346 | 0.352 | 0.356 | 0.342 | 0.338 | 0.338 | 0.342 | 0.343 |
| Guangxi | 0.332 | 0.321 | 0.323 | 0.326 | 0.327 | 0.323 | 0.331 | 0.33 | 0.335 | 0.328 | |
| Chongqing | 0.353 | 0.383 | 0.395 | 0.398 | 0.394 | 0.393 | 0.4 | 0.405 | 0.394 | 0.39 | |
| Sichuan | 0.304 | 0.292 | 0.3 | 0.292 | 0.296 | 0.293 | 0.308 | 0.321 | 0.329 | 0.304 | |
| Guizhou | 0.32 | 0.307 | 0.303 | 0.304 | 0.325 | 0.331 | 0.348 | 0.347 | 0.364 | 0.328 | |
| Yunnan | 0.326 | 0.311 | 0.315 | 0.313 | 0.313 | 0.308 | 0.317 | 0.317 | 0.313 | 0.315 | |
| Tibet | 0.483 | 0.487 | 0.496 | 0.493 | 0.494 | 0.494 | 0.499 | 0.517 | 0.504 | 0.496 | |
| Shaanxi | 0.344 | 0.323 | 0.338 | 0.339 | 0.34 | 0.34 | 0.338 | 0.328 | 0.33 | 0.336 | |
| Gansu | 0.29 | 0.281 | 0.292 | 0.288 | 0.287 | 0.286 | 0.294 | 0.282 | 0.286 | 0.287 | |
| Qinghai | 0.358 | 0.343 | 0.346 | 0.331 | 0.318 | 0.319 | 0.322 | 0.328 | 0.331 | 0.333 | |
| Ningxia | 0.409 | 0.39 | 0.395 | 0.404 | 0.403 | 0.4 | 0.386 | 0.382 | 0.381 | 0.395 | |
| Xinjiang | 0.351 | 0.346 | 0.338 | 0.333 | 0.346 | 0.345 | 0.348 | 0.323 | 0.334 | 0.34 | |
| Central | Shanxi | 0.365 | 0.361 | 0.379 | 0.378 | 0.38 | 0.38 | 0.356 | 0.34 | 0.34 | 0.364 |
| Anhui | 0.376 | 0.371 | 0.38 | 0.388 | 0.413 | 0.421 | 0.432 | 0.425 | 0.426 | 0.404 | |
| Jiangxi | 0.427 | 0.414 | 0.415 | 0.423 | 0.374 | 0.374 | 0.387 | 0.4 | 0.398 | 0.401 | |
| Henan | 0.476 | 0.441 | 0.451 | 0.452 | 0.446 | 0.456 | 0.446 | 0.446 | 0.45 | 0.452 | |
| Hubei | 0.344 | 0.352 | 0.362 | 0.373 | 0.381 | 0.388 | 0.391 | 0.39 | 0.404 | 0.376 | |
| Hunan | 0.389 | 0.394 | 0.419 | 0.433 | 0.421 | 0.436 | 0.447 | 0.458 | 0.454 | 0.428 | |
| D | Rank | P | Rank | S | Rank | I | Rank | R | Rank | |
|---|---|---|---|---|---|---|---|---|---|---|
| Beijing | 0.093 | 6 | 0.196 | 2 | 0.076 | 5 | 0.070 | 5 | 0.072 | 7 |
| Tianjin | 0.082 | 11 | 0.195 | 3 | 0.066 | 8 | 0.065 | 7 | 0.072 | 8 |
| Hebei | 0.063 | 26 | 0.178 | 7 | 0.052 | 13 | 0.049 | 16 | 0.109 | 1 |
| Shanxi | 0.065 | 24 | 0.179 | 6 | 0.019 | 27 | 0.037 | 24 | 0.065 | 11 |
| Inner Mongolia | 0.116 | 1 | 0.131 | 26 | 0.030 | 23 | 0.041 | 22 | 0.025 | 29 |
| Liaoning | 0.077 | 13 | 0.148 | 20 | 0.056 | 11 | 0.045 | 18 | 0.044 | 22 |
| Jilin | 0.089 | 7 | 0.157 | 13 | 0.064 | 9 | 0.035 | 26 | 0.022 | 30 |
| Heilongjiang | 0.113 | 3 | 0.110 | 30 | 0.035 | 21 | 0.041 | 21 | 0.016 | 31 |
| Shanghai | 0.105 | 4 | 0.151 | 17 | 0.078 | 4 | 0.108 | 1 | 0.029 | 27 |
| Jiangsu | 0.100 | 5 | 0.111 | 29 | 0.069 | 6 | 0.076 | 4 | 0.055 | 16 |
| Zhejiang | 0.085 | 9 | 0.150 | 19 | 0.078 | 3 | 0.053 | 14 | 0.060 | 15 |
| Anhui | 0.066 | 23 | 0.172 | 8 | 0.043 | 18 | 0.059 | 12 | 0.063 | 14 |
| Fujian | 0.079 | 12 | 0.140 | 23 | 0.067 | 7 | 0.059 | 11 | 0.064 | 12 |
| Jiangxi | 0.062 | 29 | 0.146 | 21 | 0.050 | 15 | 0.070 | 6 | 0.074 | 6 |
| Shandong | 0.074 | 18 | 0.199 | 1 | 0.062 | 10 | 0.060 | 10 | 0.096 | 3 |
| Henan | 0.060 | 31 | 0.192 | 4 | 0.047 | 17 | 0.064 | 8 | 0.087 | 5 |
| Hubei | 0.074 | 17 | 0.137 | 24 | 0.050 | 16 | 0.060 | 9 | 0.055 | 17 |
| Hunan | 0.062 | 27 | 0.133 | 25 | 0.056 | 12 | 0.076 | 3 | 0.100 | 2 |
| Guangdong | 0.076 | 14 | 0.118 | 28 | 0.051 | 14 | 0.078 | 2 | 0.063 | 13 |
| Guangxi | 0.061 | 30 | 0.144 | 22 | 0.028 | 25 | 0.048 | 17 | 0.047 | 20 |
| Hainan | 0.069 | 21 | 0.181 | 5 | 0.032 | 22 | 0.044 | 19 | 0.033 | 25 |
| Chongqing | 0.070 | 20 | 0.164 | 11 | 0.030 | 24 | 0.059 | 13 | 0.068 | 10 |
| Sichuan | 0.064 | 25 | 0.121 | 27 | 0.038 | 19 | 0.050 | 15 | 0.031 | 26 |
| Guizhou | 0.062 | 28 | 0.172 | 9 | 0.005 | 31 | 0.036 | 25 | 0.053 | 19 |
| Yunnan | 0.066 | 22 | 0.154 | 15 | 0.014 | 29 | 0.034 | 28 | 0.046 | 21 |
| Tibet | 0.114 | 2 | 0.154 | 16 | 0.134 | 1 | 0.000 | 31 | 0.095 | 4 |
| Shaanxi | 0.071 | 19 | 0.156 | 14 | 0.014 | 30 | 0.041 | 20 | 0.054 | 18 |
| Gansu | 0.075 | 15 | 0.150 | 18 | 0.017 | 28 | 0.019 | 30 | 0.026 | 28 |
| Qinghai | 0.075 | 16 | 0.158 | 12 | 0.023 | 26 | 0.035 | 27 | 0.043 | 23 |
| Ningxia | 0.082 | 10 | 0.170 | 10 | 0.037 | 20 | 0.037 | 23 | 0.069 | 9 |
| Xinjiang | 0.088 | 8 | 0.074 | 31 | 0.107 | 2 | 0.033 | 29 | 0.038 | 24 |
| Province | Overall Efficiency | First Stage Efficiency | Second Stage Efficiency | Province | Overall Efficiency | First Stage Efficiency | Second Stage Efficiency |
|---|---|---|---|---|---|---|---|
| Beijing | 1.000 | 0.130 | 1.000 | Hubei | 0.596 | 0.195 | 0.598 |
| Tianjin | 0.822 | 0.208 | 0.823 | Hunan | 0.544 | 0.239 | 0.541 |
| Hebei | 0.577 | 0.283 | 0.579 | Guangdong | 0.579 | 0.197 | 0.581 |
| Shanxi | 0.605 | 0.332 | 0.607 | Guangxi | 0.477 | 0.264 | 0.142 |
| Inner Mongolia | 0.788 | 1.000 | 0.636 | Hainan | 0.609 | 0.139 | 0.615 |
| Liaoning | 0.535 | 0.285 | 0.536 | Chongqing | 0.586 | 0.115 | 0.587 |
| Jilin | 0.528 | 0.284 | 0.555 | Sichuan | 0.574 | 0.186 | 0.579 |
| Heilongjiang | 0.616 | 0.604 | 0.254 | Guizhou | 0.603 | 0.207 | 0.604 |
| Shanghai | 0.742 | 1.000 | 0.655 | Yunnan | 0.590 | 0.227 | 0.592 |
| Jiangsu | 0.696 | 0.189 | 0.697 | Tibet | 0.995 | 0.406 | 0.900 |
| Zhejiang | 0.621 | 0.071 | 0.622 | Shaanxi | 0.740 | 0.266 | 0.741 |
| Anhui | 0.579 | 0.263 | 0.580 | Gansu | 0.638 | 0.553 | 0.669 |
| Fujian | 0.604 | 0.136 | 0.605 | Qinghai | 0.860 | 0.517 | 0.001 |
| Jiangxi | 0.496 | 0.196 | 0.496 | Ningxia | 0.520 | 1.000 | 0.195 |
| Shandong | 0.674 | 0.146 | 0.676 | Xinjiang | 0.789 | 1.000 | 0.053 |
| Henan | 0.552 | 0.235 | 0.552 | number (=1) | 1 | 4 | 1 |
Publisher’s Note: MDPI stays neutral with regard to jurisdictional claims in published maps and institutional affiliations. |
© 2021 by the authors. Licensee MDPI, Basel, Switzerland. This article is an open access article distributed under the terms and conditions of the Creative Commons Attribution (CC BY) license (https://creativecommons.org/licenses/by/4.0/).
Share and Cite
Tan, C.; Peng, Q.; Ding, T.; Zhou, Z. Regional Assessment of Land and Water Carrying Capacity and Utilization Efficiency in China. Sustainability 2021, 13, 9183. https://doi.org/10.3390/su13169183
Tan C, Peng Q, Ding T, Zhou Z. Regional Assessment of Land and Water Carrying Capacity and Utilization Efficiency in China. Sustainability. 2021; 13(16):9183. https://doi.org/10.3390/su13169183
Chicago/Turabian StyleTan, Changchun, Qinhong Peng, Tao Ding, and Zhixiang Zhou. 2021. "Regional Assessment of Land and Water Carrying Capacity and Utilization Efficiency in China" Sustainability 13, no. 16: 9183. https://doi.org/10.3390/su13169183
APA StyleTan, C., Peng, Q., Ding, T., & Zhou, Z. (2021). Regional Assessment of Land and Water Carrying Capacity and Utilization Efficiency in China. Sustainability, 13(16), 9183. https://doi.org/10.3390/su13169183