1. Introduction
While some natured-inspired enterprises are created voluntarily, environmental solutions among many large enterprises are often driven by stakeholder governance. There is an argument that transparency enables stakeholders to make informed decisions, confront disclosers, and hold them accountable. However, like many scholars e.g., [
1,
2], Hess ([
3] p. 457) suggest that “corporations will never voluntarily disclose information that will hold them accountable.” Firms disclose information only when there is a crisis or scrutiny; they often do so to mainly gain or repair lost legitimacy by emphasizing positive aspects of their performance [
1,
4] and focusing on impression management [
5]. Due to the lack of standards and regulations that mandate the use of (objective) third-party verification of corporate reporting, inaccurate or incomplete information is customary which misleads society [
6]. It is thus difficult to identify a specific firm and hold them accountable.
Firms can be held accountable when the information that they disclose has specific
characteristics that facilitate appropriate
governance mechanisms. The purpose of this paper is to develop a framework to understand how transparency drive accountability in environmental issues through
stakeholder governance.
Environmental transparency (ET) is concerned with the receptivity of firms in making their environmental management-related information accessible to parties of interest [
7].
Environmental accountability (EA) means that one is responsible for one’s own actions and the consequences of those actions that affect the natural environment and wider society. Nature-inspired enterprises are expected to be accountable through leading environmental transparency practices. However, there is a lack of understanding how other enterprises that are not born naturally inspired increase transparency and accountability.
The framework consists of several components. We use the term “action cycle” per Fung et al. [
8] to understand how information disclosure works in four steps: (1) disclosers disclose new information; (2) users (stakeholders) use and interpret the information; (3) users act or change their behavior; and (4) disclosers observe and respond to the changes, including disclosing more information. We use the
information integration theory [
9] to provide a better understanding of whether the information received (in Steps 2 and 4) drives changes in attitudes and actions. The
accountability theory [
10] is used to explain how disclosers (Step 4) are affected by their awareness of being
identified,
monitored,
evaluated, and
pressured by stakeholders to improve the specific
characteristics of information disclosed (Step 1). Then users can effectively monitor and evaluate the disclosers (Step 2).
Voluntary disclosure has its limits [
3]. Corporate governance may neglect EA when regulatory and stakeholder governance mechanisms are weak. Thus, the demand for ET and EA depends on the presence of organizations that represent the interests of stakeholders [
8]. The stakeholders can exert a significant amount pressure towards higher EA (Step 3) only when they have accurate and complete information. Thus, we apply four accountability criteria (
identifiability,
awareness of monitoring,
expectations of evaluation and
social pressure) to characterize
what information (
contents),
how much information (
details) and
how the information (
channels) is disseminated in order to support stakeholder governance [
11]. Based on this framework, we establish a 2 × 2 matrix to identify firms that are strong or weak in environmental transparency and governance from the 50 companies listed in the annual Best Global Green Brands report, the Global RepTrak 100, and The Climate A-List of the CDP (formerly the Carbon Disclosure Project).
2. A Framework of Environmental Transparency and Accountability
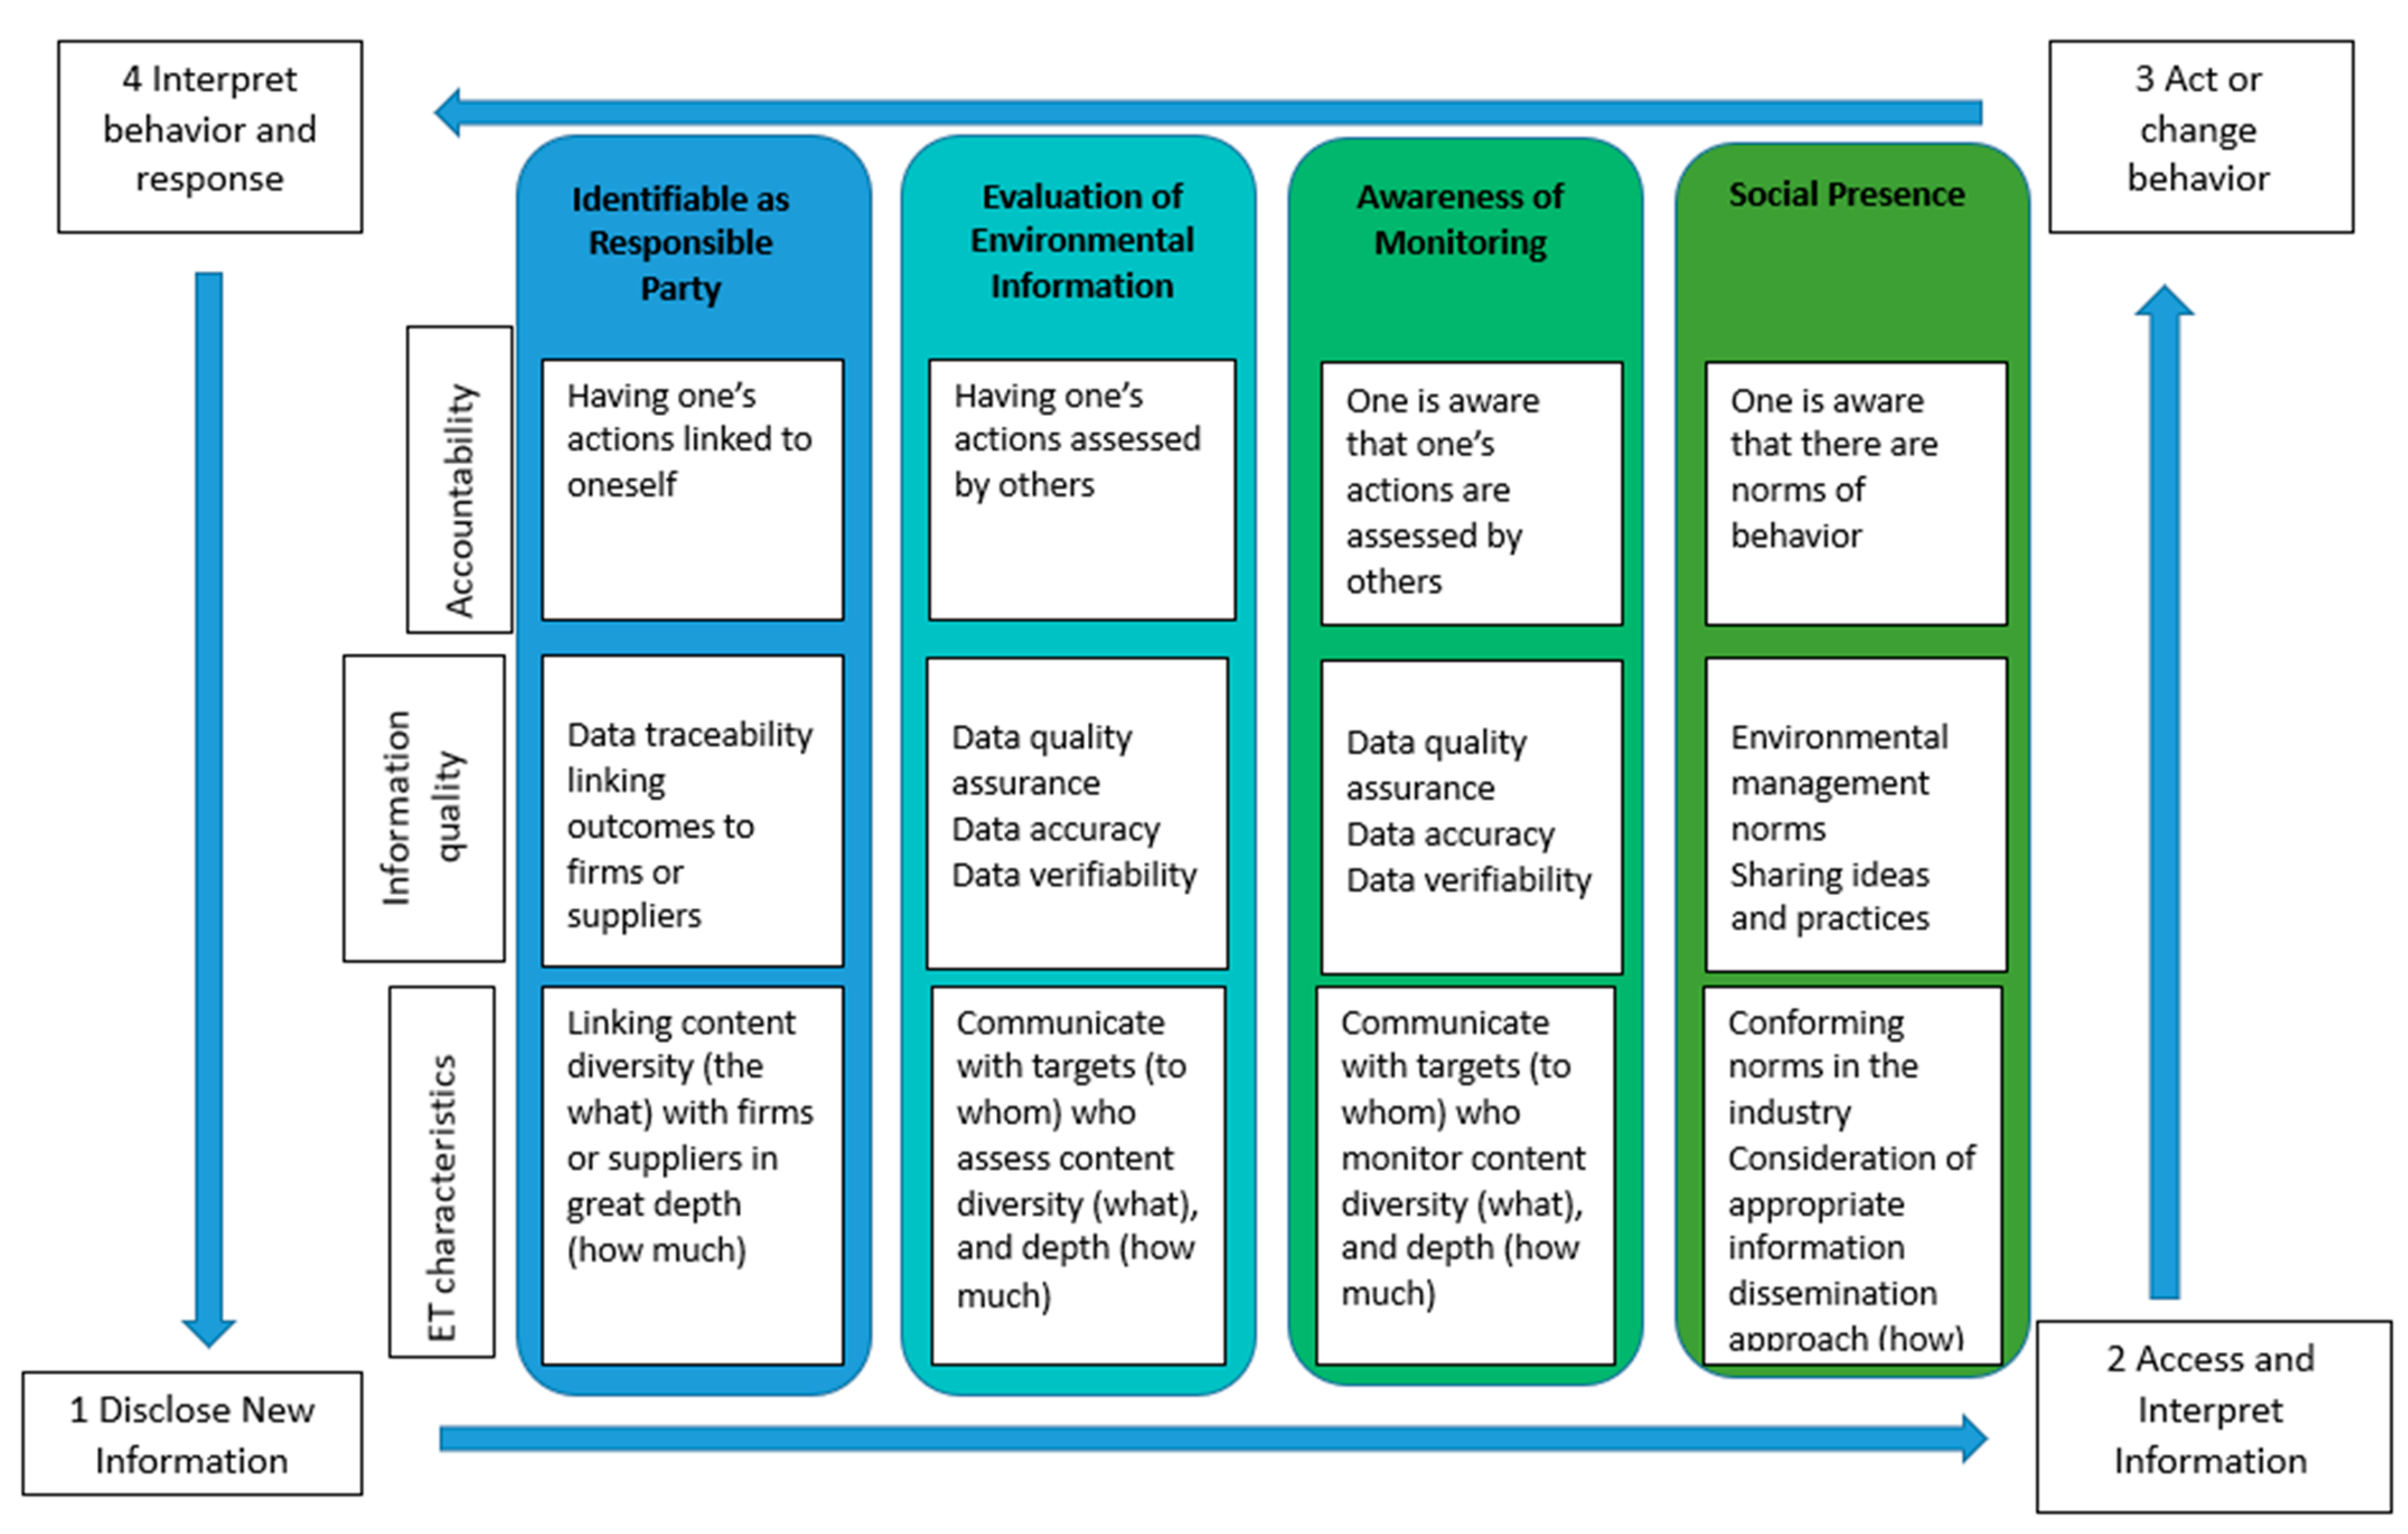
Figure 1 shows how ET and EA can be enhanced through the different avenues of information disclosure that support effective governance mechanisms. We incorporate the four-step “action cycle” in Fung et al. (2004) to provide a better understanding of how information disclosers receive feedback.
A contentious issue in Step 1 is determining how to characterize information that truly represents transparency. While transparency is an ambiguous and vague concept [
12], there are some commonly defined characteristics. First, rather than viewing transparency from the perspective of a sender or a linear transmission of information, we should emphasize how effectively the users interpret the information [
12]. Second, transparency means that the information disclosed must be accessible, timely [
13], open [
14,
15], relevant and reliable [
16]. Transparency points to observability, which requires clarity, understandability, interpretability, and coherence [
17,
18] without information distortion [
19]. Additionally, there is a need to consider how the information is used for effective stakeholder governance (Step 3) that holds the disclosers accountable.
From the perspective of the stakeholders [
20], ET should allow stakeholders such as customers, government, green groups, and non-government organizations (NGOs) to be more informed, which subsequently enables them to evaluate the extent of the transparency and accountability of a firm. Information provided by ET should allow the government to identify regulation needs and their effectiveness in improving the functioning of markets [
21]. The information integration theory explains that each type of information has its own value (informational stimulus that affects judgment) and weight (the psychological importance of the information) [
9]. When stakeholders perceive the new information is valuable (e.g., stimulates effective evaluation) and important (weight), they will be more likely to perceive the disclosure as being accountable through transparency (attitude change).
We argue that the main goal of ET is to engage with stakeholders so they can carry out effective governance. Stakeholder governance can hold disclosers accountable because internal corporate governance is liable to neglect the interest of the stakeholders. Thus, ET is not just a tool for informing but should embody a governance system that assists stakeholders assessing environmental information and the performance of the disclosers. To determine which type of information is valuable and carry more weight, we need to understand how stakeholders expect the disclosers to be accountable. Being accountable means being answerable to one’s actions, intentions, and beliefs. The accountability theory suggests that
identifiability,
awareness of monitoring expectations of evaluation, and
social presence [
22] drive accountability. To illustrate the roles of these four accountability drivers, we draw upon examples from 50 companies listed in the annual Best Global Green Brands report, the Global RepTrak 100, and The Climate A-List of the CDP (formerly the Carbon Disclosure Project).
2.1. Identifiability
Identifiability means that actions can be linked to oneself. The public expects that firms are responsible for their own actions or inactions that have environmental impacts. When a firm perceives it is more identifiable, its sense of accountability also increases [
23]. Subsequently, the firm behaves as expected and becomes more transparent. The theory in Deming (1982) emphasizes transparency with a more detailed unit of operation to enable access to the data of a firm which would allow observing, monitoring, assessing, and improving its processes. Thus, some firms have started to share supplier lists, disclose audited details of a specific supplier, and even showing the GPS locations of their operations or suppliers. For example, Nestlé, the largest food company in the world and one of the major players in the global palm oil industry, published a list of direct and indirect palm oil suppliers and mills with the aim to identify unethical suppliers and mills and reduce the risks of deforestation and human rights infractions. Sime Darby Plantation, a palm oil producer in Malaysia, publishes the GPS location of its mills on an interactive map called Crosscheck 2.0 (
www.simedarbyplantation.com, accessed on 1 June 2018). This increased transparency of its supply sources further increases perceived identifiability and subsequently upstream accountability.
2.2. Awareness of Monitoring
Awareness of monitoring means firms recognize that they are being monitored. Nowadays, firms know that they are potentially under the gaze of NGOs, government agencies, ranking organizations, local communities, and business partners. Global Forest Watch provides geolocation maps for any user to monitor whether a firm is involved in deforestation. Databases such as the Environmental, Social and Governance (ESG) are used to facilitate monitoring and ranking of firms in terms of their environmental, social and governance performances. A low ranking could result in significant damage to reputation. With continuous monitoring and therefore the risk of being poorly ranked, firms would ensure that their disclosed information is more accurate and verifiable by external infomediaries. To do so, systematic procedures that make environmental data accessible to internal and external parties for monitoring are implemented. Furthermore, reliable environmental information measurements would be instilled into the organizational processes. In doing so, firm performance can be self-monitoring to identify areas for improvement. For example, Hermès, a luxury-goods manufacturer, has monitored its environmental performance since 2012 through a reporting system that collects data on resources consumption in its production sites. The data provide Hermès with insights into its ongoing environmental performance. Thus, an increased awareness of monitoring can motivate accountability and improvement in performance.
2.3. Awareness of Evaluation
To ascertain whether expectations are met, external parties and stakeholders evaluate the firm-disseminated information. The evaluation by the public, government, NGOs, and other stakeholders serves as a form of policing, which could have consequences that range from purchasing, endorsing, or boycotting of a firm. For example, Coca-Cola and Pepsi were boycotted in India in early 2017 due to allegations that they were siphoning the scarce local water resources, while the farmers were struggling to irrigate their crops. Back in 2004, a Coca-Cola bottling plant was shut down by the local authorities in India, and the company was held liable for US$47 million for damages due to its alleged unethical water use. Coca-Cola repeated this offense again after ten years and was found extracting ground water illegally. All these infractions suggest that Coca-Cola has failed to address its environmental impacts on the local environment and made false claims of being water stewards. To avoid misleading evaluations, firms need to provide verifiable information, i.e., accurate environmental information understood by target audience. They must provide a wide variety of different contents and in-depth information to specific stakeholder groups through specific channels. This requires a better understanding of the knowledge and expectations of stakeholders who evaluate them. There might need to demonstrate both positive and negative performances because a proactive approach to wrong doings could help to avoid severe criticism or being boycotted.
2.4. Social Presence
Since firms are open systems that interact with multiple entities, e.g., customers, NGOs, government agents, etc. [
24], the existence of others in the business environment have a “mere presence” effect on them [
25]. The accountability theory suggests firms are pressured by the presence of others, even if they cannot fully assess a firm’s environmental performance. Parties who have a presence or pressure groups who intend to hold the firms accountable drive firms to treat them as communication targets. These stakeholders can demonstrate their satisfaction or dissatisfaction of the transparency and accountability of a firm. As the perceived social pressure increases, firms increase their accountability. For example, Toyota, a Japanese automobile manufacturer, prepared its environmental reports based on both the Global Reporting Initiative (GRI) Sustainability Reporting Guidelines and Environmental Reporting Guidelines by the Japanese Ministry of the Environment to address concerns raised by locals and international communities. Under immense social pressure, firms may incorporate the use of two-way stakeholder engagement such as dialogues to better understand the expectations of their stakeholders. Honda is another Japanese car manufacturer and both they and Toyota understand the needs of their market by presenting details on their environmental commitment which result in meetings and forums with customers and investors.
3. Incorporating Accountability-Driven Stakeholder Governance
This section incorporates the roles of stakeholder governance to the framework in
Figure 1. To hold someone accountable, the accountability process must be transparent (Walker, 2002) for stakeholders to effectively monitor them. When the degree of volunteered transparent information is low, crisis events act a powerful mechanism that hold a firm accountable. Without a major crisis, many firms hesitate in actions that increase transparency, such as providing supplier lists, revealing positive and negative impacts, admitting to involvement in an environmental crisis, etc. Crisis empower stakeholders to confront firms, bring their misconduct to public attention, and subsequently demand accountability. Not every firm is however ready for such a challenge, so being caught off guard will drive serious firm behavioral changes. For example, in view of Nestlé was reluctant to address and failed to provide information about its source palm oil, Greenpeace launched its “KitKat Killer” campaign in 2010 to publicize that the candy bar Kit Kat was a killer of rain forests as Nestlé used unsustainable source of palm oil in making Kit Kat and its other chocolate products. Ultimately, this crisis opened a “policy window” for stakeholders such as Greenpeace to kick-start the demand for ET and EA on palm oil.
If a firm lacks ET, stakeholders can use different governance mechanisms to hold them accountable. Some NGOs name and shame companies with a low score for specific environmental management factors. Rating companies and NGOs affect how firms disclose their environmental policies and performance. Initially, Greenpeace rated Apple poorly in 2006–2012 but later ranked them a leader in the industry as one of the three cleanest data-center operators in the world in its 2014–2016 “Clicking Clean Report”. The change of heart is because Apple made some significant improvements in its environmental conducts under the leadership of Tim Cook.
Another important stakeholder group are investors. The ESG or other sustainability rating companies and market analysts nowadays provide comprehensive reports to support the decision-making process of investors. In addition to information related to the financial health and governance of financial performance, investors can collect information about the ESG factors, which are based on the self-reported data of firms as well as other sources of information. A report by Ernst & Young in 2020 suggests that 91% of the investors refer to ESG performance to guide investment decisions. ESG performance may affect bond pricing and real asset valuations, and most importantly, influence the long-term performance of firms. Fernandez-Feijoo et al. (2014) suggested that investors are better informed when they take the ESG factors into account to predict the future earnings of firms. However, the Ernst & Young report revealed that investors are increasingly dissatisfied with the information from ESG performances. Investors now demand access to more rigorous ESG data for evaluation purposes. They also want an increase in the scope of assurance for more creditability and transparency about a firm’s performance and impacts. Thus, to access capital, firms need to communicate their impacts and plans in response to investor expectations.
ET drives accountability through increasing identifiability, monitoring, evaluation, and social pressure. For example, when lead firms such as Nestlé publish their supplier’s list, they make it possible for stakeholders to identify the suppliers who are responsible for environmental impacts, monitor and evaluate them, and pressure them and even Nestlé itself to increase accountability to its stakeholders. To protect from false allegations, reputation risks and even disassociation from Nestlé as their supplier, suppliers therefore ensure that the environmental information disseminated is collected from reliable sources and reflects the truth around their environmental actions and practices. These developments drive Nestlé and their suppliers to emphasize on the accuracy and reliability of the collected environmental data. They use third parties or reliable information-sharing linkages to collect and share a variety of data from audits, inspections, operating processes, and those that are factual and objective. They adopt more stringent measures in their operation processes to ensure that the collected information is traceable, accurate and verifiable. They are improving their environmental performance and practices because stakeholders now have more knowledge and insights into their operations and environmental issues. That means ET driven by accountability criteria allow stakeholder governance mechanisms to work more effectively.
3.1. ET Characteristics
Figure 1 shows how the four accountability criteria and stakeholder governance can be incorporated into a framework to drive disclosure of relevant and useful information for supporting stakeholder governance mechanisms necessary to hold the firm accountable. Discloser firms to know “
what” (content diversity) and “
how much” (content depth) information and “
to whom” (targets) or “
how” (channels) the information must be disseminated [
26,
27,
28].
Table 1 provides some sample practices used to achieve these different facets of ET transparency.
3.2. Content Diversity (The ‘What’)
Content diversity concerns “what” type of environmental information is to be shared. To enable effective monitoring and evaluation, it is important to define the different types of environmental information to be disseminated. Based on previous studies and the GRI guidelines, there are two types of reported environmental information, namely (i) information obtained through directional predictions, and (ii) factual and objective reports, which are also known as soft or hard disclosure, respectively [
29].
Directional predictions are concerned with the information related to organizational strategies, and environmental initiatives and firm position. They reflect the direction and position of firms in reducing their environmental impacts. This kind of environmental information is often associated with pledges towards environmental programs and practices that will be implemented, such as landfill programs (e.g., by Apple and Google), recycling programs (e.g., by Apple, Cisco, Canon), eco-responsible packaging programs (e.g., by UPS), use of renewable energy (e.g., by IBM) and adoption of low-loss electrical energy distribution systems (e.g., by Oracle), etc. Directional predictions help stakeholders to understand and evaluate the environmental protection orientation of an organization by facilitating transparency around actions taken, plans made, or steps that will be taken to reduce environmental impacts. To facilitate evaluation, information from directional predictions must be linked to outcomes such as environmental performance.
Factual and objective reports provide specific information on environmental performance as evidence of the results of specific environmental efforts. For example, IKEA publishes factual and objective reports on the types of cotton that the company uses in its products as evidence of its environmental efforts. All their cotton comes from sustainable sources, with 17.5% recycled cotton, and 82.2% cotton grown that meets the Better Cotton Initiative standard or is sourced from farmers who are working towards Better Cotton standards, or other more sustainable types of cotton, such as the cotton from the e3 Sustainable Cotton program in the USA in 2016. Similarly, Apple encourages its suppliers to participate in its environmental initiatives, namely the Supplier Clean Energy Program and Supplier Energy Efficiency Program, which aim to reduce energy consumption. Through its Supplier Clean Energy Program, 100% of Apple’s suppliers share their annual environmental monitoring data through the platform offered by the Institute of Public and Environmental Affairs (China) to enable tracking and assessment of their environmental performance. A total of 77% of Apple’s suppliers participate in the Supplier Energy Efficiency Program, which results in a year-on-year carbon emission reduction of 113%. With the participation of its suppliers, these environmental initiatives by Apple have reduced more than 320,000 annualized metric tons of greenhouse gas (GHG) emissions in 2017. Factual and objective information not only can be linked to the actions that firms have taken for environmental protection, but also the progress and outcomes of these actions, thus allowing stakeholders to assess the impacts of the organizational actions.
3.3. Communication Channels (The ‘How”)
Communication channels reflect “how” firms disseminate their environmental information through different avenues; for e.g., face-to-face meetings, social events, annual and corporate social responsibility (CSR) reports [
30], corporate websites, social media, press releases [
31], and standardized reports, to information system linkages with partner firms [
32]. While some of these channels enable direct information sharing with specific partner firms using specific communication linkages, other broader channels enable sharing of information with a wider audience. Social media and websites are currently popular means of sharing information to both targeted audiences and the public in general. For example, Disney discloses its environmental protection efforts and performance on its company webpage, and their Animals, Science, and Environment Facebook page provides updates about its environmental and social efforts, which partly focus on informing animal cruelty activists and the public.
Nevertheless, the use of public communication channels e.g., media, company website, or press releases to disseminate environmental information to a broader audience only promotes passive engagement. The disseminated information is often quite general with positive aspects, making it more challenging to identify, monitor and evaluate a specific environmental issue, effort, or outcome. For example, Pampers runs the “Better for Baby” campaign to promote its sustainability efforts in reducing the amount of material used to produce and package diapers by 50% and reducing manufactured waste by 78%. Also, a manufacturing plant in Targowek, Poland, which has produced Pampers diapers since 2014, uses electricity that comes from 100% renewable resources. This information is posted on social media and the company website to inform the wider public and does not target a specific audience or stakeholder.
To allow specific stakeholder groups to monitor and evaluate, direct information-sharing mechanisms (e.g., information integration or reporting systems) are used to share specific environmental information with partner firms [
32]. Such information-sharing linkages follow consensual standards and formats between partner firms to realize certain purposes. For example, Coca Cola Enterprises and its suppliers have agreed to measure and report their carbon emissions in their responsible processes. This enables Coca Cola to collect specific information needed from its suppliers to help identify environmental issues in the supply chains. The CDP is another large-scale direct information-sharing entity. Their deliberate and purposeful linkages enable all involved partners to assess the carbon footprint in the supply chain. Standardized measures and formats used are key to ensuring data quality, accuracy and verifiability.
3.4. Content Depth (‘How Much’)
Content depth concerns “how much” environmental information is shared. Content depth reflects the permeability of the boundaries of a firm in environmental protection. Content depth allows monitoring and reporting of the environmental impacts in areas such as resource consumption and pollution discharge in specific operations. For example, both Audi and Ford show the environmental impacts from the materials that they have used at different operational levels. When disseminating information about the materials used, both companies provide details on the composition. Audi further disclosed its use of a total of 3.1 million metric tons of raw materials in 2017, of which approximately 3% are renewable raw materials. On the contrary, Ford did not provide the percentage of renewable materials used. Yet Ford offered detailed information on the energy use within its company as well as that by its marketed vehicles. According to its own issued sustainability report in 2017, Ford estimated that its 2017-sold vehicles consumed 2.25 EJ energy in that year. On the other hand, Audi only disclosed the amount of energy consumed within its own company while information on that by its vehicles is not shared.
3.5. Communication Target (‘To Whom’)
The communication target is the type of stakeholder who is targeted for environmental information disclosure. The target can include investors, customers, suppliers, NGOs, government bodies and the public.
Table 2 lists the practices that are used to communicate with different targets. The communication target can be broadly categorized into internal and external stakeholders. Different stakeholders might have different relationships with a firm and play different roles in their environmental management activities [
33]. Some firms focus on disseminating environmental information to their investors to attract investment, or reporting to government bodies for compliance purposes, while others share environmental information with their business partners (e.g., customers and suppliers) to coordinate environmental efforts across their supply chains. Employees as internal stakeholders may receive communication that strive to align and coordinate environmental efforts or create awareness. For example, H&M provides regular training to its designers and sourcing staff on sustainability issues. Similarly, Nike offers training workshops to its chemical management employees. Oracle also offers environmental awareness training to its employees.
The diversity, depth and dissemination avenues of the content that are communicated with a specific communication target reflect how much a firm wants to engage with a certain stakeholder group. For example, understanding that consumers play a significant role in supporting its environmental protection efforts through their selection and usage of cars, Toyota holds roundtable conferences, social gatherings, and special workshops with the community several times a year. While these events allow Toyota to showcase its latest environmental management efforts in new environmental initiatives through its car designs and production techniques, consumers are also educated about eco-driving methods. Moreover, the events allow direct interaction between organization and consumer. These events enable Toyota to understand the driving experience, usage patterns, environmental impacts, cost, and other concerns of consumers, thus providing market insights into its product design and environmental orientation. However, Toyota has not actively invited environmental activists to such events. On the other hand, Samsung has focused on communicating with its investors, suppliers, and employees as well as government bodies and NGOs by holding meetings with them to share updates in its environmental management efforts and acquire input on how the company is perceived by the industry and for policy development.
4. Application of the Framework
We use the framework in
Figure 1 to compare exemplar cases [
34] from the 50 business companies mentioned earlier. These companies are leaders in their respective industry sectors, and some of them are considered environmental leaders by their peers. Our samples do only cover only nature-inspired enterprise because we aim to understand how companies improve environmental accountability and transparency to become more nature-inspired. A summary of these sample firms is provided in
Appendix A, which shows how we sample them based on their sustainability ranking and scores. They are selected for four reasons. First, they are leading brands in the fields that have demonstrated commitment and effort in reducing their environmental impact through various means, which include environmental programmes and initiatives and technology adoption. Second, the environmental performance of these firms is evaluated by third-party reputable organizations. The information in their annual and CSR reports and websites is therefore likely to be reliable. Third, due to their leading position in the field, information on their environmental initiatives and performance is publicly available from news reports, NGO review reports, and media releases, thus providing data beyond carefully vetted reports (e.g., CSR and annual reports) to triangulate the data for validity and reliability. Lastly, due to their business nature, the sample firms work with trading partners, authorities, and government bodies around the world for environmental management purposes, which will help to enhance the generalizability of the study findings. The case examples were drawn on publicly available information and used for illustrative purposes.
To ensure data integrity and validity, we confirmed that the collected data met one of the following criteria. First, we selected information that appears in at least two sources so that we could triangulate the information. Second, the implementation dates of the environmental programs, initiatives, and practices are available. Third, the information is available and validated by a third-party, including NGOs, environmental groups, or government agencies. The screened data were analyzed with open and axial coding to categorize the ET activities of firms into facets of ET and EA. Open coding enables identifying of the characteristics and properties of each facet, while axial coding facilitates refining of the characteristics of ET.
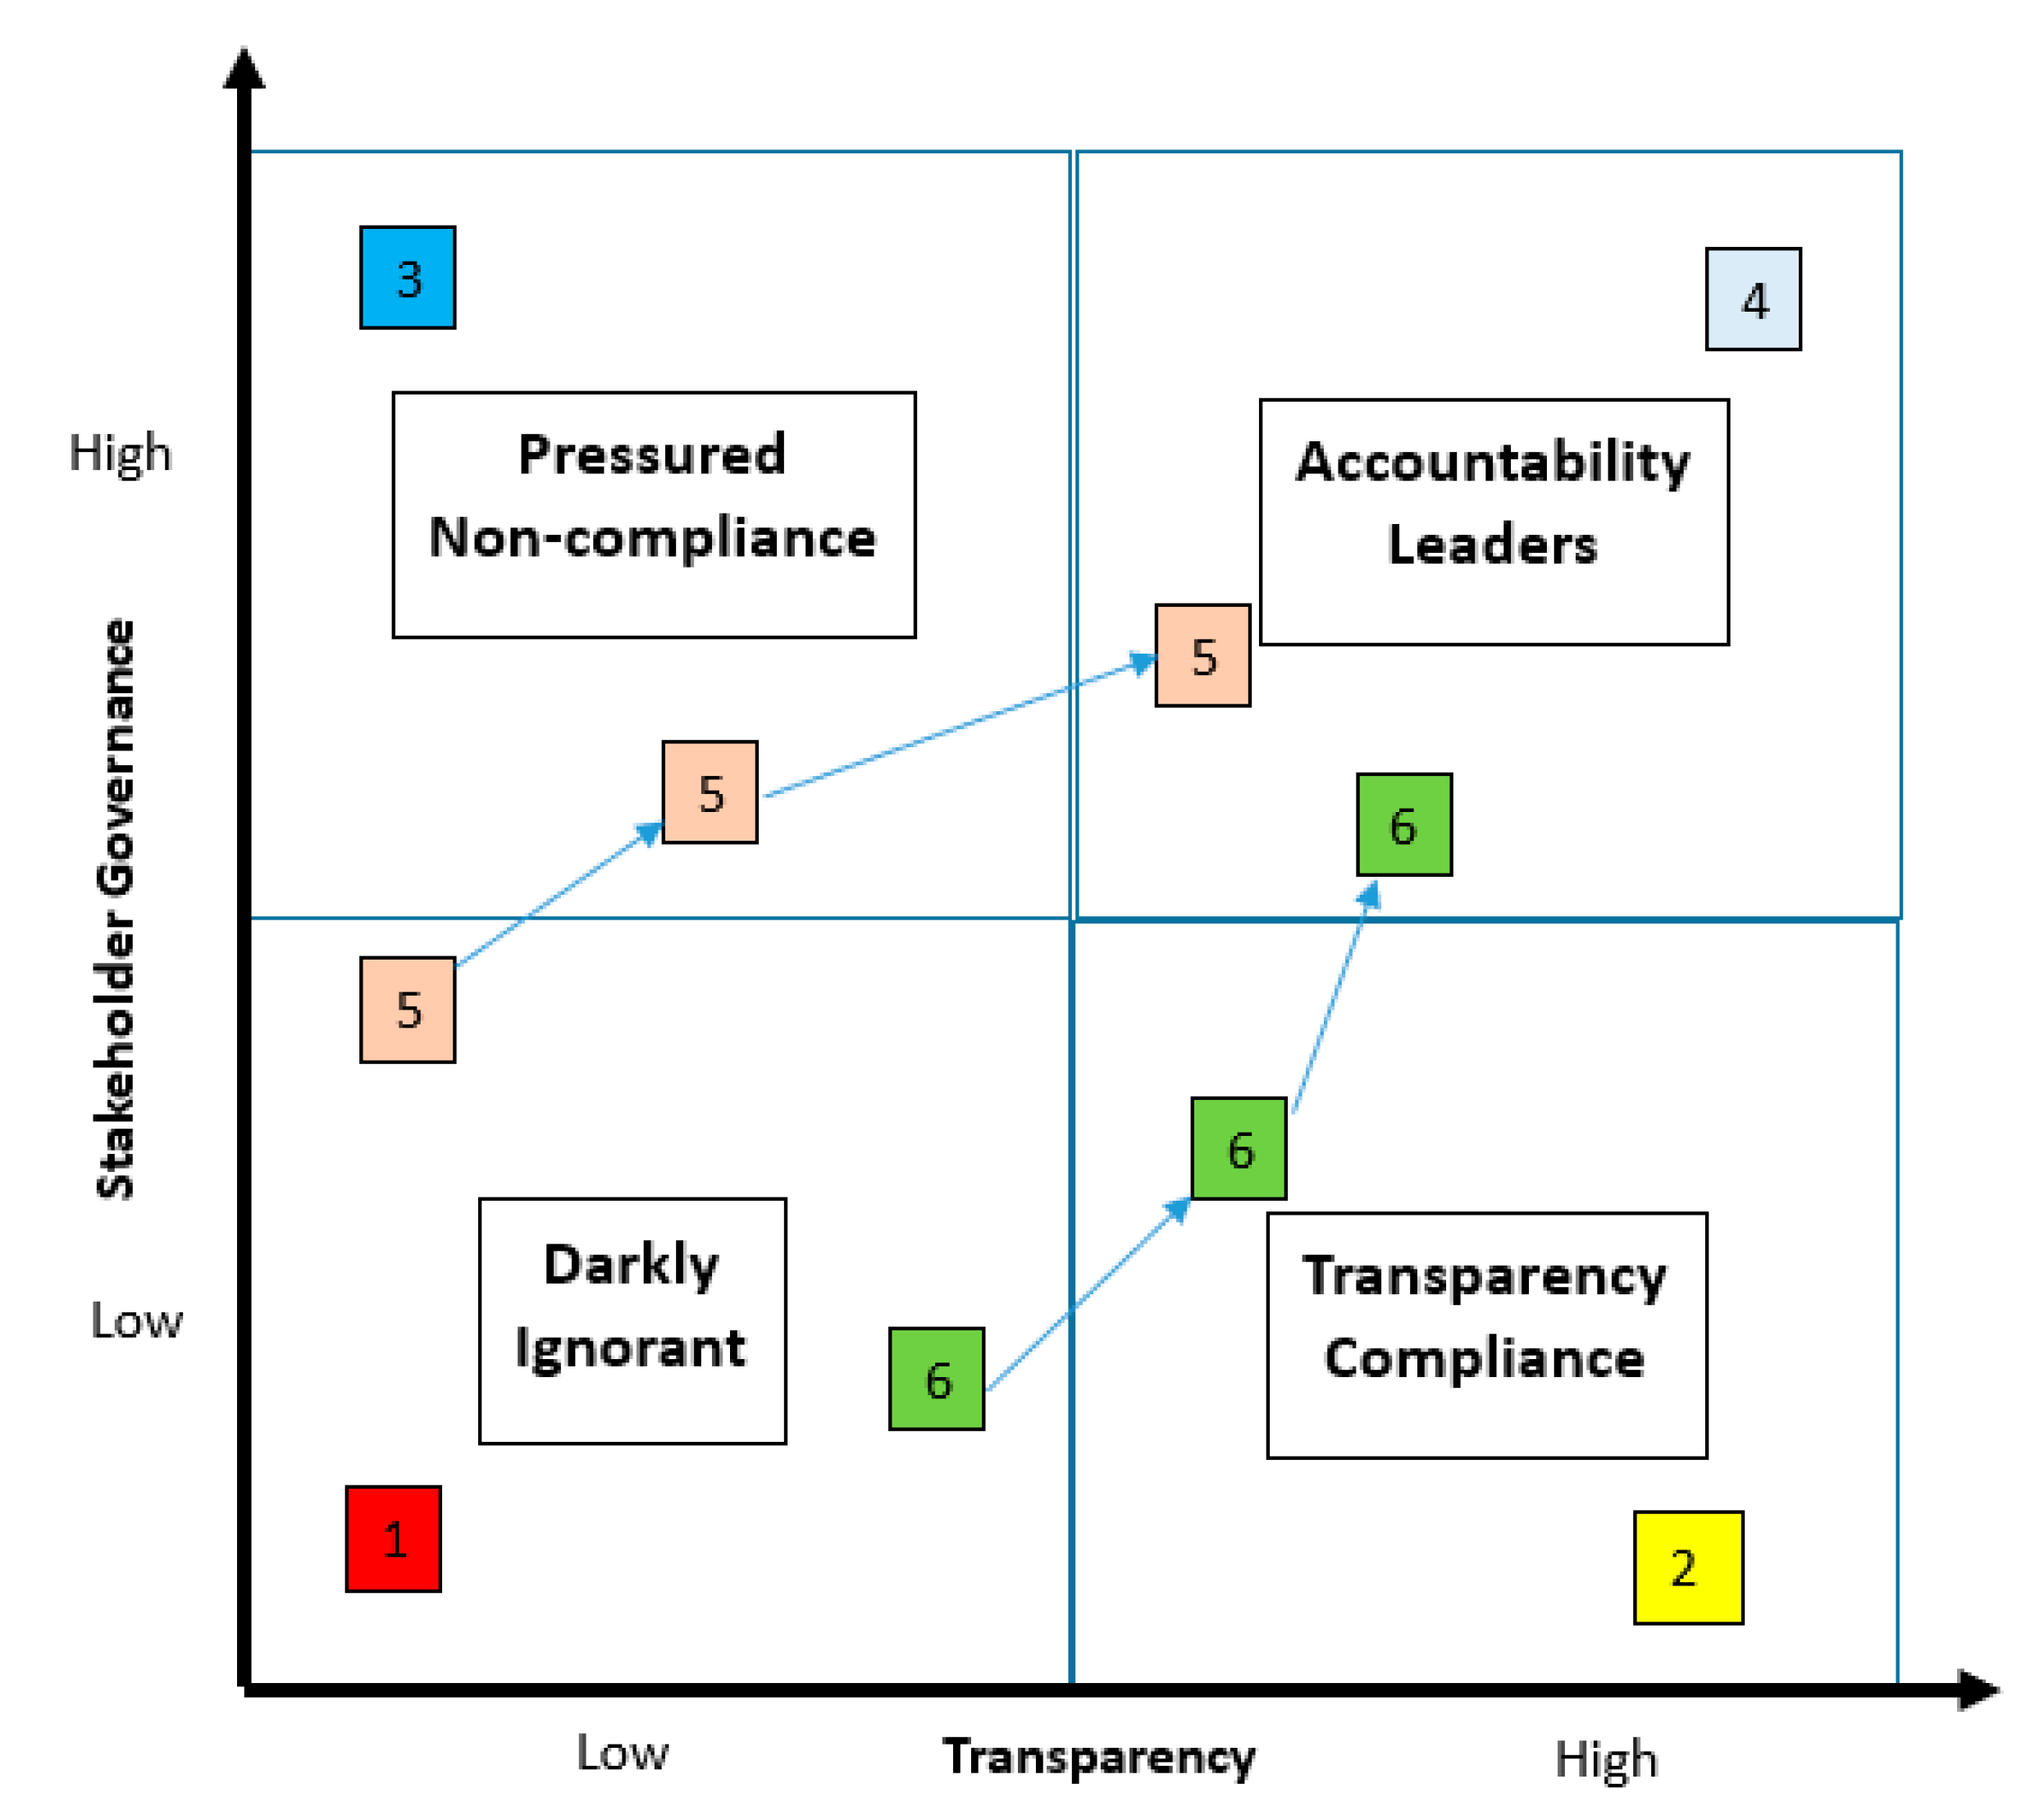
The analysis consisted of three steps. First, we identified the “what”, “how”, “how much” and “to whom” from the environmental information disclosure behaviors among the 50 firms. Next, following the criteria of identifiability, monitoring, evaluation, and social pressure, we assess whether these information disclosure behaviors allow effective regulatory stakeholder governance. Third, we position exemplar firms into a 2 × 2 matrix by combining the first two analyses on ET and governance together. The 2 × 2 matrix in
Figure 2 suggests a high level of EA is achieved through a high level of ET driven by a higher-level stakeholder and regulatory governance.
We label the firms at the lowest left corner as (red box with number 1) “Darkly Ignorant” because they do not disseminate a wide range of information about their environmental performance and in great depth to many stakeholders. They operate in secrecy and avoid answering to environmental issues. They do not face any serious pressure from stakeholder groups and there is limited information about their environmental impacts and efforts in the public domain. They are not identifiable, and it is difficult to monitor and evaluate their environmental efforts and performance. For example, prior to 2017, Amazon did not publish sustainability reports or share information about its GHGs. Its official website was the only source of information of its environmental measures and initiatives. The CDP gave them an “F” for non-participation in 2017, as the company had not responded to their questionnaire from 2010 to 2017. Similarly, Budweiser, the largest beer brewer, did not establish an environmental sustainability plan before 2018. It was ranked 40 on the Toxic 100 list and the Political Economy Research Institute at the University of Massachusetts Amherst in the US found that the company was releasing 1,002,786 kg of toxic pollutants into the environment. On Earth Day in 2018, Budweiser finally announced its environmental sustainability goals. These firms had clearly lacked transparency and showed little accountability in terms of ET.
On the flip side, there are firms that are very generous in voluntarily sharing environmental management information considering social pressure. However, they are simply following the “bandwagon” (the actions of others). These firms are labeled as those that demonstrate “
Transparency Compliance” as shown in
Figure 2 (yellow box with number 2); that is, those who voluntarily disseminate their environmental information through self-reporting. Such firms provide a higher level of transparency as the information is often broadcasted to a wide range of stakeholders. However, the information disclosed does not allow scrutiny at the operational level, meaning that it is difficult to identify, monitor and evaluate the responsible firm when an upstream supplier is found to violate an environmental requirement. Pressure from stakeholder governance is relatively low as the disseminated environmental information is often viewed as standard but also too vague to hold such firms accountable. Many firms voluntarily publish sustainability reports to show that they comply to industrial norms. However, they do not provide identifiable information to stakeholders which would require them to answer to the damage inflicted onto the environment in their supply chains. There is the lack of identifiability, despite the presence of stakeholder groups who monitor and evaluate them. Such firms are aware that they are being monitored and evaluated. So, they increase the information disclosed just enough to “silence” the pressure groups and gain legitimacy. For example, there is the Walt Disney Company, which is one of the largest and most well-known companies to voluntarily disseminate information on its environmental impacts through CSR reports in specific areas, including energy, water, soil, and biodiversity impacts. The information that they disclose through a self-imposed carbon tax since 2009 follow the regulation on GHGs. Similarly, Nike produces reports on their environmental impacts with information including energy consumption, waste incurred in its operations, and water and chemical use. However, details of emission and pollutants released are missing in their report. Hermès, one of most well-known luxury fashion brands, offers some information about its environmental conducts, including using renewable materials, but provides few details about its environmental impacts.
There is another group of firms that are labelled with the number 3 in a dark blue box in
Figure 2. They are targeted by pressure groups because their ET is below expectations. They are firms that are “
Pressured or (have been)
Targeted Non-compliant” or “
Prone to Suspicious or False Claims” as they provide some factual data to a limited audience of stakeholders, for e.g., the government and customers, to comply with their requirements but offer few details (the how much criterion) to allow meaningful evaluation. They provide vague information with a low level of transparency to a few stakeholders in anticipation that this could be perceived as adequate transparency. With limited depth and content diversity that aim to satisfy the targeted stakeholders, their identifiability is limited. Although these firms are aware to some extent of the monitoring and evaluation expectations of some of the specific stakeholder groups, they also underestimate the social presence and pressure. For example, to comply with the Clean Air Act of the US Environmental Protection Agency (EPA), automakers who wish to sell their vehicles in the US market must provide emission data to the government. In 2015, Volkswagen used emissions-cheating software to mask the true emission levels of the diesel engines in their cars. In 2020, Daimler AG conducted a national recall and repair of the emission system of their Mercedes-Benz diesel vehicles sold in the US between 2009 to 2016. More than 250,000 diesel cars had undisclosed auxiliary emission control devices and defective devices programmed into the vehicles using complex emission control software. The emission controls performed less effectively, which resulted in an increase in nitrogen oxide (NOx) emissions above the allowable standard. Daimler AG ended up paying a settlement and penalties at a sum of about US
$1.5 billion.
Accountability Leaders refer to those who are exceptional in disclosing detailed factual and directional information to the public and specific stakeholder groups in a regular and practice basis. Labelled in a light blue box with the number 4 in
Figure 2, they offer a high level of details (depth) and content diversity by using both passive and interactive channels with the genuine intent to engage with stakeholders and treat them as an important governance body. Such firms are more open, and proactively take responsibility and are answerable to the environmental issues created by their entire end to end supply chain. They do not worry that they are identifiable, thus subjecting themselves to monitoring and evaluation, and they also exert social pressure in the industry instead of running away from the pressure. Toyota, for example, has maintained a high ranking on the Best Global Green Brands since the report was first published. Toyota makes environmental sustainability its management priority. The car manufacturer has achieved a near zero-landfill status at all its North American manufacturing plants. It continues its commitment to build LEED-certified buildings and dealerships. Similarly, Apple (more recently) was ranked at the top in a list of various companies that have shown great efforts and results in addressing their environmental impacts. Under stakeholder scrutiny and criticism of its environmental impacts, Apple is now producing environmental progress reports and publicizes information about its environmental initiatives to stakeholders to hold themselves accountable for their impacts to the environment. These are exemplars that have transformed themselves into nature-inspired enterprises.
Figure 2 shows that some firms shift to a different category in the 2 × 2 matrix. As mentioned, many firms such as Nestlé experienced an unexpected crisis and were subsequently pressured by external stakeholders (usually NGOs or regulators) to rectify the damage. So, they followed the path with the number 5 in pink boxes in
Figure 2, and were initially “Darkly Ignorant” but then shifted to a firm that is “Pressured or (has been) Targeted Non-compliant” and further shifted to become “Accountability Leaders” after experiencing tremendous pressure and scrutiny from their stakeholders. As stated earlier, Greenpeace launched a social media attack on Nestlé called the KitKat Killer campaign. Instead of retaliating through social media, Nestlé suspended sourcing of palm oil from non-sustainable suppliers and held meetings with Greenpeace to provide details about its palm oil supply chains. Nestlé also hired external creditable bodies to certify the sustainability of its palm oil supply.
Some other firms notice that their peers experience pressure from their stakeholders and significant loss of reputation. They realize that it is more to their advantage to voluntarily comply with the expectations of their stakeholders. They will therefore follow the path marked with the number 6 in the green box in
Figure 2 to demonstrate “Transparency Compliance”. However, they will not necessarily make extra effort to become “Accountability Leaders” if there is insufficient external stakeholder pressure, as argued by Hess (2007). An example of a sector that shifted from “Darkly Ignorant” to “Transparency Compliance” is the banking industry. Both Citi Bank and HSBC have invested in and developed an environmental sustainability framework and reported environmental initiatives in view of the weight that their investors place on environmental issues. Yet, the details of their environmental impacts are still unreported.
Both Paths (5) and (6) are important pathways to create accountability leaders. We use the “action cycle” and data from the 50 firms in Fung et al. (2004) to show that Path (5) initiated due to dissatisfaction with ET among stakeholders is an important governance mechanism that exemplifies the expectations of stakeholders. The pressure from the stakeholders will compel more firms to voluntarily follow Path (6). Whether these “Transparency Compliance” firms move on to become “Accountability Leaders” depends if their stakeholders give them enough pressure, or a regulation is created to do so. Another potential driver is the emergence of a “Accountability Leader” in the industry who will increase the standards and shift market expectations so that a premium price can be set for such products. For example, Xerox was one of the charter partners who supported the launch of the EPA’s Energy Star Program in 1993.
5. Proposition Development and Discussion
The application of the environmental transparency and accountability framework to compare some exemplar firms suggests stakeholder governance can significantly affect the level of environmental transparency. Even though firms prefer to be less transparent to avoid being held accountable [
3], our analysis shows the “action cycle” of Fung et al. (2004) explains how information disclosed and the lack of it are used by stakeholders to pressure the disclosures. Our analysis suggests the four criteria—identifiability, awareness of monitoring, expectations of evaluation, and social pressure—can be increased by stakeholder actions, driving firms to increase transparency through improving content diversity, content depth and target stakeholders/channels specificity, and through this process accountability is increased. These processes are important for transforming most enterprises from opaque and less accountable for the natural environment toward nature-inspired enterprises and accountability leaders. Because these processes eventually create environmental leaders and raise standards in the industry, they become important mechanisms to drive the creation of more nature-inspired enterprises.
The framework and our analysis provide the basis to formulate several propositions that explain the governance mechanisms in which ET and stakeholder governance drive increased accountability. First, the analysis shows firms that are originally less transparent are pressured to increase ET when powerful stakeholders uncovered major incidents. This mechanism is particularly relevant to large multinational firms that are regarded as leaders in the industry, i.e., Nike’s sue of child labor in the 1990s and the Greenpeace’s palm oil campaign against Nestle. Thus, we posit:
P1. Leading firms in industry that are less transparent than stakeholders expected will be pressured to increase environmental transparency and accountability once a major identifiable incident is uncovered by major stakeholders.
The second governance mechanism usually comes after leading firms in the industry have been pressured to become more transparent and accountable. This is like the “jump on the bandwagon” effect. After observing peer firms being punished by stakeholders, other firms will become more aware of the identifiability, monitoring, evaluation, and social pressure from different stakeholders. However, due to the tendency to refused being held accountable by others [
3], most firms will regulate their ET and EA to a commonly accepted levels slightly below the environmental leaders in their industry and slightly above the know unacceptable standards.
P2. Peer firms observing leading firms in industry being pressure to increase transparent and accountability by stakeholders increase environmental transparency and accountability to a level below the leading firms.
The third mechanism is used by powerful stakeholders to punish those firms that refuse to increase ET and EA despite many firms in the industry have done so. Zara for example became the main target of the Greenpeace’s Detox Campaign because Zara was slower in responding to Greenpeace’s reports and allegation relative to other similar fashion brands. Such stakeholders often target such suspicious offenders who are less transparent and punish them heavily to make them more transparent and accountable.
P3. Peer firms observing other firms in industry being pressure to increase transparent and accountability by stakeholders and yet refuse to increase environmental transparency and accountability will be punished by powerful stakeholders.
The fourth governance mechanism requires both stakeholder governance and internal corporate governance. Most firms prefer to limit governance by external stakeholders. Few environmental leaders try to integrate stakeholder governance and corporate governance, by actively lead the industry in terms of ET and actively engage with major stakeholders. These firms are ready to lead EA in their industry. There is a threshold whereby firms at the forefront of ET and EA have provided enough transparency to facilitate identifiability, monitoring and evaluation (such as Patagonia, Unilever) such that stakeholders begin to work with them rather than against them, with the aim to drive the sustainability standards in the industry. Once this threshold is reached, the firm will accelerate efforts in ET and EA to gain competitive advantages from environmental leadership.
P4. When leading firms in industry increase environmental transparency and accountability to a threshold whereby stakeholders start to work with rather than work against them, the firms will accelerate efforts to increase environmental transparency and accountability.
6. Conclusions and Future Research
Nature-inspired enterprises take full accountability of the natural environment. The emerging literature argues that ET is an important means for increasing accountability important for creating nature-inspired enterprises. The originality of the manuscript is the framework built based on integrating several theories and literature: the action cycle of Fung et al. (2004), the information integration theory, the accountability theory, and the idea of stakeholder governance recently promoted by the editors from the Academy of Management Review as a hard problem (Amis et al., 2020). We have demonstrated how three important ET, EA and stakeholder governance treated by the literature separately can be integrated to gain new insights (our analysis in
Figure 2 and the propositions).
By extending the “action cycle” from the existing literature with four accountability criteria (identifiability, awareness of monitoring, expectation of evaluation, and social pressure), this paper shows that EA is created by several stakeholder governance mechanisms that enable ET to promote accountability. This paper shows that firms increase their accountability by changing the ways that they disclose information in four facets of ET, namely content diversity (the what), communication channels (the how), content depth (how much), and communication target (to whom), and they will not increase ET unless there is the presence of regulatory and stakeholder governance and pressure from them. To increase accountability, the required information disclosure must have diverse contents, detailed information that can be verifiable, identifiable, and traceable such that monitoring, and evaluation can become more efficient and effective, and that the users (stakeholders) can have meaningful dialogues or engagement with the disclosures.
The paper provides important implications to policy makers that set transparency policies so that the policies reflect the content diversity and depth that would increase identifiability, monitoring and evaluation required for the four mechanisms stipulated in our propositions. While the four facets of ET can provide a sense of accountability, policy makers need to recognize ET is not necessarily enough to demonstrate full accountability. The four mechanisms explain how policy makers can help stakeholders pressure and guide firms to increase accountability through incorporate the four criteria of accountability. When stakeholders find it challenging to monitor and evaluate the firms from the information that is disclosed, they are likely to be treated as firms that are “Darkly Ignorant” and pressured to comply with the demanded level of transparency. When other firms observe the social pressure on the Darkly Ignorant firms and their loss of reputation, they have a change of heart and strive to increase their ET. After a few Accountability Leaders emerge as a result, more firms will become nature-inspired Accountability Leaders under market competition mechanisms.
The framework and propositions serve as a platform to better understand the roles and dynamics of ET and stakeholder governance in driving EA. Future research may conduce in-depth and longitudinal case studies to understand the perspectives of both firms (disclosers) and stakeholders. Since we have no primary data, we may have overlooked important contextual factors and dynamics. The use of case studies will help verifying and enrich our framework and our arguments for the propositions, as well as developing constructs and measurement scales for testing the propositions. This will contribute to the ambition of developing a theory of stakeholder governance (Amis et al., 2020) from the perspective of transparency and accountability.


