Article

The CirCo (Circular Coffee) Project: A Case Study on Valorization of Coffee Silverskin in the Context of Circular Economy in Italy

1
School of Life Sciences, Technical University of Munich, Weihenstephaner Steig, 2285354 Freising, Germany
2
Institute for Renewable Energy, European Academy of Bolzano (EURAC Research), Viale Druso 1, 39100 Bolzano, Italy
3
CNR-SCITEC, via C. Golgi 19, 20133 Milan, Italy
4
FAVINI srl, via Alcide De Gasperi 26, 36028 Rossano Veneto, Italy
*
Authors to whom correspondence should be addressed.
Former collaborator of EURAC Research.
Sustainability 2021, 13(16), 9069; https://doi.org/10.3390/su13169069
Submission received: 22 July 2021 / Revised: 6 August 2021 / Accepted: 11 August 2021 / Published: 13 August 2021

Abstract

:
Coffee silverskin (CSS) is one of the main byproducts of coffee roasting and poses a potential risk to the environment if disposed of incorrectly. Each year in Italy, over 500,000 tonnes of green coffee are imported for roasting followed by consumption or export. This results in over 7500 tonnes of CSS produced each year which is typically disposed of as solid waste. Silverskin contains lignocellulose and can be used as a substitute for other raw materials to produce paper pulp. Both Life Cycle Assessment (LCA) and Life Cycle Costing (LCC) were performed to compare the impact and cost of CSS paper production to conventional paper production using only virgin pulp. It was shown that the addition of CSS reduces the environmental impact of paper production by 10% and greenhouse gas (GHG) emissions by 13% compared to conventional production with no cost increase (0.01% reduction with addition of CSS) for the producer. The results of this case study show that the utilization of CSS for paper production at the national level in Italy represents a suitable example of circular economy (CE).

1. Introduction

In 2018, the EU’s primary energy consumption accounted for approximately 1600 million tons of oil equivalent per year (Mtoe/y), of which a major contribution is provided by heating and cooling applications (around 800 Mtoe/y, which also includes industrial heat), followed by transport and electricity—which account for nearly 520 Mtoe/y and 280 Mtoe/y, respectively [1,2,3,4]. By 2030, the EU intends to further lower domestic greenhouse gas (GHG) emissions by 55% relative to 1990 levels. Moreover, EU countries have declared the goal of being the first climate neutral continent by 2050 [5,6]. The fulfilment of the Paris COP21 agreement is going to require equal, if not more, reduction of GHG emissions [6].
Circular economy (CE) plays a crucial role in this scenario. Circular economy intends to recover and valorize wastes and residues (from here on referred to as byproducts), adding value to these materials which can be included back into supply chains and minimizing the waste creation along the production pathways [7]. Moreover, the CE concept is gaining attention among researchers and institutions since it has potential to increase the sustainability of production and consumption systems [8]. According to the European Parliament, CE could increase the gross domestic product by 0.5% and create about 700,000 new jobs in the EU by 2030 [7]. By tapping into previously unexploited pools of byproducts, a new, valuable resource is available.
A study published by the EU in 2010 revealed that nearly 90 million tons of food byproducts are expelled from the food manufacturing industry every year [9]. Food industry byproducts could be utilized as raw material for multiple purposes. For example, large amounts of lignocellulosic material from food processing can be converted into ethanol [10] or biogas [11]. Food byproducts are also a potential reservoir for high value-added chemicals [12,13], including lipids, nutraceuticals, other bioactive compounds, bioplastics, etc. A recent report demonstrates that production of bulk chemicals from biomass waste is 3.5 times more profitable than converting it into biofuel [14].
Coffee is one of the world’s most popular beverages, amounting to about ten million tonnes of roasted coffee consumed annually worldwide (2018/2019). In 2015, Italy was the third-largest international green coffee importer, after the USA and Germany. Coffee is imported into Italy for roasting which, together with brewing, is the industrial process responsible for the final flavor and aroma of coffee. Different byproducts are produced along the whole coffee life cycle [15]. In the past 10 years, spent coffee grounds have received significant attention, especially as an alternative bioenergy resource [16]. Oil suitable for biodiesel production can be extracted from spent coffee grounds or these residues can be transformed into bricks and pellets which could be used in domestic wood burners and multi-fuel stoves [17]. The coffee roasting process also generates a biowaste called coffee silverskin (CSS). Coffee silverskin is a very thin, papery material accounting for about 1.5% of the total mass of unroasted coffee. In Italy, approximately 7500 tonnes of CSS are produced each year due to the large coffee roasting industry [15,16]. Currently CSS is largely unexploited and, to the best of our knowledge, no major valorization of CSS is on the market yet.
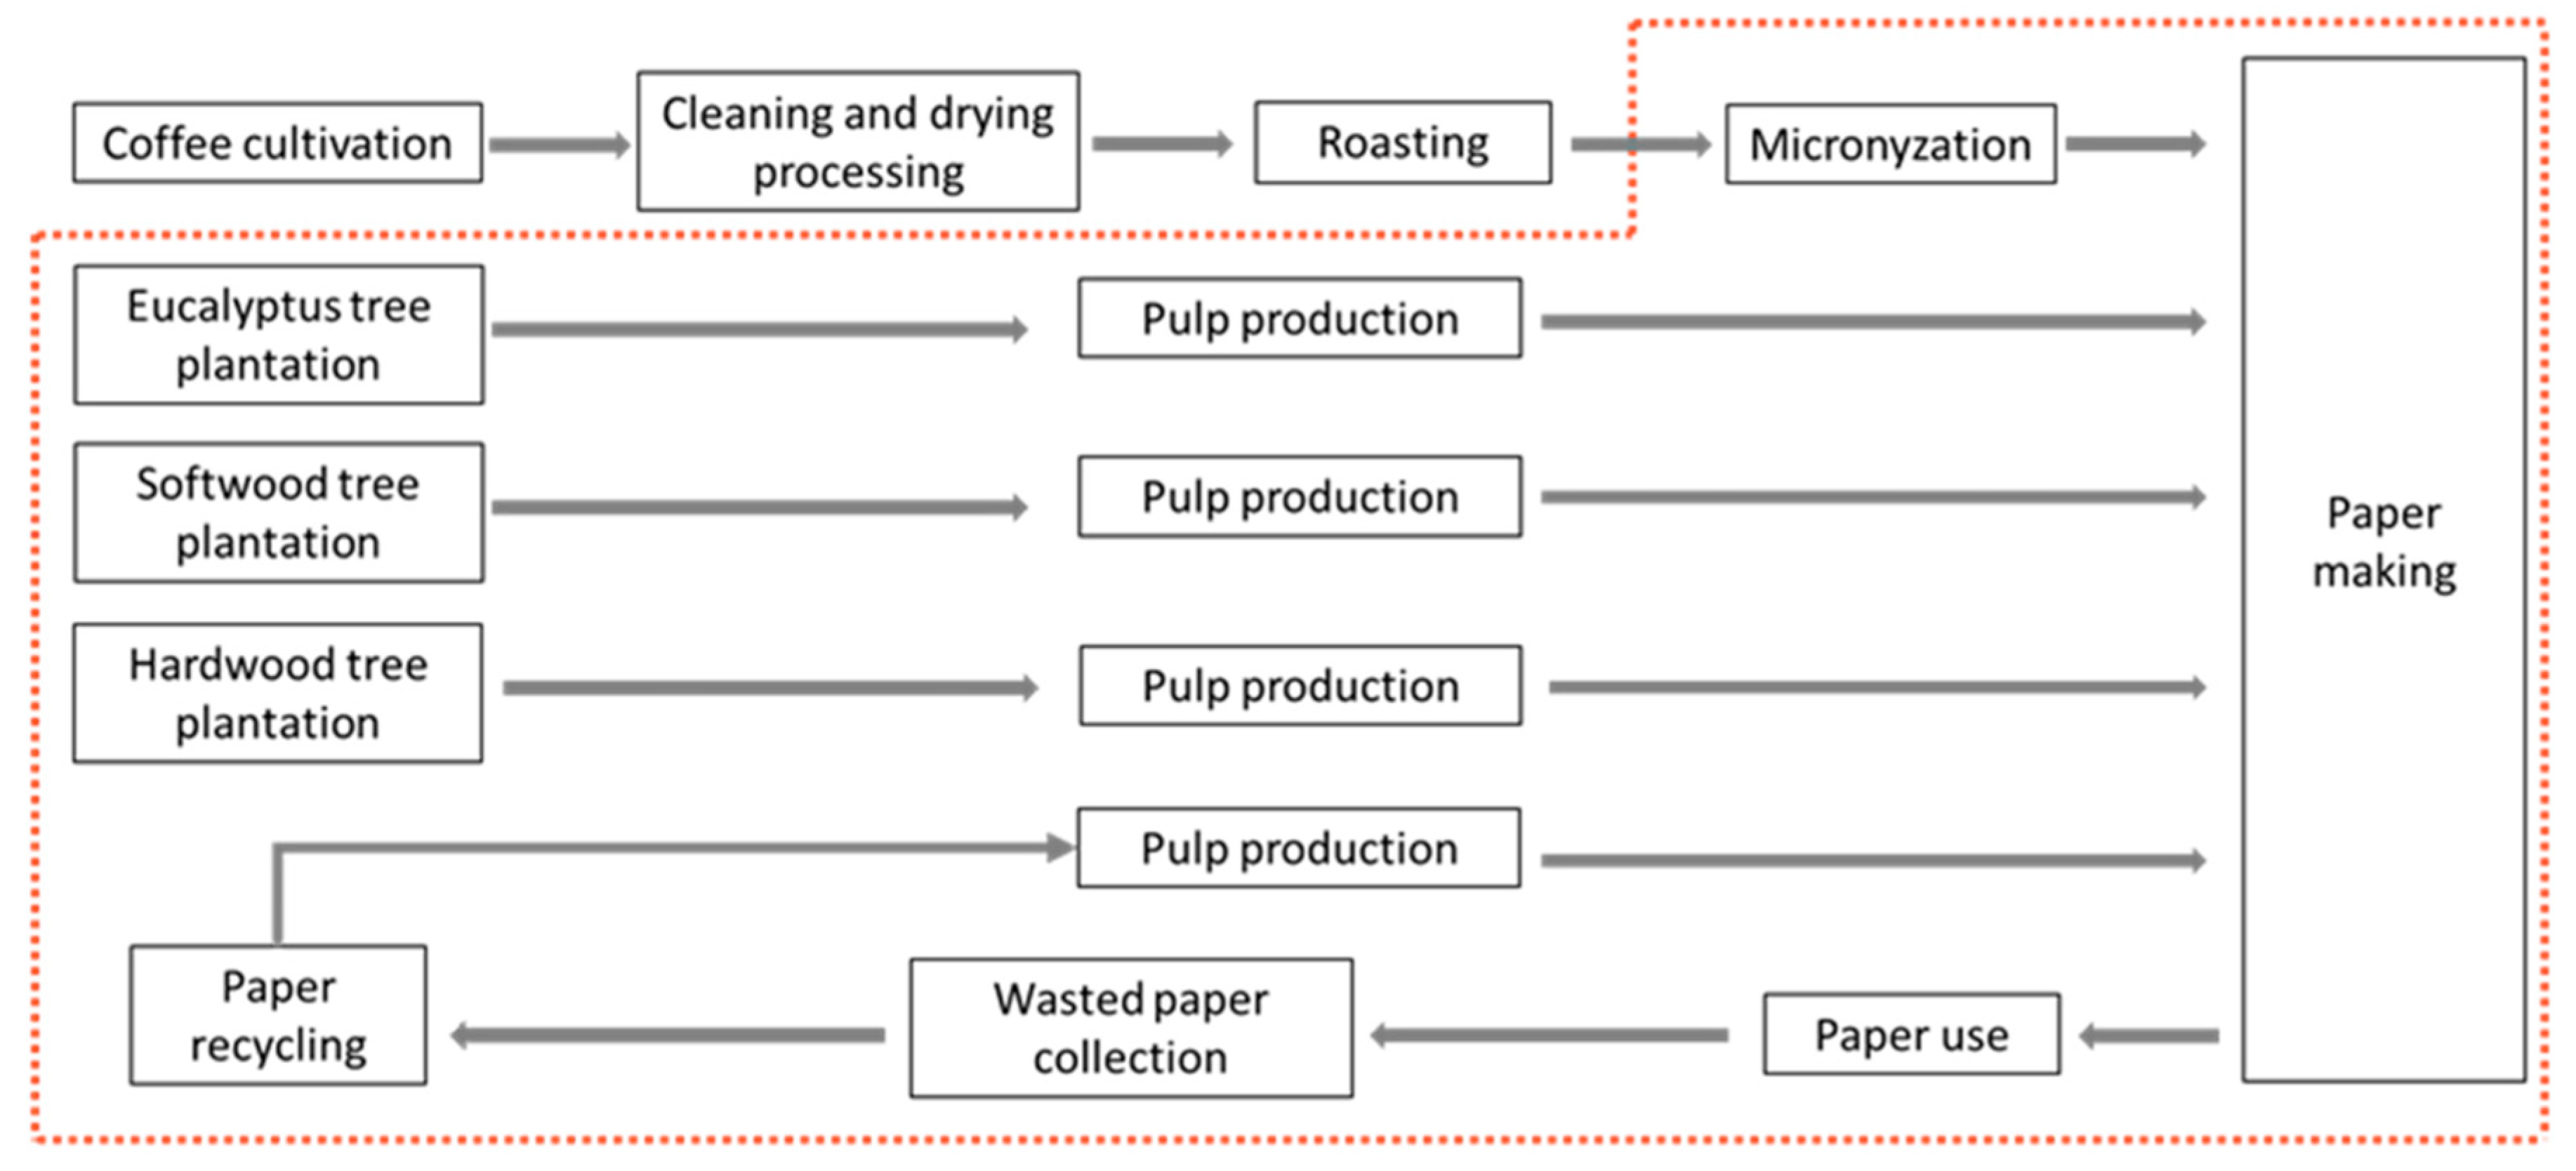
FAVINI srl [18], a company producing paper since 1736, developed a method called “CRUSH” which involves the use of byproducts and residues of agri-food transformations to produce paper. The vegetable residues (peels, shells, or pits) are dried at controlled temperature and milled to obtain a flour that is micronized and added to paper pulp. The amount of these flours can reach nearly 15% by weight, with significant savings of virgin cellulose [19].
Within the multidisciplinary project “CirCo-Multi valorization of silverskin, a residue of the coffee roasting industry” (funded by The Cariplo Foundation and Innovhub Stazioni Sperimentali per l’Industria S.r.l. [20]), the possibility to use these industrial coffee byproducts as a raw material in other industrial processes, embracing the CE concept, is examined.
Silverskin is mainly formed by cellulose together with other value-added chemicals (i.e., polyphenols, fat, and waxes) that are extremely interesting for its valorization [21]. Due to the high content in cellulose and to the significance of reducing the import of virgin cellulose in Italy, the use of CSS in paper manufacturing was envisaged [15]. Samples of graphic paper containing 15% of micronized CSS have been prepared in the framework of the CirCo project and its quality was found to be comparable with that of conventionally prepared paper.
However, besides the verification of the technical feasibility of using CSS as a raw material for paper production, it is fundamental to assess the sustainability of this new circular system since prolonging the lifetime of a material (i.e., byproduct) does not automatically confer sustainability. When modifications to the current industrial system occur due to the inclusion of byproducts, it is fundamental to verify their potential in reducing resource and energy consumption, greenhouse gas (GHG) emissions, and other environmental, economic, and social burdens along the whole life-cycle chain.
Life cycle assessment (LCA) and life cycle costing (LCC) analyses are powerful tools for considering the environmental and economic sustainability of a particular good. Life cycle assessment is an internationally standardized (ISO 14040/2006 [22]; ISO 14044/2006 [23]) methodology that allows a quantitative assessment of the environmental performance of a product, process, or system along their whole life cycle. Based on the LCA concept, the LCC method evaluates the costs occurring along the whole chain, analyzing the economic side of sustainability [7].
The goal of this study is to verify that use of CSS as a raw material for paper production decreases energy demand and environmental costs and increases economic benefits for the Italian graphic paper sector.
The results of this work provide useful insights to entrepreneurs and to policy makers, identifying environmental and economic trade-offs which could occur along the system’s life cycle. Based on the investigation performed in the CirCo activities report [24] and Boschiero & Pezzutto, 2019 [8], which are characterized by a consistent input from the CirCo project form [15], an elaborated analysis has been carried out. We explain, in detail, the context of the investigation, provide an interpretation of the main findings, and discuss its implications.
The following section, Section 2, includes the materials and methodology that supported the study. Section 3 specifies the primary outcomes in findings and figures. Section 4 critically evaluates the top results, and Section 5 indicates the conclusions with potential future implications and recommendations.

2. Materials and Methods

2.1. Life Cycle Assessment (LCA)

This study aims to evaluate the environmental performance of CSS paper production compared to conventional paper production—where the raw materials include only virgin pulp and recycled paper. The CirCo project assessed graphic paper on the national (Italian) market. As a result, national average values have been used. For instances when using these values was not possible, data from the FAVINI srl paper mill (CirCo project partner) was assumed to be representative of national averages.
It is assumed that the paper mill is located in northern Italy (Milan) according to the average national distribution of these companies as reported by ASSOCARTA, 2017 [25].
The functional unit that is considered is 1 kg of graphic paper. The LCA encompasses “cradle” to “grave” attributes.
Both conventional paper production and silverskin paper production systems were modelled. Figure 1 and Figure 2 provide a detailed scheme of these two systems.

2.1.1. Conventional Paper Production

Conventional graphic paper is principally composed of wood pulp, recycled paper pulp, chemicals, and additives. According to FAVINI srl, pulp contributes approximately 64.6% of the weight of a sheet of graphic paper. In this case, three wood pulps are used: Eucalyptus virgin pulp from Brazil, Softwood virgin pulp from Scandinavian countries (the model assumes Sweden), and Hardwood virgin pulp from Slovakia. Recycled paper pulp was assumed to have been produced within national borders. Please see Table 1:
The percentages of pulp typology for conventional graphic paper that were used in this study reflects the Italian national paper production, where softwood (58%) is utilized more than hardwood (42%) [25].
The process can be described in four key parts: Wood cultivation, pulp production, paper production, and use/recycling phase.
  • Wood production involves the processes required in the cultivation of the wood species considered in this study as well as the transportation to the pulp producer.
  • Pulp production phase involves tree cultivation processes, wood management and handling, wood transportation to the pulp-mill, and, finally, the bleached pulp production and the transportation of these materials to the paper mill.
  • Paper production phase involves the process of creating graphic paper. Paper production was assumed to take place in northern Italy (Milan), representing the Italian paper industry distribution.
  • Use/recycling phase involves the transportation to the end-user to a waste-collection point as well as the recycling process.
  • All transportation that occurs along the entire cycle has been grouped together to assess their impact.
Each stage also includes additional processes in addition to these main processes, such as raw materials production, energy production, etc.

2.1.2. Silverskin Paper Production

In the case of CSS paper production, the production of the CSS itself was also included in the system. Coffee Silverskin is a waste residue and can therefore be considered either a byproduct or a co-product when performing a LCA [26]. How it is considered influences the system boundaries and the allocation procedures. In this case study, CSS was assumed to be a byproduct and therefore no mass allocation during coffee production was performed. The system boundary starts with the transportation of CSS to the micronization facility.

2.1.3. Life Cycle Inventory (LCI)

Primary and secondary data were used.
The study retrieved most of the data for the main processes from Ecoinvent v3.0 [27], including the production of pulps, paper, alkyl ketene dimer, brighteners, potato starch, pesticide, glyphosate, coffee cultivation, eucalyptus plantation, paper recycling, etc. This data was then inserted into the GaBi database [28]. However, several background-based processes and flows that are available in Ecoinvent v3.0 are not present in the database (e.g., sulphur dioxide production, sodium sulphate production, etc.), and, as a result, were not included. When possible, proxy processes were used.
All the data on national quantities and fluxes of materials for paper making as well as all the data related to the country of origin and the main pulp and paper producers at both the national and international levels were provided by FAVINI srl and ASSOCARTA [25].
Data on the technology typology that was used to produce virgin pulp were taken from a technical report published by the Energy Technology Systems Analysis Programme [29] and by Silva et al., 2015 [30]. According to the results, the sulphate pulp (or kraft pulp) was the most frequently used technology.
Data on the production process for pulps were obtained from Ecoinvent v3.0. It was assumed that the whole wood produced was used exclusively for paper production.
Data on the materials and energy used for papermaking, as well as the origin of the material used for papermaking, are provided by FAVINI srl, as were data.
All data for the transportation processes and background processes (energy, material, chemicals production, etc.) were obtained from Ecoinvent and GaBi databases.
Data on coffee cultivation was obtained from literature [16,31,32], while the process of cultivation is provided by Ecoinvent v3.0.
Data needed to estimate the energy and materials consumptions of the roasting process was unavailable.
Only energy consumption data was available for micronization. These have been indicated by FAVINI srl.
In the following sections, the inventory of each main process is explained in detail.

2.1.3.1. Eucalyptus Plantation and Eucalyptus Pulp Production

Dataset inventories of the production of Eucalyptus plantation were obtained from two dedicated LCA studies: Silva et al., 2013 [33] and Silva et al., 2015 [30].
Data refers to 1 kg of logs oven dry with a density of 474 kg/m3. The process that was assessed in the studies included seedling cultivation, soil preparation, seedling transplanting, forest management, harvesting, and transport.
Since the majority of pulp production companies are located close to the Eucalyptus cultivation sites (mostly in São Paulo and Bahia) [34], a transport distance from the Eucalyptus plantation to the pulp mill infrastructure of 200 km carried out by truck was assumed (Euro 3, 34–40 t).
The process of Eucalyptus virgin pulp production was taken from Ecoinvent v3.0 (process name: “Sulphate pulp, from Eucalyptus, unbleached, at plant”).
Transportation of the Eucalyptus pulp from Brazil to Italy was performed by a container ship (about 10,000 km) followed by road transport for an average of 300 km by truck (Euro 3, 34–40 t).

2.1.3.2. Softwood Plantation and Softwood Pulp Production

Because Sweden is both the leading virgin pulp producer in the EU and the biggest European exporter of pulp for Italy [25], this study assumed that all the virgin pulp originated in Sweden. The softwood timber production process was obtained from the GaBi database. It is assumed that the required transportation of the harvested wood from the forest field to the pulp company is 100 km by truck (Euro 3, 34–40 t). The pulp production process was modelled according to the Ecoinvent v3.0 process “Sulphate pulp, Scandinavian wood, elemental chlorine free (ECF) bleached, at plant”.
The transportation of Swedish virgin pulp to Italy was carried out about 1000 km by ship from Stockholm to Rostock (DE), and approximately 1300 km by truck from Rostock to Milan.

2.1.3.3. Hardwood Plantation and Hardwood Pulp Production

According to FAVINI srl, hardwood fibers are critical in the production of graphic paper. The process of producing hardwood timber was obtained from the GaBi database. It was assumed that the transportation of the harvested wood from the forest field to the pulp company is around 100 km by big truck (Euro 3, 34–40 t). The process for producing pulp was modelled in accordance with the Ecoinvent v3.0 process “Sulphate pulp, Scandinavian wood, ECF bleached, at plant”.
Transportation of hardwood virgin pulp to Italy is performed by truck (from the middle of Slovakia to Milan, which is about 1000 km).

2.1.3.4. Paper Recycling and Pulp from Wasted Paper

The process of pulp production for this material was obtained from Ecoinvent v3.0 “Sulphate pulp, ECF bleached”. It was assumed that 75% of the used paper is collected. During the sorting process, 2.5% of the harvested paper could not proceed with pulping (because of metal parts, plastic parts, etc.). This data was obtained from Ecoinvent v3.0. According to the European Declaration of Paper Recycling [35], the final recycling rate is 72.5%
It is assumed that there is a system of urban/industrial collection carried out with small trucks (up to 7.5 t). The average distance is 50 km. The wasted paper from the storing urban site is then transported to a dedicated sorting and recycling site with a truck of 26–28 t for about 100 km where it is sorted and transported to the pulp industry (which we hypothesize is located in northern Italy). As reported in ASSOCARTA 2017, Italy imports only around 7% of the recycled paper, the majority of which originates in Germany (about 21%). It was decided to model only the national recycling system and to exclude imports.
Transportation of recycled-paper-pulp is carried out by truck (Euro 3, 34–40 t) for around 500 km.

2.1.3.5. Coffee Silverskin Production

It was assumed that the roasted coffee travels with a truck for approximately 375 km on average from the roasting plant to the micronization site (from Trieste to Cuneo: about 600 km, Genova-Cuneo: around 150 km; average: 375 km). Only the energy consumption was considered for the micronization process: 450 kWh per 1 t of silverskin [36].
Furthermore, the following assumptions were made in creating the LCA:
  • The micronized CSS travels for an average of about 350 km to reach the final paper-company—mean Italian distance from mills able to micronize silverskin to paper producing companies [25,37].
  • Silverskin replaces 15% of the virgin pulp used in the “conventional paper production” system [18].
  • Electricity used in this step is the average Italian mix [38].
  • To obtain 1 kg of green coffee, 2 kg of dried red berries are used [39].
  • Silverskin is 1.5% of the roasted beans [16].
  • Mass allocation between coffee and CSS is applied when CSS is considered as a co-product.

2.1.3.6. Paper Making

Data on the materials and quantities that are used to produce the graphic paper are reported in Table 2 below.
Once the paper is produced, transportation to the consumers was estimated to be approximately 200 km, carried out with a Euro 3 (26–28 t) truck. Paper use was not included in the study due to high variability that results from consumer habits. However, the required effort of the consumer for the transport to the waste-collection site was taken into consideration.

2.1.3.7. Life Cycle Impact Assessment

The 100-year time horizon global warming potential (GWP) methodology from the IPCC Fifth Assessment Report 2014 (AR5) [40] was used to calculate the global warming potential (GWP). Following the IPCC (2006) guidelines [41], biogenic carbon was not included in this study.
Results are reported in kg of CO2 eq (kg CO2 eq) per functional unit (FU).
The primary energy demand (PED) methodology was selected to evaluate the energy consumption of the systems. The data refers to the net energy demand (expressed in MJ), subdivided by renewable and non-renewable energy.
The life cycle impact assessment method ReCiPe [42] was used to calculate several other environmental impacts of the two paper types. ReCiPe provides a wide range of impacts, covering the whole environment-sphere (from atmosphere, to soil, to human toxicity).
In total we analyzed 20 mid-point impact categories (Table 3).
The impacts of land occupation and transformation were not included in the assessment.

2.2. Life Cycle Costing (LCC)

The LCC methodology is congruent with the methodology of the LCA and follows the methodology described by Swarr et al. (2011) [43] and Hunkeler et al. (2008) [44].
Even though LCC is a well-established concept, it has never been explicitly developed in a common and standardized methodology [44]. Within the given assessment, we performed a so-called environmental LCC as described by Hunkler et al. (2008), where the financial costs are assessed per each life cycle step together with the costs associated to the environmental impacts.
However, we also included the dimension of environmental impacts, monetizing the environmental impacts assessed in the LCA. We took the mean of values reported by Pizzol et al. (2015) [45] as monetization values.
The overall structure of the LCC is performed by following the indication given by Amerighi (2016) [46].

2.2.1. Goal and Scope Definition

The goal of this study is to estimate the life cycle cost for producing 1 kg of graphic paper using CSS instead of conventional wood-pulps. In addition, a comparison with conventional graphic paper will be carried out, as well.

2.2.2. Calculation of Life Cycle Costs

The calculation of life cycle costs is based on the LCI of the previous LCA. As a result, both the FU and the system boundaries are the same. The materials within the inventory were multiplied by the specific prices, including research and development (R&D) as well as labor costs.
All costs that occur before the procurement of raw materials (e.g., extraction costs, production costs, transport costs, etc.) have been included/aggregated in the price of raw material itself. These data were retrieved from the paper producing company FAVINI srl.
The cost of CSS is 0.00 € as it is given away for free. Data regarding operational costs, such as those regarding electricity and natural gas, were taken from EUROSTAT [47]. Moreover, data about the wastewater treatment cost were taken from [48].
Data are presented in Table 4 and Table 5.
Due to the lack of involvement of long-term intervals, discounting is not applied.
We also included the environmental costs that resulted from each of the two systems in the assessment. To do this, the costs that were derived from the environmental impacts assessed in the previous LCA were internalized. The mean of values reported by Pizzol et al., 2005 [45] (see Table 6) were calculated and used for further monetary calculations.
Unfortunately, the impacts that we considered within the LCA have not all been monetized. Thus, in the LCC we included only the impacts for which we found a value (i.e., global warming, ozone depletion, acidification, and human toxicity).

3. Results

3.1. LCA Results

Conventional Paper

The values of the impacts assessed for conventional paper production processes are shown in Table 7 and Figure 3.
In the majority of the impact categories, the most impactful phases are paper production and pulp production. Concerning carcinogenic human toxicity, the recycling phase is the most significant contributor, especially the incineration of wasted paper (the share that cannot be recycled). Please see Table 8:
The comparison displayed in Figure 3 shows that the conventional paper production causes a higher environmental impact for each impact category. When performing the comparison at endpoint single-score level following the ReCiPe Hierarchy method, the systems could be ordered as follows: Conventional paper (0.156 point-Pt) > CSS paper (0.142 Pt). Based on these endpoint scores, there is about 10% environmental impact reduction of the CSS paper generation methodology related to the conventional one. Please see Figure 3:
There is a 13% GHG emission reduction concerning the silverskin paper production compared to the conventional one. Main factors of influence are given by (see Figure 4) a reduction of CO2 emissions in the cultivation of wood and regarding pulp production.

3.2. LCC Results

The LCC results show that the difference between the two paper typologies is very small (−0.01% using the CSS production method). The CSS paper indicates marginally higher acquisition costs for raw material (+8%). However, less costs associated with environmental impacts are generated (about −16%). Table 9 summarizes the indications mentioned above:

4. Discussion

Comparing the results with other studies is difficult for numerous reasons. A specific system is analyzed in each study, which may sometimes allow for reasonable comparisons when assumptions are made. Furthermore, various distinct impact assessment methods are selected, and separate impact categories are analyzed, making any comparisons even more problematic.
The figure regarding GWP that was obtained in our study is in line with the figure reported in two separate carbon-footprints carried out for FAVINI srl regarding paper made with other agricultural residues. Our results for conventional paper are in line with the figures reported in Silva et al., 2015 [30].
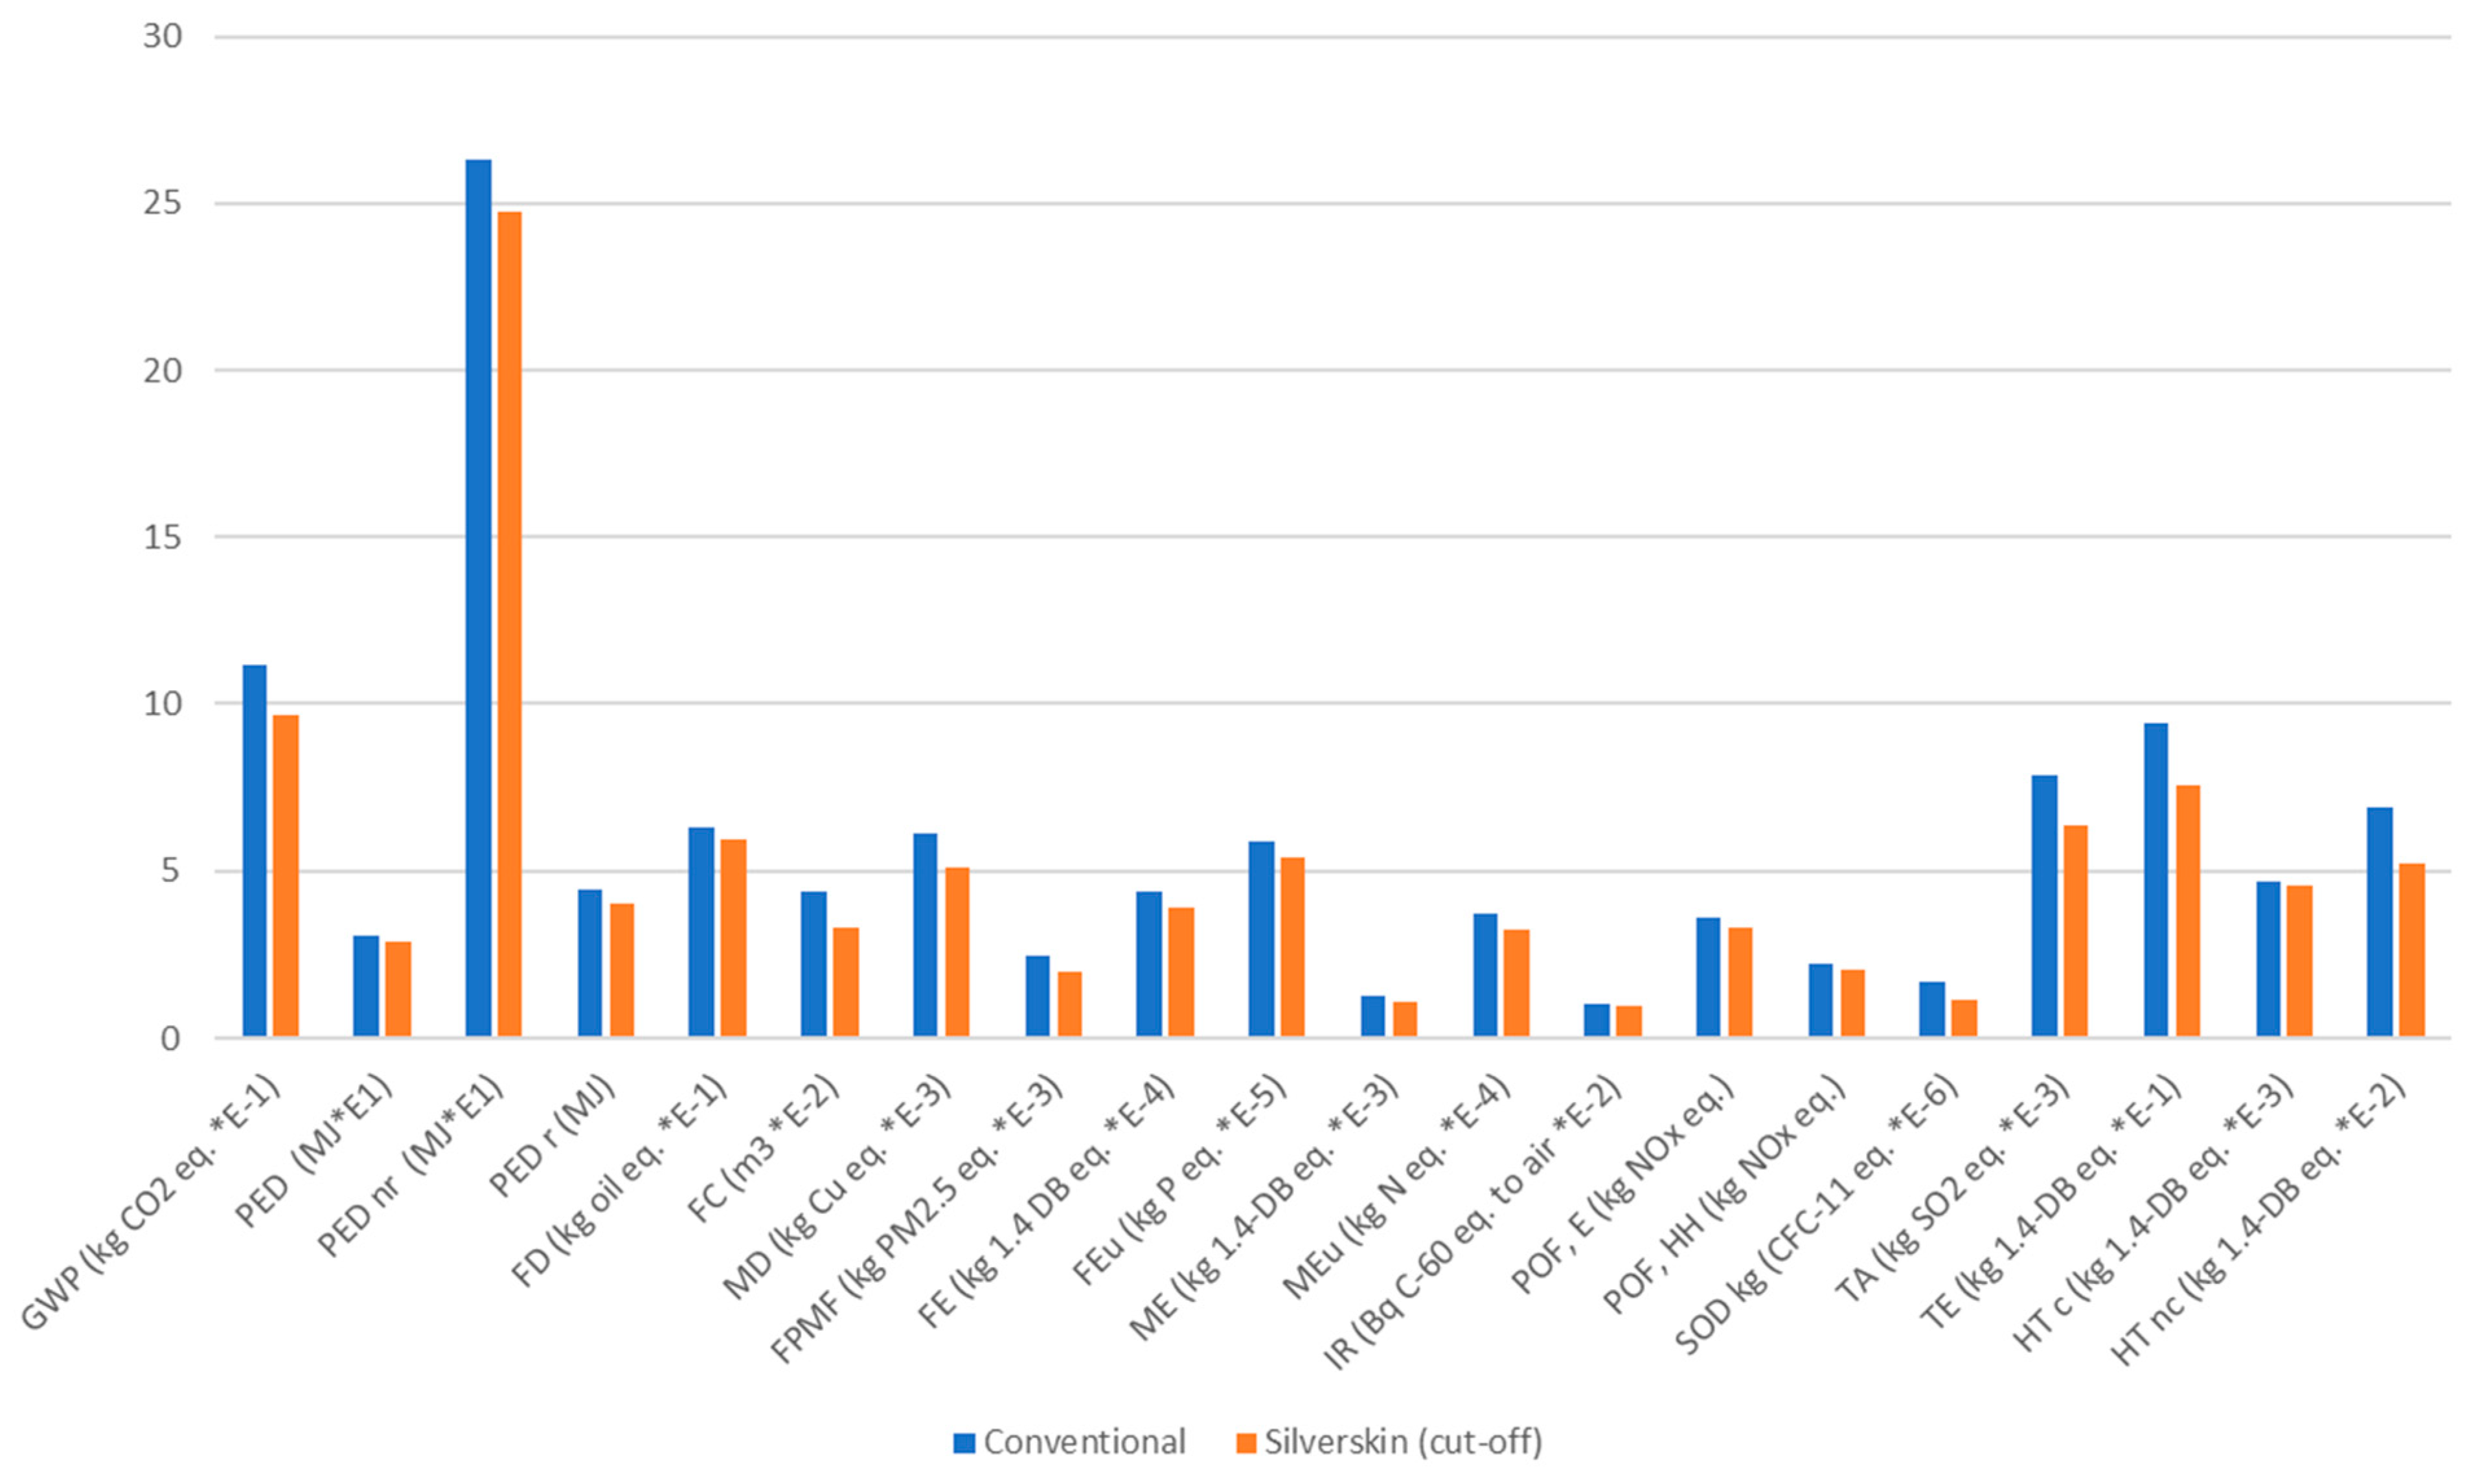
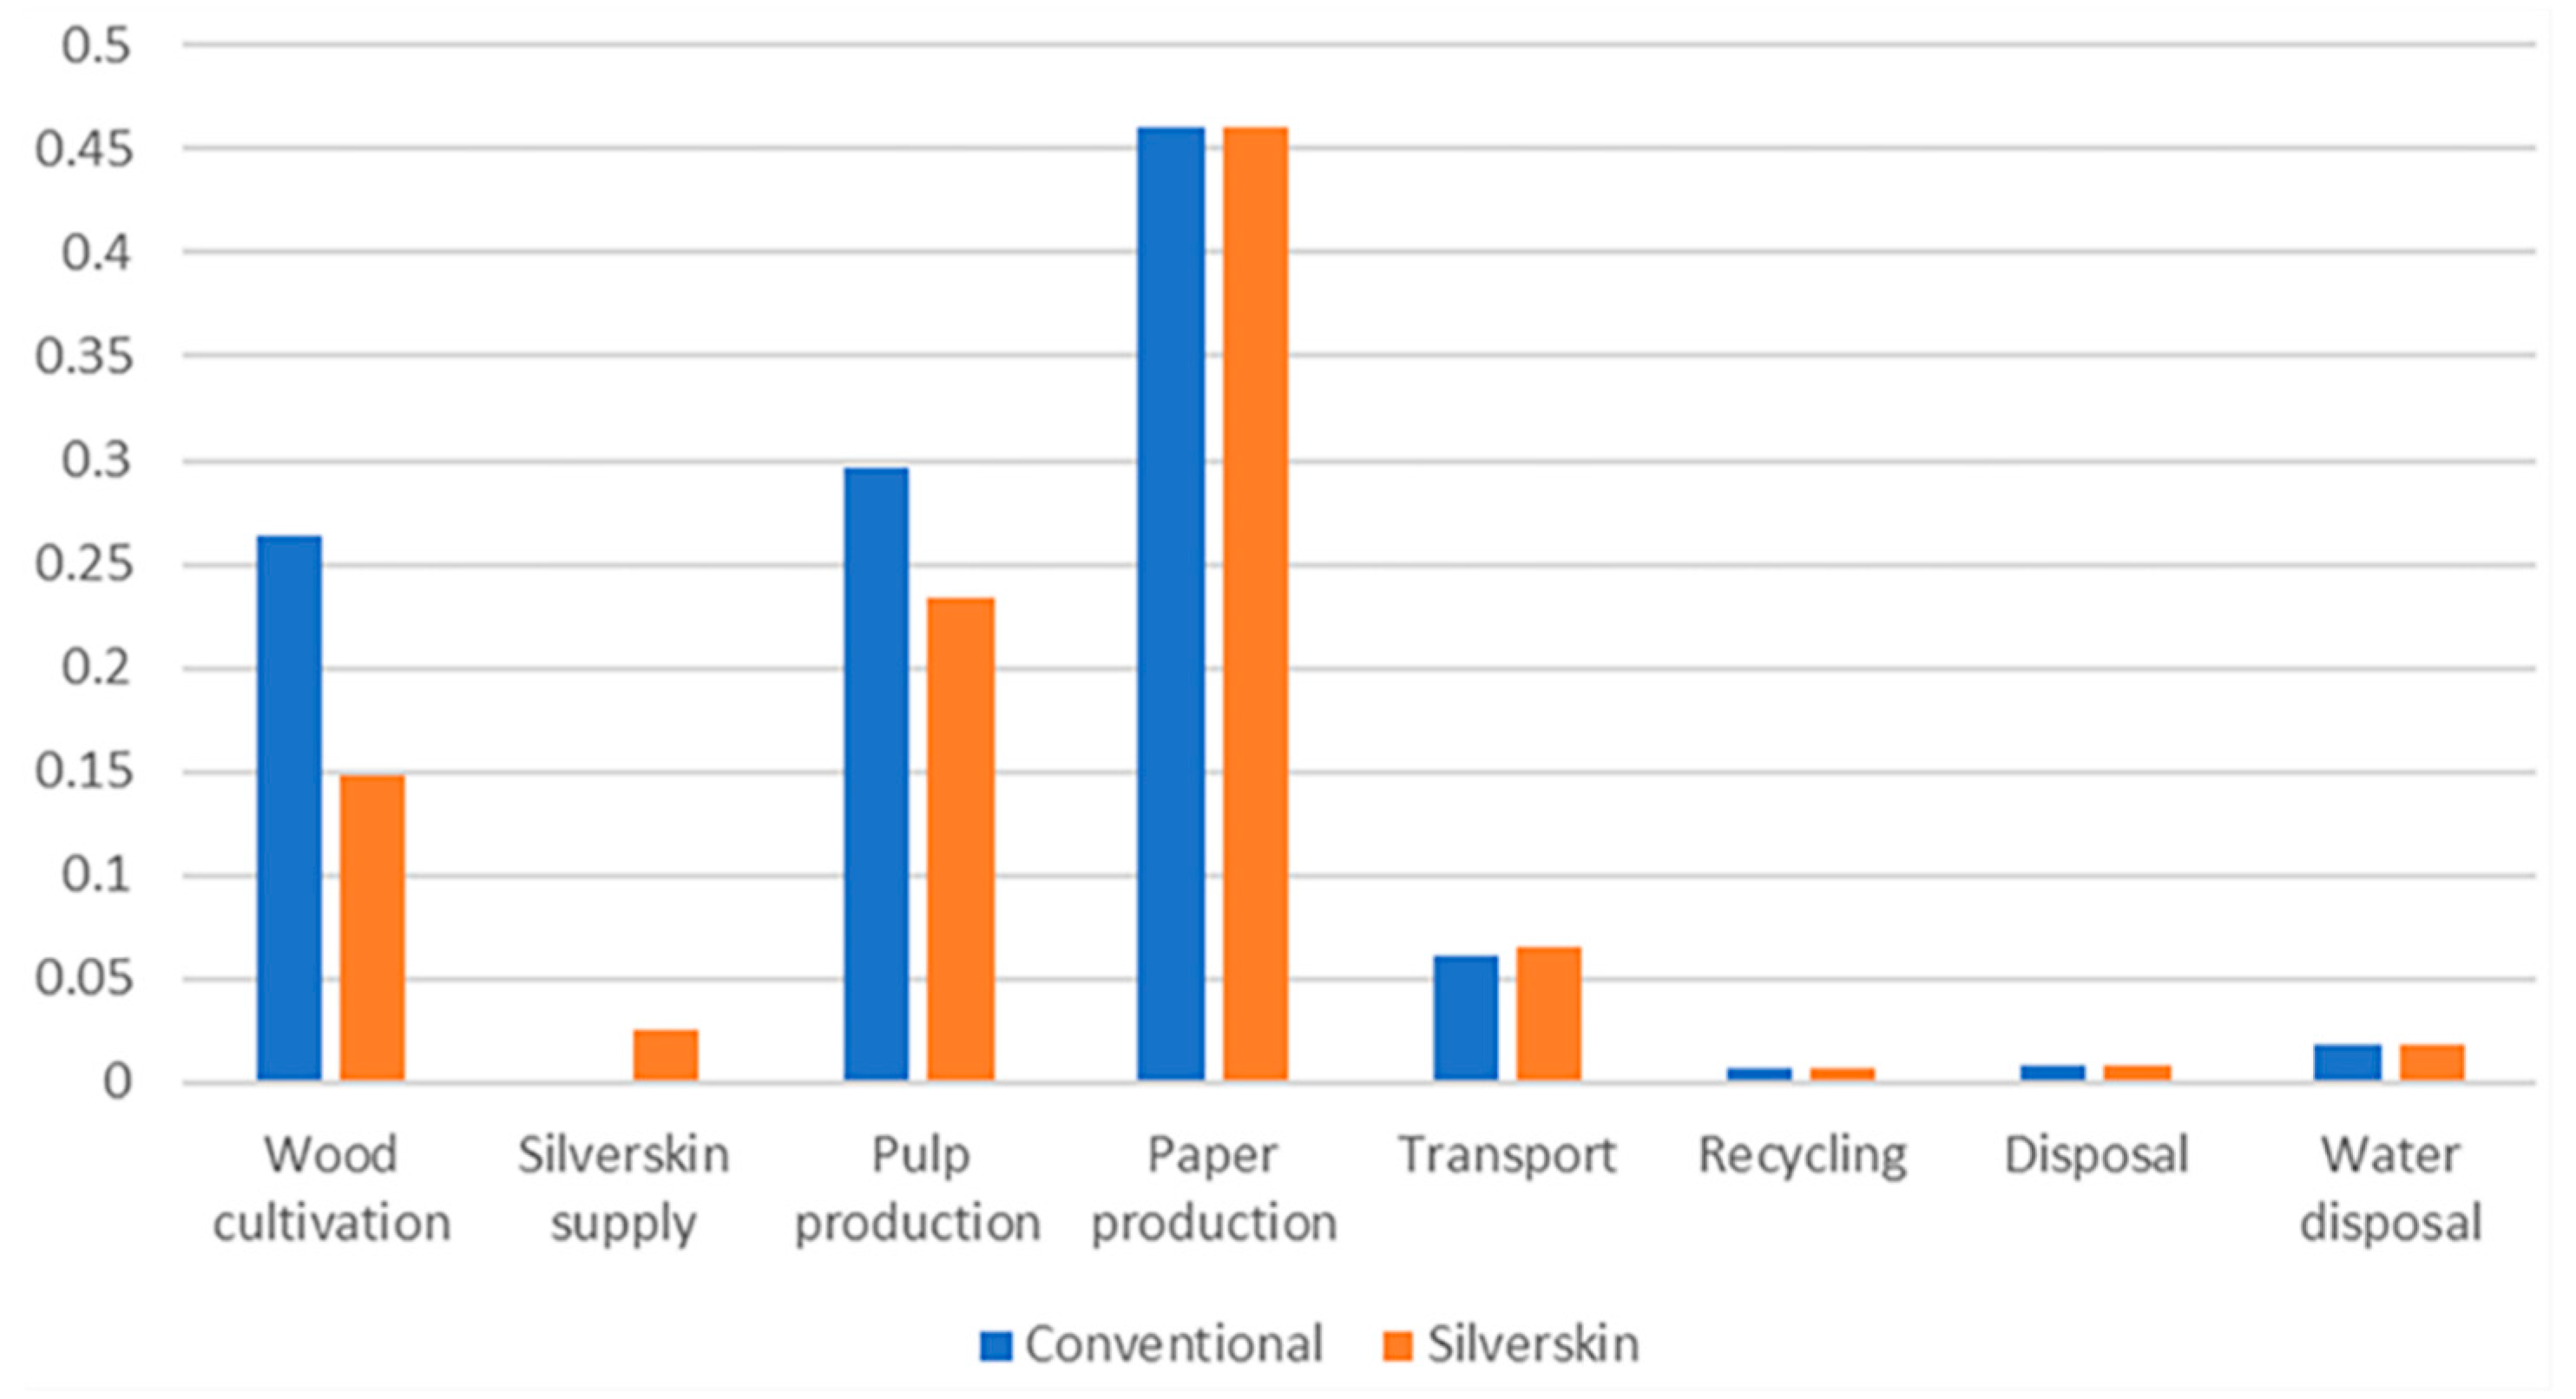
The LCA results show that there is an advantage in including coffee silverskin in paper production compared to using virgin pulp alone. There is approximately 10% environmental impact reduction through the incorporation of CSS in paper production method relative to using virgin pulp alone. Moreover, we registered a 13% reduction in GHG emissions concerning the CSS paper production method compared to the conventional method.
This result should not be taken for granted. The use of agri-food byproducts as secondary raw materials is a topic of relevant interest in the Bio-economy scenario that is strongly encouraged by the EU. However, some initiatives have turned out to be less sustainable than conventional disposal, such as landfilling, after a careful LCA analysis. This was the case with the use of spent coffee grounds to produce biodiesel in the UK according to one recent study [53].
In addition to the environmental benefits conferred by incorporating CSS into paper production, the LCC analysis indicates that the difference in cost of production is competitive and marginally lower for CSS paper versus conventional paper. The LCC results show that the divergence between the two paper production methods is quite small: we determined a 0.01% reduction using the CSS production method.
Data acquisition required a significant effort due to the unique material under study. There are data gaps in the scientific literature, especially on the topic of coffee processing and cultivation. These data, along with data regarding much of the paper production process, is only available through the private sector, making robust LCA and LCC results difficult to obtain. While the cooperation of FAVINI srl made good estimates of their processes possible, the conventional processes required many assumptions as far as transport distances: energy consumption for certain processes and sources for raw material.
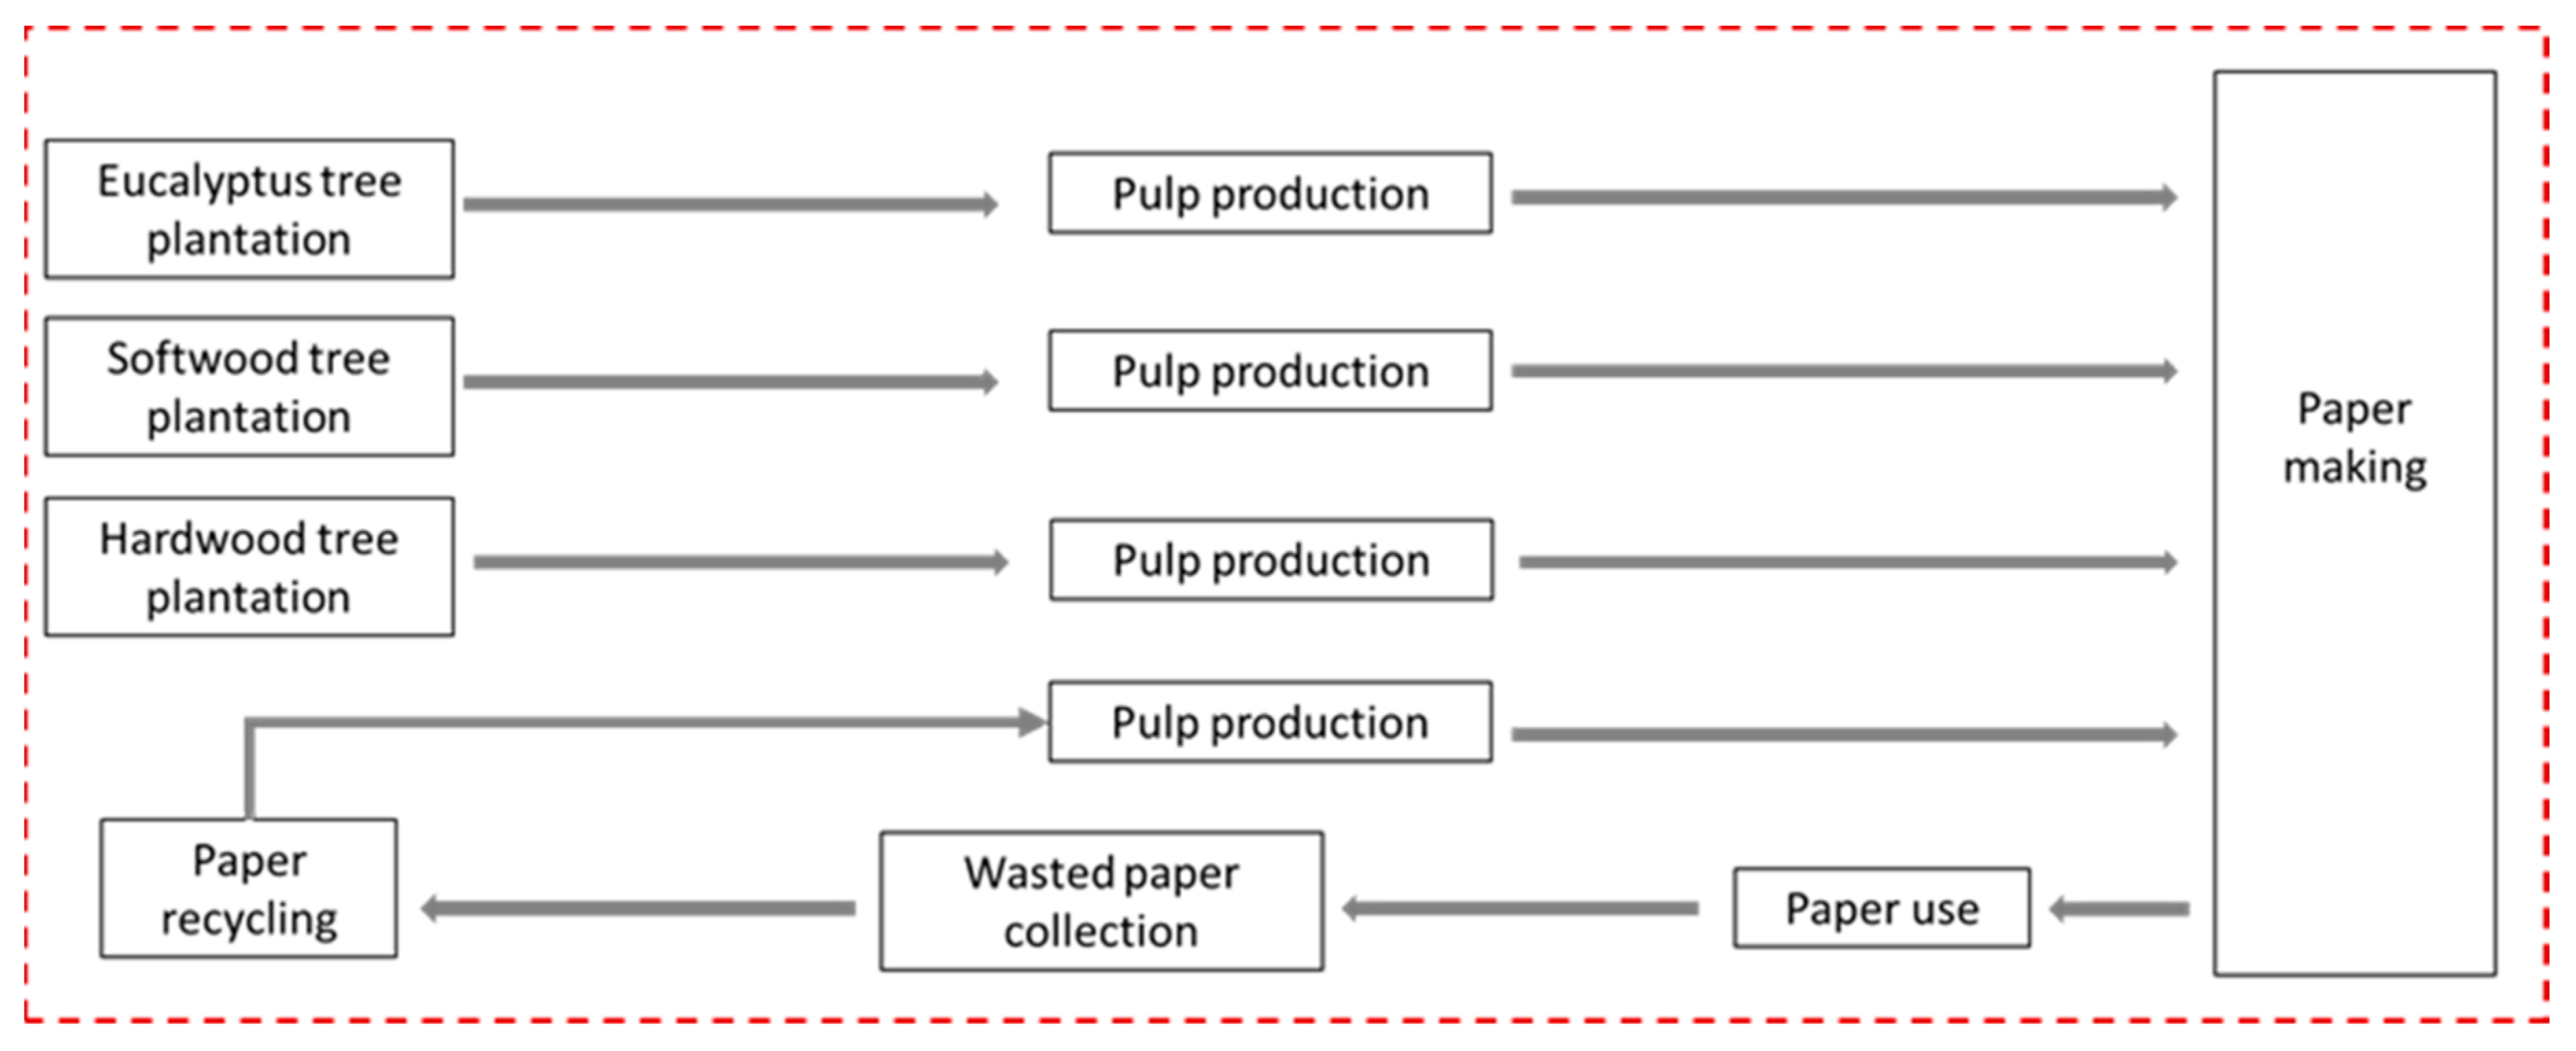
As with all LCA and LCC analyses, several assumptions were needed. One of the main considerations affecting the outcome of the model is how to consider the CSS itself. Silverskin is a residue and can thus be considered as either a waste or as a co-product when performing an LCA. If CSS is considered as a waste, then the system boundary should begin with the waste itself and a production system cut-off should be applied. Alternatively, if CSS is considered as a co-product, then the system boundary should include every necessary process required to attain that co-product (i.e., coffee cultivation, handling, transport, roasting, etc.). While both scenarios were explored, the main results presented represent the first scenario where CSS is considered as a waste product. The authors assumed this was appropriate given that the normal practice of disposal for CSS is disposal as solid waste. Of course, this leads to the entire CSS paper having a lower impact as the impacts from the coffee production itself are not considered. It should be mentioned, however, that even when CSS was considered as a co-product, the CSS paper production still outperformed conventional paper production.
Considering the main results obtained, it is worth mentioning that the customers consumer behavior might favor the CSS option due to being more attractive because of environmental impact reasons. In recent years, there has been a substantial increase in demand for “green” products and, when marketed as such, consumers might be willing to accept a higher price point for a product with a lower environmental impact. In fact, one study showed that 37% of consumers are willing to pay up to 5% more for a more environmentally friendly product [54]. Further research concerning consumers’ willingness to pay with regards to CSS paper is recommended.
Another point deserves to be mentioned. CSS has no market, at least in Italy, and this material is disposed of as a waste or given away for free to people interested in valorizing it. Following this work it could become a very attractive substitute for virgin cellulose in paper making, thus achieving a monetary value and adding profit to the roasters. Of course this is where policy and regulation play a landmark role for the implementation of the circular economy and industrial symbiosis.

5. Conclusions

To conclude the current work, the main findings are summarized as follows:
  • An about 10% environmental impact reduction can be achieved by substituting existing methods with the novel silverskin paper production method.
  • We found approximately 13% reduction in greenhouse gas emissions when comparing the silverskin paper production method to the conventional method.
  • The limited availability of data and information to carry out the given investigation required the study team to make several assumptions. Please refer to Section 2.1.3.5 (Coffee production) for more information concerning this issue.
Thus, the findings of the given case study demonstrate the feasibility in utilizing silverskin as a substitute to other raw materials to produce paper pulp at the Italian national level. These results also show the relevance of applying LCA analysis when designing circular economy and industrial symbiosis pathways.

Author Contributions

Conceptualization. M.B., S.P., N.R. and E.O.; Data curation. M.B., S.P. and A.M.; Writing. E.O., S.P., M.B. and N.R.; Supervision. S.P., N.R. and A.M.; Validation. S.P., M.B., N.R. and A.M. All authors have read and agreed to the published version of the manuscript.

Funding

This research was financed by the Cariplo Foundation and Innovhub-Stazioni Sperimentali per l’Industria S.r.l., Project 2017-0988.

Acknowledgments

The authors would like to acknowledge FAVINI srl for providing essential data and information for the performed LCA and LCC analysis.

Conflicts of Interest

The authors declare no conflict of interest.

References

  1. Final Energy Consumption. Available online: https://ec.europa.eu/eurostat/databrowser/view/t2020_34/default/table?lang=en (accessed on 29 May 2020).
  2. Rousselot, M.; Pollier, K. Energy efficiency trends in buildings. Odyssee Mure Policy Br. 2018, 4, 1–4. [Google Scholar]
  3. Energy Efficiency and Energy Consumption in the Transport Sector. Available online: https://www.eea.europa.eu/data-and-maps/indicators/energy-efficiency-and-energy-consumption/assessment-1 (accessed on 3 June 2021).
  4. Pezzutto, S.; Croce, S.; Zambotti, S.; Kranzl, L.; Novelli, A.; Zambelli, P. Assessment of the space heating and domestic hot water market in Europe—open data and results. Energies 2019, 12, 1760. [Google Scholar] [CrossRef] [Green Version]
  5. 2050 Long-Term Strategy Climate Action. Available online: https://ec.europa.eu/clima/policies/strategies/2050_en (accessed on 29 May 2020).
  6. Paris Agreement. Available online: https://ec.europa.eu/clima/policies/international/negotiations/paris_en (accessed on 29 May 2020).
  7. Circular Economy: Definition, Importance and Benefits. Available online: https://www.europarl.europa.eu/news/en/headlines/economy/20151201STO05603/circular-economy-definition-importance-and-benefits (accessed on 31 December 2020).
  8. Boschiero, M.; Pezzutto, S. Assessing sustainability of circular economy supply chains: A case study on coffee residues in Italy. In Proceedings of the SSPCR Conference, Bolzano, Italy, 9–13 December 2019. [Google Scholar]
  9. Monier, V.; Mudgal, S.; Escalon, V.; O’Connor, C.; Gibon, T.; Anderson, G.; Ogilvie, S.; Montoux, H.; Morton, G.; Reisinger, H.; et al. Preparatory Study on Food Waste Across Eu 27. 2010, pp. 40–51. Available online: https://ec.europa.eu/environment/eussd/pdf/bio_foodwaste_report.pdf (accessed on 12 August 2020).
  10. Mabee, W.E.; McFarlane, P.N.; Saddler, J.N. Biomass availability for lignocellulosic ethanol production. Biomass Bioenergy 2011, 35, 4519–4529. [Google Scholar] [CrossRef]
  11. Abraham, A.; Mathew, A.K.; Park, H.; Choi, O.; Sindhu, R.; Parameswaran, B.; Pandey, A.; Park, J.H.; Sang, B.I. Pretreatment strategies for enhanced biogas production from lignocellulosic biomass. Bioresour. Technol. 2020, 301, 122725. [Google Scholar] [CrossRef] [PubMed]
  12. Overturf, E.; Ravasio, N.; Zaccheria, F.; Tonin, C.; Patrucco, A.; Bertini, F.; Canetti, M.; Avramidou, K.; Speranza, G.; Bavaro, T.; et al. Towards a more sustainable circular bioeconomy. Innovative approaches to rice residue valorization: The RiceRes case study. Bioresour. Technol. Rep. 2020, 11, 100427. [Google Scholar] [CrossRef]
  13. Mirabella, N.; Castellani, V.; Sala, S. Current options for the valorization of food manufacturing waste: A review. J. Clean. Prod. 2014, 65, 28–41. [Google Scholar] [CrossRef] [Green Version]
  14. Tuck, C.O.; Pérez, E.; Horváth, I.T.; Sheldon, R.A.; Poliakoff, M. Valorization of biomass: Deriving more value from waste. Science 2012, 337, 695–699. [Google Scholar] [CrossRef] [PubMed]
  15. Ravasio, N.; CirCo Project Form. 2017; 1–14, unpublished.
  16. Kovalcik, M.; Obruca, S.; Marova, I. Valorization of spent coffee grounds: A review. Food Bioprod. Process. 2018, 110, 104–119. [Google Scholar] [CrossRef]
  17. The World’s Largest Recycler of Coffee Grounds. Available online: https://www.bio-bean.com/ (accessed on 1 June 2020).
  18. FAVINI. Available online: https://www.favini.com/en/ (accessed on 3 June 2021).
  19. Favini’s Upcycled Ecological Papers: Crush, Uses By-Products from the Food Industry. Available online: https://circulareconomy.europa.eu/platform/en/good-practices/favinis-upcycled-ecological-papers-crush-uses-products-food-industry (accessed on 17 June 2020).
  20. CirCo Project. Available online: http://progettocirco.it/?lang=en (accessed on 4 December 2020).
  21. Xuan, S.H.; Lee, K.S.; Jeong, H.J.; Park, Y.M.; Ha, J.H.; Park, S.N. Cosmeceutical activities of ethanol extract and its ethyl acetate fraction from coffee silverskin. Biomater. Res. 2019, 23, 2. [Google Scholar] [CrossRef] [PubMed]
  22. Environmental Management—Life Cycle Assessment—Principles and Framework (ISO 14040:2006). Available online: https://www.iso.org/standard/37456.html (accessed on 12 June 2019).
  23. Environmental Management—Life Cycle Assessment—Requirements and Guidelines (ISO 14044:2006). Available online: https://www.iso.org/standard/38498.html (accessed on 12 June 2019).
  24. Boschiero, M.; Pezzutto, S.; Report of the Activities Carried Out by the WP5 within the Project CirCo. Unpublished work. 2020.
  25. L’industria Cartaria in Cifre. Available online: http://www.assocarta.it/it/dati-di-settore/lindustria-cartaria-in-cifre.html (accessed on 2 March 2021).
  26. Boschiero, M.; Kelderer, M.; Schmitt, A.O.; Andreotti, C.; Zerbe, S. Influence of agricultural residues interpretation and allocation procedures on the environmental performance of bioelectricity production—A case study on woodchips from apple orchards. Appl. Energy 2015, 147, 235–245. [Google Scholar] [CrossRef]
  27. Ecoinvent (Version 3). 2014. Available online: https://www.ecoinvent.org/database/older-versions/ecoinvent-30/ecoinvent-30.html (accessed on 2 March 2020).
  28. PE International GaBi Databases. Available online: http://www.gabi-software.com/databases/gabi-databases/ (accessed on 9 March 2020).
  29. Energy Technology Network—Energy Technology Systems Analysis Programme. Available online: https://iea-etsap.org/E-TechDS/HIGHLIGHTS%20PDF/I07_Pulp&Paper%20May2015_%201st%20page.pdf (accessed on 10 May 2020).
  30. Silva, D.A.L.; Raymundo Pavan, A.L.; Augusto De Oliveira, J.; Ometto, A.R. Life cycle assessment of offset paper production in Brazil: Hotspots and cleaner production alternatives. J. Clean. Prod. 2015, 93, 222–233. [Google Scholar] [CrossRef]
  31. Comitato Italiano del Caffé. Importazioni Italiane di Caffé Verde Periodo Gennaio/Dicembre—Anni 2012/2017. 2017. Available online: http://www.umamiarea.com/public/d6ac2c6d-cce9-4426-917f-ffec52b51c15.pdf (accessed on 12 August 2021).
  32. Bartl, M. Carbon Footprint of the Coffee Roasting Process Based on Two Technologies with Different Sources of Energy in Peru. Eur. J. Sustain. Dev. 2018, 7, 90–98. [Google Scholar] [CrossRef] [Green Version]
  33. Silva, D.A.L.; Lahr, F.A.R.; Garcia, R.P.; Freire, F.M.C.S.; Ometto, A.R. Life cycle assessment of medium density particleboard (MDP) produced in Brazil. Int. J. Life Cycle Assess. 2013, 18, 1404–1411. [Google Scholar] [CrossRef]
  34. Yhdistys, S.P.; Keskusliitto, S.P. Paper and Timber; Suomen Paperi- ja Puutavaralehi Oy: Helsinki, Finland, 2005. [Google Scholar]
  35. European Declaration on Paper Recycling 2011–2015. Available online: https://www.paperforrecycling.eu/?page_id=11&sf_paged=2 (accessed on 10 March 2020).
  36. Meng, L.; Zhang, C.; Ren, Y.; Luo, M.; Tian, G. Study on the power consumption of different milling modes and number of inserts in face milling processes. In Proceedings of the 2017 13th IEEE Conference on Automation Science and Engineering (CASE), Xi’an, China, 20–23 August 2017; pp. 1475–1480. [Google Scholar]
  37. Google Maps—Italy. Available online: https://www.google.com/maps/place/Italy/ (accessed on 12 August 2021).
  38. Italy—Countries & Regions—IEA. Available online: https://www.iea.org/countries/italy (accessed on 2 March 2021).
  39. World Coffee Trade—Conversions and Statistics. Available online: http://www.thecoffeeguide.org/coffee-guide/world-coffee-trade/conversions-and-statistics/ (accessed on 12 January 2021).
  40. Jarraud, M.; Steiner, A. AR5 Synthesis Report—Climate Change 2014—IPCC; IPCC: Geneve, Switzerland, 2014; Volume 9781107025. [Google Scholar]
  41. 2006 IPCC Guidelines for National Greenhouse Gas Inventories (Miscellaneous). Available online: https://www.osti.gov/etdeweb/biblio/20880391 (accessed on 9 March 2021).
  42. LCIA: The ReCiPe Model—RIVM. Available online: https://www.rivm.nl/en/life-cycle-assessment-lca/recipe (accessed on 9 March 2021).
  43. Swarr, T.E.; Hunkeler, D.; Klöpffer, W.; Pesonen, H.L.; Ciroth, A.; Brent, A.C.; Pagan, R. Environmental life-cycle costing: A code of practice. Int. J. Life Cycle Assess. 2011, 16, 389–391. [Google Scholar] [CrossRef]
  44. Hunkeler, D.; Lichtenvort, K.; Rebitzer, G. Introduction: History of Life Cycle Costing, Its Categorization, and Its Basic Framework. In Environmental Life Cycle Costing; CRC Press: Boca Raton, FL, USA, 2008; pp. 1–16. [Google Scholar] [CrossRef]
  45. Pizzol, M.; Weidema, B.; Brandão, M.; Osset, P. Monetary valuation in Life Cycle Assessment: A review. J. Clean. Prod. 2015, 86, 170–179. [Google Scholar] [CrossRef]
  46. Amerighi, O.; Notarnicola, B.; Raggi, A.; Tarquinio, L.; Thiébat, F.; Zamagni, A. Corso di life cycle costing 2016. Available online: http://www.reteitalianalca.it/documenti/brochure-lcc-2016 (accessed on 12 August 2021).
  47. Statistics Explained. Available online: https://ec.europa.eu/eurostat/statistics-explained/index.php?title=Main_Page (accessed on 31 March 2021).
  48. European Association of Public Water Operators. Water affordability in Italy. 2016. Available online: https://www.aquapublica.eu/sites/default/files/event/file/2017-11/federico_feltri.pdf (accessed on 12 August 2021).
  49. Statistiche Sul Prezzo Dell’energia Elettrica. Available online: https://ec.europa.eu/eurostat/statistics-explained/index.php?title=Archive:Statistiche_sul_prezzo_dell%27energia_elettrica (accessed on 31 May 2021).
  50. Statistiche Sul Prezzo Del Gas Naturale. Available online: https://ec.europa.eu/eurostat/statistics-explained/index.php?title=Archive:Statistiche_sul_prezzo_del_gas_naturale (accessed on 31 May 2021).
  51. Evaluation of Costs and Benefits for the Achievement of Reuse and Recycling Targets for the Different Packaging Materials in the Frame of the Packaging and Packaging Waste Directive 94/62/EC. 2003. Available online: https://ec.europa.eu/environment/pdf/waste/studies/packaging/costsbenefits.pdf (accessed on 29 May 2020).
  52. Energy and Mining Analysis and Statistics—Ministry of Ecological Transition. Available online: https://dgsaie.mise.gov.it/prezzi_carburanti_mensili.php?pid=2 (accessed on 31 May 2021).
  53. Schmidt Rivera, X.C.; Gallego-Schmid, A.; Najdanovic-Visak, V.; Azapagic, A. Life cycle environmental sustainability of valorisation routes for spent coffee grounds: From waste to resources. Resour. Conserv. Recycl. 2020, 157, 104751. [Google Scholar] [CrossRef]
  54. 2019 Sustainability Report. Available online: http://go.toluna-group.com/l/36212/2019-10-30/5p7ppd (accessed on 12 August 2021).
Figure 1. Scheme of conventional paper production system. The system boundary is represented by the dashed line and transport phases are represented by grey arrows.
Sustainability 13 09069 g001
Figure 2. Scheme of the paper production system using coffee silverskin as raw material. The system boundary for silverskin as a byproduct of coffee roasting is represented by the dotted line and transport phases are represented by the grey arrows.
Sustainability 13 09069 g002
Figure 3. Comparison of the environmental impacts of the two investigated productions of paper—conventional (in blue) and with the addition of silverskin (in orange). Please note that the abbreviations present in this figure, are explained within Table 3 above.
Sustainability 13 09069 g003
Figure 4. Comparison of the greenhouse gas emissions of the two investigated productions of paper—conventional at one hand (in blue) and with silverskin at other hand (in orange).
Sustainability 13 09069 g004
Table 1. Pulp composition for conventional and silverskin papers.
Pulp TypologyOrigin CountryConventional PaperSilverskin Paper
HardwoodSlovakia10.2%8.11%
EucalyptusBrazil11.86%8.11%
SoftwoodSweden10.2%9.46%
Recycled-paper pulp (Italy)Italy67.74%54.05%
SilverskinItaly-20.27%
Total 100%100%
Table 2. Data on materials used to produce the graphic paper. Data are given per functional unit.
INPUT MaterialsUnitAmount
Pulp mixkg0.646
Limestonekg0.202
Alkyl ketene dimers sizerkg0.004
Potato starchkg0.040
Brightenerskg0.001
Waterl23.000
Chemicalskg0.037
ElectricityMJ1.477
Natural gasMJ13.386
Table 3. Mid-point impact categories assessed.
Environmental Impact NameAcronymUnit
Global Warming PotentialGWPkg CO2 eq.
Primary energy demandPEDMJ
PED non renewablesPED nrMJ
PED renewablePED rMJ
Fine Particulate Matter FormationFPMFkg PM2.5eq.
Fossil depletionFDkg oil eq.
Freshwater ConsumptionFCm3
Freshwater ecotoxicityFEkg 1.4 DB eq.
Freshwater EutrophicationFEukg P eq.
Human toxicity, cancerHT ckg 1.4-DB eq.
Human toxicity, non-cancerHT nckg 1.4-DB eq.
Ionizing RadiationIRBq C-60 eq. to air
Marine ecotoxicityMEkg 1.4-DB eq.
Marine EutrophicationMEukg N eq.
Metal depletionMDkg Cu eq.
Photochemical Ozone Formation, EcosystemsPOF, Ekg NOx eq.
Photochemical Ozone Formation, Human HealthPOF, HHkg NOx eq.
Stratospheric Ozone DepletionSODkg CFC-11 eq.
Terrestrial AcidificationTAkg SO2 eq.
Terrestrial ecotoxicityTEkg 1.4-DB eq.
Table 4. Costs associated with conventional paper production life cycle.
PhaseCost’s VoiceQuantityUnitUnit CostUnitCosts (€)Sources
Research and Development
Work (researcher/engineer)0.5hour40€/hour20FAVINI srl
Subtotal 20
Raw material acquisition
Chemicals, inorganic0.0372kg0.20 €€/kg0.007 €FAVINI srl
Silica flour0.001kg0.75 €€/kg0.001 €FAVINI srl
Limestone0.202kg0.06 €€/kg0.012 €FAVINI srl
AKD sizer0.00434kg0.60 €€/kg0.003 €FAVINI srl
Waste-paper pulp (Italy)0.349206kg0.65 €€/kg0.227 €FAVINI srl
Eucalyptus pulp (Brazil)0.09599kg0.63 €€/kg0.060 €FAVINI srl
Softwood pulp (Sweden)0.104775kg0.76 €€/kg0.080 €[24]
Hard-wood pulp (Slovakia)0.09599kg0.60 €€/kg0.058 €FAVINI srl
Potato starch0.0397kg0.42 €€/kg0.017 €FAVINI srl
Pigment0.0008kg2.50 €€/kg0.002 €FAVINI srl
Subtotal 0.466 €
Production
Electricity0.4104kWh0.1449€/kWh0.059 €[49]
Natural gas, consumer price, Italy3.72kWh0.0253€/kWh0.094 €[50]
Water23kg1.73€/mc = t0.040 €[48]
Work1hour25€/hour25
Subtotal 25.193 €
Depreciation and taxes
Wastewater treatment21.597kg4€/kg86.388 €[24]
Subtotal 86.388 €
Use
Subtotal 0
Recycling
Collection1kg41.2€/t0.041 €[24]
Sorting0.725kg35€/t0.025 €[51]
Transport to re-processor0.707kg22.9€/t0.016 €[51]
Revenue for baled paper0.349206kg−21.6€/t−0.008 €[51]
Subtotal 0.075 €
Table 5. Costs associated with Silverskin paper production life cycle.
PhaseCost’s VoiceQuantityUnitUnit CostUnitCosts (€)Sources
Research and Development
Work (researcher/ engineer)0.8hour40€/hour32FAVINI srl
Subtotal 32
Raw material acquisition
Chemicals, inorganic0.0372kg0.20 €€/kg0.007 €FAVINI srl
Silica flour0.001kg0.75 €€/kg0.001 €FAVINI srl
Limestone0.202kg0.06 €€/kg0.012 €FAVINI srl
AKD sizer0.00434kg0.60 €€/kg0.003 €FAVINI srl
Wastepaper pulp (Italy)0.349141kg0.65 €€/kg0.227 €FAVINI srl
Eucalyptus pulp (Brazil)0.052387kg0.63 €€/kg0.033 €FAVINI srl
Softwood pulp (Sweden)0.061108kg0.76 €€/kg0.046 €Index Mundi
Hardwood pulp (Slovakia)0.052387kg0.60 €€/kg0.031 €FAVINI srl
Silverskin0.130936kg0.00 €€/kg0.000 €
Potato starch0.0397kg0.42 €€/kg0.017 €FAVINI srl
Pigment0.0008kg2.50 €€/kg0.002 €FAVINI srl
Subtotal 0.380 €
Production
Electricity0.4104kWh0.1449€/kWh0.059 €[49]
Natural gas, consumer price, Italy3.72kWh0.0253€/kWh0.094 €[50]
Water23kg1.73€/mc = t0.040 €[48]
Work1hour25€/hour25
Subtotal 25.193 €
Depreciation and taxes
Wastewater treatment21.597kg4€/kg86.388 €[24]
Subtotal 86.388 €
Silverskin supply
Micronization0.130936kg800€/t0.10 €FAVINI srl
Transport diesel consumption0.002304kg1.488.03€/t0.0034 €[52] (average 2018)
Subtotal 0.11 €
Use
Subtotal 0
RecyclingCollection1kg41.2€/t0.041 €[51]
Sorting0.725kg35€/t0.025 €[51]
Transport to re-processor0.707kg22.9€/t0.016 €[51]
Revenue for baled paper0.349206kg−21.6€/t−0.008 €[51]
Subtotal 0.075 €
Table 6. Monetary values [45].
Monetary Values of Environmental Impacts€/unit
Max.Min.Mean
Global warming [kgCO2eq]0.230.050.108
Ozone depletion [kgCFC11eq]139.563089.853
Acidification [kgSO2eq]6.40.153.226
Eutrophication [kgPO4eq]25.351.28.384
Photochemical oxidation [kgC2H4eq]55.820.5615.606
Abiotic Resources [MJ]0.020.000470.008
Human-toxicity [kg1.4DBeq]1.40.001540.524
Table 7. Impacts of the conventional paper production expressed per functional unit, divided by main processes.
Environmental ImpactsSystem’s Phases
Wood CultivationPulp ProductionPaper ProductionTransportRecyclingTotal
GWP [kg CO2 eq.]3.46 × 10⁻¹ 2.92 × 10⁻¹ 4.58 × 10⁻¹ 5.28 × 10⁻² 1.67 × 10⁻² 1.17 × 10
PED [MJ]5.28 × 10 4.38 × 102.12 × 10+1 7.31 × 10⁻¹ 2.89 × 10⁻¹ 3.19 × 10+1
PED nr [MJ]3.33 × 10 3.72 × 101.88 × 10+1 7.01 × 10⁻¹ 2.32 × 10⁻¹ 2.68 × 10⁻¹
PED r [MJ]1.94 × 10 6.59 × 10⁻¹ 2.38 × 102.96 × 10−2 5.73 × 10⁻² 5.07 × 10
FPMF [kg PM2.5 eq.]5.29 × 10⁻⁴ 1.58 × 10⁻³ 2.53 × 10⁻⁴ 1.49 × 10⁻⁴ 2.55 × 10⁻⁵ 2.54 × 10⁻³
FD [kg oil eq.]7.87 × 10⁻² 8.70 × 10⁻² 4.53 × 10⁻¹ 1.64 × 10⁻² 5.43 × 10⁻³ 6.41 × 10⁻¹
FC [m3]1.29 × 10⁻³ 4.97 × 10⁻² 2.57 × 10⁻² 5.45 × 10⁻⁵ 1.20 × 10⁻³ 7.79 × 10⁻¹
FE [kg 1.4 DB eq.]1.10 × 10⁻⁴ 6.63 × 10⁻⁵ 6.47 × 10⁻⁵ 9.8 × 10⁻⁶ 1.76 × 10⁻⁶ 2.53 × 10⁻⁴
FEu [kg P eq.]7.20 × 10⁻⁶ 1.68 × 10⁻⁵ 1.18 × 10⁻⁵ 1.94 × 10⁻⁷ 4.24 × 10⁻⁸ 3.61 × 10⁻⁵
HT. c [kg 1.4-DB eq.]2.32 × 10⁻⁴ 2.47 × 10⁻⁴ 3.09 × 10⁻⁴ 1.40 × 10⁻⁵ 2.85 × 10⁻³ 3.65 × 10⁻³
HT. nc [kg 1.4-DB eq.]4.06 × 10⁻² 2.65 × 10⁻² −4.53 × 10⁻⁴ 4.6 × 10⁻³ 3.44 × 10⁻⁴ 7.17 × 10⁻²
IR [Bq C-60 eq. to air]3.9 × 10⁻⁴ 3.63 × 10⁻³ 5.43 × 10⁻³ 3.02 × 10⁻⁵ 2.64 × 10⁻⁴ 9.75 × 10⁻³
ME [kg 1.4-DB eq.]2.97 × 10⁻⁴ 5.62 × 10⁻⁴ 1.47 × 10⁻⁴ 2.82 × 10⁻⁵ 7.89 × 10⁻⁶ 1.04 × 10⁻³
MEu [kg N eq.]5.99 × 10⁻⁵ 1.53 × 10⁻⁴ 1.39 × 10⁻⁴ 1.04 × 10⁻⁶ 3.70 × 10⁻⁷ 3.53 × 10⁻⁴
MD [kg Cu eq.]1.39 × 10⁻³ 3.18 × 10⁻³ 4.93 × 10⁻³ 2.37 × 10⁻⁵ 5.78 × 10⁻¹ 1.01 × 10⁻²
POF. E [kg NOx eq.]3.12 × 10⁻¹ 1.28 × 101.18 × 104.27 × 10−3 7.44 × 10⁻¹ 3.52 × 10
POF. HH [kg NOx eq.]1.94 × 10⁻¹ 7.92 × 10⁻¹ 7.32 × 10⁻¹ 2.92 × 10⁻³ 4.62 × 10⁻¹ 2.18 × 10
SOD [kg CFC-11 eq.]1.42 × 10⁻⁶ 1.22 × 10⁻⁷ 5.55 × 10⁻⁷ 1.33 × 10⁻⁸ 5.32 × 10⁻⁹ 2.11 × 10⁻⁶
TA [kg SO2 eq.]1.46 × 10⁻³ 5.32 × 10⁻³ 7.88 × 10⁻⁴ 4.57 × 10⁻⁴ 8.46 × 10⁻⁵ 8.10 × 10⁻³
TE [kg 1.4-DB eq.]1.92 × 10⁻¹ 6.99 × 10⁻¹ 8.94 × 10⁻² 2.16 × 10⁻³ 6.82 × 10⁻³ 9.89 × 10⁻¹
Table 8. Impacts of silverskin paper production expressed per functional unit, divided by main processes.
Environmental ImpactsSystem’s Phases
Wood CultivationSilver-Skin SupplyPulp ProductionPaper ProductionTransportRecyclingTotal
GWP [kg CO2 eq.]2.95 × 10⁻¹ 2.49 × 10−22.34 × 10−14.58 × 10−16.50 × 10−21.67 × 10−21.09 × 10
PED [MJ]4.67 × 106.33 × 10−13.47 × 102.12 × 10+19.15 × 10−12.89 × 10−13.12 × 10+1
PED nr [MJ]2.88 × 103.55 × 10−12.95 × 101.88 × 10+18.74 × 10−12.32 × 10−12.61 × 10+1
PED r [MJ]1.79 × 102.78 × 10−15.19 × 10−12.38 × 104.07 × 10−25.73 × 10−25.07 × 10
FPMF [kg PM2.5 eq.]4.48 × 10−41.00 × 10−51.28 × 10−32.53 × 10−41.46 × 10−42.55 × 10−52.16 × 10⁻³
FD [kg oil eq.]6.80 × 10−28.31 × 10−36.91 × 10−24.53 × 10−12.05 × 10−25.43 × 10−36.25 × 10⁻¹
FC [m3]1.11 × 10−32.93 × 10−43.95 × 10−22.57 × 10−27.50 × 10−51.20 × 10−36.79 × 10⁻²
FE [kg 1.4 DB eq.]9.80 × 10−51.86 × 10−65.28 × 10−56.47 × 10−51.24 × 10−51.76 × 10−62.32 × 10⁻⁴
FEu [kg P eq.]5.12 × 10−61.40 × 10−71.34 × 10−51.18 × 10−52.67 × 10−74.24 × 10−83.08 × 10⁻⁵
HT. c [kg 1.4-DB eq.]2.05 × 10−46.06 × 10−61.97 × 10−43.09 × 10−41.76 × 10−52.85 × 10−33.58 × 10⁻³
HT. nc [kg 1.4-DB eq.]3.63 × 10⁻²−8.61 × 10−42.13 × 10−2−4.53 × 10−46.00 × 10−33.44 × 10−46.27 × 10−2
IR [Bq C-60 eq. to air]3.45 × 10−44.96 × 10−42.80 × 10−35.43 × 10−33.92 × 10−52.64 × 10−49.38 × 10⁻³
ME [kg 1.4-DB eq.]2.65 × 10−47.17 × 10−64.49 × 10−41.47 × 10−43.52 × 10−57.89 × 10−69.11 × 10⁻⁴
MEu [kg N eq.]5.37 × 10−58.98 × 10−71.22 × 10−41.39 × 10−41.43 × 10−63.70 × 10−73.18 × 10⁻⁴
MD [kg Cu eq.]1.05 × 10−35.26 × 10−52.58 × 10−34.93 × 10−33.25 × 10−55.78 × 10−49.23 × 10⁻³
POF. E [kg NOx eq.]2.69 × 10−15.49 × 10−21.02 × 101.18 × 105.34 × 10−37.44 × 10−13.27 × 10
POF. HH [kg NOx eq.]1.68 × 10−13.41 × 10−26.31 × 10−17.32 × 10−13.62 × 10−34.62 × 10−12.03 × 10
SOD [kg CFC-11 eq.]1.19 × 10−69.08 × 10−99.77 × 10−85.55 × 10−71.62 × 10−85.32 × 10−91.87 × 10⁻⁶
TA [kg SO2 eq.]1.23 × 10−33.25 × 10−54.30 × 10−37.88 × 10−44.42 × 10−48.46 × 10−56.88 × 10⁻³
TE [kg 1.4-DB eq.]1.72 × 10−19.40 × 10−35.59 × 10−18.94 × 10−22.69 × 10−36.82 × 10−38.40 × 10⁻¹
Table 9. Paper production costs of the two analyzed systems (conventional and with the use of silverskin). Data refers to euro (€) or million euro (M€).
LCCResearch and DevelopmentRaw Material AcquisitionProductionEnd of LifeDepreciation and TaxesEnvironmental ImpactsTotal
Conventional paper0.0 €16.296 M€18.368 M€4.339 M€4983 M€10.655 M€5.034 M€
CSS paper9200.0 €17.528 M€18.368 M€4.339 M€4983 M€8.928 M€5.033 M€
∆ (CSS-conventional)100%8%0%0%0%−16%−0.01%
Publisher’s Note: MDPI stays neutral with regard to jurisdictional claims in published maps and institutional affiliations.

