Abstract
The transportation sector is the largest producer of greenhouse gas (GHG) emissions in the United States. Energy-optimal algorithms are proposed to reduce the transportation sector’s fuel consumption and emissions. These algorithms optimize vehicles’ speed to lower energy consumption and emissions. However, recent studies argued that these algorithms could negatively impact traffic flow, create traffic congestions, and increase fuel consumption on the network-level. To overcome this problem, we propose a collective-energy-optimal adaptive cruise control (collective-ACC). Collective-ACC reduces fuel consumption and emissions by directly optimizing vehicles’ trajectories and indirectly by improving traffic flow. Collective-ACC is a bi-objective non-linear integer optimization. This optimization was solved by the Non-dominated Sorting Genetic Algorithm (NSGA-II). Collective-ACC was compared with manual driving and self-centered adaptive cruise control (i.e., conventional energy-optimal adaptive cruise controls (self-centered-ACC)) in a traffic simulation. We found that collective-ACC reduced fuel consumption by up to 49% and 42% compared with manual driving and self-centered-ACC, respectively. Collective-ACC also lowered CO2, CO, NOX, and PMX by up to 54%, 70%, 58%, and 64% from manual driving, respectively. Game theory analyses were conducted to investigate how adopting collective-ACC could impact automakers, consumers, and government agencies. We propose policy and business recommendations to accelerate adopting collective-ACC and maximize its environmental benefits.
1. Introduction
According to a recent survey by PEW Research Center, U.S. citizens rated “environmental protection” and “climate change” as the top priorities for their government [1]. The concern has reached the highest level since starting the survey in 2002. Air pollution emissions also cause premature deaths and morbidities. It is estimated that the emissions cause about 200,000 premature deaths annually in the U.S. [2]. The transportation sector is the largest producer of greenhouse gas (GHG) in the U.S., responsible for 29% of total GHG [3]. Light-duty vehicles (LDVs) have the largest share within the transportation sector, generating 59% of GHG [3]. The emissions from road transportation cause 58,000 premature deaths annually in the U.S. [2], which is much higher than the fatality resulting from car crashes (i.e., about 37,000 deaths annually) [4]. Mitigating this public health and environmental issue needs significant changes in the transportation sector. Automated vehicle technologies (e.g., adaptive cruise control) could play a key role in reducing road vehicles’ GHG emissions.
Energy-optimal algorithms optimize vehicles’ trajectories to minimize energy consumption and emissions. Vehicles’ trajectories are optimized, considering technical constraints (e.g., maximum acceleration and velocity) and environmental constraints (e.g., speed limit, traffic light, and traffic condition) [5,6,7]. Several energy-optimal algorithms have been proposed in the literature [8,9,10]. The algorithms attempt to improve the fuel efficiency of vehicles by:
- Smoothing acceleration/deceleration (rule-based systems) [8,11].
- Optimizing vehicle’s speed and acceleration (optimization-based systems) [9,10,12].
These algorithms solely consider the direct fuel consumption and emissions of a vehicle. Direct fuel consumption is defined as the amount of fuel consumed by an engine at a given velocity and acceleration. However, the fuel consumption of a vehicle also depends on traffic conditions. For instance, drivers cannot travel at a fuel-efficient speed in a congested traffic flow.
Traffic flow is a multi-agent system in which each agent could influence the entire system. The phantom traffic jam is a well-known example of multi-agent traffic flow. A driver’s brake could cause a traffic jam in a phantom traffic jam, increasing fuel consumption for all vehicles on the road.
Some studies illustrate that fuel consumption could be reduced by modifying a traffic flow. Speed harmonization is a well-known approach to alter traffic flow [12,13,14,15]. Studies in the literature indicated that speed harmonization could increase fuel efficiency by improving traffic flow and reducing congestion [8,13]. In this study, fuel-saving by improving traffic flow is named “indirect fuel-saving”.
In the literature, energy-optimal algorithms only focus on vehicles’ direct fuel consumption, ignoring vehicles’ impacts on traffic flow. This study names these algorithms self-centered energy-optimal algorithms because they only optimize fuel consumption for the equipped vehicles. These algorithms may negatively impact traffic flow and increase fuel consumption and emissions at the network-level [16,17,18]. For instance, the maximum fuel efficiency for an internal combustion engine is achieved around 40 to 60 miles per hour (MPH) [3], which is much lower than the average travel speed on U.S. highways. Driving at a fuel-efficient speed could reduce road capacity and block traffic flow. Increasing traffic congestion increases fuel consumption for all road users, including the equipped vehicles themselves. These negative impacts could become more substantial as self-centered algorithms’ market penetration rate (MPR) increases [19,20]. Xin et al. revealed that self-centered algorithms could harm traffic flow and increase fuel consumption for other road users by up to 8% [20]. McConky reported that in a low MPR, automated vehicles could reduce CO2 emissions by 5%, but as their MPR increases, their CO2 emissions increase [19]. They stated that self-centered algorithms could increase CO2 emissions by up to 20% at high MPRs.
The shortcoming of previous studies is that they have ignored the network impact of their algorithms. The goal of our study is to solve this issue by introducing a novel concept. This concept integrates both direct and indirect energy impacts. This integrated energy optimization concept is named collective energy and emissions optimization. It is inspired by “collective behavior” in socio-economic systems. It is named “collective” because it improves energy efficiency by improving vehicles’ “collective behavior” in a decentralized optimization. In this concept, each vehicle attempts to directly save energy and emissions for itself and also positively impacts traffic flow (e.g., speed harmonization). When the number of vehicles equipped with collective-ACC increases, their positive impacts become dominant and provides energy and emissions saving for all vehicles.
The contributions of this study can be summarized in three categories:
- Concept: We have introduced a novel concept in energy-optimal algorithms to prevent the negative impact of these algorithms on traffic flow. Our concept not only solved the issue but also discovered a substantial emission saving opportunity (i.e., up to USD 35 million per day in the U.S.).
- Method: We have formulated a multi-objective optimization (i.e., no need to sum up distinct objective functions (e.g., fuel and safety)) and used a metaheuristic optimization algorithm (i.e., NSGA-II). NSGA-II solved the optimization in approximately 0.4 s, overcoming the long run-time issue reported in the previous studies [21,22].
- Scope: To the best of our knowledge, this is the first study that investigated the adoptability and socio-economic impacts of its energy-optimal algorithm. This study went beyond developing a theoretical algorithm and used game theory and stakeholder analysis to determine the pros and cons of adopting this technology for the stakeholders. This analysis provides valuable recommendations for policymakers, automakers, and environmental advocates.
2. Definitions
This section defines the most common terms in this study. These terms are used in different ways in the literature. This section defines these terms based on the most commonly used meaning in the literature to avoid misunderstandings.
Cruise control (CC): It is a technology that maintains vehicles’ speed at a pre-defined speed. Drivers or algorithms define the speed. CC does not interact with the traffic flow, and drivers maintain the safety headway.
Adaptive cruise control (ACC): It is an advanced version of CC that uses radar or camera data to maintain a safe distance from the leading vehicle. ACC adapts its speed to maintain the safety of vehicles [23].
Cooperative ACC (CACC): It is an advanced ACC system designed to utilize vehicle-to-vehicle (V2V) communication to send and receive feedback from other vehicles. CACC adjusts speed and headway based on information from physical sensors (e.g., radar and laser) and feedbacks from V2V communications [24,25].
Energy-optimal driving: It is an advanced technology that computes the most fuel-efficient trajectory for vehicles based on the available information (e.g., speed limit, traffic condition, traffic signal, and topographic information) [26]. It finds the most fuel-efficient trajectory by optimization [27] or rule-based algorithms [28]. Energy-optimal algorithms are developed for different fuel types (e.g., gas, hybrid, and electric) and various control technologies (e.g., CC, ACC, CACC, and CAV) [17,27,29].
Ecological cruise control (Ecological-CC): It is a type of energy-optimal driving technology with CC using topographic information to minimize fuel consumption [23]. Ecological-CC does not consider the surrounding traffic, and drivers must maintain the safety of their vehicles [27,30]. However, some studies developed Ecological-ACCs which use radar or camera data to adjust their speed and avoid collisions [29,31].
Energy-optimal ACC and energy-optimal CACC: These are types of energy-optimal driving technologies based on ACC and CACC. They calculate the most fuel-efficient trajectory for a vehicle based on radar, camera, V2V, or vehicle-to-infrastructure (V2I) communications. They also adjust vehicles’ speed to avoid collisions [26].
It should be noted that drawing a clear boundary between these technologies is challenging since most of the proposed technologies have a combination of these features.
Offline and online optimizations: Energy-optimal optimization could be performed online or offline. An offline optimization assumes that the model knows the route’s information in advance (e.g., topography, speed limit, and traffic conditions). An online optimization receives the information in real-time and performs the optimization [31,32,33].
Model predictive control (MPC): It is a group of control algorithms that use a process to estimate the future status of an object (e.g., the status of a traffic light or leading vehicle’s location) [34,35]. MPCs vary from simple linear models (e.g., assuming a fixed acceleration rate for the preceding vehicle) to complex non-linear algorithms (e.g., deep learning models). However, computation time is the main limit for online MPC algorithms, especially when the number of control inputs is large [34].
Rolling horizon control: This is an approach to solve the computation time problem in online optimization. In rolling horizon control, the control period is limited to a short planning period. The optimization focuses on that planning horizon. So, the number of parameters to optimize is small, and the optimization process is fast.
3. Literature Review
In recent years, several technologies have been proposed to reduce vehicles’ fuel consumption and emissions. The technologies attempt to reduce fuel consumption and emissions by improving powertrain performance [10], smoothening accelerations and decelerations [36,37], optimizing vehicles’ trajectories [38,39], or harmonizing vehicles’ behavior [39,40,41]. Some technologies improved fuel efficiency by smoothing engines and powertrain behavior [36,37]. These technologies have been widely commercialized in current vehicles, and they are known as Eco-mode. Some other technologies optimize charging and discharging cycles for plug-in hybrid vehicles (PHEVs). These studies have improved the fuel efficiency for PHEVs [10,42].
Fuel efficiency could be improved by modifying vehicles’ longitudinal behavior. Adaptive cruise control (ACC) and cooperative adaptive cruise control (CACC) could reduce fuel consumption and emissions by maintaining a constant speed and smoothening vehicles’ accelerations and decelerations [28]. A summary of these studies is provided in Table 1.
Some studies applied optimization algorithms to minimize fuel consumption for a given route, known as energy-optimal ACCs [16,43]. Energy-optimal ACCs use optimization algorithms to find a speed trajectory that minimizes fuel consumption while maintaining a safe headway. Park et al. estimated that energy-optimal ACC could save fuel by up to 60%, saving 13.8 billion gallons of gas, equal to USD 38.0 billion annually in the U.S. [43].
Some studies used topographic information to maximize fuel saving [28,31,32]. In these studies, vehicles adjust their speeds on hilly roads to use gravity to maximize their fuel savings, known as ecological-CC. It is reported that ecological-CC could save up to 5% more fuel than classic cruise control systems [29]. Other studies combined ACC with ecological-CC, in which ecological-ACCs receive road data through radar or camera, and topographic data, through topographic maps [10,44]. These ecological-ACC algorithms could maintain a safe headway while driving fuel efficiently. The studies reported up to 27% fuel saving, depending on road slope and traffic conditions [24,29,33].
Some energy-optimal algorithms combined longitudinal control with lane-changing [18,29]. They minimize fuel consumption by adjusting speed and changing lane [31,45]. These algorithms change lanes if lane changing could provide better fuel efficiency [18,29].
Recent studies used advanced prediction models to predict leading vehicles’ location. These studies utilized machine learning and deep learning models for this prediction [46,47]. These models increased the accuracy of predictions, but they increased computation time. A major obstacle for commercializing energy-optimal algorithms is the computation time [21]. Thus, some studies attempted to reduce computation time. They used simplified optimization functions [48], closed-form solutions [49], or look-up tables [21].
Although these studies reported significant energy savings for their algorithms, the algorithms were tested in small traffic simulations with only a pair of subject-leading vehicles. These studies lack investigating network-level impacts. The importance of investigating the network impact of energy-optimal algorithms has been highlighted by several studies [17,29]. Huang et al. reviewed multiple fuel-saving technologies. They concluded that “current studies mostly focus on individual’s driving behaviors, but lacks consideration at network-levels” [50].
A small number of studies investigated the network impact of energy-optimal algorithms [20,21]. Xin et al. reported a negative network impact of their proposed algorithm, which increased fuel consumption for road users by up to 8% [20]. They found that the fuel-saving of the equipped vehicles decreases as the MPR increases. McConky found that his proposed algorithm reduced CO2 emissions by 5% in a low MPR, but the CO2 emissions increased as the MPR increased [19]. He reported an up to 20% increase in CO2 emissions at the network-level. He et al. performed a road test with a platoon of five ACC-equipped vehicles in two scenarios: (1) all vehicles with activated ACC and (2) all vehicles with deactivated ACC [51]. They revealed that using ACC increased fuel consumption by 12% for the immediate follower in the platoon and by 14% for the whole platoon. These studies indicated that energy-optimal algorithms could negatively impact fuel consumption and emissions at the network-level.


Table 1.
Summary of energy-optimal algorithms.
Table 1.
Summary of energy-optimal algorithms.
| Author | Type | Method | Result |
|---|---|---|---|
| Lin et al., 2016 [27] | Ecological-CC for PHEV | They optimized electric and gas consumption, considering MPC for the leading vehicle and topography of the roadway. They used an engine deterministic model to estimate fuel consumption. | It improved fuel efficiency by 3% in comparison with a classic cruising control system. |
| Saerens et al., 2013 [29] | Ecological-CC | They optimized fuel consumption and travel time. They used an engine deterministic model to estimate fuel consumption. | They reported a 5% fuel saving in comparison with a classic cruising control system. |
| Vajedi and Azad, 2016 [10] | Ecological-ACC for PHEV | They aimed to optimize energy cost (i.e., gas and electric) and a soft safety constraint. The model considers road topography and MPC for the leading vehicle. An engine deterministic model was used to estimated fuel consumption. | Traffic simulations showed that the model reduces total energy cost by up to 19%. |
| Ahn et al., 2013 [32] | Ecological-ACC | It used a speed range selected by the driver and topographic data to minimize fuel consumption. They used an engine deterministic model to estimate fuel consumption. | The model could save up to 10% in fuel, depending on the speed range selected by the driver. |
| Tajeddin et al., 2019 [31] | Ecological-ACC with lane changing and V2V | The model received information of surrounding vehicles through V2V communication and performed lane-changing if needed. It optimized fuel consumption, variation from defined speeds, and a soft safety constraint. | They found up to 27% fuel-saving possibilities depending on traffic flow conditions. |
| Wang et al., 2014 [28] | Ecological-ACC | They developed an energy-efficient model improving CO2, comfort, safety, and driving at the desired speed. They also developed a travel-efficient model increasing driving in desire speed and comfort. | The energy-efficient model reduced CO2 by 3% and 9% at the free-flow and congested conditions, respectively, compared to the travel-efficient model. The energy-efficient model achieved a 5% higher road capacity than the travel-efficient model. |
| He et al., 2020 [51] | ACC | They performed a road test with 5 ACC-equipped vehicles when the ACC was on and off. | ACC showed a quick response to fluctuation in speed and caused traffic instability. Fuel consumption had increased by 12% for the immediate followers and by 14% for the platoon. |
| Kamal et al., 2015 [45] | Energy-optimal CAV with lane-changing | The model optimized speed variation from fuel optimum speed with acceleration, safety, and lane-change penalties. They used MPC and rolling horizon for the optimization. | The model improved fuel efficiency by 7%, but it dropped the mean velocity by 7%. |
| Park et al., 2011 [43] | Energy-optimal ACC | The model received a cruising speed from the driver and optimized fuel and variation from the cruising speed with a gear change penalty. MPC was used to predict traffic conditions. | It showed fuel savings between 30% and 60% in different scenarios. |
| Bertoni et al., 2017 [52] | Energy-optimal CACC for EVs | It minimized energy consumption for EVs at a platoon. The difference between this model and the others was that each EV shared its planned trajectory for its following EV. So, the following EV optimized its trajectory accordingly. | They found a 15% reduction in fuel consumption in highway travel. |
| Weißmann et al., 2018, 2017 [32,33] | Energy-optimal Ecological-ACC | They developed an offline–online fuel optimization ACC algorithm. First, it estimated fuel-efficient trajectory for the whole route based on topographic data. Then, an online optimization minimized variation from the optimum trajectory. They used three planning horizons (4 s, 10 s, and 20 s). They tried two models to predict the leading vehicle’s trajectory (i.e., constant speed and full knowledge). | Their simulation scenario (single vehicle following another vehicle) found average energy savings of 7.5% for full-knowledge and 7.2% for constant speed. They also found that a longer-rolling horizon results in slightly more fuel savings. |
| Yang et al., 2021 [53] | Energy-optimal ACC | They assumed that energy consumption has a direct relation with acceleration. So, they proposed an energy-optimal ACC to minimize acceleration, improve ride comfort (i.e., minimize jark value), and follow the leading car with a minimal gap variation. They estimated the proceeding vehicle’s location by a longitudinal car-following model. They applied active disturbance rejection control (ADRC) to smoothen the speed trajectory for ACC. | They performed a real road test by an equipped vehicle. The algorithm reduced average acceleration by 11% from conventional ACC. Adding ADRC reduced average acceleration by up to 84%. They did not report a change in fuel consumption. |
| Jia et al., 2020 [22] | Energy-optimal ACC | They compared the performance of three different MPC approaches, including liner MPC, hybrid model predictive control (HMPC), and receding horizon dynamic programming (RHDP). Their algorithm aimed to minimize fuel consumption with soft constraints on safety and comfort. | They conducted a traffic simulation and found that RHDP has the highest energy saving capability (12%) and liner MPC (7%) has the lowest saving capability. However, liner MPC had a significantly better computation time (12 ms) than RHDP (2850 ms). |
| Han et al., 2020 [49] | Energy-optimal CACC with V2I communication | They developed an energy-optimal CACC for a platoon of vehicles with V2V and V2I communications. The leading vehicle in the platoon performs fuel optimization, and the other vehicles follow it. The leading vehicle also receives traffic information through V2I communication to pass traffic lights on time. This vehicle finds a right gap between the vehicles in the platoon to pass traffic lights and does not break the platoon. | The algorithm could reduce fuel consumption by 10% if an MPC model selects the gap. |
| Jia et al., 2020 [46] | Energy-optimal ACC | They proposed a new approach to predict the preceding vehicle’s location by a deep learning model (i.e., a recurrent neural network with long short-term memory). The model used various driving data (e.g., speed trajectories, traffic light statuses, and road conditions). Since there was not sufficient data to train a deep learning model, they used VISSIM simulation to generate enough data for the training. | This study only presented a new concept, and there was not any energy-saving result. |
| Hattori et al., 2021 [21] | Energy-optimal Ecological-ACC | They focused on reducing the computation time of energy-optimal ACC algorithms. They used quadrant dynamic programming (QDP) and generated an offline table to estimate optimal speed for a given traffic condition. This approach helped to make the algorithm running in real-time. | They performed a traffic simulation for electric vehicles. They reported 16% energy saving. |
| Jia et al., 2021 [47] | Energy-optimal Ecological-ACC | This study proposed a data-driven energy-optimal ecological-ACC for heavy-duty vehicles (HDVs). The model combined weather data, historical traffic data, 3D road maps, and local traffic data to predict traffic conditions and optimize fuel consumption. They used a convolutional neural network (CNN). | They found that the proposed algorithm could reduce fuel consumption by 11% compared to an average traffic speed policy. In congested traffic, there was less fuel-saving opportunity. |
| M. Mamouei et al., 2018 [16] | Energy-optimal ACC | They optimized IDM parameters to generate an ACC model that minimizes fuel consumption. They developed two ACC models: (1) minimize user-oriented fuel consumption and (2) minimize system-oriented fuel consumption (i.e., the whole network). They used a simulation-based optimization that tries different IDM parameter sets to find a set that minimizes fuel consumption. | The user-oriented ACC reduced fuel consumption by 12% for the equipped vehicle, but it increases network-level fuel consumption by 34%. Road capacity also dropped by 27%. System-oriented ACC increased equipped vehicle’s fuel consumption by 12%, but it increased road capacity by 39% and the network fuel consumption by 18%. These benefits were more significant in long simulations and high traffic flow. |
Mamouei indicated that it is “short-sighted” to study energy-optimal algorithms at a single-vehicle level [16]. Mamouei et al. developed two ACC algorithms: (1) user-oriented fuel saving (i.e., self-centered ACC) and (2) system-oriented fuel saving (i.e., similar to collective ACC). They found that user-oriented ACC reduces fuel consumption by 12% for the equipped vehicle, but it increased network-level fuel consumption by 34%. The road capacity also dropped by 27%. On the other hand, the system-oriented ACC increased the equipped vehicle’s fuel consumption by 12%. However, it increased road capacity by 39% and reduced network fuel consumption by 18% [16].
The main challenges and trends in this research domain are summarized in Table 2.

Table 2.
The main challenges and trends in developing energy-efficient driving algorithms.
Although Mamouei’s study is a breakthrough in energy-optimal algorithms, it has some shortcomings. First, they developed two extreme models. The user-oriented ACC attempts to maximize its fuel-saving with no empathy for its network. The system-oriented ACC sacrifices equipped vehicles’ fuel-saving to maximize the network-level fuel savings. No driver may install an ACC which increases her/his vehicle’s fuel consumption and benefits the others. Second, there was only one ACC-equipped vehicle in their traffic simulation, which was the leading vehicle. It is unclear how having multiple equipped vehicles in the traffic simulation (i.e., mixed traffic flow) could change the network’s behavior. Third, they developed the ACC algorithm by calibrating IDM’s parameters for a specific traffic condition (i.e., passive optimization). If the traffic condition changes, the ACC may not adapt itself to the new condition, and it should be calibrated again. Fourth, if a system-oriented ACC does not benefit its owners, it may never launch to market despite its great social benefits.
This study aims to propose an energy-optimal ACC algorithm that optimizes network-level fuel consumption and emissions and solve the Mamouei model’s shortcomings. Our model maximizes equipped vehicles’ benefits in the first place, and it also positively impacts traffic flow (i.e., neither sacrifice for the network nor selfishness). Second, our model uses an online optimization with a rolling horizon (i.e., active optimization). It automatically adapts itself to different traffic conditions, with no need for additional calibrations. Third, we investigate mixed traffic flow as well as fully automated traffic flow. We study the impact of MPR on individual and network-level fuel and emissions savings. This is the first study that determines the effect of its algorithm on broader stakeholders, including consumers, environmental advocates, and government agencies. We conducted a game theory analysis to investigate consumers’ willingness to adapt collective-ACC. We estimated collective-ACC’s social cost-savings (i.e., reducing mortality and morbidity costs due to reduction in transportation emissions). We also discussed collective-ACC’s impacts on the Environmental protection Agency (EPA), the Department of Transportation (DOT), and other stakeholders.
4. Method
In this section, first, model predictive control is explained in detail. Second, direct fuel-saving and indirect fuel-saving objective functions are described. Third, the multi-objective optimization approach is explained. Then, the adaptability of collective-ACC is modeled by a game between automakers. Finally, the simulation scenario and its execution process are described.
4.1. Modeling Predictive Control
It is critical to know the location of the preceding vehicle to maintain safe headway through cruising. This study uses model predictive control (MPC) to predict the preceding vehicle’s location through the rolling horizons. It is assumed that the preceding vehicle maintains its acceleration () for the rolling horizon. Based on physics motion equations, the preceding vehicle’s location and speed in time i = 1 are estimated as:
where and are the preceding vehicle’s speed in the current time step (i = 0) and the next time step (i = 1), respectively. is the duration of time steps (i.e., one second). and are the preceding vehicle’s location in i = 0 and i = 1, respectively. These equations could be extended for T time steps, as:
where and are the preceding vehicle’s speed and location in time step i, measured by radars or cameras installed on the subject vehicle. T is the planning (rolling) horizon. The gap and velocity difference between the preceding and the subject vehicles are calculated as:
where, is the subject vehicle’s location at time . and are the subject and preceding vehicles’ lengths, which are utilized to adjust center-to-center distance to bumper-to-bumper distance.
4.2. Optimization Function
The optimization functions and constraints are formulated as:
Subject to:
where is an instantaneous fuel consumption model which calculates fuel consumption for a vehicle at the velocity and acceleration rate . is the target velocity, is the average velocity of the preceding vehicle in the coming rolling horizon. is the average velocity of the following vehicle in the current rolling horizon. and are the time gaps for the subject vehicle and following vehicle, respectively. is the minimum time gap between vehicles. and are sensitivity weights. is the speed limit, and and are the maximum deceleration and acceleration rates.
This optimization is a multi-objective non-linear integer programming problem. The only variable in this optimization is the target velocity (). The other variables (e.g., acceleration and time gap) could be calculated based on the target velocity. The target velocity is considered to be a positive integer value (e.g., 43 MPH). Using integer values instead of float values significantly decreases the solution area and reduces optimization computation time.
Collective-ACC algorithm has two objectives: (1) minimizing the direct fuel consumption and (2) minimizing indirect fuel consumption. The first objective function minimizes the direct fuel consumption of the subject vehicle. This objective function is explained in detail in Section 4.2.1. The second objective function minimizes indirect fuel consumption. This objective function is also described in detail in Section 4.2.2. The approach to merge these two objective functions is explained in Section 4.2.3.
Equation (9) guarantees that the vehicle’s velocity never passes the speed limit. Equation (10) guarantees that the vehicle’s acceleration and deceleration rates are in a comfortable range. Comfortable acceleration and deceleration rates are considered as below 2 [54,55]. Equation (11) guarantees safety. It makes sure that the vehicle’s time gap is always greater than the minimum time gap. Unlike previous studies which used soft safety constraints (i.e., adding safety penalties to the objective function) [10,29,33], this study uses a hard constraint to make sure a safe driving condition is always maintained. A soft constraint could be relaxed by accepting a penalty, but hard constraints are not open for negotiation. For more information on soft and hard constraints, please see [56].
4.2.1. Optimizing Direct Fuel Consumption and Emissions
Several approaches have been proposed to model instantaneous fuel consumption and emissions [57,58,59]. This study uses the Handbook Emission Factors for Road Transport (HBEFA). HBEFA is one of the most advanced instantaneous fuel models developed by the Environmental Protection Agencies of Germany, Switzerland, and Austria [59]. HBEFA is more advanced than deterministic physical models and more updated than regression models [57]. Hence, HBEFA is utilized to calculate the amount of fuel consumed and emissions released in a given velocity and acceleration.
The direct fuel consumption is minimized by using instantaneous fuel consumption for rolling horizon T:
where J is the instantaneous fuel consumption based on HBEFA at the velocity of and acceleration of at the time i. The outcome of this objective function is milliliter fuel consumed in rolling horizon T. The road slope is not considered in the instantaneous model because our algorithm is developed for driving on a flat road. The algorithm could be extended to hilly roads in the future.
HBEFA calculates fuel consumption for a decelerating vehicle as zero because a decelerating vehicle loses energy and does not consume fuel. These zero values could push the optimization function to select deceleration as the most fuel-efficient solution. Continuous deceleration leads to a full stop. A full stop is the most fuel-efficient option in theory because a stopped vehicle does not consume energy. Stopping a vehicle is the global optimum in theory, but the vehicle should reach its destination in the real world. To avoid full stop, it is assumed that fuel consumption in a deceleration period is equal to the fuel consumption in the target speed (i.e., ). This adjustment prevents unnecessary decelerations, and the algorithm decelerates only if the deceleration could save fuel in the long term.
4.2.2. Optimizing Indirect Fuel Consumption and Emissions
The goal of this objective function is to reduce fuel consumption and emissions by improving traffic flow. Unlike the direct fuel and emissions optimization, there is no equation to calculate the amount of saved fuel or emissions from the amount of improved traffic flow. It is not possible to measure fuel consumption based on traffic density, throughput, or other macro traffic measures. Therefore, a proxy optimization function is used.
Proxy optimization is an optimization technique used when the actual objective is not measurable or hard to measure [60]. In this technique, instead of optimizing the actual objective, a proxy function is defined and optimized. There is a correlation between the actual and proxy objectives. Thus, improving the proxy objective could result in improving the actual objective.
The proxy function for indirect fuel and emissions includes a set of penalty functions to improve traffic flow. These penalties consider three scenarios to improve traffic flow:
- (1)
- Car-following condition;
- (2)
- Blocking traffic flow;
- (3)
- Free-flow condition.
The scenarios are shown in Figure 1.
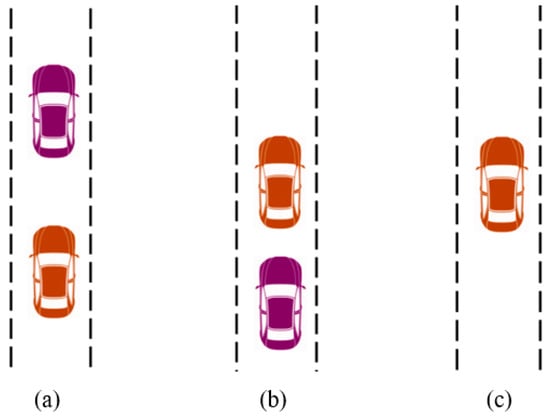
Figure 1.
The three traffic conditions. (a) The subject vehicle, in orange, follows the preceding vehicle, in purple, in a car-following condition. (b) The slow-moving subject vehicle blocks the roadway. (c) The subject vehicle travels in free-flow traffic conditions.
Car-following condition: In car-following traffic conditions, speed harmonization could improve traffic flow and reduce fuel consumption [8,61]. Similarly, the speed variation between the subject vehicle and its preceding vehicle is minimized in car-following traffic conditions. This speed harmonization is formulated as:
where is the average velocity of the preceding vehicle at the coming rolling horizon. is calculated as:
Speed harmonization is effective when vehicles follow one another with short headway. Therefore, a dynamic weight is added to increase the importance of speed harmonization in short headways. is a constant value. As decreases, increases. is always larger or equal to (i.e., the safety constraint). So, is in [0, 1] range. is a sensitivity parameter, which is discussed in the following.
Blocking traffic flow: An equipped vehicle that travels at fuel-efficient speed (i.e., around 40 to 60 MPH) could block traffic and cause congestion. In order to force the equipped vehicle to increase its speed, a penalty function is added to the objective function. The penalty function has a direct correlation with the speed difference between the following and subject vehicles. When the speed difference is higher, it is more likely that the equipped vehicle blacks the traffic. The penalty is defined as:
where is the average velocity of the following vehicle in the current time step. is calculated as:
where is the velocity of the following vehicle in the previous rolling horizon (i.e., i in [−T, 0] range), which is measured by the radar. In this equation, the average velocity is used because calculating this penalty based on a single velocity could not represent a traffic blockage (e.g., when the following vehicle increases its velocity for a moment), and it could lead to drastic penalties and unstable traffic flow.
Blocking traffic flow happens when some vehicles closely follow a slow-moving vehicle. If there is no following vehicle in close distance, it should not be considered as a traffic blocking condition. Therefore, a dynamic weight is used to activate the traffic blocking penalty only when there is a closely following vehicle. Value of the dynamic weight () increases as the time gap between the following and subject vehicles (i.e., ) decreases. In order to adjust the sensitivity of this dynamic weight, is used, a sensitivity parameter, which is discussed in the following.
Free-flow traffic condition: When vehicles travel in a flow-flow condition, they travel at their desired speed with minimal interaction with one another. In this condition, it is unlikely that vehicles could influence one another or cause congestion. So, the vehicles should not cause any indirect fuel wastes or savings. Thus, the indirect fuel consumption and emissions’ penalties should converge to zero.
In a free-flow condition, and are much larger than . So, the dynamic weights for speed harmonization and blocking traffic flow converge to zero. How fast the weights converge to zero depends on and . Figure 2 shows how adjusting the sensitivity weights change the penalty values. High sensitivity weights cause fast convergence to zero (i.e., less sensitive to speed harmonization or blocking traffic), and low sensitivity weights result in slow convergence. and values are selected after a sensitivity analysis in the traffic simulation.
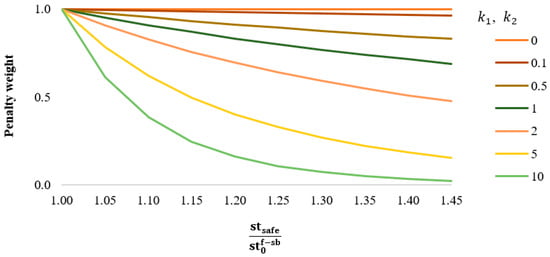
Figure 2.
Impact of and in converging the indirect fuel consumption penalties to zero.
Even though the second objective function converges to zero in a free-flow condition, it is not exactly zero. These small values may impact the optimization’s outcome. To avoid this issue, negligible indirect objective values are considered zero (i.e., values in [−10−3, 10−3] range).
4.2.3. Multi-Objective Optimization
Several approaches are proposed to manage multi-objective optimizations (e.g., scalarization methods, no preference methods, and posterior methods). Most energy-optimal studies used scalarization methods [31]. Scalarization methods convert a multi-objective problem to a single-objective problem using weights. Although it is not a rational approach to sum up distinct objective functions (e.g., travel time, fuel, and safety), it is common in the literature [31,44]. This study uses the Non-dominated Sorting Genetic Algorithm II (NSGA-II), a well-known posterior multi-objective optimization method [62]. NSGA-II is an extended version of the Genetic Algorithm for multi-objective optimization, proposed by Deb et al. in 2002 [62]. NSGA-II starts with a random population. It finds the dominant solutions (i.e., Pareto frontiers). Then, the dominant solutions generate the new population by crossover and mutation. The new population creates new dominant solutions. This process continues until a robust set of dominant solutions (i.e., Pareto frontiers) is found. Finally, the decision-maker chooses the optimum solution by a trade-off between the objective functions. More information about the NSGA-II optimization is available from Deb’s original paper [62]. Figure 3 shows a schematic view of Pareto optimal solutions (i.e., dominant solutions) versus non-optimum solutions (i.e., non-dominant solutions), where there are two objective functions (i.e., and ).
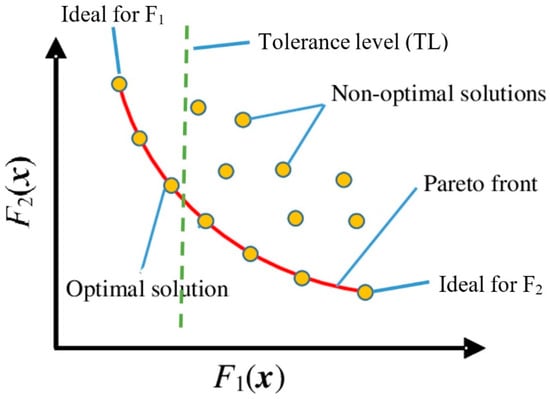
Figure 3.
Pareto optimal solutions versus non-dominant solutions in NSGA-II.
The decision-maker’s preferred solution is selected by defining a tolerance level (TL). TL defines the decision-maker’s willingness to give up some of the first objective function to optimize the second objective function. In this study, the TL is defined as a percentage of direct fuel consumption’s ideal solution. The ideal solution for F1 is shown in the top-left corner of Figure 3. This solution minimizes F1, but it is not ideal for F2. So, the decision-maker decides to trade a percentage of the ideal solution to minimize F2. In Figure 3, TL (the dash green line) is a percentage of the ideal solution that the decision-maker is willing to give up. The optimum solution for NSGA-II is a node on TL’s left side, which minimizes F2. TL is defined after tuning the optimization function in a traffic simulation.
4.3. Adopting Collective-ACC
Besides the technical details, a successful ACC technology should provide enough motivation for automakers to develop and adopt it. Most studies in the literature have missed analyzing the adaptability of their proposed technologies. This study uses a game theory analysis to investigate automakers’ willingness to develop and sell collective-ACC versus selling self-centered-ACCs. Automakers aim to maximize consumer satisfaction. One way to maximize consumer satisfaction is to sell highly fuel-efficient and environmentally friendly vehicles. The consumers could save on their fuel expenses, and the automakers could maximize their revenue. It is assumed there are only two automakers on the market, for simplicity. These automakers could sell vehicles with self-centered-ACC and collective-ACC. They choose to produce and sell only one type of these technologies. The goal is to find the optimum strategy (i.e., Nash equilibrium) for the automakers.
4.4. Traffic Simulation
This study uses the Simulation of Urban MObility (SUMO) software for traffic simulation. SUMO is an open-source traffic simulation software developed by the German Aerospace Center [63]. HBEFA v3 is implanted in SUMO, and SUMO uses it to calculate fuel consumption and emissions.
A ring-road scenario was created in SUMO. Figure 4 shows the simulation environment. In the ring-road scenario, vehicles traveled around the ring-road until the end of the simulation. The ring-road scenario has two advantages:
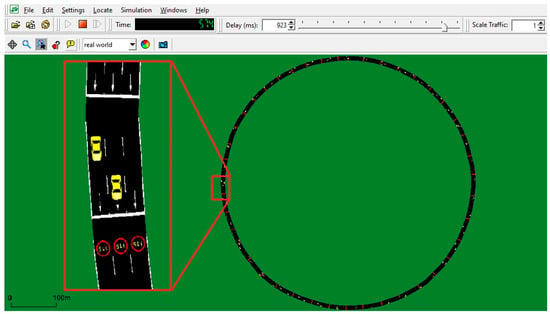
Figure 4.
SUMO simulation environment and the ring-road scenario.
- Vehicles do not leave the simulation. So, the simulation could be initialized and run faster with fewer vehicles.
- The ring-road scenario could reveal network-level behaviors in a short simulation, with no need for a long simulation. These advantages save time and processing power.
The simulation scenario was a three-lane highway with 0.97 miles (1.56 km) length. The road was designed with 85 edges, creating a smooth ring. The road was divided into 17 initiation sections, each five edges apart. In simulation initiation, vehicles entered the ring-road from these initiation sections, equally distributed around the ring. The simulation was run for 1 h (3600 s). The simulation ran in three traffic flow levels to investigate how an increase in traffic flow could impact the ACCs. Levels A, B, and C had 17, 51, and 102 vehicles in the simulation, respectively. All vehicles were passenger cars. The authors tested different market penetration rates (MPRs) for collective-ACC and self-centered-ACC.
The collective-ACC and self-centered-ACC were coded in Python 3.7 by the authors. The difference between self-centered-ACC and collective-ACC is that self-centered-ACC only optimizes the first objective function (i.e., direct fuel optimization), but collective-ACC optimizes both objective functions. The traffic simulation-optimization configuration is shown in Figure 5. The Python code reads instantaneous fuel data, which is generated by HBEFA and saved in a database. Python initiates the simulation and requests simulation data from SUMO every second (e.g., vehicles’ location, speed, and headway). Based on this data, Python runs the optimization model and sends vehicles’ target speeds to SUMO for execution. SUMO writes the outputs (e.g., fuel, emissions, trajectories, and flow) in log files through the simulation. Python script does not have any control over these files. At the end of the simulation, Python closes SUMO and reads the log files. The log files are used for analyzing the results and visualizations.

Figure 5.
Configuration of fuel optimization and traffic simulation.
A manual driving model was used to compare Collective-ACC and self-centered-ACC with human driving. It is assumed that SUMO’s manual driving model represents human driving style. So, SUMO simulation ran without Python involvement for the baseline model. SUMO managed all vehicles in its default mode.
5. Results
Before running the traffic simulations, collective-ACC was tuned. The traffic simulation ran with different values for w1, w2, k1, k2, minimum time headway (), rolling horizon (T), and tolerance level (TL). The parameters which minimize total fuel consumption are selected. Table 3 summarizes the model tuning results. The chosen parameters are shown in bold with an underline.

Table 3.
Parameter tuning for the energy-optimal algorithms. The selected parameters are highlighted in bold with underline.
5.1. Simulation Results
The optimization and traffic simulation ran on an Intel i7-8750H CPU with 16 GB RAM. Each optimization took approximately 0.4 seconds. Each traffic simulation took between 2 to 7 h to finish depending on the number of vehicles in the simulation.
Figure 6 shows the fuel consumption of manual driving, self-centered-ACC, and collective-ACC at different traffic flow levels at 100% MPR. Manual driving had the highest fuel consumption, 7.8 L/100 km on average. Collective-ACC was the most fuel-efficient technology, 4.0 L/100 km on average. Collective-ACC was 49% and 42% more fuel-efficient than manual driving and Self-centered-ACC, respectively. Moreover, manual driving and self-centered-ACC’s fuel consumption increased by an increase in traffic flow. However, collective-ACC’s fuel consumption was not sensitive to the traffic flow level.
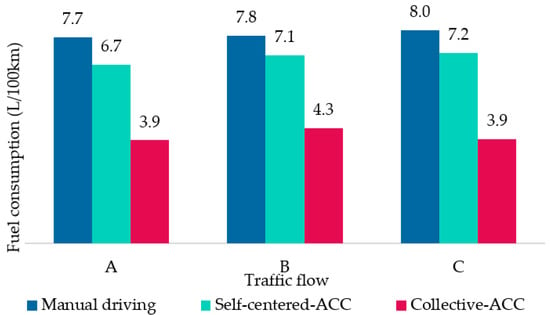
Figure 6.
Fuel consumption for manual, self-centered-ACC, and collective-ACC at different traffic flow levels (Levels A, B, and C with 17, 51, and 102 vehicles in the simulation, respectively).
Figure 7 illustrates the fuel economy of collective-ACC at different MPR and traffic flow levels. An increase in the MPR boosted collective-ACC’s fuel-saving capability. Collective-ACC consumed 5 to 6 L/100 km at low MPRs, but its fuel consumption reached around 4 L/100 km at 100% MPR. In general, collective-ACC’s fuel economy increased as traffic flow increased. The algorithm achieved the lowest fuel consumption at C traffic flow when 102 vehicles traveled in the traffic simulation.
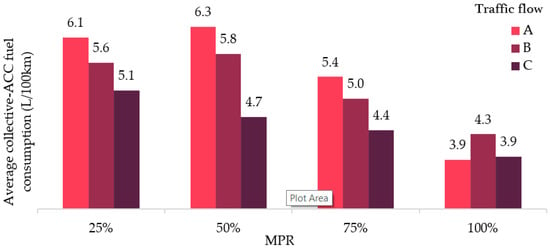
Figure 7.
Sensitivity of collective-ACC’s fuel consumption to MPR and traffic flow.
Collective-ACC not only benefited the equipped vehicles but also benefited manual vehicles. Figure 8 demonstrates the positive impact of collective-ACC on manual vehicles’ fuel consumption. When there was no collective-ACC on the road, manual vehicles’ consumed about 7.8 L/100 km. But the manual vehicles’ fuel efficiency improved as collective-ACC’s MPR increased. When 75% of vehicles were collective-ACC, manual vehicles’ fuel consumption reached around 6.6 L/100 km (i.e., 15% fuel saving).
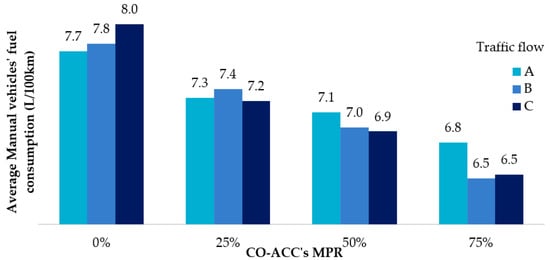
Figure 8.
Collective-ACC’s impact on manual vehicles’ fuel consumption.
Additionally, fuel-saving was more significant in high traffic flow. In traffic flow level A, manual vehicles’ fuel consumption declined by 12%, from 0% to 75% MPR. In traffic flow level C, this decline was about 19%. This pattern demonstrates that when the headways are small, collective-ACC vehicles had more tight interactions with manual vehicles. Therefore, collective-ACC could have more positive impacts on manual vehicles’ fuel consumption.
Figure 9 reveals that collective-ACC provided considerable environmental benefits. The figure shows CO, CO2, NOX, and PMX emissions for the entire traffic (i.e., network-level), including manual vehicles and collective-ACC vehicles. The figure clearly illustrates that CO, CO2, NOX, and PMX decreased as the MPR of collective-ACC increased. CO, CO2, NOX, and PMX release declined by 70%, 54%, 58%, and 64%, respectively, from 0% MPR (i.e., all manually driven vehicles) to 100% MPR (i.e., all collective-ACC equipped vehicles).
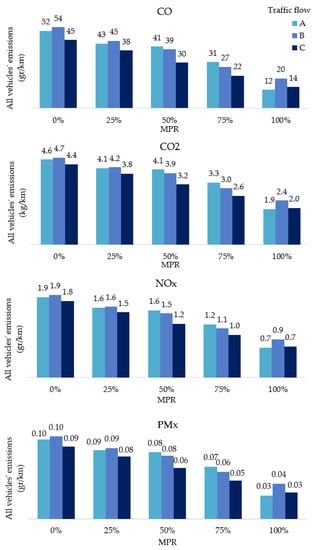
Figure 9.
Network-level environmental impacts of collective-ACC on traffic flow.
The main concern about energy-optimum algorithms is their impact on traffic flow and road capacity. Figure 10 compares the fundamental diagrams of manual driving, self-centered-ACC, and collective-ACC. First, the figure shows manual driving and collective-ACC both reached a similar maximum road capacity of 2900 vehicles/hour/lane. Self-centered-ACC reduced road capacity to approximately 2200 vehicles/hour/lane, a 24% decline in road capacity. The fundamental diagram’s slope illustrates average speed. Manual driving had the highest average speed (90 Kph = 56 Mph). Collective-ACC reached the maximum road capacity with a slightly lower average speed (85 Kph = 53 Mph). Self-centered-ACC decreased traffic speed significantly to 44 Kph, equal to 27 Mph. This result demonstrates that a self-centered-ACC could have a devastating impact on traffic flow and lower the road capacity and average speed.
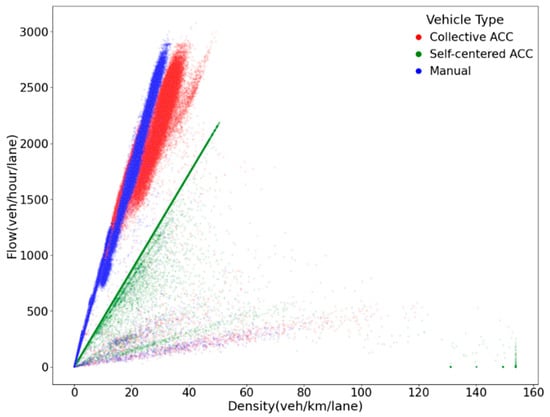
Figure 10.
Fundamental diagrams of the algorithms.
Figure 11 illustrates how collective-ACC trades off between optimizing direct fuel saving (x-axis) and optimizing indirect fuel saving (y-axis). Each dot is a possible target speed. The red dash lines show TL. The decision-maker could accept any target speed on the left side of the dashed line, which minimizes the indirect fuel objective function. The red arrows show the optimum target speed, which is chosen by the collective-ACC algorithm. Self-centered-ACC only minimizes direct fuel objective function. So, it selects the most left node as its target speed. Self-centered-ACC’s target speeds are shown with green arrows.
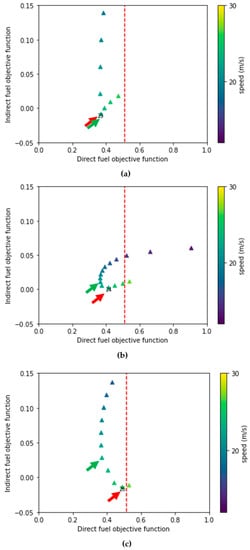
Figure 11.
Examples of solution areas (i.e., Pareto frontiers). The red dash lines show the decision-makers tolerance level. The red and green arrows indicate optimum solutions (i.e., selected target speeds) by collective-ACC and self-centered-ACC, respectively. (a) collective-ACC and self-centered-ACC have the same optimal speeds. (b) collective-ACC has higher optimal speed than self-centered-ACC, and it is not limited by the tolerance level. (c) collective-ACC has higher optimal speed than self-centered-ACC, but it is limited by the tolerance level.
In Figure 11, it should be noted that there are many possible target speeds in each solution area. However, the figures were cropped to show the most important options (i.e., the optimum solution). Moreover, the NSGA-II algorithm generates these figures after each fuel optimization process. Each simulation generates thousands of these solution areas. Figure 11 only shows three random examples for illustration purposes.
This figure indicates that in some cases, self-centered-ACC and collective-ACC may choose the same speed as the optimum target speed (e.g., part-a). In other instances, they choose different speeds (e.g., part-b and part-c). When the chosen speeds are different, collective-ACC selects a higher speed than self-centered-ACC (i.e., nodes with brighter colors have higher speeds). This behavior intuitively increases road capacity since a higher speed improves road capacity. An increase in road capacity benefits indirect fuel saving. This behavior shows that collective-ACC works most efficiently, and it trades off between direct fuel optimization and indirect fuel optimization.
5.2. Game Theory Results
This section presents the results of game theory on automakers’ game to choose between self-centered-ACC and collective-ACC. Table 4 indicates the games’ results in traffic flow A, B, and C levels. The payoff values are calculated based on the amount of saved fuel compared to manual driving in L/100 km. A higher saving is favorable. Regardless of the traffic flow level, this game is a Deadlock game. Collective-ACC is the dominant strategy for both automakers. Nash equilibrium is collective-ACC versus collective-ACC strategy. The automakers could not achieve a higher payoff by choosing self-centered-ACC at any condition.

Table 4.
The game theory results for different traffic flow levels.
6. Discussion
This section discusses three major questions:
- How does collective-ACC save this significant amount of fuel and emissions?
- How much could collective-ACC reduce the social cost of transportation emissions?
- How will the stakeholders be impacted by adopting this technology?
6.1. How Collective-ACC Reduces Fuel Consumption and Emissions
This study found that collective-ACC could reduce fuel consumption and emissions by 49% with no impact on road capacity or speed. The key question is: how does collective-ACC save fuel and emissions? To answer this question, we investigated how collective-ACC works in traffic simulation.
Figure 12 shows a pair-plot of fuel consumption, acceleration, and speed. This figure is generated from three traffic simulations in level C. In these simulations, all vehicles were equipped with only one technology (i.e., all manual driving, all self-centered-ACC, or all collective-ACC). The number of observations for all technologies was equal. The acceleration histogram (bottom-right corner) illustrates that manual driving has the widest acceleration range (i.e., var = 1.04). This wide range of acceleration causes significant fuel consumption, which is shown in the fuel consumption histogram (top-left corner). In this histogram, manual driving has a long tail on the right side, which justifies why manual driving had the highest fuel consumption rate. Manual driving accelerated and decelerated more often with sharp rates. This aggressive behavior increased fuel consumption and emissions.
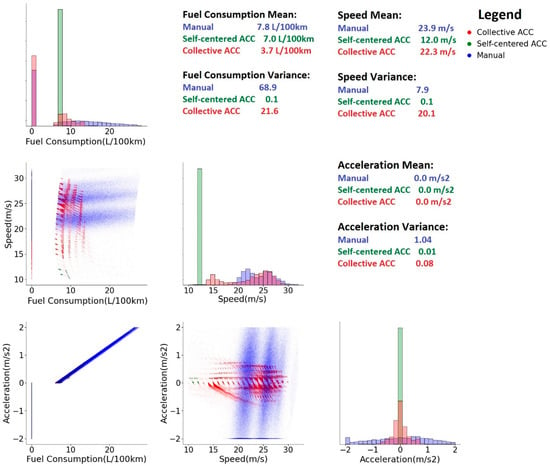
Figure 12.
Histograms, scatter plots, descriptive statistics of fuel consumption, speed, and acceleration for the technologies.
Self-centered-ACC drove vehicles at a constant speed, with a constant fuel consumption rate and zero acceleration. This smooth driving style resulted in some fuel savings (i.e., the average fuel consumption of 7.0 L/100 km).
Unlike self-centered-ACC, collective-ACC did not drive vehicles at a constant speed. It drove with some speed fluctuations and with smooth accelerations and decelerations, between −0.7 and 0.7 m/s2. In decelerations, HBEFA estimates fuel consumption as zero because the vehicles lose energy. So, when collective-ACC decelerates, its fuel consumption is zero. In Figure 12, see the left corner of the fuel consumption histogram. Collective-ACC was in deceleration mode in 47% of the simulation period, which resulted in zero fuel consumption. Collective-ACC decelerated more often than self-centered-ACC. While collective-ACC consumed a minimal amount of fuel for 47% of the driving period, self-centered-ACC consumed about 7.0 L/100 km for almost the whole driving period.
Manual driving decelerated 47% of the simulation period but with much sharper deceleration rates than collective-ACC. The manual driving and collective-ACC’s acceleration variances were 1.04 and 0.08, respectively. This significant difference in the acceleration variances illustrates that collective-ACC drove much smoother than manual driving, even though they drove in relatively similar speed ranges.
This analysis demonstrates that collective-ACC’s superior fuel-saving strategy is “smooth speed fluctuation”. This strategy has two benefits:
- In speed fluctuation, fuel consumption is negligible about 50% of the time since deceleration needs minimal fuel consumption.
- Smooth accelerations slightly increase fuel consumption which is worth the deceleration period with the minimal fuel consumption.
6.2. Social Cost Savings of Collective-ACC
The authors, in their previous publications, have proposed a framework to estimate automated vehicles’ social cost savings (i.e., reduction in mortality and morbidity due to reduced transportation-related emissions) [24,64]. The framework has been used to estimate automated vehicles’ social cost savings in 86 major metropolitan areas in the U.S. This subsection uses the framework to estimate collective-ACC’s social cost savings. The framework relies on five direct and indirect impacts of automated vehicles to estimate their social cost savings. These impacts are:
- Accident-related congestion reduction;
- Non-accident-related congestion reduction;
- Aerodynamic force reduction;
- Operation load;
- Traffic rebound.
The accident reduction impact of collective-ACC is not clear yet, but the authors’ previous studies found that accident-related congestion reduction has minimal energy and emissions impacts [24,64]. Thus, it is assumed collective-ACC’s accident-reduction impact is negligible. The fundamental diagram analysis showed that collective-ACC does not impact road capacity. Therefore, this technology’s non-accident-related congestion reduction is also minimal. Collective-ACC has a major aerodynamic force reduction impact which directly reduces fuel consumption and emissions. The relationship between collective-ACC’s emissions savings and its MPR is calculated by fitting a polynomial regression model to the data gathered in the traffic simulations (i.e., Figure 9). The operation load is calculated based on the energy consumed by two radars and one-speed control unit. The traffic rebound is expected due to improved fuel efficiency (i.e., fuel economy rebound). However, induced traffic is not expected since collective-ACC has minimal congestion reduction impact (i.e., increase in road capacity). These assumptions and parameters are listed in Table 5. More information is available from the original studies [24,64].

Table 5.
Parameter estimation for collective-ACC’s social cost-saving analysis.
Figure 13 shows the social cost saving of collective-ACC and its sensitivity to MPR. The result demonstrates that collective-ACC could reduce the emissions’ costs by up to USD 35 million per day, equal to about USD 13 billion annually. Collective-ACC could save 65 million metric tons (MMT) CO2, 115 thousand metric tons (TMT) NOX, 1 MMT CO, and 2 TMT PMX annually. This emissions saving extremely depends on MPR and varies from USD 0.2 million per day in 1% MPR to USD 35 million per day at 100% MPR. A reduction in CO2 and NOX generates the most savings.
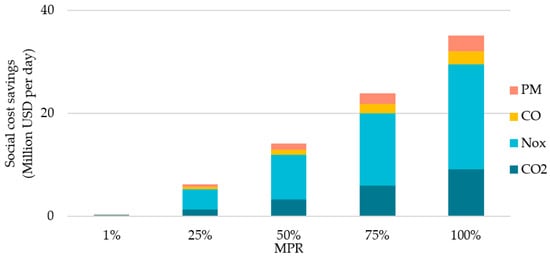
Figure 13.
Social cost saving of collective-ACC in the 86 metropolitan areas by MPR.
The social cost savings are not equally distributed among the urban areas. Figure 14 indicates the distribution of total cost savings and saving per VMT at 50% MPR. The greater Los Angles, New York, and San Diego areas have the highest total savings at USD 2.1, USD 1.3, and USD 0.7 million daily, respectively. Social cost saving per VMT ranges between USD 0.012 and USD 0.001. The greater San Diego, Los Angles, and San Francisco have the highest social cost savings per VMT.
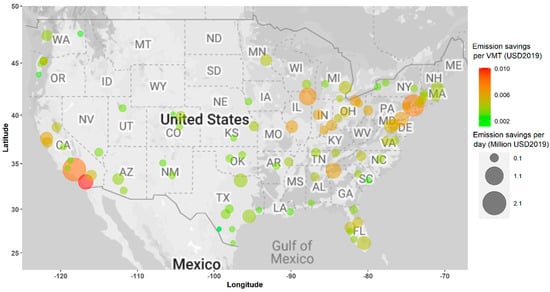
Figure 14.
Distribution of collective-ACC’s social cost savings among the 86 metropolitan areas.
6.3. Stakeholders and Cost-Benefit Analysis
This sub-section investigates how each stakeholder is impacted by adopting collective-ACC technology. The game theory analysis indicated that producing collective-ACC is the Nash equilibrium for automakers. Automakers prefer to produce vehicles with collective-ACC than with self-centered-ACC because collective-ACC provides a higher fuel economy, and consumers are more willing to buy fuel-efficient vehicles.
On the other hand, consumers need a benefit-cost analysis to determine if collective-ACC’s fuel savings could cover its installation cost. Collective-ACC technology is not available yet, and we cannot determine an accurate cost estimation. However, its cost could be estimated based on similar technologies in the market. The most similar technology is ACC, which uses one radar in front and a processing unit. ACC’s cost is estimated between USD 1300 and USD 2500 [65,66]. Collective-ACC needs two radars in front and back, and it may need additional processing power to process the optimization. It is assumed that collective-ACC’s installation cost could be as low as an ACC technology (i.e., lower bound) or as high as two ACC technologies (i.e., upper bound). Thus, collective-ACC’s cost is estimated in the [USD 1300, USD 5000] range.
Collective-ACC’s fuel-saving benefit is calculated based on saved fuel in comparison to manual driving. The return in investment (ROI) period is assumed to be 15 years, the average annual driving is 12,000 miles, and the average gas price is USD 2.6 per gallon [67]. It should be noted that adopting collective-ACC not only saves fuel for the equipped vehicles but also saves fuel for manual vehicles. Hence, if a consumer buys a manual vehicle, he could still benefit from collective-ACC without paying for the technology.
Figure 15 shows the net saving of manual and collective-ACC vehicles over 15 years in different MPR rates. The blue line shows how much a manual vehicle could save at a given MPR of collective-ACC. The red line shows how much a vehicle with collective-ACC could save at a given MPR after paying for the installation cost. The solid red line shows mean saving, and the dash lines show the upper bound (i.e., paying USD 1300 in the installation cost) and the lower bound (i.e., paying USD 5000 in the installation cost).
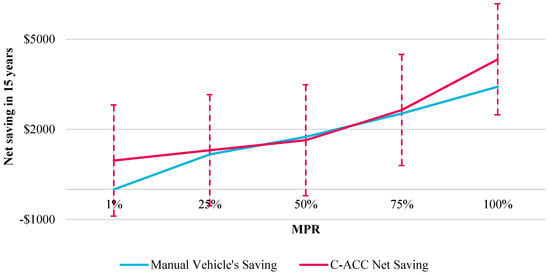
Figure 15.
Manual vehicles and collective-ACC’s net total saving in 15 years. The error bars show collective-ACC’s upper and lower bound net savings depending on installation cost.
Figure 15 explains, if a consumer walks to a vehicle dealer to buy a new vehicle, what type of vehicle (i.e., a manual or a collective-ACC equipped vehicle) would be financially suitable for him/her at a given MPR. At low MPRs (i.e., below 25%), buying a collective-ACC is more favorable because manual cars’ benefits from collective-ACC are negligible. However, installing collective-ACC has a risk of negative savings (i.e., losing money) at low MPRs (i.e., MPR below 50%). In mid-MPRs (i.e., between 25% and 75%), manual vehicles’ saving rapidly grows. Manual vehicles have an almost similar amount of net saving as equipped vehicles. It should be noted that collective-ACC vehicles save much more fuel than manual vehicles, but collective-ACC vehicles pay for the installation cost, which reduces their net savings. At high MPRs (i.e., above 75%), collective-ACC vehicles’ net savings surpass manual vehicles.
Figure 15 indicates that collective-ACC’s appeal to consumers relies on the MPR. In low and high MPRs, this technology is more persuasive for the customer. There is still considerable uncertainty about the final cost of collective-ACC, which could influence customers’ decisions between manual and collective-ACC vehicles.
Manual vehicle owners are the big winner of adopting collective-ACC. They do not pay for the technology, but they benefit from it. They could save up to USD 220 annually in fuel expenses.
The other big winners are environmental protection agencies and activists. Collective-ACC could reduce CO2, CO, NOx, and PMx by up to 48%, 69%, 58%, and 63%, respectively. This saving is equal to USD 13 billion in social cost-saving annually in the 86 urban areas in the U.S. These savings could significantly reduce transportation sectors’ GHG and the social costs of the emissions. This impact could be more considerable in metropolitan areas because collective-ACC provides more fuel and emissions benefits in congested traffic conditions than free-flow. Collective-ACC could save more fuel and emissions in metropolitan areas, where there is high congestion and population density. Lowering emissions in these areas could provide significant social cost savings.
Federal and local transportation agencies (e.g., Federal Department of Transportation) may not directly be impacted by adopting this technology because collective-ACC has negligible impacts on traffic flow. However, improving fuel efficiency decreases driving costs, which results in traffic rebounds [68,69,70]. Driving depreciates infrastructures and increases maintenance costs. On the other hand, fuel-efficient vehicles pay less in fuel tax, which is the primary source of revenue for these agencies. Energy-optimum technologies (e.g., collective-ACC) reduce these agencies’ revenue and increase their maintenance expenses.
Society at large and local governments benefit from adopting collective-ACC. They experience less transportation-related air pollutions. Reducing emissions improves public health and declines social costs. Moreover, society at large benefits when collective-ACC reduces all road users’ fuel consumption. Society and government should support adopting this technology, which provides substantial environmental, public health, and energy benefits. The government’s incentives may accelerate this technology’s adoption and motivate consumers to install this technology when its net benefit for the owners is minimal. Collective-ACC does not require investment in new infrastructure, communication technology, or regulations. Therefore, the governments should concentrate on financial incentives to lower the installation cost and provide financial loans for automakers and startups to produce this technology on a large scale.
6.4. Real-World Applications
This study developed a new energy-optimal algorithm that could be installed on vehicles and launch to the market. This technology does not need any change in infrastructure (e.g., connected traffic lights) or transportation systems (e.g., V2V communications), and all required technologies (i.e., radar and computational unit) are currently available. Moreover, long optimization time is a barrier to commercializing energy-optimal algorithms. We used a metaheuristic optimization method (NSGA-II) along with some optimization techniques (e.g., look-up tables and transforming continuous variables into discrete variables) to make the optimization faster. The algorithm ran in 0.4 s, which makes it easy to commercialize our algorithm for real-world applications.
Our result illustrated that collective-ACC could improve the energy efficacy of vehicles by up to 49%, which provides a significant fuel saving for the consumers. More importantly, this technology could reduce air pollutant emissions between 54% to 64%. These emissions savings could decelerate global warming and provide substantial public health benefits. It is estimated that the social-cost savings of our algorithm could reach up to USD 13 billion annually in the U.S.
In comparison with similar algorithms, collective-ACC provides much higher energy and emissions savings opportunities. Similar studies reported 3% [27] to 27% [31] energy-saving, while our study demonstrated up to 49% energy-saving. Additionally, similar algorithms have indicated negative impacts on traffic flow (e.g., reducing road capacity) [20,21,54], but our algorithm had not shown any adverse effect on traffic flow or road capacity.
7. Conclusions
This study proposed a novel energy-optimal ACC, which improves fuel consumption and emissions. Collective-ACC reduced fuel consumption by up to 49% and 42% from manual driving and self-centered-ACC, respectively, in traffic simulations. It also reduced CO2, CO, NOX, and PMX by up to 54%, 70%, 58%, and 64%, respectively. This finding illustrates emissions savings of up to 320 million metric ton CO2 (i.e., only light-duty vehicles in highway drive) at the national level [24,71]. This saving is equal to 4% of U.S. total GHG emissions. These emissions savings could reduce mortality and morbidity cost of transportation emissions by up to USD 13 billion annually in 86 urban areas in the U.S.
Unlike self-centered ACC, this technology does not have negative impacts on traffic flow. Collective-ACC’s benefits increase as its MPR grows. If more vehicles are equipped with this technology, collective-ACC saves more fuel and emissions for the vehicles’ owners and manual vehicles. Adopting Collective-ACC technology could reduce manual vehicles’ fuel consumption by up to 19%. This saving depends on the traffic flow level. Manual vehicles save up to 12% in low traffic flow, but manual vehicles could achieve 19% fuel saving in high traffic flow.
The game theory and stakeholders analyses showed that environmental protection agencies and activists, road users, and society are the big winners of adopting collective-ACC. This technology provides significant social cost savings for society. Collective-ACC aids our society in mitigating global warming. This technology saves fuel for all road users. Buying vehicles with collective-ACC may not be financially reasonable in mid-MPRs (i.e., 25% to 75%) because owning this technology does not provide enough financial benefits to attract consumers. Hence, government incentives (e.g., tax incentives) could be essential to boost adopting this technology, which will benefit society.
This study provides multiple future work opportunities. First, collective driving is a broad concept proposed by this study. This concept could be applied for CACC, roads with signalized intersections, hilly roads, and highly automated vehicles. Considering these technologies’ direct and indirect impacts and optimizing their network-level impacts could boost their benefits for the vehicle owners and society. Second, this study tested the algorithm in a traffic simulation. Testing the algorithm in a testbed would be a critical step in illustrating collective-ACC’s real-world performance. Third, it should be noted that the game theory analysis in this study has some limitations. The final cost of collective-ACC is estimated based on its installation/manufacturing costs. The final cost should consider overhead costs (e.g., R&D cost, marketing expenses, and new technology surcharges). Automakers decide between self-centered-ACC and collective-ACC based on multiple factors (e.g., the final cost of the product, convenience in production and supply, and their target market’s preferences). These factors should be included in future studies.
Author Contributions
Conceptualization, S.V. and Y.M.H.; methodology, S.V. and Y.M.H.; software, S.V.; validation, S.V. and Y.M.H.; data curation, S.V.; writing—original draft preparation, S.V.; writing—review and editing, Y.M.H.; visualization, S.V.; supervision, Y.M.H.; project administration, Y.M.H. All authors have read and agreed to the published version of the manuscript.
Funding
This research received no external funding.
Institutional Review Board Statement
Not applicable.
Informed Consent Statement
Not applicable.
Acknowledgments
The authors acknowledge and are grateful to Paul Grogan, Thomas Stephens, and Andrew Eilbert for their comments and contributions to this research project.
Conflicts of Interest
The authors declare no conflict of interest.
References
- PEW. Research Center for the First Time, Environmental Protection Rivals the Economy among the Public’s Top Policy Priorities. Available online: https://www.people-press.org/2020/02/13/as-economic-concerns-recede-environmental-protection-rises-on-the-publics-policy-agenda/pp_2020-02-13_political-priorities_0-01/ (accessed on 20 February 2020).
- Caiazzo, F.; Ashok, A.; Waitz, I.A.; Yim, S.H.L.; Barrett, S.R.H. Air Pollution and Early Deaths in the United States. Part I: Quantifying the Impact of Major Sectors in 2005. Atmos. Environ. 2013, 79, 198–208. [Google Scholar] [CrossRef]
- United States Environmental Protection Agency (EPA). Fast Facts: U.S. Transportation Sector Greenhouse Gas Emissions, 1990–2017; EPA: Washington, DC, USA, 2018.
- National Highway Traffic Safety Administration. Traffic Safety Facts: 2018; NHTSA: Washington, DC, USA, 2019.
- Guanetti, J.; Kim, Y.; Borrelli, F. Control of Connected and Automated Vehicles: State of the Art and Future Challenges. Annu. Rev. Control 2018, 45, 18–40. [Google Scholar] [CrossRef]
- David, J.; Brom, P.; Starý, F.; Bradáč, J.; Dynybyl, V. Application of Artificial Neural Networks to Streamline the Process of Adaptive Cruise Control. Sustainability 2021, 13, 4572. [Google Scholar] [CrossRef]
- Yin, B.; Menendez, M.; Yang, K. Joint Optimization of Intersection Control and Trajectory Planning Accounting for Pedestrians in a Connected and Automated Vehicle Environment. Sustainability 2021, 13, 1135. [Google Scholar] [CrossRef]
- Yang, H.; Jin, W.-L. A Control Theoretic Formulation of Green Driving Strategies Based on Inter-Vehicle Communications. Transp. Res. Part C Emerg. Technol. 2014, 41, 48–60. [Google Scholar] [CrossRef]
- Jin, Q.; Wu, G.; Boriboonsomsin, K.; Barth, M.J. Power-Based Optimal Longitudinal Control for a Connected Eco-Driving System. IEEE Trans. Intell. Transp. Syst. 2016, 17, 2900–2910. [Google Scholar] [CrossRef]
- Vajedi, M.; Azad, N.L. Ecological Adaptive Cruise Controller for Plug-In Hybrid Electric Vehicles Using Nonlinear Model Predictive Control. IEEE Trans. Intell. Transp. Syst. 2016, 17, 113–122. [Google Scholar] [CrossRef]
- Wu, G.; Kari, D.; Qi, X.; Boriboonsomsin, K.; Barth, M.J. Developing and Evaluating an Eco-Speed Harmonization Strategy for Connected Vehicles. In Proceedings of the 2015 International Conference on Connected Vehicles and Expo (ICCVE), Shenzhen, China, 19–23 October 2015; IEEE: Piscataway, NJ, USA, 2015; pp. 373–378. [Google Scholar]
- Park, S.; Rakha, H.; Ahn, K.; Moran, K. Predictive Eco-Cruise Control: Algorithm and Potential Benefits. In Proceedings of the 2011 IEEE Forum on Integrated and Sustainable Transportation Systems, Vienna, Austria, 29 June–1 July 2011; IEEE: Piscataway, NJ, USA, 2011; pp. 394–399. [Google Scholar]
- Tajalli, M.; Hajbabaie, A. Dynamic Speed Harmonization in Connected Urban Street Networks. Comput. Civ. Infrastruct. Eng. 2018, 33, 510–523. [Google Scholar] [CrossRef]
- Yang, H.; Rakha, H. Feedback Control Speed Harmonization Algorithm: Methodology and Preliminary Testing. Transp. Res. Part C Emerg. Technol. 2017, 81, 209–226. [Google Scholar] [CrossRef]
- Dowling, R.; Nevers, B.; Jia, A.; Skabardonis, A.; Krause, C.; Vasudevan, M. Performance Benefits of Connected Vehicles for Implementing Speed Harmonization. Transp. Res. Procedia 2016, 15, 459–470. [Google Scholar] [CrossRef][Green Version]
- Hong, S.; Andreas, A.; Malikopoulos, J.L. Development and evaluation of speed harmonization using optimal control theory: A simulation-based case study at a speed reduction zone. In Annu. Meeting Transp. Res. Board (TRB); Intergovernmental Panel on Climate Change, Ed.; Cambridge University Press: Cambridge, UK, 2017; Volume 1, pp. 1–30. ISBN 9788578110796. [Google Scholar]
- Mamouei, M.; Kaparias, I.; Halikias, G. A Framework for User- and System-Oriented Optimisation of Fuel Efficiency and Traffic Flow in Adaptive Cruise Control. Transp. Res. Part C Emerg. Technol. 2018, 92, 27–41. [Google Scholar] [CrossRef]
- Mamouei, M.H.; Kaparias, I.; Galatioto, F. Validation of a System-Level Fuel Economy Based Control Method for Autonomous Vehicles. In Proceedings of the Universities’ Transport Study Group Executive Committee, Loughborough, UK, 31 March 2018; pp. 1–10. Available online: https://eprints.soton.ac.uk/416878/1/4_54.pdf (accessed on 5 July 2021).
- Shi, Y.; Li, Y.; Cai, Q.; Zhang, H.; Wu, D. How Does Heterogeneity Affect Freeway Safety? A Simulation-Based Exploration Considering Sustainable Intelligent Connected Vehicles. Sustainability 2020, 12, 8941. [Google Scholar] [CrossRef]
- McConky, K.; Rungta, V. Don’t Pass the Automated Vehicles! Transp. Res. Part C Emerg. Technol. 2019, 100, 289–305. [Google Scholar] [CrossRef]
- Xin, W.; Moonam, H. Connected Eco-Driving Technologies for Adaptive Traffic Signal Control; New York State Energy Research and Development Authority: Albany, NY, USA, 2019.
- Hattori, M.; Shimizu, O.; Nagai, S.; Fujimoto, H.; Sato, K.; Takeda, Y.; Nagashio, T. Quadrant Dynamic Programming for Optimizing Velocity of Ecological Adaptive Cruise Control. IEEE/ASME Trans. Mechatron. 2021, 4435, 1. [Google Scholar] [CrossRef]
- Jia, Y.; Gorges, D. Energy-Optimal Adaptive Cruise Control Based on Hybrid Model Predictive Control with Mixed-Integer Quadratic Programming. In Proceedings of the 2020 European Control Conference (ECC), Saint Petersburg, Russia, 12–15 May 2020; IEEE: Piscataway, NJ, USA, 2020; pp. 686–692. [Google Scholar]
- Sakhdari, B.; Vajedi, M.; Azad, N.L. Ecological Adaptive Cruise Control of a Plug-in Hybrid Electric Vehicle for Urban Driving. In Proceedings of the 2016 IEEE 19th International Conference on Intelligent Transportation Systems (ITSC), Rio de Janeiro, Brazil, 1–4 November 2016; IEEE: Piscataway, NJ, USA, 2016; pp. 1739–1744. [Google Scholar]
- Vasebi, S.; Hayeri, Y.; Samaras, C.; Hendrickson, C. Low-Level Automated Light-Duty Vehicle Technologies Provide Opportunities to Reduce Fuel Consumption. Transp. Res. Rec. J. Transp. Res. Board 2018, 2672, 60–74. [Google Scholar] [CrossRef]
- Liu, Y.; Wang, W.; Hua, X.; Wang, S. Safety Analysis of a Modified Cooperative Adaptive Cruise Control Algorithm Accounting for Communication Delay. Sustainability 2020, 12, 7568. [Google Scholar] [CrossRef]
- Kamalanathsharma, R.K.; Rakha, H. Agent-Based Modeling of Eco-Cooperative Adaptive Cruise Control Systems in the Vicinity of Intersections. In Proceedings of the 2012 15th International IEEE Conference on Intelligent Transportation Systems, Anchorage, AK, USA, 16–19 September 2012; IEEE: Piscataway, NJ, USA, 2021; pp. 840–845. [Google Scholar]
- Lin, Y.-C.; Hsu, H.-C.; Kuo, I.-C. An Eco-Cruising Control Systems Using Nonlinear Predictive Control Approach. In Proceedings of the International Automatic Control Conference (CACS), Taichung, Taiwan, 9–11 November 2016; IEEE: Piscataway, NJ, USA, 2016; pp. 59–64. [Google Scholar]
- Kamal, M.A.S.; Taguchi, S.; Yoshimura, T. Efficient Vehicle Driving on Multi-Lane Roads Using Model Predictive Control under a Connected Vehicle Environment. In Proceedings of the 2015 IEEE Intelligent Vehicles Symposium (IV), Seoul, Korea, 28 June–1 July 2015; IEEE: Piscataway, NJ, USA, 2015; Volume 2015, pp. 736–741. [Google Scholar]
- Wang, M.; Hoogendoorn, S.; Daamen, W.; van Arem, B. Potential Impacts of Ecological Adaptive Cruise Control Systems on Traffic and Environment. IET Intell. Transp. Syst. 2014, 8, 77–86. [Google Scholar] [CrossRef]
- Saerens, B.; Rakha, H.A.; Diehl, M.; Van den Bulck, E. A Methodology for Assessing Eco-Cruise Control for Passenger Vehicles. Transp. Res. Part D Transp. Environ. 2013, 19, 20–27. [Google Scholar] [CrossRef]
- Ahn, K.; Rakha, H.A.; Park, S. Ecodrive Application: Algorithmic Development and Preliminary Testing. Transp. Res. Rec. J. Transp. Res. Board 2013, 2341, 1–11. [Google Scholar] [CrossRef]
- Tajeddin, S.; Ekhtiari, S.; Faieghi, M.; Azad, N.L. Ecological Adaptive Cruise Control With Optimal Lane Selection in Connected Vehicle Environments. IEEE Trans. Intell. Transp. Syst. 2019, 1–12. [Google Scholar] [CrossRef]
- Weißmann, A.; Görges, D.; Lin, X. Energy-Optimal Adaptive Cruise Control Combining Model Predictive Control and Dynamic Programming. Control Eng. Pract. 2018, 72, 125–137. [Google Scholar] [CrossRef]
- Weißmann, A.; Görges, D.; Lin, X. Energy-Optimal Adaptive Cruise Control Based on Model Predictive Control. IFAC-PapersOnLine 2017, 50, 12563–12568. [Google Scholar] [CrossRef]
- Wang, Z.; Wu, G.; Barth, M.J. A Review on Cooperative Adaptive Cruise Control (CACC) Systems: Architectures, Controls, and Applications. In Proceedings of the 2018 21st International Conference on Intelligent Transportation Systems (ITSC), Maui, HI, USA, 4–7 November 2018; IEEE: Piscataway, NJ, USA, 2018; Volume 2018, pp. 2884–2891. [Google Scholar]
- El Ganaoui-Mourlan, O.; Camp, S.; Hannagan, T.; Arora, V.; De Neuville, M.; Kousournas, V.A. Path Planning for Autonomous Platoon Formation. Sustainability 2021, 13, 4668. [Google Scholar] [CrossRef]
- Moskwa, J.J.; Hedrick, J.K. Nonlinear Algorithms for Automotive Engine Control. IEEE Control Syst. Mag. 1990, 10, 88–93. [Google Scholar] [CrossRef]
- Mensing, F.; Trigui, R.; Bideaux, E. Vehicle Trajectory Optimization for Application in ECO-Driving. In Proceedings of the 2011 IEEE Vehicle Power and Propulsion Conference, Chicago, IL, USA, 5–8 September 2011; IEEE: Piscataway, NJ, USA, 2011; pp. 1–6. [Google Scholar]
- Huang, X.; Sun, J.; Sun, J. A Car-Following Model Considering Asymmetric Driving Behavior Based on Long Short-Term Memory Neural Networks. Transp. Res. Part C Emerg. Technol. 2018, 95, 346–362. [Google Scholar] [CrossRef]
- Ghiasi, A.; Ma, J.; Zhou, F.; Li, X. Speed Harmonization Algorithm Using Connected Autonomous Vehicles. In Proceedings of the 96th Annual Meeting of the Transportation Research Board, Washington, DC, USA, 8–12 January 2017; pp. 145–161. [Google Scholar]
- Yu, S.; Shi, Z. An Extended Car-Following Model Considering Vehicular Gap Fluctuation. Measurement 2015, 70, 137–147. [Google Scholar] [CrossRef]
- Englund, C.; Chen, L.; Voronov, A. Cooperative Speed Harmonization for Efficient Road Utilization. In Proceedings of the 2014 7th International Workshop on Communication Technologies for Vehicles (Nets4Cars-Fall), Saint Petersburg, Russia, 6–8 October 2014; IEEE: Piscataway, NJ, USA, 2014; pp. 19–23. [Google Scholar]
- Phillips, A.M.; Jankovic, M.; Bailey, K.E. Vehicle System Controller Design for a Hybrid Electric Vehicle. In Proceedings of the 2000 IEEE International Conference on Control Applications. Conference Proceedings (Cat. No.00CH37162), Anchorage, AK, USA, 27 September 2000; IEEE: Piscataway, NJ, USA, 2002; pp. 297–302. [Google Scholar]
- Sun, Y.; Ge, H.; Cheng, R. An Extended Car-Following Model under V2V Communication Environment and Its Delayed-Feedback Control. Phys. A Stat. Mech. Appl. 2018, 508, 349–358. [Google Scholar] [CrossRef]
- Zhang, J.; Ioannou, P. Longitudinal Control of Heavy Trucks in Mixed Traffic: Environmental and Fuel Economy Considerations. IEEE Trans. Intell. Transp. Syst. 2006, 7, 92–104. [Google Scholar] [CrossRef]
- Lim, H.; Mi, C.C.; Su, W. A Distance-Based Two-Stage Ecological Driving System Using an Estimation of Distribution Algorithm and Model Predictive Control. IEEE Trans. Veh. Technol. 2017, 66, 6663–6675. [Google Scholar] [CrossRef]
- Bertoni, L.; Guanetti, J.; Basso, M.; Masoero, M.; Cetinkunt, S.; Borrelli, F. An Adaptive Cruise Control for Connected Energy-Saving Electric Vehicles. IFAC-PapersOnLine 2017, 50, 2359–2364. [Google Scholar] [CrossRef]
- Jia, Y.; Cai, C.; Gorges, D. An LSTM-Based Speed Predictor Based on Traffic Simulation Data for Improving the Performance of Energy-Optimal Adaptive Cruise Control. In Proceedings of the 2020 IEEE 23rd International Conference on Intelligent Transportation Systems (ITSC), Rhodes, Greece, 20–23 September 2020; IEEE: Piscataway, NJ, USA, 2020; pp. 1–7. [Google Scholar]
- Jia, D.; Chen, H.; Zheng, Z.; Watling, D.; Connors, R.; Gao, J.; Li, Y. An Enhanced Predictive Cruise Control System Design with Data-Driven Traffic Prediction. IEEE Trans. Intell. Transp. Syst. 2021, 1–14. [Google Scholar] [CrossRef]
- Jia, Y.; Jibrin, R.; Itoh, Y.; Görges, D. Energy-Optimal Adaptive Cruise Control for Electric Vehicles in Both Time and Space Domain Based on Model Predictive Control. IFAC-PapersOnLine 2019, 52, 13–20. [Google Scholar] [CrossRef]
- Han, J.; Karbowski, D.; Kim, N. Closed-Form Solutions for a Real-Time Energy-Optimal and Collision-Free Speed Planner with Limited Information. In Proceedings of the 2020 American Control Conference (ACC), Denver, CO, USA, 1–3 July 2020; IEEE: Piscataway, NJ, USA, 2020; Volume 2020, pp. 268–275. [Google Scholar]
- Huang, Y.; Ng, E.C.Y.; Zhou, J.L.; Surawski, N.C.; Chan, E.F.C.; Hong, G. Eco-Driving Technology for Sustainable Road Transport: A Review. Renew. Sustain. Energy Rev. 2018, 93, 596–609. [Google Scholar] [CrossRef]
- He, Y.; Makridis, M.; Fontaras, G.; Mattas, K.; Xu, H.; Ciuffo, B. The Energy Impact of Adaptive Cruise Control in Real-World Highway Multiple-Car-Following Scenarios. Eur. Transp. Res. Rev. 2020, 12, 17. [Google Scholar] [CrossRef]
- Yang, Z.; Wang, Z.; Yan, M. An Optimization Design of Adaptive Cruise Control System Based on MPC and ADRC. Actuators 2021, 10, 110. [Google Scholar] [CrossRef]
- Hoberock, L. A Survey of Longitudinal Acceleration Comfort Studies in Ground Transportation Vehicles. J. Dyn. Sys. Meas. Control 1976, 99, 76–84. [Google Scholar] [CrossRef]
- Li, S.E.; Deng, K.; Zheng, Y.; Peng, H. Effect of Pulse-and-Glide Strategy on Traffic Flow for a Platoon of Mixed Automated and Manually Driven Vehicles. Comput. Civ. Infrastruct. Eng. 2015, 30, 892–905. [Google Scholar] [CrossRef]
- Sachenbacher, M.; Williams, B.C. Conflict-Directed A Search for Soft Constraints. In International Conference on Integration of Artificial Intelligence (AI) and Operations Research (OR) Techniques in Constraint Programming; Springer: Berlin/Heidelberg, Germany, 2006; pp. 182–196. [Google Scholar]
- Othman, B.; De Nunzio, G.; Di Domenico, D.; Canudas-de-Wit, C. Ecological Traffic Management: A Review of the Modeling and Control Strategies for Improving Environmental Sustainability of Road Transportation. Annu. Rev. Control 2019, 48, 292–311. [Google Scholar] [CrossRef]
- Ahn, K. Microscopic Fuel Consumption and Emission Modeling; Virginia Tech: Blacksburg, VA, USA, 1998. [Google Scholar]
- Keller, M.; Koch, P.; Heldstab, J.; Staub, B.D. Handbook Emission Factors for Road Transport; Fachbibliothek Umwelt Berlin, Bern Swiss Agency for the Environment, Forests and Landscape, Ed.; INFRAS Bern: Bern, Switzerland, 1999; Available online: https://www.hbefa.net/e/index.html (accessed on 10 July 2021).
- Miettinen, K. Nonlinear Multiobjective Optimization; Springer Science & Business Media: Berlin/Heidelberg, Germany, 2012; ISBN 978-1-4615-5563-6. [Google Scholar]
- Yang, H.; Andres, L.; Sun, Z.; Gan, Q.; Jin, W.-L. Field Tests of a Dynamic Green Driving Strategy Based on Inter-Vehicle Communication. Transp. Res. Part D Transp. Environ. 2018, 59, 289–300. [Google Scholar] [CrossRef]
- Deb, K.; Pratap, A.; Agarwal, S.; Meyarivan, T. A Fast and Elitist Multiobjective Genetic Algorithm: NSGA-II. IEEE Trans. Evol. Comput. 2002, 6, 182–197. [Google Scholar] [CrossRef]
- Lopez, P.A.; Wiessner, E.; Behrisch, M.; Bieker-Walz, L.; Erdmann, J.; Flotterod, Y.-P.; Hilbrich, R.; Lucken, L.; Rummel, J.; Wagner, P. Microscopic Traffic Simulation Using SUMO. In Proceedings of the 2018 21st International Conference on Intelligent Transportation Systems (ITSC), Maui, HI, USA, 4–7 November 2018; IEEE: Piscataway, NJ, USA, 2018; pp. 2575–2582. [Google Scholar]
- Vasebi, S.; Hayeri, Y.M. Air Emission Impacts of Low-Level Automated Vehicle Technologies in U.S. Metropolitan Areas. Transp. Res. Interdiscip. Perspect. 2020, 7, 100194. [Google Scholar] [CrossRef]
- Linder, K. 23 Cheapest Cars with Adaptive Cruise Control in 2020. Available online: https://cars.usnews.com/cars-trucks/cheapest-cars-with-adaptive-cruise-control (accessed on 10 October 2020).
- Howard, B. What Is Adaptive Cruise Control, and How Does It Work? Available online: https://www.extremetech.com/extreme/157172-what-is-adaptive-cruise-control-and-how-does-it-work#:~:text=Expecttopay%242%2C000-%24,control%2Corradarcruisecontrol (accessed on 10 October 2020).
- U.S. Energy Information Administration. U.S. Average Retail Gasoline Prices in 2019. Available online: https://www.eia.gov/todayinenergy/detail.php?id=42435 (accessed on 10 October 2020).
- Hymel, K.; Small, K.; Dender, K. Van Induced Demand and Rebound Effects in Road Transport. Transp. Res. Part B Methodol. 2010, 44, 1220–1241. [Google Scholar] [CrossRef]
- Barr, L.C. Testing for the Significance of Induced Highway Travel Demand in Metropolitan Areas. Transp. Res. Rec. J. Transp. Res. Board 2000, 1706, 1–8. [Google Scholar] [CrossRef]
Publisher’s Note: MDPI stays neutral with regard to jurisdictional claims in published maps and institutional affiliations. |
© 2021 by the authors. Licensee MDPI, Basel, Switzerland. This article is an open access article distributed under the terms and conditions of the Creative Commons Attribution (CC BY) license (https://creativecommons.org/licenses/by/4.0/).