
Knowledge Discovery from Healthcare Electronic Records for Sustainable Environment


 , ,
, ,
Abstract
:1. Introduction
2. Related Work
2.1. Correlations through Association Analysis
2.2. Medical Pathways through Sequential Pattern Mining
2.3. Discovering Groups through Clustering
3. Fundamental Concepts of Data Mining Techniques
3.1. Association Analysis
3.2. Sequential Pattern Mining
3.3. Clustering
3.3.1. Clustering Techniques
3.3.2. Proximity Functions
3.3.3. Evaluation Indices
4. Knowledge Discovery from Real Healthcare Data—A Case Study
4.1. Healthcare Electronic Records
4.2. Association Analysis
4.3. Sequential Pattern Mining
4.4. Clustering
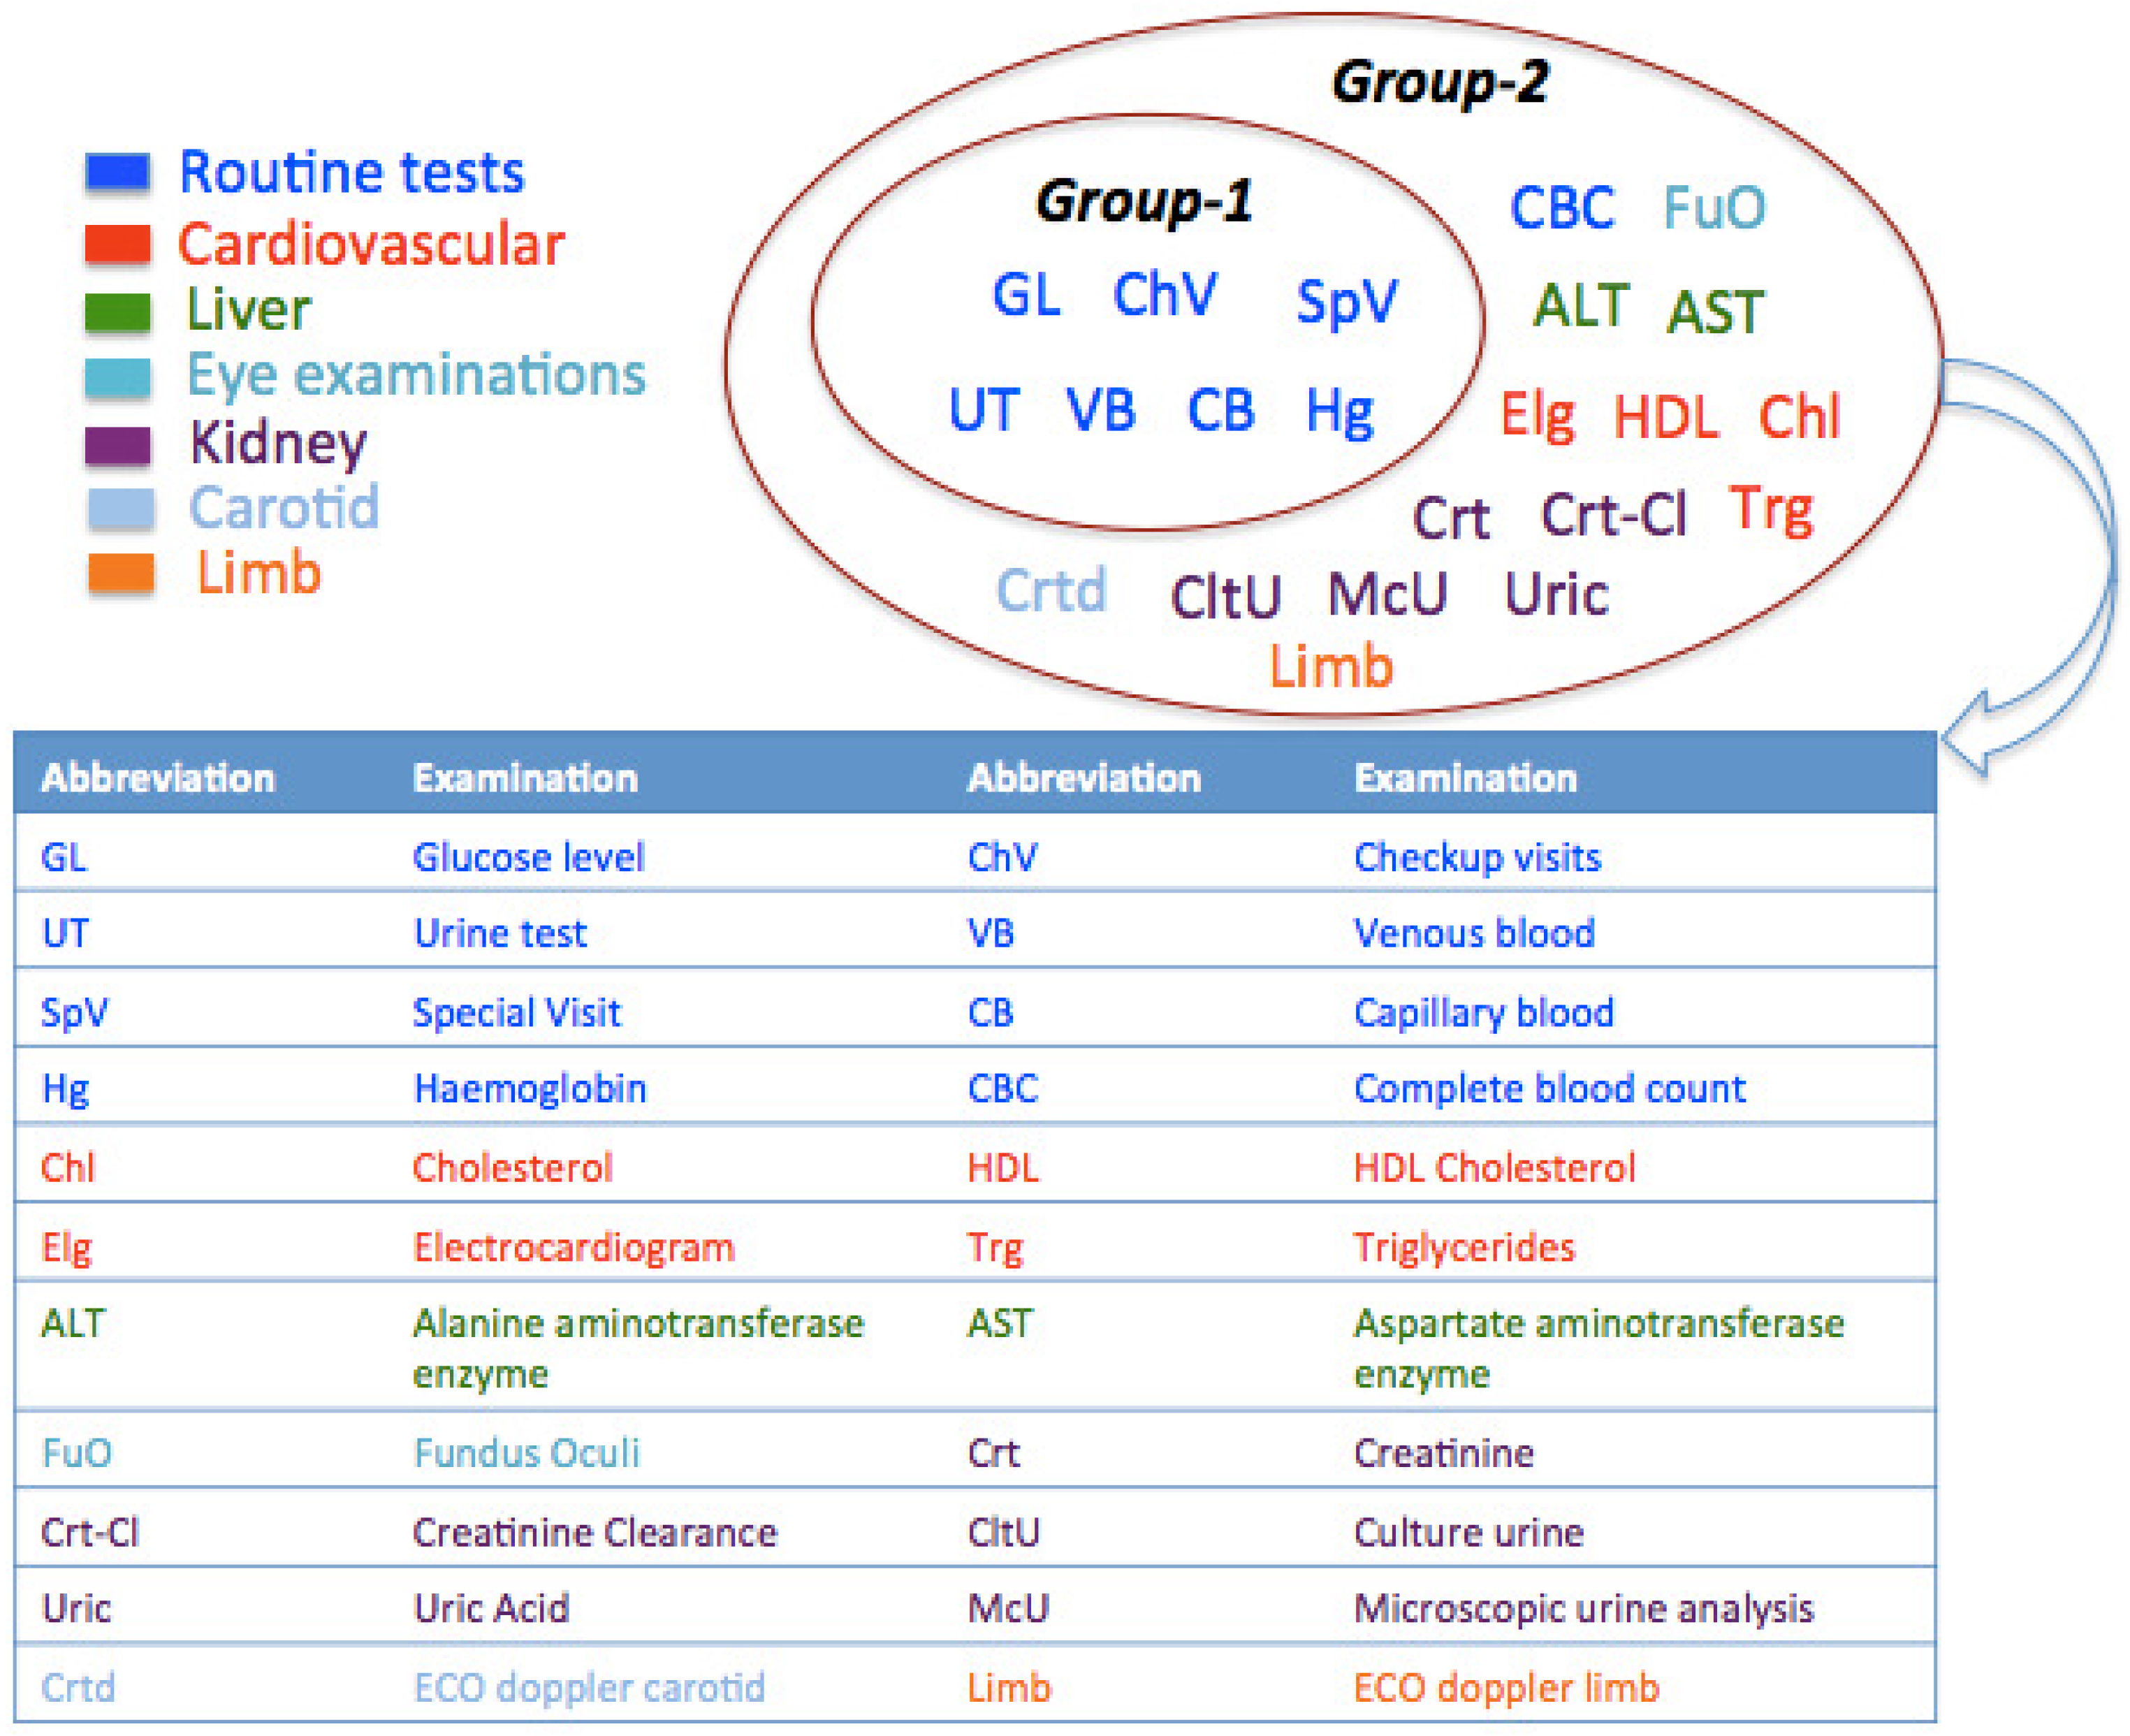
- Group 1, – clusters: This group of clusters contained the two largest clusters ( and ) having patients who have been examined for standard routine tests. In addition to routine examinations, patients of had a specialistic visit for the detection of diabetes complications. The patients of and merely visited for routine check-ups. These patients in and have undergone private diagnostic examinations and reported results in the healthcare agency.
- Group 2, – clusters: It was analyzed that the patients in clusters – have been tested additionally for diabetes complications in: (i) eye (); (ii) cardiovascular system (); (iii) both eye and cardiovascular system (); (iv) carotid (); (v) limb (). Finally, Cluster comprised patients who underwent tests for liver, kidneys and cardiovascular. Besides, standard routine diagnostic examinations have also been observed in – to be comparatively less than those of clusters –.
5. Conclusions and Future Work
Author Contributions
Funding
Conflicts of Interest
References
- Tien, J.M.; Goldschmidt-Clermont, P.J. Healthcare: A complex service system. J. Syst. Sci. Syst. Eng. 2009, 18, 257–282. [Google Scholar] [CrossRef]
- El-Sappagh, S.H.; El-Masri, S.; Riad, A.M.; Elmogy, M. Data Mining and Knowledge Discovery: Applications, Techniques, Challenges and Process Models in Healthcare. Int. J. Eng. Res. Appl. 2013, 3, 900–906. [Google Scholar]
- Schmidt, S.; Vuillermin, P.; Jenner, B.; Ren, Y.; Li, G.; Chen, Y.P.P. Mining Medical Data: Bridging the Knowledge Divide. In Proceedings of the eResearch Australasia, Melbourne, Australia, 28 September–3 October 2008; pp. 1–10. [Google Scholar]
- Simon, S.; Kaushal, R.; Cleary, P.; Jenter, C.; Volk, L.; Orav, E.; Burdick, E.; Poon, E.; Bates, D. Physicians and electronic health records: A statewide survey. Arch. Intern. Med. 2007, 167, 507. [Google Scholar] [CrossRef] [PubMed]
- Prather, J.C.; Lobach, D.F.; Goodwin, L.K.; Hales, J.W.; Hage, M.L.; Hammond, W.E. Medical data mining: Knowledge discovery in a clinical data warehouse. In Proceedings of the AMIA Annual Fall Symposium, Nashville, TN, USA, 25–29 October 1997; pp. 101–105. [Google Scholar]
- Sumathi, S.; Sivanandam, S. Introduction to Data Mining and Its Applications; Springer: Berlin/Heidelberg, Germany, 2006; Volume 29, ISSN 1860-9503. [Google Scholar]
- Antonelli, D.; Baralis, E.M.; Chiusano, S.A.; Mahoto, N.A.; Bruno, G.; Petrigni, C. Extraction of medical pathways from electronic patient records. In Medical Applications of Intelligent Data Analysis: Research Advancements; IGI Global: Hershey, PA, USA, 2012; pp. 273–289. [Google Scholar]
- Lakshmi, K.; Kumar, G.S. Association rule extraction from medical transcripts of diabetic patients. In Proceedings of the 2014 Fifth International Conference on the Applications of Digital Information and Web Technologies (ICADIWT), Chennai, India, 17–19 February 2014; pp. 201–206. [Google Scholar]
- Ilayaraja, M.; Meyyappan, T. Mining medical data to identify frequent diseases using Apriori algorithm. In Proceedings of the 2013 International Conference on Pattern Recognition, Informatics and Medical Engineering (PRIME), Tamilnadu, India, 21–22 February 2013; pp. 194–199. [Google Scholar]
- Khaing, H.W. Data mining based fragmentation and prediction of medical data. In Proceedings of the 2011 3rd International Conference on Computer Research and Development (ICCRD), Shanghai, China, 11–13 March 2011; Volume 2, pp. 480–485. [Google Scholar]
- Antonelli, D.; Bruno, G.; Chiusano, S. Anomaly detection in medical treatment to discover unusual patient management. IIE Trans. Healthc. Syst. Eng. 2013, 3, 69–77. [Google Scholar] [CrossRef]
- Berlingerio, M.; Bonchi, F.; Giannotti, F.; Turini, F. Mining clinical data with a temporal dimension: A case study. In Proceedings of the 2007 IEEE International Conference on Bioinformatics and Biomedicine (BIBM 2007), Fremont, CA, USA, 2–4 November 2007; pp. 429–436. [Google Scholar]
- Sawacha, Z.; Guarneri, G.; Avogaro, A.; Cobelli, C. A new classification of diabetic gait pattern based on cluster analysis of biomechanical data. J. Diabetes Sci. Technol. 2010, 4. [Google Scholar] [CrossRef] [PubMed] [Green Version]
- van Rooden, S.M.; Colas, F.; Martínez-Martín, P.; Visser, M.; Verbaan, D.; Marinus, J.; Chaudhuri, R.K.; Kok, J.N.; van Hilten, J.J. Clinical subtypes of Parkinson’s disease. Mov. Disord. 2011, 26, 51–58. [Google Scholar] [CrossRef]
- Antonelli, D.; Baralis, E.; Bruno, G.; Cerquitelli, T.; Chiusano, S.; Mahoto, N. Analysis of diabetic patients through their examination history. Expert Syst. Appl. 2013, 40, 4672–4678. [Google Scholar] [CrossRef] [Green Version]
- Subasi, A.; Radhwan, M.; Kurdi, R.; Khateeb, K. IoT based mobile healthcare system for human activity recognition. In Proceedings of the 15th Learning and Technology Conference (L&T), Jeddah, Saudi Arabia, 25–26 February 2018; pp. 29–34. [Google Scholar]
- Kumar, S.R.; Gayathri, N.; Muthuramalingam, S.; Balamurugan, B.; Ramesh, C.; Nallakaruppan, M. Medical big data mining and processing in e-healthcare. In Internet of Things in Biomedical Engineering; Elsevier: Amsterdam, The Netherlands, 2019; pp. 323–339. [Google Scholar]
- Rose, K. Deterministic annealing for clustering, compression, classification, regression, and related optimization problems. Proc. IEEE 1998, 86, 2210–2239. [Google Scholar] [CrossRef] [Green Version]
- Singh, P.; Singh, S.; Pandi-Jain, G.S. Effective heart disease prediction system using data mining techniques. Int. J. Nanomed. 2018, 13, 121–124. [Google Scholar] [CrossRef] [PubMed] [Green Version]
- Perçın, İ.; Yağin, F.H.; Güldoğan, E.; Yoloğlu, S. ARM: An Interactive Web Software for Association Rules Mining and an Application in Medicine. In Proceedings of the 2019 International Artificial Intelligence and Data Processing Symposium (IDAP), Malatya, Turkey, 21–22 September 2019; pp. 1–5. [Google Scholar]
- Nuwangi, S.; Oruthotaarachchi, C.; Tilakaratna, J.; Caldera, H. Usage of association rules and classification techniques in knowledge extraction of diabetes. In Proceedings of the 2010 6th International Conference on Advanced Information Management and Service (IMS), Seoul, Korea, 30 November–2 December 2010; pp. 372–377. [Google Scholar]
- Chen, Y.; Pedersen, L.; Chu, W.; Olsen, J. Drug exposure side effects from mining pregnancy data. ACM SIGKDD Explor. Newsl. 2007, 9, 22–29. [Google Scholar] [CrossRef]
- Krysiak-Baltyn, K.; Nordahl Petersen, T.; Audouze, K.; Jørgensen, N.; Ängquist, L.; Brunak, S. Compass: A hybrid method for clinical and biobank data mining. J. Biomed. Inform. 2014, 47, 160–170. [Google Scholar] [CrossRef]
- Mohanty, A.K.; Senapati, M.R.; Lenka, S.K. An improved data mining technique for classification and detection of breast cancer from mammograms. Neural Comput. Appl. 2013, 22, 303–310. [Google Scholar] [CrossRef]
- Qiang, Y.; Guo, Y.; Li, X.; Wang, Q.; Chen, H.; Cuic, D. The diagnostic rules of peripheral lung cancer preliminary study based on data mining technique. J. Nanjing Med. Univ. 2007, 21, 190–195. [Google Scholar] [CrossRef]
- Zikeba, M.; Tomczak, J.M.; Lubicz, M.; Świkatek, J. Boosted SVM for extracting rules from imbalanced data in application to prediction of the post-operative life expectancy in the lung cancer patients. Appl. Soft Comput. 2014, 14, 99–108. [Google Scholar]
- Ordonez, C. Association rule discovery with the train and test approach for heart disease prediction. IEEE Trans. Inf. Technol. Biomed. 2006, 10, 334–343. [Google Scholar] [CrossRef]
- Nahar, J.; Imam, T.; Tickle, K.S.; Chen, Y.P.P. Association rule mining to detect factors which contribute to heart disease in males and females. Expert Syst. Appl. 2013, 40, 1086–1093. [Google Scholar] [CrossRef]
- Shmiel, O.; Shmiel, T.; Dagan, Y.; Teicher, M. Data mining techniques for detection of sleep arousals. J. Neurosci. Methods 2009, 179, 331–337. [Google Scholar] [CrossRef] [PubMed]
- Brossette, S.; Sprague, A.; Jones, W.; Moser, S. A data mining system for infection control surveillance. Methods Inf. Med. 2000, 39, 303–310. [Google Scholar] [CrossRef]
- Chen, T.J.; Chou, L.F.; Hwang, S.J. Application of a data-mining technique to analyze coprescription patterns for antacids in Taiwan. Clin. Ther. 2003, 25, 2453–2463. [Google Scholar] [CrossRef]
- Jensen, S. Mining medical data for predictive and sequential patterns. In Proceedings of the Fifth European Conference on Principles and Practice of Knowledge Discovery in Databases, Freiburg, Germany, 3–5 September 2001; pp. 1–10. [Google Scholar]
- Dart, T.; Cui, Y.; Chatellier, G.; Degoulet, P. Analysis of hospitalised patient flows using data-mining. Stud. Health Technol. Inform. 2002, 95, 263–268. [Google Scholar]
- Rossille, D.; Cuggia, M.; Arnault, A.; Bouget, J.; Le Beux, P. Managing an emergency department by analysing HIS medical data: A focus on elderly patient clinical pathways. Health Care Manag. Sci. 2008, 11, 139–146. [Google Scholar] [CrossRef]
- Lin, F.; Chou, S.; Pan, S.; Chen, Y. Mining time dependency patterns in clinical pathways. Int. J. Med. Inform. 2001, 62, 11–25. [Google Scholar] [CrossRef]
- Batal, I.; Fradkin, D.; Harrison, J.; Moerchen, F.; Hauskrecht, M. Mining recent temporal patterns for event detection in multivariate time series data. In Proceedings of the 18th ACM SIGKDD International Conference on Knowledge Discovery and Data Mining, Beijing, China, 12–16 August 2012; pp. 280–288. [Google Scholar]
- Choi, K.; Chung, S.; Rhee, H.; Suh, Y. Classification and sequential pattern analysis for improving managerial efficiency and providing better medical service in public healthcare centers. Healthc. Inform. Res. 2010, 16, 67–76. [Google Scholar] [CrossRef]
- Exarchos, T.P.; Papaloukas, C.; Lampros, C.; Fotiadis, D.I. Mining sequential patterns for protein fold recognition. J. Biomed. Inform. 2008, 41, 165–179. [Google Scholar] [CrossRef] [PubMed]
- Ryan, G.W. What do sequential behavioral patterns suggest about the medical decision-making process?: Modeling home case management of acute illnesses in a rural Cameroonian village. Soc. Sci. Med. 1998, 46, 209–225. [Google Scholar] [CrossRef]
- Lasker, G.E. Application of sequential pattern-recognition technique to medical diagnostics. Int. J. Bio-Med. Comput. 1970, 1, 173–186. [Google Scholar] [CrossRef]
- Concaro, S.; Sacchi, L.; Bellazzi, R. Temporal data mining methods for the analysis of the AHRQ archives. Proc. Am. Med. Inform. Assoc. 2007, 1–23. Available online: http://citeseerx.ist.psu.edu/viewdoc/download?doi=10.1.1.131.6417&rep=rep1&type=pdf (accessed on 2 July 2021).
- Li, J.; Fu, A.; Fahey, P. Efficient discovery of risk patterns in medical data. Artif. Intell. Med. 2009, 45, 77–89. [Google Scholar] [CrossRef]
- Baralis, E.; Bruno, G.; Chiusano, S.; Domenici, V.C.; Mahoto, N.A.; Petrigni, C. Analysis of medical pathways by means of frequent closed sequences. In International Conference on Knowledge-Based and Intelligent Information and Engineering Systems; Springer: Berlin/Heidelberg, Germany, 2010; Volume 6278, pp. 418–425. [Google Scholar]
- Antonelli, D.; Baralis, E.; Bruno, G.; Chiusano, S.; Mahoto, N.A.; Petrigni, C. Analysis of diagnostic pathways for colon cancer. Flex. Serv. Manuf. J. 2012, 24, 379–399. [Google Scholar] [CrossRef]
- Gotz, D.; Wang, F.; Perer, A. A methodology for interactive mining and visual analysis of clinical event patterns using electronic health record data. J. Biomed. Inform. 2014, 48, 148–159. [Google Scholar] [CrossRef] [Green Version]
- Huang, Z.; Lu, X.; Duan, H. On mining clinical pathway patterns from medical behaviors. Artif. Intell. Med. 2012, 56, 35–50. [Google Scholar] [CrossRef]
- Khaleel, M.A.; Pradhan, S.K.; Dash, G. Finding Locally Frequent Diseases Using Modified Apriori Algorithm. Int. J. Adv. Res. Comput. Commun. Eng. 2013, 2, 3792–3797. [Google Scholar]
- Pokharel, S.; Zuccon, G.; Li, Y. Representing EHRs with Temporal Tree and Sequential Pattern Mining for Similarity Computing. In Proceedings of the International Conference on Advanced Data Mining and Applications, Foshan, China, 12–14 November 2020; pp. 220–235. [Google Scholar]
- Abawajy, J.; Kelarev, A.; Chowdhury, M. Multistage approach for clustering and classification of ECG data. Comput. Methods Programs Biomed. 2013, 112, 720–730. [Google Scholar] [CrossRef]
- Wang, J.; Liu, P.; She, M.F.H.; Nahavandi, S.; Kouzani, A. Biomedical time series clustering based on non-negative sparse coding and probabilistic topic model. Comput. Methods Programs Biomed. 2013, 111, 629–641. [Google Scholar] [CrossRef]
- Rani, S.; Kautish, S. Association Clustering and Time Series Based Data Mining in Continuous Data for Diabetes Prediction. In Proceedings of the 2018 Second International Conference on Intelligent Computing and Control Systems (ICICCS), Madurai, India, 14–15 June 2018; pp. 1209–1214. [Google Scholar]
- Zriqat, I.A.; Altamimi, A.M.; Azzeh, M. A Comparative Study for Predicting Heart Diseases Using Data Mining Classification Methods. arXiv 2017, arXiv:1704.02799. [Google Scholar]
- Sufi, F.; Khalil, I.; Mahmood, A.N. A clustering based system for instant detection of cardiac abnormalities from compressed ECG. Expert Syst. Appl. 2011, 38, 4705–4713. [Google Scholar] [CrossRef]
- Mahoto, N.A.; Shaikh, F.K.; Ansari, A.Q. Exploitation of Clustering Techniques in Transactional Healthcare Data. Mehran Univ. Res. J. Eng. Technol. 2014, 33, 77–92. [Google Scholar]
- Chaurasia, V.; Pal, S.; Tiwari, B. Prediction of benign and malignant breast cancer using data mining techniques. J. Algorithms Comput. Technol. 2018, 12, 119–126. [Google Scholar] [CrossRef] [Green Version]
- Buczak, A.L.; Moniz, L.J.; Feighner, B.H.; Lombardo, J.S. Mining electronic medical records for patient care patterns. In Proceedings of the IEEE Symposium on Computational Intelligence and Data Mining (CIDM), Nashville, TN, USA, 30 March–2 April 2009; pp. 146–153. [Google Scholar]
- Karegowda, A.G.; Jayaram, M.; Manjunath, A. Cascading k-means clustering and k-nearest neighbor classifier for categorization of diabetic patients. Int. J. Eng. Adv. Technol. 2012, 1, 147–151. [Google Scholar]
- Hirano, S.; Sun, X.; Tsumoto, S. Comparison of clustering methods for clinical databases. Inf. Sci. 2004, 159, 155–165. [Google Scholar] [CrossRef]
- Isken, M.; Rajagopalan, B. Data mining to support simulation modeling of patient flow in hospitals. J. Med. Syst. 2002, 26, 179–197. [Google Scholar] [CrossRef] [PubMed]
- Wang, J.; Han, J.; Pei, J. Closet+: Searching for the best strategies for mining frequent closed itemsets. In Proceedings of the Ninth ACM SIGKDD International Conference on Knowledge Discovery and Data Mining, Washington, DC, USA, 24–27 August 2003; pp. 236–245. [Google Scholar]
- Juang, B.H.; Rabiner, L. The segmental K-means algorithm for estimating parameters of hidden Markov models. IEEE Trans. Acoust. Speech Signal Process. 1990, 38, 1639–1641. [Google Scholar] [CrossRef]
- Ester, M.; Kriegel, H.; Sander, J.; Xu, X. A density-based algorithm for discovering clusters in large spatial databases with noise. In Proceedings of the 2nd International Conference on Knowledge Discovery and Data Mining, Portland, OR, USA, 2–4 August 1996; Volume 1996, pp. 226–231. [Google Scholar]
- Xia, H.; Wang, S.; Yoshida, T. A modified ant-based text clustering algorithm with semantic similarity measure. J. Syst. Sci. Syst. Eng. 2006, 15, 474–492. [Google Scholar] [CrossRef]
- Rousseeuw, P. Silhouettes: A graphical aid to the interpretation and validation of cluster analysis. J. Comput. Appl. Math. 1987, 20, 53–65. [Google Scholar] [CrossRef] [Green Version]
- Sharan, R.; Maron-Katz, A.; Shamir, R. CLICK and EXPANDER: A system for clustering and visualizing gene expression data. Bioinformatics 2003, 19, 1787–1799. [Google Scholar] [CrossRef] [Green Version]
- Szathmary, L. Symbolic Data Mining Methods with the Coron Platform. Ph.D. Thesis, University Henri Poincare, Nancy, France, 2006. [Google Scholar]
- Fournier-Viger, P.; Gomariz, A.; Soltani, A.; Lam, H.; Gueniche, T. SPMF: A Sequential Pattern Mining Framework. 2014. Available online: http://www.philippe-fournier-viger.com/spmf/ (accessed on 2 July 2021).
- Audet, A.M.; Greenfield, S.; Field, M. Medical practice guidelines: Current activities and future directions. Ann. Intern. Med. 1990, 113, 709–714. [Google Scholar] [CrossRef] [PubMed]
- Wang, J.; Han, J. BIDE: Efficient Mining of Frequent Closed Sequences. In Proceedings of the 20th International Conference on Data Engineering (ICDE ’04), Boston, MA, USA, 2 April 2004; pp. 79–90. [Google Scholar]
- Rapid Miner Project. The Rapid Miner Project for Machine Learning. 2013. Available online: http://rapid-i.com/ (accessed on 2 July 2021).
- Dierk, S.F. The SMART retrieval system: Experiments in automatic document processing Gerard Salton, Ed. (Englewood Cliffs, N.J.: Prentice Hall, 1971, 556 pp., $15.00). IEEE Trans. Prof. Commun. 1972, PC-15, 17. [Google Scholar] [CrossRef]

| Patient ID | Date | Examination |
|---|---|---|
| 1 | 17 February 2007 | Glucose |
| 1 | 17 February 2007 | Capillary blood |
| 2 | 25 July 2007 | Glucose |
| 3 | 8 January 2007 | Urine Test |
| 3 | 15 February 2007 | Venous blood |
| 3 | 15 February 2007 | Glucose |
| ... | ... | ... |
| Patient ID | Examination Sequence |
|---|---|
| 1 | {Glucose, Capillary blood} |
| 2 | {Glucose} |
| 3 | {Urine Test} {Venous blood, Glucose} |
| ... | ... |
| Closed Frequent Item sets | Support | ||
|---|---|---|---|
| {Glucose} | 84.8% | ||
| {Venous blood} | 79.2% | ||
| {Capillary blood} | 75.0% | ||
| {Urinalysis} | 74.9% | ||
| {Glucose, Urinalysis} | 74.8% | ||
| {Glucose, Capillary blood} | 74.4% | ||
| {Glucose, Urinalysis, Capillary blood} | 73.9% | ||
| {Glucose, Venous blood} | 71.0% | ||
| {Glucose, Urinalysis, Capillary blood, Venous blood} | 57.4% | ||
| {Hemoglobin} | 46.4% | ||
| {Hemoglobin, Venous blood} | 43.0% | ||
| {Cholesterol} | 36.0% | ||
| {Triglycerides} | 35.7% | ||
| {HDL cholesterol} | 35.4% | ||
| {Cholesterol, Triglycerides, HDL cholesterol} | 33.7% | ||
| Closed Association Rules | Support | Confidence | Lift |
| {Venous blood, AST, HDL cholesterol} ⇒ {ALT, Total cholesterol} | 25% | 98% | 3.66 |
| {Glucose, Venous blood, ALT, Hemoglobin} ⇒ {AST} | 26% | 98% | 3.27 |
| {Venous blood, Hemoglobin, HDL cholesterol} ⇒ {Triglycerides, Total cholesterol} | 33% | 97% | 2.72 |
| {Venous blood, Triglycerides, Total cholesterol, HDL cholesterol} ⇒ {Hemoglobin} | 33% | 96% | 2.03 |
| {Gluocse, Capillary blood, Venous blood} ⇒ {Urine Test} | 64% | 100% | 1.32 |
| {Capillary blood, Venous blood} ⇒ {Urine Test} | 65% | 99% | 1.32 |
| {Glucose, Urine Test} ⇒ {Capillary blood} | 73% | 98% | 1.32 |
| {Urine Test, Venous blood} ⇒ {Glucose} | 65% | 99% | 1.17 |
| Examination Sequences | Frequency (%) |
|---|---|
| {Glucose}{Capillary blood} | 53 |
| {Venous blood}{Glucose} | 53 |
| {Venous blood}{Capillary blood} | 48 |
| {Venous blood}{Glucose, Capillary blood, Urine} | 48 |
| {Capillary blood}{Glucose}{Glucose} | 26 |
| {Glucose, Urine}{Glucose}{Glucose, Capillary blood} | 25 |
| {Venous blood} {Glucose, Capillary blood}{Venous blood} | 20 |
| {Capillary blood}{Glucose, Venous blood}{Glucose} | 20 |
| {Capillary blood, Venous blood}{Glucose}{Glucose} | 17 |
| {Haemoglobin}{Glucose}{Venous blood} | 16 |
Publisher’s Note: MDPI stays neutral with regard to jurisdictional claims in published maps and institutional affiliations. |
© 2021 by the authors. Licensee MDPI, Basel, Switzerland. This article is an open access article distributed under the terms and conditions of the Creative Commons Attribution (CC BY) license (https://creativecommons.org/licenses/by/4.0/).
Share and Cite
Mahoto, N.A.; Shaikh, A.; Al Reshan, M.S.; Memon, M.A.; Sulaiman, A. Knowledge Discovery from Healthcare Electronic Records for Sustainable Environment. Sustainability 2021, 13, 8900. https://doi.org/10.3390/su13168900
Mahoto NA, Shaikh A, Al Reshan MS, Memon MA, Sulaiman A. Knowledge Discovery from Healthcare Electronic Records for Sustainable Environment. Sustainability. 2021; 13(16):8900. https://doi.org/10.3390/su13168900
Chicago/Turabian StyleMahoto, Naeem Ahmed, Asadullah Shaikh, Mana Saleh Al Reshan, Muhammad Ali Memon, and Adel Sulaiman. 2021. "Knowledge Discovery from Healthcare Electronic Records for Sustainable Environment" Sustainability 13, no. 16: 8900. https://doi.org/10.3390/su13168900
APA StyleMahoto, N. A., Shaikh, A., Al Reshan, M. S., Memon, M. A., & Sulaiman, A. (2021). Knowledge Discovery from Healthcare Electronic Records for Sustainable Environment. Sustainability, 13(16), 8900. https://doi.org/10.3390/su13168900