Article

Modelling the Impact of Building Information Modelling (BIM) Implementation Drivers and Awareness on Project Lifecycle

by
Oludolapo Ibrahim Olanrewaju
1,2,
Ahmed Farouk Kineber
3,
Nicholas Chileshe
4,* and
David John Edwards
5
1
Wellington School of Architecture, Victoria University of Wellington, P.O. Box 600, Wellington 6140, New Zealand
2
Dollahills Research Lab, Dollasoft Technologies, Lagos 101283, Nigeria
3
Department of Civil & Environmental Engineering, Universiti Technologi PETRONAS, Seri Iskandar 32610, Malaysia
4
UniSA STEM, Scarce Resources and Circular Economy (ScaRCE), University of South Australia, Adelaide 5001, Australia
5
Faculty of Computing, Engineering and the Built Environment (CEBE), Birmingham School of the Built Environment, Birmingham City University, Birmingham B4 7XG, UK
*
Author to whom correspondence should be addressed.
Sustainability 2021, 13(16), 8887; https://doi.org/10.3390/su13168887
Submission received: 2 July 2021 / Revised: 2 August 2021 / Accepted: 4 August 2021 / Published: 9 August 2021

Abstract

:
The Architecture, Engineering, Construction and Operations (AECO) industry is generally slow in adopting emerging technologies, and such hesitance invariably restricts performance improvements. A plethora of studies have focused on the barriers, Critical Success Factors (CSFs), lifecycle and drivers independently, but none have explored the impact of BIM drivers and awareness on the project lifecycle. This study empirically explored the impact of BIM drivers and awareness on the project lifecycle using Structural Equation Modelling (SEM). Initially, a conceptual model was developed from an extensive literature review. Thereafter, the model was tested using primary questionnaire data obtained from 90 construction professionals in Lagos, Nigeria. Emergent findings indicate that Building Information Modelling (BIM) drivers have a high impact on BIM awareness at the operation stage of the project lifecycle. The SEM model has an average R2 value of 23% which is moderate. Consequently, this research contributes to the existing body of knowledge by providing invaluable insight into the impact of BIM drivers on BIM awareness in the project lifecycle. Knowledge acquired will help industry stakeholders and government to develop appropriate policies to increase BIM uptake within contemporary practice.

1. Introduction

The Architecture, Engineering, Construction and Operations (AECO) industry constitutes a cornerstone of a country’s economy and is predicted to account for circa 15% of the World’s Gross Domestic Product (GDP) by 2030 [1,2]. Construction outputs create critical infrastructure and buildings that cumulatively constitute the built environment which provides the basis for society and other industries to flourish [3,4]; hence, the economic contribution is perhaps greater than the estimated “direction” contribution to the GDP. Annually, the AECO industry is responsible for nearly 40% of the total energy use, 32% of CO2 emissions and 25% of the generated waste in Europe [5,6]. Furthermore, in many developing countries, the construction industry has undergone substantial fluctuations to accomplish its local economic objectives [7]. As a result, many developing countries’ financial procedures are in the process of improvement [8]. In these countries, construction projects frequently face several time-schedule delays [9,10,11]. Furthermore, the industry is faced with numerous productivity issues stemming from the lack of adoption of emerging technologies or concepts such as Building Information Modelling (BIM) [12], blockchain [13], Internet of Things (IoT) [14] and Industry 4.0 [15]. As a result, the construction industry in developing countries does not achieve government goals for society and clients, and a need for developing “overall success construction projects” that are resource-efficient has been underlined in the literature [16].
BIM resides at the vanguard of advancements made, and literature on this technology and its applications is ubiquitous and can be combined with the success approach at the preliminary and whole phases of a project [17]. Autodesk [18] defined BIM as “an intelligent 3D model-based process that gives architecture, engineering, and construction professionals the insight and tools to more efficiently plan, design, construct, and manage buildings and infrastructure”. BIM contains the inherent latent capacity to improve efficiency in the design, construction and maintenance of buildings [19,20].
BIM continues to undergo radical metamorphosis in response to sector stakeholder calls for technology to address systemic and recurrent issues that doggedly persist, viz. thematically grouped as productivity, cost and time management problems [21]. BIM as a procedure is targeted at the procedure of frequent production and at using the highest effective technology available to increase the improvement of Return on Investment (ROI) via refined and standardized processes [22]. It enables a central hub of data that designers, engineers, Mechanical, Electrical and Plumbing (MEP) contractors, operators and Facility Management (FM) corporations can execute for different buildings of any type and size besides current projects [23]. Consequently, BIM has been considered a critical lifecycle management tool that can have a significant positive effect on a building’s lifecycle [24,25].
However, BIM’s full potential is arguably yet to be realised despite the many palpable benefits inherent within this software. Many related studies that have sought to disentangle a Gordian knot of barriers to BIM adoption have focused on identifying the current state of adoption [26], defining and delineating the barriers (Babatunde, et al. [27]) and identifying the drivers (Olanrewaju, et al. [2], Eadie, et al. [28], Olawumi and Chan [29]) in both developed and developing countries. Consequently, there is also a lack of systematic attempts to examine the drivers for BIM implementation in the construction industry. Whereas previous studies have examined BIM activities and method efficiency in various developed countries, humble effort has been generated to explore the drivers and how BIM implementation can enhance its awareness in Nigerian construction projects. Drivers are important management processes for guaranteeing success and reflect “features where, if successfully executed, their results will assure an organization’s competitive performance” [30,31]. For example, Olanrewaju, et al. [2] revealed that key drivers include construction process visualization, improved decision-making process, controlled whole-life costs and environmental data, improved quality and increased sustainability and improved productivity and collaboration, which are the most important drivers for BIM adoption in the Nigerian AECO industry. Similarly, Eadie, et al. [28] identified clash detection, government pressure, competitive pressure, accurate construction sequencing and cost savings through reduced re-work. Rodgers, et al. [32] also identified clash detection, collaboration enhancement and cost saving as the key drivers for BIM adoption in Australia. Anecdotal synthesis of this aforementioned prevailing body of knowledge illustrates similarities in the drivers for BIM adoption. However, the impact(s) of these drivers on the BIM awareness on project lifecycle has received scant academic attention, yet knowledge of this phenomenon is crucial to understanding how to augment BIM implementation in the AECO industry. Consequently, for this empirical investigation, the following research question was posed: What is the impact of BIM drivers’ implementation on its awareness in the Project Lifecycle (PL)? As a result, the current work is the first to address this gap by quantitatively investigating the impact of BIM drivers on BIM awareness across the project lifecycle using deterministic techniques to represent networks of constructs to primary data collated and determine relationships between input variables using Structured Equation Modelling (SEM). Associated objectives were to: excoriate the impact of BIM drivers on BIM awareness across the project lifecycle as a basis for the development of appropriate policies and strategies to increase BIM uptake within the contemporary practice; and engender wider critical debate and discussion amongst industry stakeholders and policy advisors but also stimulate further research and investigation within the academic community. This study can help decision-makers succeed in their construction projects by reducing unnecessary expenditures and improving quality through the usage of BIM. This study is significant for the Nigerian construction sector, which has been slow to implement BIM. As a consequence, the findings from this study might be a game changer in construction projects not only in Nigeria but also in other developing countries where construction projects are carried out in a similar manner and method [33].

2. Awareness of BIM in the AECO Industry

BIM implementation continues to gain exponential momentum among global construction professionals [34]. For example, the National Building Specification (NBS) [35] revealed that there is a high level of BIM awareness in the UK, Canada, Finland and New Zealand. Consequently, BIM awareness and adoption have grown expeditiously from 10% in 2011 to nearly 70% in 2019 [36]. McGraw-Hill [37] revealed the implementation rate of BIM in Australia to be 64% while Rodgers, et al. [32] indicated a 48% level of adoption among Small–Medium Enterprises (SMEs). However, Tookey [38] revealed that there are doubts about the advantage of BIM in New Zealand’s construction industry.
In sub-Saharan Nigeria (as an exemplar of a developing country), Anifowose, et al. [39] indicated the adoption level of BIM as 50% while Ogunmakinde and Umeh [40] recorded a 58% level of awareness. Olanrewaju, et al. [26] also reported a high level of BIM awareness at the design stage which concurs with the findings of Onungwa and Uduma-Olugu [41] where client satisfaction and drawing improvement were identified as the major reasons for BIM usage at the design stage. However, Olapade and Ekemode [42] reported that there is very low awareness of BIM implementation for facility management practices in Nigeria. Literature suggests that many Nigerian construction professionals are aware of BIM and its potential benefits. For other developing countries, Gamil and Rahman [43] highlighted that 38% of Yemen’s construction practitioners are aware of the benefits of BIM while 8% are already implementing it. Similarly, Ismail, et al. [44] assessed the level of BIM uptake in Asian developing countries including China, Malaysia, India, Indonesia, Thailand, Myanmar, Sri Lanka, Mongolia, Vietnam and Pakistan. The study reported a low level of BIM implementation in the region. Nonetheless, China is at the forefront of BIM adoption due to its hybrid system, i.e., it has attributes of both a developed and developing country. Mehran [45] reported that the use of BIM in the United Arab Emirates (UAE) is gathering momentum while Shibani, et al. [46] indicated a low level of BIM awareness in Lebanon.
Recently, there has been positive feedback regarding BIM awareness in some developing countries such as South Africa [47]. This connotes that much work has been done regarding promoting the use of BIM in developing economies. Conclusively, construction professionals in developing countries are becoming aware of the benefits BIM offers, and the major problem lies in implementing BIM for construction projects. For instance, Olanrewaju, et al. [26] stated that only the Eko Atlantic City project has fully implemented BIM (i.e., from design to operation stage) in Nigeria.

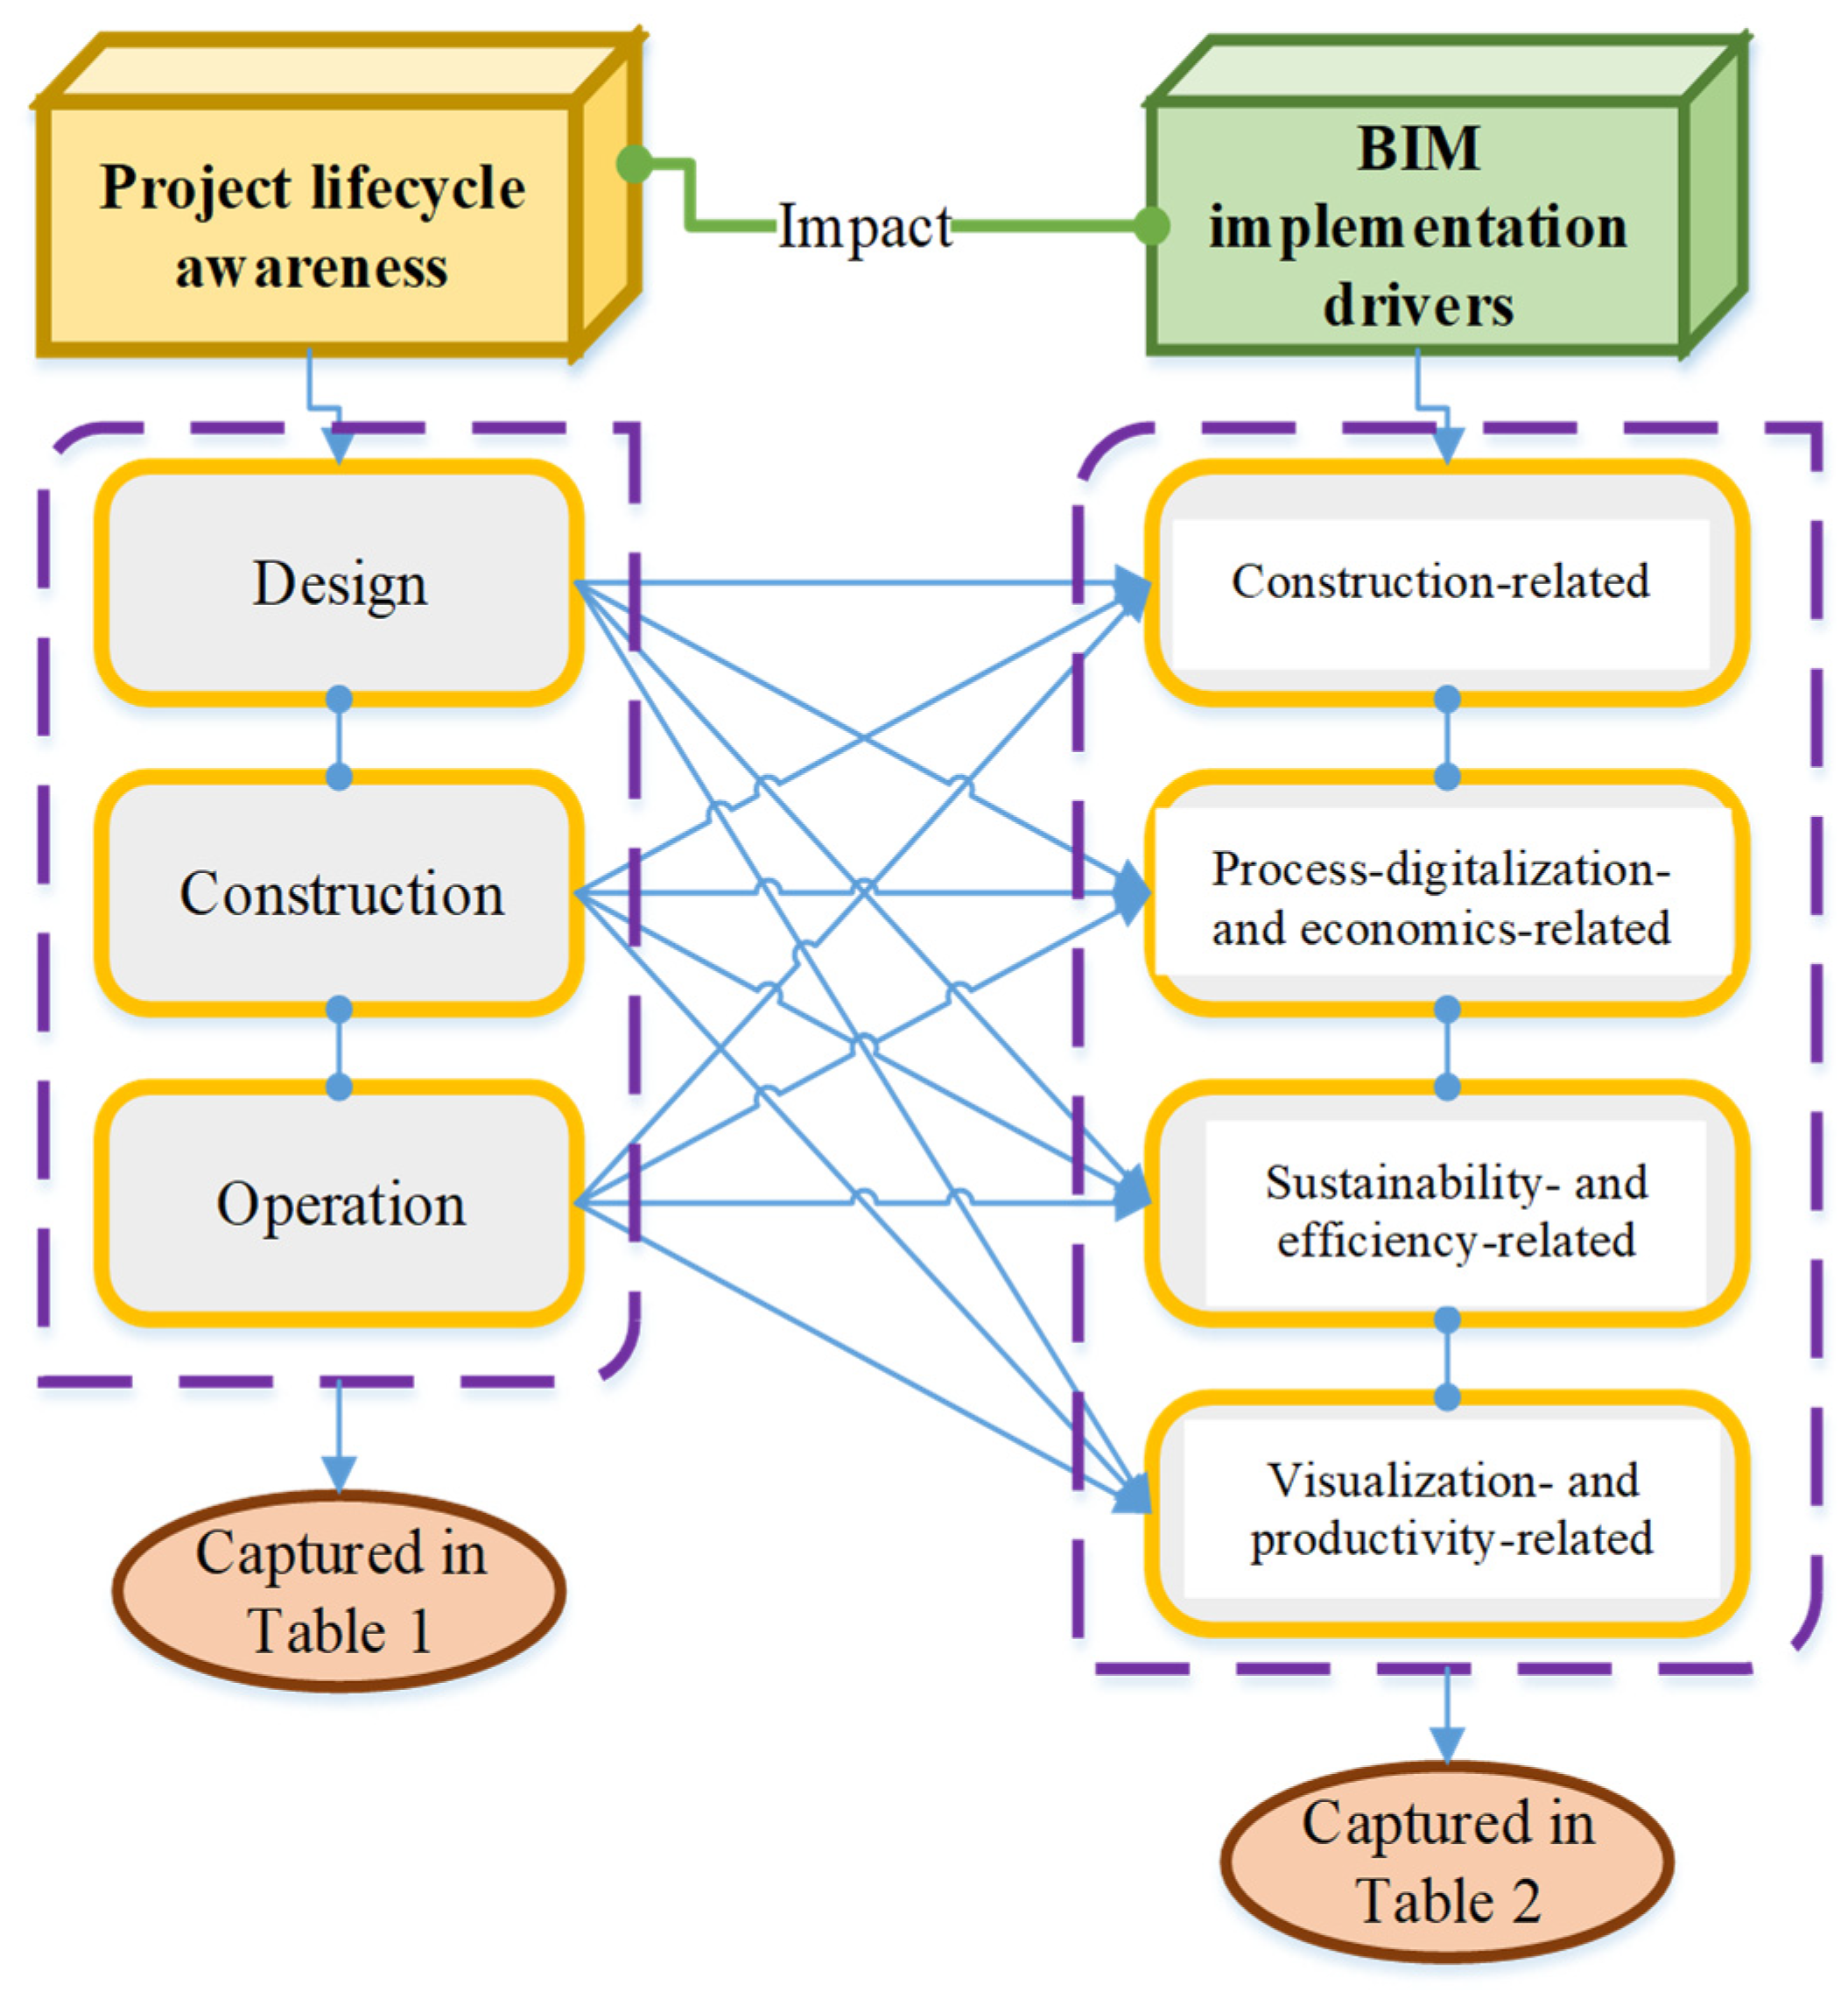
2.1. BIM and Project Lifecycle

Raouf et al. [48] proffered that BIM has transformed traditional construction-project-management practices which in turn impact the project lifecycle. BIM usage varies across this lifecycle which is periodically punctuated by inputs from diverse professionals at various stages of development—defined for brevity as design (e.g., designers and architects), construction (e.g., contractors) and operation stages (e.g., facility managers) [26,49]. The BIM usage at different project lifecycle stages is shown in Table 1 which was adapted from our previous study. The table highlights the different uses of BIM during project execution which are discussed based on building lifecycle stages in Section 2.1.1, Section 2.1.2, Section 2.1.3

2.1.1. Design Stage

The design stage often involves a virtual collaboration between the architect/designer, structural engineer and mechanical and electrical services engineer to ensure design clashes are minimised in a federated model [50]. In addition, depending on the country’s legalizations, BIM models are implemented using different software (ArchiCAD, Revit or SketchUp, CYPE MEP, DDS-CAD,). These models are imported into simulation software packages (e.g., Ecotect or IES-VE) to assess building features and sustainability. After the successful design, the quantity surveyor is responsible for using BIM tools such as costX, Navisworks or Vico to generate thorough cost analysis and Bills of Quantities. The final designs and cost details are then presented to the client for contractor selection and project commencement. In summary, BIM in the design stage not only enables visualisation of the project and design but also enhances the project by reducing the cost without affecting the quality. Chahrour, et al. [51] expressed that BIM offers cost savings through early clash detection in design before the project execution. It has also been viewed as a tool that facilitates a smart contract-automation process and effective collaboration among team members [52,53]. Cheng, et al. [54] argued that BIM has the potential to enhance the efficiency of facility maintenance management for MEP components (mechanical, electrical and plumbing) in building projects.

2.1.2. Construction Stage

During the construction stage, the “as-designed” BIM model produced is used by the contractor and consultant to ensure appropriate cost and time management and track the project progress; however, changes will be needed to reflect the final “as-built” structure to cater to client variations [49]. Olanrewaju, et al. [26] also highlighted construction monitoring, maintenance scheduling and fabrication as the main uses of BIM during the construction stage. Similarly, Eastman, et al. [55] mentioned monitoring, modelling and fabrication as the major uses of BIM. The 3D models contain essential data related to building projects essential for BIM procedures, far better than usual construction methods [56]. BIM techniques deliver the chance to organize project data, such as building geometry, and construction typology that can be used in creating informed decisions [57,58]. Consequently, BIM represents an effective tool for obtaining an accurate model that reflects the “as-is condition” or “as-built” condition in a project [56]. Currently, key technological advances enabled detailed three-dimensional (3D) models to illustrate the “as-is condition” of buildings projects [59,60]. Three-dimensional laser scanning is a reality-capture technique that aims to collect the greatest and extremely accurate data about “as-built” or “as-is condition” [56].

2.1.3. Operation Stage

The operation stage is characterised by maintenance and facility management operations aimed at improving the building’s lifespan. Comparatively, this area attracts less research, and general awareness is low (even in developed countries); however, some advanced applications in the industry are apparent [3]. Within the developing country of Nigeria, Olapade and Ekemode [42] expressed the low level of BIM awareness among facility management professionals. Additionally, Olanrewaju, et al. [26] reported a low level of BIM awareness at the operation stage in the Nigerian construction industry and potential applications that include asset management, building system analysis and record modelling. Elsewhere, Xu, et al. [49] also mentioned that BIM could be used for emergency management, lifecycle management and facility management. In addition, the implementation of the BIM concept in the building industry also belongs to the category of the digital twin approach for enhancement of building maintenance [61]. Digital twin has been the subject of various classic studies for increasing performance and decreasing operating costs in assets, machines, processes and specific applications with different integration and levels [62]. As a result, throughout the BIM implementation process, the design concept is turned into a three-dimensional model and then progressively into architecture for better performance maintenance procedures [61].

2.2. Drivers of BIM

The construction industry is characterized by poor document and information management which negatively impacts the project’s lifecycle. Saka and Chan [63] also reported that the industry is notoriously slow to adopt modern digital technologies such as BIM which has stunted industry growth and modernity. In recent years, BIM has grown in popularity as a tool for design and construction in the built environment across the world [34,64]. BIM has developed as a solution, with significant promise for generating, consolidating and maintaining these connected databases, which contain essential information for a facility (or a portfolio of facilities) to assist operations and maintenance [65]. In addition, Nieto-Julián, et al. [66] agreed that BIM can support members of a multi-disciplinary team from the heritage field by providing data interoperability. Furthermore, the study (ibid) revealed four major drivers of BIM adoption in Nigeria, viz.: (1) construction-related; (2) process-digitalization- and economics-related; (3) sustainability- and efficiency-related; and (4) visualization- and productivity-related. Stransky and Dlask [67] suggested that BIM aids decision making during project execution and improves construction productivity. Similarly, Eastman, et al. [55] asserted that BIM improves collaboration among project teams. Studies also highlight the benefit of BIM in cost estimation and management processes [2,68].
BIM has also been considered as a crucial tool in promoting sustainable construction/buildings through the term “Green BIM” which aims to reduce the impact of construction activities on the environment [69,70]. Amarasinghe and Soorige [71] demonstrated the use of BIM for building Lifecycle Assessment (LCA) and made recommendations on how to improve BIM-LCA assessments. The innate visualization capability of BIM is another critical driver for its adoption as it enables the client to virtually preview their proposed structure before construction commences. This empowers the design team with the flexibility to adjust certain building features in line with the client’s comments [2,55]. Lin and Hsu [72] adopted BIM to support problem visualization and management using a web-based API. This demonstrates the ability of BIM to visualize problems and work progress at an early stage. Table 2 summarizes the BIM drivers extracted from existing literature reviewed and categorized based on the BIM drivers’ groups identified in [2].

3. Research Methods

This research adopted positivism analysis to conduct an empirical analysis of primary data collated from a questionnaire survey; such an approach is well established within contemporary construction management literature [73,74]. Positivism was first adopted to analyse extant literature and identify pertinent BIM implementation drivers in BIM awareness across the PL (i.e., model constructs and constructs classification) and build a conceptual model [75,76,77]. Consequently, Structural Equation Modelling (SEM) was employed to define the relationships between constructs. The overarching epistemological research design is shown in Figure 1, while the conceptual model developed is shown in Figure 2.

3.1. Survey Administration

The identified constructs were used to design a closed-ended 5-point Likert scale with 5 = very high, 4 = high, 3 = average, 2 = low and 1 = very low as used in many earlier studies [78,79,80]. A closed-ended questionnaire was adopted because of its inherent ability to yield expedient responses from a large survey conducted and low administration costs [81]. The study’s scope was restricted to Lagos because it is the commercial hub of Nigeria and, in recent years, has developed remarkable infrastructures such as Eko Atlantic City and Dangote petroleum refinery [26].
The questionnaire was divided into two sections, namely: (1) respondent’s demographics; and (2) 5-point Likert scale questions on the constructs (see Table 1 and Table 2). A total of one hundred and fifty (150) questionnaires were distributed; ninety (90) were completed and returned—equating to a 60% response rate. This response rate provides reasonable data for analysis [82]. Furthermore, the sample size used is adequate and has been implemented in previous studies on the current state, barriers and drivers of BIM in the Nigerian construction industry [2,26,27,83].

3.2. Data Analysis

3.2.1. Reliability Test

Cronbach’s Alpha Reliability Test (CART) was conducted on data collected to determine the internal consistency of the study’s constructs in the questionnaire. The Cronbach’s alpha coefficients range from 0 to 1 in value [83,84] where 0.90 means high reliability, 0.80 moderate reliability and 0.70 low reliability [85]. CART is calculated by using the following formula in Equation (3) (Cronbach, 1951):
α = n n 1 ( 1 i V i V t )
where:
  • n = the number of items
  • Vt = the variance of the total scores
  • Vi = the variance of the item scores
The reliability test for the constructs revealed a Cronbach’s alpha coefficient of 0.910 which is considered very reliable.

3.2.2. Respondent Demographics

In terms of the respondents’ profession, 24% were quantity surveyors, 20% were builders and civil engineers, 19% were architects, and 17% were estate surveyors. This distribution illustrates that good representation was accrued from the major professionals working within the Nigerian construction industry. For working experience (and in highest to lowest order), 40% of respondents had 5–10 years, 32% had <5 years, 12% had 11–15 years, 10% had 16–20 years, and 6% had 21 years. This connotes the respondents are well experienced to provide informed and insightful information for this study.

3.2.3. Analytical Technique

SEM adopts a confirmatory approach to the analysis of a structural theory based on some conditions. Usually, the theory symbolises “causal processes” that result in the production of multiple variables [86]. It is a powerful tool capable of handling latent variables in multivariate regression analysis [76]. SEM encompasses two critical aspects of the procedure which include: (1) a series of regression equations which implies the study of causal processes; and (2) a diagrammatic representation of structural relations for better theory conceptualisation [86]. SEM was adopted because it has been successfully applied in previous BIM-related studies, viz.: Chen, et al. [87] who sought to identify the impact of information management on BIM maturity; Chang, et al. [88] who explored the impact of BIM implementation on the acceptance of integrated delivery systems; and Okakpu, et al. [89] who explored the influence of environmental factors on BIM adoption for refurbishment projects. The statistical investigation conducted in this study embraced the common-method variance analysis, measurement and structural model evaluation technique via SmartPLS 3.2.7 software which are discussed in the following sub-sections.

3.2.4. Common-Method Variance

Common-method bias (CMB) is the bias generated from the common-methods variance (CMV) and clarifies the error investigation outcomes [90,91]. In many occurrences, data collection may increase the extent of trigger issues such as bias relationships [92,93]. Therefore, it is vital to identify these issues to detect any CMV using a formal systematic one-factor analysis which was conducted as recommended by Harman [94] and Podsakoff, et al. [91]. Factor analysis shows the degree of variance explained by the variable [93].

3.2.5. Measurement Model

The measurement model explains the existing association between the indicators or measurement and their construct [95] and can be addressed via convergent and discriminant validity assessments. Convergent validity explores the level of agreement between two measurements in each construct [96]. In addition, discriminant validity highlights that the concept being assessed for each construct is empirically distinct and proposes any constructs that do not recognize the concept being observed in the SEM [97,98].

3.2.6. Structural Model

The main stage of the proposed model evaluation embraces the use of the structural model [16]. In this study, the structural model was generated via path analysis to evaluate all complicated relationships between constructs at the same time [99]. Consequently, a total of four structural equations for BIM drivers’ constructs were considered for the proposed Partial Least Squares Structural Equation Modelling (PLS-SEM) model, demonstrating relationships among the BIM drivers and BIM awareness constructs (Figure 4).

4. Results

4.1. Common-Method Bias

Common-method bias represents a measurement of variance (i.e., variance of error correlated with the measured variables) that influences the validity of a study [91,100]. In this study, a single-factor analysis was conducted to identify the standard method variance [94]. If the overall variance of the factors is <50%, the common-method bias does not influence the collected data [101]. The findings illustrate that the first set of factors indicates 34.63% of the total variance, and consequently, the common-method variance cannot affect the results [101].

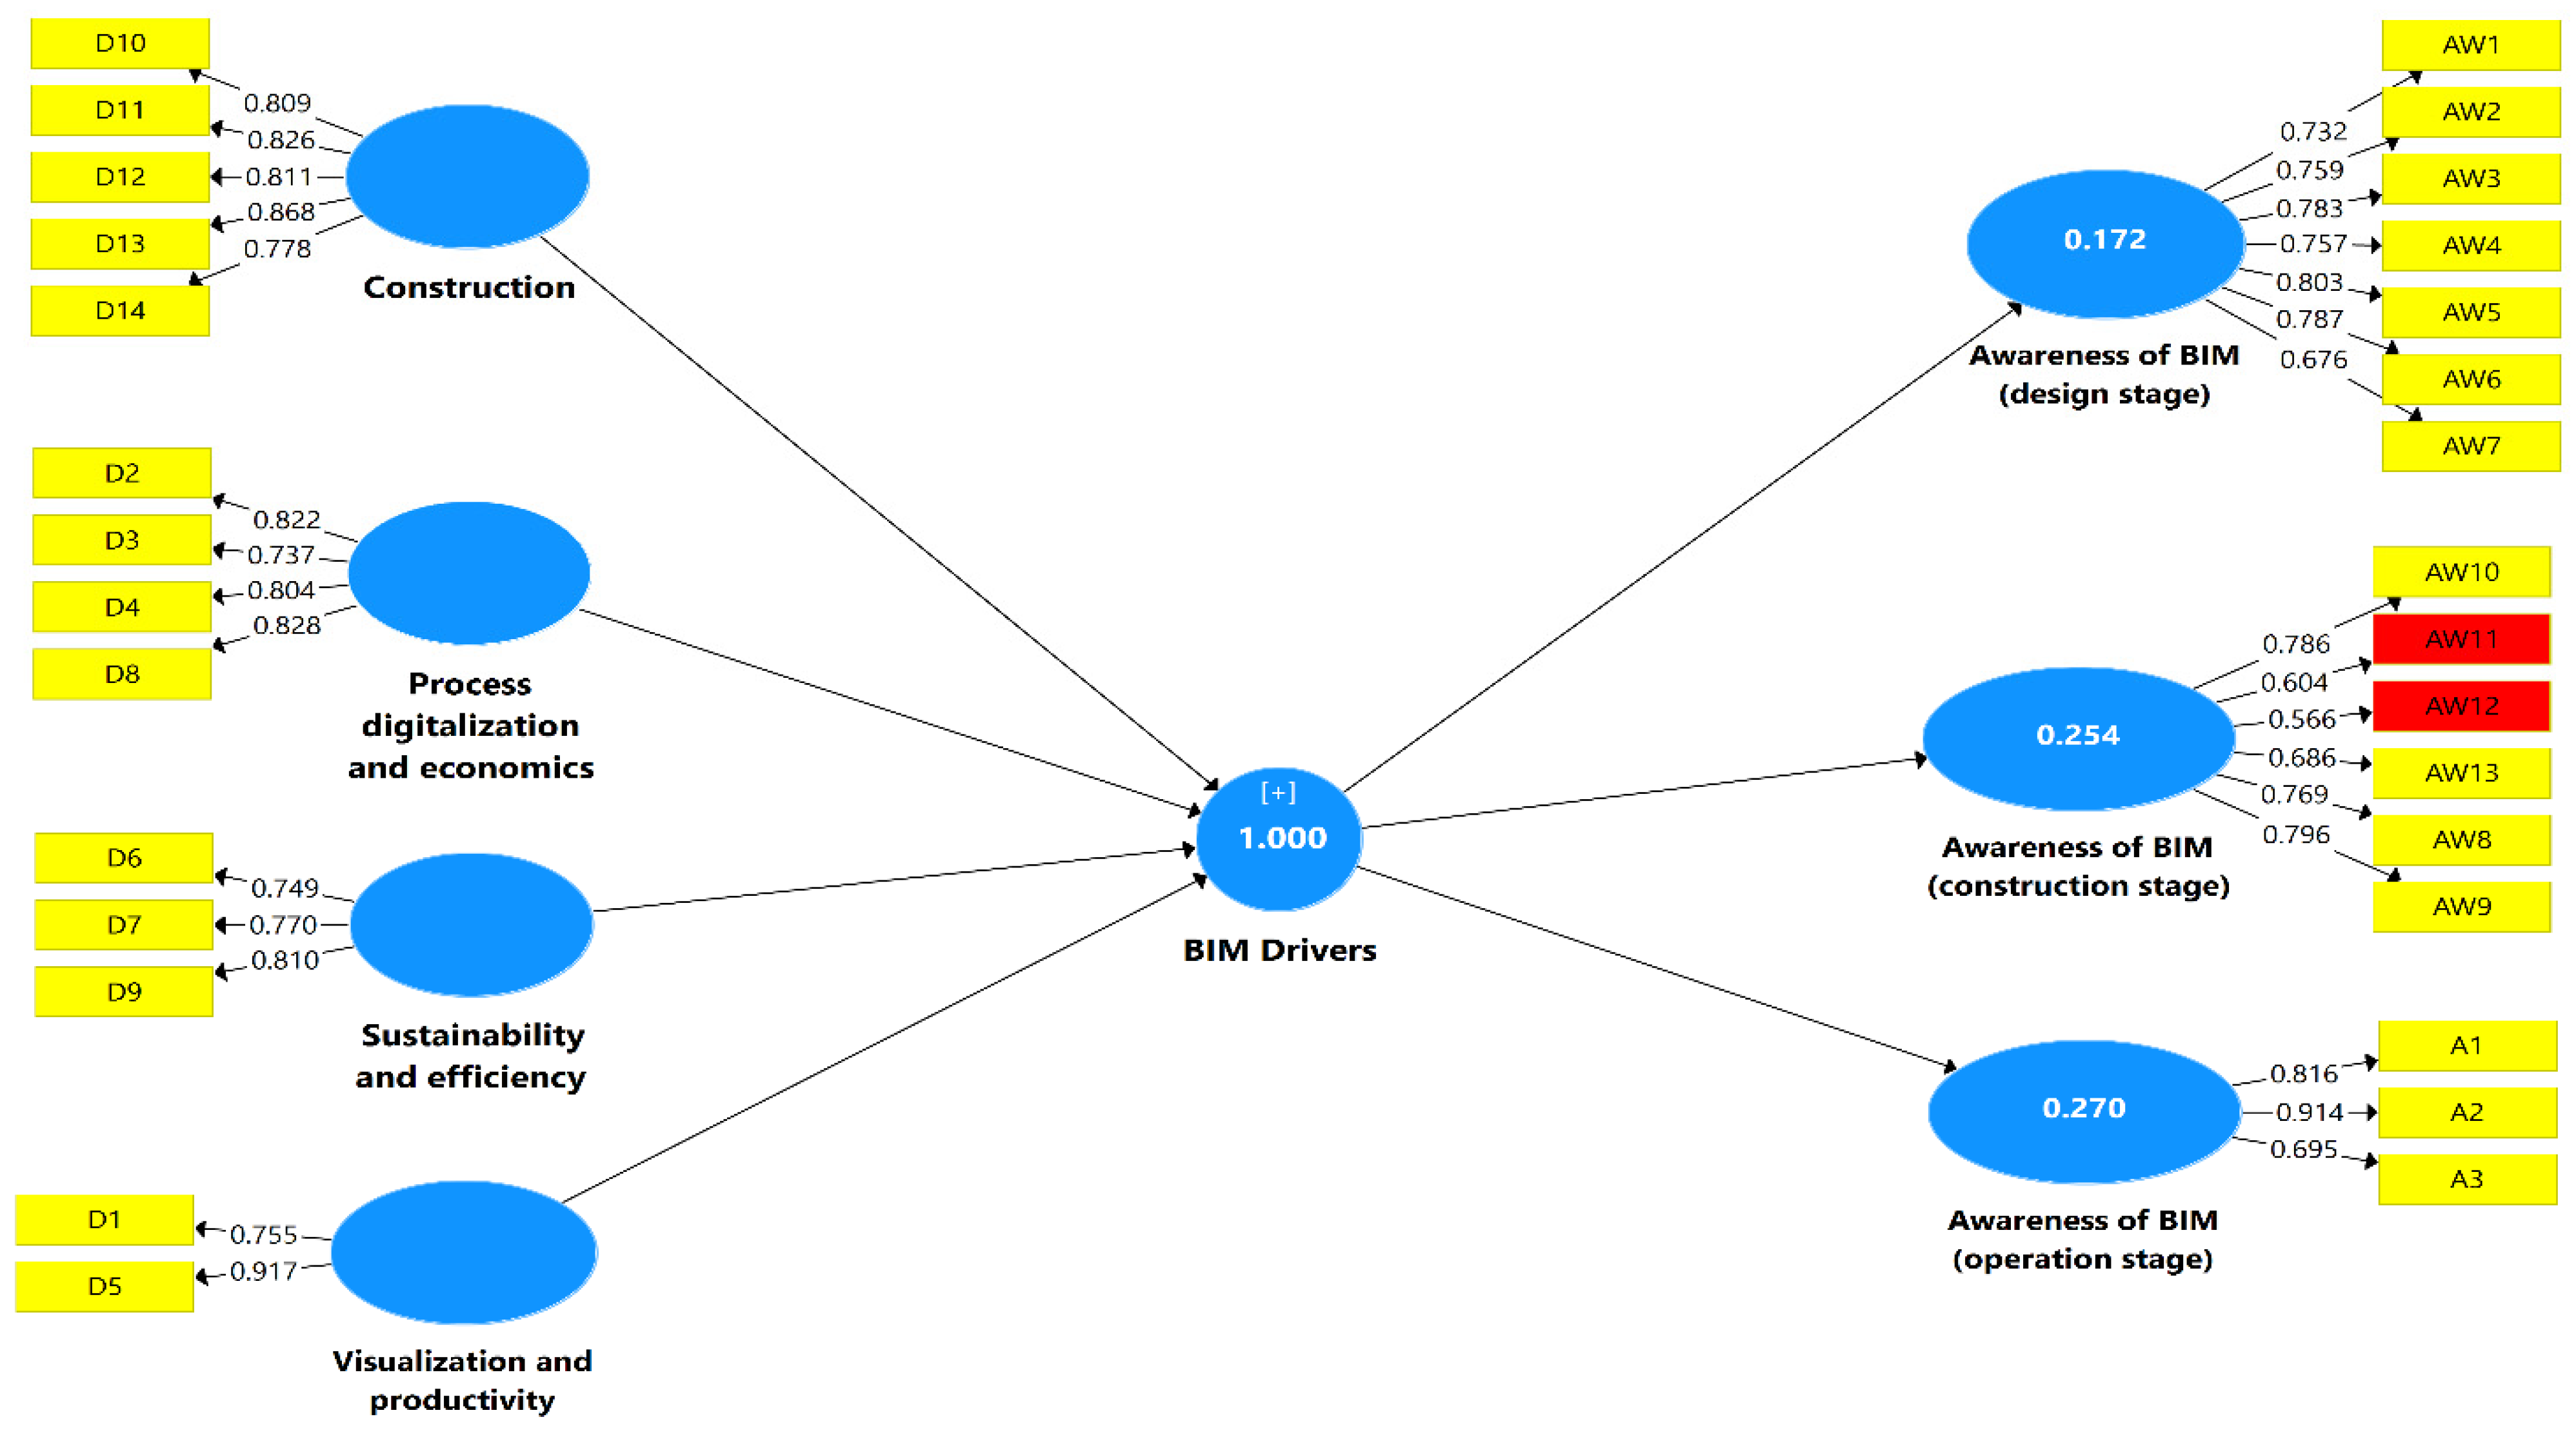
4.2. Measurement Model (First-Order Construct)

The SEM depicted in Figure 3 reproduces the above conceptual model for this study. In the previous tables, all the BIM drivers and awareness factors during the project’s lifecycle (design, construction and operation) were detailed and classified according to previous studies and EFA analysis. The measurement analysis for the proposed model requires an evaluation of: (1) Cronbach’s alpha analysis; (2) internal consistency of composite reliability; (3) Average Variance Extracted (AVE); and (4) discriminant validity [102].
Normally, items with an outer load around 0.40 and 0.65 can only be recommended for omission from the scale if the indicator’s removal resulted in a substantial improvement in composite reliability and AVE [102,103]. This is the level at which its construct describes roughly one-half of the item’s variance, and the amount at which the variance stated is higher than the error variance. External loads for the original and modified measurement models are shown in Figure 3 and Figure 4.
Consequently, all outer loads were accepted with the exception of two items related to “BIM awareness” at the construction stage (“AW11” and “AW12”), which were omitted from the initial model resulting in a lower loading factor of <0.6 (see Figure 3 and Table 3). A modified model (see Figure 4) was further calculated once these items were eliminated. Furthermore, the internal consistency of Composite Reliability (cr) was assessed due to Cronbach’s alpha restrictions, which determine sensitivity concerning the number of items involved [102]. Consequently, these two assessments showed that all constructs reached the Cronbach’s alpha and cr > 0.60 thresholds and were appropriate [104,105,106]. The results also show that all constructs passed the AVE test with a value >0.50, which means that all constructs have appropriate convergent values (Table 3) [104].
Discriminant validity analysis is important to assess whether each construct has distinctive phenomena that are not captured by other constructs in the proposed model [107]. This study used Fornell and Larcker [108] principles and the cross-loading criterion to measure discriminant validity. Table 4 confirms the discriminant validity of the measurement model according to these principles, which highlighted that all square roots of the AVE, for all constructs, are greater than the correlation among the latent variables [90,109].
Nevertheless, many studies have rejected the Fornell and Larcker [108] criterion of characteristic discriminatory validity. Consequently, the cross-loading criterion was also used in this study to assess discriminant validity. This approach confirms that the loading of indicators (items) of their constructs must be greater than the loading of another construct. Figures reported in Table 5 verified the above cross-loading principles as the loading on all indicators of the given construct is greater than the loading on other constructs (by row).

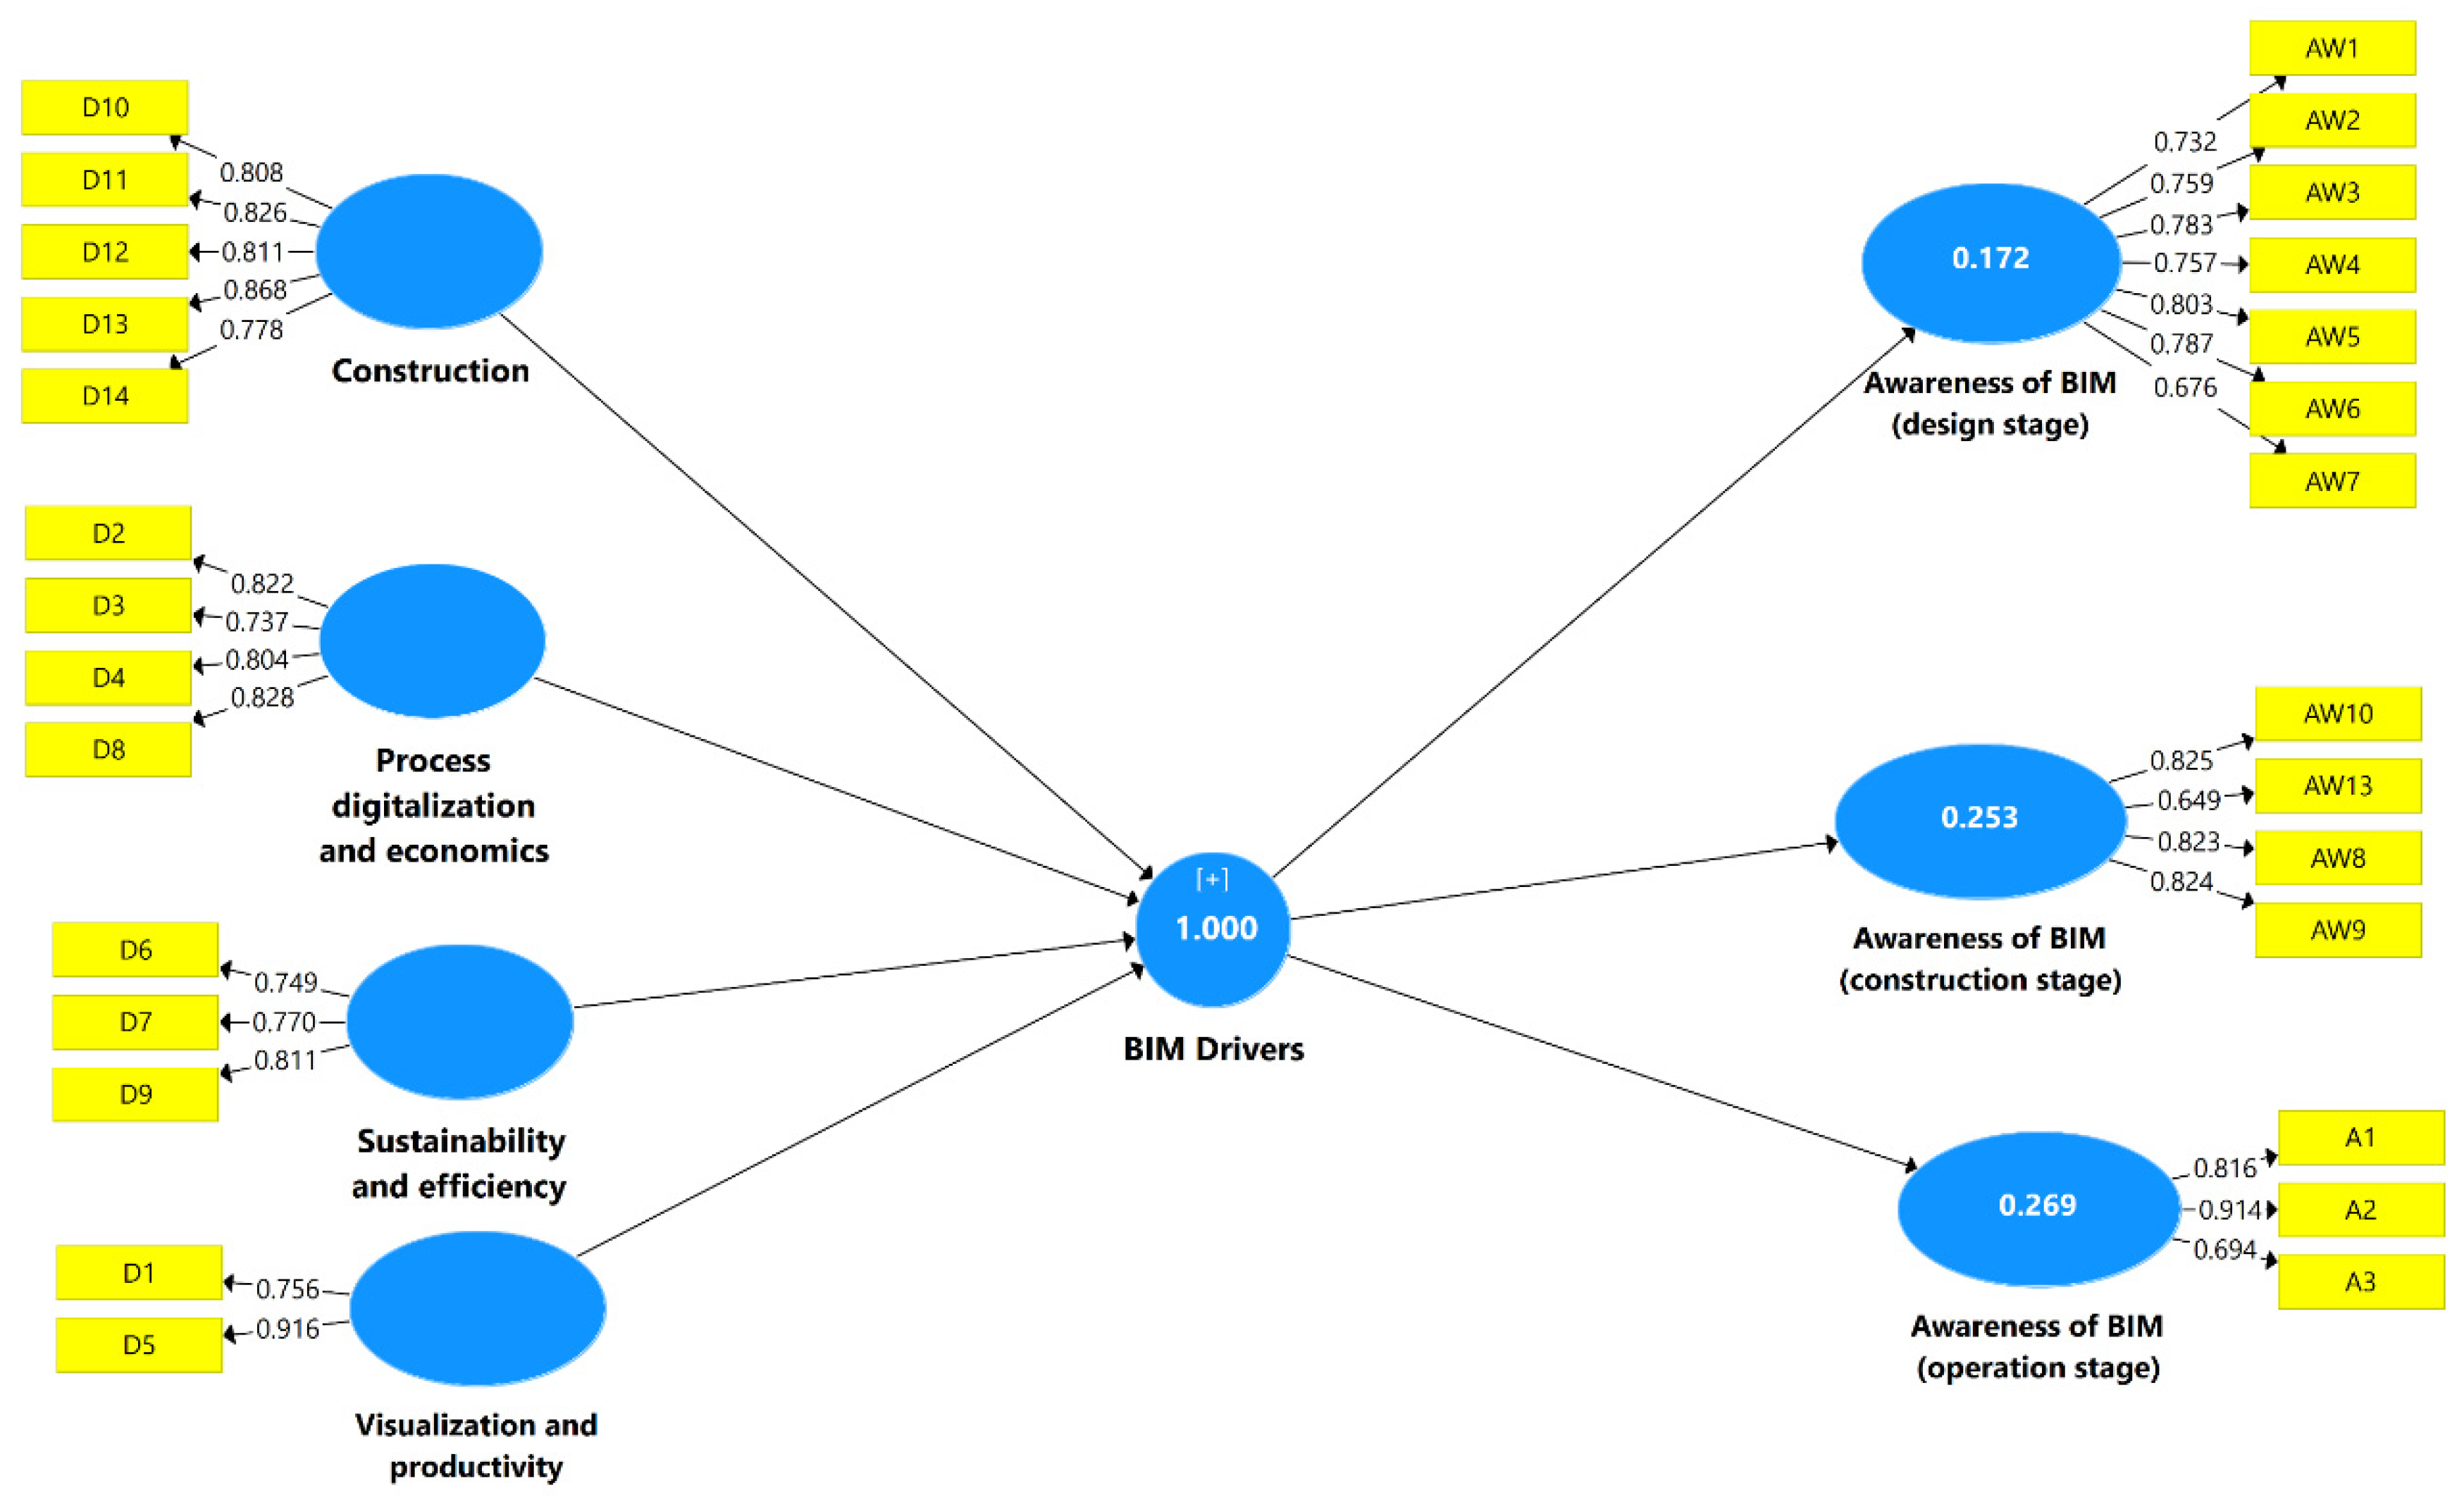
4.3. Measurement Model (Second-Order Construct)

As the BIM drivers construct was a latent second-order construct, the significant influence of all latent first-order constructs (i.e., construction, process digitalization and economics, sustainability and efficiency and visualization and productivity) were calculated using the bootstrap method. However, the BIM drivers construct was formative, and excessive correlations among latent first-order constructs are typically not anticipated. Additionally, the high correlation between formative items implies collinearity, which is considered problematic [107]. Consequently, the collinearity between the formative latent first-order constructs was explored by analysing the value of the Variable Inflation Factor (VIF). Table 6 shows that all latent first-order constructs have VIF values < 3.5, which indicates that these constructs independently contribute to the BIM drivers construct.
The results in Table 6 and Figure 5 show that four first-order subscales for BIM drivers, including construction, process digitalization and economics, sustainability and efficiency and visualization and productivity had a significant standard path coefficient β (outer weight). Table 4 indicates that the maximum outer loading was observed for construction (β = 0.471, p < 0.001), followed by process digitalization and economics (β = 0.341, p < 0.001), sustainability and efficiency (β = 0.224, p < 0.001) and visualization and productivity (β = 0.136, p < 0.001).

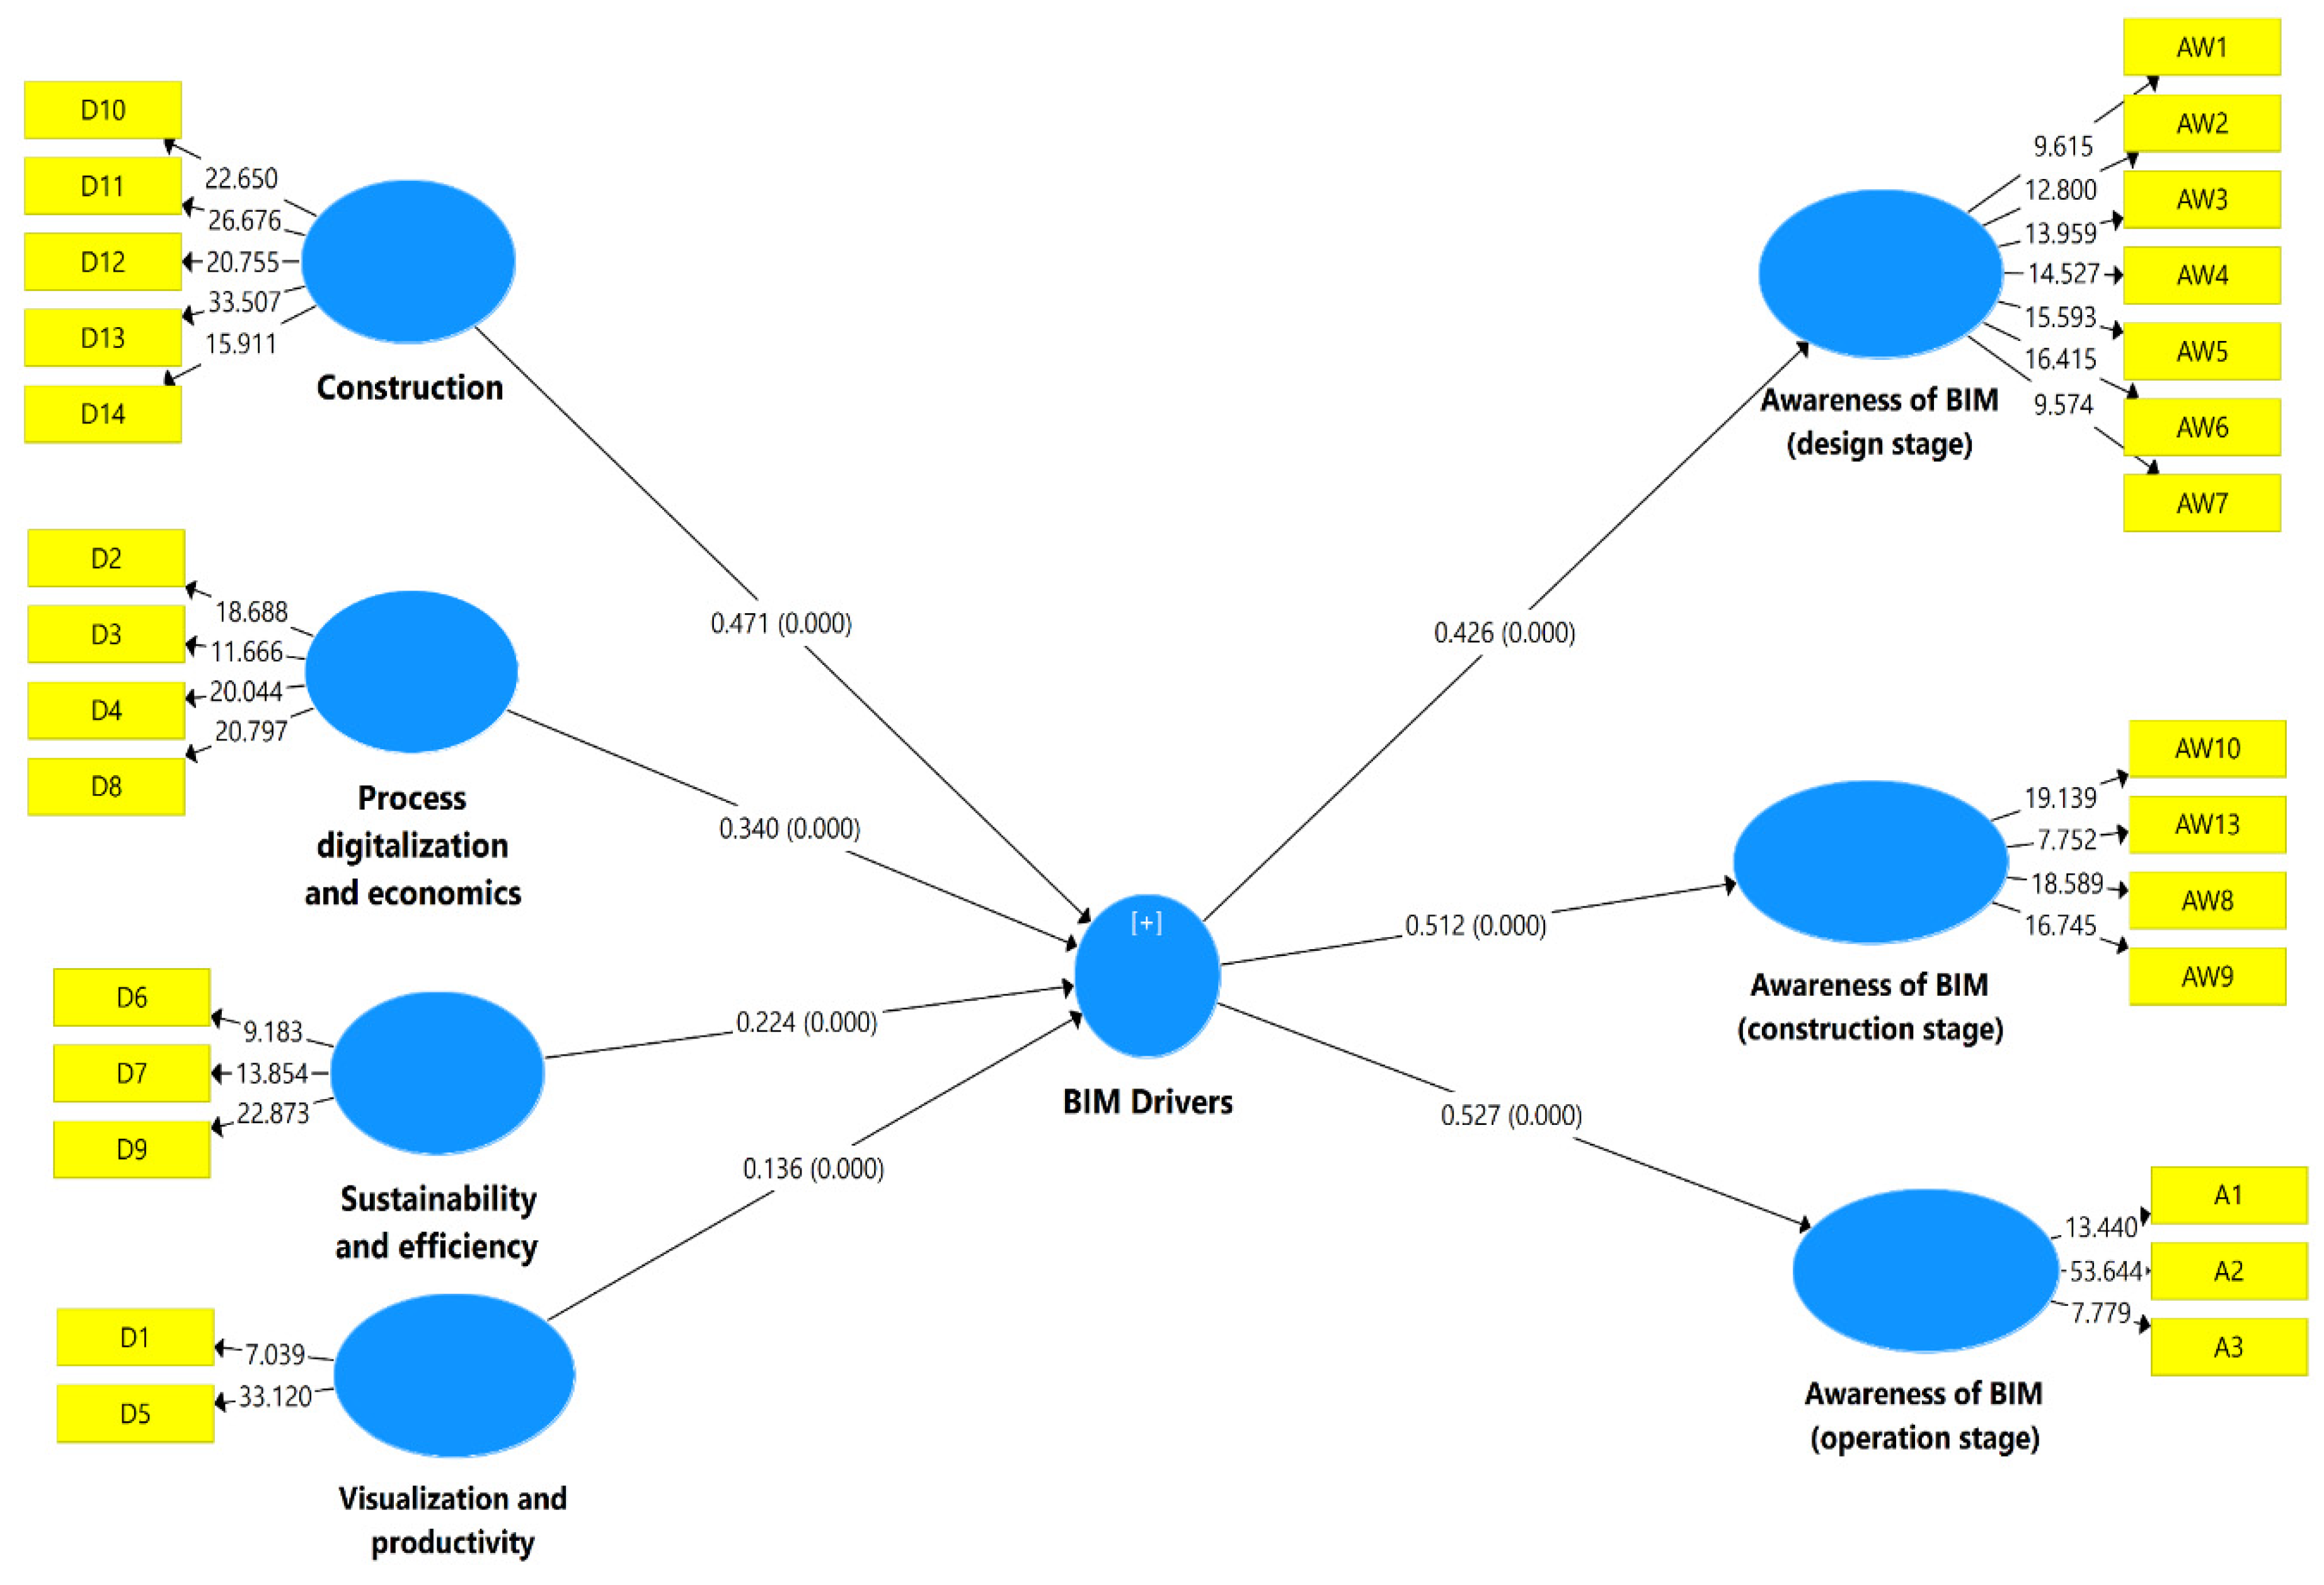
4.4. Structural Model (Path Analysis)

Having fitted the measurement model, the structural model examination could now commence. In the structural model, the relationships between variables are rationalised in detail. This analysis displays the relationship between an exogenous construct and endogenous constructs [110]. Structural model evaluation is performed mainly according to the hypothesized parameter evaluations followed by the size, direction and significance of the variables [110].
For the research hypotheses, SEM was utilized. The influence of BIM drivers on the awareness of BIM in the three project lifecycle stages (i.e., design, construction and operation) was examined with PLS-SEM (Figure 5). Consequently, the significance of the model hypothesis, reliability of the data and, thus, the error of the calculated path coefficients set was assessed based on the bootstrapping approach [111]. Figure 5 and Table 7 illustrate that the impact of BIM drivers on BIM awareness was statistically positive and significant.

4.5. The Explanatory Power of the Structural Model (R2)

The value of R2 is the sum of the variation and is demonstrated by the independent construct (BIM drivers) in the dependent constructs. R2 value improves the predictive capability of the structural model, i.e., the higher the value, the higher the model strength. Usually, an R2 value of 0.7 and above is considered excellent, and its value ranges between −1 and 1 [112]. Furthermore, Ringle, et al. [113] indicated that values between 0.02 and 0.12 are considered weak, 0.13 and 0.25 are moderate, and values above 0.26 are substantial. In this study, the PLS algorithm concluded that R2 is similar to the conventional regression and the same rules apply [114]. Table 8 illustrates that the adjusted R2 for the dependent variable in this model was 0.253 for awareness of BIM in the construction stage, 0.172 for awareness of BIM in the design stage and 0.269 for awareness of BIM in the operation stage, which suggested that the exogenous latent variable (BIM drivers) can averagely explain 23% of BIM awareness on the whole project lifecycle while 77% was a result of other factors not considered in this study. According to Chin [114], the findings mean that the size described by BIM drivers is moderate.

4.6. Predictive Relevance of the Structural Model

A vital function of a structural model is its capability to evaluate the model’s predictive relevance. In this study, the blindfolding protocol was employed to evaluate the cross-validated redundancy measures for each dependent construct. The findings indicate that the Q2 values (0.15, 0.091 and 0.17) for awareness of BIM in the three project stages (i.e., construction stage, design stage and operation stage) were higher than zero, indicating that the independent construct (BIM drivers) had predictive significance for the dependent constructs (Table 9) [115].

5. Discussion

Recent construction enhancement has brought more effective and sustainable approaches, specialized tools and materials [116]. Building direction in the construction industry necessitates significant, long-term growth [117]. Enhancing performance throughout use, on the other hand, is becoming increasingly important. [118]. It is necessary to develop strategies for incorporating the concept of sustainable and performance development [119,120]. Moreover, BIM implementation can carry out an efficient technique of attaining building performance. In this study, SEM revealed the relationship between the constructs (project lifecycle BIM awareness and drivers). All the drivers (construction, process digitalization and economics, sustainability and efficiency and visualization and productivity—in order of impact) were considered significant in relation to the implementation of BIM drivers. This finding illustrates a step-change in the mindset of practitioners in developing countries who acknowledge the latent value of digitising the construction process using BIM as an enabling technology. Such a finding confirms earlier studies such as that by Vass and Gustavsson [121] who asserted that increased digitalization has revolutionized the industry due to the elimination of potential drawbacks and traditional practices gradually becoming redundant. Biancardo, et al. [122] also mentioned that BIM implementation has helped significantly in reducing construction costs and time. BIM has also been viewed as a decision support tool that helps designers in comparing the performance of different designs in terms of energy, emissions and cost [123]. Furthermore, Ibem, et al. [124] agreed that BIM aids effective visualization for client design approval. It must be acknowledged that BIM is not a sole panacea to construction sector ailments and is increasingly being absorbed into the wider concept of Industry 4.0 which represents a broader coalescence of digital technologies [15]. The Internet of Things, artificial intelligence, big-data analytics, sensor-based technologies, etc., are now integrated to provide a suite of sophisticated project management tools that provide greater insight and knowledge of the complex modern projects. This aside, the results do illustrate how the developing country of Nigeria has embraced this digital transition with considerable aplomb and potentially how indigenous contractors could become more internationally competitive.
Another intriguing finding is that BIM awareness at the operation stage of the project lifecycle has a high impact on drivers of BIM adoption. This is accompanied by the construction and design stage. Despite the high impact of BIM awareness at the operation stage on the drivers, studies have shown that there is a poor level of BIM awareness in facility management in Nigeria which is a critical aspect of the operation stage [43]. In this respect, therefore, Nigeria is behind international practice adoption in terms of digitising facilities management to provide much-needed modernity. Ghaffarianhoseini, et al. [123] indicated that BIM supports facility managers to help reduce the lifecycle cost of buildings. Similarly, Wu, et al. [125] indicated that there is a high level of awareness at the design stage while Olanrewaju, et al. [26] revealed that there is a strong correlation between awareness at the design and construction stages and a weak correlation between the design and operation stages. However, the relationship between the construction and operation stages is fairly strong. This connotes that there is a disconnection between the design and operation stages in the level of awareness. Reducing BIM implementation obstacles via the recommended drivers can inspire construction participants to learn more about how BIM can be used. According to Sidani, et al. [126], there is still a need for key industry actors to grasp how to manage BIM techniques, recognising opportunities for further development in accessing, preserving and sharing BIM data. Furthermore, the Internet of Things, artificial intelligence, big-data analytics, sensor-based technologies and other technologies are now integrated to provide a suite of advanced project management devices that enable greater insight and understanding of complex modern projects [127]. These results are in line with the work of Biancardo, et al. [122] who stated that the implementation of BIM has considerably reduced construction costs and time, particularly throughout the building phase. Participants also should consider how BIM use in construction businesses reduces risks. It will explain why the initial high benefits of the employee and enhancing the building environment are so high [128].
Overall, the research illustrates that Nigeria is on course to create a smart built environment within a cyber-physical system in which BIM is an integral part. However, further research is now needed to take a far more holistic view of other digital innovation developments in this respect and how transitional challenges (such as cyber threats (Parn and Edwards [13])) may be overcome to protect critical assets and infrastructure from nefarious hackers and cybercriminals. Such work will help ensure the country’s preparedness to embrace future innovative developments and capitalise upon these to reap maximum socio-economic benefits for its citizens.

6. Conclusions

This study used SEM to explore the impact of BIM drivers on usage and awareness in the project lifecycle which is an aspect that has been neglected by previous researchers. It was revealed that BIM drivers have a significant impact on BIM awareness across the project lifecycle. The study is unique because it helps construction researchers and stakeholders determine the impacts of BIM drivers on BIM awareness across the project lifecycle which is essential for BIM uptake across the project lifecycle (design, construction and operation). Particularly, the operation stage was seen to be most impacted by the BIM of the PL which calls for major action to be implemented by stakeholders to increase BIM awareness. In addition, the study is the first to develop a quantified model to measure the impact of BIM drivers on BIM awareness across the project lifecycle which will be useful for policymakers to develop an appropriate framework for BIM adoption in the AECO industry. This framework would be useful for stakeholders, such as client consultants and contractors in adopting BIM in their projects. Furthermore, the proposed framework generated from this study can, to a large extent, support BIM adoption in other developing countries where construction projects are executed in the same way [33]. Nevertheless, this study generates vital managerial implications and empirical contributions to the AECO industry which are given below:

6.1. Conceptual and Empirical Contributions

The suggested model established a necessity for BIM adoption, particularly in the developing-country construction industry. Through the suggested model, this study highlighted the drivers for BIM implementation. These drivers can help overcome the present obstacles to successfully implement BIM in the Nigerian construction industry. As a result of this research, the gap between BIM practice and theory will be narrowed. To the best of our knowledge, no research has been conducted to examine the drivers of BIM implementation in the Nigerian construction sector by determining its influence on BIM awareness at various construction stages. Initially, this study empirically analysed the major BIM drivers that can help in BIM implementation in the construction sector. This discovery lays the groundwork for future study on the drivers of BIM in developing countries, notably in the field of construction management. To that aim, the theoretical elements of this research provide a mathematical framework for identifying the BIM drivers that may be employed successfully in Nigeria and other developing nations. Using the unique PLS-SEM, the four components of the BIM drivers in the Nigerian construction sector were compared. As a result, this study provides a mechanism to assist policymakers who are interns in incorporating BIM impartially. In addition, a number of conceptual and empirical contributions were made by the study as follows:
  • The study makes a conceptual contribution through the identification and conceptual definition of additional constructs to be added to the conceptual framework such as the impact of BIM implementation drivers on BIM usage and awareness across the project lifecycle.
  • The range of construction-based BIM and BIM implementation studies focused primarily on developed countries (UK, USA, Hong Kong and Australia). Consequently, scant research has been conducted in developing countries and the Nigerian construction sector on the adoption of BIM. This creates a solid basis for addressing BIM adoption in improving local construction projects’ reliability and filling the above-mentioned gap of knowledge.
  • The study’s output offers, for the first time, a significant prediction tool (PLS-SEM) to discuss the impact of BIM drivers on BIM usage and awareness in the project lifecycle in the construction industry. As such, this tool could improve the traditional adoption of BIM in the construction sector, particularly in developing countries. This contribution is empirical in nature as it is focused on testing a theoretical linkage between two constructs, namely the BIM implementation drivers and BIM usage and awareness in the project lifecycle, which have not previously been tested.
  • Regarding country context, it is evident that there is an increase in the level of BIM awareness in the Nigerian construction industry, and this is expected to rise significantly within the next few years. This empirical study provides evidence that there is a vital and positive impact of BIM drivers on BIM awareness across the project lifecycle. Consequently, this can encourage the Nigerian government and other local organizations to adopt BIM. Such research will improve BIM adoption in this region. Therefore, the study makes significant contributions by adding new knowledge in a previously unexplored context.

6.2. Managerial Implications

The following managerial implications that can be used by construction practitioners in understanding the impact of BIM implementation drivers on BIM usage and awareness in the project lifecycle are suggested:
  • It provides construction companies with critical drivers that can be leveraged upon for competitiveness and global market survival via BIM incorporation.
  • It assists clients, contractors and consultants in evaluating BIM drivers and BIM awareness across the project lifecycle which will facilitate effective decision making during project execution.
  • It presents empirical evidence that could be useful to guide Nigerian policymakers and other developing countries in adopting BIM.

6.3. Limitations and Future Research

Whilst this study contributes to knowledge on the impact of BIM drivers on BIM usage and awareness in the project lifecycle, it nevertheless has a number of limitations. First, the study is limited in terms of geographical location. The research instrument (questionnaire) was only administered to construction professionals in Lagos, Nigeria. Future studies should seek to further explore other regions to improve the generalization of the study. In this study, time and resources are limited, and thus it is challenging to carry out a longitudinal analysis that requires data to be obtained at various times as well as chronologically. Consequently, a cross-sectional study examining a particular situation of BIM at a particular time was used. Longitudinal study needs to be conducted in future studies to collect data from several samples to test changes typically in a particular pattern over a long period. Consequently, the casual inferences between BIM implementation drivers and greater BIM usage and awareness in the project lifecycle should be examined. In addition, this study focused on exploring the impact of BIM drivers on BIM usage and awareness in the project lifecycle using Structural Equation Modelling (SEM) with theoretical conceptualization. Future studies could use innovation diffusion theory to explain how, over time, a BIM concept gains momentum and diffuses via a specific stakeholder or organizations in other developing countries. The prediction analysis used in this study was limited to BIM drivers; future studies are recommended to predict the impact of BIM barriers on BIM awareness in the project lifecycle. Lastly, the results from the proposed study may be beneficial to enhance country improvement through adopting BIM, but it is not a promise to prepare the country to accept and capitalize on future creative advancements in order to maximise socioeconomic advantages for its inhabitants. Consequently, the government also plays a significant role to support the use of BIM in construction projects in the country by improving the level of laws and guidelines. The study’s findings on BIM implementation requirements and drivers cannot be executed at the business level in emerging companies, and its employees cannot be taught in it without top management guidance.

Author Contributions

Conceptualization, O.I.O. and N.C.; methodology, A.F.K., O.I.O. and N.C.; software, A.F.K.; validation, N.C. and A.F.K.; analysis of the literature, O.I.O. and A.F.K.; writing—original draft preparation, O.I.O., A.F.K., N.C. and D.J.E.; writing—review and editing, O.I.O., A.F.K., N.C. and D.J.E.; visualization, A.F.K.; supervision and quality control, N.C. and D.J.E. All authors have read and agreed to the published version of the manuscript.

Funding

This research received no external funding.

Institutional Review Board Statement

The study was conducted according to the guidelines of the Declaration of Helsinki, and approved by the Institutional Review Board (or Ethics Committee) of Dollahills Research Lab, Dollasoft Technologies.

Informed Consent Statement

Not applicable.

Data Availability Statement

Data generated or analysed during the study are available from the corresponding author by request.

Conflicts of Interest

The authors declare no conflict of interest.

Abbreviations

The following abbreviations are used in this manuscript:
AECOArchitecture, Engineering, Construction and Operations
AVEAverage Variance Extracted
CARTCronbach’s Alpha Reliability Test
CMVCommon-Methods Variance
CRComposite Reliability
CSFsCritical Success Factors
FMFacility Management
GDPGross Domestic Product
IoTInternet of Things
LCALife Cycle Assessment
MDPIMultidisciplinary Digital Publishing Institute
MEPMechanical, Electrical and Plumbing
PLProject Lifecycle
PLS-SEMPartial Least Squares Structural Equation Modelling
RoIReturn on Investment
SEMStructural Equation Modelling
UAEUnited Arab Emirates
VIFVariable Inflation Factor

References

  1. Olanrewaju, O.; Idiake, J.; Oyewobi, L.; Akanmu, W.P. Global economic recession: Causes and effects on Nigeria building construction industry. J. Surv. Constr. 2018, 9, 9–18. [Google Scholar]
  2. Olanrewaju, O.I.; Babarinde, S.A.; Chileshe, N.; Sandanayake, M. Drivers for implementation of building information modeling (BIM) within the Nigerian construction industry. J. Financ. Manag. Prop. Constr. Econ. Build. 2021. [Google Scholar] [CrossRef]
  3. Edwards, D.J.; Pärn, E.; Love, P.E.; El-Gohary, H. Research note: Machinery, manumission, and economic machinations. J. Bus. Res. 2017, 70, 391–394. [Google Scholar] [CrossRef]
  4. Owusu-Manu, D.-G.; Edwards, D.J.; Mohammed, A.; Thwala, W.D.; Birch, T. Short run causal relationship between foreign direct investment (FDI) and infrastructure development. J. Eng. Des. Technol. 2019. [Google Scholar] [CrossRef]
  5. Araújo, C.; Almeida, M.; Bragança, L. Analysis of some Portuguese thermal regulation parameters. Energy Build. 2013, 58, 141–150. [Google Scholar] [CrossRef]
  6. Carvalho, J.P.; Bragança, L.; Mateus, R. Optimising building sustainability assessment using BIM. Autom. Constr. 2019, 102, 170–182. [Google Scholar] [CrossRef]
  7. Mousa, A. A Business approach for transformation to sustainable construction: An implementation on a developing country. Resour. Conserv. Recycl. 2015, 101, 9–19. [Google Scholar] [CrossRef]
  8. Fang, Z.; Gao, X.; Sun, C. Do financial development, urbanization and trade affect environmental quality? Evidence from China. J. Clean. Prod. 2020, 259, 120892. [Google Scholar] [CrossRef]
  9. Kissi, E.; Boateng, E.; Adjei-Kumi, T. Strategies for implementing value management in the construction industry of Ghana. In Proceedings of the DII-2015 Conference on Infrastructure Development and Investment Strategies for Africa, Livingstone, Zambia, 16–18 September 2015; pp. 255–267. [Google Scholar]
  10. Adeyemi, L.A.; Idoko, M. Developing Local Capacity for Project Management—Key to Social and Business Transformation in Developing Countries; Project Management Institute: Newtown Square, PA, USA, 2008. [Google Scholar]
  11. Maceika, A.; Bugajev, A.; Šostak, O.R. The Modelling of Roof Installation Projects Using Decision Trees and the AHP Method. Sustainability 2020, 12, 59. [Google Scholar] [CrossRef] [Green Version]
  12. Acre, F.; Wyckmans, A.J.S. The impact of dwelling renovation on spatial quality: The case of the Arlequin neighbourhood in Grenoble, France. Smart Sustain. Built Environ. 2015. [Google Scholar] [CrossRef] [Green Version]
  13. Parn, E.A.; Edwards, D. Cyber threats confronting the digital built environment: Common data environment vulnerabilities and block chain deterrence. Eng. Constr. Archit. Manag. 2019. [Google Scholar] [CrossRef]
  14. Ghosh, A.; Edwards, D.J.; Hosseini, M.R. Patterns and trends in Internet of Things (IoT) research: Future applications in the construction industry. Eng. Constr. Archit. Manag. 2020. [Google Scholar] [CrossRef]
  15. Newman, C.; Edwards, D.; Martek, I.; Lai, J.; Thwala, W.D.; Rillie, I. Industry 4.0 deployment in the construction industry: A bibliometric literature review and UK-based case study. Smart Sustain. Built Environ. 2020. [Google Scholar] [CrossRef]
  16. Kineber, A.F.; Othman, I.; Oke, A.E.; Chileshe, N.; Buniya, M.K. Impact of Value Management on Building Projects Success: Structural Equation Modeling Approach. J. Constr. Eng. Manag. 2021, 147, 04021011. [Google Scholar] [CrossRef]
  17. Shirowzhan, S.; Sepasgozar, S.M.; Edwards, D.J.; Li, H.; Wang, C. BIM compatibility and its differentiation with interoperability challenges as an innovation factor. Autom. Constr. 2020, 112, 103086. [Google Scholar] [CrossRef]
  18. Autodesk. Building Information Modelling (BIM). 2020. Available online: https://www.autodesk.com/solutions/bim (accessed on 10 January 2021).
  19. Abubakar, M.; Ibrahim, Y.; Kado, D.; Bala, K. Contractors’ Perception of the Factors Affecting Building Information Modelling (BIM) Adoption in the Nigerian Construction Industry. Available online: https://www.researchgate.net/publication/269192661_Contractors’_Perception_of_the_Factors_Affecting_Building_Information_Modelling_BIM_Adoption_in_the_Nigerian_Construction_Industry (accessed on 30 January 2021).
  20. Pärn, E.A.; Edwards, D.J.; Sing, M.C. The building information modelling trajectory in facilities management: A review. Autom. Constr. 2017, 75, 45–55. [Google Scholar] [CrossRef] [Green Version]
  21. Oraee, M.; Hosseini, M.R.; Edwards, D.J.; Li, H.; Papadonikolaki, E.; Cao, D. Collaboration barriers in BIM-based construction networks: A conceptual model. Int. J. Proj. Manag. 2019, 37, 839–854. [Google Scholar] [CrossRef]
  22. Azhar, S. Building information modeling (BIM): Trends, benefits, risks, and challenges for the AEC industry. Leadersh. Manag. Eng. 2011, 11, 241–252. [Google Scholar] [CrossRef]
  23. Bianchini, C.; Inglese, C.; Ippolito, A.; Maiorino, D.; Senatore, L.J. Building Information Modeling (BIM): Great Misunderstanding or Potential Opportunities for the Design Disciplines? In Handbook of Research on Emerging Technologies for Digital Preservation and Information Modeling; IGI Global: Hershey, PA, USA, 2017; pp. 67–90. [Google Scholar]
  24. Yan, H.; Demian, P. Benefits and Barriers of Building Information Modelling; Tingshua University Press: Beijing, China, 2008. [Google Scholar]
  25. Olanrewaju, O.I.; Chileshe, N.; Babarinde, S.A.; Sandanayake, M. Investigating the barriers to building information modeling (BIM) implementation within the Nigerian construction industry. Eng. Constr. Archit. Manag. 2020, 27, 2931–2958. [Google Scholar] [CrossRef]
  26. Olanrewaju, O.; Babarinde, S.A.; Salihu, C. Current State of Building Information Modelling in the Nigerian Construction Industry. J. Sustain. Archit. Civ. Eng. Geod. 2020, 27, 63–77. [Google Scholar] [CrossRef]
  27. Babatunde, S.O.; Perera, S.; Ekundayo, D.; Adeleye, T.E. An investigation into BIM-based detailed cost estimating and drivers to the adoption of BIM in quantity surveying practices. J. Financ. Manag. Prop. Constr. Econ. Build. 2019, 25, 61–81. [Google Scholar] [CrossRef]
  28. Eadie, R.; Odeyinka, H.; Browne, M.; McKeown, C.; Yohanis, M. An analysis of the drivers for adopting building information modelling. J. Inf. Technol. Constr. 2013, 18, 338–352. [Google Scholar]
  29. Olawumi, T.O.; Chan, D.W. An empirical survey of the perceived benefits of executing BIM and sustainability practices in the built environment. Constr. Innov. 2019, 19, 321–342. [Google Scholar] [CrossRef]
  30. Chan, A.P.; Ho, D.C.; Tam, C. Design and build project success factors: Multivariate analysis. J. Constr. Eng. Manag. 2001, 127, 93–100. [Google Scholar] [CrossRef]
  31. Yu, A.T.; Shen, Q.; Kelly, J.; Lin, G. A value management approach to strategic briefing: An exploratory study. Archit. Eng. Des. Manag. 2006, 2, 245–259. [Google Scholar] [CrossRef]
  32. Rodgers, C.; Hosseini, M.R.; Chileshe, N.; Rameezdeen, R. Building information modelling (BIM) within the Australian construction related small and medium sized enterprises: Awareness, practices and drivers. In Proceedings of the ARCOM 2015 31st Annual Conference of the Association of Researchers in Construction Management, Lincoln, UK, 7–9 September 2015; pp. 691–700. [Google Scholar]
  33. Aghimien, D.O.; Oke, A.E.; Aigbavboa, C.O. Barriers to the adoption of value management in developing countries. Eng. Constr. Archit. Manag. 2018. [Google Scholar] [CrossRef]
  34. Olugboyega, O.; Edwards, D.J.; Windapo, A.O.; Omopariola, E.D.; Martek, I. Development of a conceptual model for evaluating the success of BIM-based construction projects. Smart Sustain. Built Environ. 2020. [Google Scholar] [CrossRef]
  35. NBS. NBS National BIM Report. 2014. Available online: https://www.thenbs.com/knowledge/nbs-national-bim-report-2014 (accessed on 30 January 2021).
  36. NBS. NBS National BIM Report. 2019. Available online: https://www.thenbs.com/knowledge/national-bim-report-2019 (accessed on 30 January 2021).
  37. McGraw-Hill. The Business Value of BIM in Australia and New Zealand: How Building Information Modelling Is Transforming the Design and Construction Industry. Available online: https://download.autodesk.com/temp/pdf/mcgraw_hill_business_value_of_bim_anz.pdf (accessed on 30 January 2021).
  38. Tookey, J.E. Shaving BIM: Establishing A Framework for Future BIM Research in New Zealand. Int. J. Constr. Supply Chain. Manag. 2012, 2, 66–79. [Google Scholar]
  39. Anifowose, O.M.; Babarinde, S.A.; Olanrewaju, O.I. Adoption level of building information modelling by selected professionals in Kwara state. Environ. Technol. Sci. J. 2018, 9, 35–44. [Google Scholar]
  40. Ogunmakinde, O.E.; Umeh, S. Adoption of BIM in the Nigerian Architecture Engineering and Construction (AEC) Industry. Available online: https://www.researchgate.net/publication/328031625_Adoption_of_BIM_in_the_Nigerian_Architecture_Engineering_and_Construction_AEC_Industry (accessed on 30 January 2021).
  41. Onungwa, I.O.; Uduma-Olugu, N. Building information modelling and collaboration in the Nigerian construction industry. J. Constr. Bus. Manag. Prod. Eng. Rev. 2017, 1, 1–10. [Google Scholar]
  42. Olapade, D.T.; Ekemode, B.G. Awareness and utilisation of building information modelling (BIM) for facility management (FM) in a developing economy: Experience from Lagos, Nigeria. J. Facil. Manag. 2018, 16, 387–395. [Google Scholar] [CrossRef]
  43. Gamil, Y.; Rahman, I.A.R. Awareness and challenges of building information modelling (BIM) implementation in the Yemen construction industry. J. Eng. Des. Technol. 2019, 17, 1077–1084. [Google Scholar] [CrossRef]
  44. Ismail, N.A.A.; Chiozzi, M.; Drogemuller, R. An Overview of BIM Uptake in Asian Developing Countries. Available online: https://www.researchgate.net/publication/321079523_An_overview_of_BIM_uptake_in_Asian_developing_countries (accessed on 10 January 2021).
  45. Mehran, D. Exploring the Adoption of BIM in the UAE Construction Industry for AEC Firms. Procedia Eng. 2016, 145, 1110–1118. [Google Scholar] [CrossRef] [Green Version]
  46. Shibani, A.; Ghostin, M.; Hassan, D.; Saidani, M.; Agha, A. Exploring the Impact of Implementing Building Information Modelling to Support Sustainable Development in the Lebanese Construction Industry: A Qualitative Approach. J. Mech. Civ. Eng. Geod. 2021, 7, 33–62. [Google Scholar]
  47. Akinradewo, O.; Oke, A.; Aigbavboa, C.; Molau, M. Assessment of the Level of Awareness of Robotics and Construction Automation in South African. In Collaboration and Integration in Construction, Engineering, Management and Technology; Springer: New York, NY, USA, 2021; pp. 129–132. [Google Scholar]
  48. Raouf, A.M.; Al-Ghamdi, S.G. Building information modelling and green buildings: Challenges and opportunities. Archit. Eng. Des. Manag. 2019, 15, 1–28. [Google Scholar] [CrossRef]
  49. Xu, X.; Ma, L.; Ding, L. A framework for BIM-enabled life-cycle information management of construction project. Int. J. Adv. Robot. Syst. 2014, 11, 126. [Google Scholar] [CrossRef]
  50. Pärn, E.; Edwards, D.; Sing, M.C. Origins and probabilities of MEP and structural design clashes within a federated BIM model. Autom. Constr. 2018, 85, 209–219. [Google Scholar] [CrossRef]
  51. Chahrour, R.; Hafeez, M.A.; Ahmad, A.M.; Sulieman, H.I.; Dawood, H.; Rodriguez-Trejo, S.; Kassem, M.; Naji, K.K.; Dawood, N. Cost-benefit analysis of BIM-enabled design clash detection and resolution. Constr. Manag. Econ. 2021, 39, 55–72. [Google Scholar] [CrossRef]
  52. McNamara, A.J.; Sepasgozar, S.M. Intelligent contract adoption in the construction industry: Concept development. Autom. Constr. 2021, 122, 103452. [Google Scholar] [CrossRef]
  53. Badi, S.; Ochieng, E.; Nasaj, M.; Papadaki, M. Technological, organisational and environmental determinants of smart contracts adoption: UK construction sector viewpoint. Constr. Manag. Econ. 2021, 39, 36–54. [Google Scholar] [CrossRef]
  54. Cheng, J.C.; Chen, W.; Chen, K.; Wang, Q. Data-driven predictive maintenance planning framework for MEP components based on BIM and IoT using machine learning algorithms. Autom. Constr. 2020, 112, 103087. [Google Scholar] [CrossRef]
  55. Eastman, C.M.; Eastman, C.; Teicholz, P.; Sacks, R.; Liston, K. BIM Handbook: A Guide to Building Information Modeling for Owners, Managers, Designers, Engineers and Contractors, 2nd ed; John Wiley & Sons: Hoboken, NJ, USA, 2011. [Google Scholar]
  56. Almukhtar, A.; Saeed, Z.O.; Abanda, H.; Tah, J.H. Reality capture of buildings using 3D laser scanners. Civ. Eng. 2021, 2, 214–235. [Google Scholar]
  57. Ham, Y.; Golparvar-Fard, M. Mapping actual thermal properties to building elements in gbXML-based BIM for reliable building energy performance modeling. Autom. Constr. 2015, 49, 214–224. [Google Scholar] [CrossRef]
  58. Sanhudo, L.; Ramos, N.M.; Martins, J.P.; Almeida, R.M.; Barreira, E.; Simões, M.L.; Cardoso, V. A framework for in-situ geometric data acquisition using laser scanning for BIM modelling. J. Build. Eng. 2020, 28, 101073. [Google Scholar] [CrossRef]
  59. Lagüela, S.; Díaz-Vilariño, L.; Armesto, J.; Arias, P. Non-destructive approach for the generation and thermal characterization of an as-built BIM. Constr. Build. Mater. 2014, 51, 55–61. [Google Scholar] [CrossRef]
  60. Sanhudo, L.; Ramos, N.M.; Martins, J.P.; Almeida, R.M.; Barreira, E.; Simões, M.L.; Cardoso, V. Building information modeling for energy retrofitting—A review. Renew. Sustain. Energy Rev. 2018, 89, 249–260. [Google Scholar] [CrossRef]
  61. Sun, L.; Pei, A.; Qi, X.; Cao, S.; Yang, R.; Liu, X. Dynamic Analysis of Digital Twin System Based on Five-Dimensional Model. In Proceedings of the Journal of Physics: Conference Series, Chengdu, China, 13–15 December 2019; p. 072038. [Google Scholar]
  62. Aheleroff, S.; Xu, X.; Zhong, R.Y.; Lu, Y. Digital twin as a service (DTaaS) in industry 4.0: An architecture reference model. Adv. Eng. Inform. 2021, 47, 101225. [Google Scholar] [CrossRef]
  63. Saka, A.B.; Chan, D.W. A scientometric review and metasynthesis of building information modelling (BIM) research in Africa. Buildings 2019, 9, 85. [Google Scholar] [CrossRef] [Green Version]
  64. Chan, D.W.; Olawumi, T.O.; Ho, A.M. Perceived benefits of and barriers to Building Information Modelling (BIM) implementation in construction: The case of Hong Kong. J. Build. Eng. 2019, 25, 100764. [Google Scholar] [CrossRef]
  65. Cavka, H.B.; Staub-French, S.; Poirier, E.A. Developing owner information requirements for BIM-enabled project delivery and asset management. Autom. Constr. 2017, 83, 169–183. [Google Scholar] [CrossRef]
  66. Nieto-Julián, J.E.; Lara, L.; Moyano, J.J.S. Implementation of a TeamWork-HBIM for the Management and Sustainability of Architectural Heritage. Sustainability 2021, 13, 2161. [Google Scholar] [CrossRef]
  67. Stransky, M.; Dlask, P. Process of matching work items between bim model and cost estimating software. Eng. Rural. Dev. 2018, 17, 856–864. [Google Scholar] [CrossRef]
  68. Nagalingam, G.; Jayasena, H.S.; Ranadewa, K. Building information modelling and future quantity surveyor’s practice in Sri Lankan construction industry. In Proceedings of the Second World Construction Symposium, Colombo, Sri Lanka, 14–15 June 2013; pp. 81–92. [Google Scholar]
  69. Chileshe, N.; Jayasinghe, R.S.; Rameezdeen, R. Information flow-centric approach for reverse logistics supply chains. Autom. Constr. 2019, 106, 102858. [Google Scholar] [CrossRef]
  70. Wu, J.; Lepech, M.D. Incorporating multi-physics deterioration analysis in building information modeling for life-cycle management of durability performance. Autom. Constr. 2020, 110, 103004. [Google Scholar] [CrossRef]
  71. Amarasinghe, I.A.; Soorige, D.; Geekiyanage, D. Comparative study on Life Cycle Assessment of buildings in developed countries and Sri Lanka. Built Environ. Proj. Asset Manag. 2021. [Google Scholar] [CrossRef]
  72. Lin, Y.-C.; Hsu, Y.-T. Enhancing the Visualization of Problems Tracking and Management Integrated BIM Technology for General Contractor in Construction. In Collaboration and Integration in Construction, Engineering, Management and Technology; Springer: New York, NY, USA, 2021; pp. 427–432. [Google Scholar]
  73. Aghimien, D.O.; Aigbavboa, C.; Edwards, D.J.; Mahamadu, A.-M.; Olomolaiye, P.; Nash, H.; Onyia, M. A fuzzy synthetic evaluation of the challenges of smart city development in developing countries. Smart Sustain. Built Environ. 2020. [Google Scholar] [CrossRef]
  74. Edwards, D.J.; Rillie, I.; Chileshe, N.; Lai, J.; Hosseini, M.R.; Thwala, W.D. A field survey of hand-arm vibration exposure in the UK utilities sector. Eng. Constr. Archit. Manag. 2020. [Google Scholar] [CrossRef]
  75. Shields, P.M.; Tajalli, H. Intermediate theory: The missing link in successful student scholarship. J. Public Aff. Educ. 2006, 12, 313–334. [Google Scholar] [CrossRef] [Green Version]
  76. Chileshe, N.; Rameezdeen, R.; Hosseini, M.R.; Martek, I.; Li, H.X.; Panjehbashi-Aghdam, P. Factors driving the implementation of reverse logistics: A quantified model for the construction industry. Waste Manag. 2018, 79, 48–57. [Google Scholar] [CrossRef]
  77. Christensen, C.M. The ongoing process of building a theory of disruption. J. Prod. Innov. Manag. 2006, 23, 39–55. [Google Scholar] [CrossRef]
  78. Kineber, A.F.; Othman, I.; Oke, A.E.; Chileshe, N.; Alsolami, B. Critical Value Management Activities in Building Projects: A Case of Egypt. Buildings 2020, 10, 239. [Google Scholar] [CrossRef]
  79. Kineber, A.F.; Othman, I.; Oke, A.E.; Chileshe, N.; Buniya, M.K. Identifying and Assessing Sustainable Value Management Implementation Activities in Developing Countries:The Case of Egypt. Sustainability 2020, 12, 9143. [Google Scholar] [CrossRef]
  80. Oke, A.E.; Kineber, A.F.; Albukhari, I.; Othman, I.; Kingsley, C. Assessment of Cloud Computing Success Factors for Sustainable Construction Industry: The Case of Nigeria. Buildings 2021, 11, 36. [Google Scholar] [CrossRef]
  81. Gilham, B. Developing a Questionnaire, 2nd ed.; Bloomsbury: London, UK, 2015; ISBN 978-0-826409631-7. [Google Scholar]
  82. Collins, H. Creative Research: The Theory and Practice of Research for the Creative Industries; Bloomsbury: London, UK, 2018. [Google Scholar]
  83. Babatunde, S.O.; Ekundayo, D.; Adekunle, A.O.; Bello, W. Comparative analysis of drivers to BIM adoption among AEC firms in developing countries: A case of Nigeria. J. Eng. Des. Technol. 2020. [Google Scholar] [CrossRef] [Green Version]
  84. Santos, J.R. Cronbach’s alpha: A tool for assessing the reliability of scales. J. Ext. 1999, 37, 1–5. [Google Scholar]
  85. Buniya, M.K.; Othman, I.; Durdyev, S.; Sunindijo, R.Y.; Ismail, S.; Kineber, A.F. Safety Program Elements in the Construction Industry: The Case of Iraq. Int. J. Environ. Res. Public Health 2021, 18, 411. [Google Scholar] [CrossRef]
  86. Adedokun, O.A.; Ibironke, O.T.; Olanipekun, A.O. Vulnerability of motivation schemes in enhancing site workers productivity for construction industry’s sustainability in Nigeria. Int. J. Sustain. Constr. Eng. Technol. 2013, 4, 21–30. [Google Scholar]
  87. Byrne, B.M.; Group, F. Structural equation modeling with AMOS: Basic concepts, applications, and programming (multivariate applications series). N. Y. Taylor Fr. Group 2010, 396, 7384. [Google Scholar]
  88. Chen, Y.; Dib, H.; Cox, R.F.; Shaurette, M.; Vorvoreanu, M. Structural equation model of building information modeling maturity. J. Constr. Eng. Manag. Prod. Eng. Rev. 2016, 142, 04016032. [Google Scholar] [CrossRef]
  89. Chang, C.-Y.; Pan, W.; Howard, R. Impact of building information modeling implementation on the acceptance of integrated delivery systems: Structural equation modeling analysis. J. Constr. Eng. Manag. Prod. Eng. Rev. 2017, 143, 04017044. [Google Scholar] [CrossRef]
  90. Okakpu, A.; GhaffarianHoseini, A.; Tookey, J.; Haar, J.; Ghaffarianhoseini, A. Exploring the environmental influence on BIM adoption for refurbishment project using structural equation modelling. Archit. Eng. Des. Manag. 2020, 16, 41–57. [Google Scholar] [CrossRef]
  91. Kineber, A.F.; Othman, I.; Oke, A.E.; Chileshe, N.; Zayed, T. Exploring the value management critical success factors for sustainable residential building—A structural equation modelling approach. J. Clean. Prod. 2021, 126115. [Google Scholar] [CrossRef]
  92. Podsakoff, P.M.; MacKenzie, S.B.; Lee, J.-Y.; Podsakoff, N.P. Common method biases in behavioral research: A critical review of the literature and recommended remedies. J. Appl. Psychol. 2003, 88, 879. [Google Scholar] [CrossRef]
  93. Williams, L.J.; Cote, J.A.; Buckley, M.R. Lack of method variance in self-reported affect and perceptions at work: Reality or artifact? J. Appl. Psychol. 1989, 74, 462. [Google Scholar] [CrossRef]
  94. Strandholm, K.; Kumar, K.; Subramanian, R. Examining the interrelationships among perceived environmental change, strategic response, managerial characteristics, and organizational performance. J. Bus. Res. 2004, 57, 58–68. [Google Scholar] [CrossRef]
  95. Harman, H.H. Modern Factor Analysis; University of Chicago press: Chicago, IL, USA, 1967. [Google Scholar]
  96. Al-Ashmori, Y.Y.; Othman, I.; Rahmawati, Y.; Amran, Y.M.; Sabah, S.A.; Rafindadi, A.D.u.; Mikić, M. BIM benefits and its influence on the BIM implementation in Malaysia. Ain Shams Eng. J. 2020, 11, 1013–1019. [Google Scholar] [CrossRef]
  97. Hulland, J. Use of partial least squares (PLS) in strategic management research: A review of four recent studies. Strateg. Manag. J. 1999, 20, 195–204. [Google Scholar] [CrossRef]
  98. Hair, J.F.; Anderson, R.E.; Babin, B.J.; Black, W.C. Multivariate Data Analysis: A Global Perspective; Pearson: Upper Saddle River, NJ, USA, 2010; Volume 7. [Google Scholar]
  99. Al-Mekhlafi, A.-B.A.; Isha, A.S.N.; Chileshe, N.; Abdulrab, M.; Saeed, A.A.H.; Kineber, A.F. Modelling the Relationship between the Nature of Work Factors and Driving Performance Mediating by Role of Fatigue. Int. J. Environ. Res. Public Health 2021, 18, 6752. [Google Scholar] [CrossRef]
  100. Tabachnick, B.G.; Fidell, L.S.; Ullman, J.B. Using Multivariate Statistics; Pearson: Boston, MA, USA, 2007; Volume 5. [Google Scholar]
  101. MacKenzie, S.B.; Podsakoff, P.M. Common method bias in marketing: Causes, mechanisms, and procedural remedies. J. Retail. 2012, 88, 542–555. [Google Scholar] [CrossRef]
  102. Podsakoff, P.M.; Organ, D.W. Self-reports in organizational research: Problems and prospects. J. Manag. 1986, 12, 531–544. [Google Scholar] [CrossRef]
  103. Hair, J.F., Jr.; Matthews, L.M.; Matthews, R.L.; Sarstedt, M. PLS-SEM or CB-SEM: Updated guidelines on which method to use. Int. J. Multivar. Data Anal. 2017, 1, 107–123. [Google Scholar] [CrossRef]
  104. Henseler, J.; Ringle, C.M.; Sinkovics, R.R. The use of partial least squares path modeling in international marketing. In New Challenges to International Marketing; Emerald Group Publishing Limited: Bingley, UK, 2009. [Google Scholar]
  105. Wong, K.K.-K. Partial least squares structural equation modeling (PLS-SEM) techniques using SmartPLS. Mark. Bull. 2013, 24, 1–32. [Google Scholar]
  106. Bagozzi, R.P.; Yi, Y. Specification, evaluation, and interpretation of structural equation models. J. Acad. Mark. Sci. 2012, 40, 8–34. [Google Scholar] [CrossRef]
  107. Perry, R.H.; Charlotte, B.; Isabella, M.; Bob, C. SPSS Explained; Routledge: London, UK, 2004. [Google Scholar]
  108. Hair, J.F.; Ringle, C.M.; Sarstedt, M. Partial least squares structural equation modeling: Rigorous applications, better results and higher acceptance. Long Range Plan. 2013, 46, 1–12. [Google Scholar] [CrossRef]
  109. Fornell, C.; Larcker, D.F. Evaluating structural equation models with unobservable variables and measurement error. J. Mark. Res. 1981, 18, 39–50. [Google Scholar] [CrossRef]
  110. Hair, J.F.; Black, W.C.; Babin, B.J.; Anderson, R.E.; Tatham, R.L. Multivariate Data Analysis. In Humans: Critique and Reformulation, 6th ed.; Pearson Prentice Hall: Hoboken, NJ, USA, 2006; Volume 87, pp. 49–74. [Google Scholar]
  111. Chin, W.W. The partial least squares approach to structural equation modelling. Mod. Methods Bus. Res. 1998, 295, 295–336. [Google Scholar]
  112. Olanrewaju, O.I.; Oyewobi, L.O.; Idiake, J.E.; Alumbugu, P.; Babarinde, S.A.; Oke, A.E. Nexus of economic recession and building construction cost in Nigeria. J. Niger. Inst. Quant. Surv. 2019. [Google Scholar] [CrossRef]
  113. Ringle, C.; Da Silva, D.; Bido, D.; Ringle, C. Structural Equation Modeling with the SmartPLS. Available online: https://www.researchgate.net/publication/281448905_STRUCTURAL_EQUATION_MODELING_WITH_THE_SMARTPLS (accessed on 30 January 2021).
  114. Chin, W.W. Commentary: Issues and opinion on structural equation modeling. JSTOR 1998, 22, vii–xvi. [Google Scholar]
  115. Hair, J.F.; Ringle, C.M.; Sarstedt, M. PLS-SEM: Indeed a silver bullet. J. Mark. Theory Pract. 2011, 19, 139–152. [Google Scholar] [CrossRef]
  116. Švajlenka, J.; Kozlovská, M. Perception of user criteria in the context of sustainability of modern methods of construction based on wood. Sustainability 2018, 10, 116. [Google Scholar] [CrossRef] [Green Version]
  117. Švajlenka, J.; Kozlovská, M.; Pošiváková, T. Analysis of selected building constructions used in industrial construction in terms of sustainability benefits. Sustainability 2018, 10, 4394. [Google Scholar] [CrossRef] [Green Version]
  118. Švajlenka, J.; Kozlovská, M. Evaluation of the efficiency and sustainability of timber-based construction. J. Clean. Prod. 2020, 259, 120835. [Google Scholar] [CrossRef]
  119. Spychalska-Wojtkiewicz, M. The Relation between Sustainable Development Trends and Customer Value Management. Sustainability 2020, 12, 5496. [Google Scholar] [CrossRef]
  120. Al-Atesh, E.; Rahmawati, Y.; Zawawi, N.A.W.A. Sustainability Criteria for Green Building Material Selection in the Malaysian Construction Industry. Available online: https://www.researchgate.net/publication/348159484_Sustainability_Criteria_for_Green_Building_Material_Selection_in_the_Malaysian_Construction_Industry (accessed on 1 January 2021).
  121. Vass, S.; Gustavsson, T.K. Challenges when implementing BIM for industry change. Constr. Manag. Econ. 2017, 35, 597–610. [Google Scholar] [CrossRef]
  122. Biancardo, S.A.; Viscione, N.; Oreto, C.; Veropalumbo, R.; Abbondati, F. BIM approach for modeling airports terminal expansion. Infrastructures 2020, 5, 41. [Google Scholar] [CrossRef]
  123. Ghaffarianhoseini, A.; Tookey, J.; Ghaffarianhoseini, A.; Naismith, N.; Azhar, S.; Efimova, O.; Raahemifar, K. Building Information Modelling (BIM) uptake: Clear benefits, understanding its implementation, risks and challenges. Renew. Sustain. Energy Rev. 2017, 75, 1046–1053. [Google Scholar] [CrossRef]
  124. Ibem, E.; Uwakonye, U.; Akpoiroro, G.; Somtochukwu, M.; Oke, C. Building information modeling (BIM) adoption in architectural firms in Lagos, Nigeria. Int. J. Civ. Eng. Technol. 2018, 9, 902–915. [Google Scholar]
  125. Wu, S.; Wood, G.; Ginige, K.; Jong, S.W. A technical review of BIM based cost estimating in UK quantity surveying practice, standards and tools. J. Inf. Technol. Constr. 2014, 19, 534–562. [Google Scholar]
  126. Sidani, A.; Dinis, F.M.; Duarte, J.; Sanhudo, L.; Calvetti, D.; Baptista, J.S.; Martins, J.P.; Soeiro, A. Recent Tools and Techniques of BIM-Based Augmented Reality: A Systematic Review. J. Build. Eng. 2021, 102500. [Google Scholar] [CrossRef]
  127. Olanrewaju, A.F.K.O.I.; Chileshe, N.; Edwards, D.J. Analysis of the role of Building Information Modelling (BIM) Implementation drivers and awareness on Project Lifecycle. Sustainability 2021, submitted. [Google Scholar]
  128. Delgado, J.M.D.; Oyedele, L.; Ajayi, A.; Akanbi, L.; Akinade, O.; Bilal, M.; Owolabi, H.J.J.o.B.E. Robotics and automated systems in construction: Understanding industry-specific challenges for adoption. J. Build. Eng. 2019, 26, 100868. [Google Scholar] [CrossRef]
Figure 1. Research design.
Sustainability 13 08887 g001
Figure 2. Conceptual model.
Sustainability 13 08887 g002
Figure 3. The PLS initial model with outer loading and R2.
Sustainability 13 08887 g003
Figure 4. The PLS modified model with outer loading and R2.
Sustainability 13 08887 g004
Figure 5. Performing bootstrapping analysis with path coefficients and p-value.
Sustainability 13 08887 g005
Table 1. BIM usage and awareness in project lifecycle.
ConstructsCode
Design stage
Cost EstimationAW1
Construction PlanningAW2
3D CoordinationAW3
PrefabricationAW4
VisualizationAW5
Constructability AnalysisAW6
SequencingAW7
Construction stage
Construction MonitoringAW10
Maintenance SchedulingAW11
FabricationAW12
Operation stage
Asset Management AW13
Building System AnalysisAW8
Record ModellingAW9
Note: Adapted from Olanrewaju, et al. [2].
Table 2. Drivers of BIM implementation.
DriversCode
Construction-related driver
Construction planning and monitoringD13
Synchronized design and construction planningD12
Facilities management record modelD14
Improved decision-making processD11
Improved productivity and collaborationD10
Process-digitalization- and economics-related driver
BIM-enabled estimating capabilitiesD2
Controlled whole-life costs and environmental dataD4
Potential economic benefitsD3
Lifecycle dataD8
Sustainability- and efficiency-related driver
Green building standards incorporationD6
Increased efficiency and coordinationD9
Improved customer serviceD7
Visualization- and productivity-related driver
Construction process visualizationD1
Improved quality and increased sustainabilityD5
Note: Adapted from Olanrewaju, et al. [2].
Table 3. Construct reliability and validity tests.
ConstructsItemOuter LoadingCronbach’s AlphaComposite ReliabilityAVE
InitialModified
ConstructionD100.8090.8080.8770.9100.670
D110.8260.826
D120.8110.811
D130.8680.868
D140.7780.778
Process digitalization and economicsD20.8220.8220.8100.8760.638
D30.7370.737
D40.8040.804
D80.8280.828
Sustainability and efficiencyD60.7490.7490.6740.8200.604
D70.7700.770
D90.8100.811
Visualization and productivityD10.7550.7560.6020.8260.705
D50.9170.916
Awareness of BIM (design stage)AW10.7320.7320.8760.9040.574
AW20.7590.759
AW30.7830.783
AW40.7570.757
AW50.8030.803
AW60.7870.787
AW70.6760.676
Awareness of BIM (construction stage)AW100.7860.8250.7910.8630.615
AW110.604Deleted *
AW120.566Deleted *
AW130.6860.649
AW80.7690.823
AW90.7960.824
Awareness of BIM (operation stage)A10.8160.8160.7390.8520.661
A20.9140.914
A30.6950.694
* Deleted items.
Table 4. Correlation of latent variables and discriminant validity (Fornell–Larcker).
ConstructsAwareness of BIM
(Construction Stage)
Awareness of BIM
(Design Stage)
Awareness of BIM
(Operation Stage)
ConstructionProcess Digitalization and EconomicsSustainability and EfficiencyVisualization and Productivity
Awareness of BIM (construction stage)0.784
Awareness of BIM (design stage)0.6130.758
Awareness of BIM (operation stage)0.9290.8120.813
Construction0.4910.4060.4860.819
Process digitalization and economics0.4390.3440.4770.6190.799
Sustainability and Efficiency0.4010.3440.4120.6640.6650.777
Visualization and Productivity0.260.2530.2660.5060.5830.5670.84
Notes: Values in bold represent the square root of the AVE.
Table 5. Cross-loadings to test the discriminant validity of indicators.
ItemsAwareness of BIM
(Operation Stage)
Awareness of BIM
(Construction Stage)
Awareness of BIM
(Design Stage)
ConstructionProcess Digitalization and EconomicsSustainability and EfficiencyVisualization and Productivity
A10.8160.6190.9980.4010.3370.3430.244
A20.9140.980.6410.490.4380.390.256
A30.6940.6180.2980.2630.3940.2570.132
AW100.7310.8250.4820.4590.3850.3870.206
AW130.6020.6490.2640.2630.2450.2350.165
AW80.7630.8230.5260.3830.3440.2390.195
AW90.8050.8240.60.4010.3780.3670.244
AW10.5670.4050.7320.3620.3420.2310.268
AW20.5090.3230.7590.2880.30.2860.315
AW30.6280.5060.7830.2860.2150.1960.158
AW40.6320.4720.7570.3080.2980.2710.061
AW50.6690.4910.8030.2430.1830.2170.174
AW60.6590.5110.7870.310.2560.2840.205
AW70.6580.570.6760.3260.1820.3190.122
D100.2990.2990.2170.8080.5770.6170.416
D110.4580.4490.4140.8260.5460.6520.481
D120.3420.4010.2860.8110.3550.5250.424
D130.5170.4780.4550.8680.5190.5330.364
D140.3640.380.2790.7780.5210.3680.383
D20.3970.3190.3170.3860.8220.4220.403
D30.4330.4090.3220.4940.7370.4710.539
D40.3560.3250.2550.5890.8040.5290.445
D80.3450.3480.2150.4890.8280.6790.47
D60.3030.2740.2470.3520.4550.7490.419
D70.4150.4230.2640.4850.5650.770.419
D90.2510.2440.2870.670.5240.8110.48
D10.1640.150.2140.3010.3510.2910.756
D50.2660.2680.2190.5140.5880.6030.916
Table 6. Test of second-order models using bootstrapping for formative constructs.
PathβSET Valuesp ValuesVIF
Construction → BIM Drivers0.4710.03912.179<0.0012.015
Process digitalization and economics → BIM Drivers0.3410.03210.765<0.0012.174
Sustainability and efficiency → BIM Drivers0.2240.0268.744<0.0022.316
Visualization and productivity → BIM Drivers0.1360.0255.534<0.0031.682
Table 7. List of hypotheses and relative paths for the model.
PathβSET Valuep-Value
BIM Drivers → Awareness of BIM (construction stage)0.5120.0717.23<0.001
BIM Drivers → Awareness of BIM (design stage)0.4260.0954.456<0.001
BIM Drivers → Awareness of BIM (operation stage)0.5270.0796.676<0.001
Table 8. Results of the explanatory power of the structural model (R2).
Endogenous Latent VariableR SquareR Square AdjustedExplained Size
Awareness of BIM (construction stage)0.2620.253Moderate
Awareness of BIM (design stage)0.1810.172Moderate
Awareness of BIM (operation stage)0.2770.269Moderate
Table 9. Results of predictive relevance (Q2).
Endogenous Latent VariableSSOSSEQ2 (=1 − SSE/SSO)
Awareness of BIM (construction stage)360305.5270.151
Awareness of BIM (design stage)630572.8990.091
Awareness of BIM (operation stage)270223.7630.171
Publisher’s Note: MDPI stays neutral with regard to jurisdictional claims in published maps and institutional affiliations.

