Abstract
This research aims to develop a safety culture model by investigating the relationship between safety culture and driving performance. In previous studies, safety culture has been one of the factors that determine safety issues. These issues were then contextually transformed via a pilot study and organized in the form of a theoretical model. The data were collected from 307 oil and gas tanker drivers in Malaysia through questionnaire surveys. Consequently, structural equation models of partial least squares (PLS-SEM) were applied to statistically assess the final model of this study. The results showed that the implementation of safety culture contributes to driving performance at a substantial level; there is a strong association with an effect of 67.3%. The findings of this research would serve as a benchmark for decision-makers in the oil and gas transportation sector, as promoting an awareness of safety culture should boost the efficiency of drivers. This research fills a gap in knowledge by identifying that positive safety culture practices and mindset are direct antecedents for the improvement of driver performance and, thus, the avoidance of road accidents.
1. Introduction
Transportation is one of the most important areas in many sectors. In the transportation industry, fatigue in truck drivers is generally identified as the main safety issue because it has consistently been linked to road crashes [1,2,3,4,5,6]. A transportation department study from the United States reported that three independent studies identified lack of alertness or driving fatigue as one of the main reasons for serious accidents [3]. Fatigue has been linked to 10–20% of road accidents [7,8,9,10,11]. Furthermore, another truck driver study showed that 19% of tractor-trailer drivers have confirmed falling asleep at the wheel once or more in the month [12]. The association between rates of road accidents and fatigue is well documented [13]. Perceptions of what constitutes a safe environment may be different from person to person, for instance the perceptions of the safety directors may differ from those of the dispatchers. These perceptual differences may represent a tendency to disconnect from negative results and connect to positive results, depending on the self-serving motivations and bias of the individual [14]. In fact, there is evidence to show that people explain and interpret their safety environments according to their beliefs, the perceived importance of events, and the impact of particular issues on their well-being [15]. Therefore, there is a need for the implementation of a safety culture that prevents accidents, efficiently saves resources, and mitigates losses [16].
Safety culture is considered to be the result of personal and collective attitudes, beliefs, and behaviour patterns, and it determines the commitment, willingness, style, and ability of organizations to manage health and safety issues [17]. In many countries, safety culture in the oil and gas industry is fundamentally competitive because it is one of the global requirements for sustainable growth. The association between strong safety culture and the occurrence and seriousness of accidents has long been recognized in various industrial environments [18,19]. Moreover, the literature review on safety culture has identified several management practices, i.e., beliefs and values, which underline the relevance of health and safety and could contribute to a strong safety culture [20]. In many manufacturing environments, the existence of a solid safety culture has produced a positive effect on safety consequences [21,22]. Perceptions of health and safety in workplace conditions have been linked to variables of incidents, such as near accidents, accident rates, and anxiety [23]. In addition, the safety expectations of the workers could be affected by their compliance with safety practices [23,24].
Previous studies in the Malaysian oil and gas transportation sector have examined the effects of exhaustion-related psychological risk factors [25], psychological well-being and fatigue [26,27], perceived stress [28], and driving fatigue [4,29]. Although these factors are important, the impact of safety culture on driving performance has been neglected. Currently, there is an urgent need to address the low performance of Malaysian oil and gas tanker drivers, which is caused by a lack of safety culture. There is a lack of evidence for the ways in which safety culture affects driving performance in the context of oil and gas transportation, especially in Malaysia [4]. Therefore, we set out the following research question for this empirical study: what is the impact of safety culture on oil and gas tanker driver performance? The present study aims to make up for the lack of empirical research on the effects of safety culture on driving performance in the Malaysian oil and gas transportation context via the partial least square modelling approach (PLS-SEM). This study would provide insights for decision-makers into how accidents in the oil and gas transportation sector might be reduced through an understanding of the ways in which general management practices lead to enhanced safety cultures, and also the extent to which drivers’ perceptions of these practices vary among oil and gas transportation companies.
2. Literature Review
2.1. Safety Culture
Safety culture has been an interesting subject worldwide for both scientists and researchers because it is responsible for many organizational accidents and disasters [30]. Safety culture plays a crucial role in assessing the success or failure of an organization [31]. The term safety culture was coined as a result of the Chernobyl disaster in 1986 [32]. Safety culture refers to the extent to which individuals and organizations are committed to taking personal responsibility for safety, act to recognize and communicate safety concerns, adapt and modify behaviour based on lessons learned from previous mistakes, and how they are rewarded in line with these values [33]. According to Choudhry [30], safety culture can be defined as the outcome of the attitudes, values, competencies, and behavioural habits of the individuals and the groups that represent the organization’s commitment to effective health and safety programs.
Using social cognitive theory, Bandura [34] attempted to understand the principle of safety culture as mutual determinism and derived three elements: behaviour, the individual, and the environment. Geller [35] adopted Bandura [34] and has been working to define the characteristics of each part, which has led to the development of a Total Safety Culture model. Choudhry et al. (2007) likewise adopted and developed Bandura (1986), and asserted by his modern paradigm that safety culture is a substance focused on interactions between individuals, workplaces, and organizations.
In summary, the literature revealed that safety culture is a term that has been tested outside the context of the Malaysian oil and gas sector, for instance, in construction companies, [36,37,38,39], vocational colleges [40], the manufacturing industry [31,41], and health care organizations [42]. Further attention is required to examine the safety culture in oil and gas transportation companies. This effort will enrich the understanding of safety culture in the oil and gas transportation context.
2.2. Driving Performance
Driving performance refers to a driver’s effectiveness in accomplishing driving duty, which can be measured by studying driver vigilance, driver reaction time, and attention to duties [43,44,45]. In general, performance is the accomplishment of a specific job measured against recognized precision, completeness, speed, and cost. In a contract, performance is deemed to be the fulfilment of an obligation [46]. Driving performance involves attention [47] (which must often be split between driving duties such as maintenance of the lane position), speed, and other tasks, such as those which deal with dashboard instruments. The growing number of “technological” automotive distractions (e.g., smartphones, GPS, and entertainment systems) competing for driver attention is particularly worrying. Such distractions have been one of the primary causes of performance deficiency [48,49].
Previous research in the last decade has indicated that driving performance is influenced by several factors. These include driving for prolonged periods, monotonous environments [50,51,52], personality traits, age, executive functions [53], foggy conditions [54], drowsiness [55], a loss of focus [56], mental workload, the demand of the task [57,58], speed [54], and driver distractions, such as alcohol and energy drinks, eating, texting, loud music, mobile phone and smartwatch use, and caffeine [47,59,60,61,62,63,64]. Although the above studies focused on many important factors that influence driving performance, to date, the effect of safety culture on driving performance has not yet been empirically investigated.
2.3. Safety Culture and Driving Performance
In the transportation sector, safety measures are crucial and there is an ever-increasing demand for safe environments. Previous studies have discussed transport safety, including safety performance and safety cultures. Rigid safety requirements may create issues for tight scheduling requirements [65,66,67,68,69]. Moreover, these activities often lead to physical and mental fatigue, which lead to deteriorating levels of performance and safety [70]. Another study demonstrated that human accidents are caused by poor safety culture and other associated factors [71]. The safety of a journey relies mainly on the performance of the driver. The driver is the leading human operating a car, and in this specific situation, the car is considered the machine. The duties of the driver are very challenging because they must satisfy the many different demands and requests of a job [72]. They must also retain their driving skills, particularly in instances when the vehicle in question is a train or a commercial truck, and be attentive and environmentally friendly during monotonous journeys [73,74]. Both simulated and real case studies have demonstrated the connection between safety culture and impaired performance [70,75], medical and health services [68], manufacturing [76], vehicle driving [50], train driving [77,78], and oil and gas upstream operation [79].
2.4. Literature Summary and Contributions of This Study
In summary, previous studies have proven that there is empirical evidence for the relationship between safety culture and employee performance [66,67,75,80], medical and health services [68], manufacturing [76], operating nuclear power [65], vehicle driving [50,70], the rail industry [71,72,73,74,77,78], and oil and gas upstream operation [79,81]. However, the literature of previous studies shows that there is a lack of evidence for the relationship between safety culture and driving performance in the oil and gas transportation context, especially in Malaysia. Therefore, Figure 1 shows the hypothesis proposed for this study. Theoretically, based on the literature review, the current study will contribute to the body of knowledge by investigating the impact of safety culture on driving performance. Practically, this study is among the first studies that will examine this relationship in the oil and gas transportation sector.
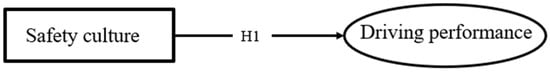
Figure 1.
Influence of safety culture on driving performance.
Hypothesis 1.
safety culture has a significant impact on the driving performance of oil and gas tanker drivers.
3. Method
A conceptual model begins to develop the research approach. A literature review is summarized as the conceptual model to establish the theory underpinning (hypothesis) the analysis, which will be examined by empirical evidence [82]. This approach is based on a three-phase procedure: (i) identifying model constructs, (ii) categorization of constructs, and (iii) specifying relationships between these constructs [83]. The conceptual model is displayed in Figure 1. The procedure that followed and the research design are outlined in Figure 2, adapted from Kineber [84].
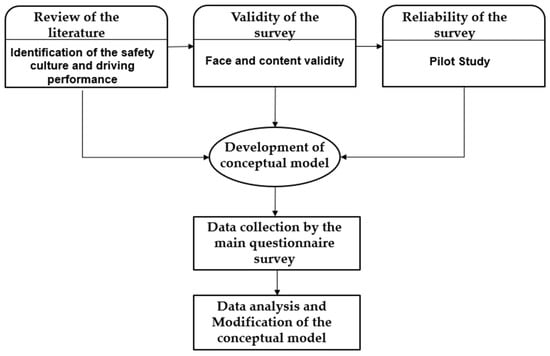
Figure 2.
Research design.
Throughout previous literature, the studies adapted measuring instruments for safety culture and driving performance. Consequently, this study conducted three phases of questionnaire surveys. The first phase is the face and content validity of the survey. The second phase consists of a pilot study, which is important for testing the reliability and validity of the instruments before the main study has been carried out [85]. The last phase is the main survey, which tests the theoretical hypothesis.
3.1. Design of Survey
A systematic, cross-sectional questionnaire was developed based on the literature review. Appropriate changes were made according to the preliminary questionnaire (pilot study). The research has taken place in regions of Malaysia. To determine the impact of safety culture on driving performance, a wide range of potential oil and gas tanker drivers were approached and asked to complete the main questionnaire. The sample size was dependent on the methodological analyses of the Morgan table [86]. Kline [87] believes that a sophisticated path model requires about 200 samples or more, while Yin [88] recommends that the SEM sample size should exceed 100. This study utilized the SEM analysis approach; using random stratified sampling techniques, the total 357 surveys were distributed among tanker drivers working in oil and gas transportation companies. The survey was taken in person (self-administrated) and resulted in a high response rate of about 85.9% [89].
This questionnaire has been designed in two main parts: part one, demographic information of the respondents; part two, factors designed to measure two variables utilizing a five-point Likert scale ranging from “1” (never) to “5” (always), using instruments that have been adapted from previous studies [90,91,92]. Safety culture measures safety responsibility, communication, and the role of communication in the development of safety culture, along with management attitudes to safety and patterns of driver behaviour that determine the commitment to health and safety during driving duties. Driving performance, meanwhile, measures driver attention, vigilance, and reaction time, as shown in Table 1.

Table 1.
Questionnaire items.
Distribution and collection of the questionnaire was done manually, and the data obtained were then stored in the online database with an acceptable response rate of 85.9%. To further conduct numerous data screening tests, the data were filtered and entered into statistical software. Before starting the data screening process, the items of measurement were keyed in and coded. Outliers found in the results were eliminated, meaning the tests carried out in the data screening were reduced to 304.
3.2. Analysis Approach Structured Equation Modelling (SEM)
To investigate the influence of safety culture on driving performance, four approaches from the literature review were evaluated and compared in order to choose the best approach for the implementation of safety culture and to create the driving performance model. The four approaches were multiple linear regressions (MLR), system dynamic (SD), artificial neural network (ANN), and structural equation modelling (SEM). First, the regression equation has not been used because the relationship between variables is not observed, and this is an important limiting requirement when using the equation of regression. Second, the system dynamics method could not be employed due to the nature of the data, specifically because the data are unrelated to time. Third, the artificial neural network is a predictive method, whereas the essence of this research is to test the influence of safety culture on driving performance. Lastly, the structural equation modelling (SEM) method describes the relationship between many measurable and non-observable variables, making this approach suitable for the requirements of the study. The SEM is a useful method for dealing with errors in variables [95]. In this research, the SEM approach was employed to establish the relationship between safety culture and driving performance and to create the model. Byrne [96] has noted that structural equation modelling has now developed into a non-experimental research method, whilst techniques to hypothesis assessment have not been recognized previously. Furthermore, Yuan [97] concluded that structural equation modelling is a common and well-known approach to analysing data in social science research.
Hair et al. [98] highlighted that partial least squares (PLS) are now well known as an alternative to the SEM approach. Among other programs such as AMOS and LISREL, the PLS-SEM is a flexible and useful instrument for the building and prediction of statistical models [99]. The relatively recent approach operates well with structural equation models, incorporating latent variables and a series of cause and effect relationships. The PLS path model is more suitable for complex models, such as those with hierarchical structures and a complete disaggregation technique [100].
In previous research, the SEM analysis method has been utilized in the transportation sector [101,102,103], the construction industry [84,89,104,105], competitive performance [106], organization and the environment [107,108], and higher education [109]. To test the relationship between safety culture and driving performance, the partial least square (PLS) has been employed to evaluate the impact of safety culture on driving performance.
4. Results
4.1. Common Method Bias
Common method bias explains the variance in the results of an analysis (or error) as being attributed to the measurement method rather than to the constructs that are described through the measurements [110]. Common method bias may also be defined as the overlap between the variance that is ascribed to constructs and that which is ascribed to the measuring instruments [110]. Common method bias is a very important test when analysing data collected by self-administered means, such as survey questionnaires [111,112]. In some instances, data from self-reports might be exaggerated which will affect on results of the case under investigation, which would cause problems [112,113]. Therefore, it is important to address these problems to detect any biased data, particularly for this study, because the data are self-reported and collected from a single source. According to Harman’s experiment [114], the one-factor test is considered to be one of the best common methods for testing biased data.
Common method bias is defined as the error (variance) measurement which impacts the validity of the research. This is a systematic variation of error linked with estimated and measured variables [110]. This may be measured using the Harman single-factor test, which shows different measures of the structure [114]. The single-factor test for measuring the variance of the standard technique has been utilized in this study [115]. Based on the results, if the overall variance of the variables is less than 50%, the common bias technique does not influence the data [114]. As Table 2 shows, the first set of variables is 43.84% of the total variance, meaning the common method variance cannot impact the findings as it is below 50% [114].
Table 2.
The common method variance outcome.
4.2. Measurement Model
The SEM is illustrated in Figure 3 and Figure 4, while Figure 1 illustrates the conceptual model of the study. According to Hair Jr. [116], the assessment of the measurement model involves an estimate of (i) reliability of indicators, (ii) composite reliability, (iii) average variance extracted (AVE), and (iv) discrimination of validity. According to Wong’s [117] the PLS algorithm is analysis the path weighting, average data metric, variance 1, maximum iterations of 300, and 1.0 weight criterion. Generally, outer load indications from 0.40 to 0.70 must be eliminated only if the removal of the item leads to a considerable rise in AVE and composite reliability [118]. Table 2 shows that outer loading values for all items in the measurement model were above 0.70. The values above 0.70 are suitable for further analysis [116]. Next, the internal consistency of composite reliability (cr) was evaluated for all outer loads above 0.70 [116]. As seen in Table 1, all items in the model achieved a cr > 0.70 threshold and, hence, were approved. AVE is a common measure for assessing the convergent validity in the constructs of the model with values above 0.50, meaning that, as Wong [117] recommended, it is a suitable convergent value. The findings in Table 3 demonstrate that this test was passed for constructs of the model.
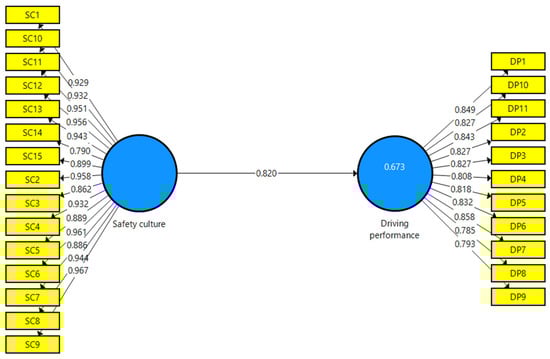
Figure 3.
The structural model with R2 values and path coefficient, outer loading.
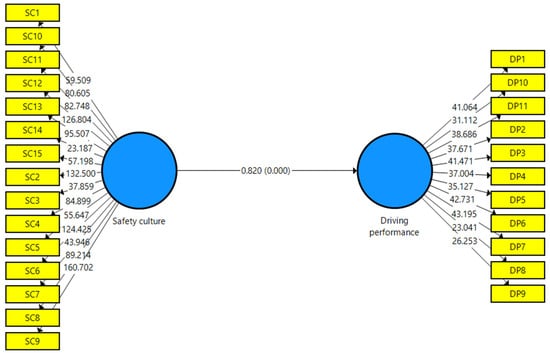
Figure 4.
The bootstrapping analysis, path coefficients, and p-values.
Table 3.
Construct validity and reliability.
Discrimination validity is defined as a construct that markedly varies from the other constructs by the standards observed. The discriminatory validity of the model, therefore, means that there are unique constructs which catch phenomena that are not well represented otherwise in the model [119]. In the present study, discriminant validity based on two methods was assessed: Fornell Larcker’s (1981) criterion, and the cross loading criterion.
To measure the validity of the discriminating construction, each construct square AVE root may be contrasted with the correlations between one and the other. Based on the principles of Fornell and Larcker [120], the square root of the AVE should be greater than the correlation between latent variables. The results in Table 4 demonstrate the discriminating validity of the measuring model [121].
Table 4.
Discriminant validity (Fornell–Larcker).
In this analysis, the second technique is the cross-loading criterion, which was also used to assess discriminant validity. This methodology tries to determine that the loading of indicators on a certain latent construct should exceed all other constructs per line. This means that the loading of indicators or items on the main construct must be greater than the loading on other constructs. The data in Table 5 show that the loading of all latent variables (indicators) is higher than that of other constructs, by row. For each construct, the outcomes reveal a high degree of one-dimensionality.
Table 5.
Discriminant validity of indicators tested by cross-loading.
4.3. Path Analysis (Structural Model)
Path analyses are a statistical technique for linear regression. For social science and management analysis techniques, path analysis is preferred. Path analysis is also a dominating methodology for investigating complicated relationships of research simultaneously [122]. After the model has been fitted, the structural equation modelling can be conducted to examine the relationships between variables. The relationships between study variables are described in detail in the structural model [123]. The results demonstrate the relationship between exogenous or independent and dependent or endogenous variables. Structural model assessment is focused primarily on the fit of the overall model, with hypothesised parameter estimates, dimensions, path, and importance [123]. In the final section, the study relationship was confirmed based on the study hypothesis given in Figure 1.
Following the research context in this model, the effect of safety culture on driving performance was investigated by PLS-SEM. Figure 3 shows the associated hypothesis model. The significance of the model hypothesis was measured in the bootstrapping approach as shown in Figure 4. The random reassessment of the original data involves the procedure of bootstrapping for generating samples that are equal to the original data. Not only does this method assess the reliability of the data, but it also predicts the importance and the error of the measured path coefficient [124]. As seen in Figure 3 and Figure 4, the endogenous construct was tested for the standardized path coefficients (β) and p-values, path significance, and R2. Table 6 displays p-values for the study path in the result of the bootstrapping process. The findings showed that safety culture has a statistically significant effect on driving performance. According to these findings, safety culture had a positive and significant impact on driving performance (β = 0.820, p < 0.000).
Table 6.
Hypothesis and path coefficient.
4.4. The Explanatory Power of the Structural Model
The findings demonstrate high reliability of individual items, and convergent and discriminatory validity of the measurement model. The predictive strength of the structural model can be measured by assessing the difference in the dependent variable described by the model. The PLS algorithm provided multiple squared (R2) correlations for the endogenous variables of the model. R2 in the SEM-PLS algorithm is considered as conventional regression [125].
The R2 is defined as the sum of the variance. The R2 has been demonstrated by the explanation of independent variables in the dependent variable. A better R2 value thus increases the predictive capability of the structural model. In this study, the R2 values were calculated by the PLS algorithm as shown in Table 7. The R2 value in this model for the dependent variable (driving performance) was 0.673, indicating that the latent exogenous variable (safety culture) could explain 67.3% of driving performance. According to Chin [124], the outcome of R2 as 67.3% means that the influence of safety culture is substantial.
Table 7.
Explanatory power of the structural model (R2).
4.5. Predictive Relevance of the Structural Model
The ability to determine the predictive relevance of the model is an important feature of a structural model. The blindfolding technique was used to monitor cross-validated redundancy tests for the dependent variable. The results showed that the performance of the Q² (0.45) project was higher than 0, meaning that the exogenous construct has predictive significance for the endogenous construct in this study [126]. The value of Q² in Table 8 is above 0, and thus an excellent predictive relevance of the model can be safely concluded.
Table 8.
The predictive relevance (Q²).
4.6. Importance-Performance Matrix Analysis (IPMA)
The PLS-SEM approach shows how the independent variable relative value represents the dependent variable in the path model [116,126]. Importance-performance matrix analysis (IPMA) extends SEM outcomes, and also takes into account each variable’s performance. The outcome may be taken from two dimensions (importance and performance), which are important in the selection of management actions [116]. The overall results of the structural model (importance) and the average value of latent variable scales (performance) were used to illustrate areas that will improve the management practices (or the basic emphasis of the model). IPMA has utilized safety culture as the dependent variable in the current research. Table 9 illustrates the importance and performance of the exogenous variable (safety culture).
Table 9.
Importance and performance of safety culture.
5. Discussion
Enhancement of safety culture among oil and gas tanker drivers can substantially improve the level of driving performance. The analysis of SEM models and the statistical values provide sound basis for understanding correlations between these variables. Some important results were revealed during the review and interpretation process.
It is essential to investigate the influence of safety culture on driving performance to improve the performance of oil and gas tanker drivers and to avoid fatal crashes [5]. The analysis has been utilized to examine the influence of safety culture on driving performance. The findings show that the enhancement of the safety culture among oil and gas tanker drivers will contribute 67.3% to the level of driving performance. Similarly, safety culture has a significant impact on driving performance when the value of β = 0.820, which is significant when the organizations increase safety culture by 1 unit, and it would also increase the level of driver performance by 0.820. The results indicate that better safety culture would help the drivers to manage their job demands, to remain focused, to avoid fatigue, and to maintain good reaction time during driving duty. This result is in line with Arboleda [127], who agreed that the implementation of safety culture could enhance drivers’ perceptions of safety culture, whereas, currently, safety culture among drivers is more influenced by the organization’s commitment to managing safety culture and training drivers to avoid fatigue. Moreover, Deepak and Mahesh [128] agreed that safety culture is one of the most important tools for minimizing accidents that in construction projects. It is not surprising, therefore, that in the oil and gas industry safety culture is necessary for accident prevention [129,130].
From the results mentioned above, we can conclude that the output of the safety culture will have an impact on driving performance. The level of safety culture, which is defined in consideration of safety responsibility, communication, the role of communication in the development of safety culture, management attitudes to safety, and patterns of driver behaviour, determines the commitment to the health and safety of drivers during their duties. All findings on driving performance met expectations in the current research. The objective of this study has been achieved and is in line with previous studies [90,91,92], and has shown that safety responsibility, the role of communication in the improvement of safety culture, management attitudes, and patterns of driver behaviour have a positive impact on driving performance and ultimately lead to the sustained vigilance of drivers. Therefore, safety culture has been utilized as a supportive technique to enhance driver performance [43,44,45].
6. Conclusions
Safety culture is highly important in many industries and, as in many other industries, the oil and gas transportation sector has experienced road accidents due to poor driver performance. Safety culture should be adopted in order to reduce this. The PLS-SEM technique has been utilized to examine the impact of safety culture on driving performance. Based on the data obtained from the oil and gas transportation sector in Malaysia, a direct path has been validated in the developed model. Moreover, the direct path between variables has been identified through the examination of the relationship between variables. The outcomes agree that the adoption of a safety culture can enhance the performance of drivers and can contribute to reducing the possibilities of road accidents.
Several implications can be drawn from this study. First, the study contributes to the body of knowledge on the oil and gas transportation sector by improving the understanding of safety culture. Second, the current results provide a foundation for future researchers by empirically confirming that an interest in safety culture has a strong and positive impact on driving performance. The current study also provides a clear vision for managers of oil and gas transportation companies which aim to succeed in their transportation duties through an interest in safety culture. The current study can help all parties involved—administrators, supervisors, and drivers—through an interest in safety culture, by focusing on the attention and vigilance of drivers during transportation of oil and gas.
Despite the contributions of this study, a number of inherent limitations related to data collection and generalization are acknowledged. First, as with cross-sectional studies or snapshot survey research, this does not reflect a deep understanding of the context, as in the case of Malaysian oil and tank transportation sector drivers, when compared to theory building methods. Therefore, it is recommended that larger sample sizes should be employed. Second, the survey sample consisted of oil and gas tanker drivers from one country, Malaysia. Evidently, findings may not be generalized to encompass other developing countries and, therefore, future studies should be extended to other parts of Asia. Third, whilst our study focused on oil and gas tanker drivers, the importance of freight transportation must be noted, given the growing volume of international trade and freight transportation [131,132,133]. Future studies should also include other modes of transportation such as trucks, trains, and large ships, as well as the challenges faced by them. Similarly, further research should investigate driver distraction and other correlated factors that can impact driving performance. Finally, a limit within the methodology is the fact that the study was conducted using self-reported questionnaires. For further research, an experimental approach for measuring the vigilance and reaction time of drivers would be preferred.
Author Contributions
Conceptualization, A.-B.A.A.-M. and A.S.N.I.; writing—original draft preparation A.-B.A.A.-M. and A.S.N.I.; supervision and quality control, project leader, A.S.N.I.; Data collection, A.-B.A.A.-M., A.S.N.I., and M.A. (Muhammad Ajmal). Analysis of the literature, A.-B.A.A.-M.; software and data analysis, A.-B.A.A.-M., M.A. (Mohammed Abdulrab), and A.F.K.; validation, A.-B.A.A.-M. and N.C.; visualization, A.-B.A.A.-M., A.F.K., N.C. and M.A. (Mohammed Abdulrab); writing—review and editing, A.-B.A.A.-M., A.S.N.I., N.C., M.A. (Mohammed Abdulrab), A.F.K. and M.A. (Muhammad Ajmal). All authors have read and agreed to the published version of the manuscript.
Funding
This research was funded by the YUTP project (Cost Center: 015LC0-032), Universiti Teknologi PETRONAS.
Institutional Review Board Statement
Not applicable.
Informed Consent Statement
Informed consent was obtained from all subjects involved in the study.
Data Availability Statement
The data are available for anyone who wants to look at it with reasonable arguments. Please contact the corresponding author.
Acknowledgments
The authors would like to thank Universiti Teknologi PETRONAS for funding this study. The authors are grateful to the participants who contributed to the research as well.
Conflicts of Interest
The authors declare no conflict of interest.
References
- Hartley, L.R.; Penna, F.; Corry, A.; Feyer, A.M. Comprehensive Review of Fatigue Research; Murdoch University, Institute for Research in Safety & Transport: Perth, Australia, 2001. [Google Scholar]
- Knipling, R.R.; Wang, J.-S. Crashes and Fatalities Related to Driver Drowsiness/Fatigue; National Highway Traffic Safety Administration: Washington, DC, USA, 1994. [Google Scholar]
- Wylie, C.; Shultz, T.; Miller, C.J.; Mitler, M.M.; Mackie, R. Commercial Motor Vehicle Driver Fatigue and Alertness Study: Project Report; Transportation Research Board (TRB): Washington, DC, USA, 1996; Available online: https://trid.trb.org/view/472243 (accessed on 11 May 2019).
- Al-Mekhlafi, A.B.A.; Isha, A.S.N.; Sabir, A.A.; Naji, G.M.A.; Ajmal, M.; Al-Harasi, A.H. Fatigue Assessment of Oil and Gas Tanker Drivers: Psychomotor Vigilance Test (PVT-192). Solid State Technol. 2020, 63, 4256–4262. [Google Scholar]
- Al-Mekhlafi, A.B.A.; Isha, A.S.N.; Naji, G.M.A. The relationship between fatigue and driving performance: A review and directions for future research. J. Crit. Rev. 2020, 7, 134–141. [Google Scholar]
- Soares, S.; Monteiro, T.; Lobo, A.; Couto, A.; Cunha, L.; Ferreira, S. Analyzing driver drowsiness: From causes to effects. Sustainability 2020, 12, 1971. [Google Scholar] [CrossRef] [Green Version]
- Meng, F.; Li, S.; Cao, L.; Li, M.; Peng, Q.; Wang, C.; Zhang, W. Driving fatigue in professional drivers: A survey of truck and taxi drivers. Traffic Inj. Prev. 2015, 16, 474–483. [Google Scholar] [CrossRef]
- Sagberg, F. Road Accidents Caused by Drivers Falling Asleep. Accid. Anal. Prev. 1999, 31, 639–649. [Google Scholar] [CrossRef]
- Maycock, G. Sleepiness and driving: The experience of UK car drivers. Accid. Anal. Prev. 1997, 29, 453–462. [Google Scholar] [CrossRef]
- Horne, J.A.; Reyner, L.A. Sleep related vehicle accidents. Br. Med. J. 1995, 310, 565–567. [Google Scholar] [CrossRef] [Green Version]
- Fletcher, A.; McCulloch, K.; Baulk, S.D.; Dawson, D. Countermeasures to driver fatigue: A review of public awareness campaigns and legal approaches. Aust. N. Z. J. Public Health 2005, 29, 471–476. [Google Scholar] [CrossRef] [Green Version]
- Braver, E.R.; Preusser, C.; Preusser, D.; Baum, H.M.; Beilock, R.; Ulmer, R. Who Violates Work Hour Rules? A Survey of Tractor-Trailer Drivers; Transportation Research Board (TRB): Washington, DC, USA, 1992. [Google Scholar]
- Mooren, L.; Grzebieta, R.; Williamson, A.; Olivier, J.; Friswell, R. Safety management for heavy vehicle transport: A review of the literature. Saf. Sci. 2014, 62, 79–89. [Google Scholar] [CrossRef]
- Bierhoff, H.W.; Klein, R. Reasoning in Impression Formation. In Person Perception and Attribution; Springer: Berlin/Heidelberg, Germany, 1989; pp. 77–105. [Google Scholar]
- Griffin, M.A.; Neal, A. Perceptions of safety at work: A framework for linking safety climate to safety performance, knowledge, and motivation. J. Occup. Health Psychol. 2000, 5, 347. [Google Scholar] [CrossRef] [PubMed]
- Hajmohammad, S.; Vachon, S. Safety culture: A catalyst for sustainable development. J. Bus. Ethics 2014, 123, 263–281. [Google Scholar] [CrossRef]
- Health and Safety Commission. ACSNI Study Group on Human Factors; Advisory Committee on the Safety of Nuclear Installations (ACSNI): London, UK; Health and Safety Commission: London, UK, 1993; Volume 25. [Google Scholar]
- Gillen, M.; Baltz, D.; Gassel, M.; Kirsch, L.; Vaccaro, D. Perceived safety climate, job demands, and coworker support among union and nonunion injured construction workers. J. Saf. Res. 2002, 33, 33–51. [Google Scholar] [CrossRef]
- Zohar, D. Safety climate in industrial organizations: Theoretical and applied implications. J. Appl. Psychol. 1980, 65, 96. [Google Scholar] [CrossRef]
- Clarke, S. Perceptions of organizational safety: Implications for the development of safety culture. Int. J. Ind. Occup. Organ. Psychol. Behav. 1999, 20, 185–198. [Google Scholar] [CrossRef]
- O’Toole, M. The relationship between employees’ perceptions of safety and organizational culture. J. Saf. Res. 2002, 33, 231–243. [Google Scholar] [CrossRef]
- Lin, S.C.; Mufidah, I.; Persada, S.F. Safety-culture exploration in Taiwan’s metal industries: Identifying the workers’ background influence on safety climate. Sustainability 2017, 9, 1965. [Google Scholar] [CrossRef] [Green Version]
- Hayes, B.E.; Perander, J.; Smecko, T.; Trask, J. Measuring perceptions of workplace safety: Development and validation of the work safety scale. J. Saf. Res. 1998, 29, 145–161. [Google Scholar] [CrossRef]
- Bailey, C. Managerial factors related to safety program effectiveness: An update on the Minnesota Perception Survey. Prof. Saf. 1997, 42, 33. [Google Scholar]
- Krishnan, S.; Hizam, S.M.; Firdhaus, A.; Sarah, S.; Taufiq, A. Analysis of Exhaustion Related Psychological Risk Factors among Oil and Gas Tanker Drivers in Malaysia. Int. J. Adv. Multidiscip. Soc. Sci. 2017, 3, 22–27. [Google Scholar]
- Sabir, A.A.; Isha, A.S.N.B. Psychological Well-being and Fatigue Impact on Aberrant Driving Behaviors in Oil and Gas Sector of Malaysia. Glob. Bus. Manag. Res. 2017, 9, 110. [Google Scholar]
- Sabir, A.A.; Isha, A.S.N.B. Assessing the fatigue related psychological risk factors among oil and gas tankers drivers in Malaysia. Int. Rev. Manag. Mark. 2016, 6, 138–142. [Google Scholar]
- Sabir, A.A.; Shahru, A.; Isha, N.B.; Langove, N.; Javaid, M.U. An Integrative Approach to Study Drivers Perceived Stress on Aberrant Driving Behaviour: The Mediation Role of Driver Fatigue. SHS Web Conf. 2018, 56, 02009. [Google Scholar] [CrossRef]
- Al-Mekhlafi, A.B.A.; Isha, A.S.N.; Chileshe, N.; Abdulrab, M.; Saeed, A.A.H.; Kineber, A.F. Modelling the Relationship between the Nature of Work Factors and Driving Performance Mediating by Role of Fatigue. Int. J. Environ. Res. Public Health 2021, 18, 6752. [Google Scholar] [CrossRef] [PubMed]
- Choudhry, R.M.; Fang, D.; Mohamed, S. The nature of safety culture: A survey of the state-of-the-art. Saf. Sci. 2007, 45, 993–1012. [Google Scholar] [CrossRef]
- Sukadarin, E.H.; Suhaimi, N.S.; Abdull, N. Preliminary study of the safety culture in a manufacturing industry. Int. J. Humanit. Soc. Sci. 2012, 2, 176–183. [Google Scholar]
- Ostrom, L.; Wilhelmsen, C.; Kaplan, B. Assessing safety culture. Nucl. Saf. 1993, 34, 163–172. [Google Scholar]
- Wiegmann, D.A.; Zhang, H.; von Thaden, T.L.; Sharma, G.; Gibbons, A.M. Safety culture: An integrative review. Int. J. Aviat. Psychol. 2004, 14, 117–134. [Google Scholar] [CrossRef]
- Bandura, A. Socia Foundations of Thought and Action: A Social Cognitive Theory; Prentice-Hall: Englewood Cliffs, NJ, USA, 1986; Volume 19, pp. 23–28. [Google Scholar]
- Geller, E.S. Ten principles for achieving a total safety culture. Prof. Saf. 1994, 39, 18. [Google Scholar]
- Majid, A. A Framework of Safety culture for the Malaysian construction companies: A Methodological development. Pertanika J. Soc. Sci. Humanit. 2010, 18, 45–54. [Google Scholar]
- Ismail, F.; Ahmad, N.; Janipha, N.A.I.; Ismail, R. The behavioural factors’ characteristics of safety culture. J. Asian Behav. Stud. 2017, 2, 91–98. [Google Scholar] [CrossRef] [Green Version]
- Ajmal, M.; Isha, A.S.N.; Nordin, S.M.; Kanwal, N.; Al-Mekhlafi, A.B.A.; Naji, G.M.A. A Conceptual Framework for the Determinants of Organizational Agility: Does Safety Commitment Matters? Solid State Technol. 2020, 63, 4112–4119. [Google Scholar]
- Ajmal, M.; Isha, A.S.N.; Nordin, S.M.; Sabir, A.A.; Munir, A.; Al-Mekhlafi, A.-B.A.; Naji, G.M.A. Safety Management Paradigms: COVID-19 Employee Well-Being Impact on Occupational Health and Safety Performance. J. Hunan Univ. Nat. Sci. 2021, 48, 128–142. [Google Scholar]
- Makhtar, N.K.; Parasuraman, B.; Zakaria, M.N.; Ismail, A.R.; Husna, N.; Hassan, C. Research Framework for Safety Culture in Malaysian Education Sector: Moderating Effect of Safety Knowledge. Int. J. Eng. Technol. 2018, 7, 146–149. [Google Scholar]
- Hee, O.C. Factors contribute to safety culture in the manufacturing industry in Malaysia. Int. J. Acad. Res. Bus. Soc. Sci. 2014, 4, 63. [Google Scholar] [CrossRef]
- Ludin, S.M.; Bajuri, N.A.A. Nurses’perception on patient safety culture in critical care area at a tertiary hospital in pahang, Malaysia. Malays. J. Nurs. (MJN) 2020, 11, 78–84. [Google Scholar] [CrossRef]
- Paas, F.G.; Van Merriënboer, J.J. The efficiency of instructional conditions: An approach to combine mental effort and performance measures. Hum. Factors 1993, 35, 737–743. [Google Scholar] [CrossRef]
- Mcgehee, D.V.; Mazzae, E.N.; Baldwin, G.S. Driver Reaction Time in Crash Avoidance Research: Validation of a Driving Simulator Study on a Test Track, Proceedings of the Human Factors and Ergonomics Society Annual Meeting, San Diego, CA, USA, 30 July–4 August 2000; SAGE Publications Sage CA: Los Angeles, CA, USA, 2000; pp. 3-320–3-323. [Google Scholar]
- Oken, B.S.; Salinsky, M.C.; Elsas, S. Vigilance, alertness, or sustained attention: Physiological basis and measurement. Clin. Neurophysiol. 2006, 117, 1885–1901. [Google Scholar]
- BusinessDictionary, Performance. Available online: http://www.businessdictionary.com/definition/performance.html (accessed on 11 May 2019).
- Harrison, E.L.; Fillmore, M.T. Alcohol and distraction interact to impair driving performance. Drug Alcohol Depend. 2011, 117, 31–37. [Google Scholar] [CrossRef] [PubMed] [Green Version]
- Klauer, S.G.; Dingus, T.A.; Neale, V.L.; Sudweeks, J.D.; Ramsey, D.J. The Impact of Driver Inattention on Near-Crash/Crash Risk: An Analysis Using the 100-Car Naturalistic Driving Study Data; National Highway Traffic Safety Administration: Washington, DC, USA, 2006; Available online: https://vtechworks.lib.vt.edu/bitstream/handle/10919/55090/DriverInattention.pdf?sequence=1%26isAllowed%3Dy (accessed on 11 May 2019).
- Lam, L.T. Distractions and the risk of car crash injury: The effect of drivers’ age. J. Saf. Res. 2002, 33, 411–419. [Google Scholar] [CrossRef]
- Kee, S.; Tamrin, S.B.M.; Goh, Y. Driving fatigue and performance among occupational drivers in simulated prolonged driving. Glob. J. Health Sci. 2010, 2, 167–177. [Google Scholar]
- Davenne, D.; Lericollais, R.; Sagaspe, P.; Taillard, J.; Gauthier, A.; Espié, S.; Philip, P. Reliability of simulator driving tool for evaluation of sleepiness, fatigue and driving performance. Accid. Anal. Prev. 2012, 45, 677–682. [Google Scholar] [CrossRef]
- Larue, G.S.; Rakotonirainy, A.; Pettitt, A.N. Driving performance impairments due to hypovigilance on monotonous roads. Accid. Anal. Prev. 2011, 43, 2037–2046. [Google Scholar] [CrossRef] [PubMed] [Green Version]
- Adrian, J.; Postal, V.; Moessinger, M.; Rascle, N.; Charles, A. Personality traits and executive functions related to on-road driving performance among older drivers. Accid. Anal. Prev. 2011, 43, 1652–1659. [Google Scholar] [CrossRef] [PubMed]
- Brooks, J.O.; Crisler, M.C.; Klein, N.; Goodenough, R.; Beeco, R.W.; Guirl, C.; Tyler, P.J.; Hilpert, A.; Miller, Y.; Grygier, J.; et al. Speed choice and driving performance in simulated foggy conditions. Accid. Anal. Prev. 2011, 43, 698–705. [Google Scholar] [CrossRef]
- Jackson, M.L.; Croft, R.J.; Kennedy, G.A.; Owens, K.; Howard, M.E. Cognitive components of simulated driving performance: Sleep loss effects and predictors. Accid. Anal. Prev. 2013, 50, 438–444. [Google Scholar] [CrossRef] [PubMed]
- Yanko, M.R.; Spalek, T.M. Driving with the wandering mind: The effect that mind-wandering has on driving performance. Hum. Factors 2014, 56, 260–269. [Google Scholar] [CrossRef]
- Silva, F.P. Mental workload, task demand and driving performance: What relation. Procedia Soc. Behav. Sci. 2014, 162, 310–319. [Google Scholar] [CrossRef] [Green Version]
- Engström, J.; Markkula, G.; Victor, T.; Merat, N. Effects of cognitive load on driving performance: The cognitive control hypothesis. Hum. Factors 2017, 59, 734–764. [Google Scholar] [CrossRef] [PubMed]
- Irwin, C.; Khalesi, S.; Desbrow, B.; McCartney, D. Effects of acute caffeine consumption following sleep loss on cognitive, physical, occupational and driving performance: A systematic review and meta-analysis. Neurosci. Biobehav. Rev. 2020, 108, 877–888. [Google Scholar] [CrossRef]
- Perlman, D.; Samost, A.; Domel, A.G.; Mehler, B.; Dobres, J.; Reimer, B. The relative impact of smartwatch and smartphone use while driving on workload, attention, and driving performance. Appl. Ergon. 2019, 75, 8–16. [Google Scholar] [CrossRef] [PubMed]
- Oviedo-Trespalacios, O.; Haque, M.M.; King, M.; Washington, S. Understanding the impacts of mobile phone distraction on driving performance: A systematic review. Transp. Res. Part. C Emerg. Technol. 2016, 72, 360–380. [Google Scholar] [CrossRef] [Green Version]
- Ünal, A.B.; Steg, L.; Epstude, K. The influence of music on mental effort and driving performance. Accid. Anal. Prev. 2012, 48, 271–278. [Google Scholar] [CrossRef]
- Alosco, M.L.; Spitznagel, M.B.; Fischer, K.H.; Miller, L.A.; Pillai, V.; Hughes, J.; Gunstad, J. Both texting and eating are associated with impaired simulated driving performance. Traffic Inj. Prev. 2012, 13, 468–475. [Google Scholar] [CrossRef]
- Mets, M.A.; Ketzer, S.; Blom, C.; Van Gerven, M.H.; Van Willigenburg, G.M.; Olivier, B.; Verster, J.C. Positive effects of Red Bull®® Energy Drink on driving performance during prolonged driving. Psychopharmacology 2011, 214, 737–745. [Google Scholar] [CrossRef] [Green Version]
- Morrow, S.L.; Koves, G.K.; Barnes, V.E. Exploring the relationship between safety culture and safety performance in US nuclear power operations. Saf. Sci. 2014, 69, 37–47. [Google Scholar] [CrossRef]
- Brimley, B.K.; Saito, M.; Schultz, G.G. Calibration of Highway Safety Manual safety performance function: Development of new models for rural two-lane two-way highways. Transp. Res. Rec. 2012, 2279, 82–89. [Google Scholar] [CrossRef]
- Harwood, D.W.; Council, F.; Hauer, E.; Hughes, W.; Vogt, A. Prediction of the Expected Safety Performance of Rural Two-Lane Highways; Office of safety research and development federal Highway Administration: Washington, DC, USA, 2000. [Google Scholar]
- Ross, J. Fatigue: Do you understand the risks to safety? J. PeriAnesthesia Nurs. 2008, 23, 57–59. [Google Scholar] [CrossRef]
- Stanton, N.A.; Salmon, P.M. Planes, trains and automobiles: Contemporary ergonomics research in transportation safety. Appl. Ergon. 2011, 42, 529–532. [Google Scholar] [CrossRef] [PubMed]
- Williamson, A.; Lombardi, D.A.; Folkard, S.; Stutts, J.; Courtney, T.K.; Connor, J.L. The link between fatigue and safety. Accid. Anal. Prev. 2011, 43, 498–515. [Google Scholar] [CrossRef] [PubMed]
- San Kim, D.; Baek, D.H.; Yoon, W.C. Development and evaluation of a computer-aided system for analyzing human error in railway operations. Eng. Syst. Saf. 2010, 95, 87–98. [Google Scholar]
- Baysari, M.T.; Caponecchia, C.; McIntosh, A.S.; Wilson, J.R. Classification of errors contributing to rail incidents and accidents: A comparison of two human error identification techniques. Saf. Sci. 2009, 47, 948–957. [Google Scholar] [CrossRef]
- Edkins, G.D.; Pollock, C.M. The influence of sustained attention on railway accidents. Accid. Anal. Prev. 1997, 29, 533–539. [Google Scholar] [CrossRef]
- McLeod, R.W.; Walker, G.H.; Moray, N. Analysing and modelling train driver performance. Appl. Ergon. 2005, 36, 671–680. [Google Scholar] [CrossRef] [PubMed] [Green Version]
- Horrey, W.J.; Noy, Y.I.; Folkard, S.; Popkin, S.M.; Howarth, H.D.; Courtney, T.K. Research needs and opportunities for reducing the adverse safety consequences of fatigue. Accid. Anal. Prev. 2011, 43, 591–594. [Google Scholar] [CrossRef] [PubMed]
- Dawson, D.; Noy, Y.I.; Härmä, M.; Åkerstedt, T.; Belenky, G. Modelling fatigue and the use of fatigue models in work settings. Accid. Anal. Prev. 2011, 43, 549–564. [Google Scholar] [CrossRef]
- Dorrian, J.; Baulk, S.D.; Dawson, D. Work hours, workload, sleep and fatigue in Australian Rail Industry employees. Appl. Ergon. 2011, 42, 202–209. [Google Scholar] [CrossRef]
- Härmä, M.; Sallinen, M.; Ranta, R.; Mutanen, P.; Müller, K. The effect of an irregular shift system on sleepiness at work in train drivers and railway traffic controllers. J. Sleep Res. 2002, 11, 141–151. [Google Scholar] [CrossRef]
- Naji, G.M.A.; Isha, A.S.N.; Al-Mekhlafi, A.B.A.; Sharafaddin, O.; Ajmal, M. Implementation of leading and lagging indicators to improve safety performance in the upstream oil and gas industry. J. Crit. Rev. 2020, 7, 265–269. [Google Scholar]
- Cooper, D. Safety culture. Prof. Saf. 2002, 47, 30–36. [Google Scholar]
- Naji, G.M.A.; Isha, A.S.N.; Alzoraiki, M.; Al-Mekhlafi, A.B.A.; Sharafaddin, O.; Saleem, M.S. Impact of Safety Culture And Psychosocial Hazard On Safety Performance Among Upstream Employees In Malaysia At Oil And Gas Industry. Solid State Technol. 2020, 63, 4120–4126. [Google Scholar]
- Shields, P.M.; Tajalli, H. Intermediate theory: The missing link in successful student scholarship. J. Public Aff. Educ. 2006, 12, 313–334. [Google Scholar] [CrossRef] [Green Version]
- Christensen, C.M. The ongoing process of building a theory of disruption. J. Prod. Innov. Manag. 2006, 23, 39–55. [Google Scholar] [CrossRef]
- Kineber, A.F.; Othman, I.; Oke, A.E.; Chileshe, N.; Buniya, M.K. Impact of Value Management on Building Projects Success: Structural Equation Modeling Approach. J. Constr. Eng. Manag. 2021, 147, 04021011. [Google Scholar] [CrossRef]
- Van Teijlingen, E.R.; Hundley, V. The importance of pilot studies. Soc. Res. Update 2010, 35, 49–59. [Google Scholar] [CrossRef]
- Krejcie, R.V.; Morgan, D.W. Determining sample size for research activities. Educ. Psychol. Meas. 1970, 30, 607–610. [Google Scholar] [CrossRef]
- Kline, R. Principles and Practice of Structural Equation Modeling, 3rd ed.; The Guilford Press: New York, NY, USA, 2010. [Google Scholar]
- Yin, R.K. Case Study Research: Design and Methods, 4th ed.; SAGE lnc.: Los Angeles, CA, USA, 2009; pp. 1–312. [Google Scholar]
- Oke, A.E.; Kineber, A.F.; Albukhari, I.; Othman, I.; Kingsley, C. Assessment of Cloud Computing Success Factors for Sustainable Construction Industry: The Case of Nigeria. Buildings 2021, 11, 36. [Google Scholar] [CrossRef]
- Ryan, B.; Wilson, J.R.; Sharples, S.; Morrisroe, G.; Clarke, T. Developing a rail ergonomics questionnaire (REQUEST). Appl. Ergon. 2009, 40, 216–229. [Google Scholar] [CrossRef]
- Austin, A.; Drummond, P.D. Work problems associated with suburban train driving. Appl. Ergon. 1986, 17, 111–116. [Google Scholar] [CrossRef]
- Karali, S.; Gyi, D.E.; Mansfield, N.J. Driving a better driving experience: A questionnaire survey of older compared with younger drivers. Ergonomics 2017, 60, 533–540. [Google Scholar] [CrossRef]
- Ortiz, C.; Castro, J.J.; Alarcón, A.; Soler, M.; Anera, R.G. Quantifying age-related differences in visual-discrimination capacity: Drivers with and without visual impairment. Appl. Ergon. 2013, 44, 523–531. [Google Scholar] [CrossRef]
- Owsley, C.; Stalvey, B.; Wells, J.; Sloane, M.E. Older drivers and cataract: Driving habits and crash risk. J. Gerontol. Ser. A Biomed. Sci. Med. Sci. 1999, 54, M203–M211. [Google Scholar] [CrossRef] [Green Version]
- Amaratunga, D.; Kulatunga, U.; Liyanage, C.; Hui, E.C.; Zheng, X. Measuring customer satisfaction of FM service in housing sector. Facilities 2010, 28, 306–320. [Google Scholar]
- Byrne, B.M. Multivariate applications series. In Structural Equation Modeling with AMOS: Basic Concepts, Applications, and Programming; Routledge/Taylor Francis Group: New York, NY, USA, 2010. [Google Scholar]
- Yuan, K.H.; Wu, R.; Bentler, P.M. Ridge structural equation modelling with correlation matrices for ordinal and continuous data. Br. J. Math. Stat. Psychol. 2011, 64, 107–133. [Google Scholar] [CrossRef] [Green Version]
- Hair, J.F.; Anderson, R.E.; Babin, B.J.; Black, W.C. Multivariate Data Analysis: A Global Perspective (Vol. 7); Pearson: Upper Saddle River, NJ, USA, 2010. [Google Scholar]
- Ringle, C.M.; Sarstedt, M.; Straub, D.W. Editor’s comments: A critical look at the use of PLS-SEM in “MIS Quarterly”. MIS Q. 2012, 36, iii–xiv. [Google Scholar] [CrossRef] [Green Version]
- Chin, W.W.; Marcolin, B.L.; Newsted, P.R. A partial least squares latent variable modeling approach for measuring interaction effects: Results from a Monte Carlo simulation study and an electronic-mail emotion/adoption study. Inf. Syst. Res. 2003, 14, 189–217. [Google Scholar] [CrossRef] [Green Version]
- Lagoudis, I.N.; Lalwani, C.S.; Naim, M.M. Ranking of factors contributing to higher performance in the ocean transportation industry: A multi-attribute utility theory approach. Marit. Policy Manag. 2006, 33, 345–369. [Google Scholar] [CrossRef]
- Allen, J.; Eboli, L.; Mazzulla, G.; de Dios Ortúzar, J. Effect of critical incidents on public transport satisfaction and loyalty: An Ordinal Probit SEM-MIMIC approach. Transportation 2020, 47, 827–863. [Google Scholar] [CrossRef]
- Papantoniou, P. Structural equation model analysis for the evaluation of overall driving performance: A driving simulator study focusing on driver distraction. Traffic Inj. Prev. 2018, 19, 317–325. [Google Scholar] [CrossRef] [PubMed]
- Aibinu, A.A.; Al-Lawati, A.M. Using PLS-SEM technique to model construction organizations’ willingness to participate in e-bidding. Autom. Constr. 2010, 19, 714–724. [Google Scholar] [CrossRef]
- Kineber, A.F.; Othman, I.; Oke, A.E.; Chileshe, N.; Zayed, T. Exploring the value management critical success factors for sustainable residential building–A structural equation modelling approach. J. Clean. Prod. 2021, 293, 126115. [Google Scholar] [CrossRef]
- Mikalef, P.; Pateli, A. Information technology-enabled dynamic capabilities and their indirect effect on competitive performance: Findings from PLS-SEM and fsQCA. J. Bus. Res. 2017, 70, 1–16. [Google Scholar] [CrossRef]
- Abdulrab, M.; Al-Mamary, Y.H.S.; Alwaheeb, M.A.; Alshammari, N.G.M.; Balhareth, H.; Al-Shammari, S.A. Mediating role of strategic orientations in the relationship between entrepreneurial orientation and performance of Saudi SMEs. Braz. J. Oper. Prod. Manag. 2021, 18, 1–15. [Google Scholar] [CrossRef]
- Aboelmaged, M. The drivers of sustainable manufacturing practices in Egyptian SMEs and their impact on competitive capabilities: A PLS-SEM model. J. Clean. Prod. 2018, 175, 207–221. [Google Scholar] [CrossRef]
- Al-Tahitah, A.N.; Al-Sharafi, M.A.; Abdulrab, M. How COVID-19 Pandemic Is Accelerating the Transformation of Higher Education Institutes: A Health Belief Model View. Emerg. Technol. Era COVID-19 Pandemic 2021, 348, 333. [Google Scholar]
- MacKenzie, S.B.; Podsakoff, P.M. Common method bias in marketing: Causes, mechanisms, and procedural remedies. J. Retail. 2012, 88, 542–555. [Google Scholar] [CrossRef]
- Glick, W.H.; Jenkins, G.D., Jr.; Gupta, N. Method versus substance: How strong are underlying relationships between job characteristics and attitudinal outcomes? Acad. Manag. J. 1986, 29, 441–464. [Google Scholar] [CrossRef]
- Strandholm, K.; Kumar, K.; Subramanian, R. Examining the interrelationships among perceived environmental change, strategic response, managerial characteristics, and organizational performance. J. Bus. Res. 2004, 57, 58–68. [Google Scholar] [CrossRef]
- Williams, L.J.; Cote, J.A.; Buckley, M.R. Lack of method variance in self-reported affect and perceptions at work: Reality or artifact? J. Appl. Psychol. 1989, 74, 462. [Google Scholar] [CrossRef]
- Podsakoff, P.M.; Organ, D.W. Self-reports in organizational research: Problems and prospects. J. Manag. 1986, 12, 531–544. [Google Scholar] [CrossRef]
- Harman, H. Modern Factor Analysis; University of Chicago press: Chicago, IL, USA, 1967; pp. 1–486. [Google Scholar]
- Hair, J.F., Jr.; Hult, G.T.M.; Ringle, C.; Sarstedt, M. A Primer on Partial Least Squares Structural Equation Modeling (PLS-SEM); European Journal of Tourism Research; Sage Publications: Hong Kong, China, 2016. [Google Scholar]
- Wong, K.K.-K. Partial least squares structural equation modeling (PLS-SEM) techniques using SmartPLS. Mark. Bull. 2013, 24, 1–32. [Google Scholar]
- Henseler, J.; Ringle, C.M.; Sinkovics, R.R. The Use of Partial Least Squares Path Modeling in International Marketing, in New Challenges to International Marketing; Emerald Group Publishing Limited: Bingley, The Netherlands, 2009. [Google Scholar]
- Hair, J.F.; Ringle, C.M.; Sarstedt, M. Partial least squares structural equation modeling: Rigorous applications, better results and higher acceptance. Long Range Plan. 2013, 46, 1–12. [Google Scholar] [CrossRef]
- Fornell, C.; Larcker, D.F. Evaluating structural equation models with unobservable variables and measurement error. J. Mark. Res. 1981, 18, 39–50. [Google Scholar] [CrossRef]
- Chin, W.W.; Newsted, P.R. Structural equation modeling analysis with small samples using partial least squares. Stat. Strateg. Small Sample Res. 1999, 1, 307–341. [Google Scholar]
- Tabachnick, B.G.; Fidell, L.S.; Ullman, J.B. Using Multivariate Statistics; Pearson: Boston, MA, USA, 2007. [Google Scholar]
- Hair, J.F.; Black, W.C.; Babin, B.J.; Anderson, R.E.; Tatham, R.L. Multivariate Data Analysis (Vol. 6); Pearson Prentice Hall: Upper Saddle River, NJ, USA, 2006. [Google Scholar]
- Chin, W.W. Commentary: Issues and Opinion on Structural Equation Modeling; MIS Quarterly, Management Information Systems Research Center, University of Minnesota: Twin Cities, MN, USA, 1998; Volume 22, pp. vii–xvi. [Google Scholar]
- Chin, W.W. The partial least squares approach to structural equation modeling. Mod. Methods Bus. Res. 1998, 295, 295–336. [Google Scholar]
- Hair, J.F.; Ringle, C.M.; Sarstedt, M. PLS-SEM: Indeed a silver bullet. J. Mark. Theory Pract. 2011, 19, 139–152. [Google Scholar] [CrossRef]
- Arboleda, A.; Morrow, P.C.; Crum, M.R.; Shelley, M.C., II. Management practices as antecedents of safety culture within the trucking industry: Similarities and differences by hierarchical level. J. Saf. Res. 2003, 34, 189–197. [Google Scholar] [CrossRef]
- Deepak, M.D.; Mahesh, G. Developing a knowledge-based safety culture instrument for construction industry. Eng. Constr. Archit. Manag. 2019, 26, 2597–2613. [Google Scholar]
- Gao, Y.; Fan, Y.; Wang, J.; Li, X.; Pei, J. The mediating role of safety management practices in process safety culture in the Chinese oil industry. J. Loss Prev. Process. Ind. 2019, 57, 223–230. [Google Scholar] [CrossRef]
- Iqbal, H.; Waheed, B.; Haider, H.; Tesfamariam, S.; Sadiq, R. Mapping safety culture attributes with integrity management program to achieve assessment goals: A framework for oil and gas pipelines industry. J. Saf. Res. 2019, 68, 59–69. [Google Scholar] [CrossRef]
- Kechagias, E.P.; Gayialis, S.P.; Konstantakopoulos, G.D.; Papadopoulos, G.A. An Application of an Urban Freight Transportation System for Reduced Environmental Emissions. Systems 2020, 8, 49. [Google Scholar] [CrossRef]
- Dulebenets, M.A. A comprehensive multi-objective optimization model for the vessel scheduling problem in liner shipping. Int. J. Prod. Econ. 2018, 196, 293–318. [Google Scholar] [CrossRef]
- Bruzzone, F.; Cavallaro, F.; Nocera, S. The integration of passenger and freight transport for first-last mile operations. Transp. Policy 2021, 100, 31–48. [Google Scholar] [CrossRef] [PubMed]
Publisher’s Note: MDPI stays neutral with regard to jurisdictional claims in published maps and institutional affiliations. |
© 2021 by the authors. Licensee MDPI, Basel, Switzerland. This article is an open access article distributed under the terms and conditions of the Creative Commons Attribution (CC BY) license (https://creativecommons.org/licenses/by/4.0/).