Article

Using Naturalness for Assessing the Impact of Forestry and Protection on the Quality of Ecosystems in Life Cycle Assessment

1
Department of Wood and Forestry Sciences, Université Laval, Quebec City, QC G1V 0A6, Canada
2
CIRAIG, Department of Mathematical and Industrial Engineering, Polytechnique Montréal, Montréal, QC H3C 3A7, Canada
3
Institute of Sustainable Energy, University of Applied Sciences and Arts Western Switzerland, 1950 Sion, Switzerland
*
Author to whom correspondence should be addressed.
Sustainability 2021, 13(16), 8859; https://doi.org/10.3390/su13168859
Submission received: 10 May 2021 / Revised: 27 July 2021 / Accepted: 27 July 2021 / Published: 8 August 2021
(This article belongs to the Special Issue Biodiversity and Natural Resources Management)

Abstract

:
A novel approach is proposed to evaluate the impact of forestry on ecosystem quality in life cycle assessment (LCA) combining a naturalness assessment model with a species richness relationship. The approach is applied to a case study evaluating different forest management strategies involving concomitantly silvicultural scenarios (plantation only, careful logging only or the current mix of both) combined with an increasing share of protected area for wood production in a Québec black spruce forest. The naturalness index is useful to compare forest management scenarios and can help evaluate conservation needs considering the type of management foreseen for wood production. The results indicate that it is preferable to intensify forest management over a small proportion of the forest territory while ensuring strict protection over the remaining portion, compared to extensive forest management over most of the forested area. To explore naturalness introduction in LCA, a provisory curve relating the naturalness index (NI) with the potential disappeared fraction of species (PDF) was developed using species richness data from the literature. LCA impact scores in PDF for producing 1 m3 of wood might lead to consistent results with the naturalness index but the uncertainty is high while the window leading to consistent results is narrow.

1. Introduction

Green building relies on quantitative tools such as life cycle analysis (LCA) to evaluate the environmental impact of alternative design choices, among them the supply of different building materials [1], to support environmentally sound choices in the context of decision-making based on scientific evidence [2]. For harvested wood products, the impact on ecosystem quality is influenced by the forest management strategies, silvicultural practices and management intensity [3,4]. Impact assessment of anthropic activities on ecosystem quality in LCA has been a subject of research for more than 20 years [5,6]. According to the LCA framework, the impact corresponds to the marginal change in ecosystem quality related to a given land use during a certain period of time (considered here on an annual basis), multiplied by the area required to produce the functional unit [7], corresponding here to 1 m3 of wood used in building structure. These impacts are assumed to grow linearly with the quantity produced [2], whereas land use intensity should be related to impact using non-linear functions [8].
Anthropic activities and especially habitat change related to land use and land use change has caused losses of biodiversity and contributed to an unprecedented rate of species extinction [9]. Impact on ecosystem quality is expressed as the effects on biodiversity in the context of life cycle analysis (LCA) [7,10,11]. The Convention on Biological Diversity (CBD) states that “Biological diversity means the variability among living organisms from all sources including, inter alia, terrestrial, marine and other aquatic ecosystems and the ecological complexes of which they are part, this includes diversity within species, between species and of ecosystems” [12]. Methods proposed for assessing biodiversity in LCA focus either on the species or ecosystem level, or both [13]. Among the multitude of approaches experimented for ecosystem quality assessment, some propose the use of hemeroby classes as biodiversity indicators [14,15,16]. Others use either biodiversity indicators [17,18] or parametric functions relating the area used to diversity data based on a predefined mechanistic relationship describing an observed process (e.g., SAR: species–area relationship) [19,20]. Some use models based on experts’ judgement to assess biodiversity globally (e.g., variety of genes, species and ecosystems) [5,21,22]. Biodiversity loss in LCA is expressed as the potentially disappeared fraction of species (PDF) [11] as loss of species richness is generally the prevalent indicator used because of limited data availability [8,16]. The use of species richness as a biodiversity indicator can lead to ambiguous conclusions, because an increase does not necessarily mean an enhanced biodiversity value, as some rare forest interior species are being replaced by more generalist and common species [18]. However, a reduction in species richness can safely be interpreted as a negative impact [18]. Despite the incompleteness of adopting species richness as the sole indicator [8,22], it still represents an appropriate starting point to model potential impacts on biodiversity in LCA models of impacts on biodiversity.
The approach actually proposed by the UNEP-SETAC initiative recommends the use of the SARc (species–area relationship for countryside) to evaluate the potential impacts of land use on biodiversity associated with species loss at the global scale. Chaudhary and Brooks, 2018 [23] proposed corresponding characterization factors for five land use and three land use intensities, providing results for five taxa. However, this approach is limited by its coverage of management intensity (three classes only: minimal, light or intense) and the use of the species–area relationship (SAR) which relates the impact with the area of a given land use by adjusting the parameter of a power function [24]. Their results reflect the fact that species groups are differently affected by forest management, hence, site-specific assessments are still needed to characterize the effect on species at a local scale [18,24]. Multiple species groups do not necessarily ease the interpretation of the results in the context of LCA, by raising questions about possible trade-offs [24]. Species-based evaluations rely on data availability, which are limited for boreal forests [25,26]. Furthermore, biodiversity is subject to delayed responses [27,28], while some practices are recognized to have negative effects even if the impact on biodiversity has not yet been quantified. These considerations explain why we favor focusing on the ecosystems themselves to evaluate the effects of forest management strategies considering different silvicultural scenarios.
Though several methods have been proposed over time to measure impact on ecosystem quality in LCA [17,20,23], these are still rarely used in life cycle impact assessment (LCIA) of products and processes [13]. Improvements could be possible with a better consideration of specific impacts associated with the type of land-use and related management parameters, and a better assessment of the land-use intensity [13]. For forestry, different management strategies can be adopted [29], such as high yield plantation silviculture, extensive forestry, multiple-use management or ecological forestry.
Setting aside areas for strict protection represents an important component of forest management strategies to prevent or limit biodiversity losses [29,30,31,32]. Therefore, it would be of interest to analyze concomitantly the effects of a protection gradient with different silvicultural scenarios to assist forest management strategy elaboration and verify the possibility of including it in LCIA to support decision-making [13]. Such a use of LCA results related to ecosystem quality is still restricted up to now, as LCA impact evaluation does not always lead to conclusions aligned with the ecosystem quality assessed. For example, Turner et al., 2019 [5] found an LCA impact score lower for a forest management system based on pine plantations to produce softwood, compared with a native forestry system relying on partial cuttings, though the former was recognized as the one having the most negative impact on ecosystem quality. Another case using a SAR-based approach obtained results which were not always aligned with the existing scientific knowledge on biodiversity and forest management [24]. This situation is problematic as it can lead to inaccurate conclusions about management practices [24,33]. As stated by Michelsen et al., 2014 [34], “when different approaches give rise for different recommendations, the usefulness for decision-making will be questioned”. Therefore, it is important to examine the passage from an assessment of the impact on the ecosystem quality over a given territory to the LCA impact evaluation, which calculates the impact per area required to produce one functional unit (i.e., 1 m3 of wood for building structure).
We propose an approach to evaluate the potential impacts of forest management intensity on ecosystems based on the concept of naturalness. A naturalness assessment model has been designed for this purpose for boreal forests [35]. Many authors have proposed to use the concepts of naturalness and hemeroby to evaluate impacts of land use, such as forestry, on the quality of ecosystems in LCA [14,15,36,37,38]. Naturalness is defined as “the similarity of a current ecosystem state to its natural state” [39], whereas hemeroby expresses “distance to nature” in landscape ecology [15]. The use of these concepts provides indexes to be used as guiding principles for forest management overcoming the challenge of gaps in obtaining empirical data on biodiversity. Côté et al., 2019’s [35] naturalness assessment model relies on forest inventory maps and data to compare the anticipated outcome of different forest management strategies, including protection over a given territory [40].
This study aims at exploring the integration of the naturalness assessment results in a characterization model to evaluate ecosystem quality impacts of different forest management scenarios within the Life Cycle Analysis (LCA) framework, in order to verify its relevance for forest management decision-making. The specific objectives are to:
  • Establish the relationship between naturalness and species richness and expand the model developed by Côté et al., 2019 [35] to express results in potential disappeared fraction of species (PDF);
  • Evaluate the effects on naturalness and PDF of increasing the share of protected area combined with different silvicultural scenarios and compare different forest management strategies in the Québec boreal forest;
  • Provide an example of LCA impact score calculation based on a naturalness assessment transformed in PDF to evaluate impacts on the quality of ecosystem of harvested wood products supplied from different forestry management practices in the LCA context.

2. Materials and Methods

2.1. Description of the Test Area and Forest Management Scenarios
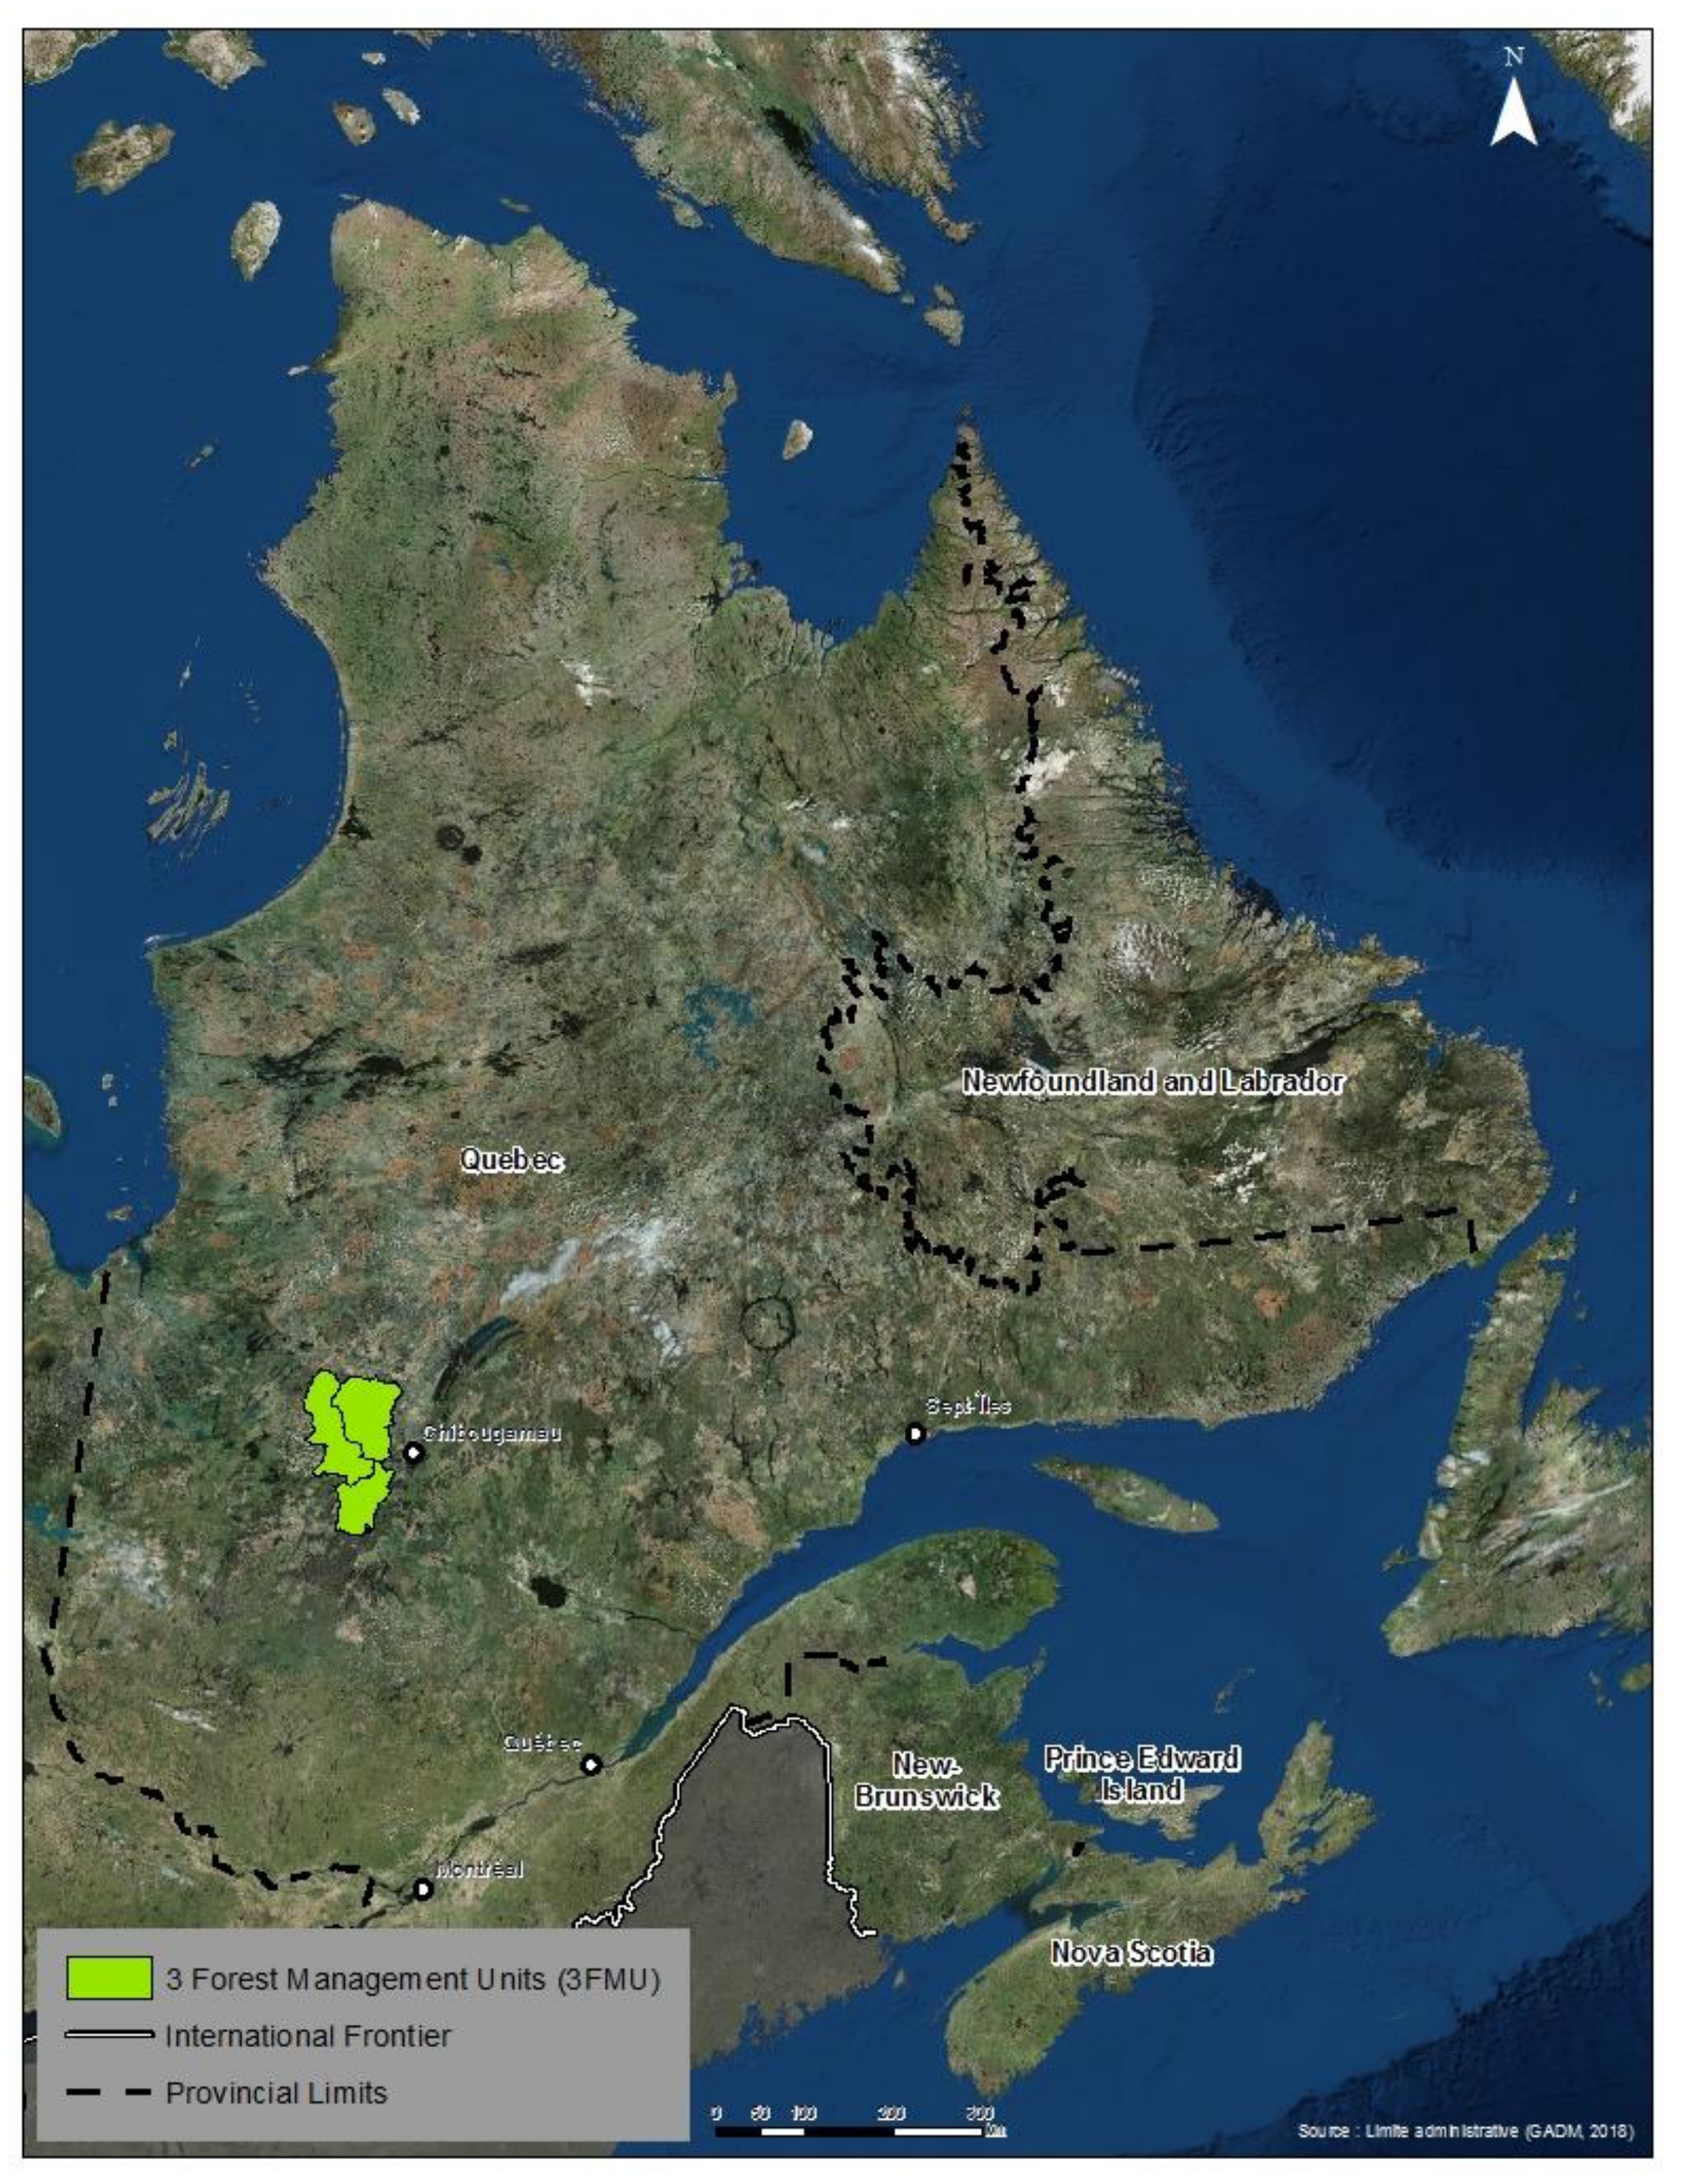
2.1.1. Test Area

The test area is the same that has been used in Côté et al., 2019 [35] and corresponds to a public forest formed by three forest management units (FMU) located in the western black spruce feathermoss bioclimatic sub-domain, near the locality of Chibougamau in Northern Quebec (Appendix A: Figure A1).
The area arrangement considered for the 3FMU is presented in Figure 1. The share of protected area was applied on the available forested area (forested minus excluded), and practices related to wood procurement were applied over a given proportion of the productive area. Silvicultural scenario components must encompass 100% of the productive forested area. The excluded forested area [41] and the protected area were ascribed a natural evolution based on historical reference data (Appendix A: Table A1).

2.1.2. Forest Management Scenarios and Strategies Tested

Three components were involved in the tested forest management scenarios: strict protection and silvicultural scenarios of careful logging and plantation. Strict protection was defined as protected areas belonging to IUCN category I, II or III [43]. The practices considered for silvicultural scenarios applied in the productive area were careful clearcut logging (CL), which corresponds to clearcut with the protection of pre-established regeneration and soil as required by law for clearcut operations in Quebec [44] and forest plantation of indigenous species mechanically released (PL). To determine results at the landscape level, each silvicultural scenario, corresponding to the sequence of silvicultural interventions over time, were applied on a constant basis over a given proportion of the productive area. However, this exercise is highly theoretical, considering that in reality, the different scenarios are adjusted through time. The impact of future fires was not taken into account. Ecological effects of careful clearcut logging and plantations are detailed in Appendix A.
Three silvicultural scenarios were considered: (1) CL only: 100% in careful logging on a 100-year rotation (coded 100CL100); (2) Current Mix: 60% CL on a 100-year rotation combined with 40% PL on a 70-year rotation (coded 60CL100-40PL70); (3) PL only: 100% plantation on a 70-year rotation (coded 100PL70). The two 100% scenarios evaluate the maximal theoretical effect of each practice. Forest management scenario coding (Figure 1) details the percentage of productive area of each silvicultural component (CL or PL) specifying the related rotation length (PL70: plantation with a 70-year rotation) completed by the percentage of protected forest area (e.g., 17.9p: 17.9% of the forest area in strict protection).
A forest management strategy corresponds to a plan of action or a policy designed to ensure a major aim, here defined as sustainable timber production. Two different forest management strategies were considered: (1) variable wood production over a fixed productive area, and (2) fixed wood production over a variable productive area completed with strict protection. The first strategy implies that each silvicultural scenario was applied over the current productive area, considering the current proportion in protection (17.9% of the forest area) and varying wood production. The second forest management strategy considers intensifying wood production to increase area available for conservation but aims to produce the same volume from each of the three tested silvicultural scenarios. The area available for protection was computed as follows: forested area minus excluded area minus productive area necessary to produce the expected volume (Figure 1).
The effect of the level of protection was evaluated by the reassessment of the three silvicultural scenarios with an increasing proportion of forest area in protection, from 0% up to 90%, by steps of 5%. We used the proportion of forest area to control forest protection objectives so as to not take into account unproductive areas that occupy a significant proportion of the territory (18% of the terrestrial area). We assumed that conservation plans considered ecosystem irreplaceability and vulnerability [45].

2.2. Naturalness Assessment

The impact of forest management scenarios involving several forestry practices on ecosystem quality was evaluated using the Naturalness Assessment Model developed for the Picea mariana–feathermoss ecological domain of Quebec [35]. The naturalness assessment of forest management scenarios considered that the scenarios were being applied over the whole territory, as described in Côté et al., 2020 [40].
The Côté et al., 2019 model [35] evaluates five naturalness characteristics: landscape context, forest composition, structure, dead wood and regeneration process (Table 1). The model uses indicators of condition (closed forests for context; cover type and late successional species groups for composition; old forests and irregular stands for structure), which are assessed against historical values, and pressures indicators resulting from practices (anthropization, modified wetlands, clearcuts on wetlands, exotic species, companion species, horizontal structure, dead wood and regeneration process). The evaluation is realized in two steps (see Appendix A for details). First, a partial naturalness index for each condition indicator (condition_pni: pni in lower case) is determined as a function of empirical curves relating measures (percentage of area) to condition_pni (Figure A2) and naturalness degradation potentials (NDP) are evaluated through tables relating percentage of forest area by practices to NDP factors (Appendix A: Table A2 and Table A3). Second, the partial naturalness for each naturalness characteristic (characteristic_PNI: PNI in capital letters) is calculated using the corresponding equation as per Table 1. The final result, the naturalness index (NI), is obtained from the arithmetic mean of the five characteristic_PNI. For the full description of the method, see Côté et al., 2019 [35].

Expanding Naturalness to Species Richness Assessment

In LCA, it is proposed to express the impact of land use on ecosystem quality by the potential disappeared fraction of species (PDF) [11]. The naturalness assessment model used in this study was expanded to estimate the anticipated effects on species richness using global data. To do so, the five naturalness classes (by NI interval of 0.2) based on the conceptual model defined in [35] were related to species richness data as per Figure 2, using data associated with land use characteristics corresponding to the pressure level (i.e., primary vegetation—minimal, light or intense use; secondary vegetation—young, intermediate or mature—minimal, or light/intense use; plantation forest—minimal, light or intense). Data were taken from the PREDICTS data base [46] and built on land use characteristics corresponding to different pressure levels based on 485 studies across the globe with available data of any taxon [3]. Species richness assessed in that study corresponds to the within-sample number of differently named taxa recorded at a given site. Values provided are expressed relatively to an un-impacted baseline (score of 100%), corresponding to complete naturalness. Species richness values from [3] were considered to be the biodiversity potential and correspond to (1-PDF). The PDF value for a given NI was computed using a linear estimation between established points of correspondence. The resulting curve (Figure 2) is provisional considering the global scale, the restricted representation of boreal forests in the database used and the necessity to quantify empirically the relationship between naturalness and PDF. This curve was used to calculate an impact score for LCA based on PDF derived from naturalness (NI).
The NI-PDF curve was given a concave shape (Figure 2) showing a decreasing PDF with a rising naturalness index. This corresponds to a growing negative effect (i.e., more species loss) as the pressure resulting from forest management for wood production rises, which is consistent with cumulative impacts related to multiple stressors, and effects accumulation over large areas and over time [47].
We underline the high level of uncertainty of the NI-PDF curve resulting from the high variability of the available biodiversity data. Therefore, it should not be used as a basis for decision-making. However, we performed a sensitivity analysis of the curve setting using the mean, to explore what would be the effects of variations in corresponding values of PDF on the forest management scenarios assessment using LCA impact scores. The curve building procedure is detailed in Appendix B and the alternative curve settings used for sensitivity analysis are detailed in the Supplementary Materials.

2.3. Life Cycle Assessment Framework of Land Use

According to the land use impact assessment framework in LCA, the impact score (IS) on ecosystem quality due to the land occupation by a given forest management was calculated as follows [7]:
IS = ∆Q × A × T
where ∆Q corresponds to the change in ecosystem quality, here assessed against to the natural situation, A corresponds to the area of land occupied (ha) and T the time of occupation (years). A × T typically represent the area-time of occupation related to the functional unit, e.g., the ha × years required to produce 1 m3 of harvested wood product. ∆Q corresponds to the characterization factor and is computed by a given impact assessment methodology with its specific category indicator units.
The theoretical framework considers a sudden transformation of ecosystem quality from a land use to another [10]. In reality, the initial transformation related to forestry is gradual at the scale of the whole productive area and will span over the length of the first cutting cycle [35]. Land occupation for forestry scenario evaluation corresponds to the state of the ecosystem after the implementation of the production scenario over the entire productive area [40].
For our study, ∆Q was expressed as the potential disappeared fraction of species (PDF) (a dimensionless value between 0 and 1) and A × T was the terrestrial area required annually to produce 1 m3 of wood (TAR) and corresponds to the life cycle inventory (LCI) data representing the flow for land occupation [7]. The TAR was based on yield hypothesis (see Appendix A for details) and the sensitivity of yield was evaluated by varying the respective scenario yields by ±20%, for plantation and careful logging. The area needed each year for the production of 1 m3 was calculated over the terrestrial area as follows:
TAR = 1 ÷ (yield × productive area ÷ terrestrial area)
where the yield related to each scenario component, expressed in (m3/(ha productive × yr)), where yr = 1, was multiplied by the productive area to calculate the annual harvest in (m3/yr), which was then divided by the terrestrial area of the 3FMU to calculate the annual harvest related to the total terrestrial area in (m3/(ha terrestrial × yr)). For LCA, we need the area required for the production of 1 functional unit defined here as 1 m3 of wood. Applying the rule of three, the inverse (1/x) of the annual harvest related to the terrestrial area corresponds to the TAR (terrestrial area required annually to produce 1 m3 of wood) and is expressed in ((ha terrestrial × yr)/m3), where yr = 1 and m3 = 1.
Therefore, the LCA impact score (IS) corresponds to:
IS (PDF × ha_ter × yr/m3) = PDF × TAR (ha_ter × yr/m3)
where yr = 1 and m3 = 1.

3. Results

3.1. Naturalness Assessment Results on the Test Area

Considering a fixed productive area with varying wood production, the CL only scenario results in the highest naturalness, followed by the Current Mix and the PL only (Table 2; supported by detailed results in Supplementary Materials, sheet “results_current_protection”). In comparison, the PL only silvicultural scenario has a positive effect on composition, but negative effects for the four others naturalness characteristics. A forest management strategy aimed at producing a maximum of wood over a given productive area results in a low level of naturalness. With 17.9% of the forest area in protection, regeneration through careful logging would produce 502,100 m3/yr, leading to a naturalness index in the lower portion of the semi-natural class (NI = 0.470). With the same protection level, regeneration with indigenous species plantations would produce more wood (1,629,025 m3/yr) but lead to an altered naturalness state (NI = 0.301).
Considering a fixed production of wood (502,100 m3/yr), it would be possible to produce the same amount of wood with PL only over 28.3% of the forest area with the remaining 71.7% of the forest area in strict protection. Such a strategy would lead to a naturalness index in the higher portion of the near-natural class (NI = 0.746). Applying the current regeneration mix (60% careful logging and 40% plantation) over 45.3% of the forest area while protecting the remaining 54.7% would lead to a naturalness index in the lower portion of the near-natural class (NI = 0.649). According to the conceptual model of the naturalness assessment model, there is a high probability of species persistence associated with the near-natural class (Figure 2).
The naturalness assessment results, expressed as a function of the level in strict protection, show that the level of naturalness rises with an increase in the proportion of protected forest area (Figure 3; see detailed results in Supplementary Materials, sheet “NI-PDF_a”). The naturalness index of CL only without protection (NI = 0.414) is almost equivalent to the naturalness index resulting from PL only combined with 35% of the forest area in protection (NI = 0.408), or from the Current Mix combined with 20% of protection (NI = 0.417).

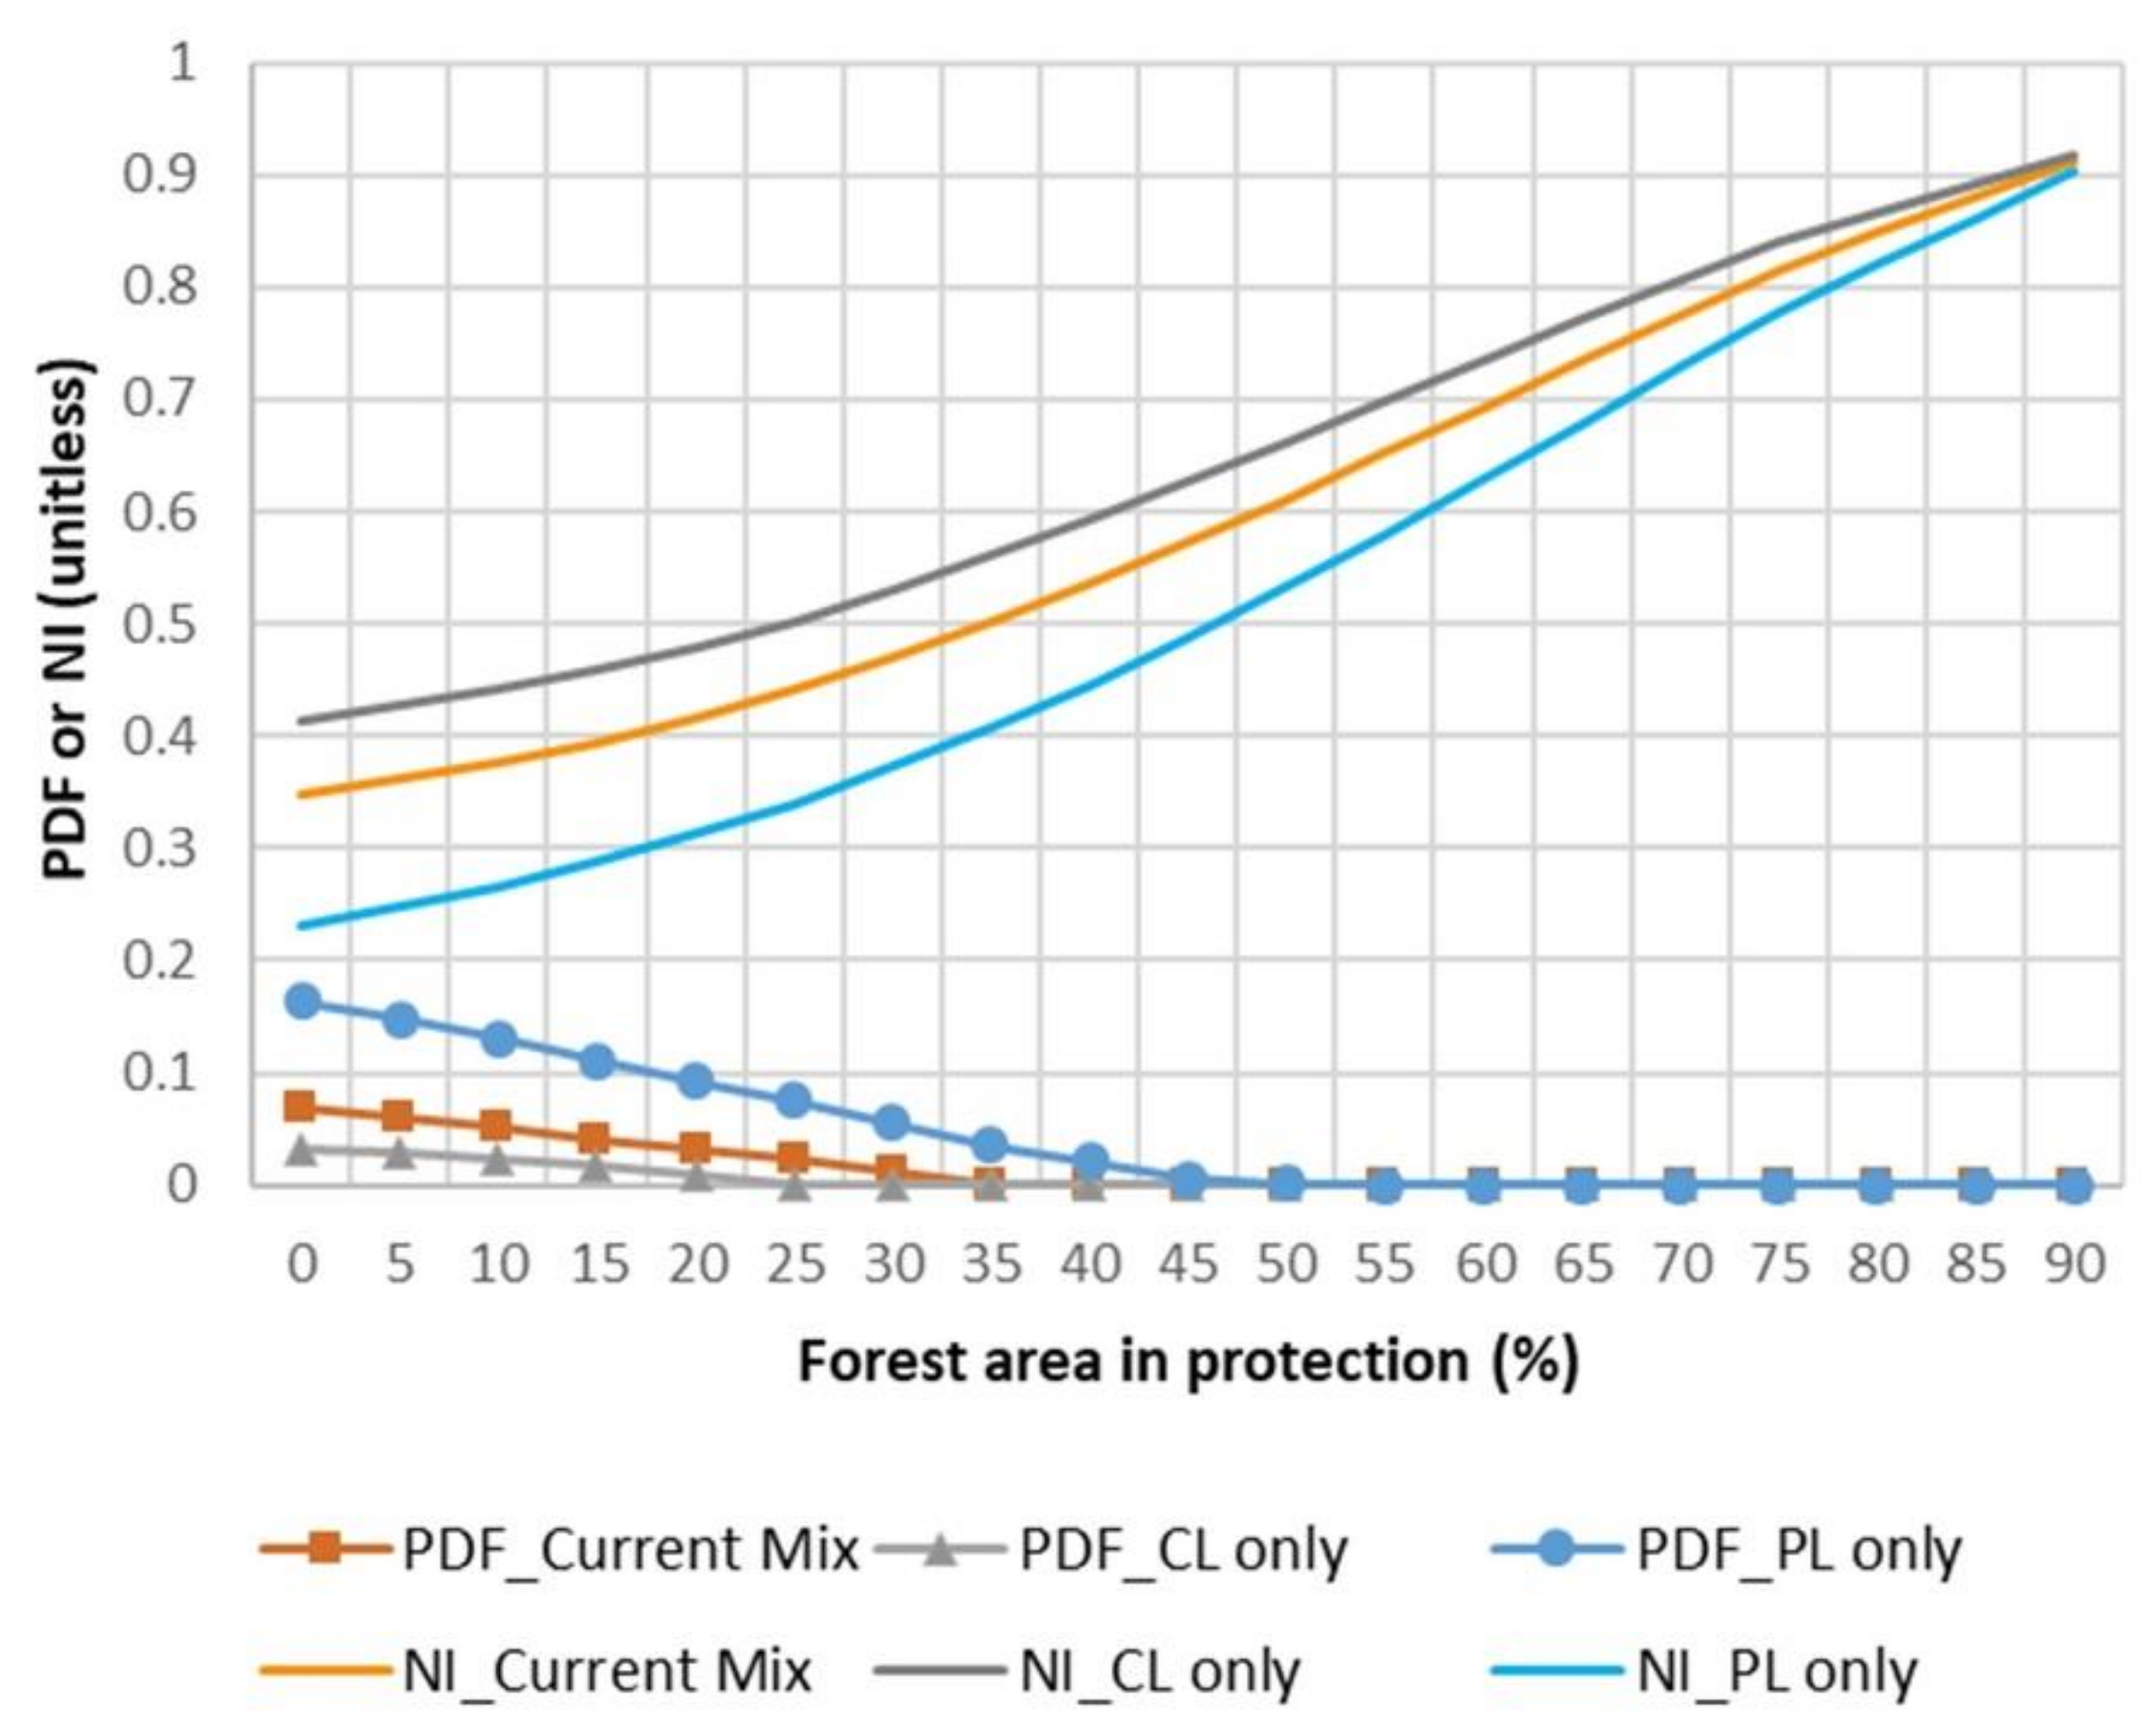
3.2. Transformation of NI to PDF

The transformation to PDF required for life cycle assessment has the following effects on the NI (Figure 3): (1) it reverses tendencies to express damages (with NI representing the state of “what is remaining”: PL only < Current Mix < CL only, while PDF represents “what is lost”: PL only > Current Mix > CL only); (2) it narrows and reduces markedly the range of values (NI: 0.23–0.92; PDF: 0–0.16); (3) when increasing the protection level from 0% onwards, it reduces more rapidly the differences between silvicultural scenarios; and (4) it sets all effects at 0 when above a certain level of protection. We adjusted part of it by introducing infinitesimal values for PDF when NI lies in the near-natural class, but this does not affect the results and conclusions.

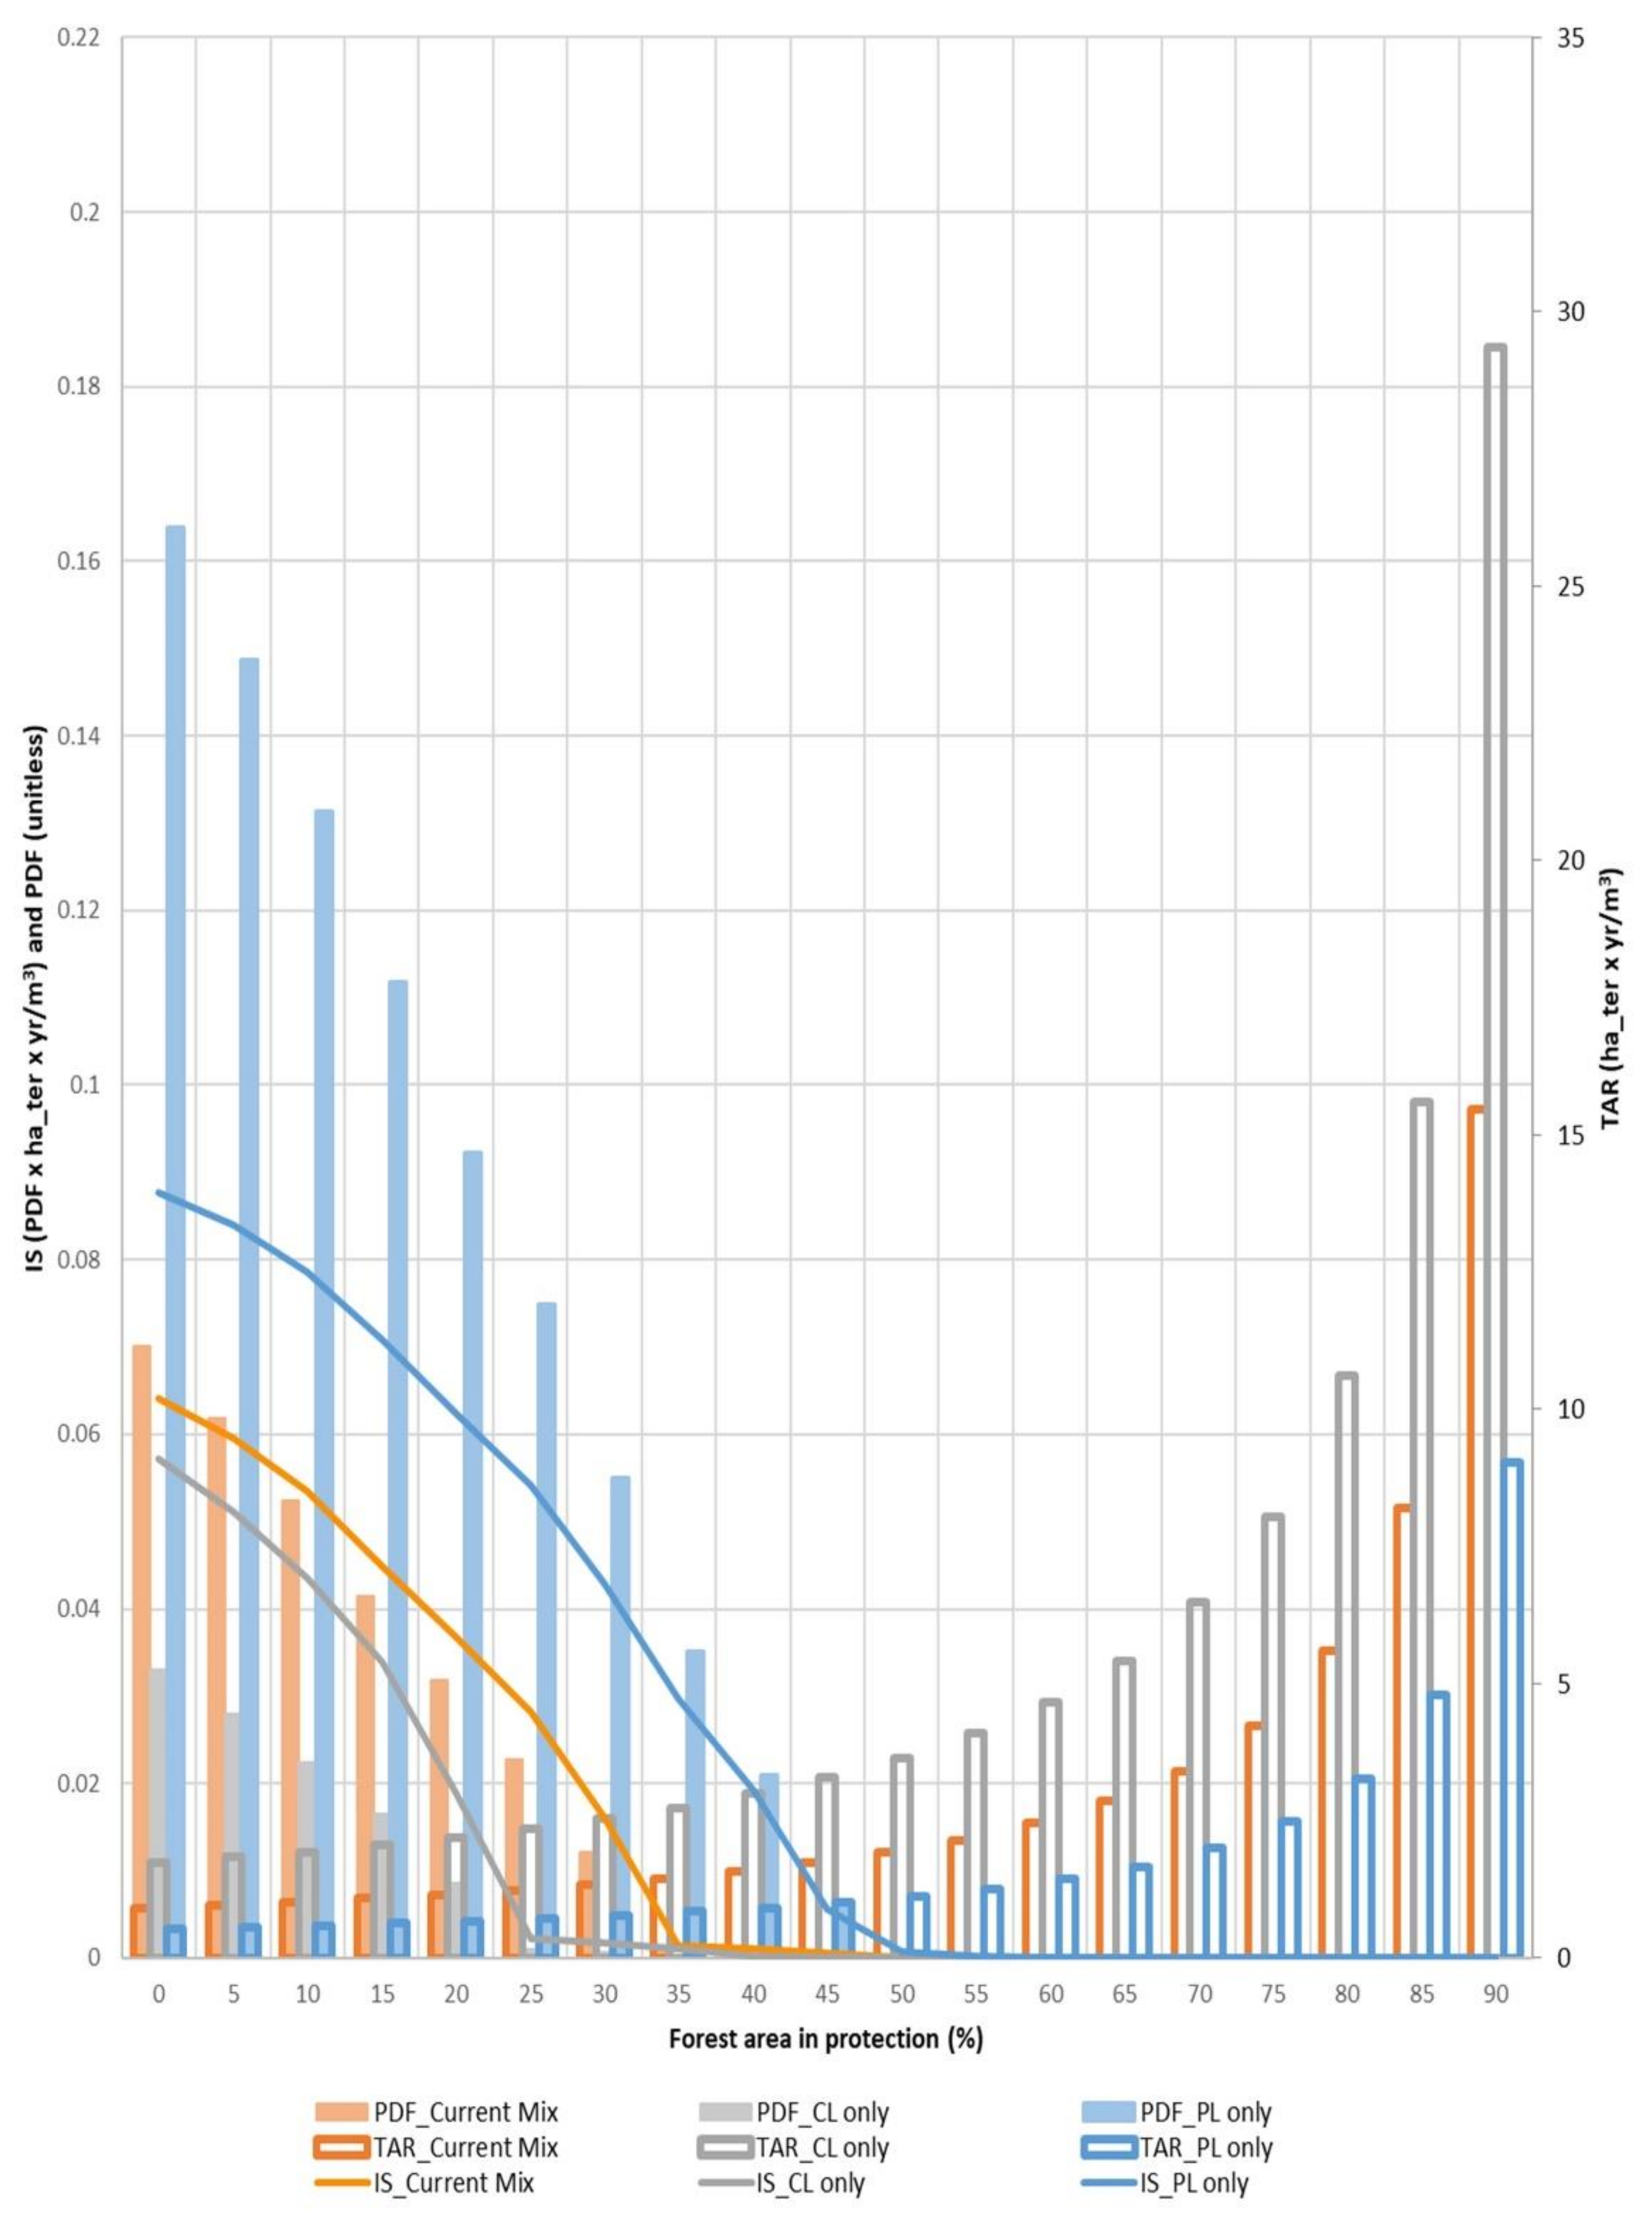
3.3. Life Cycle Assessment Results

Life cycle assessment results and related key input data are presented in Table 3 for the two forest management strategies, resulting from the combination of each of the three silvicultural scenarios assessed with the protection level required to achieve the objective of the strategy. Silvicultural scenario ranking results are summarized in Table 4 for each LCA parameter.
For the strategy over a fixed productive area considering 17.9% of the forest area protected, the scenario ranking based on the PDF is the opposite of the TAR-related ranking (Table 4). The strategy producing annually a fixed volume of 502,100 m3 of wood, with the CL only scenario, requires 651,610 ha of productive forest, which leaves 149,856 ha available for protection, corresponding to the current level of protection of 17.9% (Table 3). The same production of wood can be obtained with the Current Mix scenario combined with 54.7% of the forest area in protection or with the PL only scenario combined with 71.7% in protection. Therefore, producing the same volume of wood (502,100 m3) over the same terrestrial area (1,072,294 ha) for the three management scenarios (each combining one silvicultural scenario with different percentage of area in strict protection) leads to the same value for the TAR.
For the strategy over a fixed area, we observe that the impact scores are highly correlated to the PDF characterization factors and lead to the same ranking of management scenarios (Table 4), but show less difference between the scenarios compared with the PDF (Table 3). For the fixed wood production strategy, it is not possible to discriminate between Current Mix and PL only based on PDF and LCA impact score results because of zero values.
The evaluation of silvicultural scenarios considering a protection gradient is illustrated in Figure 4. It presents the modeled relationships between the impact scores (IS) and the potential disappeared fraction of species (PDF), the terrestrial area annually required (TAR) to produce 1 m3 of wood and the proportion of the forest area in protection. The PDF characterization factor is illustrated along the protection level using the solid chart bars associated with the left axis. The TAR is illustrated along the protection level using the empty chart bars associated with the right axis. The impact score, which corresponds to the multiplication of the PDF with the TAR, is illustrated with the lines associated with the left axis.
The results along the protection gradient show a nonlinear relationship between the level of protection and the TAR (Figure 4). The shape corresponds to the inverse function of the land productivity resulting in the area required to produce 1 m3 of wood (as per Equation (2)). The TAR results display a wide range varying between 0.53 and 9.04 ha_ter × yr/m3 for PL only, between 0.92 and 15.47 ha_ter × yr/m3 for the Current Mix, and between 1.74 up to 29.4 ha ter × yr/m3 for CL only (see Supplementary Materials for detailed results). The PDF results expressed as a function of the level in protection show a decrease in the PDF as the proportion of protected forest area in protection increases (Figure 4). For CL only, the PDF results varies between 0 and 0.033, between 0 and 0.070 for the Current Mix, and between 0 and 0.1638 for PL only. The TAR and the PDF show opposite effects (Figure 4), as well as opposite scenario ranking (Table 4). The impact score ranking corresponds to the PDF one.

3.4. Sensitivity Analysis

A sensitivity analysis of the values used to set up the provisional NI-PDF curve was performed by applying alternative correspondence values for PDF (indicated in red in Figure 5 and Figure S1) to evaluate their effects on the resulting impact scores. The setting and detailed results for each alternative curve are included in the Supplementary Materials, the EXCEL file sheets correspond to the letter associated with the curve tested. The representations of these results displayed accordingly to Figure 4 are included in the Supplementary Materials, sheet “Figures_curves_a_to_f”.
The analysis shows high sensitivity to the values used to generate the curve relating potential disappeared fraction of species (PDF) to the naturalness index (NI). A small change in correspondence values, comprised within the confidence interval of the PDF data, can affect not only the magnitude of differences between scenario impact scores (Figure 5b,c) but can lead to different results (Figure 5d,e). Based either on the naturalness index or on the PDF the scenario ranking in decreasing order of damage is PL only > Current Mix > CL only. This ranking is consistent with scientific knowledge on ecological impacts of silvicultural treatments. The use of the provisional curve (curve (a)) leads to impact scores displaying the same ranking. However, using the curve (d), with 0 and 5% levels of protection, the impact scores would rank PL only > CL only > Current Mix. Using the curve (e), the impact scores with a 0 to 20% protection level would rank CL only > PL only ≈ Current Mix. With more than 25% of protection, they would rank PL only > Current Mix > CL only (see Supplementary Materials, sheet “NI-PDF_e” for detailed results).
We also observe that the use of the impact score to compare the level of protection related to a scenario would lead to different results depending on the NI-PDF curve setting. For example, the protection level where losses reach near zero values when using curves (c) and (d) is different from the level obtained with the provisional curve.
The second parameter involved in the impact score calculation is the TAR associated to the scenario, which results from the division by the yield. The effect on the impact scores of a variation of ±20% of the scenarios yield for PL or CL are illustrated in Figure 6. Results are affected by the difference between the scenario’s productivity. Larger differences between the basic scenarios can lead to questionable conclusions at low levels of protection (Figure 6b,c).

4. Discussion

4.1. LCA Impact Assessment

The trial use of naturalness in LCA considering gradient of protection sheds light on the LCA model behavior. The two parameters involved in the LCA impact score calculation, the potentially disappeared fraction of species (PDF) and the terrestrial area required annually to produce 1 m3 of wood (TAR), showed opposite non-linear effects that have to be properly put in balance in order to lead to impact score results consistent with existing scientific knowledge about the impacts of forest management. The transformation in PDF using the provisional curve provided a range of values and a distribution allowing to offset the effect of the TAR and led to impact scores correlated with the PDF rankings (i.e., PL only showing the greater impact followed by Current Mix and CL only). As the biodiversity data necessary to calibrate and confirm empirically the NI-PDF curve are not available for our study area, the use of the proposed NI-PDF curve could be hazardous with the current state of knowledge. The sensitivity analysis showed that the window for obtaining consistent results is narrow. There are risks of inaccurate results if data on species richness loss do not have the mathematical characteristics allowing to compensate for the effect of the area required (TAR), itself determined by the inverse of the yield function (1/x). When the quality indicator does not vary appropriately with the variation of the TAR, it can produce misleading conclusions. This supports raised doubts about the possibility to implement the non-linear relationship between LCI data related to land use productivity (e.g., land occupied/transformed in area × year) and impact on biodiversity (e.g., potentially disappeared fraction of species locally) in LCA models that typically scale impacts up or down using simple proportionality [8]. This also supports worries expressed by Teixeira et al., 2016 [8] about the use of LCA biodiversity models. It highlights the need to look beyond the characterization factor and the necessity to analyze the effect on the impact score of introducing an indicator into the LCA model, in regard to the effective protection of the safeguard subject (i.e., the ecosystem quality).
Turner et al., 2019 [5] also obtained diverging results from LCA impact scores when comparing with existing knowledge on the effects of a given type of forest management; they linked this with issues related to scaling/weighing, cumulative effects and with the reference benchmark. Our results confirm the relevance of scaling and weighing indices from ecological models for their inclusion into the LCA model as ecosystem quality indicator. When evaluating the environmental impact of anthropogenic production systems, LCA assumes a linear relationship between the impact and the quantity produced, which does not reflect the shape of cumulative effects [2]. However, our results indicate that the mathematical framework imposed by the TAR calls for the use of an indicator reflecting somehow the cumulative effects, because it has the power to compensate for TAR’s preponderance within the LCA framework. Interestingly, most biodiversity indicators or weighing approaches proposed in the land use LCA context do reflect a cumulative effect. It is the case in our study with the potentially disappeared fraction of species along the alteration gradient (Figure 2), as it is often found in the literature expressed through the use of some kind of exponential/logarithmic relationship between habitat degradation and species losses. It can be seen in Chaudhary et al., 2015 [48] with the SAR, in Rossi et al., 2018 [38] between hemeroby level and partial biodiversity scores, in Lindqvist et al., 2016 [49] to express the contribution of a given parameter to a biodiversity potential function or in Turner et al., 2019 [5] for weighing results from expert opinions.
In the perspective of using LCA results for forest management decision-making, the present study showed difficulties for both the protection level and the silvicultural scenarios. The transformation of NI in PDF required for LCA involved values equal or near 0 for PDF in the higher portion of the protection gradient to offset the non-linear portion of the TAR. This impaired the possibility to properly consider the effects of the level of protection on the quality of ecosystems. As for the evaluation of silvicultural scenarios, the transformation in PDF reduced the difference between scenarios more rapidly along the protection gradient. The sensitivity analysis showed that the LCA impact scores could not be used as comparative basis to associate the level of protection related to a given management scenario as it would correspond to an artefact of the NI-PDF curve. Moreover, the sensitivity analysis showed that the LCA impact scores were sensitive to the PDF value and to productivity, as well, and there are risks of curve inter-crossings (i.e., changing ranking of silvicultural scenarios) which produce results that are difficult to interpret. Another point is that the use of an LCA impact score for decision-making in sustainable forest management has the potential to misinform as it does not take into account the crossing of ecological thresholds. An ecological threshold corresponds to a point where a small marginal change in the quality of ecosystems can cause a large response leading to an irreversible reorganization of the ecosystem [50,51]. LCA does not aim to evaluate the shifting state of ecosystems or biodiversity [2] and most of the time we do not know exactly which level corresponds to an ecological threshold until it has been crossed. Furthermore, for a given ecosystem, biodiversity thresholds can be numerous [52] and cannot be expressed on a functional unit basis. This situation supports the recommendation of using site-specific evaluations for decision-making about land use and management practices [24].
In any case, best management practices or strategy identification must be aligned with local evaluation over a given territory, as we are managing at the scale of hundreds of thousands of hectares of forests, which are finite over the planet. It would not be environmentally sound to take a direction towards more production at the expense of the overall ecosystem quality. Site-specific and/or territorial studies should be used to support decisions [24] in order to prevent inaccurate conclusions about the forest management strategy and practices and their effects on landscape [8].
The available LCA model calls for another round of critical evaluation of the underpinning of the land use aspects in LCA modelling, considering the mathematical features related to the non-linear relationships involved [48]. Moreover, questions still remain about the proper method to consider ecosystem quality in LCA. As recommended by Teixeira et al., 2016 [8], LCA modelling should strive for a better coupling between results and policy decisions and existing strategic plans.

4.2. Consequences for Forest Management

4.2.1. Targeting the Level of Protection Using Naturalness

Limitations imposed to the incorporation of naturalness assessments into the LCA model does not question the use of naturalness assessment as a tool to assist decision-making related to forest management scenarios and strategies.
The area set aside for strict protection is an important component of a forest management strategy to prevent or limit biodiversity losses [30,31,32]. The question of how much is enough has been a source of questioning for years [53,54].
With the hypothesis that strictly protected forests have the characteristics of natural forests, the increase in protection contributes to the improvement of overall naturalness, and to the decrease in the potential loss of species due to forest management. Protection targets could be estimated using the relation between the naturalness index and the potential impacts on biodiversity (Figure 2). For example, aiming a management target seeking to limit species loss (i.e., NI ≥ 0.5), the proportion in protection should be 25% of the forest area with the CL only scenario (Figure 3 and Supplementary Materials, sheet “NI-PDF_a”). It should be set at 35% with the Current Mix scenario (which represents twice the current level of protection for the forest management units (FMU) under study), and 50% for the PL only scenario. This level of protection is consistent with the level recently proposed as a “big bold conservation target” [32]. However, according to the naturalness conceptual model (Figure 2), if the objective is to avoid species loss, the naturalness level target should aim for the lower limit of the near-natural class (NI ≥ 0.6). Such a level is reached with 45% of protection with the CL only scenario, 50% of protection with the Current Mix scenario or 60% of protection with the PL only scenario (Figure 3 and Supplementary Materials, sheet “NI-PDF_a”). This 60% level corresponds to the proportion of area set aside estimated by Framstad et al., 2002 in Michelsen 2008 [36] to be necessary to maintain biodiversity within boreal forests. The current protection level for the three FMUs under study (17.9% of the study forest area) combined with the Current Mix of regeneration methods (60% in careful logging and 40% in plantation) is expected to lead to an ecosystem at the limit of being altered (NI = 0.407). This level is likely to produce some biodiversity losses. These losses could be limited by doubling the proportion of forest area in strict protection to reach a level of 35%.

4.2.2. Considering Protection in Forest Management Strategies Using Naturalness

A forest management strategy producing wood over a given productive area shows a lower naturalness level if wood is produced through plantation of indigenous species when compared with careful logging (Table 2). In contrast, a forest management strategy producing a given amount of wood leads to a higher naturalness if wood is produced through plantation of indigenous species with a revolution of 70 years over a small portion of the area combined with strict protection of the remaining fraction, compared with production over the whole current productive area through careful logging with a revolution of 100 years combined with the actual level of protection. Based on the naturalness assessment results, it would be better for the environment to intensify forest management over a small proportion of the forest territory while ensuring strict protection over the remaining portion, compared with an extensive forest management applied over the vast majority of the forested area. This confirms the pertinence of a zoning approach such as the “Triad strategy” [55,56]. Obviously, this conclusion holds true only if the area not used for wood production is permanently set aside for strict protection through an effective strict protected area system [57], and if the enhanced production does not involve plantation of exotic species. However, the implementation of scenarios involving increased production to compensate for protection is complicated by the necessary delay to obtain wood products from plantations and the related question of wood procurement in the meantime [58,59]. Such approaches require a paradigm shift in policy-making [60] and necessitates prompt action to ensure conservation of primary forests.

4.3. Future Research

High priority should be given to studying the effects of forest management on biodiversity, especially species loss in boreal forests. This should be put in relation with research on the relationship between naturalness and biodiversity. The reliability of the NI-PDF curve set up could be improved using an updated subset of the PREDICTS database corresponding to boreal forest with the appropriate definition of land use intensity. Further empirical data should be sought to reduce uncertainty and confirm the relevance of using species richness data in the LCA model.
The use of the naturalness concept could be promoted, by adapting the model for more bioclimatic domains and performing assessment over more forest management units (FMU) and at the bioclimatic domain scale. To expand our approach to ecosystem quality evaluation in LCA, the method used for naturalness assessment of forestry should be adapted for other land uses in order to allow land-use comparisons based on the ecosystem quality. To do so, the naturalness assessment should be integrated into the whole alteration gradient [35], along with the other land uses by designing a hemeroby assessment model based on the habitat characteristics.
To improve the robustness of the LCA model, it is of outmost importance to investigate the mathematical effects of non-linear parameters in order to verify if and how issues related to scaling and non-linear effects in the LCA model could be properly addressed.

Supplementary Materials

The following are available online at https://www.mdpi.com/article/10.3390/su13168859/s1, SM_Sensitivity_analysis_curve.doc: Description of tested alternative curve settings. SM_Results_3FMU.xls: results_current_protection: Results with the current level of protection (17.9% of the forest area). NI-PDF_a: Detailed results for Figure 5a using the provisional curve of Figure S1a. NI-PDF_b: Detailed results for Figure 5b using the curve of Figure S1b. NI-PDF_c: Detailed results for Figure 5c using the curve of Figure S1c. NI-PDF_d: Detailed results for Figure 5d using the curve of Figure S1d. NI-PDF_e: Detailed results for Figure 5e using the curve of Figure S1e. NI-PDF_f: Detailed results for Figure 5f using the curve of Figure S1f. Figures_curves_a_to_f: model display format of Figure 4 for each NI-PDF curve tested. Yield_PL−20: Detailed results for Figure 6a using a plantation yield reduced of 20%. Yield_PL+20: Detailed results for Figure 6b using a plantation yield raised of 20%. Yield_CL−20: Detailed results for Figure 6c using a careful logging yield reduced of 20%. Yield_CL+20: Detailed results for Figure 6d using a plantation careful logging yield raised of 20%. Naturalness_assessment_ex: example of naturalness assessment of a forest management scenario (60CL100-40PL70-cp).

Author Contributions

Conceptualization, S.C. and M.M.; methodology, S.C.; software, S.C.; validation, S.C., R.B. and M.M.; formal analysis, S.C. and R.B.; investigation, S.C.; resources, R.B.; data curation, S.C.; writing—original draft preparation, S.C.; writing—review and editing, S.C., R.B., M.M. and L.B.; visualization, S.C.; supervision, R.B., M.M. and L.B.; project administration, R.B. and M.M.; funding acquisition, M.M and R.B. All authors have read and agreed to the published version of the manuscript.

Funding

This research was funded by the Natural Sciences and Engineering Research Council of Canada (NSERC) through a grant to Manuele Margni, grant number CRD-462197-13, with the collaboration of Cecobois, Canadian Wood Council, Desjardins, GIGA, Hydro-Québec and Pomerleau. The first author received scholarships from the Jean-Claude and-Lisette Mercier Fund and from the Industrial Research Chair on Eco-Responsible Wood Construction (CIRCERB).

Institutional Review Board Statement

Not applicable.

Informed Consent Statement

Not applicable.

Data Availability Statement

Not applicable.

Acknowledgments

The authors deeply thank the Department of Wood and Forestry Sci.

Conflicts of Interest

The authors declare no conflict of interest. The funders had no role in the design of the study; in the collection, analyses or interpretation of data; in the writing of the manuscript, or in the decision to publish the results.

Abbreviations

AbbreviationsSignification
antAnthropization
ant_NDPNaturalness degradation potential from anthropization
CBDConvention on Biological Diversity
CFClose forests
CF_pniPartial naturalness for close forests
CLcareful clearcut logging
CompoComposition
Compo_PNIPartial naturalness for composition
ContextLandscape context
Context_PNIPartial naturalness for landscape context
CSCompanion species
CS_NDPNaturalness degradation potential related to companion species
CTCover type
CT_pniPartial naturalness index for cover type
DWDead wood
DW_NDPNaturalness degradation potential related to dead wood
DW_PNIPartial naturalness index for dead wood
cpCurrent protection level
exoExotic species
exo_NDPNaturalness degradation potential from exotic species
FMUForest management unit
HaHectares
ha_forForest area in hectares
ha_prodProductive area in hectares
ha_terTerrestrial area in hectares
HSHorizontal structure
HS_NDPNaturalness degradation potential related to horizontal structure
IRIrregular stands
IR_pniPartial naturalness index for irregular stands
ISImpact score
IUCNInternational Union for Conservation of Nature
LCALife cycle analysis
LCILife cycle inventory
LCIALife cycle impact assessment
LSLate successional characteristic species (i. e. Picea spp.)
LS_pniPartial naturalness index for late successional characteristic species
m3Cubic meter of wood
NDPNaturalness degradation potential
NENatural evolution
NINaturalness index
OFOld forests
OF_pniPartial naturalness index for old forests
PDFPotential disappeared fraction of species
PLPlantation
PNIPartial naturalness index for a given characteristic of naturalness (characteristic_PNI)
PniPartial naturalness index for a given condition indicator (condition_pni)
Prod_areaProductive area
RPRegeneration process
RP_NDPNaturalness degradation potential related to regeneration process
SARSpecies–area relationship
SETACSociety of Environmental Toxicology and Chemistry
StrucStructure
Struc_PNIPartial naturalness index for structure
TARTerrestrial area annually required to produce 1 m3 of wood
UNEPUnited Nations Environment Program-
W_CCClearcuts on wetlands
W_CC_NDPNaturalness degradation potential related to clearcuts on wetlands
WmModified wetlands
Wm_NDPNaturalness degradation potential related to modified wetlands
yrYear

Appendix A. Naturalness Assessment of the 3 FMU and Related Data

The test area corresponds to three Forest Management Units (FMU) (nos. 2663, 2665 and 2666) covering a total area of 1,305,200 ha [41]. The localization of the test area is shown in Figure A1. The study area is currently subject to the first cycle of harvest.
Figure A1. Test area localization.
Sustainability 13 08859 g0a1

Appendix A.1. Historical Data of the Test Area

Historical data are shown in Table A1. Reference data for cover type (CT), late successional species groups (LS), old forests (OF) and irregular stands (IR) were taken from the first Quebec forest inventory, corresponding to the period from 1965 to 1974, using Quebec’s SIFORT system (tessellation of provincial forest inventory maps) [61], from which 6% of harvested areas and other anthropic disturbances were removed. To conform to the integral application of the forest management scenario, the reference value for CF (closed forest: >40 years old) corresponds to the (total forest area minus the forest area in old forests), spread evenly over the younger age classes (0–100), then adding the corresponding area for 0 to 40 years.
Table A1. Reference values of condition indicators used for naturalness assessment.
Condition IndicatorValue (% 1)
Cover type (CT)79.54
Late successional species group (LS)46.03
Closed forest (CF)62.29
Old forests (OF)49.31
Irregular stands (IR)31.54
1 % of forest area except for CF which is based on terrestrial area.

Appendix A.2. Ecological Effects of Careful Logging and Plantations

Careful clearcut logging represents a significant and abrupt change in habitat conditions for forest wildlife [62]. At the stand level, clearcutting induces modifications in vegetation structure and composition, microclimate and ground substrate [62,63,64]. It also resets the vegetation succession to earlier stages [65]. At the landscape level, even aged management (regenerated through clearcuts) modifies the age structure (distribution of age classes) of the forest by reducing the proportion of old forests to an extent related to the rotation length [63]. This precludes the formation of characteristics related to old growth forests [66], thus affecting species associated with old-growth habitat [60]. Impacts on biodiversity are mainly influenced by the rate and the spatial pattern of harvesting and the type and intensity of subsequent management practices [63].
Plantation corresponds to an intensive form of forest management involving a suite of anthropogenic manipulations of forest regeneration including site preparation, tree planting (including sometimes genetic selection of the planted trees) and various tree-releasing and tree-thinning treatments [64]. Plantation forests support generally lower diversity compared with natural forests [64,67]. Negative effects are particularly important when exotic species are used [29,58,67], which is not the case in the study area. Plantation of indigenous species can have positive effects by contributing to forest composition restoration, for example [68], but still there are potentially negative effects related to modification of genetic pools, site preparation, shorter rotation, repeated thinning and homogenization of conditions [29,66,67]. Cumulative effects on biodiversity of intensive forest management are likely to increase over time as a result of reduced species diversity, reduced amount of dead wood and enhanced frequency of high disturbance over large areas [66]. By producing more wood from intensively managed areas, plantations could be used to reduce indirectly pressure on natural forests [58,67,68]. To be efficient, such an approach requires that forest conservation objectives are permanent and guaranteed by rigorous legislation [60,66], which can be obtained with the creation of strictly protected areas [43].

Appendix A.3. Scenario Naturalness Assessment

The territory used for the analysis covers the whole area included in the perimeter of the FMU (without cutting tessell in SIFORT maps), including the surrounding strict protected areas (IUCN categories I to III) associated with these units. The percentage of forested area over the territory of analysis was calculated for measures of forest condition (CT, LS, OF and IR) and the percentage of terrestrial area over the territory of analysis for context measures (CF, W_CC, Wm, ant).
Age structure related to each scenario under sustainable production has been used to evaluate closed and old forests. For example, for a rotation of 100 years, 10% of the productive area will be in each 10 years class (0–10 years up to 90–100 years), and for a rotation of 70 years, 14.2857% of the productive area will be in each 10 years class (from 0–10 years up to 60–70 years).
Current data, corresponding to the 2011 to 2013 period, were taken from the fourth inventory program [42]. Clearcuts on wetlands and anthropization levels were set to current values using data from ecoforest4 map [42] (% of terrestrial area: W_CC = 7.88%, ant = 0.74%) and kept constant in all scenarios. Percentages of forested area by origin and by age class considering silvicultural treatments has been used to determine CT and LS under 20 years and over 20 years old, in careful logging (CL) and plantations (PL). Hypotheses used for condition indicators (CT, LS, IR and OF) are shown in Table A2 (see Côté et al., 2019 [35] for details). Values for CF (closed forests over 40 years old) are determined based on age structure resulting from scenario components application.
Table A2. Hypotheses used for condition indicators (coniferous cover type (CT); late successional species groups (LS); old forests (OF); irregular stands (IR)) for each scenario component: careful logging (CL), plantation (PL) and natural evolution for protection and excluded area.
Scenario Component CTLSIROF
Young CL (<20 yr)6.541.09
Older CL (≥20 yr)48.1113.100 10 1
Young PL (<20 yr)42.810.41
Older PL (≥20 yr)86.579.700 10 1
Natural evolution79.5446.0331.5449.31
1 value for the whole component (all age classes).
The natural degradation potential (NDP) factors used are shown in Table A3 and correspond to those used in Côté et al., 2019 [35].
Table A3. Natural degradation potential (NDP) factors for each scenario component: careful logging (CL), plantation (PL) and natural evolution (protection).
Scenario Component Horizontal StructureDead WoodRegeneration Process
CL0.350.650.4
PL10.950.9
Natural evolution000
The curves elaborated for pni evaluation specifically for the three FMUs are presented in Figure A2.
The naturalness assessment of the Current Mix scenario forecasting 60% of CL on a 100-year rotation with 40% PL on a 70-year rotation with the current level of 17.9% of the forest area in protection (60CL100-40PL70-17.9p) is provided as an example for the detailed description of the naturalness assessment method (File: SM_Results; Naturalness_assess_ex.xls).
Figure A2. Partial naturalness index (pni) determination curves used for condition indicators’ evaluation for three forest management units (3FMU) in the boreal black spruce-feathermoss bioclimatic domain: (a) coniferous cover type (CT); (b) late successional species groups (LS); (c) old forests (OF); (d) irregular stands (IR); (e) closed forests (CF).
Sustainability 13 08859 g0a2

Appendix A.4. Scenario Yield Hypotheses

For the protection, obviously there was no yield. For the careful logging, the yield estimation of 0.77 m3/(ha productive × yr), was based on the sustainable harvest calculated in 2014 [41] (502,100 m3/yr) over the productive area (651,610 ha), considering a rotation of 100 years. For the plantations, an expected yield of 2.5 m3/(ha productive× yr) was based on tables for black spruce plantations having a station quality index of 6 (IQS = 6) with 2000 or 2500 stems/ha has been used [69]. For the 60% careful logging with 40% plantation scenario, the yield corresponds to the weighed sum of the productivity of both scenarios (1.462 m3/ha productive × yr).
The main source of uncertainty related to the estimation of the yield is for plantations, as no plantation has ever reached maturity in the study area and the plantation yield is more likely to be overestimated due to unaccounted mortality over the lifespan of the forest plantations [70]. Moreover, for the PL only scenario, the mean expected yield should be lower as plantations covering 100% of the productive area should be lower than the productivity of plantations concentrated on the best sites.
Table A4. Species richness data by pressure level.
Pressure LevelSpecies Richness (Mean [3] 1)PDF (100 Mean Richness) ÷ 100
Mature secondary vegetation (light/intense use)117.1−0.171
Intermediate secondary vegetation (light/intense use)90.10.099
Young secondary vegetation (light/intense use)79.90.201
Plantation forest (minimal use)80.80.192
Plantation forest (light use)73.10.269
Plantation forest (intense use)60.60.394
1 Reprinted with permission from Newbold et al., 2015 [3] Copyright Clearance Center: Springer Nature. Global effects of land use on local terrestrial biodiversity.

Appendix B. NI-PDF Curve Setting

The points of correspondence used to build the NI-PDF curve were established as follow. According to the naturalness model’s conceptual framework [35], there is no specie loss (i.e., PDF = 0) in the natural class (NI = 1–0.8), and there is a very low probability of losses (i.e., PDF ≈ 0) in the near-natural class (NI = 0.6–0.8). The PDF has been set to 0.0000001 for NI = 0.7 and to 0.00001 for NI = 0.6 to consider a risk of marginal losses of sensitive species while allowing the detection of improvements in the near-natural class. The losses of very sensitive species begin in the semi-natural class (NI = 0.4–0.6), but PDF are still limited. In another territory located in a balsam fir forest, a naturalness index around 0.5 could be put in relation with decline of few sensitive species [40]. Unfortunately, these impacts have not yet been fully quantified, but they indicate that the PDF should be different from 0 when the PDF reaches that level. The PDF has been set to 0.001 for NI = 0.5 and alternatives values were tested thru sensitivity analysis. The correspondence values for NI ≥ 0.5 represents expert opinions proposed by the authors and have to be validated. For the near-natural class (NI 0.6–0.8), we introduced infinitesimal values for PDF to verify the possible effects of such introduction in the model, in the perspective of opening the reflection surrounding the consideration of effects on biodiversity when there are no species losses. However, the results for that portion on the protection gradient were not adjusted accordingly in the text (results rounded to the third digit), nor used in for interpretation. The results without the introduction of the infinitesimal section for the near-natural class are provided in the sensitivity analysis (curve f). To link PDF to NI, the age structure (area by age classes) resulting from the application of the 100% scenarios over the whole area without protection (excluded portion not considered) has been used to estimate the proportion of the area in each development stage of secondary forests used by Newbold et al., 2015 [3] (Table A4). The naturalness evaluation for the scenario involving CL only without protection (100CL100-0p) results in NI = 0.414 (see Supplementary Materials, results using the provisional curve with 0% protection), which can be roughly associated with the lower bound of the semi-natural class (NI = 0.4). Gradual application of clearcuts over the entire productive area will lead to secondary forests, spread over the various development stages depending on their age (young: 0–20 years, so 20% of the area subject to CL only; intermediate: 21–70 years, so 50% of the area in CL only; mature: 71–100 years, so 30% of the area in CL only). Using the species losses ((100 species richness data) ÷ 100) from Newbold et al., 2015 [3] for secondary forests lightly and intensively used (Table A4), weighted by the proportion in each development stage associated with their age, gives a mean of 0.038. Therefore, we associated the lower bound of the semi-natural class (NI = 0.4) with a PDF of 0.038. Losses of sensitive species are measurable in the altered class (NI = 0.2–0.4) and important losses of species can be associated with the very altered class (NI < 0.2). The naturalness evaluation for the scenario involving PL only of indigenous species without protection (100PL70-0p) gives a result of NI = 0.231 (see Supplementary Materials, results using the provisional curve with 0% protection), which can be roughly associated with the lower bound of the altered class. Therefore, we associated the lower bound of the altered class (NI = 0.2), to a PDF of 0.192 using the species richness data for plantation with minimal use from Newbold et al., 2015 [3], considering that plantations are of native species, not fertilized nor cleared with herbicides. The PDF at NI = 0.3 has been set to 0.1 to smooth the curve. Finally, tests of extremes hypothetical scenarios involving exotic species lead to a naturalness index lying in the very altered class [35]. We associated the middle of the very altered class (NI = 0.1), as no forestry use will ever create a biological desert, with the species richness data for intensively used plantation (PDF = 0.394). The last part of the curve (below NI = 0.2) has no effect in this study, since no scenario in the context of forestry modeled in this study is likely to lead to such degree of alteration. The levels used to estimate the end of the curve, for the altered and very altered levels, are consistent with the proportion of species associated with dead wood which are recognized to be sensitive to forest management. According to Klamerus-Iwan, et al., 2020 [71]: “It is now estimated that 20–40% of organisms in forested ecosystems depend, during some part of their life cycle, on wounded or decaying woody material from living, weakened, or dead trees”. Species richness data for forests plantations intensively used equals 60.6 [3] (corresponding to a loss of 39.4% of species), which is very close to the maximal loss of 40% associated with forestry [71]. In Finland, where intensive forestry using indigenous species is practiced, nearly 20% of all species are extinct, threated or near threated [28]. This value is also very close to the PDF of 0.192 used to estimate the curve at NI = 0.2. Alternative correspondence values are tested in the sensitivity analysis.

References

  1. Zabalza Bribián, I.; Valero Capilla, A.; Aranda Usón, A. Life cycle assessment of building materials: Comparative analysis of energy and environmental impacts and evaluation of the eco-efficiency improvement potential. Build. Environ. 2011, 46, 1133–1140. [Google Scholar] [CrossRef]
  2. Souza, D.M.; Teixeira, R.F.; Ostermann, O.P. Assessing biodiversity loss due to land use with Life Cycle Assessment: Are we there yet? Glob. Chang. Biol. 2015, 21, 32–47. [Google Scholar] [CrossRef] [Green Version]
  3. Newbold, T.; Hudson, L.N.; Hill, S.L.L.; Contu, S.; Lysenko, I.; Senior, R.A.; Borger, L.; Bennett, D.J.; Choimes, A.; Collen, B.; et al. Global effects of land use on local terrestrial biodiversity. Nature 2015, 520, 45–50. [Google Scholar] [CrossRef] [PubMed] [Green Version]
  4. Barrette, M.; Dumais, D.; Auger, I.; Boucher, Y.; Bouchard, M.; Bouliane, J. Naturalness assessment performed using forestry maps to validate forest management sustainability. Ecol. Indic. 2020, 119, 106832. [Google Scholar] [CrossRef]
  5. Turner, P.A.M.; Ximenes, F.A.; Penman, T.D.; Law, B.S.; Waters, C.M.; Grant, T.; Mo, M.; Brock, P.M. Accounting for biodiversity in life cycle impact assessments of forestry and agricultural systems—The BioImpact metric. Int. J. Life Cycle Assess. 2019, 24, 1985–2007. [Google Scholar] [CrossRef]
  6. Winter, L.; Lehmann, A.; Finogenova, N.; Finkbeiner, M. Including biodiversity in life cycle assessment—State of the art, gaps and research needs. Environ. Impact Assess. Rev. 2017, 67, 88–100. [Google Scholar] [CrossRef]
  7. Koellner, T.; de Baan, L.; Beck, T.; Brandao, M.; Civit, B.; Margni, M.; Canals, L.; Saad, R.; Souza, D.M.; Muller-Wenk, R. UNEP-SETAC guideline on global land use impact assessment on biodiversity and ecosystem services in LCA. Int. J. Life Cycle Assess. 2013, 18, 1188–1202. [Google Scholar] [CrossRef] [Green Version]
  8. Teixeira, R.F.M.; de Souza, D.M.; Curran, M.P.; Antón, A.; Michelsen, O.; Milà i Canals, L. Towards consensus on land use impacts on biodiversity in LCA: UNEP/SETAC Life Cycle Initiative preliminary recommendations based on expert contributions. J. Clean. Prod. 2016, 112, 4283–4287. [Google Scholar] [CrossRef]
  9. MEA. Ecosystems and Human Well-Being: Biodiversity Synthesis; World Resources Institute: Washington, DC, USA, 2005; p. 86. Available online: https://www.millenniumassessment.org/documents/document.354.aspx.pdf (accessed on 16 July 2018).
  10. Milà i Canals, L.; Bauer, C.; Depestele, J.; Dubreuil, A.; Freiermuth Knuchel, R.; Gaillard, G.; Michelsen, O.; Müller-Wenk, R.; Rydgren, B. Key Elements in a Framework for Land Use Impact Assessment Within LCA (11 pp). Int. J. Life Cycle Assess. 2007, 12, 5–15. [Google Scholar] [CrossRef] [Green Version]
  11. Verones, F.; Bare, J.; Bulle, C.; Frischknecht, R.; Hauschild, M.; Hellweg, S.; Henderson, A.; Jolliet, O.; Laurent, A.; Liao, X.; et al. LCIA framework and cross-cutting issues guidance within the UNEP-SETAC Life Cycle Initiative. J. Clean. Prod. 2017, 161, 957–967. [Google Scholar] [CrossRef] [PubMed] [Green Version]
  12. CBD. Convention on Biological Diversity. 2006. Available online: https://www.cbd.int/convention/articles/?a=cbd-02#:~:text=%22Biological%20diversity%22%20means%20the%20variability,between%20species%20and%20of%20ecosystems (accessed on 30 September 2020).
  13. Maier, S.D.; Lindner, J.P.; Francisco, J. Conceptual Framework for Biodiversity Assessments in Global Value Chains. Sustainability 2019, 11, 1841. [Google Scholar] [CrossRef] [Green Version]
  14. Brentrup, F.; Küsters, J.; Lammel, J.; Kuhlmann, H. Life Cycle Impact Assessment of Land Use Based on the Hemeroby Concept. Int. J. Life Cycle Assess. 2002, 7, 339–348. [Google Scholar] [CrossRef]
  15. Fehrenbach, H.; Grahl, B.; Giegrich, J.; Busch, M. Hemeroby as an impact category indicator for the integration of land use into life cycle (impact) assessment. Int. J. Life Cycle Assess. 2015, 20, 1511–1527. [Google Scholar] [CrossRef]
  16. Curran, M.; De Souza, D.M.; Anton, A.; Teixeira, R.F.M.; Michelsen, O.; Vidal-Legaz, B.; Sala, S.; Mil i Canals, L. How Well Does LCA Model Land Use Impacts on Biodiversity?-A Comparison with Approaches from Ecology and Conservation. Environ. Sci. Technol. 2016, 50, 2782–2795. [Google Scholar] [CrossRef] [PubMed]
  17. De Baan, L.; Alkemade, R.; Koellner, T. Land use impacts on biodiversity in LCA: A global approach. Int. J. Life Cycle Assess. 2013, 18, 1216–1230. [Google Scholar] [CrossRef]
  18. Chaudhary, A.; Burivalova, Z.; Koh, L.P.; Hellweg, S. Impact of Forest Management on Species Richness: Global Meta-Analysis and Economic Trade-Offs. Sci. Rep. 2016, 6, 23954. [Google Scholar] [CrossRef] [PubMed] [Green Version]
  19. Schryver, A.; Goedkoop, M.; Leuven, R.; Huijbregts, M. Uncertainties in the application of the species area relationship for characterisation factors of land occupation in life cycle assessment. Int. J. Life Cycle Assess. 2010, 15, 682–691. [Google Scholar] [CrossRef] [Green Version]
  20. De Baan, L.; Mutel, C.L.; Curran, M.; Hellweg, S.; Koellner, T. Land use in life cycle assessment: Global characterization factors based on regional and global potential species extinction. Environ. Sci. Technol. 2013, 47, 9281–9290. [Google Scholar] [CrossRef]
  21. Lindner, J.P.; Niblick, B.; Eberle, U.; Bos, U.; Schmincke, E.; Schwarz, S.; Luick, R.; Blumberg, M.; Urbanek, A. Proposal of a unified biodiversity impact assessment method. In Proceedings of the 9th International Conference on Life Cycle Assessment in the Agri-Food Sector (LCA Food 2014), San Francisco, CA, USA, 8–10 October 2014. [Google Scholar]
  22. Winter, L.; Pflugmacher, S.; Berger, M.; Finkbeiner, M. Biodiversity impact assessment (BIA+)—methodological framework for screening biodiversity. Integr. Environ. Assess. Manag. 2018, 14, 282–297. [Google Scholar] [CrossRef]
  23. Chaudhary, A.; Brooks, T.M. Land Use Intensity-specific Global Characterization Factors to Assess Product Biodiversity Footprints. Environ. Sci. Technol. 2018, 52, 5094–5104. [Google Scholar] [CrossRef]
  24. Gaudreault, C.; Loehle, C.; Prisley, S.; Solarik, K.; Verschuyl, J. Are the factors recommended by UNEP-SETAC for evaluating biodiversity in LCA achieving their promises: A case study of corrugated boxes produced in the US. Int. J. Life Cycle Assess. 2020, 25, 1013–1026. [Google Scholar] [CrossRef]
  25. Alkemade, R.; Oorschot, M.; Miles, L.; Nellemann, C.; Bakkenes, M.; ten Brink, B. GLOBIO3: A Framework to Investigate Options for Reducing Global Terrestrial Biodiversity Loss. Ecosystems 2009, 12, 374–390. [Google Scholar] [CrossRef] [Green Version]
  26. Newbold, T.; Hudson, L.N.; Arnell, A.P.; Contu, S.; De Palma, A.; Ferrier, S.; Hill, S.L.L.; Hoskins, A.J.; Lysenko, I.; Phillips, H.R.P.; et al. Has land use pushed terrestrial biodiversity beyond the planetary boundary? A global assessment. Science 2016, 353, 288. [Google Scholar] [CrossRef] [PubMed]
  27. Brooks, T.M.; Pimm, S.L.; Oyugi, J.O. Time Lag between Deforestation and Bird Extinction in Tropical Forest Fragments. Conserv. Biol. 1999, 13, 1140. [Google Scholar] [CrossRef]
  28. Hanski, I. Landscape fragmentation, biodiversity loss and the societal response. EMBO Rep. 2005, 6, 388–392. [Google Scholar] [CrossRef] [Green Version]
  29. Hunter, M.L. (Ed.) Maintaining Biodiversity in Forest Ecosystems; Cambridge University Press: Cambridge, UK, 1999; p. 698. [Google Scholar]
  30. Paillet, Y.; Bergès, L.; Hjältén, J.; Ódor, P.; Avon, C.; Bernhardt-Römermann, M.; Bijlsma, R.J.; Bruyn, L.D.; Fuhr, M.; Grandin, U.L.F.; et al. Biodiversity Differences between Managed and Unmanaged Forests: Meta-Analysis of Species Richness in Europe. Conserv. Biol. 2010, 24, 101–112. [Google Scholar] [CrossRef] [PubMed]
  31. Gray, C.L.; Hill, S.L.L.; Newbold, T.; Hudson, L.N.; Börger, L.; Contu, S.; Hoskins, A.J.; Ferrier, S.; Purvis, A.; Scharlemann, J.P.W. Local biodiversity is higher inside than outside terrestrial protected areas worldwide. Nat. Commun. 2016, 7, 12306. [Google Scholar] [CrossRef] [Green Version]
  32. Dudley, N.; Jonas, H.; Nelson, F.; Parrish, J.; Pyhälä, A.; Stolton, S.; Watson, J.E.M. The essential role of other effective area-based conservation measures in achieving big bold conservation targets. Glob. Ecol. Conserv. 2018, 15, e00424. [Google Scholar] [CrossRef]
  33. Costanza, A. Review of Land Use and Biodiversity Approaches in Life Cycle Assessments for Forest Management Applications; NCASI White Paper: Cary, NC, USA, 2020; p. 19. Available online: https://www.ncasi.org/wp-content/uploads/2020/05/Biodiversity-LCA-Review-5-2020.pdf (accessed on 26 November 2020).
  34. Michelsen, O.; McDevitt, J.E.; Coelho, C.R.V. A comparison of three methods to assess land use impacts on biodiversity in a case study of forestry plantations in New Zealand. Int. J. Life Cycle Assess. 2014, 19, 1214–1225. [Google Scholar] [CrossRef]
  35. Côté, S.; Bélanger, L.; Beauregard, R.; Thiffault, É.; Margni, M. A Conceptual Model for Forest Naturalness Assessment and Application in Quebec’s Boreal Forest. Forests 2019, 10, 325. [Google Scholar] [CrossRef] [Green Version]
  36. Michelsen, O. Assessment of land use impact on biodiversity. Int. J. Life Cycle Assess. 2008, 13, 22–31. [Google Scholar] [CrossRef]
  37. Farmery, A.K.; Jennings, S.; Gardner, C.; Watson, R.A.; Green, B.S. Naturalness as a basis for incorporating marine biodiversity into life cycle assessment of seafood. Int. J. Life Cycle Assess. 2017, 22, 1571–1587. [Google Scholar] [CrossRef]
  38. Rossi, V.; Lehesvirta, T.; Schenker, U.; Lundquist, L.; Koski, O.; Gueye, S.; Taylor, R.; Humbert, S. Capturing the potential biodiversity effects of forestry practices in life cycle assessment. Int. J. Life Cycle Assess. 2018, 23, 1192–1200. [Google Scholar] [CrossRef]
  39. Winter, S. Forest naturalness assessment as a component of biodiversity monitoring and conservation management. Forestry 2012, 85, 293–304. [Google Scholar] [CrossRef] [Green Version]
  40. Côté, S.; Bélanger, L.; Beauregard, R.; Thiffault, É.; Margni, M. Naturalness Assessment of Forest Management Scenarios in Abies balsamea–Betula papyrifera Forests. Forests 2020, 11, 601. [Google Scholar] [CrossRef]
  41. BFEC. Calculs Des Possibilités Forestières. Période 2013–2018. Available online: https://forestierenchef.gouv.qc.ca/documents/calcul-des-possibilites-forestieres/2013-2018/ (accessed on 20 July 2017).
  42. MFFP. Quebec’s Ecoforest Map with Disturbances. Available online: https://www.donneesquebec.ca/recherche/fr/dataset/carte-ecoforestiere-avec-perturbations (accessed on 13 August 2018).
  43. Dudley, N. Lignes Directrices Pour L’application Des Catégories De Gestion Aux Aires Protégées; UICN: Gland, Switzerland, 2008; p. 96. Available online: https://portals.iucn.org/library/efiles/documents/paps-016-fr.pdf (accessed on 9 December 2020).
  44. Harvey, B.; Brais, S. Effects of mechanized careful logging on natural regeneration and vegetation competition in the southeastern Canadian boreal forest. Can. J. For. Res. 2002, 32, 653–666. [Google Scholar] [CrossRef]
  45. Brooks, T.M.; Mittermeier, R.A.; da Fonseca, G.A.B.; Gerlach, J.; Hoffmann, M.; Lamoreux, J.F.; Mittermeier, C.G.; Pilgrim, J.D.; Rodrigues, A.S.L. Global Biodiversity Conservation Priorities. Science 2006, 313, 58–61. [Google Scholar] [CrossRef] [Green Version]
  46. Hudson, L.N.; Newbold, T.; Contu, S.; Hill, S.L.L.; Lysenko, I.; De Palma, A.; Phillips, H.R.P.; Alhusseini, T.I.; Bedford, F.E.; Bennett, D.J.; et al. The database of the PREDICTS (Projecting Responses of Ecological Diversity in Changing Terrestrial Systems) project. Ecol. Evol. 2017, 7, 145–188. [Google Scholar] [CrossRef] [Green Version]
  47. Whitehead, A.L.; Kujala, H.; Wintle, B.A. Dealing with Cumulative Biodiversity Impacts in Strategic Environmental Assessment: A New Frontier for Conservation Planning. Conserv. Lett. 2017, 10, 195–204. [Google Scholar] [CrossRef]
  48. Chaudhary, A.; Verones, F.; de Baan, L.; Hellweg, S. Quantifying Land Use Impacts on Biodiversity: Combining Species-Area Models and Vulnerability Indicators. Environ. Sci. Technol. 2015, 49, 9987–9995. [Google Scholar] [CrossRef] [PubMed]
  49. Lindqvist, M.; Palme, U.; Lindner, J.P. A comparison of two different biodiversity assessment methods in LCA—A case study of Swedish spruce forest. Int. J. Life Cycle Assess. 2016, 21, 190–201. [Google Scholar] [CrossRef]
  50. Groffman, P.M.; Baron, J.S.; Blett, T.; Gold, A.J.; Goodman, I.; Gunderson, L.H.; Levinson, B.M.; Palmer, M.A.; Paerl, H.W.; Peterson, G.D.; et al. Ecological Thresholds: The Key to Successful Environmental Management or an Important Concept with No Practical Application? Ecosystems 2006, 9, 1–13. [Google Scholar] [CrossRef]
  51. Scheffer, M.; Carpenter, S.R. Catastrophic regime shifts in ecosystems: Linking theory to observation. Trends Ecol. Evol. 2003, 18, 648–656. [Google Scholar] [CrossRef]
  52. Evans, P.; Newton, A.; Cantarello, E.; Martin, P.; Sanderson, N.; Jones, D.; Barsoum, N.; Cottrell, J.; A’Hara, S.; Fuller, L. Thresholds of biodiversity and ecosystem function in a forest ecosystem undergoing dieback. Sci. Rep. 2017, 7, 1–9. [Google Scholar] [CrossRef]
  53. Tear, T.H.; Kareiva, P.; Angermeier, P.L.; Comer, P.; Czech, B.; Kautz, R.; Landon, L.; Mehlman, D.; Murphy, K.; Ruckelshaus, M.; et al. How Much Is Enough? The Recurrent Problem of Setting Measurable Objectives in Conservation. BioScience 2005, 55, 835–849. [Google Scholar] [CrossRef] [Green Version]
  54. Wilhere, G.F. The How-Much-Is-Enough Myth. Conserv. Biol. 2008, 22, 514–517. [Google Scholar] [CrossRef]
  55. Seymour, R.; Hunter, M. New Forestry in Eastern Spruce-Fir Forests: Principles and Applications to Maine; College of Forest Resources, University of Maine: Orono, ME, USA, 1992. [Google Scholar]
  56. Messier, C.; Tittler, R.; Kneeshaw, D.D.; Gelinas, N.; Paquette, A.; Berninger, K.; Rheault, H.; Meek, P.; Beaulieu, N. TRIAD zoning in Quebec: Experiences and results after 5 years. For. Chron. 2009, 85, 885–896. [Google Scholar] [CrossRef] [Green Version]
  57. Leverington, F.; Costa, K.L.; Pavese, H.; Lisle, A.; Hockings, M. A global analysis of protected area management effectiveness. Environ. Manag. 2010, 46, 685–698. [Google Scholar] [CrossRef]
  58. Carnus, J.-M.; Parrotta, J.; Brockerhoff, E.; Arbez, M.; Jactel, H.; Kremer, A.; Lamb, D.; O’Hara, K.; Walters, B. Planted Forests and Biodiversity. J. For. 2006, 104, 65–77. [Google Scholar] [CrossRef]
  59. Ward, C.; Erdle, T. Evaluation of forest management strategies based on Triad zoning. For. Chron. 2015, 91, 40–51. [Google Scholar] [CrossRef]
  60. Hartmann, H.; Daoust, G.; Bigué, B. Negative or positive effects of plantation and intensive forestry on biodiversity: A matter of scale and perspective. For. Chron. 2010, 86, 354–364. [Google Scholar] [CrossRef] [Green Version]
  61. MFFP. Données Cartographiques. Available online: https://www.donneesquebec.ca/recherche/fr/dataset?q=perturbations&organization=mffp&sort=metadata_created+desc (accessed on 9 August 2017).
  62. Escobar, M.N.A.H.; Uribe, S.V.; Chiappe, R.; Estades, C.N.F.; Russo, D. Effect of Clearcutting Operations on the Survival Rate of a Small Mammal. PLoS ONE 2015, 10, e0118883. [Google Scholar] [CrossRef]
  63. Keenan, R.J.; Kimmins, J.P. The ecological effects of clear-cutting. Environ. Rev. 1993, 1, 121–144. [Google Scholar] [CrossRef]
  64. Ross-Davis, A.-L.; Frego, K.A. Comparison of plantations and naturally regenerated clearcuts in the Acadian Forest: Forest floor bryophyte community and habitat features. Can. J. Bot. 2002, 80, 21–33. [Google Scholar] [CrossRef]
  65. Oliver, C.D.; Larson, B.C. Forest Stand Dynamics; John Wiley & Sons, Inc.: La Vergne, TN, USA, 1996; p. 520. [Google Scholar]
  66. Hayes, J.P.; Schoenholtz, S.H.; Hartly, M.J.; Murply, G.; Powers, R.F.; Berg, D.; Radosevich, S.R. Environmental Consequences of Intensively Managed Forest Plantations in the Pacific Northwest. J. For. 2005, 103, 85. [Google Scholar]
  67. Stephens, S.S.; Wagner, M.R. Forest Plantations and Biodiversity: A Fresh Perspective. J. For. 2007, 105, 307–313. [Google Scholar] [CrossRef]
  68. Paquette, A.; Messier, C. The role of plantations in managing the world’s forests in the Anthropocene. Front. Ecol. Environ. 2010, 8, 27–34. [Google Scholar] [CrossRef] [Green Version]
  69. Pothier, D.; Savard, F. Actualisation Des Tables De Production Pour Les Principales Espèces Forestières Du Québec; Ministère des Ressources Naturelles, Forêt Québec: Québec, QC, Canada, 1998; p. 183.
  70. Prégent, G.; Végiard, S. Rendement Anticipé Des Plantations D’épnette Noire Dans Les Domaines Écologiques de la Pessière Moire. Available online: https://mffp.gouv.qc.ca/documents/forets/connaissances/recherche/Note109.pdf (accessed on 16 March 2021).
  71. Klamerus-Iwan, A.; Lasota, J.; Błońska, E. Interspecific Variability of Water Storage Capacity and Absorbability of Deadwood. Forests 2020, 11, 575. [Google Scholar] [CrossRef]
Figure 1. Typology of the territory: silvicultural components of the scenario are applied over the productive area and protection corresponds to the portion of forest area not excluded, nor used for wood production. Specified areas are those from the test area: FMU no. 2663, 2665 and 2666 [41,42]. Scenario coding: 60CL100-40PL70-54.7p: 60% of the productive area in careful logging with a rotation of 100 years, with 40% of the productive area in plantation on a rotation of 70 years, combined with 54.7% of the forest area in strict protection © Sylvie Côté, Laval University, 2021.
Sustainability 13 08859 g001
Figure 2. Provisional curve relating potential disappeared fraction of species (PDF) as a function of the naturalness index (NI). Lower and upper PDF corresponds to available confidence intervals limits [3] © Sylvie Côté, Laval University, 2021.
Sustainability 13 08859 g002
Figure 3. Naturalness index (NI) and potential disappeared fraction of species (PDF) as a function of the proportion of forest area in protection. CL: careful logging; PL: plantation.
Sustainability 13 08859 g003
Figure 4. Impact score (IS) as a function of potential disappeared fraction of species (PDF), terrestrial area annually required to product 1 m3 of wood (TAR) and the proportion of the forest area in protection.
Sustainability 13 08859 g004
Figure 5. Sensitivity analysis results: impact score (IS) based on the alternative NI-PDF curves. (a) Provisional curve; (b) test of a higher PDF for the altered class; (c) test of a higher PDF for the mid semi-natural class; (d) test of a higher PDF for the semi-natural class; (e) test of a higher PDF for the semi-natural and altered classes; (f) test of no species losses (PDF = 0) for the near-natural class.
Sustainability 13 08859 g005
Figure 6. Sensitivity analysis of the impact score considering a varying yield of (a) −20% for the plantation (PL) yield; (b) +20% for the plantation yield; (c) −20% for the careful logging (CL) yield; (d) +20% for the careful logging yield.
Sustainability 13 08859 g006
Table 1. Partial naturalness index equations for each naturalness characteristic (characteristic_PNI) and naturalness index equation (source: © Côté et al. 2019 [35]).
Naturalness CharacteristicCharacteristic_PNI Equation
Landscape contextContext_PNI = CF_pni × (1-(ant_NDP+Wm_NDP+W_CC_NDP))
Forest CompositionCompo_PNI = ((CT_pni+LS_pni)/2) × (1-(exo_NDP+CS_NDP))
StructureStruc_PNI = ((OF_pni+IR_pni)/2) × (1-HS_NDP)
Dead woodDW_PNI = 1-DW_NDP
Regeneration processRP_PNI = 1-RP_NDP
Naturalness index equationNI = 1/5 × (Context_PNI + Compo_PNI + Struc_PNI + DW_PNI + RP_PNI)
PNI: partial naturalness index for each characteristic; pni: partial naturalness index for condition indicators; NDP: naturalness degradation potential; CF: closed forests; ant: anthropization; Wm: modified wetlands; W_CC: humid area in clearcut; CT: cover type; LS: late successional species; exo: exotic species; CS: companion species; OF: old forests; IR: irregular stands; HS: horizontal structure; DW: dead wood; RP: regeneration process; NI: naturalness index.
Table 2. Naturalness assessment results for different management scenarios for two forest management strategies.
Management StrategyFixed Productive Areawith Varying Wood ProductionFixed Wood Productionwith Varying Productive Area
Management scenarioCL only (100CL100-17.9p)Current Mix (60CL100-40-PL70-17.9p)PL only (100PL70-17.9p)CL only(100CL100-17.9p)Current Mix (60CL100-40-PL70-54.7p)PL only (100PL70-71.7p)
Annual Harvest (m3/yr)502,100952,8701,629,025502,100502,100502,100
Productive area (ha)651,610651,610651,610651,610343,356200,840
Context_PNI0.6690.5720.4260.6690.6510.764
Compo_PNI0.4090.4630.4930.4090.6770.755
Struc_PNI0.0890.0640.0270.0890.4790.654
DW_PNI0.4940.4010.2610.4940.6840.772
RP_PNI0.6890.5330.3000.6890.7540.784
NI0.4700.4070.3010.4700.6490.746
Estimated PDF0.0120.0350.0990.0120.0000.000
PNI: partial naturalness index for naturalness characteristics; Context: landscape context; Compo: forest composition; Struc: forest structure; DW: dead wood; RP: regeneration process; NI: naturalness index; PDF: potential disappeared fraction of species.
Table 3. Life cycle assessment results and related data for each scenario of the two evaluated forest management strategies.
Management StrategyFixed Productive Areawith Varying Wood Production Fixed Wood Production with Varying Productive Area
Management ScenarioCL Only(100CL100-17.9p)Current Mix (60CL100-40-PL70-17.9p)PL Only (100PL70-17.9p)CL Only (100CL100-17.9p)Current Mix (60CL100-40-PL70-54.7p)PL Only (100PL70-71.7p)
Mean productivity (m3/ha_prod x yr)0.771.4622.50.771.4622.5
Terrestrial area (ha_ter)1,072,2941,072,2941,072,2941,072,2941,072,2941,072,294
Productive area (ha_prod)651,610651,610651,610651,610343,356200,840
Excluded area (ha_for)36,35636,35636,35636,35636,35636,356
Protected area (ha_for) 149,856 149,856 149,856 149,856 458,111 600,626
Percentage protected (% ha_for)17.9%17.9%17.9%17.9%54.7%71.7%
Annual harvest (m3)502,100952,8701,629,025502,100502,100502,100
TAR (ha_ter × yr/m3)2.1361.1250.6582.1362.1362.136
Potential disappeared fraction of species (PDF)0.0120.0350.0990.0120.0000.000
Impact score (PDF × (ha_ter × yr)/m3))0.0260.0400.0650.0260.0000.000
TAR: terrestrial area annually required to produce 1 m3 of wood; PDF: potential disappeared fraction of species; Ha: hectares; ha_prod: productive area in hectares; ha_ter: terrestrial area in hectares; ha_for: forest area in hectares; yr: year; m3: cubic meter of wood. Scenario coding: 60CL100-40PL70: Current Mix: 60% of the productive area in careful logging with a rotation of 100 years, with 40% of the productive area in plantation on a rotation of 70 years; 100CL100: CL only: 100% of the productive area in careful logging with a rotation of 100 years; 100PL70: PL only: 100% of the productive area in plantation with a rotation of 70 years.
Table 4. Scenario ranking results for each LCA parameter using the provisory NI-PDF curve.
Strategy/ParameterPDF TAR ((ha_ter × yr)/m3)IS (PDF × (ha_ter × yr)/m3)
Fixed productive areawith varying wood productionPL > CM > CLCL > CM > PLPL > CM > CL
Fixed wood productionwith varying productive areaCL > CM = PL CL = CM = PLCL > CM = CL
Protection gradientPL > CM > CLCL > CM > PLPL > CM > CL
NI: naturalness index; PDF: potentially disappeared fraction of species; TAR: terrestrial area annually required for the production of 1 m3 of wood; IS: impact score; PL: PLonly; CM: Current Mix; CL: CL only.
Publisher’s Note: MDPI stays neutral with regard to jurisdictional claims in published maps and institutional affiliations.

