Article

Intercomparison of Indoor and Outdoor Pollen Concentrations in Rural and Suburban Research Workplaces

by
Armando Pelliccioni
1,
Virginia Ciardini
2,
Andrea Lancia
1,3,
Simona Di Renzi
1,
Maria Antonia Brighetti
4,
Alessandro Travaglini
4,
Pasquale Capone
1 and
Maria Concetta D’Ovidio
1,*
1
Department of Occupational and Environmental Medicine, Epidemiology and Hygiene, Italian Workers’ Compensation Authority (INAIL), Monte Porzio Catone, 00078 Rome, Italy
2
Laboratory of Observations and Measures for the Environment and Climate, Italian National Agency for New Technologies, Energy and Sustainable Economic Development (ENEA), 00123 Rome, Italy
3
Department of Environmental Biology, Sapienza University of Rome, 00185 Rome, Italy
4
Department of Biology, Tor Vergata University, 00173 Rome, Italy
*
Author to whom correspondence should be addressed.
Sustainability 2021, 13(16), 8776; https://doi.org/10.3390/su13168776
Submission received: 25 June 2021 / Revised: 28 July 2021 / Accepted: 3 August 2021 / Published: 5 August 2021

Abstract

:
Pollen exposure in occupational settings involves different categories of workers. In this paper the effects of diurnal pollen variations have been evaluated in two sites characterized by different vegetation and urbanization: the suburban site of Tor Vergata (TV) and the rural site of Monte Porzio Catone (MPC). Aerobiological and meteorological monitoring was performed in the two sites during the winter of 2017. The data analysis focuses on the comparison between pollen concentrations observed in relation to meteorological variables. In general, it can be stated that the indoor and outdoor dynamics for MPC and TV are different, with the outdoor concentration of pollen for MPC always higher than for TV, in accordance with significant presence of vegetation. The high nocturnal peaks detected in MPC and completely absent in TV could be caused by the presence of particular conditions of stagnation combined with greater emissions from the pollen sources. Furthermore the higher I/O ratio observed during the working hours in TV compared to MPC could be ascribed to the workers’ behavior. Exposure to pollen can be responsible for several health effects and the knowledge of its level can be useful to improve the evaluation and management of this biological risk.

1. Introduction

Pollen is one of the main components of bioaerosol. As the microgametophyte of spermatophytes, its role in the life cycle of seed plants (both wild and cultivated) is crucial, and its presence in the air is ubiquitous. From a biological, ecological and agricultural point of view, pollen is indispensable. However, from a human health perspective, pollen can be seen as an aerobiological pollutant mainly responsible for respiratory and allergic diseases [1,2,3,4,5,6] and has been recently associated with different health effects. Lung function, seasonality of flu-like illnesses, SARS-CoV-2 infection rates, and occurrence of several cancers have been put related to airborne pollen variations [7,8,9,10,11].
Environmental exposure is a critical aspect and several studies evidenced that different outdoor, indoor, rural, and urban environments may contribute to determine or exacerbate the health effects [12,13,14]. In this regard a key role should be attributed to occupational settings that may increase pre-existing sensitization and/or respiratory pathologies due to other biological, chemical and physical agents mainly present in workplaces. With respect to other agents, biological agents have the peculiarity that exposure may occur both in domestic [15,16] and work environments [17,18].
Aerobiological particles responsible for occupational allergic diseases (e.g., asthma and rhinitis) show a variation in their allergenicity, concentrations, dispersal and transport, in relation to several factors such as meteorological conditions and in particular air temperature, relative humidity, rainfall, wind speed, climate change and other factors including atmospheric pollutants, characteristics of the vegetation site, seasonality, and buildings and their occupants [19,20,21,22,23,24,25,26,27].
Many epidemiological and research studies in the literature have focused on potential interactions between chemical pollutants (e.g., ozone, carbon monoxide, nitrogen dioxide, sulfur dioxide), particulate matter including PM10, PM2,5 and airborne particles, showing the relevant effects of air pollutants on bioaerosol properties [13,14,28,29,30,31].
In this regard, important alterations have been reported in the biological and reproduction functions of pollen (e.g., decrease in pollen germination and survival) and modifications of pollen surface characteristics, and in addition pollutants seem to act as adjuvants to pollen allergens enhancing their potential health risks [13,14,28,29,30]. Prominent studies have shown that air pollutants might adhere on pollen surface damaging pollen cell membranes, with a significant number of allergens released into the environment [14,32,33]. Furthermore, some researchers use the neologism “polluen” to indicate a specific atmospheric material made up of allergens and pollutants, gases, and particulates of many sizes and shapes carried on pollen or fungal spores that act as carriers of allergens, facilitating their diffusion [28,29].
In addition to air pollutants and meteorological factors, several papers have evidenced the effect of urbanization on plant reproduction (e.g., earlier pollen flowering), pollen abundance (e.g., overexpression of allergenic proteins), pollen dispersion, people’s exposure to allergens, and severity of allergic diseases/symptoms. Furthermore, associations between urbanization and the rising prevalence of allergic epidemics in urban areas compared to those in rural environments have been studied [13,14,34,35]. However, the pollen count pattern in urban and rural areas is also linked to many critical aspects such as size of vegetation areas, distance to pollen source in relation to pollen transport and dispersal, and presence of ornamental vegetation. In this respect, ornamental trees used in urban environments in relation to the concept of green spaces and urban greening to reduce pollution levels could on the contrary produce other sources of allergenic pollen types (Oleaceae, Platanus, Poaceae, Cupressaceae, Betulaceae) as well as natural vegetation, and cause adverse effects on people’s health such as pollinosis. The knowledge of pollen distribution can be helpful in reducing pollen risk exposure in order to increase quality of life in urban environments [36,37,38].
Different trends of pollen linked to year [39,40], seasonality [41,42,43], daily [44,45,46], intradiurnal [40,47,48,49,50,51,52] or hourly variations have been reported [27,53,54], and have to be taken into account for the further distinction between urban or non-urban environments [25,26,52,55,56,57,58]. In this regard, urban and non-urban components around occupational settings add complexity. and the evaluation of environmental exposure in assessing health effects should consider the peculiarity of exposure to sources.
Occupational environments can be responsible for allergies in terms of developing and/or exacerbation in the context of public health due to their high prevalence and their economic costs, concerning workdays lost and decreases in productivity [59,60].
Pollen is a critical source of exposure in living and work environments, indoor and outdoor, urban and non-urban occupational settings, involving numerous categories of workers, e.g., farmers, gardeners, foresters, office workers [15,16,17,18,19,61,62,63,64,65].
Many papers have shown that indoor workplaces are also directly influenced by the outdoor environment. Pollen grains and, as a rule, air pollutants, can enter a building by infiltration, through open windows and doors and unfiltered ventilation systems, and can be transported on the feet and bodies of occupants [19,66,67,68].
The aim of the study is to evaluate the effects of diurnal pollen variation in two occupational settings with different vegetation and urbanization characteristics in relation to meteorological variables, working days (WDs), non-working days (NWDs), working hours (WHs), and non-working hours (WHs), considering the indoor and outdoor ratios.

2. Materials and Methods

2.1. Study Sites and Vegetation

The study was conducted inside and outside the Research Centre building of the National Workers’ Compensation Authority (INAIL) in Monte Porzio Catone (MPC) as a rural area, and inside and outside the University of Tor Vergata (TV) in Rome as a suburban area. Monte Porzio Catone is a hilly area located in southeast Rome, in the Castelli Romani regional park at ~300 m a.s.l. (41°49′19.5″ N, 12°42′24.1″ E); Tor Vergata is located in a south-easterly neighborhood of Rome at about 80 m a.s.l. (41°51′13.5″ N, 12°36′14.2″ E); the two sites are located in the Mediterranean biogeographical region. The climate of Rome is broadly sub-Mediterranean, with mild winters and hot summers (three/four months of aridity). The average annual temperature is 15 °C and average annual rainfall is 839 mm [69,70]. The vegetation is complex and varied, characterized by flora of high biodiversity and many taxa of high conservation value. The dominant types are sub-Mediterranean deciduous and evergreen mixed forests with prevalence of oak woods with Quercus cerris, Q. frainetto, Quercus ilex, Q. robur, Q. dalechampii and Q. pubescens, other common woody species such as A. monspessulanum, Acer campestre, Fraxinus ornus, Corylus avellana, Crataegus monogyna, Viburnum tinus, Pistacia lentiscus and trees belonging to the Robinia, Ulmus, and Ailanthus genera [69,70,71]. In the rural area (MPC) cultivates areas are most common including species such as Olea europaea, Vitis vinifera, Corylus avellana and chestnut woods (Castanea sativa Miller) fields, continuous prairies, hedges, many forests with oak trees, coniferous trees, vineyards, olive groves, and vegetable gardens. The area is surrounded by Cupressaceae, Pinaceae and Oleaceae. Herbaceous plants such as Urticaceae, Plantaginaceae and Poaceae are also present (http://websit.cittametropolitanaroma.it/DescriviMappa.aspx?i=7 accessed on 12 January 2021). The greenery of the suburban area (TV) is composed of pastures, abandoned fields, uncultivated land, urbanized and degraded areas, artificial surfaces, numerous native species due to human impact that are well adapted to human presence, and non-native species of uncertain origin [71].
Data regarding the vegetation maps around the sampling area were retrieved from the website http://websit.cittametropolitanaroma.it/DescriviMappa.aspx?i=7 (accessed on 12 January 2021) while data on buildings were obtained from https://dati.lazio.it/it (accessed on 22 April 2021). The retrieved data were processed using QGIS 3.16.1, obtaining measures of the areas covered by vegetation, artificial surfaces and buildings. The area measures were used to calculate the plan-area density (λp) of buildings and the Vegetation Index (Vi). The λp indicator (i.e., the fraction of area), defined as the ratio between the built area and the total area, is used to identify the presence of buildings whereas, regarding the green areas, the Vegetation index (Vi), defined as the ratio between the overall vegetated area and the total area, is considered.

2.2. Aerobiological Monitoring

Aerobiological monitoring was performed during winter 2017 (from 2 to 21 February 2017), collecting aerobiological particles in accordance with the UNI 11108/2004 and following UNI CEN/TS 16868:2015, using 7-day volumetric samplers, Lanzoni VPPS 2000 (Bologna, Italy), Hirst-type [72]. In the rural area (MPC) one sampler was placed outside the Research Center of INAIL, Monte Porzio Catone, at 1.10 m above ground level, another one inside the building at 0.6 m above ground level.
In the suburban area (TV) one sampler was located on the roof of the Biology Department building of the University Tor Vergata, Rome, at about 12 m above the ground level, and another one inside a room of the same building at 1 m above ground level.
The sampler consists of different components: a single-stage impactor of particles, a suction pump, an intake orifice, a rotating drum, and a directional wing. The air is captured by a vacuum pump to assure a constant flow of 10 L/min corresponding to the human mean breath rate, through an orifice of known dimension (2 × 14 mm) oriented continually against the wind due to a directional wing and positioned at a height of at least 1 m. The air flow is directed onto a surface consisting of a transparent plastic Melinex® tape properly equipped, coated with a 2% silicon solution as trapping surface. The trapping surface moves at a speed of 2 mm/h on a cylindrical rotating drum that makes a complete round in a week [19,73,74].
At the end of the exposure the sampling surface (sticky tape) is cut into segments of 48 mm representing daily samplings and prepared to be mounted on microscope slides. The tape is treated with glycerin jelly in order to adhere perfectly to the slides and stained with basic fuchsine solution which colors only pollen grains. Lastly the slides are observed via a light microscope with a magnification of 400×.
According to the Italian standard methodology the minimum number of horizontal sweeps must correspond to an area close to 20% of the impacted surface and the sweeps spaced 2 mm from each other, as well as from the edge of the sampling surface [73]. The pollen counts are expressed as number of particles/m3 of air [19,73,75], pollen concentrations are provided with a 30-min time resolution and, in the analysis, 2-h and 6-h averages are calculated and considered.

2.3. Meteorological Monitoring

Meteorological data were provided by the University of Rome “Tor Vergata” and collected simultaneously with the aerobiological measurements, during winter 2017 (from 2 to 21 February 2017), by a meteorological station located on the roof of the Experimental Ecology and Aquaculture Laboratory (LESA), 2.18 Km from the TV pollen trap. The monitoring was performed using a CAE SPM 20 station (Bologna, Italy) connected to sensors for air temperature, humidity, wind speed and direction (at 10 m above ground level) and rain (at 2 m above ground level). Data for air temperature (°C), relative humidity (%), wind speed and direction (m/s and deg), precipitation (mm) and solar radiation (W/m2) were recorded with a 30-min time resolution and, regarding the pollen analysis, the 2-and 6-h averages were subsequently considered. Preliminarily, the daily evolution of the main meteorological variables, also in relation to the vegetation maps, allow better characterization of the possible pollen transport/dilution conditions during the study period. The arithmetical means and the standard deviations of the meteorological variables over the entire period were calculated to complete the site description. Daily evolution of the meteorological variables is also presented and scatter plot between wind speed and direction highlights the main sectors of provenience related to the intensity of wind. It must be kept in mind that, for the MPC site, meteorological measurements are not available but, considering the short distance (7.12 km) and the objectives of the analysis presented in this study, we can consider the meteorological condition as homogeneous between the two sites.

2.4. Data Analysis

Data analysis focuses on the comparison between pollen concentrations observed in two sites, relatively close to each other but characterized by profoundly different land use (see Section 2.1); the analysis aims also to highlight the differences that can occur during the working days (WDs) and the non-working days (NWDs), working hours (WHs) and the non-working hours (NWHs), in each monitoring site in order to observe possible and different behavior patterns in relation to specific conditions, regarding also the exposure of workers [19].
In brief, three topics are the main components of the data analysis and the results will be presented as follows:
  • outdoor and indoor pollen characterization in WDs and NWDs, WHs and NWHs in the two sites;
  • the peak analysis, where the maximum of the outdoor pollen concentration for each day of measure is selected and related to the meteorological conditions;
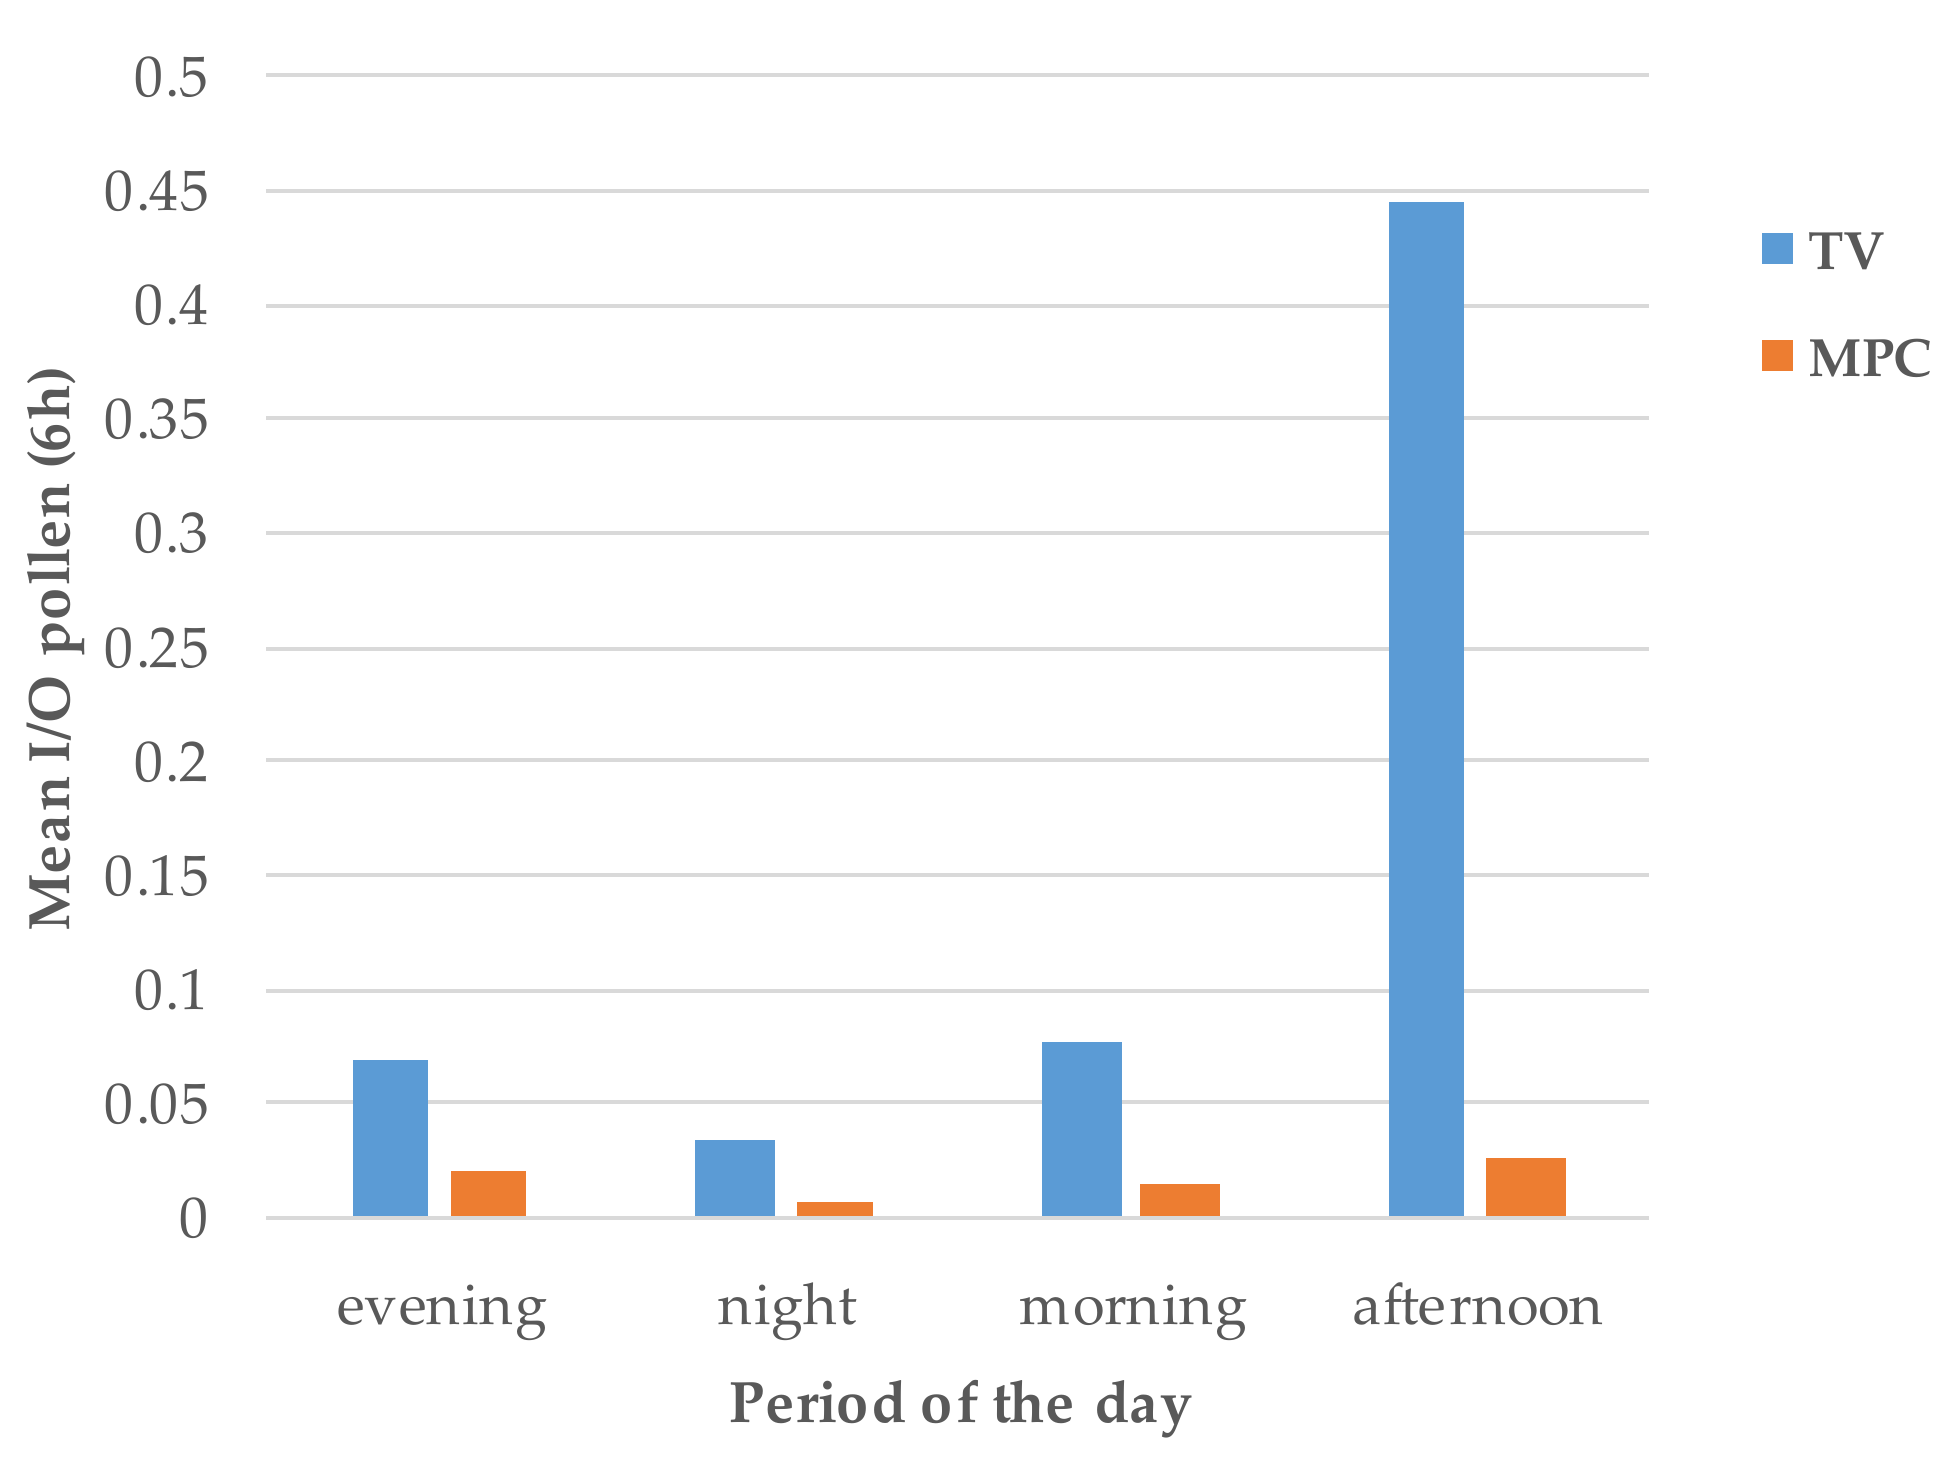
  • finally, the indoor and outdoor Ratios (I/O) are calculated and compared for the two sites.
As well as described above for the meteorological data, pollen concentrations are provided with a 30-min time resolution and, in the analysis, 2-h and 6-h averages are calculated and considered.
Pollen data were extrapolated onto spreadsheets as previously reported [19,76].

3. Results and Discussion

3.1. Average Pollen Values for TV and MPC

Starting from the observations collected every 30-min, average values for indoor and outdoor pollen concentrations were calculated for the considered study period. Mean values for the two sites and their standard deviations are reported in Table 1.
As shown in Table 1, the two sites exhibit different pollen concentrations; regarding the outdoor component, MPC is characterized by higher values of about 46% more compared to TV.
The observed values of the outdoor pollen concentration compared to the indoor are higher in both sites (about 59 times for MPC and 22 times for TV).
In general, it can be stated that the indoor and outdoor dynamics for MPC and TV are different.

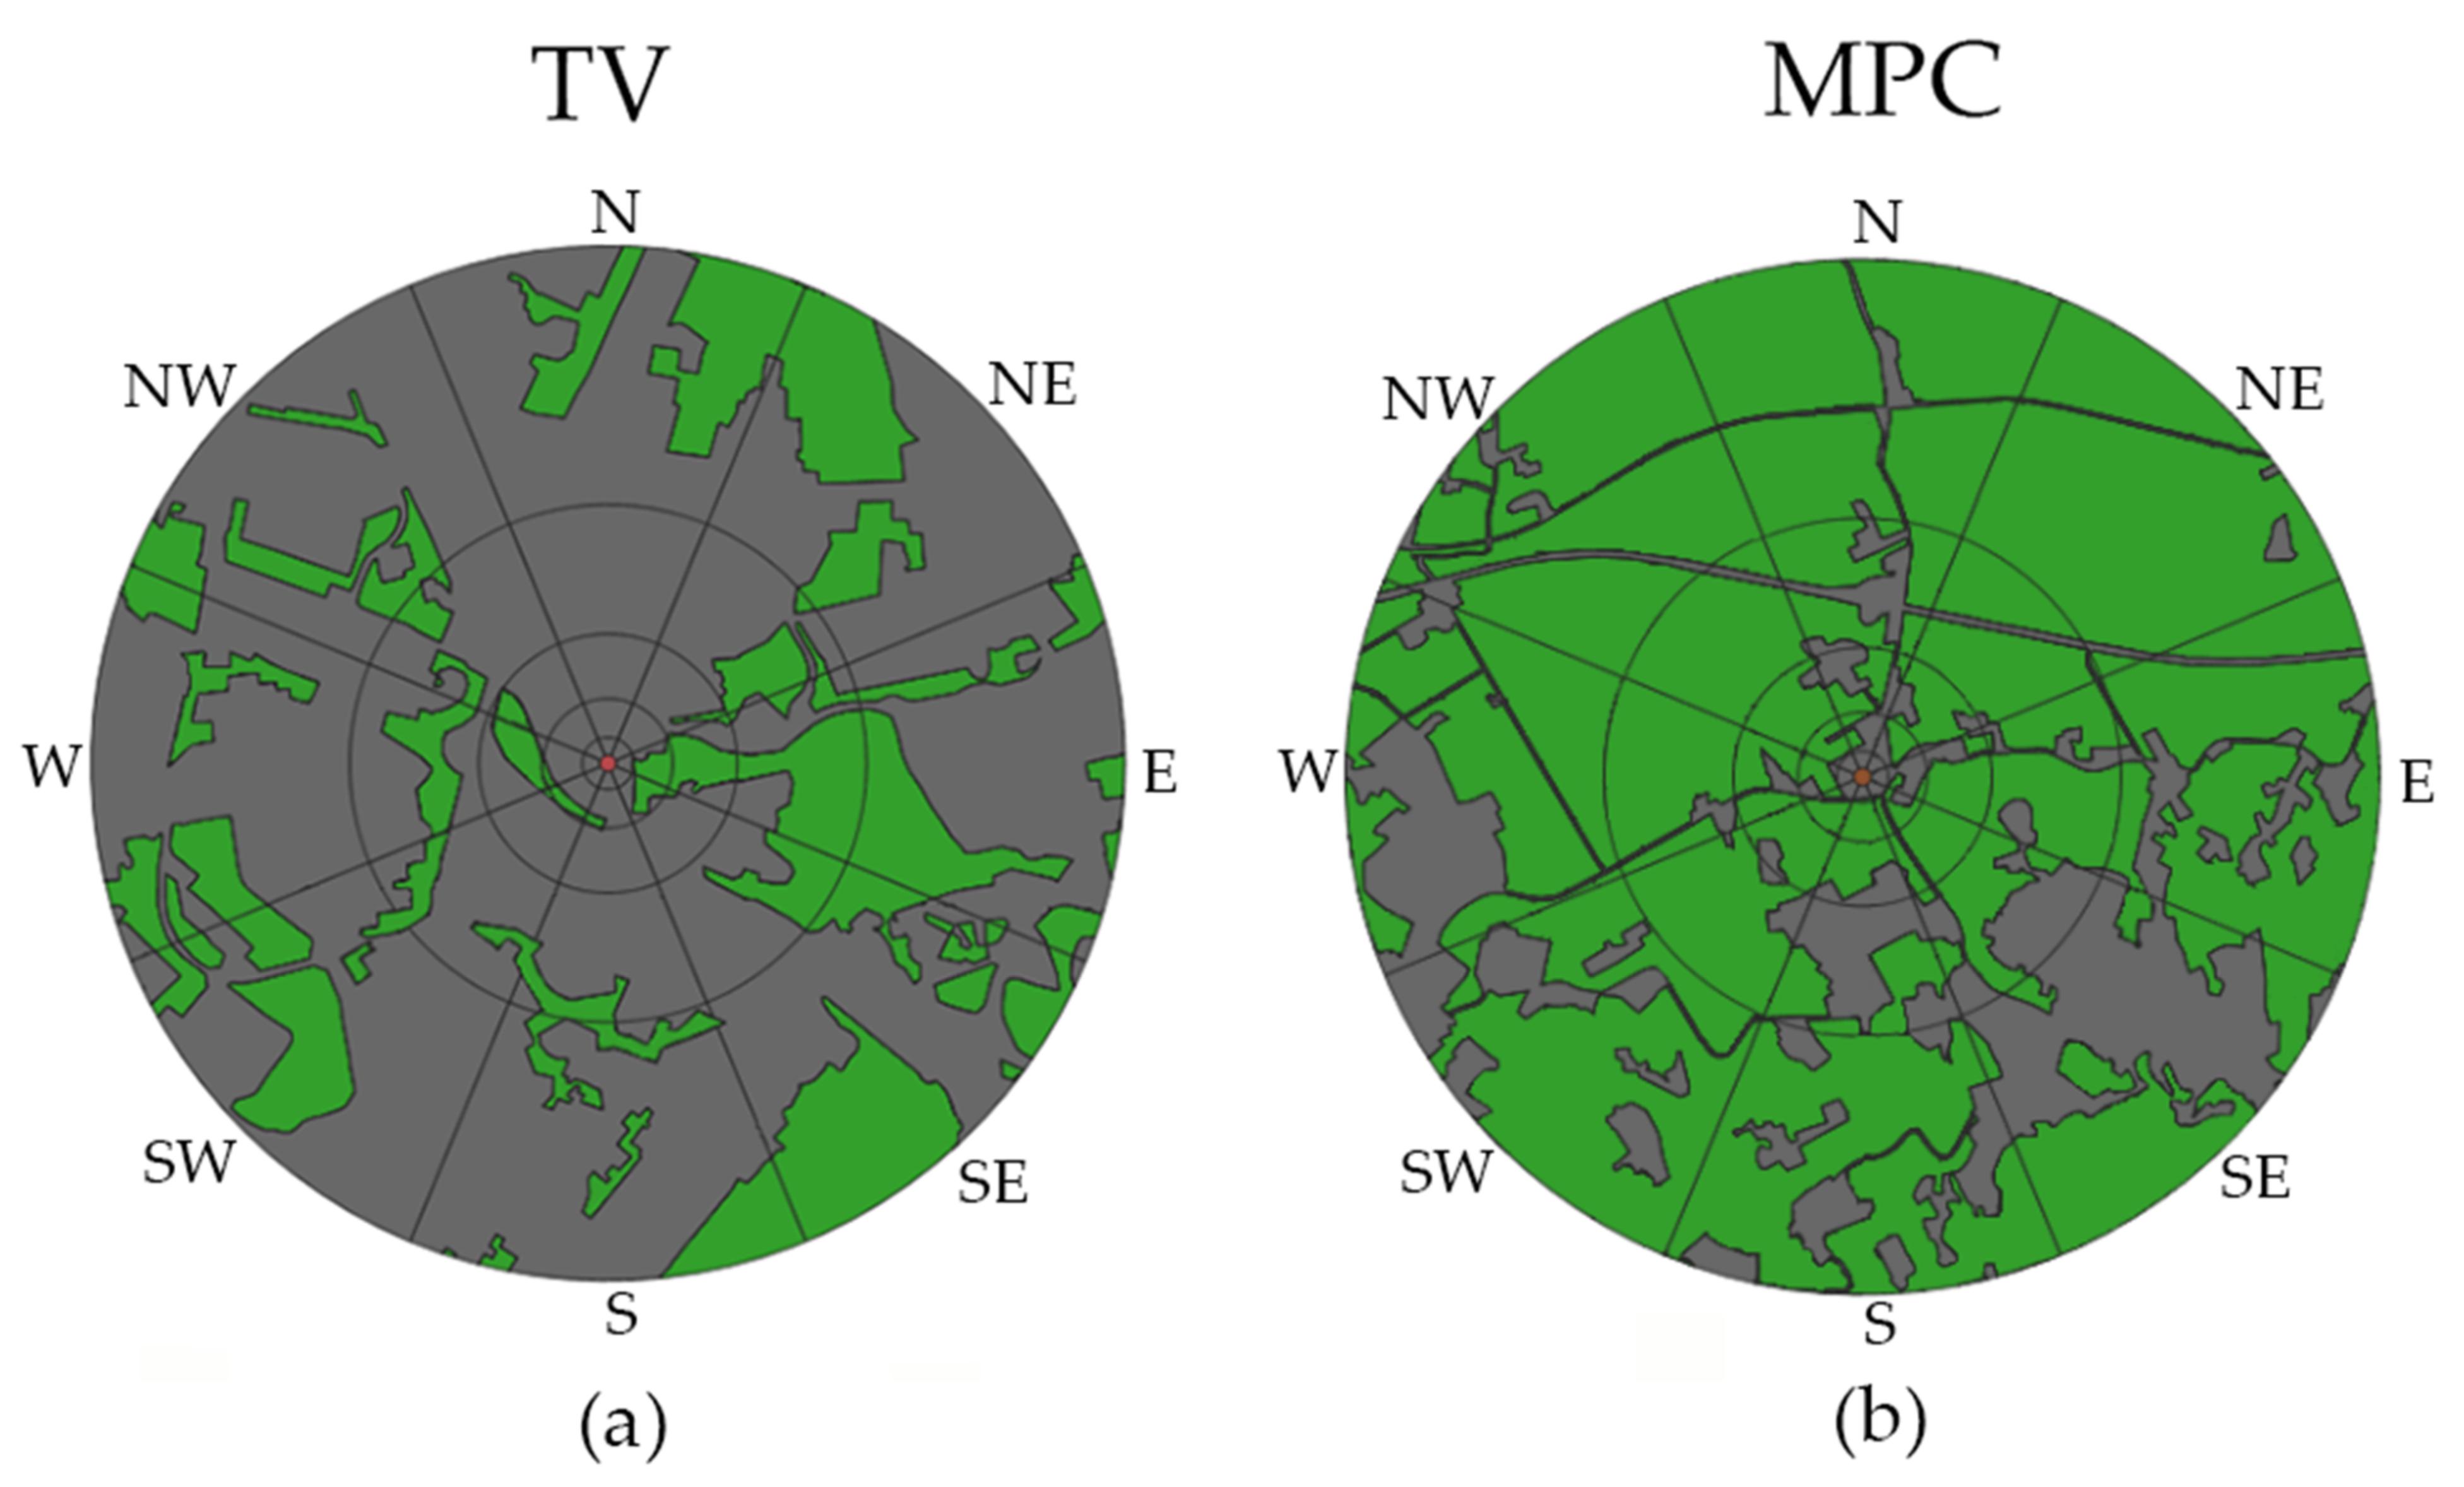
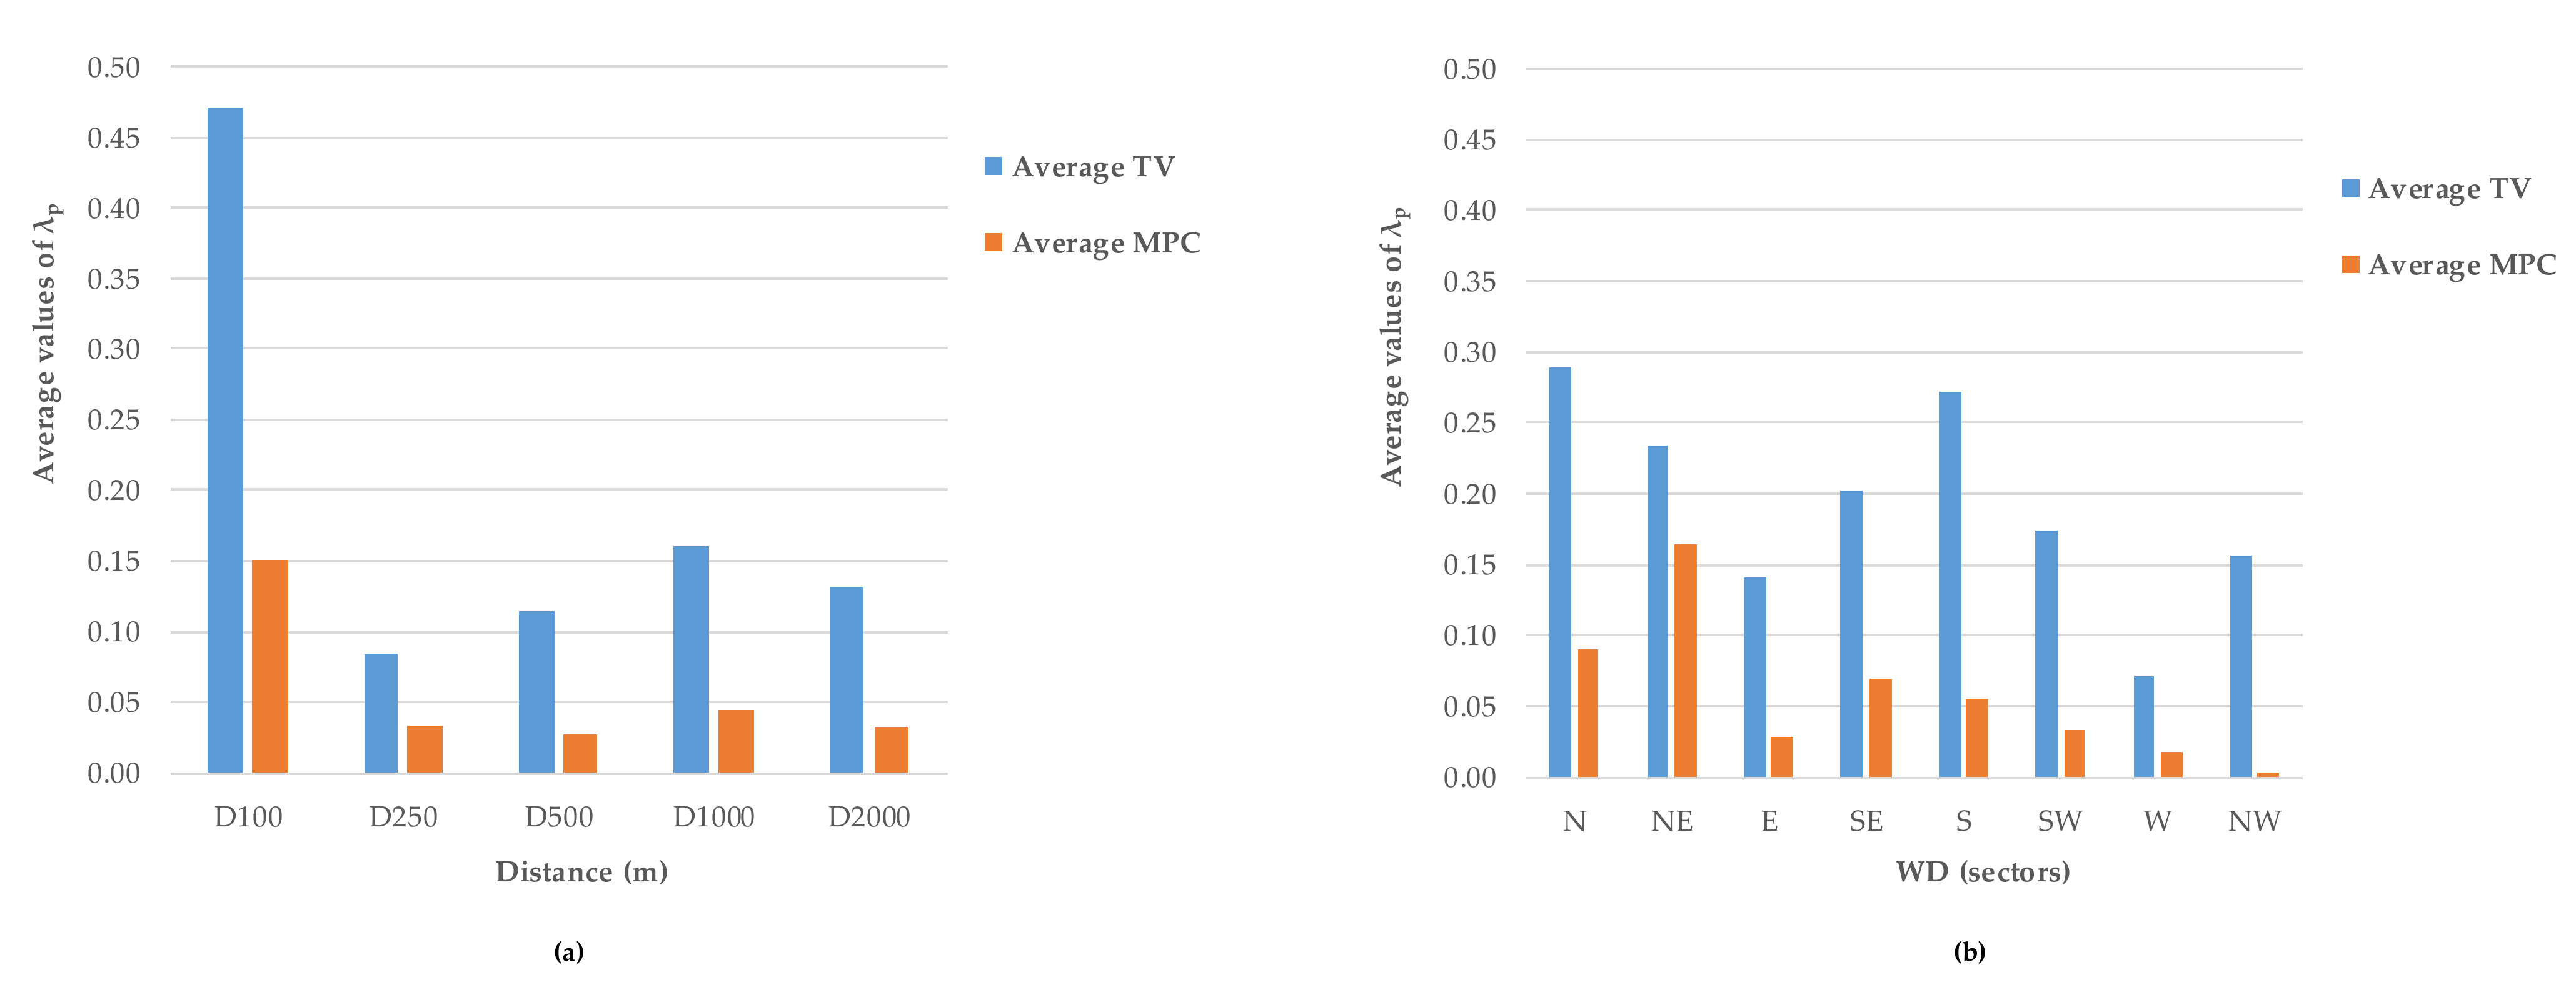
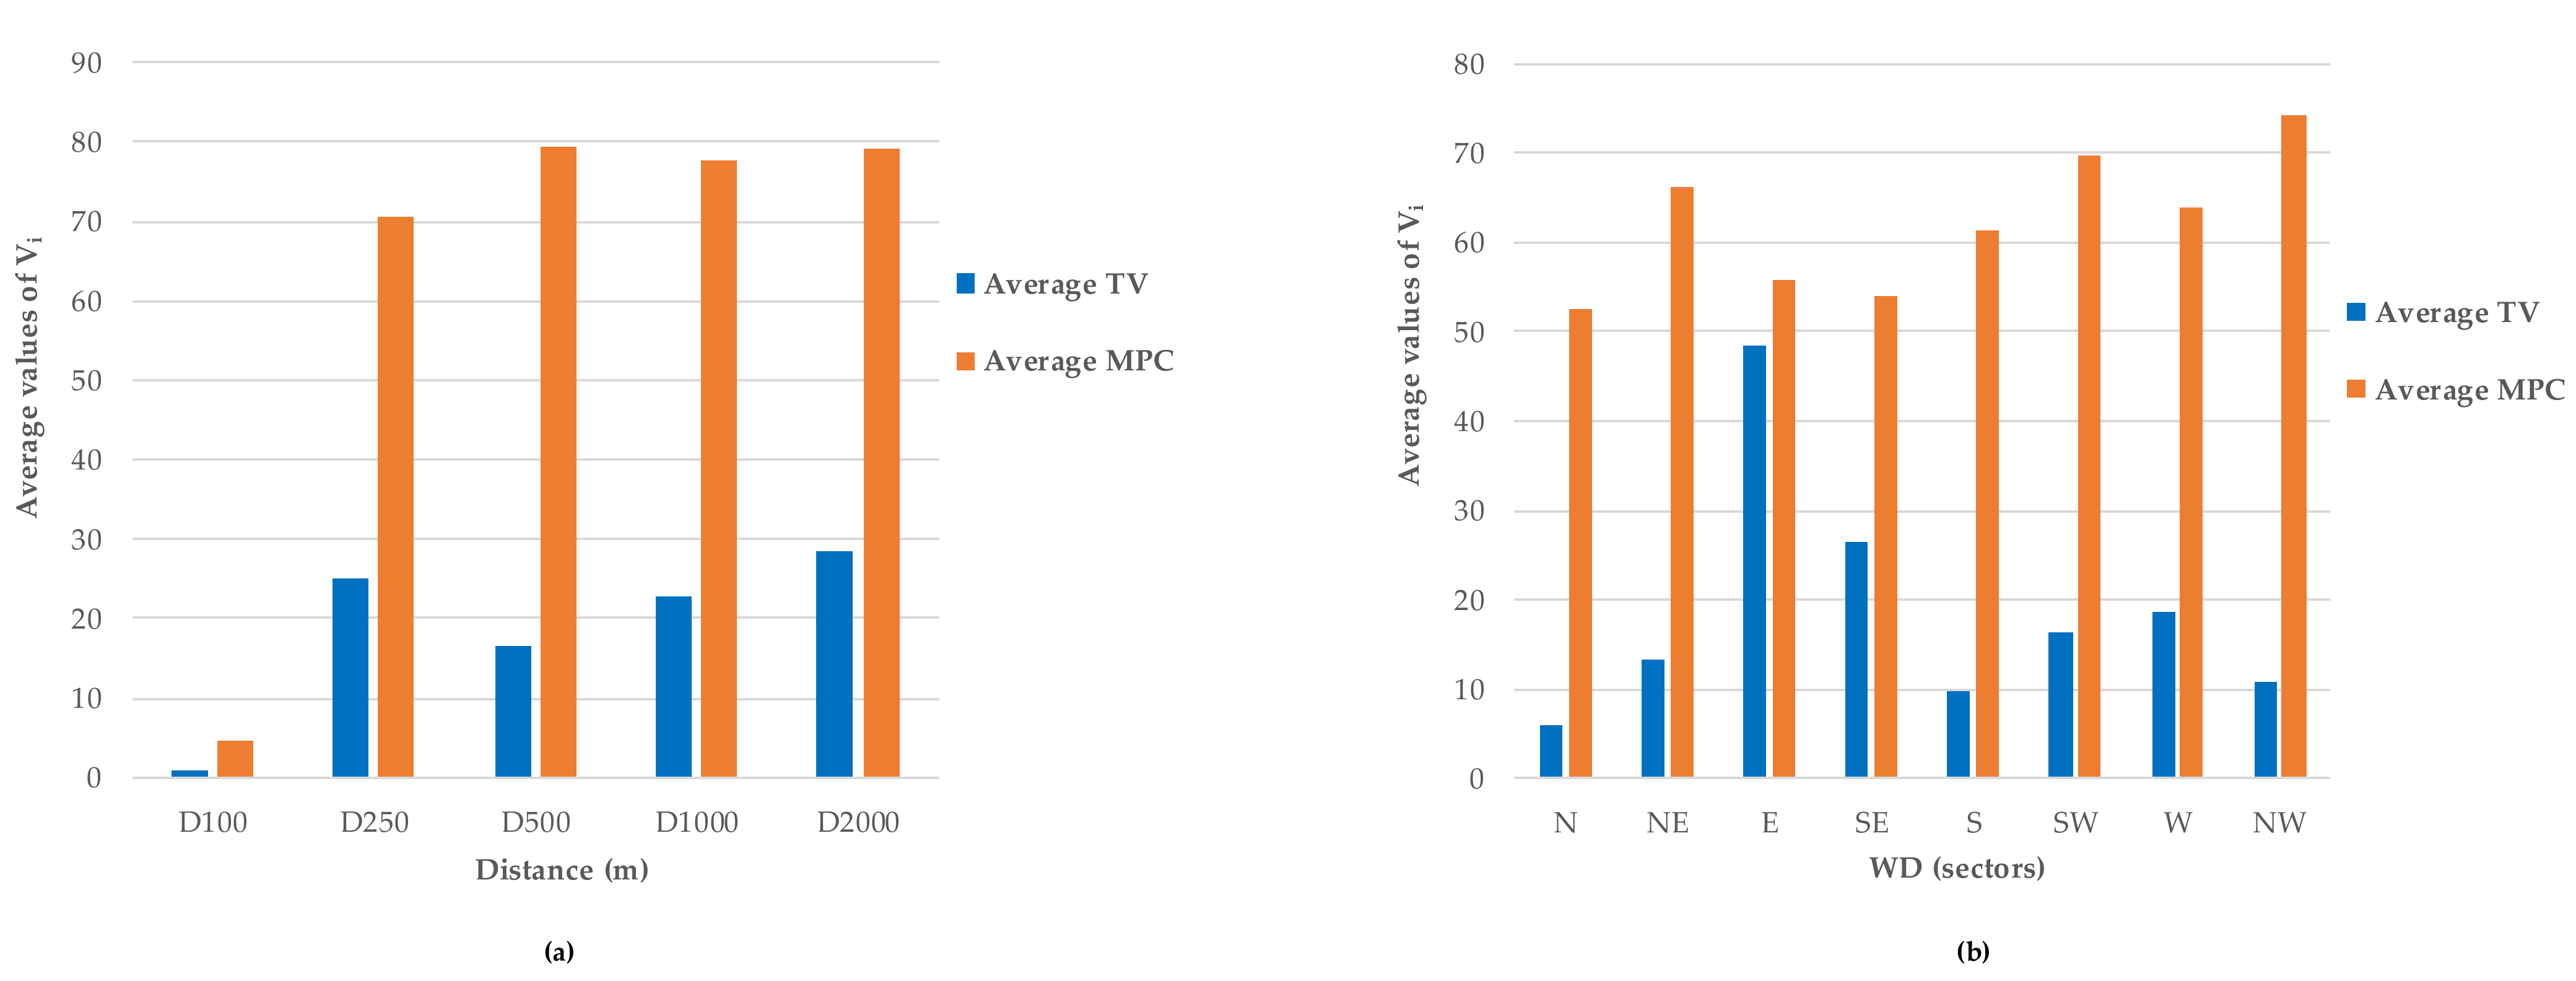
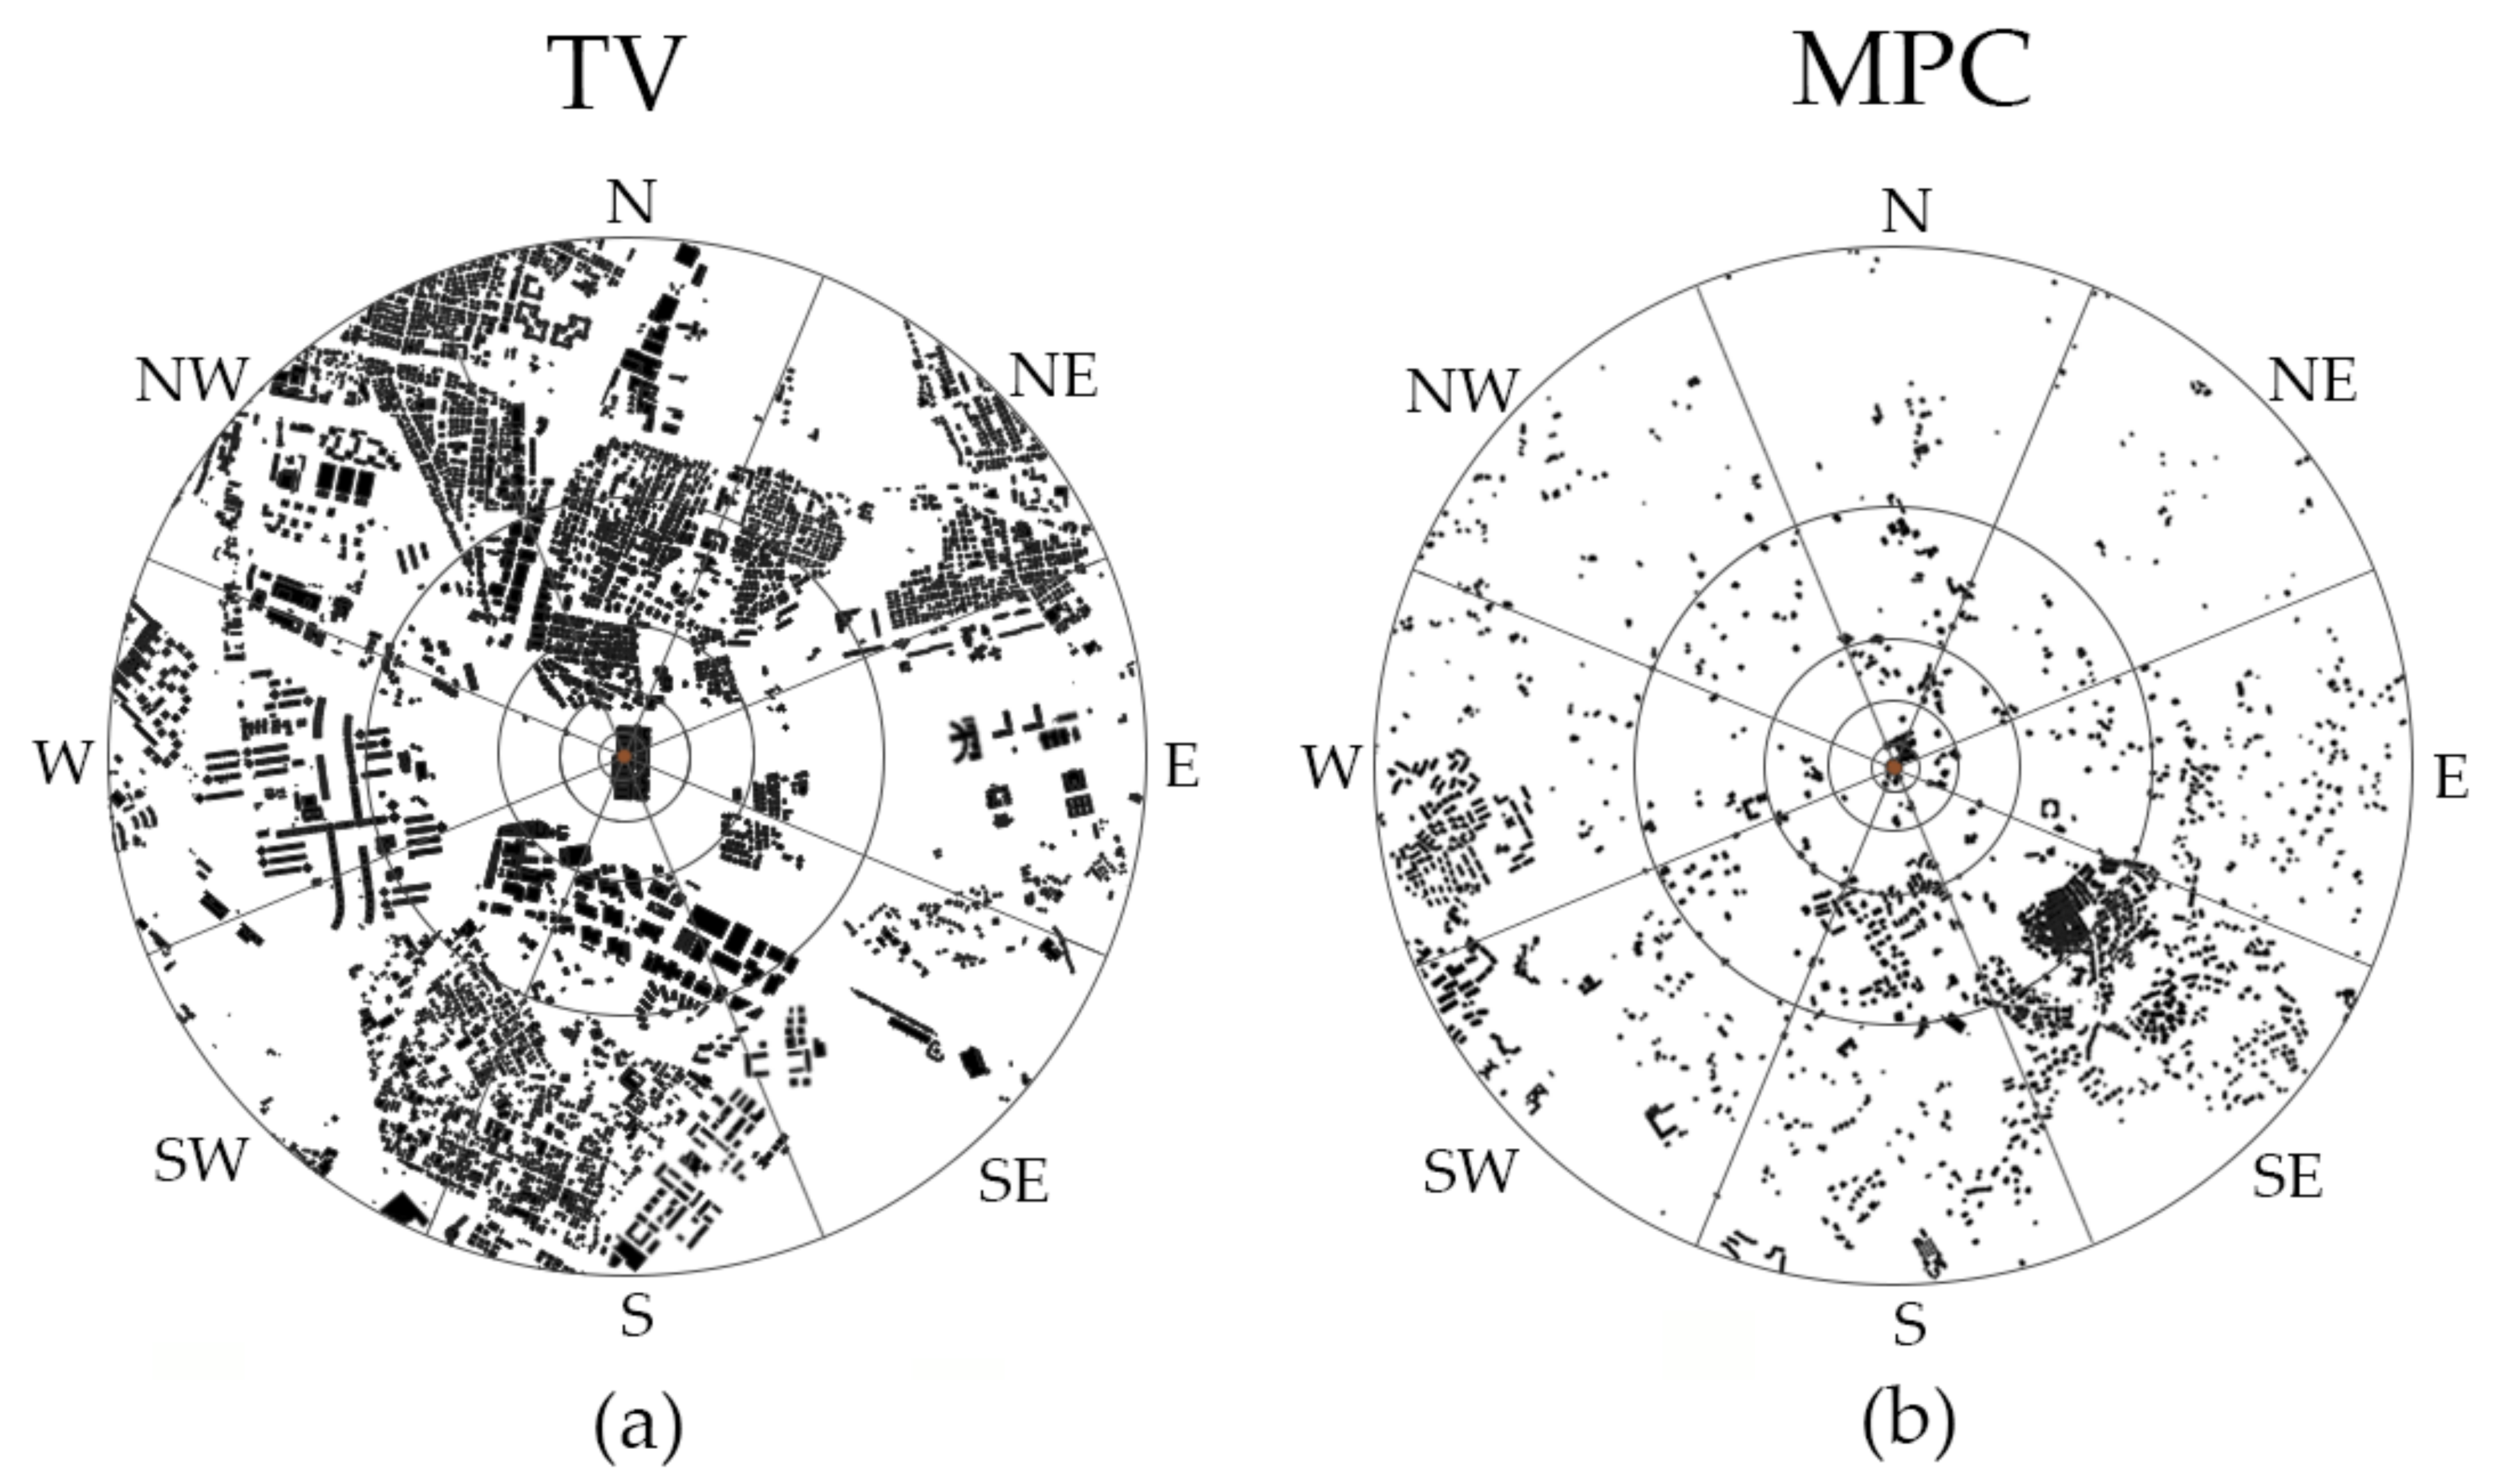
3.2. Land Use Characterization of TV and MPC

In order to interpret the observed pollen behavior, the buildings and vegetation distribution of an area of about 12 km2 around the two sites are taken into account and shown in Figure 1 and Figure 2.
The area of interest has been classified into two categories (green areas and artificial surfaces), grouping the different types of vegetation into the green area category and non-vegetated areas into artificial surfaces. Green areas are the main potential sources of pollen; however, no consideration has been made regarding the type of plants or pollen species.
The pollen impact measured at the two sites depends, firstly, on transport related to the wind direction but also on the distance between the site and the possible source of pollen. For this reason, data have been considered as a function of different classes of distance, reported in Table 2.
In this way, it is possible to identify, at different distances (up to a maximum of 2 km), the characteristics of the terrain in the vicinity of the two examined sites. Eight sectors (octants) are considered for the wind direction.
Figure 1 shows the built-up area for TV and MPC, whereas Figure 2 reports the green areas. In both figures the angular sectors representing the wind direction, as in Table 2, are highlighted.
The average values of λp (calculated from Table 3, as function of the distance and the sector of provenance) for TV and MPC are shown in Figure 3.
Both sites are characterized by unbuilt areas (except for TV in the first 100 m, where λp = 0.47), but TV is characterized by a higher presence of buildings compared to MPC (λp = 0.19 and λp = 0.06, respectively).
Table 4 reports the Vi as function of the distance and the wind direction for TV and MPC.
It is evident that MPC has a significant vegetation presence (Vi = 62.2) compared to TV (Vi = 18.7).
However, the vegetation index is small in the areas close to the two sites (first 100 m) but grows with the distance (Figure 4a), assuming on average values of 23.2 and 76.6, between 250 and 2000 m for TV and MPC, respectively.
Considering the wind direction, the vegetation index, for MPC, does not vary considerably whereas, for TV, Vi remains low, showing values comparable to MPC when the wind comes from the east (Figure 4a,b).

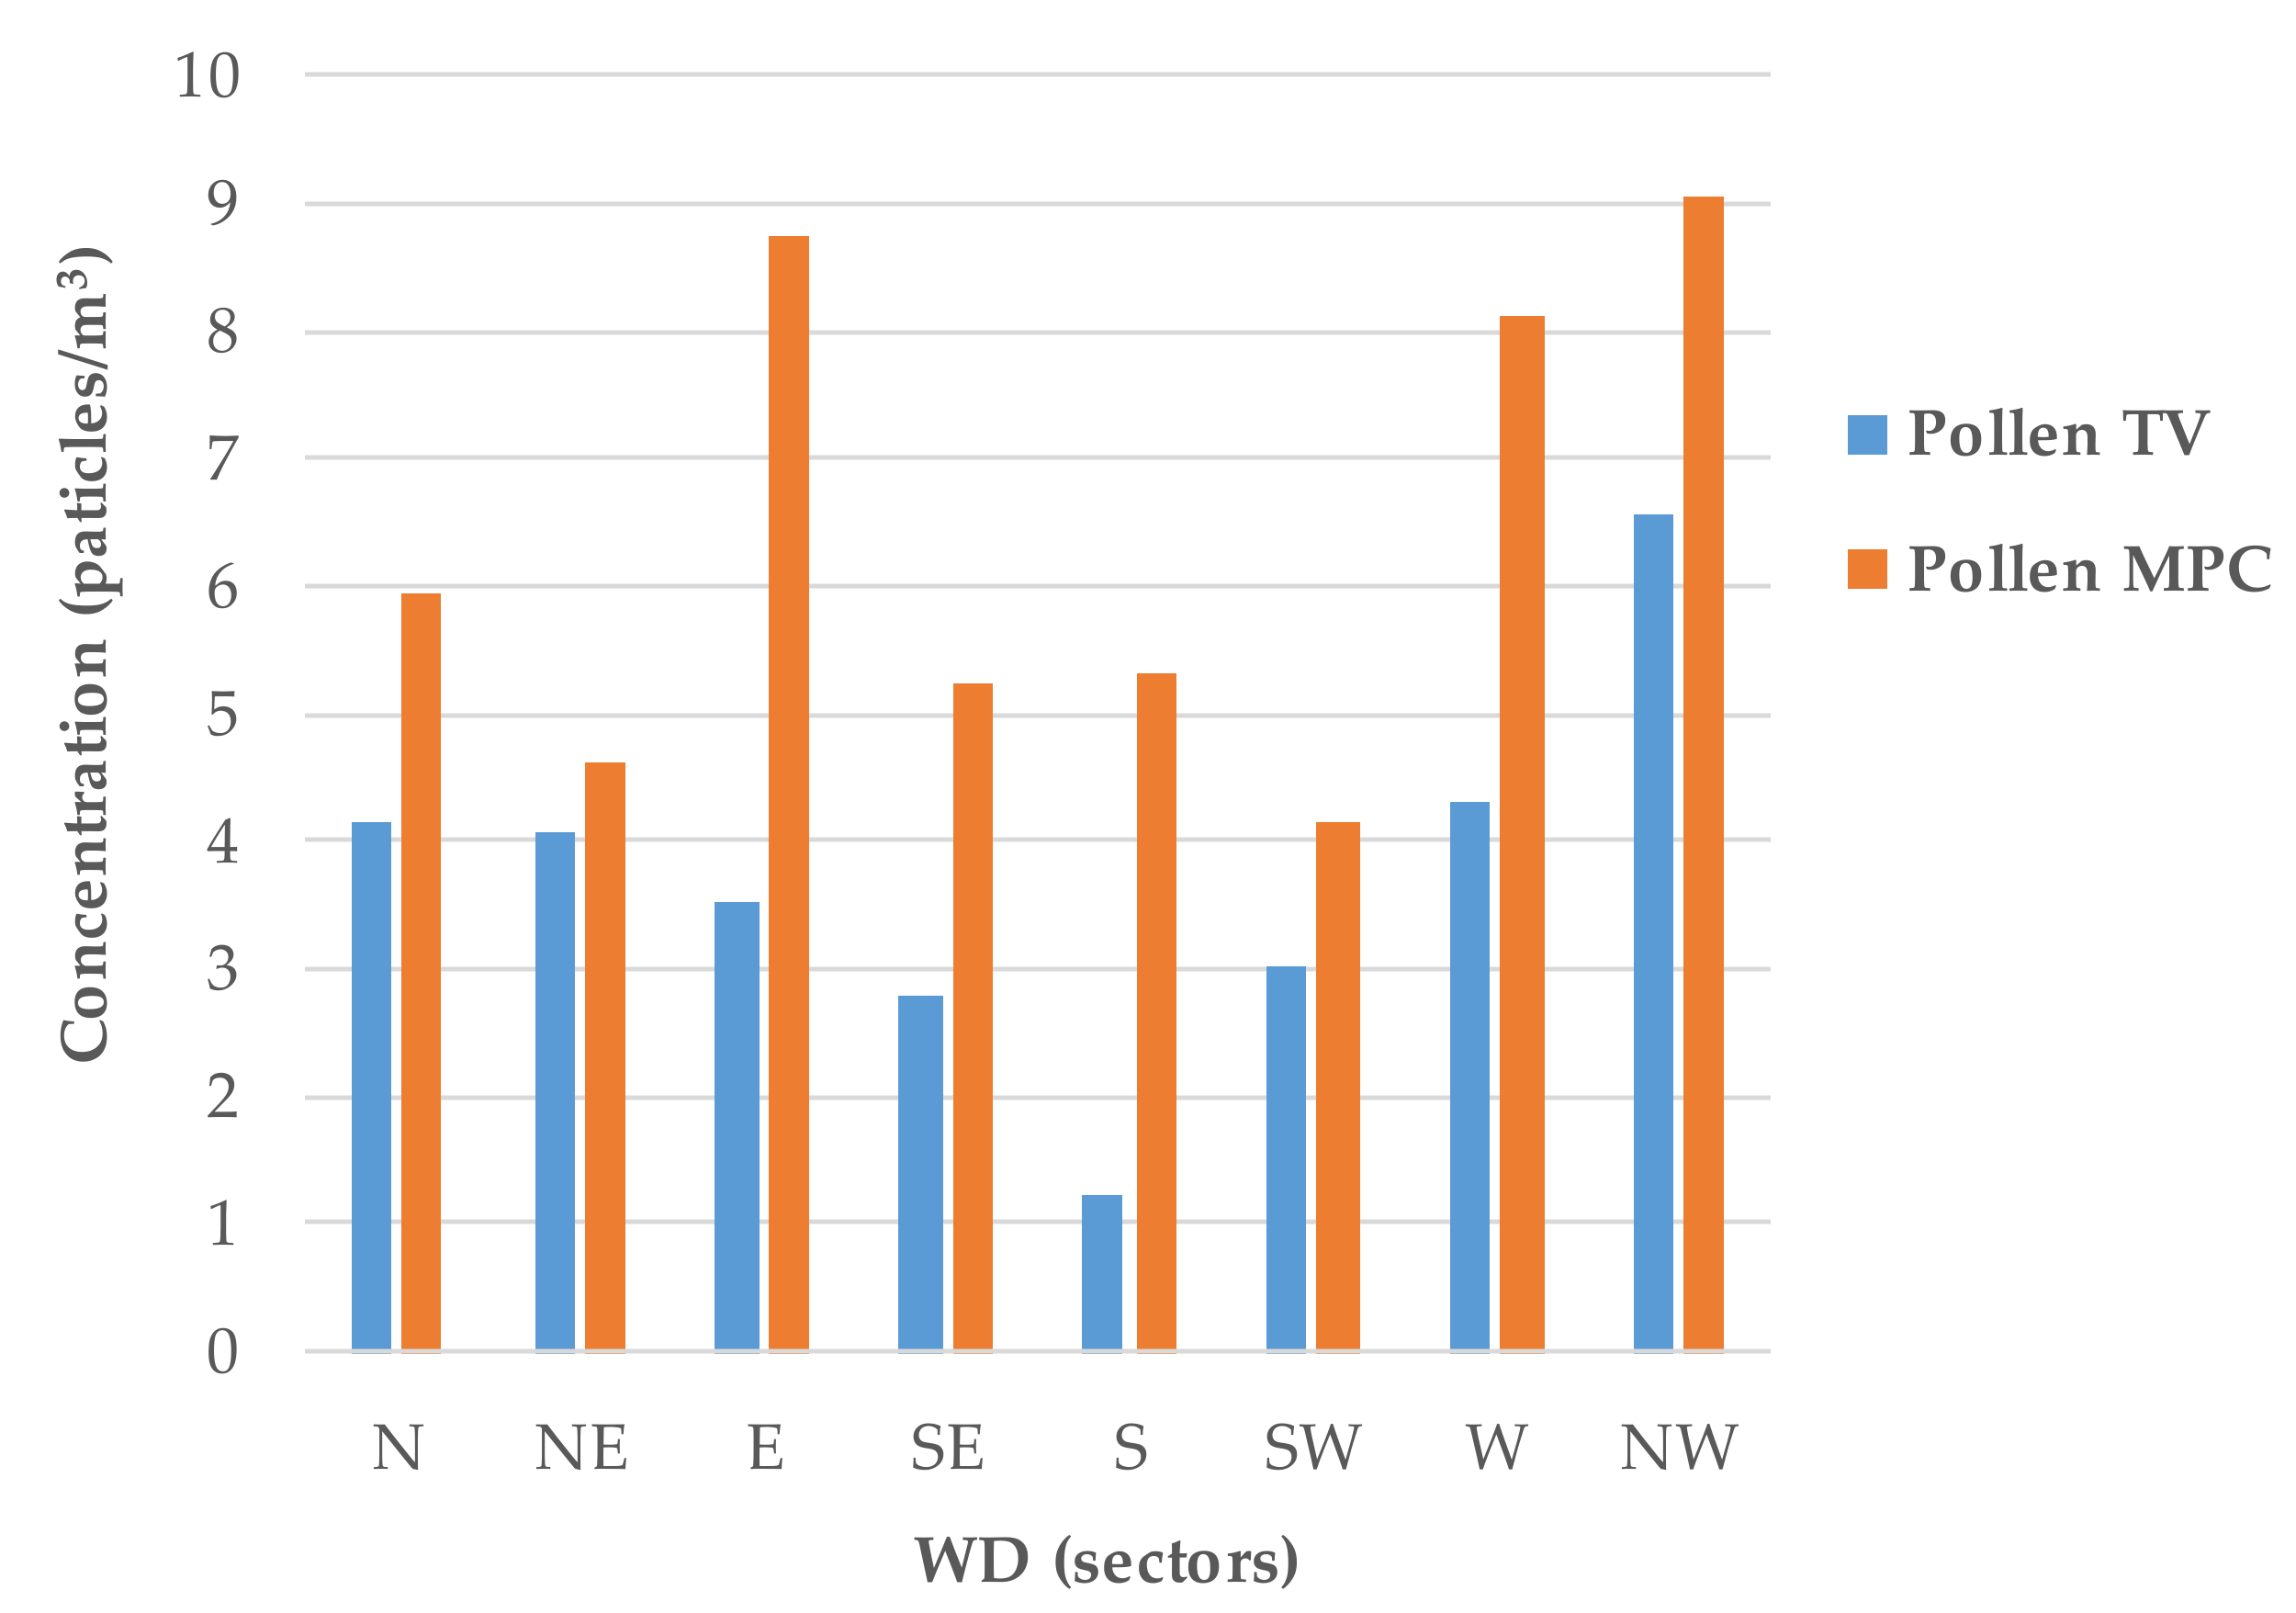
3.3. Study of Meteorological Variables and Pollen Concentrations

TV and MPC terrains are profoundly different and this aspect influences the possible source of pollen with respect to the wind direction.
To better evaluate this aspect, considering the meteorological condition as homogeneous between the two sites as indicated in Section 3.3, meteorological variables measured on TV were related to the outdoor pollen concentration observed in the two sites.
Table 5 shows the mean values of the meteorological variables observed during the measurement campaign.
Wind speed values are on average higher for the sector between North–South (WS = 1.5 m/s) while lower values are observed from West (WS = 0.8 m/s). Data for solar radiation show higher values for directions from SW–W–NW. During the night (not shown in the table), the mean temperature and wind speed are lower (Tnight = 6.8° and WS = 1.02 m/s) than those observed during the day (Tday = 11.6° and WS = 1.33 m/s), corresponding to a mean relative humidity of 92.5% and 72.5%, respectively.
Considering the pollen at TV and MPC, Figure 5 shows the observed values as function of the wind direction measured at TV.
It should be emphasized that while for TV, meteorological variables and pollen concentration are measured on the same site, for MPC we assume that the wind regime is similar to that observed in TV; our assumption is supported by the evidence that the terrain between the two sites is generally free from obstacles, as shown in Table 3.
Figure 5 shows that, for TV, the minimum pollen concentration corresponds to the South direction (P (TV) = 1.24 particles/m3), while the maximum of transport occurs for winds from NW (P (TV) = 6.57 particles/m3). For MPC, the observed values are, on average, higher and less dependent on the wind direction in accordance with the vegetation index (Table 4), which shows higher values for MPC, independently of the wind direction (see Figure 4).

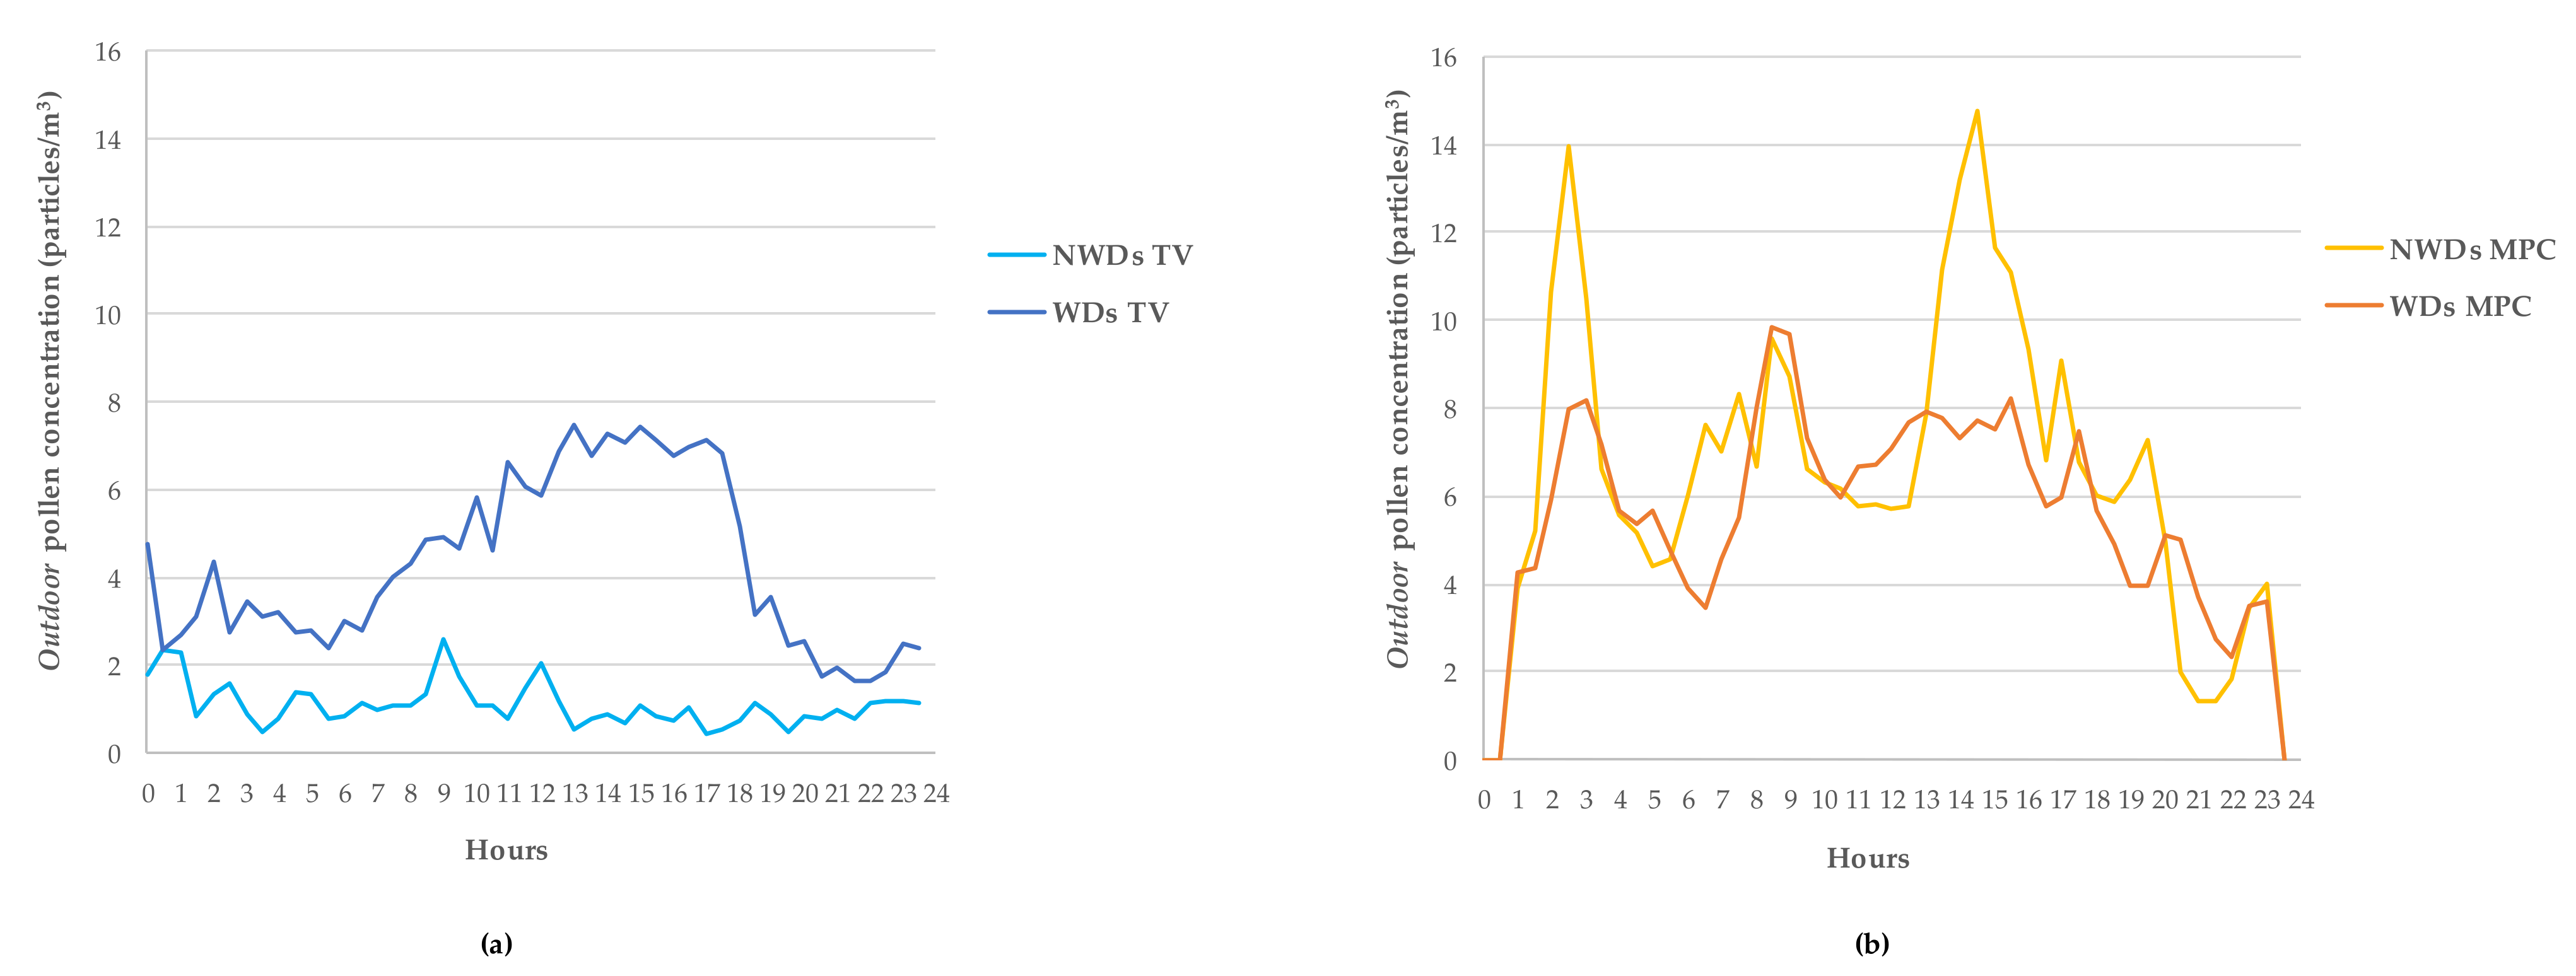
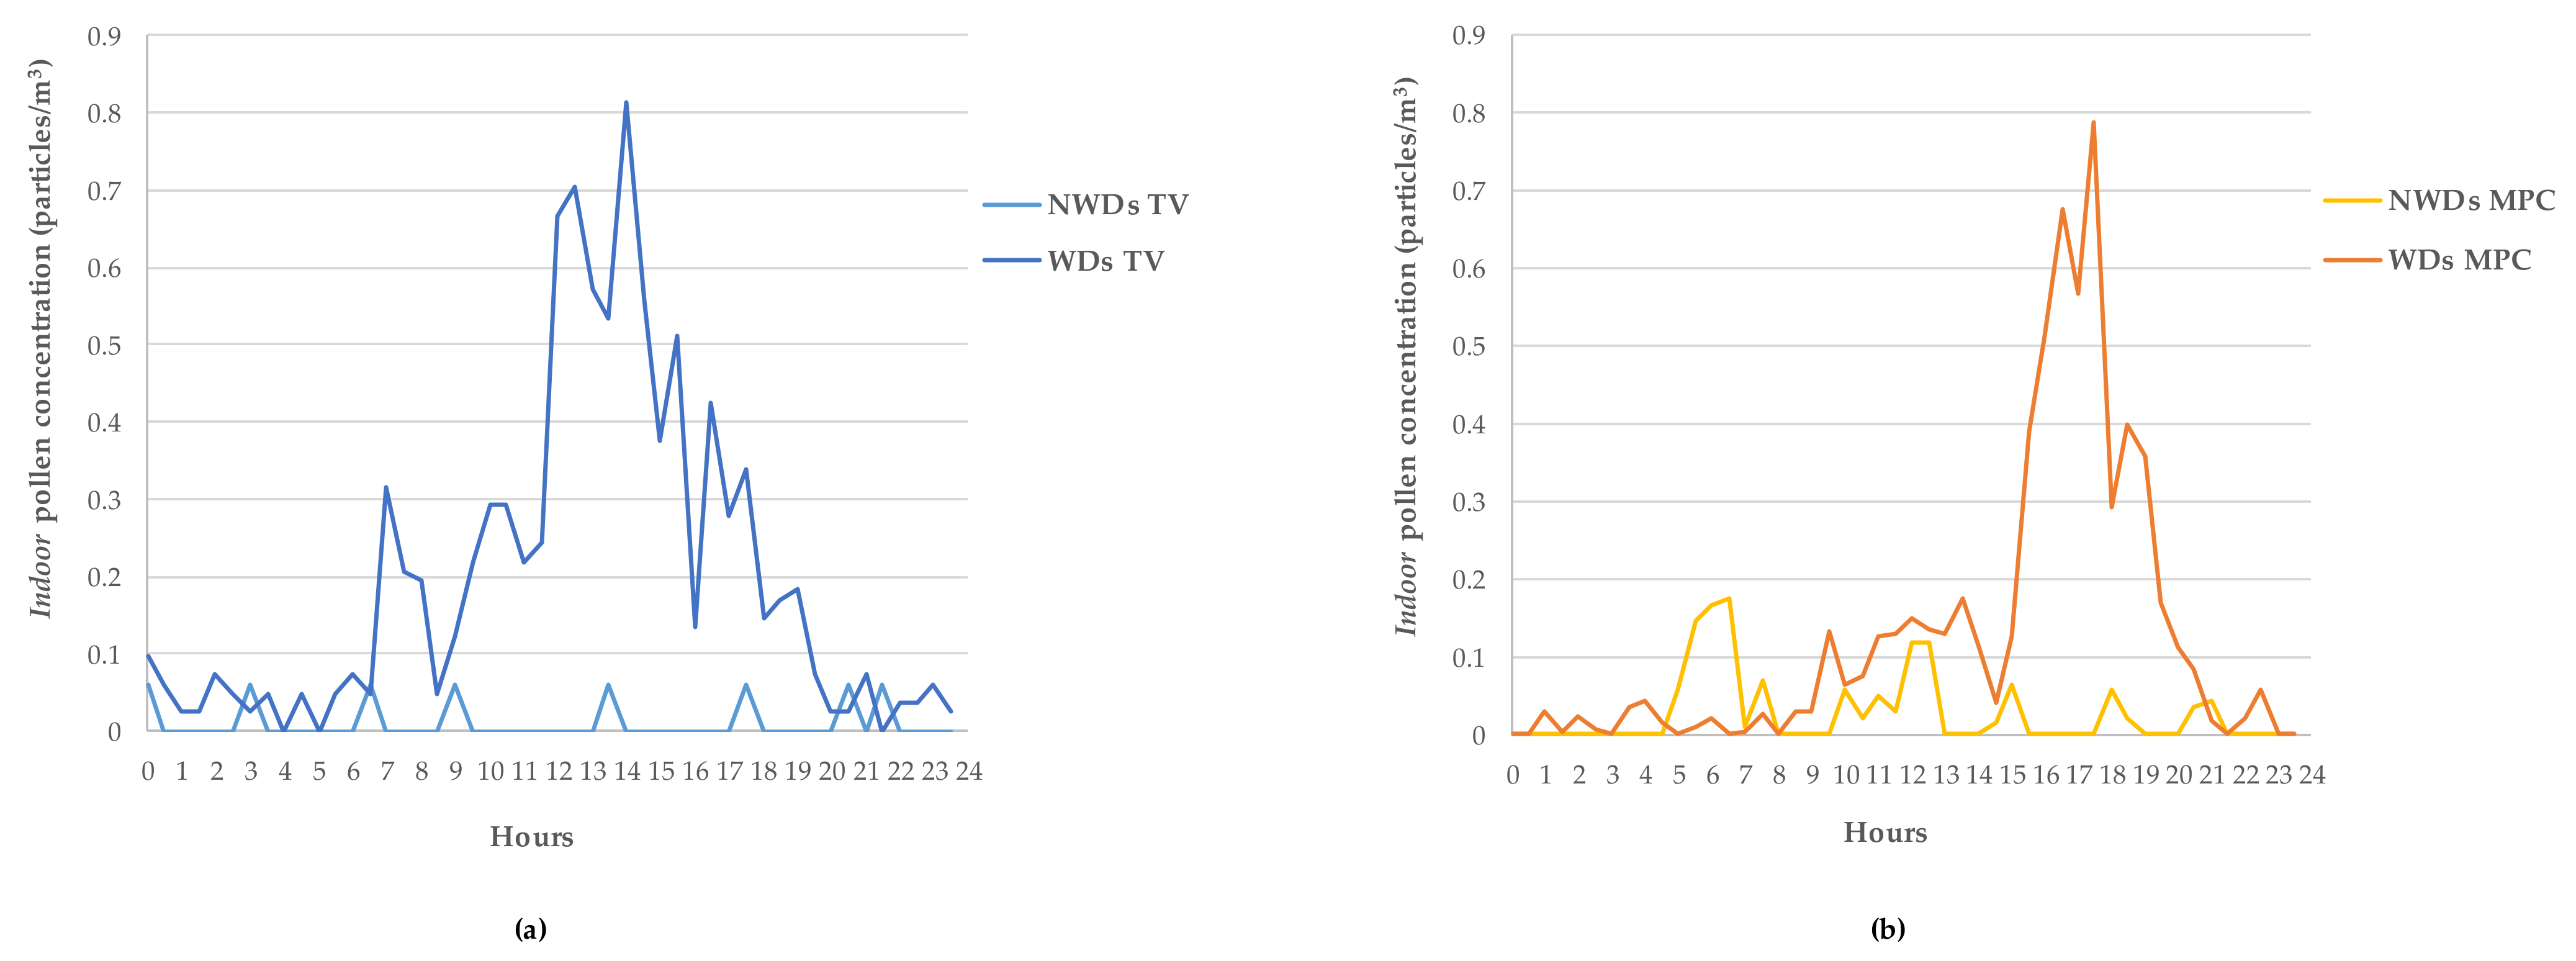
3.4. Analysis of Typical Days NWDS and WDS for Indoor and Outdoor Pollen Concentrations

Aiming to evaluate occupational exposure, the hourly average values are considered in the analysis of a typical day, taking into account separately the working days and the non-working days. Figure 6a,b shows the outdoor concentrations for the MPC and TV. The outdoor concentrations for MPC are always higher than for TV, about 79% and 27% more during the working days and the non-working days, respectively; the difference between the pollen concentration in the two sites is probably due to the influence of the Vi that characterizes MPC and TV, but also to the high agricultural vocation of the MPC area, where the average pollen values reach the maximum during the holidays (PNWDs (MPC) = 6.5 particles/m3), definitely higher than that observed at TV (1.1 particles/m3) for the same period.
Figure 7 shows the values for indoor pollution. No substantial differences are observed between MPC and TV during non-working days contrary to what was observed during working days. The average values in TV are slightly higher than in MPC (0.20 particles/m3 versus 0.13 particles/m3) but the most relevant aspect, however, is the hourly distribution of indoor pollen that is observed between MPC and TV during working days. During the first part of the morning (from 8:00 a.m. to 14:00 p.m.), very low values are observed in MPC (Pindoor (MPC) = 0.10 particles/m3) compared to TV (Pindoor (TV) = 0.38 particles/m3), while in the second part of the day (from 14:00 p.m. to 20:00 p.m.), the values of MPC are slightly higher than those observed in TV 0.37 particles/m3 versus 0.27 particles/m3).
A first consideration that can be made regards the habits of workers (their presence and behaviors) that influence the indoor pollen concentration during the day. This aspect will be discussed in Section 3.6.

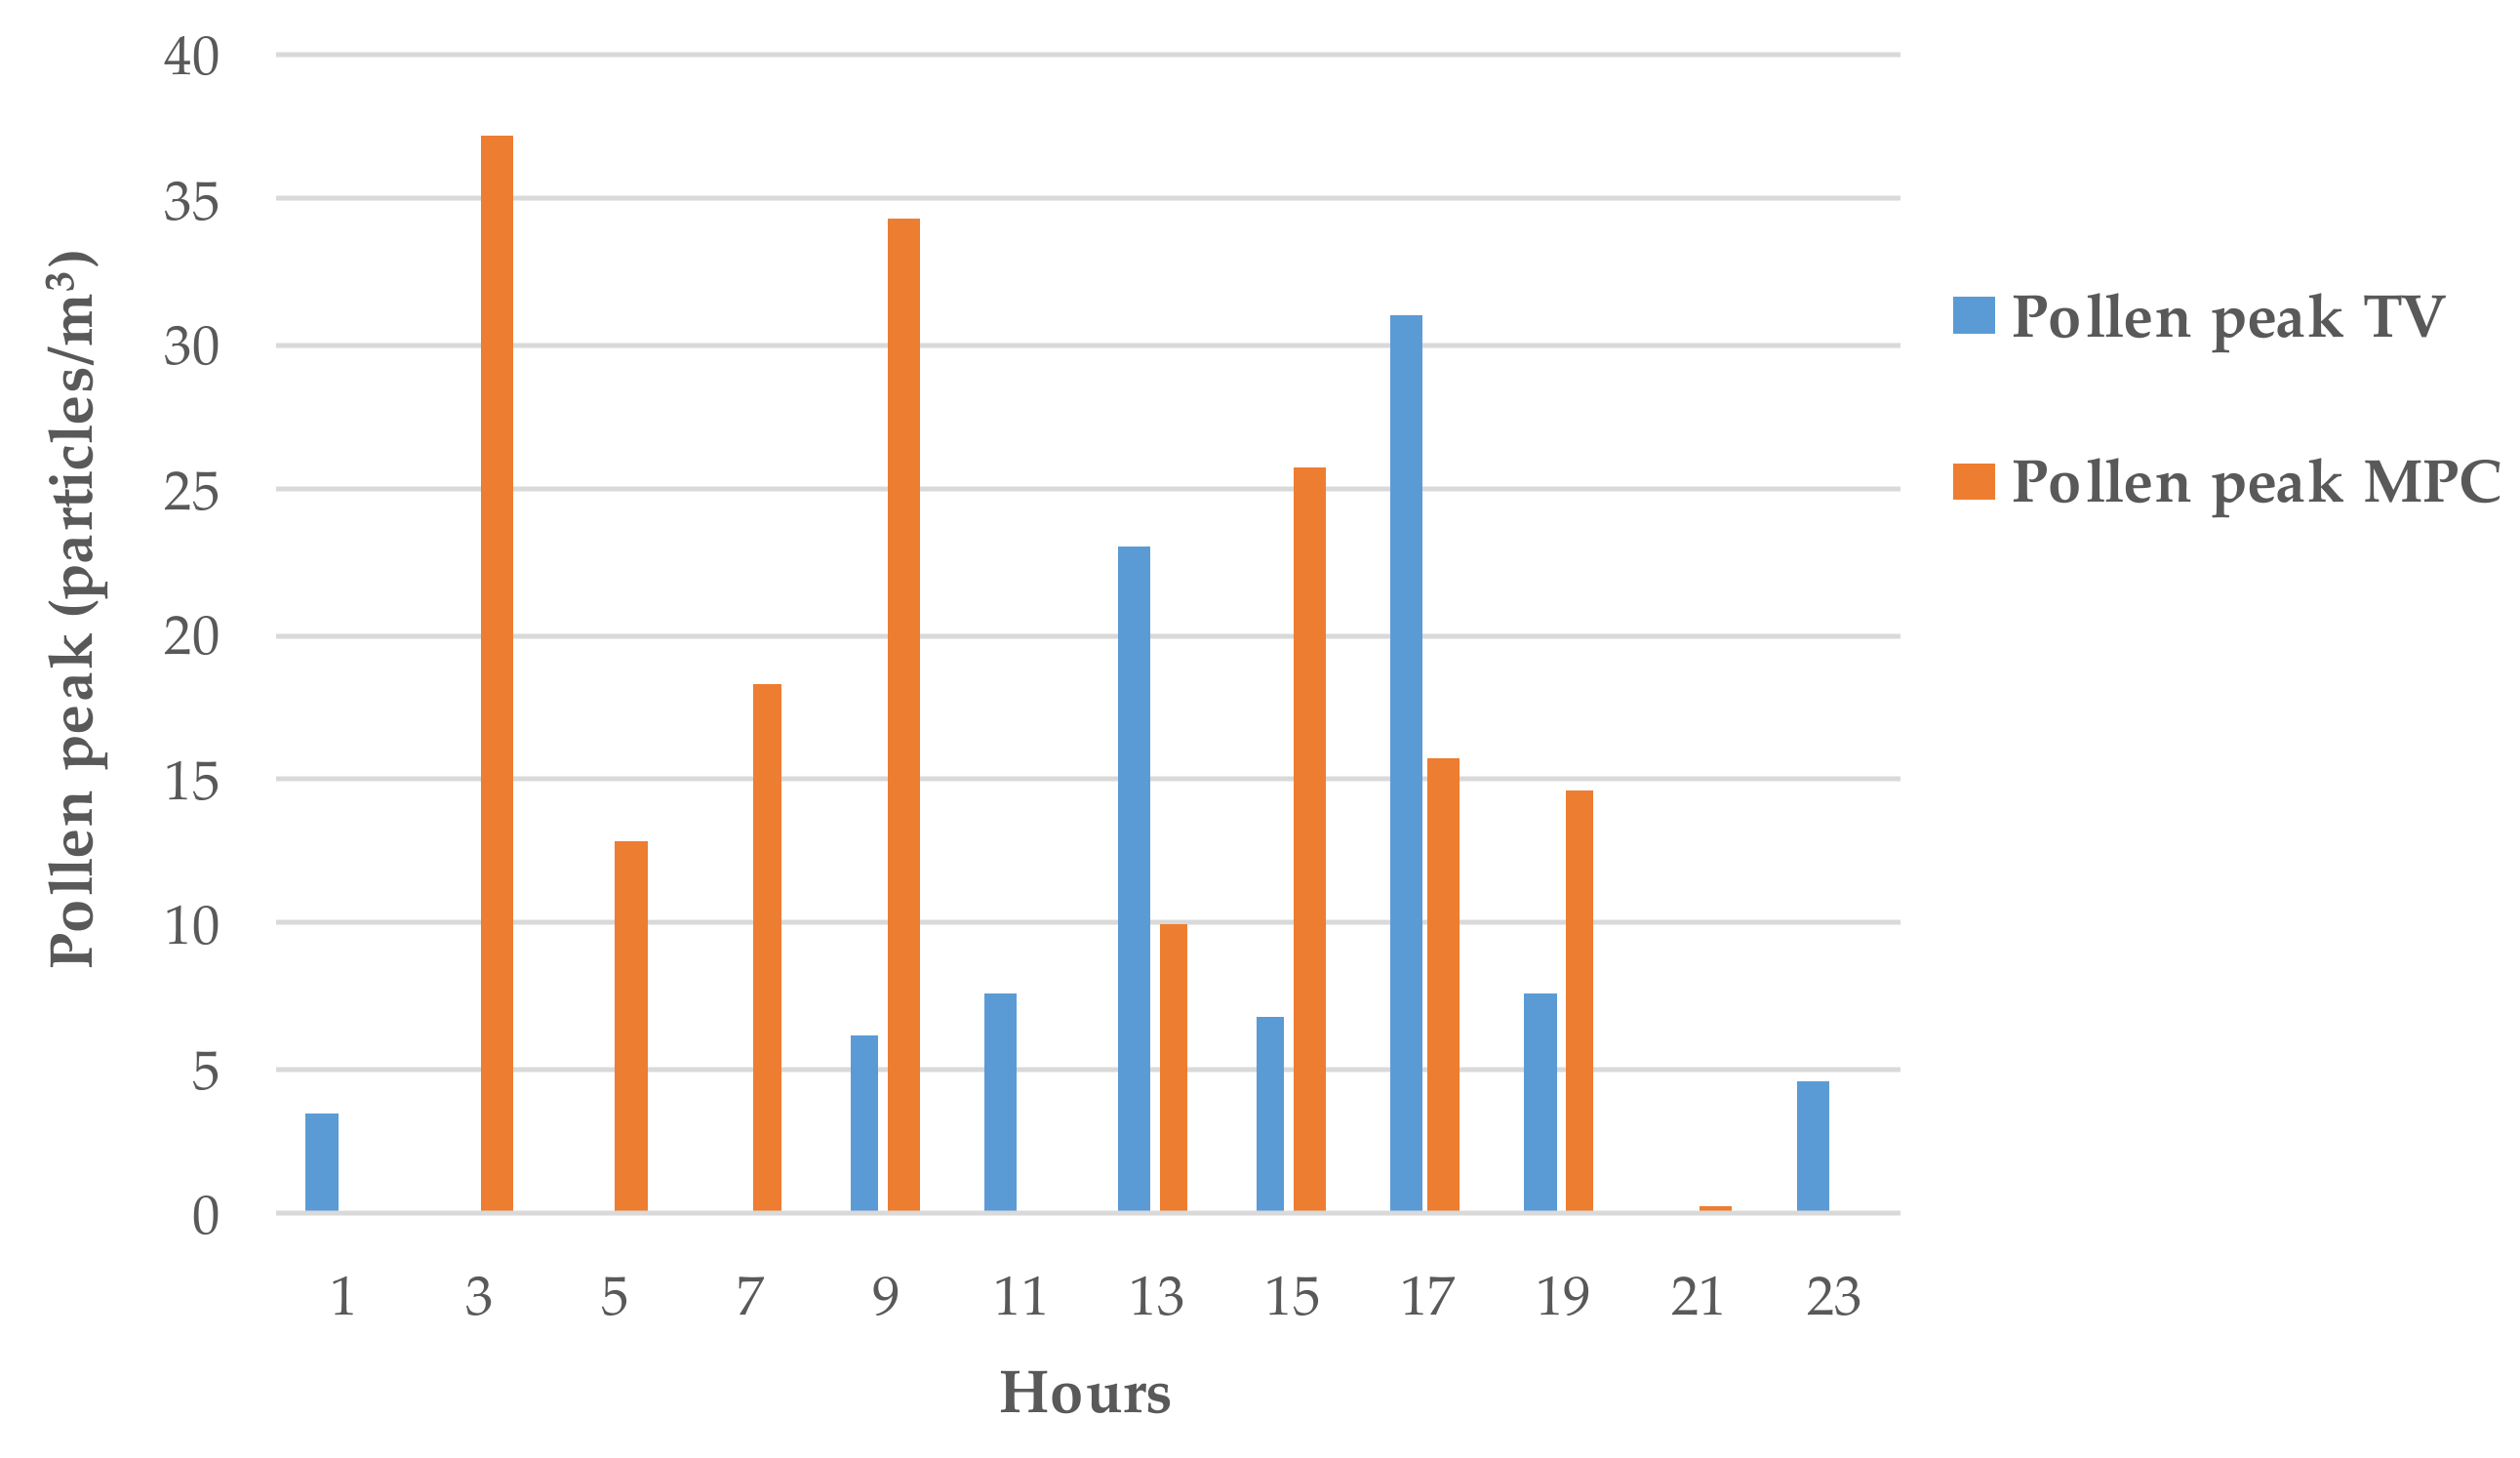
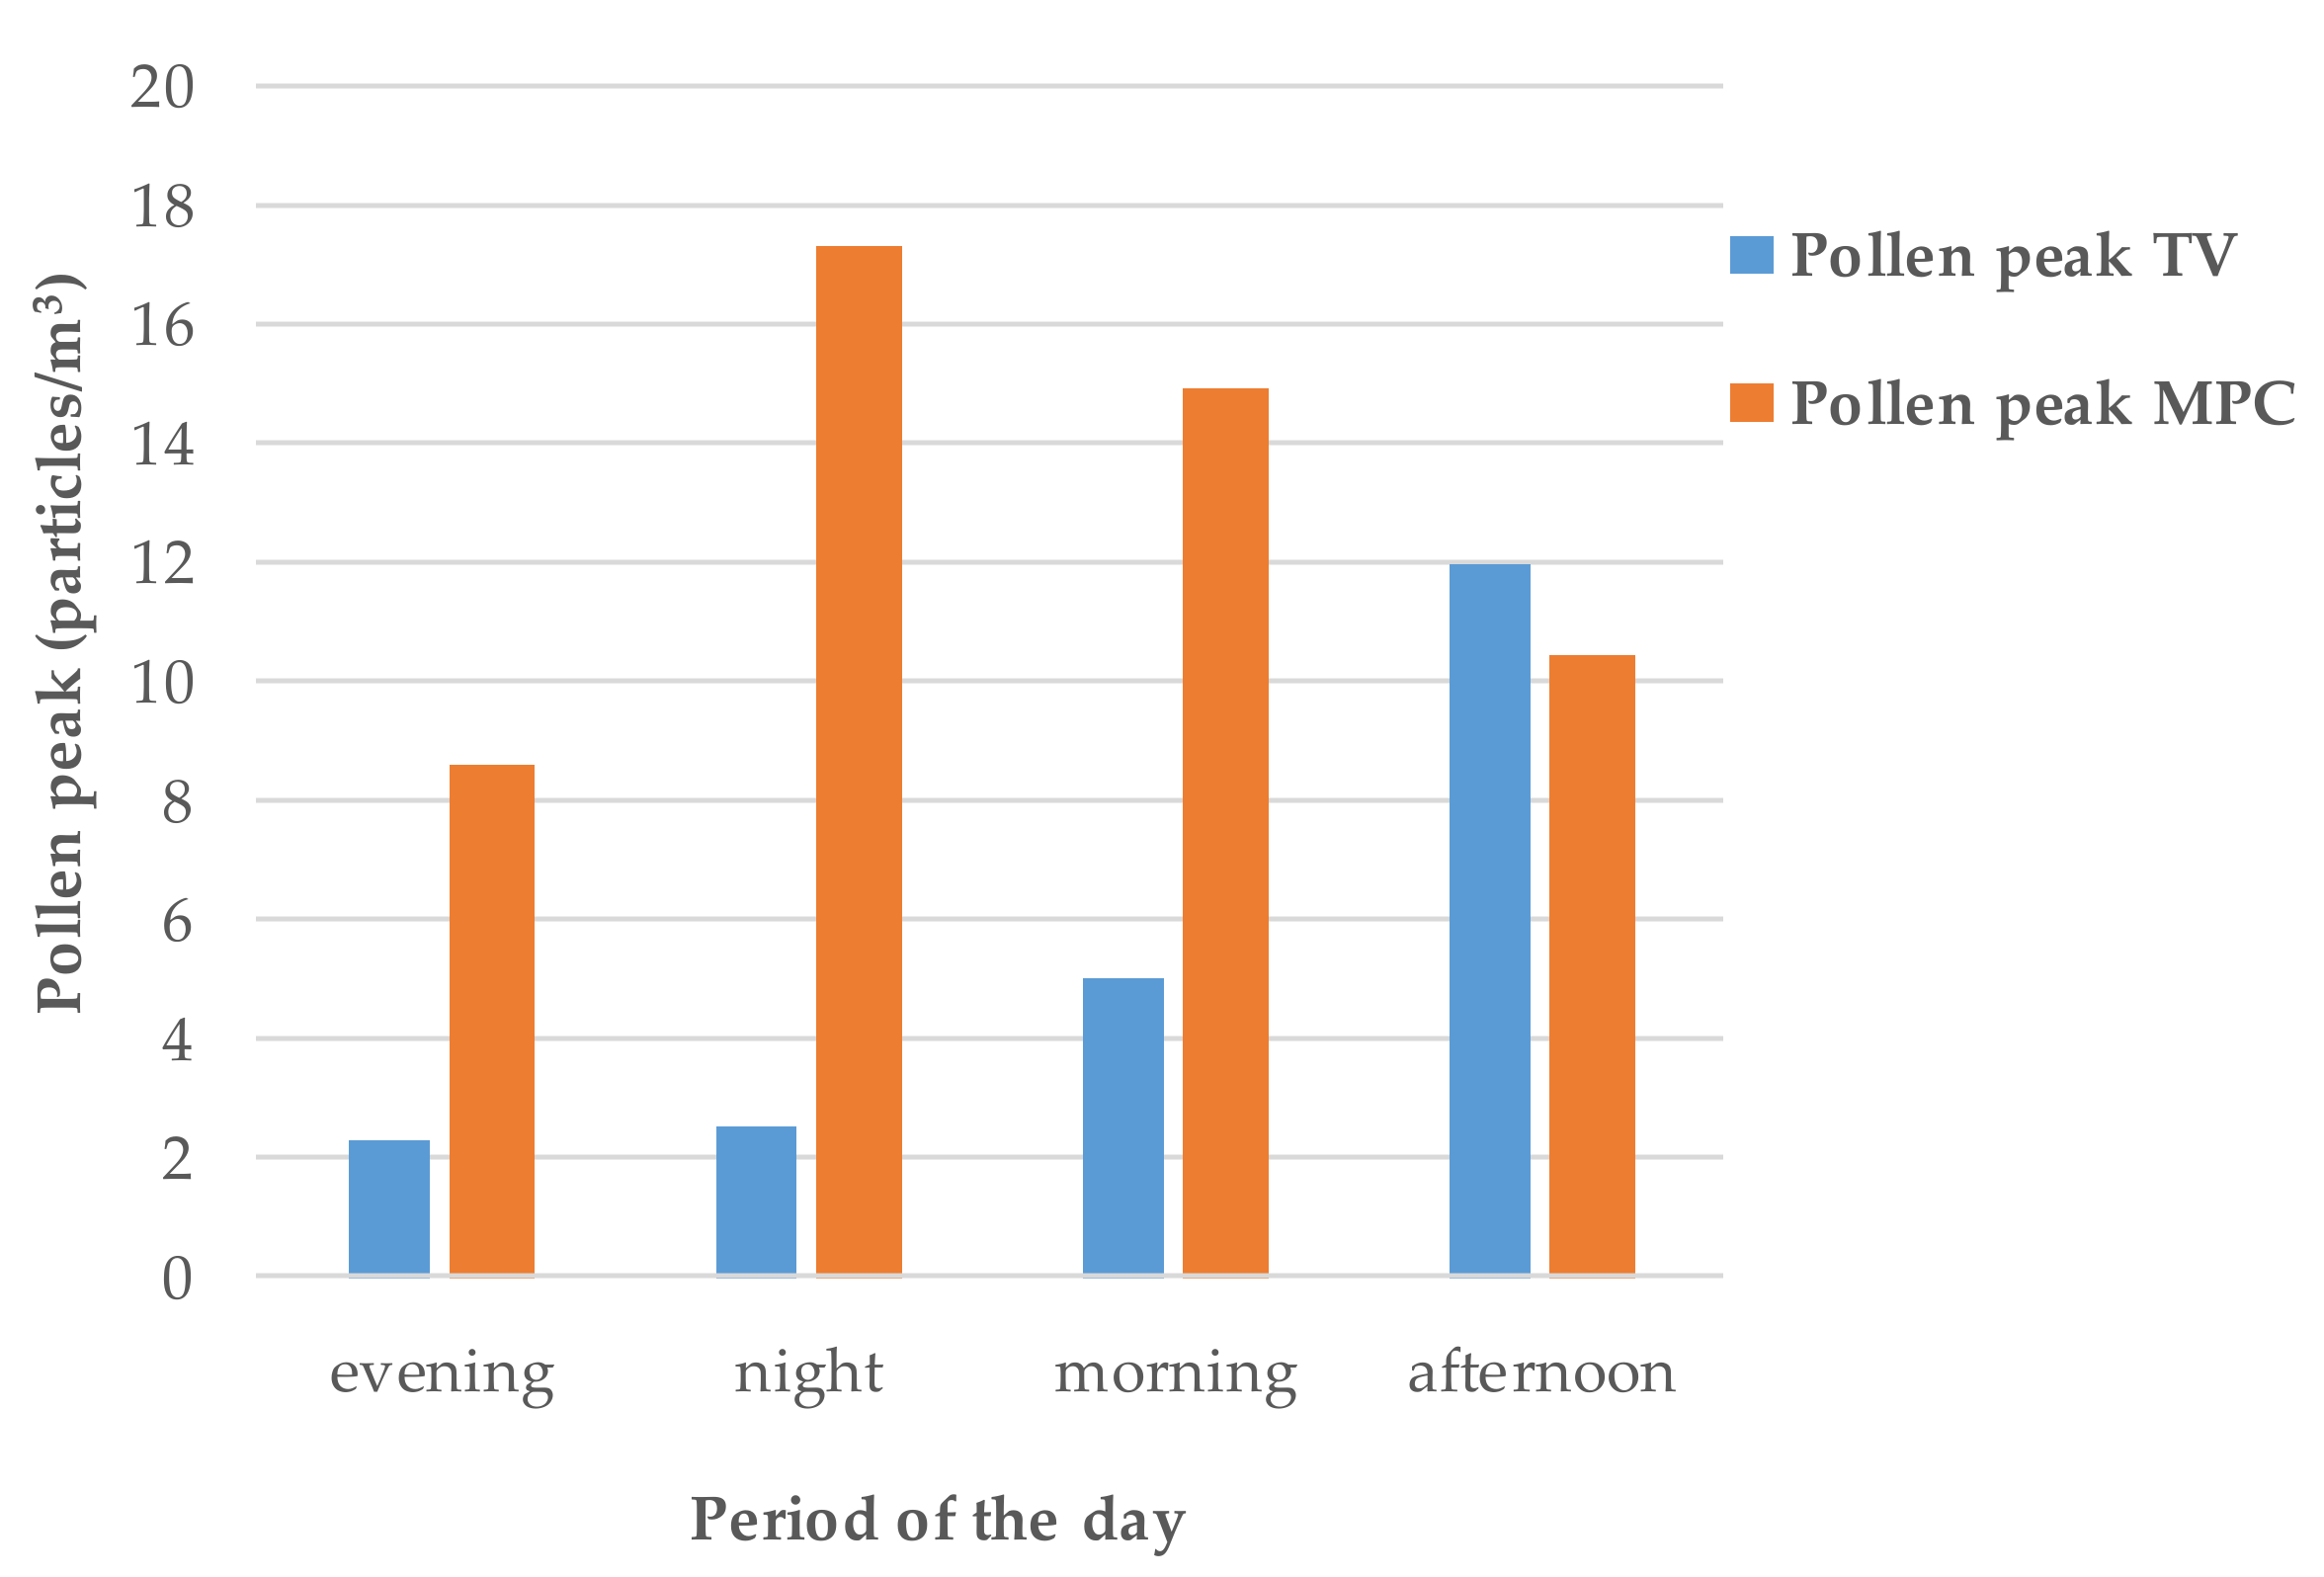
3.5. Peaks Analysis: Comparison between Outdoor Pollen in the Two Monitoring Sites

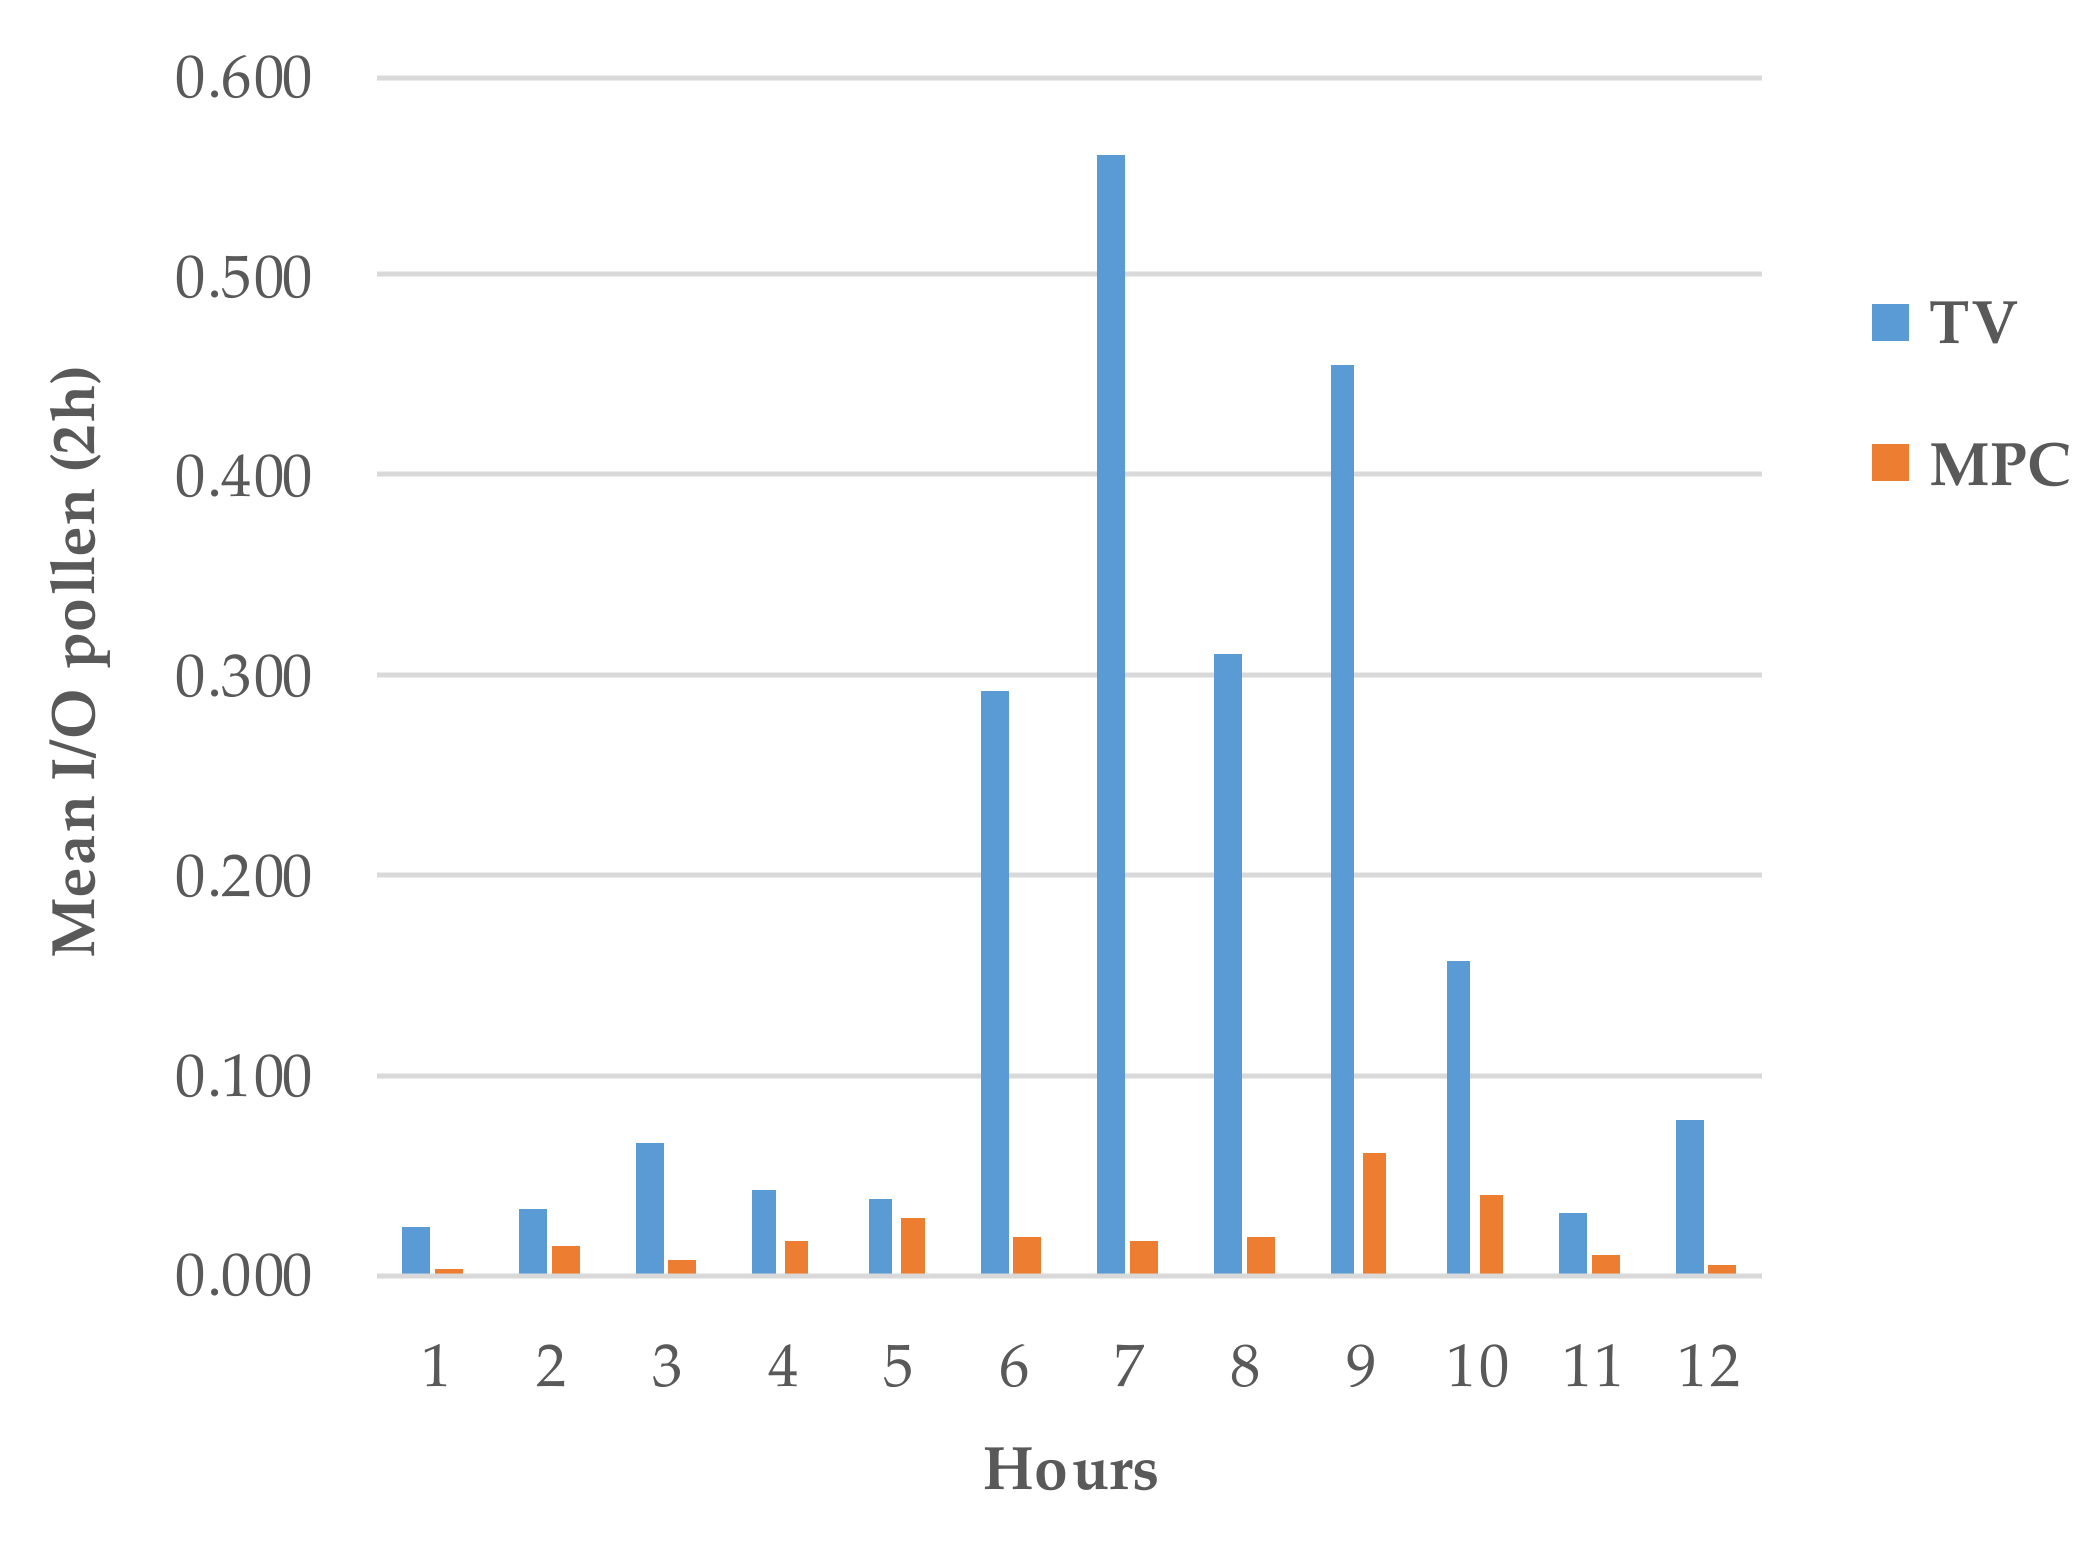
3.5.1. Two Hour Resolution Analysis

The purpose of the peak analysis is to identify the outdoor events characterized by the maximum concentration of pollen, also considering when during the day these events occur. In general, peaks can be studied at the maximum resolution (in our case 30 min); however, this temporal resolution is too high, giving rise to multiple maxima of equal intensity; thus, the 2-h and 6-h averages were considered. In the first case, this permits evaluation of the impact of pollen following the evolution during the day, whereas, in the second case, it studies which time slot of the day (morning, afternoon, evening or night) is characterized by the presence of the maximum.
As also highlighted earlier, MPC presents higher values of the average maximum concentration (18.1 particles/m3), compared to TV (9.3 particles/m3).
Figure 8 shows a very high nocturnal peak and anomalous MPC (25.9 particles/m3), completely absent in TV. Conversely, during the working hours (from 9:00 to 19:00 p.m.), the two sites show a very similar situation, with maximum equal to 19.0 particles/m3 at MPC and 10.6 particles/m3 at TV.
Considering the time of the day when peaks occur, during working activities the most critical time range is from 1:00 to 5:00 p.m. for both MPC and TV (Figure 8).
This result shows how the two sites respond differently to the solicitation related to the emission sources and to the presence of turbulence.
As reported by other papers, the peaks can occur at all hours of day and their variations depend on a complex effect of meteorological factors and distance from the pollen source [50,56]. Analysis of two hours peak resolution have shown differences in relation to areas of sampling due to pollen transport dynamics, with the highest pollen concentrations during daylight hours and maximum intradiurnal values recorded usually between 12 and 14 a.m. and early afternoon [25,26,48,51,53]. Furthermore, several authors have shown that pollen concentrations are higher in rural than in urban areas [36].

3.5.2. Six Hours Resolution Analysis

Pollen concentration maxima are also considered for the following time ranges of the day (6-h averaged data).
Figure 9 clearly shows how MPC is affected by pollen peaks during the night (Pmax (MPC) = 17.3 particles/m3) and in the morning (Pmax (MPC) = 14.9 particles/m3), while for TV peaks occur in the afternoon, with concentration value of 12.0 particles/m3, very close to the value registered in MPC (10.4 particles/m3).
As stated before, in the literature, the daily pattern distribution of pollen has been investigated and several authors have highlighted the presence of high values of pollen in the morning (06:00–12:00 a.m.) and in the afternoon (12:00–18:00 p.m.) [40,47,48].

3.6. Evaluation of I/O Ratios for TV and MPC

The I/O ratio indicates the presence of the indoor pollen we can expect in relation to the outdoor pollution. This relationship is based on the assumption of an instantaneous correspondence between external and internal pollution, but this is, especially for a short time range, not always true; thus, to obtain more reliable results, data averages (2-h, 6-h and 24-h averages) are considered.
In Figure 10, the evolution during the day of the mean I/O ratio for the two sites is shown. During the night and in the early morning (from 7:00 p.m. to 9:00 a.m.), TV and MPC exhibit similar values, slightly higher for TV (0.06 and 0.02, respectively). Instead, during the working hours (from 11:00 a.m. to 5:00 p.m.), values observed for TV and MPC are very different. TV is characterized by higher values of the ratio (mean I/O TV = 0.40) compared to MPC (mean I/O MPC = 0.03). As reported in the previous section, it should be kept in mind that, at MPC, the outdoor pollen concentrations are higher than those observed at TV.
In this regard many studies have calculated the I/O ratio in different environments and conditions in relation to pollen types and seasons, such as Betula pollen from February to April (I/O = 0.01–0.22 and I/O 0.02–0.88) [66,68], cedar pollen in early spring (I/O = 0.02–0.19) [77], and Poaceae, Quercus, Olea, Plantago, Cupressus from April to March (I/O = 0.075 and 0.917) [78].
To evaluate the differences observed in the I/O ratios for the two sites, worker habits, as highlighted in Table 6; have been taken into account; data on these habits are obtained by means of a survey form [19,20] filled in by workers, reporting any changes in occupant numbers present in the room and the indication of open windows or doors (in minutes). Data are then averaged.
While the conditions, comparing the two sites, do not vary with time during the evening and night, during the working hours MPC habits are profoundly different; doors and windows in MPC are often open, in comparison with TV (33.16% versus 1.18% for the door and 12.24% versus 4.99% for windows) showing that ventilation conditions are fundamental for the determination of the I/O ratio and that differences between the two sites are principally ascribable to habits rather than to the outdoor pollen concentrations.
In Figure 11 the I/O ratios for the different time range of the day (the 6-h averages) are shown; data are profoundly different in the afternoon while the two sites exhibit similar values for the rest of the day. If we consider the daily mean, values remain very close (I/O TV24h = 0.09 and I/O MPC24h = 0.02) and the slight difference could be attributable to the different habits and behaviors inside the rooms.

4. Conclusions

Bioaerosol exposure derived by natural and anthropogenic sources has assumed greater importance in recent years [5]. Exposure to pollen biocomponents can be responsible for several health effects and knowledge of their levels, interactions with other components, modification in relationship with the presence and absence of occupants, as well as their diffusion in several environments can be useful in improving the evaluation and management of this biological risk.
The concern in urban environments with respect to rural ones is peculiar causing different health consequences, also due to interactions with pollutants of different origins, and with urban greening that can be associated with increased exposure to pesticides and allergenic pollen, although this evidence is weaker [79,80]. On the other hand, health benefits due to the presence of urban green spaces and infrastructures have been reported, including the attenuation of indoor temperatures and heat islands, the improving of air quality, the reduction of temperature and air pollution [81] and a lack of vegetation associated with a higher risk of heat-related mortality [82]. In addition, Sustainable Development Goal 3 of the 2030 Agenda for Sustainable Development is to “ensure healthy lives and promoting well-being for all at all ages”. Moreover, another target is to reduce the number of deaths and illnesses from hazardous chemicals and pollution (https://sdgs.un.org/topics/health-and-population accessed on 3 June 2021), and goal 11 aims to “Make cities and human settlements inclusive, safe, resilient and sustainable” (https://sdgs.un.org/goals/goal11 accessed on 3 June 2021).
It is essential to improve pollen monitoring techniques and to implement automatic methods, favoring the use of personal pollen samplers and the application of molecular methodologies [83], and taking into account the role of occupants as a potential cause of indoor pollen level variation, as highlighted in previous studies [19,66,67] and in the current study, conducted in two different occupational settings. The important role of human behavior in pollen diffusion and/or retention has also been evidenced by experimental studies, where a mean of 0.93% of the initial pollen load was retained after a single wash of hands and traces of several species were found after numerous hand-wash cycles [84]. Moreover, the knowledge of pollen hourly peaks creates the opportunity to plan appropriate preventive measures and recommendations, addressed mainly to the sensitization of workers [85].
We suggest that different items should be considered in order to evaluate health effects derived by pollen exposure, such as urbanization and, conversely, vegetation areas [37,38,86], implementing predictive models in order to reduce pollen exposure and understand the complex interactions between allergens and other particles, in order to investigate the genesis of allergy and develop new preventive and therapeutic strategies [6,87], in relationship also to death due to respiratory and cardiovascular diseases [88] and to health costs [59].
The promotion of synergic and integrated approaches is needed [22], coupling data derived by individual experimental and epidemiological studies in order to optimize preventive strategies considering the most peculiar variables belonging to several occupational settings.
The knowledge of the spatial and temporal dynamics of pollen intradiurnal variations is indispensable to plan in advance and implement effective prevention strategies [26,27,35,49,53]. In this respect it is fundamental to increase the awareness of workers regarding the risk derived from exposure to allergens and to define action mechanisms, control and corrective measures such as limitation of outdoor activities, reducing the time of exposure to allergenic pollen in the peak periods, and the taking of biological vaccines and drugs before the pollen season begins. Furthermore it is important to promote the use of new techniques (i.e., GPS, remote sensing technology) to identify areas free of allergens and progressively remove allergenic taxa of ornamental plants to prevent high pollen concentrations in urban environments [27,36,38,61].

Author Contributions

Conceptualization: A.P. and M.C.D.; methodology: A.P., V.C., A.L., S.D.R., M.A.B., A.T., P.C. and M.C.D.; formal analysis: A.P., V.C., A.L., S.D.R., M.A.B., A.T., P.C. and M.C.D.; investigation: A.P., V.C., A.L., S.D.R., M.A.B., A.T., P.C. and M.C.D.; data curation: A.P., V.C., A.L., S.D.R., M.A.B., A.T., P.C. and M.C.D.; writing–original draft preparation: A.P., V.C., A.L., S.D.R., P.C. and M.C.D.; writing–review and editing: A.P., V.C., A.L., S.D.R., M.A.B., A.T., P.C. and M.C.D.; visualization: A.P., V.C., A.L., S.D.R., P.C. and M.C.D.; supervision: A.P. and M.C.D.; project administration: A.P. and M.C.D. All authors have read and agreed to the published version of the manuscript.

Funding

This research was carried out in the frame of INAIL (Italian Workers’ Compensation Authority) research.

Institutional Review Board Statement

Not applicable.

Informed Consent Statement

Not applicable.

Conflicts of Interest

The authors declare no conflict of interest.

References

  1. EAACI. White Paper on Research, Innovation and Quality Care; Agache, I., Akdis, C.A., Chivato, T., Hellings, P., Hoffman-Sommergruber, K., Jutel, M., Lauerma, A., Papadopoulos, N., Schmid-Grendelmeier, P., Schmidt-Weber, C., Eds.; European Academy of Allergy and Clinical Immunology (EAACI): Zurich, Switzerland, 2018. [Google Scholar]
  2. EAACI. Global Atlas of Asthma; Akdis, C.A., Agache, I., Eds.; European Academy of Allergy and Clinical Immunology (EAACI): Zurich, Switzerland, 2013. [Google Scholar]
  3. World Allergy Organization (WAO). White Book on Allergy: Update 2013; Pawankar, R., Canonica, G.W., Holgate, S.T., Lockey, R.F., Blaiss, M.S., Eds.; World Allergy Organization (WAO): Milwaukee, WI, USA, 2013. [Google Scholar]
  4. EAACI. Global Atlas of Allergy; Akdis, C.A., Agache, I., Eds.; European Academy of Allergy and Clinical Immunology (EAACI): Zurich, Switzerland, 2014. [Google Scholar]
  5. Xie, W.; Li, Y.; Bai, W.; Hou, J.; Ma, T.; Zeng, X.; Zhang, L.; An, T. The source and transport of bioaerosols in the air: A review. Front. Environ. Sci. Eng. 2021, 15, 44. [Google Scholar] [CrossRef]
  6. Joubert, A.I.; Geppert, M.; Johnson, L.; Mills-Goodlet, R.; Michelini, S.; Korotchenko, E.; Duschl, A.; Weiss, R.; Horejs-Höck, J.; Himly, M. Mechanisms of particles in sensitization, effector function and therapy of allergic disease. Front. Immunol. 2020, 11, 1334. [Google Scholar] [CrossRef]
  7. Idrose, N.S.; Walters, E.H.; Zhang, J.; Vicendese, D.; Newbigin, E.J.; Douglass, J.A.; Erbas, B.; Lowe, A.J.; Perret, J.L.; Lodge, C.J.; et al. Outdoor pollen-related changes in lung function and markers of airway inflammation: A systematic review and meta-analysis. Clin. Exp. Allergy 2021, 51, 636–653. [Google Scholar] [CrossRef]
  8. Hoogeveen, M.J.; van Gorp, E.C.M.; Hoogeveen, E.K. Can pollen explain the seasonality of flu-like illnesses in the Netherlands? Sci. Total Environ. 2021, 755, 143182. [Google Scholar] [CrossRef]
  9. Hoogeveen, M.J. Pollen likely seasonal factor in inhibiting flu-like epidemics. A Dutch study into the inverse relation between pollen counts, hay fever and flu-like incidence 2016–2019. Sci. Total Environ. 2020, 727, 138543. [Google Scholar] [CrossRef] [PubMed]
  10. Damialis, A.; Gilles, S.; Sofiev, M.; Sofieva, V.; Kolek, F.; Bayr, D.; Plaza, M.P.; Leier-Wirtz, V.; Kaschuba, S.; Ziska, L.H.; et al. Higher airborne pollen concentrations correlated with increased SARS-CoV-2 infection rates, as evidenced from 31 countries across the globe. Proc. Natl. Acad. Sci. USA 2021, 18, e2019034118. [Google Scholar] [CrossRef]
  11. Awaya, A.; Kuroiwa, Y. The relationship between annual airborne pollen levels and occurrence of all cancers, and lung, stomach, colorectal, pancreatic and breast cancers: A retrospective study from the National Registry Database of cancer incidence in Japan, 1975–2015. Int. J. Environ. Res. Public Health 2020, 17, 3950. [Google Scholar] [CrossRef]
  12. Rowney, F.M.; Brennan, G.L.; Skjøth, C.A.; Griffith, G.W.; McInnes, R.N.; Clewlow, Y.; Adams-Groom, B.; Barber, A.; de Vere, N.; Economou, T.; et al. Environmental DNA reveals links between abundance and composition of airborne grass pollen and respiratory health. Curr. Biol. 2021, 31, 1995–2003.e4. [Google Scholar] [CrossRef] [PubMed]
  13. Ortega-Rosas, C.I.; Meza-Figueroa, D.; Vidal-Solano, J.R.; González-Grijalva, B.; Schiavo, B. Association of airborne particulate matter with pollen, fungal spores, and allergic symptoms in an arid urbanized area. Environ. Geochem. Health 2021, 43, 1761–1782. [Google Scholar] [CrossRef] [PubMed]
  14. Sedghy, F.; Varasteh, A.R.; Saukian, M.; Moghadam, M. Interaction between air pollutants and pollen grains: The role on the rising trend in allergy. Rep. Biochem. Mol. Biol. 2018, 6, 219–224. [Google Scholar]
  15. Wimalasena, N.N.; Chang-Richards, A.; Wang, K.I.; Dirks, K.N. Housing risk factors associated with respiratory disease: A systematic review. Int. J. Environ. Res. Public Health 2021, 18, 2815. [Google Scholar] [CrossRef]
  16. Chimed-Ochir, O.; Ikaga, T.; Ando, S.; Ishimaru, T.; Kubo, T.; Murakami, S.; Fujino, Y. Effect of housing condition on quality of life. Indoor Air 2021, 31, 1029–1037. [Google Scholar] [CrossRef]
  17. Meima, M.; Kuijpers, E.; van den Berg, C.; Kruizinga, A.; van Kesteren, N.; Spaan, S. Biological Agents and Prevention of Work-Related Diseases: A Review; European Agency for Safety and Health at Work (EU-OSHA): Bilbao, Spain, 2020. [Google Scholar]
  18. Jumat, M.I.; Hayati, F.; Syed Abdul Rahim, S.S.; Saupin, S.; Awang Lukman, K.; Jeffree, M.S.; Lasimbang, H.B.; Kadir, F. Occupational lung disease: A narrative review of lung conditions from the workplace. Ann. Med. Surg. 2021, 64, 102245. [Google Scholar] [CrossRef] [PubMed]
  19. D’Ovidio, M.C.; Di Renzi, S.; Capone, P.; Pelliccioni, A. Pollen and fungal spores evaluation in relation to occupants and microclimate in indoor workplaces. Sustainability 2021, 13, 3154. [Google Scholar] [CrossRef]
  20. Pelliccioni, A.; Gherardi, M. Development and validation of an intra-calibration procedure for MiniDISCs measuring ultrafine particles in multi-spatial indoor environments. Atmos. Environ. 2021, 246, 118154. [Google Scholar] [CrossRef]
  21. Yang, S.; Bekö, G.; Wargocki, P.; Williams, J.; Licina, D. Human emissions of size-resolved fluorescent aerosol particles: Influence of personal and environmental factors. Environ. Sci. Technol. 2021, 55, 509–518. [Google Scholar] [CrossRef] [PubMed]
  22. Anenberg, S.C.; Haines, S.; Wang, E.; Nassikas, N.; Kinney, P.L. Synergistic health effects of air pollution, temperature, and pollen exposure: A systematic review of epidemiological evidence. Environ. Health 2020, 19, 130. [Google Scholar] [CrossRef] [PubMed]
  23. Grewling, Ł.; Bogawski, P.; Kostecki, Ł.; Nowak, M.; Szymańska, A.; Frątczak, A. Atmospheric exposure to the major Artemisia pollen allergen (Art v 1): Seasonality, impact of weather, and clinical implications. Sci. Total Environ. 2020, 713, 136611. [Google Scholar] [CrossRef] [PubMed]
  24. Damialis, A.; Gioulekas, D.; Lazopoulou, C.; Balafoutis, C.; Vokou, D. Transport of airborne pollen into the city of Thessaloniki: The effects of wind direction, speed and persistence. Int. J. Biometeorol. 2005, 49, 139–145. [Google Scholar] [CrossRef]
  25. Hernández-Ceballos, M.A.; García-Mozo, H.; Galán, C. Cluster analysis of intradiurnal holm oak pollen cycles at peri-urban and rural sampling sites in southwestern Spain. Int. J. Biometeorol. 2015, 59, 971–982. [Google Scholar] [CrossRef] [PubMed]
  26. Ríos, B.; Torres-Jardón, R.; Ramírez-Arriaga, E.; Martínez-Bernal, A.; Rosas, I. Diurnal variations of airborne pollen concentration and the effect of ambient temperature in three sites of Mexico City. Int. J. Biometeorol. 2016, 60, 771–787. [Google Scholar] [CrossRef]
  27. Puc, M. Influence of meteorological parameters and air pollution on hourly fluctuation of birch (Betula L.) and ash (Fraxinus L.) airborne pollen. Ann. Agric. Environ. Med. 2012, 19, 660–665. [Google Scholar]
  28. Plaza, M.P.; Alcázar, P.; Oteros, J.; Galán, C. Atmospheric pollutants and their association with olive and grass aeroallergen concentrations in Córdoba (Spain). Environ. Sci. Pollut. Res. 2020, 27, 45447–45459. [Google Scholar] [CrossRef] [PubMed]
  29. Sénéchal, H.; Visez, N.; Charpin, D.; Shahali, Y.; Peltre, G.; Biolley, J.P.; Lhuissier, F.; Couderc, R.; Yamada, O.; Malrat-Domenge, A.; et al. A review of the effects of major atmospheric pollutants on pollen grains, pollen content, and allergenicity. Sci. World J. 2015, 2015, 940243. [Google Scholar] [CrossRef] [PubMed] [Green Version]
  30. Lam, H.C.Y.; Jarvis, D.; Fuertes, E. Interactive effects of allergens and air pollution on respiratory health: A systematic review. Sci. Total Environ. 2021, 757, 143924. [Google Scholar] [CrossRef] [PubMed]
  31. Phosri, A.; Ueda, K.; Tasmin, S.; Kishikawa, R.; Hayashi, M.; Hara, K.; Uehara, Y.; Phung, V.L.H.; Yasukouchi, S.; Konishi, S.; et al. Interactive effects of specific fine particulate matter compositions and airborne pollen on frequency of clinic visits for pollinosis in Fukuoka, Japan. Environ. Res. 2017, 156, 411–419. [Google Scholar] [CrossRef]
  32. Ziemianin, M.; Waga, J.; Czarnobilska, E.; Myszkowska, D. Changes in qualitative and quantitative traits of birch (Betula pendula) pollen allergenic proteins in relation to the pollution contamination. Environ. Sci. Pollut. Res. 2021, 28, 39952–39965. [Google Scholar] [CrossRef]
  33. Zhou, S.; Wang, X.; Lu, S.; Yao, C.; Zhang, L.; Rao, L.; Liu, X.; Zhang, W.; Li, S.; Wang, W.; et al. Characterization of allergenicity of Platanus pollen allergen a 3 (Pla a 3) after exposure to NO2 and O3. Environ. Pollut. 2021, 278, 116913. [Google Scholar] [CrossRef]
  34. Cariñanos, P.; Foyo-Moreno, I.; Alados, I.; Guerrero-Rascado, J.L.; Ruiz-Peñuela, S.; Titos, G.; Cazorla, A.; Alados-Arboledas, L.; Díaz de la Guardia, C. Bioaerosols in urban environments: Trends and interactions with pollutants and meteorological variables based on quasi-climatological series. J. Environ. Manag. 2021, 282, 111963. [Google Scholar] [CrossRef]
  35. Hugg, T.T.; Hjort, J.; Antikainen, H.; Rusanen, J.; Tuokila, M.; Korkonen, S.; Weckstrom, J.; Jaakkola, M.S.; Jaakkola, J.J.K. Urbanity as a determinant of exposure to grass pollen in Helsinki Metropolitan area, Finland. PLoS ONE 2017, 12, e0186348. [Google Scholar] [CrossRef]
  36. Bosch-Cano, F.; Bernard, N.; Sudre, B.; Gillet, F.; Thibaudon, M.; Richard, H.; Badot, P.M.; Ruffaldi, P. Human exposure to allergenic pollens: A comparison between urban and rural areas. Environ. Res. 2011, 111, 619–625. [Google Scholar] [CrossRef] [Green Version]
  37. Vrinceanu, D.; Berghi, O.N.; Cergan, R.; Dumitru, M.; Ciuluvica, R.C.; Giurcaneanu, C.; Neagos, A. Urban allergy review: Allergic rhinitis and asthma with plane tree sensitization (Review). Exp. Ther. Med. 2021, 21, 275. [Google Scholar] [CrossRef]
  38. Maya-Manzano, J.M.; Sadyś, M.; Tormo-Molina, R.; Fernández-Rodríguez, S.; Oteros, J.; Silva-Palacios, I.; Gonzalo-Garijo, A. Relationships between airborne pollen grains, wind direction and land cover using GIS and circular statistics. Sci. Total Environ. 2017, 584–585, 603–613. [Google Scholar] [CrossRef]
  39. Glick, S.; Gehrig, R.; Eeftens, M. Multi-decade changes in pollen season onset, duration, and intensity: A concern for public health? Sci. Total Environ. 2021, 781, 146382. [Google Scholar] [CrossRef] [PubMed]
  40. Uguz, U.; Guvensen, A.; Tort, N.S. Annual and intradiurnal variation of dominant airborne pollen and the effects of meteorological factors in Cesme (Izmir, Turkey). Environ. Monit. Assess. 2017, 189, 530. [Google Scholar] [CrossRef] [PubMed]
  41. Ziska, L.H.; Makra, L.; Harry, S.K.; Bruffaerts, N.; Hendrickx, M.; Coates, F.; Saarto, A.; Thibaudon, M.; Oliver, G.; Damialis, A.; et al. Temperature-related changes in airborne allergenic pollen abundance and seasonality across the northern hemisphere: A retrospective data analysis. Lancet Planet Health 2019, 3, e124–e131. [Google Scholar] [CrossRef] [Green Version]
  42. Lipiec, A.; Rapiejko, P.; Furmańczyk, K.; Jurkiewicz, D. The dynamics of pollen seasons of the most allergenic plants-15-year observations in Warsaw. Otolaryngol. Pol. 2018, 72, 43–52. [Google Scholar] [CrossRef]
  43. Zhang, Y.; Bielory, L.; Mi, Z.; Cai, T.; Robock, A.; Georgopoulos, P. Allergenic pollen season variations in the past two decades under changing climate in the United States. Glob. Chang. Biol. 2015, 21, 1581–1589. [Google Scholar] [CrossRef] [PubMed] [Green Version]
  44. De Roos, A.J.; Kenyon, C.C.; Zhao, Y.; Moore, K.; Melly, S.; Hubbard, R.A.; Henrickson, S.E.; Forrest, C.B.; Diez Roux, A.V.; Maltenfort, M.; et al. Ambient daily pollen levels in association with asthma exacerbation among children in Philadelphia, Pennsylvania. Environ. Int. 2020, 145, 106138. [Google Scholar] [CrossRef]
  45. Ouyang, Y.; Yin, Z.; Li, Y.; Fan, E.; Zhang, L. Associations among air pollutants, grass pollens, and daily number of grass pollen allergen-positive patients: A longitudinal study from 2012 to 2016. Int. Forum Allergy Rhinol. 2019, 9, 1297–1303. [Google Scholar] [CrossRef] [PubMed]
  46. Zewdie, G.K.; Lary, D.J.; Liu, X.; Wu, D.; Levetin, E. Estimating the daily pollen concentration in the atmosphere using machine learning and NEXRAD weather radar data. Environ. Monit. Assess. 2019, 191, 418. [Google Scholar] [CrossRef] [PubMed]
  47. Tosunoglu, A.; Bicakci, A. Seasonal and intradiurnal variation of airborne pollen concentrations in Bodrum, SW Turkey. Environ. Monit. Assess. 2015, 187, 167. [Google Scholar] [CrossRef] [PubMed]
  48. Pérez-Badia, R.; Vaquero, C.; Sardinero, S.; Galán, C.; García-Mozo, H. Intradiurnal variations of allergenic tree pollen in the atmosphere of Toledo (central Spain). Ann. Agric. Environ. Med. 2010, 17, 269–275. [Google Scholar]
  49. Ribeiro, H.; Oliveira, M.; Abreu, I. Intradiurnal variation of allergenic pollen in the city of Porto (Portugal). Aerobiologia 2008, 24, 173–177. [Google Scholar] [CrossRef]
  50. Pérez, C.F.; Gardiol, J.M.; Paez, M.M. Comparison of diurnal variation of airborne pollen in Mar del Plata (Argentina). Grana 2003, 42, 161–167. [Google Scholar] [CrossRef] [Green Version]
  51. Trigo, M.D.M.; Recio, M.; Toro, F.J.; Cabezudo, B. Intradiurnal fluctuations in airborne pollen in Málaga (S. Spain): A quantitative method. Grana 1997, 36, 39–43. [Google Scholar] [CrossRef] [Green Version]
  52. Galán, C.; Cuevas, J.; Infante, F.; Domínguez, E. Seasonal and diurnal variation of pollen from Gramineae in the atmosphere of Cordoba Spain. Allergol. Immunopathol. 1989, 17, 245–249. [Google Scholar]
  53. Fernández-Rodríguez, S.; Maya-Manzano, J.M.; Colín, A.M.; Pecero-Casimiro, R.; Buters, J.; Oteros, J. Understanding hourly patterns of Olea pollen concentrations as tool for the environmental impact assessment. Sci. Total Environ. 2020, 736, 139363. [Google Scholar] [CrossRef]
  54. Munoz Rodriguez, A.F.; Palacios, I.; Molina, R. Influence of meteorological parameters in hourly patterns of grass (Poaceae) pollen concentrations. Ann. Agric. Environ. Med. 2010, 17, 87–100. [Google Scholar] [PubMed]
  55. Lipiec, A.; Puc, M.; Kruczek, A. Exposure to pollen allergens in allergic rhinitis expressed by diurnal variation of airborne tree pollen in urban and rural area. Otolaryngol. Pol. 2019, 74, 1–6. [Google Scholar] [CrossRef] [PubMed]
  56. Alcázar, P.; Ørby, P.V.; Oteros, J.; Skjøth, C.; Hertel, O.; Galán, C. Cluster analysis of variations in the diurnal pattern of grass pollen concentrations in Northern Europe (Copenhagen) and Southern Europe (Córdoba). Aerobiologia 2019, 35, 269–281. [Google Scholar] [CrossRef]
  57. Kasprzyk, I. Comparative study of seasonal and intradiurnal variation of airborne herbaceous pollen in urban and rural areas. Aerobiologia 2006, 22, 185–195. [Google Scholar] [CrossRef]
  58. Norris-Hill, J. The diurnal variation of Poaceae pollen concentrations in a rural area. Grana 1999, 38, 301–305. [Google Scholar] [CrossRef]
  59. Bagheri, O.; Moeltner, K.; Yang, W. Respiratory illness, hospital visits, and health costs: Is it air pollution or pollen? Environ. Res. 2020, 187, 109572. [Google Scholar] [CrossRef]
  60. Crystal-Peters, J.; Crown, W.H.; Goetzel, R.Z.; Schutt, D.C. The cost of productivity losses associated with allergic rhinitis. Am. J. Manag. Care 2000, 6, 373–378. [Google Scholar] [PubMed]
  61. D’Ovidio, M.C.; Annesi-Maesano, I.; D’Amato, G.; Cecchi, L. Climate change and occupational allergies: An overview on biological pollution, exposure and prevention. Ann. Ist. Super. Sanità 2016, 52, 406–414. [Google Scholar] [CrossRef] [PubMed]
  62. Lancia, A.; Capone, P.; Vonesch, N.; Pelliccioni, A.; Grandi, C.; Magri, D.; D’Ovidio, M.C. Research progress on aerobiology in the last 30 years: A focus on methodology and occupational health. Sustainability 2021, 13, 4337. [Google Scholar] [CrossRef]
  63. Damialis, A.; Konstantinou, G.N. Cereal pollen sensitisation in pollen allergic patients: To treat or not to treat? Eur. Ann. Allergy Clin. Immunol. 2011, 43, 36–44. [Google Scholar] [PubMed]
  64. Victorio-Puche, L.; Somoza, M.L.; Martin-Pedraza, L.; Fernandez-Caldas, E.; Abel Fernandez, E.; Moran, M.; Subiza, J.L.; Lopez-Sanchez, J.D.; Villalba, M.; Blanca, M. Prunus persica 9, a new occupational allergen from peach tree pollen involved in rhinitis and asthma. Occup. Environ. Med. 2021, 78, 142–144. [Google Scholar] [CrossRef] [PubMed]
  65. Hu, H.; Xue, M.; Wei, N.; Zheng, P.; Wu, G.; An, N.; Huang, H.; Sun, B. Sensitisation of severe asthma in different occupations: A multicentre study in China. Clin. Respir. J. 2021, 15, 177–186. [Google Scholar] [CrossRef]
  66. Menzel, A.; Matiu, M.; Michaelis, R.; Jochner, S. Indoor birch pollen concentrations differ with ventilation scheme, room location, and meteorological factors. Indoor Air 2017, 27, 539–550. [Google Scholar] [CrossRef]
  67. Jantunen, J.; Saarinen, K. Intrusion of airborne pollen through open windows and doors. Aerobiologia 2009, 25, 193–201. [Google Scholar] [CrossRef]
  68. Hugg, T.; Rantio-Lehtimäki, A. Indoor and outdoor pollen concentrations in private and public spaces during the Betula pollen season. Aerobiologia 2007, 23, 119–129. [Google Scholar] [CrossRef]
  69. Ricotta, C.; Celesti-Grapow, L.; Avena, G.; Blasi, C. Topological analysis of the spatial distribution of plant species richness across the city of Rome (Italy) with the echelon approach. Landsc. Urban Plan. 2001, 57, 69–76. [Google Scholar] [CrossRef]
  70. Blasi, C. Fitoclimatologia del Lazio; Università La Sapienza, Regione Lazio, Assessorato Agricoltura-Foreste, Caccia e Pesca: Rome, Italy, 1994. [Google Scholar]
  71. Celesti-Grapow, L.; Capotorti, G.; Del Vico, E.; Lattanzi, E.; Tilia, A.; Blasi, C. The vascular flora of Rome. Plant Biosyst. 2013, 147, 1059–1087. [Google Scholar] [CrossRef] [Green Version]
  72. Hirst, J.M. An automatic volumetric spore trap. Ann. Appl. Biol. 1952, 39, 259–265. [Google Scholar] [CrossRef]
  73. UNI 11108:2004. Air Quality. Method for Sampling and Counting of Airborne Pollen Grains and Fungal Spores; UNI, Italian National Unification: Milano, Italy, 2004; p. 8. [Google Scholar]
  74. UNI CEN/TS 16868:2015. Ambient Air—Sampling and Analysis of Airborne Pollen Grains and Fungal Spores for Allergy Networks—Volumetric Hirst Method; UNI, Italian National Unification: Milano, Italy, 2015. [Google Scholar]
  75. Mandrioli, P.; Comtois, P.; Domınguez-Vilches, E.; Galan-Soldevilla, C.; Syzdek, L.D.; Isard, S.A. Sampling: Principles and techniques. In Methods in Aerobiology; Mandrioli, P., Comtois, P., Levizzani, V., Eds.; Pitagora Editrice: Bologna, Italy, 1998. [Google Scholar]
  76. Pelliccioni, A.; Monti, P.; Cattani, G.; Boccuni, F.; Cacciani, M.; Canepari, S.; Capone, P.; Catrambone, M.; Cusano, M.; D’Ovidio, M.C.; et al. Integrated evaluation of indoor particulate exposure: The VIEPI project. Sustainability 2020, 12, 9758. [Google Scholar] [CrossRef]
  77. Yamamoto, N.; Matsuki, Y.; Yokoyama, H.; Matsuki, H. Relationships among indoor, outdoor, and personal airborne Japanese cedar pollen counts. PLoS ONE 2015, 10, e0131710. [Google Scholar] [CrossRef] [PubMed]
  78. Tormo-Molina, R.; Gonzalo-Garijo, Á.; Silva-Palacios, I.; Fernández-Rodríguez, S. Seasonal and spatial variations of indoor pollen in a hospital. Int. J. Environ. Res. Public Health 2009, 6, 3169–3178. [Google Scholar] [CrossRef] [PubMed] [Green Version]
  79. WHO Regional Office for Europe. Urban Green Spaces and Health: A Review of the Evidence; WHO Regional Office for Europe: Copenhagen, Denmark, 2016; Available online: https://www.euro.who.int/en/health-topics/environment-and-health/urban-health/publications/2016/urban-green-spaces-and-health-a-review-of-evidence-2016 (accessed on 3 June 2021).
  80. WHO Regional Office for Europe. Heat and Health in the WHO European Region: Updated Evidence for Effective Prevention; WHO Regional Office for Europe: Copenhagen, Denmark, 2021. [Google Scholar]
  81. Nieuwenhuijsen, M.J. Green infrastructure and health. Annu. Rev. Public Health 2021, 42, 317–328. [Google Scholar] [CrossRef]
  82. Pascal, M.; Goria, S.; Wagner, V.; Sabastia, M.; Guillet, A.; Cordeau, E.; Mauclair, C.; Host, S. Greening is a promising but likely insufficient adaptation strategy to limit the health impacts of extreme heat. Environ. Int. 2021, 151, 106441. [Google Scholar] [CrossRef]
  83. Suanno, C.; Aloisi, I.; Fernàndez-Gonzàlez, D.; Del Duca, S. Monitoring techniques for pollen allergy risk assessment. Environ. Res. 2021, 197, 111109. [Google Scholar] [CrossRef]
  84. Hunt, C.O.; Morawska, Z. Are your hands clean? Pollen retention on the human hand after washing. Rev. Palaeobot. Palynol. 2020, 280, 104278. [Google Scholar] [CrossRef]
  85. Roubelat, S.; Besancenot, J.-P.; Bley, D.; Thibaudon, M.; Charpin, D. Inventory of the recommendations for patients with pollen allergies and evaluation of their scientific relevance. Int. Arch. Allergy Immunol. 2020, 181, 839–852. [Google Scholar] [CrossRef] [PubMed]
  86. Donovan, G.H.; Gatziolis, D.; Longley, I.; Douwes, J. Vegetation diversity protects against childhood asthma: Results from a large New Zealand birth cohort. Nat. Plants 2018, 4, 358–364. [Google Scholar] [CrossRef] [PubMed]
  87. Suanno, C.; Aloisi, I.; Fernández-González, D.; Del Duca, S. Pollen forecasting and its relevance in pollen allergen avoidance. Environ. Res. 2021, 21, 111150. [Google Scholar] [CrossRef]
  88. Jaakkola, J.J.K.; Kiihamäki, S.P.; Näyhä, S.; Ryti, N.R.I.; Hugg, T.T.; Jaakkola, M.S. Airborne pollen concentrations and daily mortality from respiratory and cardiovascular causes. Eur. J. Public Health 2021, ckab034. [Google Scholar] [CrossRef] [PubMed]
Figure 1. Maps of the buildings (in black) present in a 2 km radius around the pollen samplers in TV (a) and MPC (b). In the maps, the concentric circumferences of 1 km, 0.5 km, 0.25 km and 0.1 km radius and the octants corresponding to cardinal directions are also shown.
Sustainability 13 08776 g001
Figure 2. Maps of the artificial surfaces (in grey) and green areas (in green) present in a 2 km radius around the pollen samplers in TV (a) and MPC (b). In the maps, the concentric circumferences of 1 km, 0.5 km, 0.25 km and 0.1 km radius and the octants corresponding to cardinal directions are also shown.
Sustainability 13 08776 g002
Figure 3. The average values of λp as function of the distance (a) and the wind direction (b), for TV and MPC.
Sustainability 13 08776 g003
Figure 4. The average values of Vi as function of distance (a) and the wind direction (b), for TV and MPC.
Sustainability 13 08776 g004
Figure 5. Pollen concentration at TV and MPC as function of measured wind direction.
Sustainability 13 08776 g005
Figure 6. Daily trend of the outdoor pollen concentration for TV (a) and MPC (b) in NWDs and WDs.
Sustainability 13 08776 g006
Figure 7. Daily trend of the indoor pollen concentration for TV (a) and MPC (b) in NWDs and WDs.
Sustainability 13 08776 g007
Figure 8. Mean pollen peak during the day in TV and MPC.
Sustainability 13 08776 g008
Figure 9. Mean pollen peak during the daily time ranges (evening, night, morning and afternoon) in TV and MPC.
Sustainability 13 08776 g009
Figure 10. Daily evolution of the mean I/O ratio (two hours average) in TV and MPC.
Sustainability 13 08776 g010
Figure 11. Mean I/O ratio (6-h average) during the daily time ranges (evening, night, morning and afternoon) in TV and MPC.
Sustainability 13 08776 g011
Table 1. Average pollen concentration, for the indoor and the outdoor components in the two study sites (TV and MPC). Mean values and standard deviation are calculated over the study period from observations collected at 30-min time resolutions.
TVMPC
IndoorOutdoorIndoorOutdoor
Pollen (particles/m3)0.14 ± 0.533.19 ± 4.690.10 ± 0.495.91 ± 9.30
Table 2. Distance classes and the relative maximum and minimum distance from the center of the annular area covered.
Dmin (m)Dmax (m)
D1000100
D250100250
D500250500
D10005001000
D200010002000
Table 3. Values of λp as function of the distance and the sector of provenance for TV and MPC.
TV (λp)MPC (λp)
D100D250D500D1000D2000D100D250D500D1000D2000
N0.600.170.260.260.160.310.050.050.030.01
NE0.610.150.130.140.140.710.060.040.010
E0.5800.010.040.0600.0900.020.03
SE0.650.130.020.150.050.050.030.020.160.09
S0.640.180.120.240.140.080.030.060.080.03
SW0.380.010.200.170.110.060.010.030.030.04
W0.13000.090.14000.020.020.05
NW0.180.030.180.190.200000.010.01
Average0.470.080.110.160.120.150.030.020.040.03
Table 4. Values of Vi as function of the distance and the sector of provenance for TV and MPC.
TV (Vi)MPC (Vi)
D100D250D500D1000D2000D100D250D500D1000D2000
N000030.55040.4755.0272.0795.52
NE00.138.2526.9531.9063.0577.3893.3197.21
E8.2477.5560.1564.7931.32029.8381.8484.5782.12
SE056.321.7728.2446.528.4276.1994.5345.9345.33
S015.320.2214.0519.9528.710059.3842.2976.87
SW038.61.3215.8425.790.8592.1387.7292.175.42
W011.6643.0815.8622.89073.1554.693.5368.27
NW0017.8416.4119.32089.2993.6696.6391.42
Average1.0324.9516.5822.7728.534.7570.5179.2777.5579.02
Table 5. Mean values of the meteorological variables during the measurement campaign as function of the sector of provenience (wind direction).
NNEESESSWWNW
WD142.345.293.6132.2180.3224.0264.2317.7
WS1.51.11.91.21.40.80.70.8
T10.89.57.87.610.910.411.911.9
Rh68.378.483.587.184.384.767.861.3
RS251.6171.244.656.770.082.1195.4329.2
Rain0000.10.10.200
Table 6. Mean worker behavior (number of workers, opening time of doors and windows) for TV and MPC in two different time ranges (night and early morning, afternoon).
OccupantsOpening DoorOpening Window
TVMPCTVMPCTVMPC
19:00–09:000.030.030.152.810.001.11
11:00–17:000.480.391.1833.164.9912.24
Publisher’s Note: MDPI stays neutral with regard to jurisdictional claims in published maps and institutional affiliations.

