Article

Fuel Effects on Regulated and Unregulated Emissions from Two Commercial Euro V and Euro VI Road Transport Vehicles

1
Shell Global Solutions (UK), Concawe, London SE1 7NA, UK
2
VTT Technical Research Centre of Finland, 02150 Espoo, Finland
3
PHS Consulting Ltd., Cheshire CH3 8NL, UK
4
ExxonMobil Research and Engineering, Concawe, Annandale, NJ 08801, USA
5
Concawe, 1160 Brussels, Belgium
*
Author to whom correspondence should be addressed.
Sustainability 2021, 13(14), 7985; https://doi.org/10.3390/su13147985
Submission received: 8 June 2021 / Revised: 5 July 2021 / Accepted: 8 July 2021 / Published: 17 July 2021
(This article belongs to the Special Issue Emissions from Road Transportation and Vehicle Management)

Abstract

:
Substantial advances in European road vehicle emissions have been achieved over the past three decades driven by strengthening revisions in emissions legislation and enabled by advances in fuel, vehicle engine and emissions control technologies. As both vehicle technology and emissions legislation in Europe continue to evolve, Concawe has conducted a study to examine the effects that fuels can have on emissions, in this case from commercial road vehicles. A bus certified to Euro VI emissions level and a delivery truck certified to Euro V emissions level have been tested on a chassis-dyno over the World Harmonized Vehicle Cycle (WHVC) and Transport for London Urban Inter-Peak (TfL UIP) test cycles with six fuels: an EN590-compliant B5 (petroleum diesel containing 5% biodiesel by volume), a bioderived paraffinic diesel, a 50:50 blend of the aforementioned fuels, a low-density petroleum-derived B5, a B30 and the same B30 additized with a high dose of cetane number improver (CNI). Results show reduced NOx reductant (AdBlue) consumption with paraffinic diesel in the Euro VI bus due to lower engine-out NOx emissions. More surprisingly, higher hydrocarbon emissions were observed with some low-density hydrocarbon fuels in the Euro V truck. Compared to B5, B30 with and without CNI did not affect tank-to-wheel (TTW) CO2, volumetric fuel consumption or NOx by statistically significant margins. When considered with the findings of a complementary light-duty study, it is apparent that low-density diesel fuels could offer overall benefits to both emissions affecting local air quality and to greenhouse gas emissions on a TTW basis. The addition of higher fatty acid methyl ester (FAME) levels to fuels can be used to increase renewable fuel contribution resulting in no penalty in NOx emissions from modern technology vehicles. Compatibility of these fuels with the existing vehicle fleet would require further specific consideration. Outside of fuel properties considerations, Euro VI aftertreatment systems can increase N2O emissions at the tailpipe through chemical reactions in the catalyst. This can translate into about 10% contribution of N2O emissions to the overall GHG emissions of the vehicle.

1. Introduction

The EN590 specification [1] is used to control automotive diesel fuel quality in Europe to ensure the reliable operation of road vehicles. The current specification is the culmination of three decades of development driven by and enabling the introduction of sophisticated emissions aftertreatment devices such as diesel oxidation catalyst (DOC), diesel particulate filters (DPF), lean NOx traps (LNT) and selective catalytic reduction catalysts (SCR) to achieve low emissions performance of the incumbent vehicles. Going forward, fuels used in diesel engines are likely to develop further and diversify to help meet future targets for carbon dioxide (CO2) and other emissions associated with road vehicle use.
The current EN590 specification allows up to 7% v/v fatty acid methyl ester by volume (FAME), meeting the EN14214 specification to be blended into conventional petroleum diesel fuel. In addition, EN16709 provides a standard for B20 and B30 (petroleum diesel containing 20% and 30% biodiesel) fuels for use in captive fleets. It is anticipated that higher renewables levels will be needed in order to meet the future renewable energy targets mandated by the recast renewable energy directive (RED2), while the use of biofuels made from food and feed crops will be capped [2].
In this study, two fuels containing 30% v/v FAME (B30, one including cetane number improver, (CNI)) were tested and their results compared to a fuel containing 5% v/v FAME (B5). This was in order to determine the impact of using FAME at levels much higher than currently permissible in EN590 compared with those typical of current European diesel fuels. The addition of FAME into diesel fuel is well known to decrease the engine-out particulate matter (PM) emissions of diesel engines [3,4,5]. This effect is largely attributed to the presence of oxygenated compounds in the fuel which increases the local oxygen concentration in the rich area of the diesel flame, facilitating the oxidation of soot [6] and diluting aromatic hydrocarbons and especially polycyclic aromatic hydrocarbons in the diesel fuel with an aromatics-free blending component where the FAME is splash-blended. Previous Concawe work confirmed that the addition of FAME in diesel fuel decreases the engine-out PM emissions and noted a reduction in fuel consumption penalty associated with reducing the frequency of DPF regenerations [7]. Another study showed that the vehicles’ volumetric consumption increased due to the reduced energy content of FAME/diesel blends, which could not be compensated for through better engine efficiency on the oxygenated fuels [8]. In general, previous studies have shown that increasing FAME reduces engine-out hydrocarbon (HC) and carbon monoxide (CO) and increases oxides of nitrogen (NOx) emissions to a lesser degree, all this being consistent with the presence of oxygenated compounds within the diffusion flame. However, it should be remembered that these results are from a collection of published studies that predominantly focused on heavy-duty engines (and primarily on US market engines) that were not equipped with NOx exhaust aftertreatment and were tested only over hot-start test cycles. It may not be reasonable to assume that these results will be representative of modern European vehicles that are equipped with a variety of aftertreatment technologies and are certified over a cold-start test cycle. There are considerably fewer publications related to modern light-duty diesel vehicles and the results that have been reported are generally less consistent than those from the heavy-duty tests. One study on light-duty engines [9] demonstrated that vehicle effects became stronger than fuel effects when emissions started to become very low. A later Concawe study examined the consumption and emissions effects of 10% FAME vs. FAME-free fuel on emissions and consumption in Euro 4, 5 and 6 vehicles. This showed that increasing FAME content had the expected effect of increasing volumetric fuel consumption whereas it had no consistent negative or positive effects on emissions and NOx penalties and PM benefits were only observed in the Euro 4 (non-DPF) vehicle [10].
Studies sponsored by California Air Resources Board (CARB) showed that use of more paraffinic fuels as blending components and addition of cetane number improvers could mitigate the NOx penalties experienced when using high FAME content fuels in US heavy-duty (HD) engines and trucks manufactured between 1998 and 2010 and subsequently some blends and fuel additives were certified for use in California for NOx mitigation in high FAME content fuels [11].
There are a number of EN590 specification properties defined to be environmental parameters according to the European Fuel Quality Directive [12] and previous regulations. The aforementioned Concawe study [10] considered other fuel properties as well as FAME: density, polycyclic aromatic hydrocarbons (PAH), cetane number. It showed that in diesel cars certified to Euro 4, 5 and 6 standards, increasing density above the current EN590 specification limit increased tailpipe CO2 emissions in all cases, with varied effects observed for other regulated emissions. Emissions effects of cetane number were inconsistent except for HC and CO benefits in New European Driving Cycle (NEDC), and not Worldwide harmonized Light-duty Test Cycle (WLTC); for all vehicles indicating cetane number (CN), effects are vehicle- and test-cycle-dependent. Effects of higher PAH levels on tailpipe emissions were largely insignificant and a PM increase observed in the non-DPF car was not observed in the Euro 5 or Euro 6 vehicles. Overall, the effect of engine emission controls, vehicle calibration and test cycle clearly dominated fuel effects on emissions and efficiency.
Paraffinic diesel fuels (PDFs) can be derived from natural gas (gas-to-liquids, GTL), biological sources (such as so-called hydrotreated vegetable oil, (HVO), biomass-to-liquids, (BTL)) and power-to-liquids, (PTL). As some PDFs have become more abundant in the market (GTL, HVO), a European specification describing the quality for PDFs for use in automotive applications, EN15940, has been developed in recent years [13]. PDFs have been proven to have beneficial effects on vehicle tailpipe emissions, including PM, NOx, CO and HC [14,15], although some studies have shown that PN can be increased [16]. As well as the tailpipe or “tank-to-wheel” (TTW) benefits, these fuels can provide overall lifecycle CO2 benefits when derived from renewable sources [17].
As both vehicle technology and emissions legislation in Europe continue to evolve, Concawe conducted a study (in 2019) to examine the opportunities that fuels can provide to further reduce emissions from light-duty diesel passenger cars [18]. Three European specification diesel cars spanning Euro 5, Euro 6b and Euro 6d-TEMP emissions certification levels were tested over the cold-start WLTC with six fuels: EN590-compliant B5, bioderived paraffinic diesel (HVO), a 50:50 blend of the aforementioned fuels, low-density petroleum-derived B5, B30 and B30 including a high dose of cetane number improver. It was concluded that low-density hydrocarbon fuels can offer benefits in TTW CO2 and other GHG emissions and emissions impacting local air quality. Although paraffinic diesel fuels offer emissions benefits when used as a neat fuel, using paraffinic diesel as a blend component can give disproportionally large benefits in these emissions. This bodes well for cases where PDFs are in short supply and in the future when HVO, BTL and PTL fuels become more widely available. Advanced exhaust aftertreatment was found to suppress the negative NOx effects associated with the use of high FAME content fuels, opening the door to the use of such fuels in markets dominated by advanced vehicles, thereby enabling increased use of such renewables without local air quality drawbacks. In the European passenger cars tested, the use of high levels of CNI did not mitigate any NOx penalty traditionally associated with the use of high FAME content fuels. Deleterious fuel effects were not evident in the emissions slated for future regulation (<23 nm PN, NH3); however, some additional benefits were noted from application of specific fuel qualities (CH4, N2O). It was evident that some traditional benefits of fuel quality on emissions were reduced or even eliminated in the tailpipe emissions of cars using advanced aftertreatment.
To complement the results of the aforementioned LD study, in 2020 Concawe commissioned a study of the effects of the same fuel set on emissions from two commercial vehicles. A heavy-duty (HD) bus certified to Euro VI emissions level and a medium-duty (MD) delivery truck certified to Euro V emissions level have been tested on a chassis-dyno over the World Harmonized Vehicle Cycle (WHVC) and Transport for London Urban Inter-Peak (TfL UIP) test cycle.
The objective of the study is to provide understanding of the effects that diesel fuels operable in current automotive technology applications could offer to both emissions affecting local air quality and to greenhouse gas emissions, with the focus on TTW effects. The fuels tested do not necessarily comply with the current EN590 specification and therefore it is recognized that compatibility of these fuels with the existing vehicle fleet would require further specific consideration which is outside the scope of the study.
Tests over the WHVC and TfL UIP chassis dynamometer test cycles rather than the Real Driving Emissions (RDE) protocol were appropriate to obtain the experimental repeatability required to analyze fuel effects, given that in a previous Concawe study, fuel differences spanning EN590 in terms of density were undetectable over RDE [19].
Testing was limited to one example each of a heavy-duty (HD) bus certified to Euro VI emissions level and a medium-duty (MD) delivery truck certified to Euro V emissions level due to resource constraints. These vehicles were chosen with consideration of the typical age of vehicles in different commercial vehicle segments in Europe.

2. Materials and Method

2.1. Test Fuels

The test fuel set comprised commercially available fuels and fuel components already used in vehicles in demonstration fleets or commercial applications without modifications. The rationale for selecting such fuels was to consider fuel options that could be applied to, and potentially achieve, benefits in the existing as well as future fleets. The fuels were selected for their expected potential to provide benefits to both emissions affecting local air quality and to greenhouse gas emissions, with the focus on TTW effects. The fuels, F1–F6 (Fuel 1–6) are described in the following subsections, key fuel properties are listed in Table 1 and full properties are given in Appendix A.
Fuel 1—EN590 B5
The EN590 B5 fuel was selected to represent a current European diesel road fuel complying with EN590 and it provided a reference fuel for some of the other fuels in the set. This fuel comprised crude-derived petroleum diesel (95% v/v) and FAME type biodiesel derived from used cooking oil (UCOME, 5% v/v) which complied with EN14214. Density for this fuel was at the top of the density range permitted in the EN590 specification: 845 g/L and cetane number was close to the EN590 minimum at 52.
Fuel 2—Low-Density B5 (LD B5)
The Low-Density B5 (LD B5) was selected to represent a lower than EN590 specification density fuel derived from refinery streams normally used for jet and diesel fuel to enable the impact of reduced density and higher hydrogen-to-carbon (H/C) ratio on emissions to be evaluated while still using conventional refinery streams. The LD B5 fuel also acted as a reference fuel for some other fuels in the set and the biodiesel component was UCOME, complying with EN14214.
Fuel 3—Paraffinic Diesel Fuel (PDF)
The PDF was chosen to represent paraffinic fuels derived from natural gas (GTL), biological sources (such as HVO, BTL) and PTL fuels. In this case, Fuel 3 was HVO targeted at the lower end of the EN15940, class A specification in terms of density and, as such, enabled the impact of low density, high H/C ratio, low aromatics and high cetane number on emissions to be evaluated.
Fuel 4—50:50 Blend of Fuels 1 and 3 (PDF50)
The 50:50 blend of PDF and EN590 B5 (PDF50) enabled the impact of a paraffinic blend component on emissions to be evaluated. This fuel was included to represent scenarios in which availability of paraffinic fuels is limited, to cater for scenarios where vehicles are not compatible with pure PDF fuel and to determine in these cases whether or not emissions benefits can be expected to be proportional to the paraffinic fuel content. It was also postulated that paraffinic fuel blends could offer the opportunity to provide emissions benefits while remaining nearer to the existing EN590 specification.
Fuel 5—B30 based on LD B5 (B30)
The B30 fuel was configured from an altered ratio of the components in Fuel 2, low-density petroleum-based diesel (70% v/v) and UCOME (30% v/v). This fuel was designed to enable the evaluation of the impact of high FAME content levels, so far only used in Europe in captive fleets, on emissions. It was postulated that the increased NOx emissions historically associated with the use of high FAME fuels could be mitigated by the sophisticated exhaust aftertreatment used in the latest vehicles.
Fuel 6—B30 + Cetane Number Improver (B30+CNI)
Fuel 6 comprised Fuel 5 with a high dose of 2-ethylhexyl nitrate (2-EHN) CNI of 0.52% v/v, (B30+CNI). The rationale was that the addition of CNI was found to be effective at mitigating NOx penalties associated with the use of high biodiesel blends used in HD trucks in California [11] and could also yield some other emission benefits.
Key Fuel Properties
Key properties of the test fuels are summarized in Table 1 and full properties are listed in Appendix A. It is notable that there is an anomalous measured difference in PAH and total aromatics between F5 and F6, which is in fact within the reproducibility of the measurement method.

2.2. Test Vehicles

The test vehicles were chosen based on representation of:
  • Vehicle types currently common in the European market;
  • Engine and emission control technologies currently common in the European market;
  • Vehicles certified to Euro V and Euro VI standards;
  • Different parent original equipment manufacturers (OEMs);
  • The typical age of vehicles in different commercial vehicle segments in Europe.
The test vehicles were rented by the test provider, VTT Technical Research Centre of Finland, from the Finnish market.
Key test vehicle details are given in Table 2.

2.3. Experimental Program

Experimental work was carried out at the VTT Technical Research Centre of Finland. Specifically, testing was conducted in a temperature-controlled heavy-duty chassis dynamometer (CD) with ambient temperature controlled to 23 °C, ±2 °C. Relative humidity was not controlled and varied between 10 and 30% in the test period. Humidity corrections (KH) were applied to NOx results.

2.3.1. Vehicle Preparation

Ahead of testing, the serviceability of each vehicle and OBD were checked for existing faults and identified faults were rectified. The vehicles were within their recommended service intervals for the duration of the test program, thereby avoiding the need for servicing mid-program. Inertia based on the 50% payload level vehicle mass along with coast down times on reference vehicles of similar mass and size was used to derive road load models for testing. Fuel lines from and to the vehicle tanks were rerouted to enable fueling from external canisters and both delivery and return lines were routed via heat exchangers to control fuel temperature.

2.3.2. Test Cycles

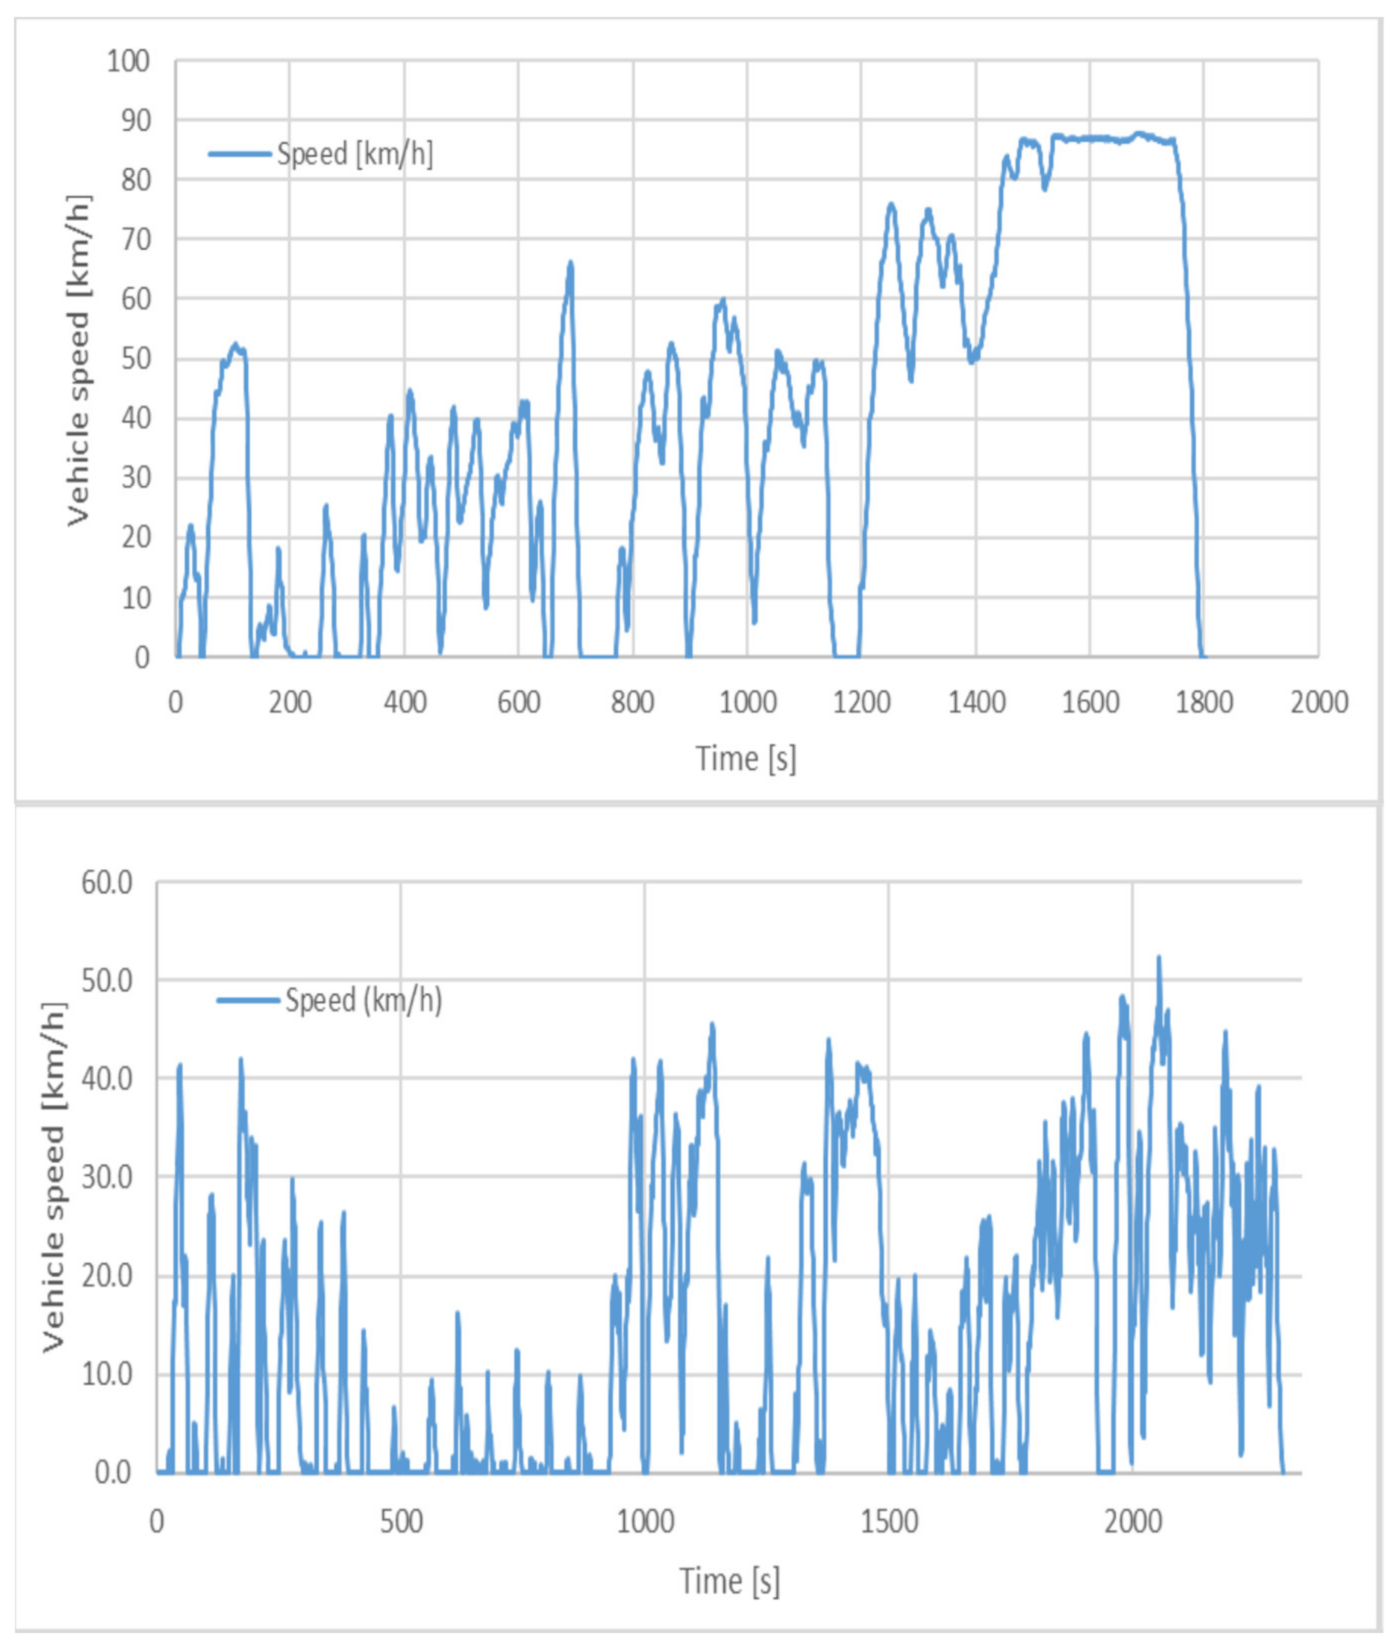
Tests were conducted over World Harmonized Vehicle Cycle (WHVC) and Transport for London Urban Inter-Peak (TfL UIP) test cycles. The WHVC was developed from the World Harmonized Transient Cycle (WHTC) for emissions certification of heavy-duty engines to provide an equivalent for testing in vehicles and includes sections representing urban, rural and highway driving [20,21]. The TfL UIP cycle was chosen to investigate emissions performance over severe urban conditions. This is a congested-traffic cycle modelled on real bus driving between the morning and evening rush hours in London (NB: morning and evening rush hours are even more congested). The cycle takes around 40 min and covers approximately 9 km. The cycle has a low average speed, but is highly dynamic and features frequent idling, thereby presenting a challenging combination for the emissions control systems of low exhaust gas temperature quickly transitioning to high pollutant throughput [22]. The key features of the WHVC and TfL UIP cycles are compared in Table 3 and the speed profiles are illustrated in Figure 1.

2.3.3. Measurements

Test measurements were collected via the CD monitoring system, vehicle and environmental data loggers and emissions analyzer equipment as listed in Table 4. The emissions measurement system implements a full flow constant volume sampler dilution tunnel (CVS). A bag sampling system was used for determining cycle average gaseous exhaust results. PM was measured using a filter paper sampling method. PN (in the range >23 nm) was measured using a CPC with a diluter. FTIR units were used both pre- and post-engine after treatment (EAT) for determining the EAT effect on the emissions. The engine exhaust mass flow was determined for the purpose of FTIR calculations from exhaust dilution rate in the CVS. Carbon balance fuel consumption (FC) was calculated from CO2, CO and HC results acquired from exhaust bag sampling in combination with fuel carbon content proportioned to total determined exhaust mass flow. As HC emissions were generally very low, they had an insubstantial impact on fuel consumption. These FC calculations were then double checked and compared with values from physical FC measurement. Total FC for each test cycle was derived from change in fuel mass measured on a balance. Vehicle urea consumption was likewise measured using a balance. Vehicle controller area network (CAN) messages (J1939 protocol) were acquired using a CAN-logger and obtained via the on-board diagnostics (OBD) port. Truck EGR position was measured directly from EGR-valve as this message was excluded from the standardized CAN-protocol. Voltage was directly measured from the EGR valve’s control unit, therefore relative EGR valve position, rather than actual EGR rate being observed, but this was deemed sufficient to check that no differences in EGR level were being applied with different fuels.

2.3.4. Test Protocol

Each daily test sequence was executed in a predefined, consistent task order. Either 1, 2 or 3 passes through the test sequence were made depending on the operational circumstances (see Section 2.3.5 and Table 5). The test sequence tasks are listed chronologically in Table 6. In order to ensure consistent initial vehicle conditions in every test, the vehicle was conditioned by running on the CD at 80 km/h for 30 min before the initial test (WHVC) and 10 min before the subsequent TfL UIP cycle. These preconditioning steps were found to be sufficient to attain consistent and stable engine coolant and oil temperatures. The target triggering temperature for coolant was set at thermostat opening temperature: 89 °C (±1 °C) for the bus and 84 °C (±1 °C) for the truck, along with 100 °C (±1.5 °C) engine oil temperature for both vehicles. Switching test fuel was performed during the initial conditioning phase of each day. After switching, the fuel return line was diverted to waste with the engine running to ensure the system was sufficiently flushed. At the end of each test day, a coast down curve was run to check that changes in vehicle frictional losses were not occurring that could confound detection of fuel differences.
Throughout the program, exhaust gas temperature was monitored from the Euro VI bus to detect and respond to DPF regeneration events; however, none were detected during testing.
Engine lubricant levels were checked at SOT and thereafter the dashboard level indicators were relied upon to ensure that levels did not fall outside recommended limits.

2.3.5. Test Schedule

The test order was designed so that the three repeats on each fuel were positioned approximately symmetrically about the mid-point of the test sequence. This ensures that the fuel means would have experienced minimal adjustment had (linear) drift been present in the data and a correction applied. Each fuel was followed by a test on a different fuel and repeated pairings of the same fuels were also avoided so that, in the very unlikely event that the effects of a fuel carried over into the following test, any impact would be distributed across multiple fuels. Another consideration was to avoid, as far as practicable, all tests on any fuel being run in the same position within the test day. As Fuel 1 was used as a main reference, more tests were carried out on this fuel to increase the statistical power of the fuel comparisons. (Fuel 2 was also a reference for Fuels 5 and 6, but because three repeats were already scheduled on each fuel, no additional tests were deemed necessary.) Tests identified as invalid at the time of running were repeated in-sequence, whereas those identified later as non-conforming were repeated in a position in the sequence subject to the constraint of avoiding successive tests on the same fuel. The detailed formulation of the fuels was not disclosed to the test facility until after the test program was complete (details required for the correct calculation of fuel and energy consumption were disclosed). This ensured that all testing was blind and that the decision to omit any test as invalid on operational grounds and to repeat it was made without any knowledge of expected performance.
The actual test order (Table 6) deviated from the planned test order due to some tests being identified as potentially non-conforming or, in the case of the first test on the truck and the first four tests on the bus, affected by vehicle settling; these tests were repeated at the end of the planned test sequence in reverse order. Two more valid tests were run on the truck rather than the bus because some tests earlier in the sequence that appeared to be outliers were confirmed not to be so when the additional repeats were run.

2.4. Data Analysis

2.4.1. Data Quality

  • As mentioned under “Test Schedule”, some tests were rejected from the analysis due to unusual high emissions, notably in CO2, in the initial tests. Specifically this was the first test sequence (of WHVC+TfL UIP) on the truck and first four test sequences (of WHVC+TfL UIP) on the bus and the cause was attributed to vehicle settling.
  • No usable CH4 data were generated; readings were below the detection limit and so CH4 was not included in calculation of GHG emissions.
  • Some PN and PM data were missing due to equipment malfunctions. In the respective tests this was the only omission and so the tests were not repeated.

2.4.2. Statistical Analysis

The statistical analysis was carried out separately for each vehicle and is based on a simple one-way analysis of variance (ANOVA) with fuel as the factor. Standard statistical methods such as ANOVA assume that the variation in the data is constant regardless of the level of the mean, but many emissions measurements exhibit proportional variation where the variability of the measurements increases with its mean level. This is not a concern for CO2 emissions, fuel consumption and the related GHG CO2 equivalent (CO2e) and energy consumption measurements, as these are predominantly determined by the vehicle and fuel effects are small in relative terms. However, for other emissions where large proportional differences can arise between fuels, a weighted analysis has been applied where the weights correspond to 1/(Mean2). This weighting has no effect on the fuel means but gives more weight to smaller measurements, which are more precise, and smaller fuel means will therefore have smaller confidence intervals than larger fuel means. Additionally, in line with other studies [
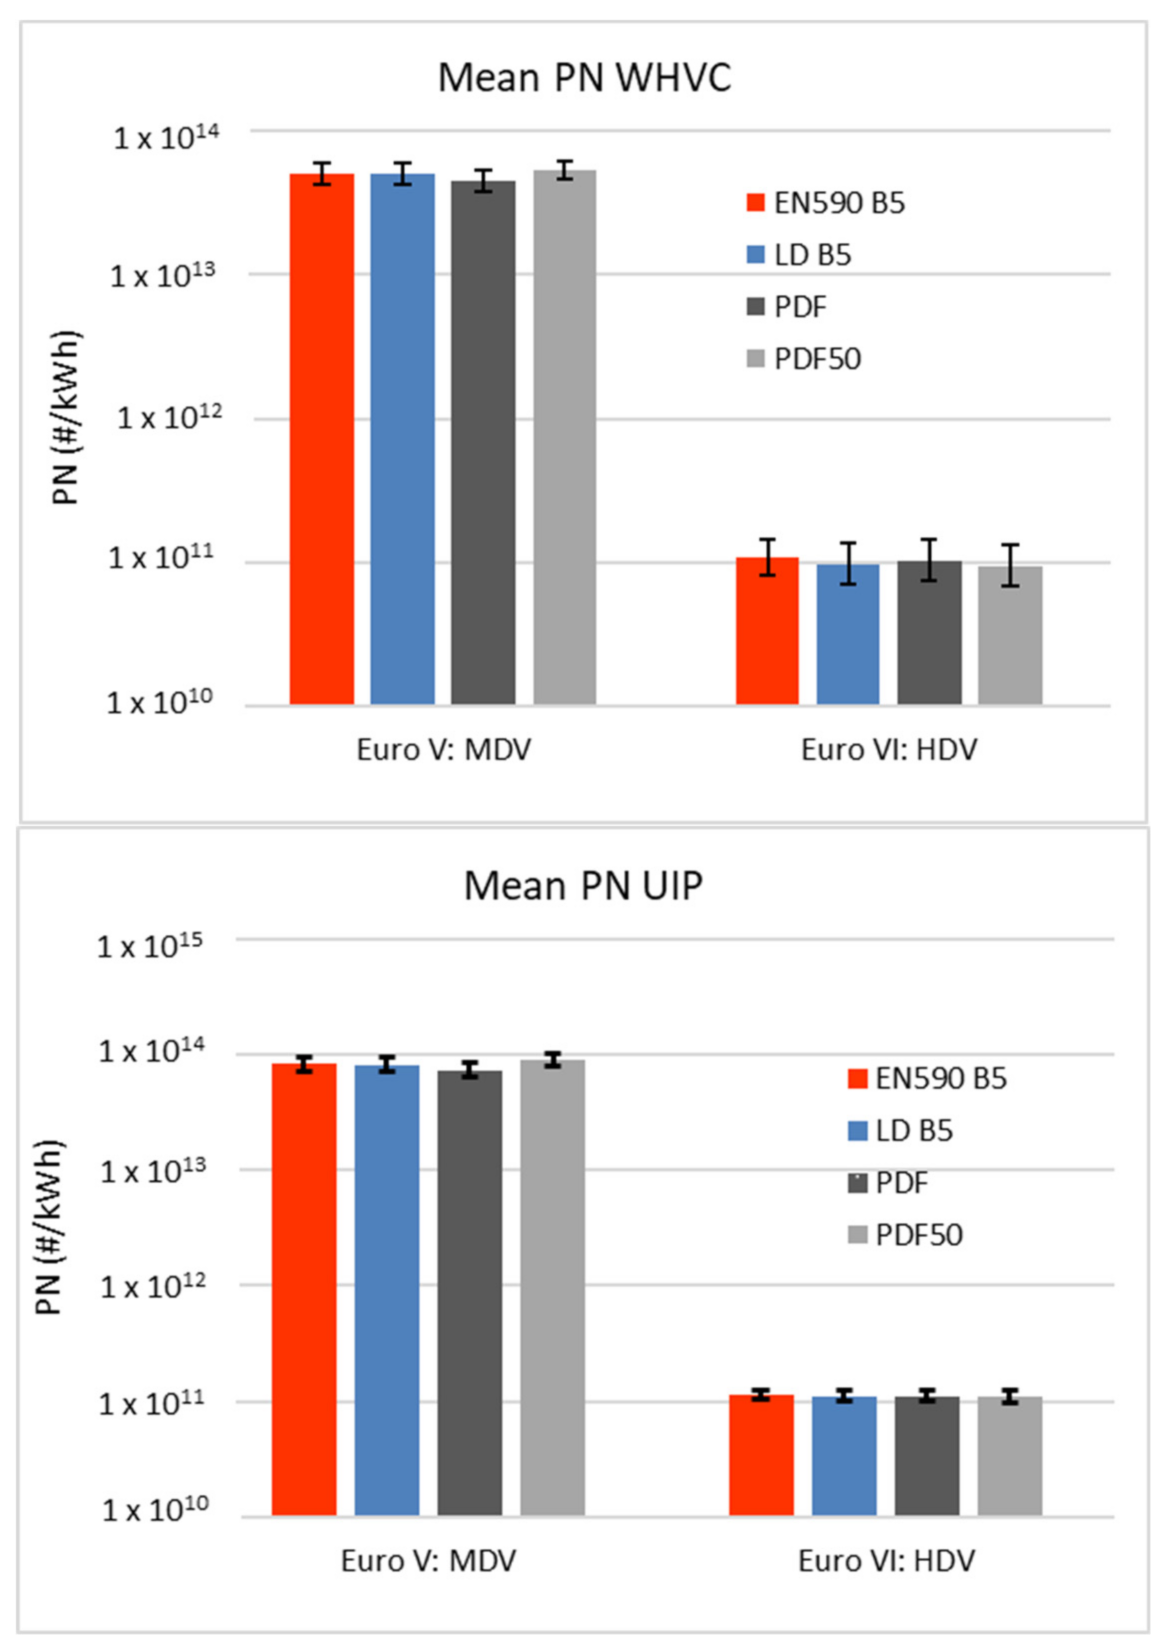
18], PN was analyzed on the logarithmic scale with the results presented as geometric means.
The study was designed to evaluate the impact of fuel properties, namely density, paraffinic fuel content, B30 and B30 with CNI, via a small fuel matrix using a predefined set of fuel comparisons. With more than one reference fuel involved, fuel differences have been assessed for significance using the Holm–Bonferroni method, which protects the family-wise error to provide protection against the risk of false positives but offers greater statistical power than other, more severe, multiple comparison tests.

3. Results

Key results from the WHVC and TfL UIP are described in this section and the full results are tabulated in Appendix B. Where appropriate, results are expressed in terms of g/kWh as is normal convention for HD vehicles. Where shown on charts, error bars denote the 95% confidence intervals about the mean. Differences between fuel means that are statistically significant at the 95% confidence level from the comparator fuel are marked with patterned bars. Fuel comparisons follow logic based on blend similarity, as follows:
  • EN590 B5 (F1) vs. LD B5 (F2), PDF (F3) and PDF50 (F4)
  • LD B5 (F2) vs. B30 (F5) and B30+CNI (F6)

3.1. Carbon Dioxide

CO2 emissions differences between the EN590 B5 reference fuel, the LD B5, PDF and PDF50 are shown in Figure 2. These fuels with lower density and higher H/C ratio tend to give lower CO2 emissions than the EN590 B5. Differences ranged between 2 and 6%. Differences tend to be larger in the higher-duty WHVC test.
CO2 results from the LD B5 fuel, the B30 and B30 with CNI are shown in Figure 3. No differences are statistically significant; however, there is a tendency for CO2 to be directionally higher with B30 (+CNI) in both vehicles and test cycles.
All these trends regarding CO2 are mostly correlated with the carbon intensities of the fuels (expressed in g of CO2 emitted per MJ of fuel), which means that the CO2 emissions mostly depend on two of the fuel properties (carbon content and net heating value) and that the fuels have almost no effect on engine efficiency (see Section 3.3 for confirmation of the latter observation).

3.2. Specific Fuel Consumption

Volumetric and mass specific fuel consumptions were calculated from the carbon balance of emissions, the fuel H/C, oxygen/carbon (O/C) ratios, energy content and density. Volumetric fuel consumption was dominated by fuel volumetric energy density and was therefore higher for the low-density fuels than the comparator EN590 B5 fuel; see Figure 4, upper two graphs. Conversely, mass specific fuel consumption is related to fuel energy density by mass, and is lower for fuels having a higher heating value, the latter being directly correlated with the paraffinic content for PDF and PDF50; see Figure 4, lower two graphs. Fuel consumption was also measured gravimetrically and once converted to the same units, similar trends were observed in both measures (see Appendix B for gravimetric FC).
Volumetric fuel consumption for the B30 (+CNI) fuels was not significantly different from the LD B5 fuel in either of the vehicles or test cycles, although it was directionally higher in some cases; see Figure 5, upper two graphs. The results are different regarding the specific mass fuel consumption, for which the B30 (+CNI) has significantly higher consumptions due to its lower energy density by mass, the latter being directly correlated with the presence of oxygenated compounds; see Figure 5, lower two graphs.

3.3. Energy Consumption

Energy consumption (MJ/kWh) was calculated by multiplying the fuel net heating value (MJ/kg) by the volumetric fuel consumption (L/kWh) and the fuel density (kg/L). It is equivalent to the inverse of an overall tank-to-wheel efficiency (powertrain and driveline efficiency).
There were no significant fuel effects on energy consumption for the low-density fuels compared to the EN590 B5, and at least no detrimental effects, Figure 6.
The same conclusion is drawn from the comparison between LD B5 and B30 fuels: there are no observable fuel effects on energy consumption; see Figure 7.

3.4. Oxides of Nitrogen (NOx) and “AdBlue” Consumption

Tailpipe NOx was substantially lower from the Euro VI HDV than the Euro V MDV, illustrating the good efficiency of modern NOx aftertreatment systems. No significant fuel effects were observed in either vehicle or test cycle, except for PDF being significantly lower than EN590 B5 in the Euro V TfL UIP tests (Figure 8 and Figure 9). No significant fuel effects on EGR valve position were observed. Engine-out NOx was significantly lower with PDF than EN590 B5 in the Euro VI in both test cycles (Figure 10), leading to lower “AdBlue” urea-based NOx reductant consumption in these cases, as well as a general correlation between engine-out NOx and AdBlue consumption indicating closed-loop control of tailpipe NOx (Figure 11). There were no other significant differences in engine-out NOx in the Euro VI.
There were no significant fuel effects on absolute levels of NO2. The fraction of NO2 in the NOx emissions (fNO2) is less than 5% of total NOx in all Euro V tests for all fuel mean values. In the Euro V, fNO2 was significantly higher for PDF than EN590 B5 in the WHVC test and higher for the LD B5 and PDF50 in the UIP cycle. In the Euro VI vehicle, fNO2 was between 9 and 20% and was lower for LD B5, PDF and PDF50 than EN590 B5 in the UIP test. fNO2 for B30 and B30+CNI was lower than for LD B5 in the Euro VI vehicle UIP tests. See Appendix B for detailed results.

3.5. Particulates Mass

PM was an order of magnitude lower for Euro VI thanks to the presence of a diesel particulate filter, and there was little chance of measuring fuel effects at the low levels (~2 mg/kWh) in this vehicle (Figure 12). Some fuel effects were observed in the Euro V vehicle: PM was significantly lower with PDF than with EN590 in both cycles. LD B5 and PDF50 gave significantly lower PM than EN590 B5 in urban duty UIP cycle and B30+CNI was significantly lower than LD B5 in UIP (Figure 13). The latter observation can possibly be explained by the presence of oxygenated compounds helping to oxidize soot in the diffusion flame.

3.6. Particles Number

Tailpipe PN emissions measured in the >23 nm size range were more than 2 orders of magnitude lower for the Euro VI than the Euro V due to the DPF fitted to the former. No statistically significant fuel effects were observed (Figure 14 and Figure 15). In particular, as observed by other groups, if it is clear that PDF offers benefits for engine-out PM, it is not necessarily the case for PN.

3.7. Carbon Monoxide

CO emissions were very low in the Euro VI vehicle and no statistically significant fuel effects were observed in either test cycle. In the Euro V, PDF gave significantly lower CO than EN590 B5 in both cycles, as did LD B5 and PDF50 in the urban TfL UIP cycle (Figure 16). CO emissions were significantly lower from B30 and B30+CNI in the Euro V TfL UIP test cycle (Figure 17). The latter observation can be explained by the presence of oxygenated compounds, facilitating oxidation of CO into CO2.

3.8. Hydrocarbons

HC emissions were very low, sometimes below the limit of detection from the Euro VI HDV and there were no detectable fuel effects. Surprisingly, HC was significantly higher for the LD B5 than EN590 B5 in the Euro V in both WHVC and TfL UIP cycles. HC for PDF was significantly higher than EN590 B5 in the WHVC but significantly lower in the UIP. PDF50 was also significantly higher than EN590 B5 in the WHVC but not significantly different from EN590 B5 in the UIP (Figure 18).
B30 and B30+CNI were both significantly lower than LD B5 in the Euro V in both the WHVC and TfL UIP cycles (Figure 19). The latter can be explained by the presence of oxygenated compounds, which facilitates the oxidation of hydrocarbons.

3.9. Greenhouse Gases

Greenhouse gas CO2 equivalent (GHG CO2e) was based on the CO2 and N2O data because CH4 was immeasurably low in nearly all tests. The global warming potential (GWP) 100-year figures for CO2e from the Greenhouse gases, Regulated Emissions and Energy use in Transport (GREET) model were used to estimate the N2O contribution [23]. GHG CO2e was significantly lower for LD B5, PDF and PDF50 than for EN590 B5 in the WHVC for both vehicles. Whereas in the UIP tests, PDF was significantly lower than EN590 B5, again in both vehicles, and LD B5 was significantly lower only in the Euro V vehicle (Figure 20). In the B30 fuel set there was only one significant fuel effect, which was B30+CNI being significantly higher than LD B5 in the Euro VI WHVC test (Figure 21).
Overall for the Euro VI vehicle, N2O contributed to approximately 10% of the GHG emissions, possibly showing a weakness in the current CO2 regulation as these are not taken into account in the vehicles’ CO2 score.

3.10. Ammonia

Ammonia (NH3) tailpipe emissions were scrutinized from the Euro VI vehicle only, due to the use of an SCR system with urea reductant. Ammonia emissions ranged from 7–18 mg/kWh and were lower in the urban TfL UIP cycle than the WHVC cycle (Figure 22). The only significant fuel effects were detected in the TfL UIP cycle where B30 and B30+CNI gave higher emissions than LD B5 (Figure 23). It may be tempting to think that the ammonia slip would increase with increased consumption of urea, but our measurements give no such correlation.

4. Discussion

The emissions and fuel consumption performance of six diesel fuels have been tested over hot-start WHVC and TfL UIP test cycles in two European commercial vehicles—one HD Euro VI bus and one MD Euro V truck—to determine their potential benefits. Most of the fuels tested have potential to be renewable, with WTT benefits as well as the TTW effects studied, but in many cases additional OEM certification would be required to deploy such fuels for general use in the European market.
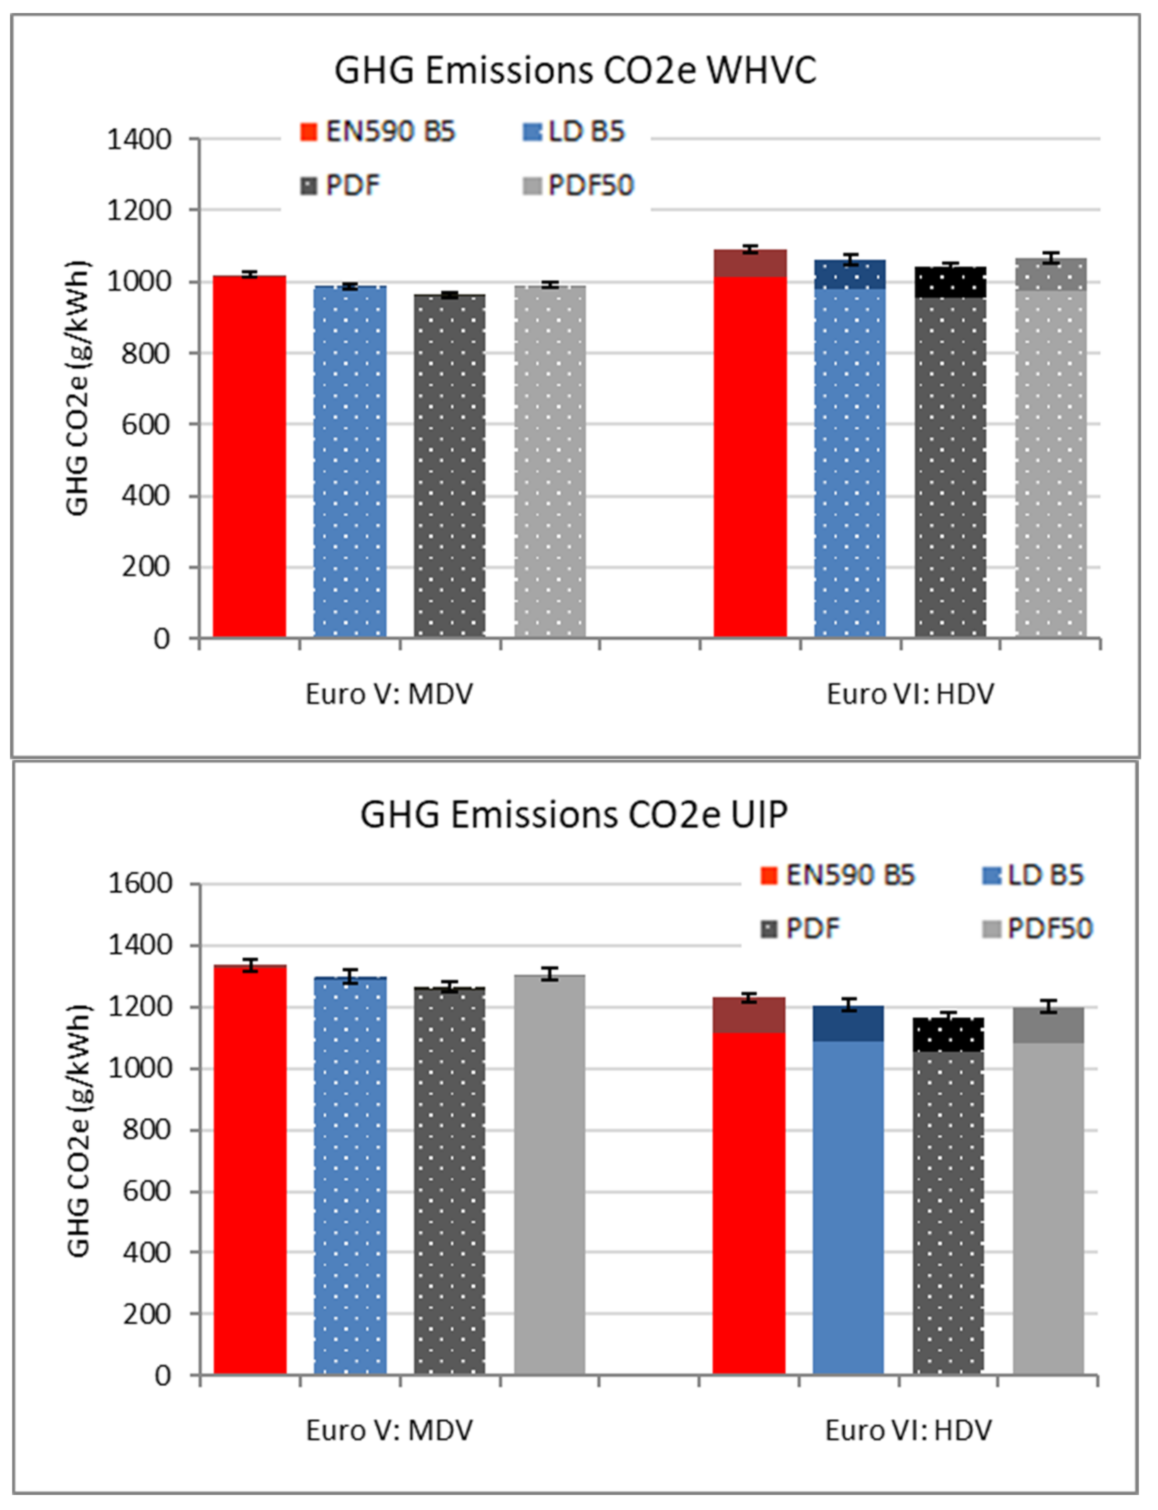
Results showed that low-density hydrocarbon fuels can offer TTW CO2 benefits in the range of 2 to 6%, but with an accompanying increase in volumetric fuel consumption and no difference in energy consumption, meaning that the fuels did not affect engine efficiency. The differences in volumetric fuel consumption were consistent with expectations based on the fuels’ lower heating value and density; so were the CO2 emissions consistent with the fuels’ carbon intensities. When combining CO2 and N2O emissions, these fuels also offer total TTW GHG benefits (with methane emissions being immeasurably low in this experiment).
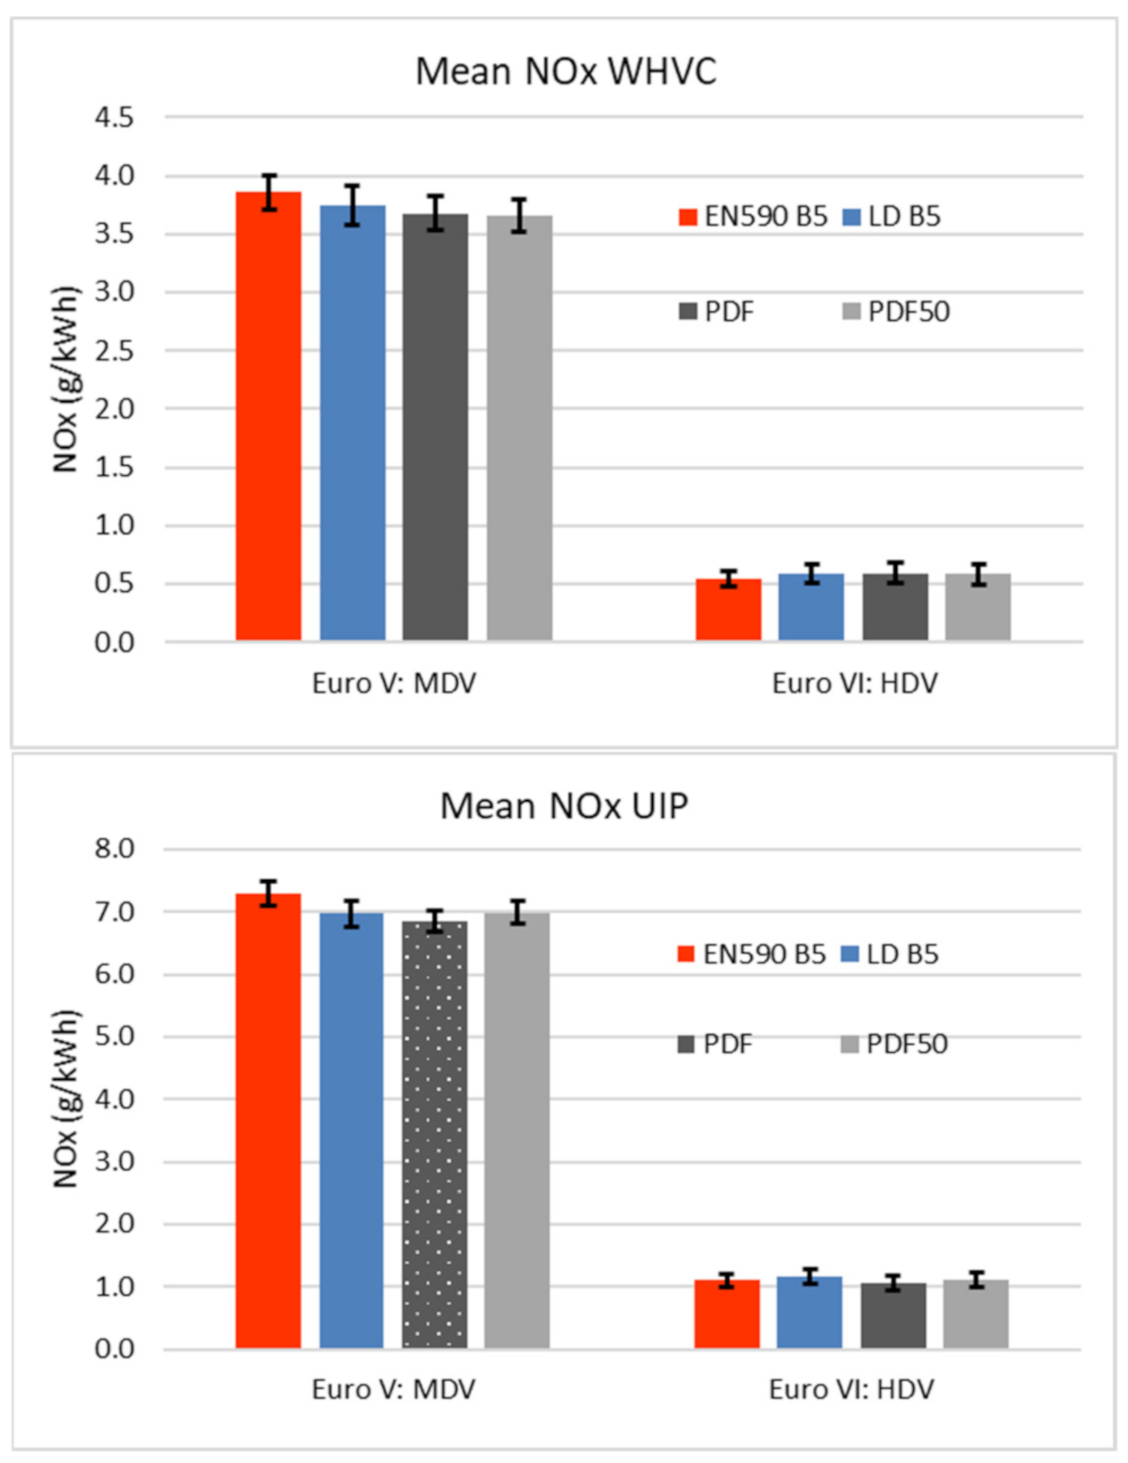
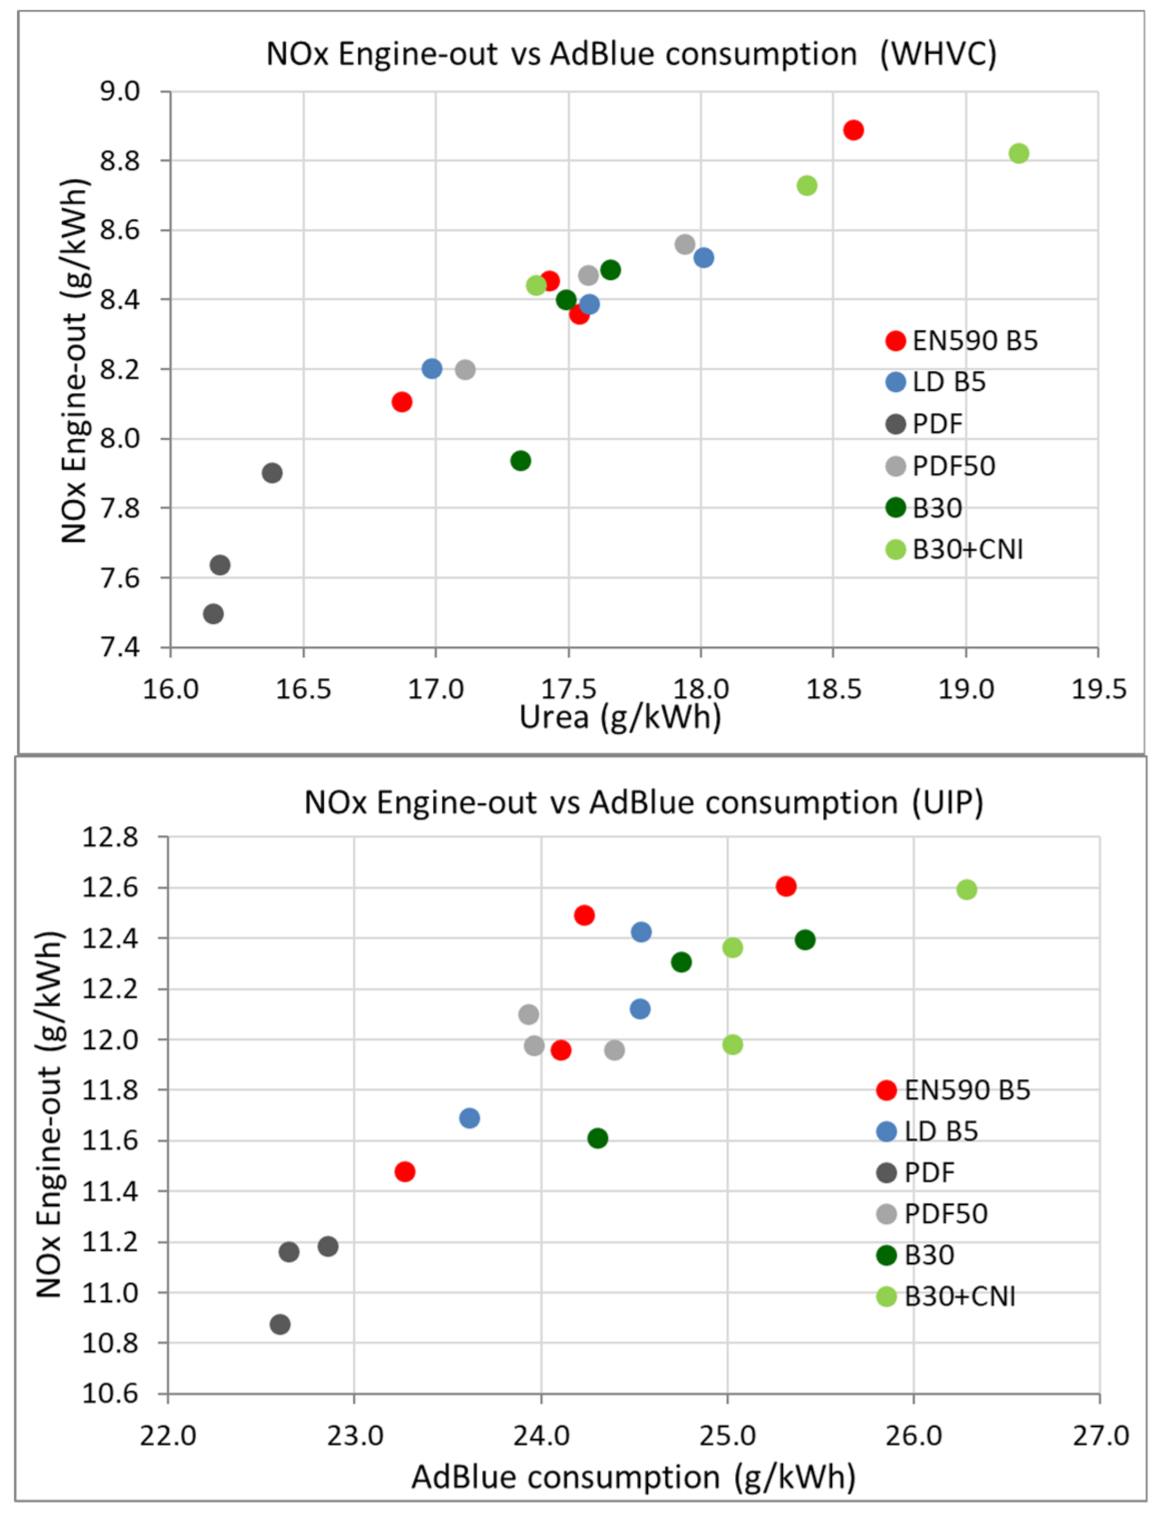
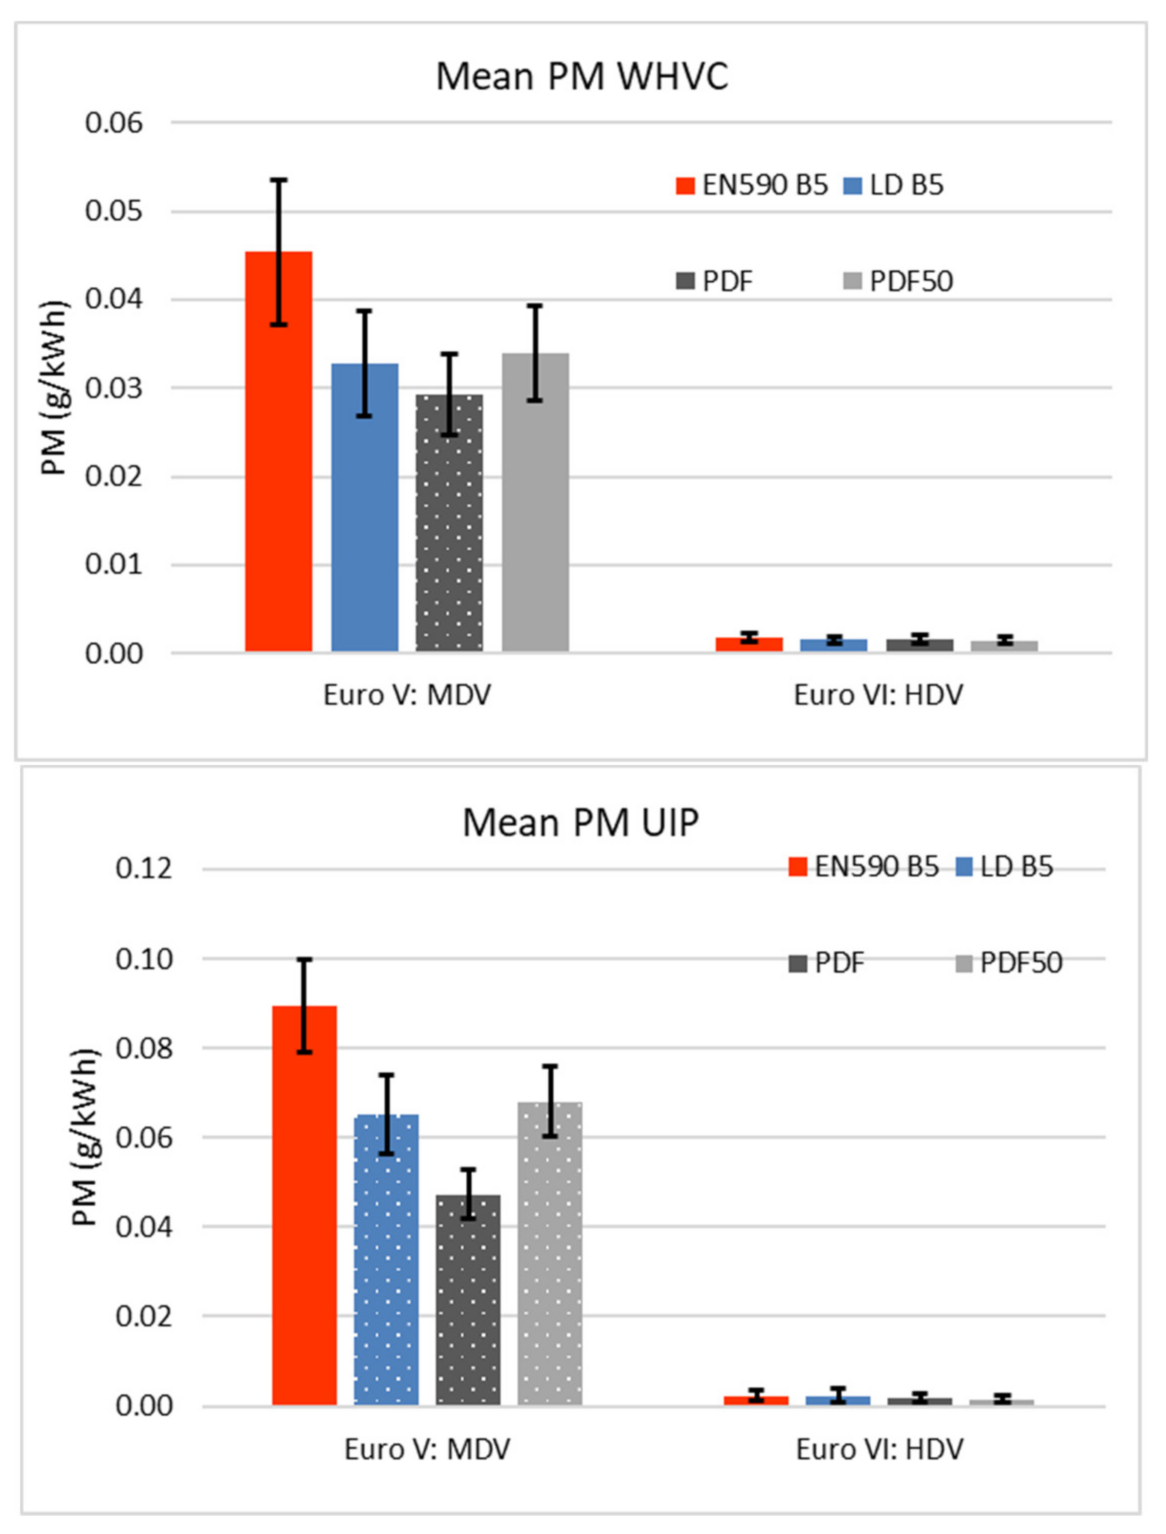
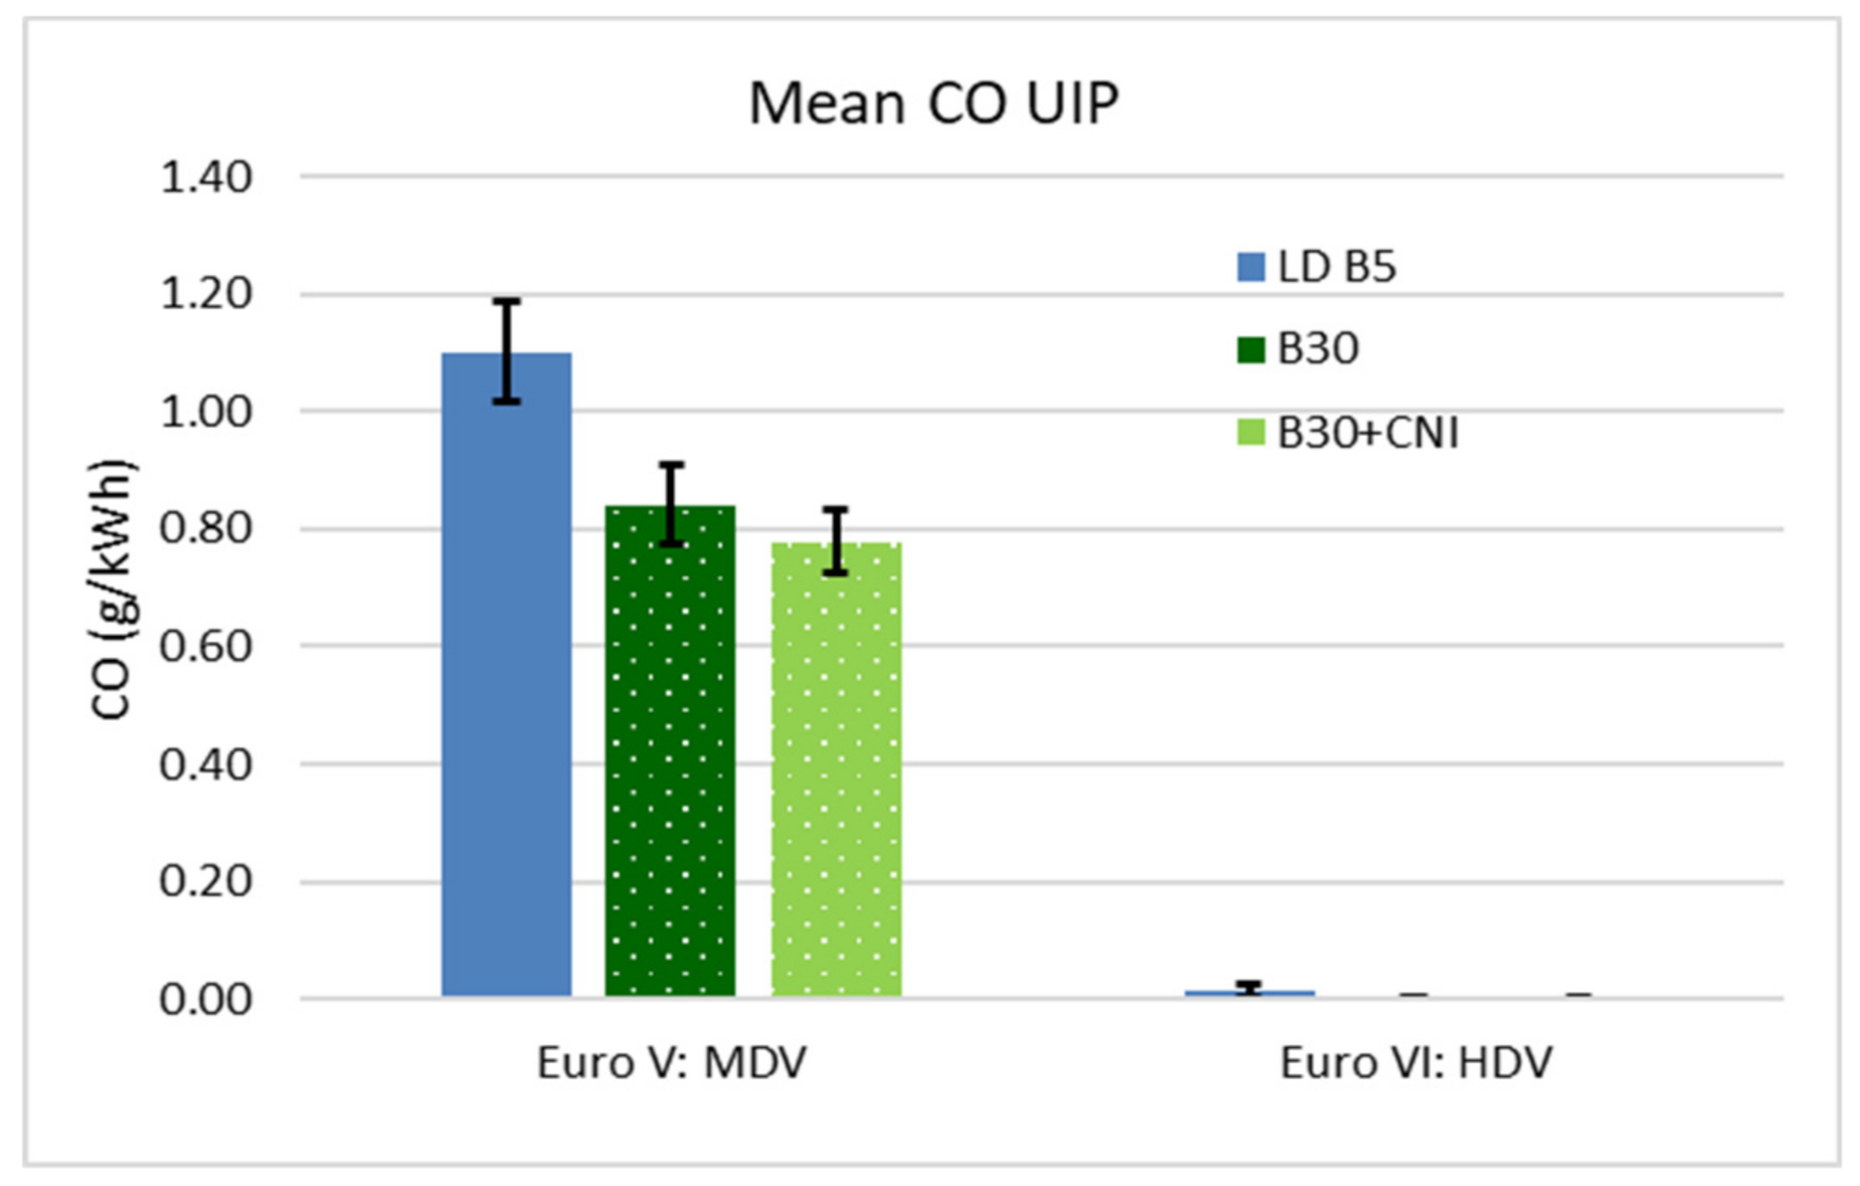
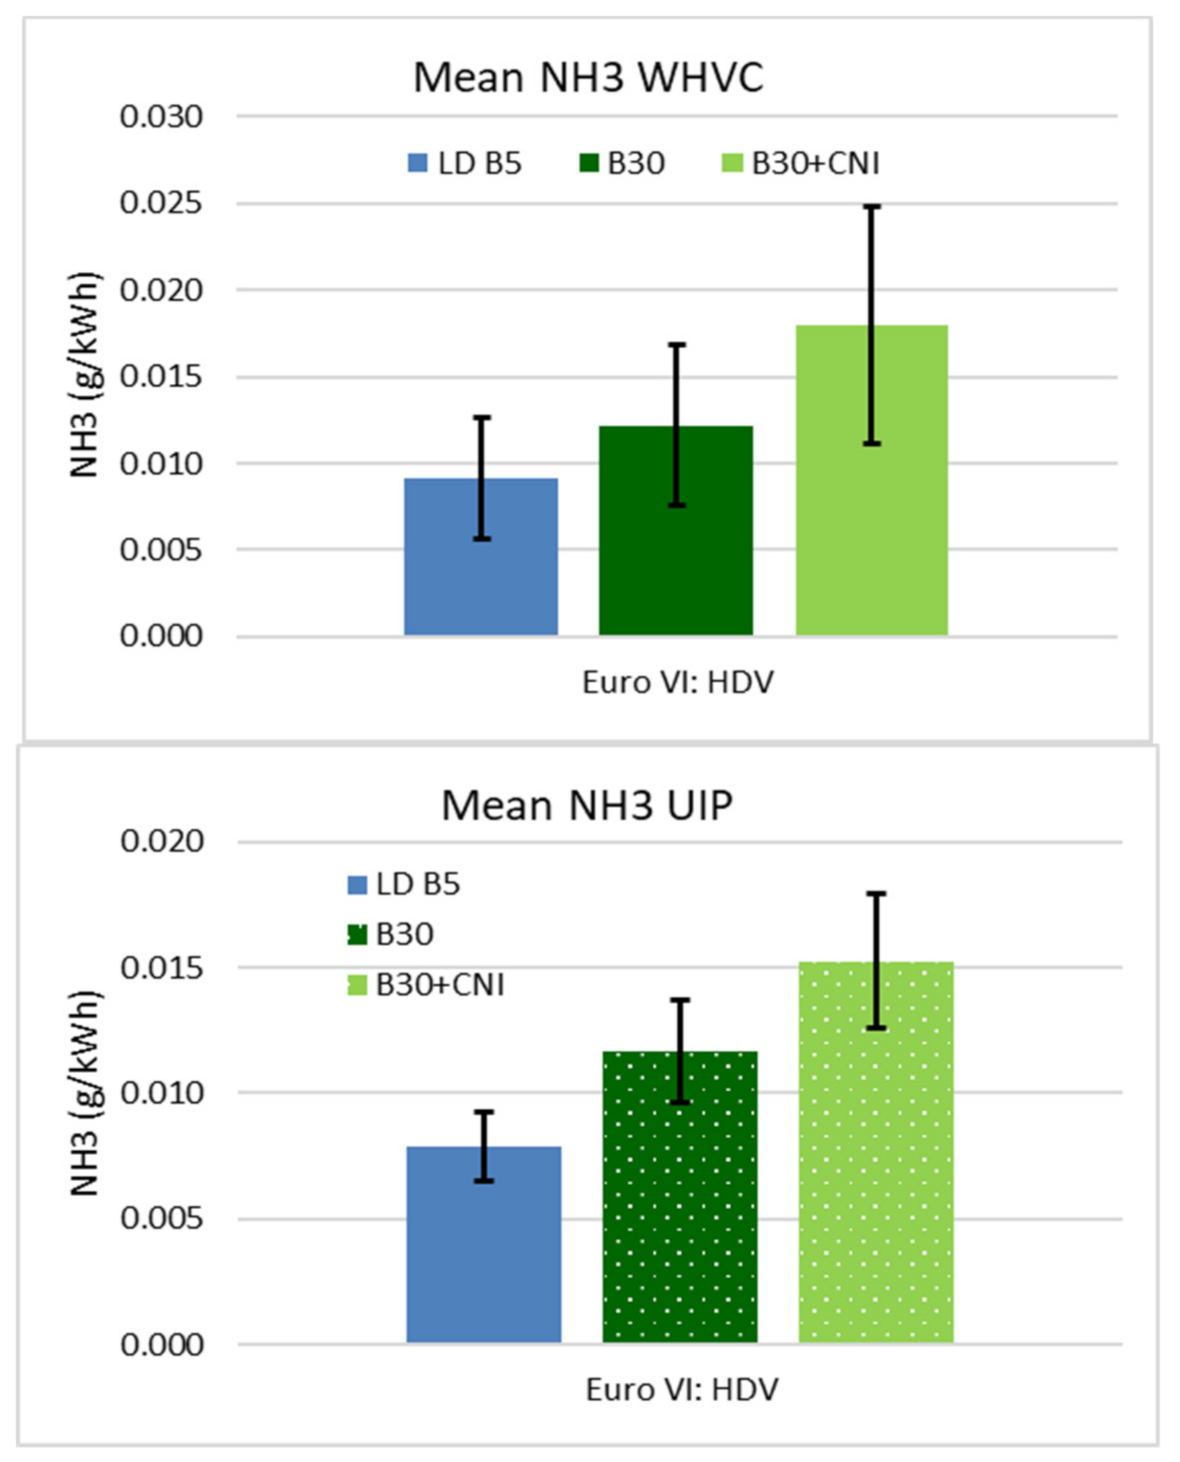
In terms of emissions that could affect local air quality, significant fuel effects on tailpipe emissions from the low-density hydrocarbon fuels were only observed in the Euro V vehicle. The impact of modern exhaust aftertreatment is illustrated in this respect, given that beneficial fuel effects on NOx were observed in engine-out emissions from the Euro VI vehicle (with paraffinic diesel fuel) but were absent in the tailpipe emissions and lower engine-out NOx was instead translated into lower consumption of AdBlue SCR reductant due to closed-loop control of tailpipe NOx. Tailpipe levels of PM, PN, NOx, CO and HC were all substantially lower for the Euro VI vehicle than for the Euro V vehicle; however, due to the application of urea-SCR, measurable ammonia emissions were observed from the Euro VI vehicle. N2O and the fraction of NO2 in the total NOx emissions were higher although absolute levels of NO2 were similar in both vehicles. For the Euro VI vehicle, N2O contributed to approximately 10% of the GHG emissions, showing a possible weakness in the current CO2 regulation which is aimed at GHG emissions reduction.
In the Euro V vehicle, low-density hydrocarbon fuels gave some benefits in PM and CO, especially in the TfL UIP urban cycle, whereas, surprisingly, HC emissions were higher for these fuels in some cases and lower in one case. The surprising increases in HC oppose trends observed in other studies [11,18,24,25,26] and could be an artefact of the calibration of the specific vehicle used. It is postulated that low-density fuels led to longer injection durations being applied to deliver the required fuel mass to meet torque demands. This in turn could have been interpreted by the vehicle EMS as different load points leading to a different point on the engine operating map being adopted, which affected engine-out emissions. There were no significant fuel effects on tailpipe NOx or PN except in one case in the TfL UIP test where the PDF reduced NOx in the Euro V vehicle.
The B30+CNI fuel was included primarily to determine if the addition of CNI could mitigate any NOx penalties arising from the high FAME level in B30 (as practiced historically for HD vehicles in California [11]). In the current study, there were no significant effects of B30 and B30+CNI on NOx (engine or tailpipe) or indeed any significant differences in CO2, volumetric fuel consumption or energy consumption compared to LD B5. This difference between the former Californian study and the outcomes of the current study possibly results from advances in fuel injection equipment capable of delivering improved fuel-air mixing and multiple injection strategies. Older engines using fewer fuel injection events per engine cycle created long auto-ignition delays, in particular with low CN fuels (which is often the case in the USA), consequently leading to a substantial premixed flame which with rapid heat release and consequent high temperatures is known to be a source of NOx. In this context, increasing the CN by using CNI was likely to reduce the auto-ignition delay, hence the premixed flame, hence the NOx emissions. The modern vehicles in this study would systematically apply multiple injection regimes, primarily to control the auto-ignition delay with pilot injections, and may be less sensitive to CN for the control of the premixed flame, hence less sensitive to CNI for NOx emissions.
The B30 and B30+CNI fuels produced similar results in most cases, only differing in two cases: where B30+CNI increased N2O in the Euro VI WHVC tests compared to LD B5 also leading to an overall higher GHG total emission and where B30+CNI reduced PM in the Euro V TfL UIP tests. Both B30 and B30+CNI reduced CO in the TfL UIP and HC in both cycles in the Euro V vehicle relative to LD B5. As was the case for the low-density hydrocarbon fuels, more fuel effects were observed in emissions relevant to local air quality in the Euro V vehicle.
Overall, it appeared that test cycle influenced the detection of fuel effects in some cases, with effects on PM and CO being more readily detected in the TfL UIP cycle than in the WHVC cycle despite similar directional trends, with improved repeatability in the UIP test along with higher absolute emission values. The TfL UIP cycle represents congested urban driving, where pollutant emissions are most relevant and so it is fitting to appraise fuel effects using this cycle. It was also apparent that vehicle technology impacted the detection of fuel effects, for example, in the cases of PM, CO and HC where the low absolute tailpipe levels from the Euro VI vehicle would make detecting fuel differences unfeasible and in the case of NOx where closed loop control of tailpipe emissions compensated for fuel effects on engine-out emissions.

5. Conclusions

From testing the emissions and fuel consumption performance of six diesel fuels in two European commercial vehicles—one HD Euro VI bus and one MD Euro V truck, it can be concluded that:
  • Low-density hydrocarbon fuels can offer TTW CO2 benefits, but with an accompanying increase in volumetric fuel consumption and no difference in overall energy efficiency. When combining CO2 and N2O emissions, these fuels also offer total TTW GHG benefits, which bodes well for the future when renewable paraffinic fuels become more widely available.
  • Modern exhaust aftertreatment suppresses traditional beneficial effects on local emissions from low-density hydrocarbon fuels due to very low emission levels and in this case translated engine-out NOx benefits into AdBlue savings. This can be accompanied by measurable ammonia emissions and increases in fNO2. On older vehicles with less sophisticated emissions aftertreatment and having higher emissions levels, low-density hydrocarbon fuels mostly have beneficial effects.
  • Modern aftertreatment systems can significantly increase N2O emissions at the tailpipe through chemical reactions in the catalyst. This can translate into about 10% contribution of N2O emissions to the overall GHG emissions of the vehicle.
  • In this experiment, B30 did not increase NOx (versus a B5 comparator) in either tailpipe or engine-out measurements as has been observed in some previous studies; furthermore, the addition of CNI to B30 did not reduce NOx. Some benefits in local emissions (PM, CO and HC) are measurable in vehicles without the latest emissions control technology with B30 whereas statistically significant effects on CO2, volumetric fuel consumption and energy consumption are absent. These results indicate that increased use of such renewables can be made with limited negative impact on TTW emissions and efficiency.
  • Most of the fuels tested have potential to be renewable, with WTT benefits as well as the TTW effects studied, but in many cases additional OEM certification would be required to deploy such fuels for general use in the European market.

Author Contributions

Conceptualization, R.W. and R.D.; methodology, R.W., R.P., K.K. and R.D.; software, P.Z.; validation, R.W., P.Z., K.K. and R.D.; formal analysis, P.Z.; investigation, R.W. and R.D.; data curation, R.P. and P.Z.; writing—original draft preparation, R.W.; writing—review and editing, R.P., P.Z., K.K. and R.D.; visualization, R.W. and P.Z.; supervision, R.W., R.P. and R.D.; project administration, R.D. All authors have read and agreed to the published version of the manuscript.

Funding

This research received no external funding.

Institutional Review Board Statement

Not applicable.

Informed Consent Statement

Not applicable.

Acknowledgments

VTT Technical Research Centre of Finland, Coryton Specialty Fuels, UK.

Conflicts of Interest

The authors declare no conflict of interest.

Abbreviations

ANOVAAnalysis of Variance
ASCBAmmonia Slip Catalyst
B5, B30Diesel containing 5% or 30% Biodiesel by volume
BTLBiomass-To-Liquid
CANController Area Network
CARBCalifornia Air Resources Board
CDChassis Dynamometer
CH4Methane
CLDChemi-Luminescence Detector
CN(I)Cetane Number (Improver)
COCarbon monoxide
CO2(e)Carbon dioxide (equivalent)
CPCCondensation Particle Counter
CVSConstant Volume Sampling
d50Median Particle Diameter
DOCDiesel Oxidation Catalyst
DPFDiesel Particulate Filter
EATExhaust Aftertreatment
2-EHN2-Ethylhexyl Nitrate
EPAEnvironmental Protection Agency (US)
FAMEFatty Acid Methyl Ester
FBPFinal Boiling Point
FCFuel Consumption
FIDFlame Ionization Detector
fNO2Fraction of NO2 in NOx emissions
FTIRFourier Transform Infra-Red
GREETGreenhouse gases, Regulated Emissions and Energy Use in Transport model
GHGGreenhouse Gas(es)
GTLGas-To-Liquids
GWPGlobal Warming Potential
HCHydrocarbons
H/C ratioHydrogen to Carbon ratio
HD(V)Heavy-Duty (Vehicle)
(HP) EGR(High Pressure) Exhaust Gas Recirculation
HVOHydrotreated Vegetable Oil
IBPInitial Boiling Point
LDLight Duty
LD B5Low-Density B5
LNTLean NOx Trap
MD(V)Medium-Duty (Vehicle)
NDIRNon-Destructive Infra-Red
NEDCNew European Drive Cycle
NH3Ammonia
NO2Nitrogen dioxide
N2ONitrous Oxide
NOxOxides of Nitrogen
OBDOn-board Diagnostics
O/COxygen to Carbon ratio
OEMOriginal Equipment Manufacturer
PAHPolycyclic Aromatic Hydrocarbons
PDF(50)Paraffinic Diesel Fuel (50% by volume)
PMParticulate Matter/Mass
PNParticle Number
PTLPower-To-Liquids
RED(2)Renewable Energy Directive (2)
RDEReal Driving Emissions
SCRSelective Catalytic Reduction
SOTStart of Test
T50/95Temperature for 50/95% evaporation
TfL UIPTransport for London Urban Interpeak cycle
T50Temperature for 50%v evaporations
TTWTank To Wheels
UCOMEUsed Cooking Oil Methyl Ester
WLTWorldwide harmonized Light-duty Test Cycle
WHTCWorld Harmonized Transient Cycle
WHVCWorldwide Harmonized Transient Vehicle Cycle

Appendix A

Table A1. Fuel properties.
PropertyUnitsMethodEN590 minEN590 max.F1-EN590 B5F2-LD B5F3-PDFF4-PDF50F5-B30F6-B30+CNI
Appearance visual C&BC&BC&BC&BC&BC&B
Density at 15 °Ckg/lEN ISO 121858208450.8450.8050.7640.8050.8250.826
Cetane number-EN ISO 516551 52.051.479.667.052.465.8
Carbon residue%m/mEN ISO 10370 0.3<0.01<0.01<0.01<0.01<0.01<0.01
Flashpoint°CEN ISO 271955 58.556.573.065.562.0
Lubricity, WSD at 60 °CumEN ISO 12156-1 460n/a194400247n/a
Sulfurmg/kgASTM D5453 10101.51.05.91.8
Viscosity at 40 °Cmm2/sEN ISO 3104 2.571.661.952.182.092.10
Water contentMg/kgEN ISO 12937 20050 3040120
FAME content%v/vEN 14078 74.65.1<0.12.430.530.3
Mono-aromatics%m/mIP 391 mod 30.46.20.116.04.4
Di-aromatics%m/mIP 391 mod 3.60.8<0.11.90.7
Tri+ aromatics%m/mIP 391 mod 0.00.0<0.10.00.0
PAH content%m/mIP 391 mod 8.03.60.8<0.11.90.70.4
Total aromatics%m/mIP 391 mod 34.07.00.117.95.14.5
Carbon content%m/mASTM D3343 mod 86.4585.3384.6285.6683.5983.60
Hydrogen content%m/mASTM D3343 mod 13.0514.1215.3814.0813.1213.12
Oxygen content%m/mEN 14078 0.500.550.000.263.293.27
Net heating valueMJ/kgASTM D3338 42.6943.2344.1743.3841.6941.69
E250%v/vEN ISO 3405 6536.7n/a62.148.857.5
E350%v/vEN ISO 340585 93.4n/a98.797.095.7
IBP°CEN ISO 3405 162.1171.2192.5176.8173.7169.3
T50°CEN ISO 3405 277.4209.4238.3251.9230.7233.4
T95°CEN ISO 3405 355.8351.4288.8338.1347.8350.3
FBP°CEN ISO 3405 366.7362.7301.5354.1354.5354.9

Appendix B

Table A2. Result Means and Confidence Intervals.
Euro V: MDVEuro VI: HDV Euro V: MDVEuro VI: HDV
WHVCMean±95% ConfMean±95% ConfUIPMean±95% ConfMean±95% Conf
PM(g/kWh)(g/kWh) (g/kWh)(g/kWh)
EN590 B50.0450.00820.00180.00042 0.0890.01030.00220.0011
LD B50.0330.00590.00150.00042 0.0650.00870.00240.0014
PDF0.0290.00460.00160.00044 0.0470.00550.00180.0011
PDF500.0340.00530.00140.00039 0.0680.00790.00150.0009
B300.0330.00720.00140.00039 0.0520.01190.00110.0007
B30+CNI0.0310.00490.00190.00052 0.0510.00590.00170.0010
CO
EN590 B50.180.0850.0220.020 1.530.100.0600.041
LD B50.110.0570.0030.003 1.100.090.0140.011
PDF0.060.0290.0580.061 0.600.040.0070.005
PDF500.070.0320.0200.021 0.930.060.0430.033
B300.080.0460.0050.005 0.840.070.0010.001
B30+CNI0.080.0440.0010.001 0.780.050.0010.001
HC
EN590 B50.060.0050.0080.0068 0.290.0250.0040.0059
LD B50.150.0140.0100.0103 0.450.0450.0080.0115
PDF0.080.0070.0160.0158 0.240.0200.0010.0011
PDF500.080.0060.0260.0257 0.270.0240.0010.0011
B300.120.0110.0120.0119 0.370.0370.0020.0032
B30+CNI0.110.0100.0110.0114 0.360.0310.0150.0232
NOx
EN590 B53.860.150.540.068 7.290.191.110.102
LD B53.740.170.580.085 6.970.201.160.124
PDF3.680.140.590.086 6.850.171.060.113
PDF503.650.140.580.085 6.990.181.100.117
B303.690.160.700.102 7.040.211.260.134
B30+CNI3.830.170.670.098 7.190.181.290.138
NO2
EN590 B50.160.0100.0840.021 0.230.0130.220.032
LD B50.160.0120.0710.021 0.250.0160.170.030
PDF0.180.0120.0950.028 0.210.0120.180.031
PDF500.160.0100.0720.021 0.240.0140.170.029
B300.160.0120.0760.023 0.230.0150.150.026
B30+CNI0.180.0130.0630.019 0.240.0140.150.026
CO2
EN590 B510147.2710128.9 132617.2111210.3
LD B59828.3997910.3 128919.8108611.9
PDF9607.2795310.3 125417.2105111.9
PDF509857.2797410.3 129817.2107911.9
B309938.3998410.3 130419.8109011.9
B30+CNI9938.3999010.3 130417.2108911.9
N2O
EN590 B50.01760.000660.2990.022 0.0320.00170.440.025
LD B50.01730.000750.3110.026 0.0340.00210.450.029
PDF0.01660.000620.3300.028 0.0340.00180.420.027
PDF500.01740.000650.3460.029 0.0330.00170.460.030
B300.01690.000730.3310.028 0.0350.00210.480.031
B30+CNI0.01730.000750.3680.031 0.0340.00180.510.033
CO2e
EN590 B510197.24109111.3 133517.5122915.3
LD B59878.36106113.1 129820.2120617.7
PDF9647.24104113.1 126317.5116217.7
PDF509907.24106613.1 130617.5120117.7
B309978.36107213.1 131320.2121817.7
B30+CNI9988.36108713.1 131317.5122317.7
fNO2
EN590 B54.2%0.25%15.3%2.57% 3.1%0.17%19.7%1.5%
LD B54.2%0.28%12.3%2.96% 3.5%0.20%15.0%1.8%
PDF5.0%0.25%16.2%2.96% 3.0%0.17%16.9%1.8%
PDF504.5%0.25%12.1%2.96% 3.5%0.17%15.6%1.8%
B304.4%0.28%10.9%2.96% 3.3%0.20%12.0%1.8%
B30+CNI4.6%0.28%9.3%2.96% 3.4%0.17%11.6%1.8%
Vol FC (C-bal)(L/kWh)(L/kWh) (L/kWh)(L/kWh)
EN590 B50.3800.00300.3790.0035 0.4980.00690.4160.0041
LD B50.3900.00350.3880.0041 0.5130.00790.4310.0047
PDF0.4050.00300.4020.0041 0.5300.00690.4430.0047
PDF500.3900.00300.3860.0041 0.5150.00690.4270.0047
B300.3930.00350.3890.0041 0.5170.00790.4310.0047
B30+CNI0.3930.00350.3910.0041 0.5160.00690.4300.0047
Mass FC (C-bal)(g/kWh)(g/kWh) (g/kWh)(g/kWh)
EN590 B5320.62.35319.72.86 420.25.52351.53.35
LD B5314.42.71313.03.30 413.36.38347.33.87
PDF309.72.35307.53.30 405.15.52338.93.87
PDF50314.12.35310.43.30 414.25.52343.83.87
B30324.02.71321.03.30 426.16.38355.63.87
B30+CNI324.12.71322.83.30 426.05.52355.23.87
Mass FC (grav)(g/kWh)(g/kWh) (g/kWh)(g/kWh)
EN590 B5323.62.11322.32.95 431.24.52358.23.24
LD B5318.02.44316.13.40 424.05.22352.63.74
PDF311.02.11308.93.40 413.94.52343.33.74
PDF50317.62.11314.23.40 425.74.52350.93.74
B30330.42.44324.73.40 440.55.22363.53.74
B30+CNI329.82.11328.53.40 440.14.52366.03.74
Specific energy cons(MJ/kWh)(MJ/kWh) (MJ/kWh)(MJ/kWh)
EN590 B513.80.0913.80.13 18.40.2015.30.14
LD B513.70.1013.70.15 18.30.2315.20.16
PDF13.70.0913.60.15 18.30.2015.20.16
PDF5013.80.0913.60.15 18.50.2015.20.16
B3013.80.1013.60.15 18.40.2315.20.16
B30+CNI13.80.0913.70.15 18.40.2015.30.16
PNEuro V: MDVEuro VI: HDV Euro V: MDVEuro VI: HDV
WHVCMean±95% ConfMean±95% ConfUIPMean±95% ConfMean±95% Conf
(#/kWh)(#/kWh) (#/kWh)(#/kWh)
EN590 B55.07 × 10137.90 × 10129.36 × 10121.09 × 10112.69 × 10103.58 × 1010 8.29 × 10131.15 × 10131.34 × 10131.14 × 10111.13 × 10101.25 × 1010
LD B55.03 × 10137.83 × 10129.28 × 10129.74 × 10102.72 × 10103.78 × 1010 8.12 × 10131.13 × 10131.31 × 10131.12 × 10111.27 × 10101.43 × 1010
PDF4.44 × 10136.92 × 10128.20 × 10121.03 × 10112.88 × 10104.00 × 1010 7.33 × 10131.02 × 10131.18 × 10131.12 × 10111.27 × 10101.43 × 1010
PDF505.32 × 10137.26 × 10128.41 × 10129.55 × 10102.67 × 10103.71 × 1010 9.07 × 10131.10 × 10131.26 × 10131.10 × 10111.24 × 10101.40 × 1010
B304.78 × 10137.44 × 10128.82 × 10121.24 × 10113.46 × 10104.80 × 1010 7.58 × 10131.05 × 10131.22 × 10131.29 × 10111.46 × 10101.64 × 1010
B30+CNI4.55 × 10137.10 × 10128.41 × 10121.17 × 10113.27 × 10104.54 × 1010 7.44 × 10131.03 × 10131.20 × 10131.25 × 10111.41 × 10101.59 × 1010
WHVCEuro VI: HDVUIPEuro VI: HDVWHVCEuro VI: HDVUIPEuro VI: HDV
NOx conv.Mean±95% Conf Mean±95% ConfNH3Mean±95% Conf Mean±95% Conf
(%) (%) (g/kWh) (g/kWh)
EN590 B594%0.8% 91%0.7% 0.0090.0030 0.00770.0012
LD B593%1.0% 90%0.8% 0.0090.0035 0.00790.0014
PDF92%1.0% 90%0.8% 0.0160.0063 0.00930.0017
PDF5093%1.0% 91%0.8% 0.0110.0043 0.00860.0015
B3092%1.0% 90%0.8% 0.0120.0046 0.01160.0021
B30+CNI92%1.0% 89%0.8% 0.0180.0068 0.01530.0027
WHVCEuro VI: HDVUIPEuro VI: HDVWHVCEuro V: MDVUIPEuro V: MDV
AdBlue cons.Mean±95% Conf Mean±95% ConfEGRMean±95% Conf Mean±95% Conf
(g/kWh) (g/kWh) (%) (%)
EN590 B517.600.601 24.230.630 270.74 10.40.63
LD B517.520.691 24.220.727 260.86 9.80.73
PDF16.240.641 22.700.681 260.74 10.00.63
PDF5017.540.692 24.090.723 260.74 10.10.63
B3017.490.690 24.820.745 280.86 10.50.73
B30+CNI18.320.723 25.440.764 270.74 10.60.63
Note: PN means are geometric means.

References

  1. EN 590–Diesel–Requirements and Test Methods (Includes Amendment: 2017); European Committee for Standardization: Brussels, Belgium, 2017.
  2. Renewable Energy Directive 2018/2001/EU; European Union: Brussels, Belgium, 2018.
  3. Williams, A.; McCormick, R.L.; Hayes, R.R.; Ireland, J.; Fang, H.L. Effect of Biodiesel Blends on Diesel Particulate Filter Performance; SAE Technical Paper 2006-01-3280; SAE International: Warrendale, PA, USA, 2006. [Google Scholar] [CrossRef] [Green Version]
  4. Czerwinski, J.; Bürki, S.; Bonsack, P.; Mayer, A.; Renz, S.; D’Urbano, G.; Heeb, S.N.; Eggenschwiler, P.D. DPF’s Regeneration Procedures and Emissions with RME Blend Fuels; SAE Technical Paper 2012-01-0844; SAE International: Warrendale, PA, USA, 2012. [Google Scholar] [CrossRef] [Green Version]
  5. Lüers, B.; Kolbeck, A.F.; Koerfer, T.; Bhardwaj, O.P.; Kremer, F. Impact of Biomass-Derived Fuels on Soot Oxidation and DPF Regeneration Behavior; SAE Technical Paper 2013-01-1551; SAE International: Warrendale, PA, USA, 2013. [Google Scholar]
  6. Lamharess, N.; Starck, L.; Millet, C.N.; Da Costa, P. Effect of Biofuels on Catalyzed Diesel Particulate Filter Regeneration. Top. Catal. 2013, 56, 462–466. [Google Scholar] [CrossRef]
  7. Katsaounis, D.; Samaras, C.; Geivanidis, S.; Samaras, Z.; Rose, K.; Jansen, L.; Fittavolini, C.; Clark, R.; Almena, M.D.C. Impact of FAME Content on the Regeneration Frequency of Diesel Particulate Filters; SAE Techical Paper 2014-01-1605; SAE International: Warrendale, PA, USA, 2014. [Google Scholar]
  8. Concawe Report 6/14: Impact of FAME on the Performance of Three Euro 4 Light Duty Vehicles: Part 1 Fuel Consumption and Regulated Emissions; Concawe: Brussels, Belgium, 2014.
  9. Nikanjam, M.; Rutherford, J.; Morgan, P. Performance and Emissions of Diesel and Alternative Diesel Fuels in Modern Light-Duty Diesel Vehicles; SAE Technical Paper 2011-24-0198; SAE International: Warrendale, PA, USA, 2011. [Google Scholar]
  10. Gunter, G.; Williams, R.; Zemroch, P.J.; Fittavolini, C.; Bartsch, T.; Van de Heijning, P.; Samaras, Z.; Dimaratos, A.; Hamje, H.; Richeard, D.J.; et al. Effect of Diesel Properties on Emissions and Fuel Consumption from Euro 4, 5 and 6 European Passenger Cars; SAE Technical Paper 2016-01-2246; SAE International: Warrendale, PA, USA, 2016. [Google Scholar] [CrossRef]
  11. Durbin, T.D.; Miller, J.W.; Johnson, K.; Hajbabaei, M.; Kado, N.Y.; Kobayashi, R.; Liu, X.; Vogel, C.F.A.; Matsumura, F.; Wong, P.S.; et al. CARB Assessment of the Emissions from the Use of Biodiesel as a Motor Vehicle Fuel in California Biodiesel Characterization and NOx Mitigation Study. Available online: https://ww3.arb.ca.gov/fuels/diesel/altdiesel/20111013_carb%20final%20biodiesel%20report.pdf (accessed on 9 July 2021).
  12. Fuel Quality Directive, European Commission Directive 98/70/EC and Amendments; European Commission: Brussels, Belgium, 1998.
  13. UNE EN 15940:2016+A1:2019+AC:2019. Automotive Fuels—Paraffinic Diesel Fuel from Synthesis or Hydrotreatment—Requirements and Test Methods; UNE: Madrid, Spain, 2019. [Google Scholar]
  14. Bhardwaj, O.P.; Holderbaum, B.; Omari, A.; Pischinger, S.; Nuottimäki, J.; Honkanen, M. Improving Engine Efficiency and Emission Reduction Potential of HVO by Fuel-Specific Engine Calibration in Modern Passenger Car Diesel Applications. SAE Int. J. Fuels Lubr. 2017, 10. [Google Scholar] [CrossRef]
  15. Scorletti, P.; Napolitano, P.; Beatrice, C.; Guido, C.; Del Giacomo, N.; Pellegrini, L. Hydrocracked Fossil Oil and Hydrotreated Vegetable Oil (HVO) Effects on Combustion and Emissions Performance of “Torque-Controlled” Diesel Engines; SAE Technical Paper 2015-24-2497; SAE International: Warrendale, PA, USA, 2015. [Google Scholar] [CrossRef]
  16. Shukla, P.C.; Shamun, S.; Gren, L.; Malmborg, V.; Pagels, J.; Tuner, M. Investigation of Particle Number Emission Characteristics in a Heavy-Duty Compression Ignition Engine Fueled with Hydrotreated Vegetable Oil (HVO). SAE Int. J. Fuels Lubr. 2018, 11, 495–505. [Google Scholar] [CrossRef]
  17. Yugo, M.; Soler, A. A Look into the Role of E-Fuels in the Transport System in Europe (2030–2050)), Concawe Review; Concawe: Brussels, Belgium, 2019. [Google Scholar]
  18. Anderson, J.; Ziman, P.; Williams, R.; Dauphin, R.; Hamje, H.; Rogerson, J. Fuel Effects on Regulated and Unregulated Emissions from Three Light-Duty Euro 5 and Euro 6 Diesel Passenger Cars; SAE Technical Paper 2020-01-2147; SAE International: Warrendale, PA, USA, 2020. [Google Scholar] [CrossRef]
  19. Williams, R.; Hamje, H.; Andersson, J.; Ziman, P.; Rickeard, D.; Pellegrini, L.; Fittavolini, C. Effect of fuel quality on emissions over RDE and a comparison of RDE and CD test emissions from Euro 6 diesel cars. In Proceedings of the IMechE Powertrains Conference 2017, Birmingham, UK, 6–7 December 2017. [Google Scholar]
  20. Steven, H. Development of a World-Wide Harmonised Heavy-Duty Engine Emissions Test Cycle. Available online: https://unece.org/fileadmin/DAM/trans/doc/2001/wp29grpe/TRANS-WP29-GRPE-41-inf01.pdf (accessed on 9 July 2021).
  21. World Harmonized Vehicle Cycle (WHVC). Available online: https://dieselnet.com/standards/cycles/whvc.php (accessed on 9 July 2021).
  22. Hamje, H.; Oliva, F.; Fittavolini, C.; Pellegrini, L.; Andersin, J.; Van de Heijning, P.; Kar, K.; Gunther, G.; Williams, R.; Ziman, P. Impact of Demanding Low Temperature Urban Operation on the Real Driving Emissions Performance of Three European Diesel Passenger Cars; SAE Technical Paper 2018-01-1819; SAE International: Warrendale, PA, USA, 2018. [Google Scholar] [CrossRef]
  23. AR5/GWP Figures for the 100-Year Potential, GREET Model. Available online: https://greet.es.anl.gov/greet.models (accessed on 9 July 2021).
  24. Murtonen, T.; Aakko-Saksa, P.; Kuronen, M.; Mikkonen, S.; Lehtoranta, K. Emissions with Heavy-Duty Diesel Engines and Vehicles Using FAME, HVO and GTL Fuels with and without DOC POC Aftertreatment. SAE Int. J. Fuels Lubr. 2010, 2, 147–166. [Google Scholar] [CrossRef]
  25. Jaroonjitsathian, S.; Saisirirat, P.; Sivara, K.; Tongroon, M.; Chollacoop, N. Effects of GTL and HVO Blended Fuels on Combustion and Exhaust Emissions of a Common-Rail di Diesel Technology; SAE Technical Papers; SAE International: Warrendale, PA, USA, 2014. [Google Scholar] [CrossRef]
  26. Nylund, N.-O.; Erkkilä, K.; Ahtiainen, M.; Murtonen, T.; Saikkonen, P.; Amberla, A.; Aatola, H. Optimized Usage of NExBTL Renewable Diesel Fuel (OPTIBIO); VTT Technical Research Centre of Finland: Espoo, Finland, 2011. [Google Scholar]
Figure 1. Vehicle speed profile of the WHVC (upper) and of the TfL UIP test cycle (lower).
Sustainability 13 07985 g001
Figure 2. CO2 from the EN590 B5, low-density B5, paraffinic diesel fuel and EN590 B5/PDF 50:50 blend, with error bars denoting the 95% confidence interval about the mean: upper WHVC, lower TfL UIP. Results which are significantly different from the EN590 B5 fuel are shown with patterned bars.
Sustainability 13 07985 g002
Figure 3. CO2 between the low-density B5, B30 and B30 with CNI, with error bars denoting the 95% confidence interval about the mean: upper WHVC, lower TfL UIP. No differences are statistically significant.
Sustainability 13 07985 g003
Figure 4. Volumetric (upper) and mass (lower) specific fuel consumptions from the EN590 B5, low-density B5, paraffinic diesel fuel and EN590 B5/PDF 50:50 blend: WHVC and TfL UIP.
Sustainability 13 07985 g004aSustainability 13 07985 g004b
Figure 5. Volumetric (upper) and mass (lower) specific fuel consumptions from the low-density B5, B30 and B30 with CNI.
Sustainability 13 07985 g005aSustainability 13 07985 g005b
Figure 6. Energy consumption from the EN590 B5, low-density B5, paraffinic diesel fuel and EN590 B5/PDF 50:50 blend.
Sustainability 13 07985 g006
Figure 7. Energy consumption from the low-density B5, B30 and B30 with CNI.
Sustainability 13 07985 g007
Figure 8. Tailpipe NOx from the EN590 B5, low-density B5, paraffinic diesel fuel and EN590 B5/PDF 50:50 blend.
Sustainability 13 07985 g008
Figure 9. Tailpipe NOx from the low-density B5, B30 and B30 with CNI.
Sustainability 13 07985 g009aSustainability 13 07985 g009b
Figure 10. Engine-out and tailpipe NOx from the Euro VI HDV with EN590 B5, low-density B5, paraffinic diesel fuel and EN590 B5/PDF 50:50 blend showing lower engine-out NOx with the PDF.
Sustainability 13 07985 g010
Figure 11. Engine-out NOx versus AdBlue consumption from the Euro VI HDV with all tests showing lower engine-out NOx with the PDF and a general correlation between the quantities.
Sustainability 13 07985 g011
Figure 12. PM from the EN590 B5, low-density B5, paraffinic diesel fuel and EN590 B5/PDF 50:50 blend.
Sustainability 13 07985 g012
Figure 13. PM from the low-density B5, B30 and B30 with CNI.
Sustainability 13 07985 g013aSustainability 13 07985 g013b
Figure 14. Particles number in the >23 nm range from the EN590 B5, low-density B5, paraffinic diesel fuel and EN590 B5/PDF 50:50 blend fuels.
Sustainability 13 07985 g014
Figure 15. Particles number in the >23 nm range from the LD B5, B30 and B30+CNI.
Sustainability 13 07985 g015
Figure 16. CO from the EN590 B5, low-density B5, paraffinic diesel fuel and EN590 B5/PDF 50:50 blend.
Sustainability 13 07985 g016
Figure 17. CO from the low-density B5, B30 and B30+CNI.
Sustainability 13 07985 g017aSustainability 13 07985 g017b
Figure 18. HC from the EN590 B5, low-density B5, paraffinic diesel fuel and EN590 B5/PDF 50:50 blend.
Sustainability 13 07985 g018
Figure 19. HC from the low-density B5, B30 and B30+CNI.
Sustainability 13 07985 g019
Figure 20. Total GHG emissions (CO2 and N2O) from the EN590 B5, low-density B5, paraffinic diesel fuel and EN590 B5/PDF 50:50 blend. The top section of the bars denotes the N2O contribution.
Sustainability 13 07985 g020
Figure 21. Total GHG emissions (CO2 and N2O) from the low-density B5, B30 and B30+CNI. The top section of the bars denotes the N2O contribution.
Sustainability 13 07985 g021aSustainability 13 07985 g021b
Figure 22. Ammonia emissions from the EN590 B5, low-density B5, paraffinic diesel fuel and EN590 B5/PDF 50:50 blend.
Sustainability 13 07985 g022aSustainability 13 07985 g022b
Figure 23. Ammonia emissions from the low-density B5, B30 and B30+CNI.
Sustainability 13 07985 g023
Table 1. Key properties of test fuels (see full data in Appendix A for measurement methods).
UnitsF1-EN590 B5F2-LD B5F3-PDFF4-PDF50F5-B30F6-B30+CNI
Densitykg/L0.8450.8050.7640.8050.8250.826
Cetane number-52.051.479.667.052.465.8
Viscosity at 40 °Cmm2/s2.571.661.952.182.092.10
FAME content%v/v4.65.1<0.12.430.530.3
PAH content%m/m3.60.8<0.11.90.70.4
Total aromatics%m/m34.07.00.117.95.14.5
Carbon content%m/m86.4585.3384.6285.6683.5983.60
Hydrogen content%m/m13.0514.1215.3814.0813.1213.12
Oxygen content%m/m0.500.550.000.263.293.27
Net heating value (m)MJ/kg42.6943.2344.1743.3841.6941.69
Net heating value (v)MJ/L36.0734.8033.7534.9234.3934.44
CO2 intensity (calc)gCO2/MJ74.272.470.372.473.473.4
IBP°C162.1171.2192.5176.8173.7169.3
T50°C277.4209.4238.3251.9230.7233.4
T95°C355.8351.4288.8338.1347.8350.3
FBP°C366.7362.7301.5354.1354.5354.9
Table 2. Key test vehicle details.
DescriptionHeavy-Duty Bus (HDV)Medium-Duty Delivery Truck (MDV)
Emissions classEuro VIEuro V
Year of registration20162012
Engine cylinders/displacement (dm3)6 L/7.74 L/4.6
Peak power (kW)235162
Peak torque (Nm)1200850
Fuel injection equipmentCommon rail, exhaust-mounted injector for aftertreatment heatingCommon rail
Exhaust aftertreatmentHP EGR, DOC, DPF, SCR, ASCHP EGR, DOC
Unladen weight (t)14.656.0
Gross vehicle weight (t)24.7510.0
Vehicle mileage at SOT (km)344,000300,000
Table 3. Comparison of features of the WHVC and TfL UIP test cycles.
WHVCTfL UIP
Time (s)18002310
Distance (km)20.18.9
Average speed (km/h)40.113.9
Maximum speed (km/h)87.852.3
Maximum acceleration (m/s2)1.592.67
Minimum deceleration (m/s2)−1.73−3.29
Idle time (s)247789
Table 4. Main measurements and measuring systems.
DeviceMetricPrinciple
AVL CVS i60, CVS 2000Dilute exhaust flowFull flow CVS
AVL i60 IRDCO, CO2NDIR
AVL i60 HFIDHCHeated FID
AVL i60 HCLDNO/NOxHeated CLD
AVL PSS i60Particle massFilter paper mass
Mass balanceFuel consumptionGravimetric
Mass balanceUrea consumptionGravimetric
Airmodus A23 and Dekati DEED-100Particle number >23 nmCPC + diluter
Froude-Consine AC dynamometer, single 2.5 m roller, 300 kW ratingTorque and vehicle wheel speedLoad cell and inductive pick up
Froude loggerCell air and exhaust gas temperaturesK-type thermocouple
CAN loggerCAN/OBD vehicle data including oil and coolant temperaturesJ1939 protocol
FTIR before EATCO2, CO, NO, NO2, NOx, HCFTIR
FTIR post EATNH3, N2OFTIR
Table 5. Actual fuels test order of valid tests.
Test No.HDV BusMDV Delivery Truck
Test 1F6F4
Test 2F3F2
Test 3F1F5
Test 4F5F6
Test 5F3F3
Test 6F2F1
Test 7F6F5
Test 8F1F3
Test 9F4F2
Test 10F6F4
Test 11F2F1
Test 12F4F6
Test 13F3F2
Test 14F5F4
Test 15F1F3
Test 16F5F5
Test 17F2F1
Test 18F4F6
Test 19F1F4
Test 20-F1
Test 21-F3
Table 6. Single test protocol.
StepTime (min)
Equipment warm up and calibration, fuel change60
Vehicle warm up/conditioning (80 km/h) and fuel flush30
WHVC test30
Sample analysis10
Vehicle conditioning (80 km/h)10
TfL UIP test40
Sample analysis10
Coast down check (at end of day)5
Total (h)3.25
Publisher’s Note: MDPI stays neutral with regard to jurisdictional claims in published maps and institutional affiliations.

