1. Introduction
The expressway maintenance operation area is a typical traffic bottleneck area and an accident-prone area. Taking the Guizhou Expressway located in the mountainous area as an example, a total of 26,465 traffic accidents occurred from 2016 to 2019, of which 252 occurred directly in the maintenance operation area, accounting for 0.95%. Carrying out the risk assessment of the safe operation of the maintenance operation area is of great significance for reducing driving safety accidents.
Regarding the evaluation of the safety risks of highway maintenance work areas to improve the level of safe operation, it is mainly based on actual survey data and statistical data that allow a macro analysis and an evaluation of risks from indicators such as vehicle speed dispersion, cross-sectional vehicle speed changes, and vehicle operating speeds by vehicle type to be carried out [
1,
2,
3,
4]. Richard and Dudek’s research found that an excessively high vehicle speed is the cause of the high incidence of accidents in the maintenance work area, and the safety of the work area can be improved by speed limits [
5]. Huang’s VISSIM simulation research results showed that a speed limit below 30 km/h can effectively reduce the vehicle speed variance and reduce the accident rate [
6]. The
Manual of Unified Traffic Control Devices (MUTCD2009) in the US clarifies that the speed limit in the construction area cannot be lower than 16 km/h, and this value is determined by the influence of the speed variance [
7,
8]. According to different design speeds, the “Safety Operating Regulations for Highway Maintenance” stipulates different speed limits of 80 km/h, 60 km/h and 40 km/h on expressways. It also stipulates that gradual speed limits and repeated prompts for speed limits can be adopted [
9].
As for the safety risk evaluation index system and the safety evaluation model, Wu established a road maintenance traffic accident risk prediction model based on the grey system theory [
10]. In the study by Wu et al. [
11], the Bayesian theory was used which has established an evaluation index system for operating risks in highway maintenance work areas and proposed control countermeasures for operating risks. Wu et al. [
12,
13,
14] established an indicator system for traffic safety influencing factors in expressway operation areas from the point of view of people, vehicles, roads, and the environment, and based on DEMADAL and other methods. They also established an identification model for traffic safety influencing factors in the operation area. Li established a maintenance work area construction risk source system and work area risk hierarchical management measures, and macroscopically pointed out the safety evaluation and management focus of expressway construction areas [
15]. Ding used the Bayesian network model to evaluate the construction risks in the work area, identified the main risk factors in the construction process, built the Bayesian network model, and graded the risks [
16]. Chen used the grey evaluation theory to evaluate the driving risk in the maintenance operation area and to classify the hazard sources [
17]. Wang carried out a safety evaluation and early warning research on highway construction in mountainous areas [
18]. Zhu established a traffic conflict analysis model for highway overhaul projects and proposed a traffic organization plan for the maintenance operation areas of highway overhaul projects [
19]. Tian used the BP neural network to identify the main risk sources in the maintenance work area and to build a risk management system based on the Near-Miss risk management theory [
20]. Li established a safety prevention system for mountain highway construction [
21]. Liang evaluated the effects of different work area layouts based on the conflict rate [
22].
The road traffic system is a dynamic coupling system that is composed of factors such as people, vehicles, roads, and road environment [
23]. Human factors, vehicle structure and use factors, the protection of construction workers, and the maintenance of construction machinery, traffic signs and other safety facilities and passing vehicles together constitute the local road environment and are the factors that we focus on in this paper [
24,
25,
26].
Reliability is defined as the probability that a component, product, or system can complete its specified function without failure in a specified environment, within a specified time, and under specified conditions. In 1939, the reliability theory was first proposed by the American Aviation Commission to evaluate the accident rate of aircraft [
27]. Subsequently, the reliability theory was widely used in various industries, and it played a particularly important role in reducing system failure rates, improving system anti-risk capabilities, and reducing losses caused by failures. The transportation field also began to use the reliability theory for related research. A study by the Japanese scholars Mine and Kawai put forward the concept of connectivity reliability to study the operational status of road networks under disaster conditions such as earthquakes, and first introduced reliability into the field of transportation [
28]. Asakusa et al. [
29] proposed the concept of operating time reliability, which is defined as the probability of a vehicle starting at point O and ending at point D within a specified time which is used to describe the operating state of the road network. Anthony Chen proposed the definition of road network capacity reliability, which is used to express the probability that the road network capacity can meet the traffic needs of road users under certain service level conditions [
30]. Zhu et al. proposed a method to evaluate the traffic network by using the reliability of the traffic network [
31]. Chen et al. [
32] put forward the concept of unblocked reliability. They believed that there is a randomness in traffic supply and demand. The state where the actual traffic capacity of the road can meet the actual road traffic demand is regarded as the unblocked state, and the road reliability is evaluated from the perspective of supply and demand. Pei et al. [
33] pointed out that there is a difference between the reliability of the urban road network and the reliability of the road network. They respectively analysed the influencing factors of the two, defined the connotation of the road network operation reliability, and proposed the Monte Carlo method for the road network operation reliability. In relation to the simulation method, Zang studied the travel time reliability of arterial highways under ice and snow conditions and established a corresponding reliability model [
34]. Dong et al. used the negative binomial model to study the frequency of accidents in the maintenance work area. The results show that the frequency of accidents increases with the duration of the work area, the length of the work area and the average daily traffic flow [
35]. Xu analysed the risk of rear-end collision in the construction area of an expressway through modelling, and the results showed that the rear-end collision in the construction area is related to the length of the work area, traffic flow, truck ratio, construction area type, etc., [
36]. Zhou et al. [
37] proposed that traffic volume, vehicle rate, lane closure type, the lateral distance of the closed lane, the slope, and the length of the work area are the main factors that affect the traffic in the maintenance work area.
The highway maintenance operation control area is generally arranged in order into six areas, such as the warning area. In reliability theory, the maintenance work area can be regarded as a system composed of these six elements. In the process of traffic operation, the occurrence of an accident may cause traffic congestion or an interruption in the road section. After the accident has been handled, the traffic operation returns to normal. This phenomenon conforms to the description of system failure in the reliability theory. The reliability system can be used to simulate the maintenance work area system.
Therefore, based on the characteristics of high-speed truck traffic in mountainous areas, which include a relatively small work area length and relatively low speed limit values, this paper designs 3 types of traffic flows, 5 types of intersection components, 5 types of work area lengths, 3 types of speed limit values, 3 kinds of traffic organization methods, and a total of 675 groups of VISSIM traffic simulation experiments based on the reliability theory to analyse the number of traffic conflicts under different working conditions. The conclusions of this study have important practical significance for the traffic organization of the maintenance work area.
3. Results and Discussion
3.1. Analysis of the Relationship between Activity Area Length and Traffic Conflicts
In
Figure 1,
Figure 2,
Figure 3,
Figure 4,
Figure 5,
Figure 6,
Figure 7,
Figure 8 and
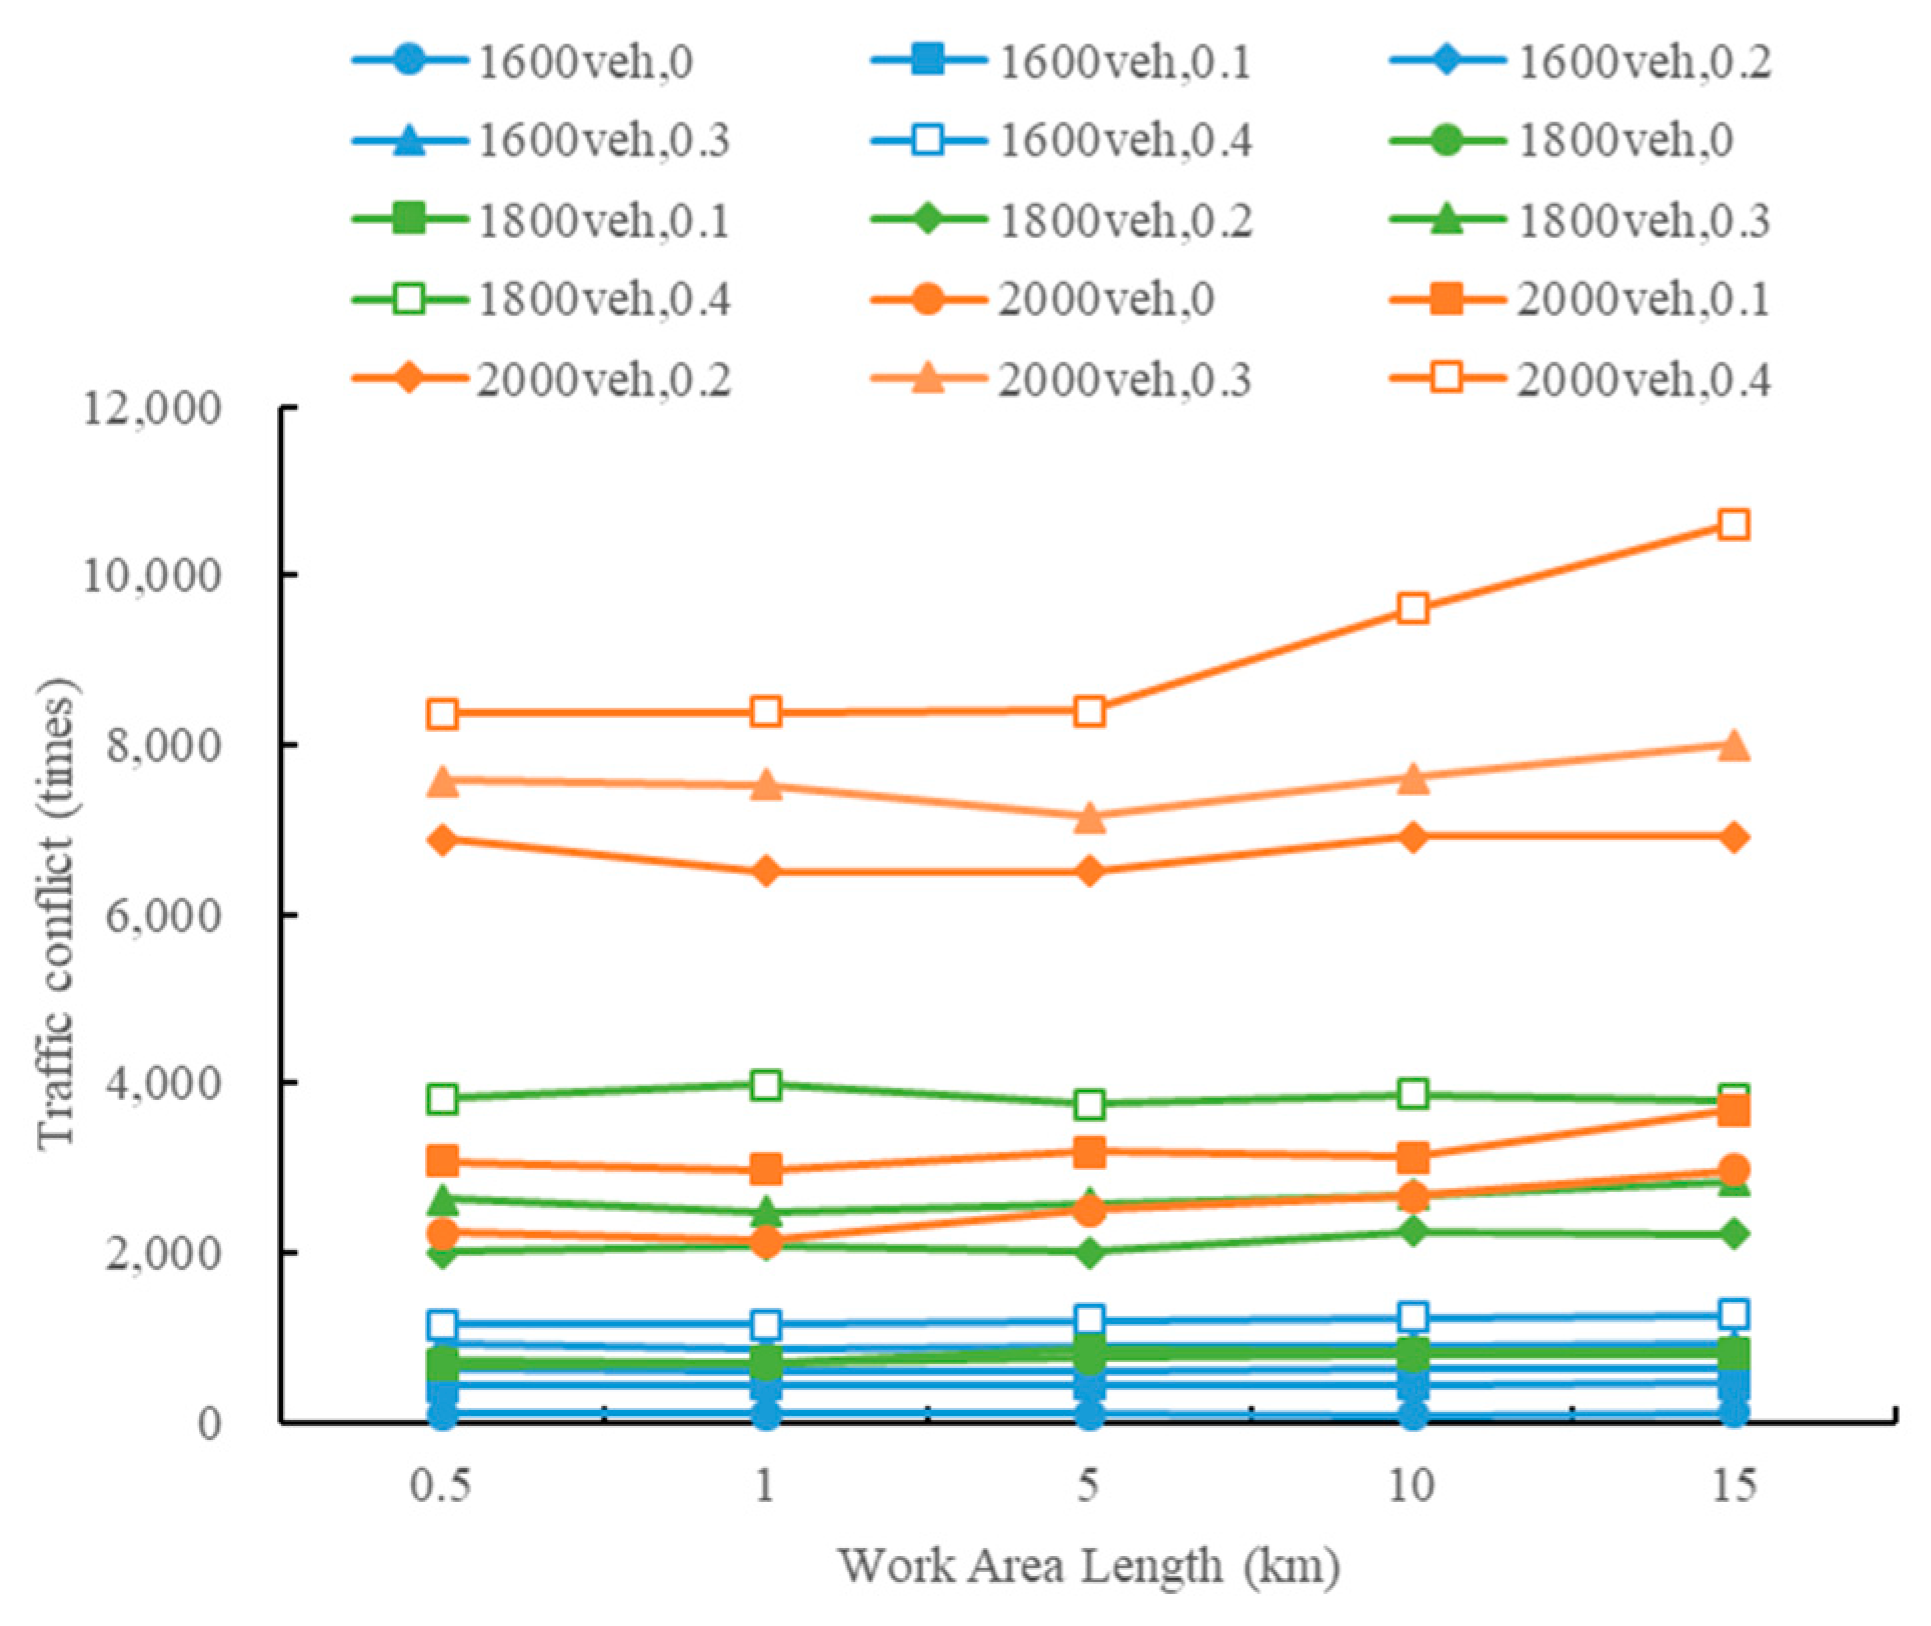
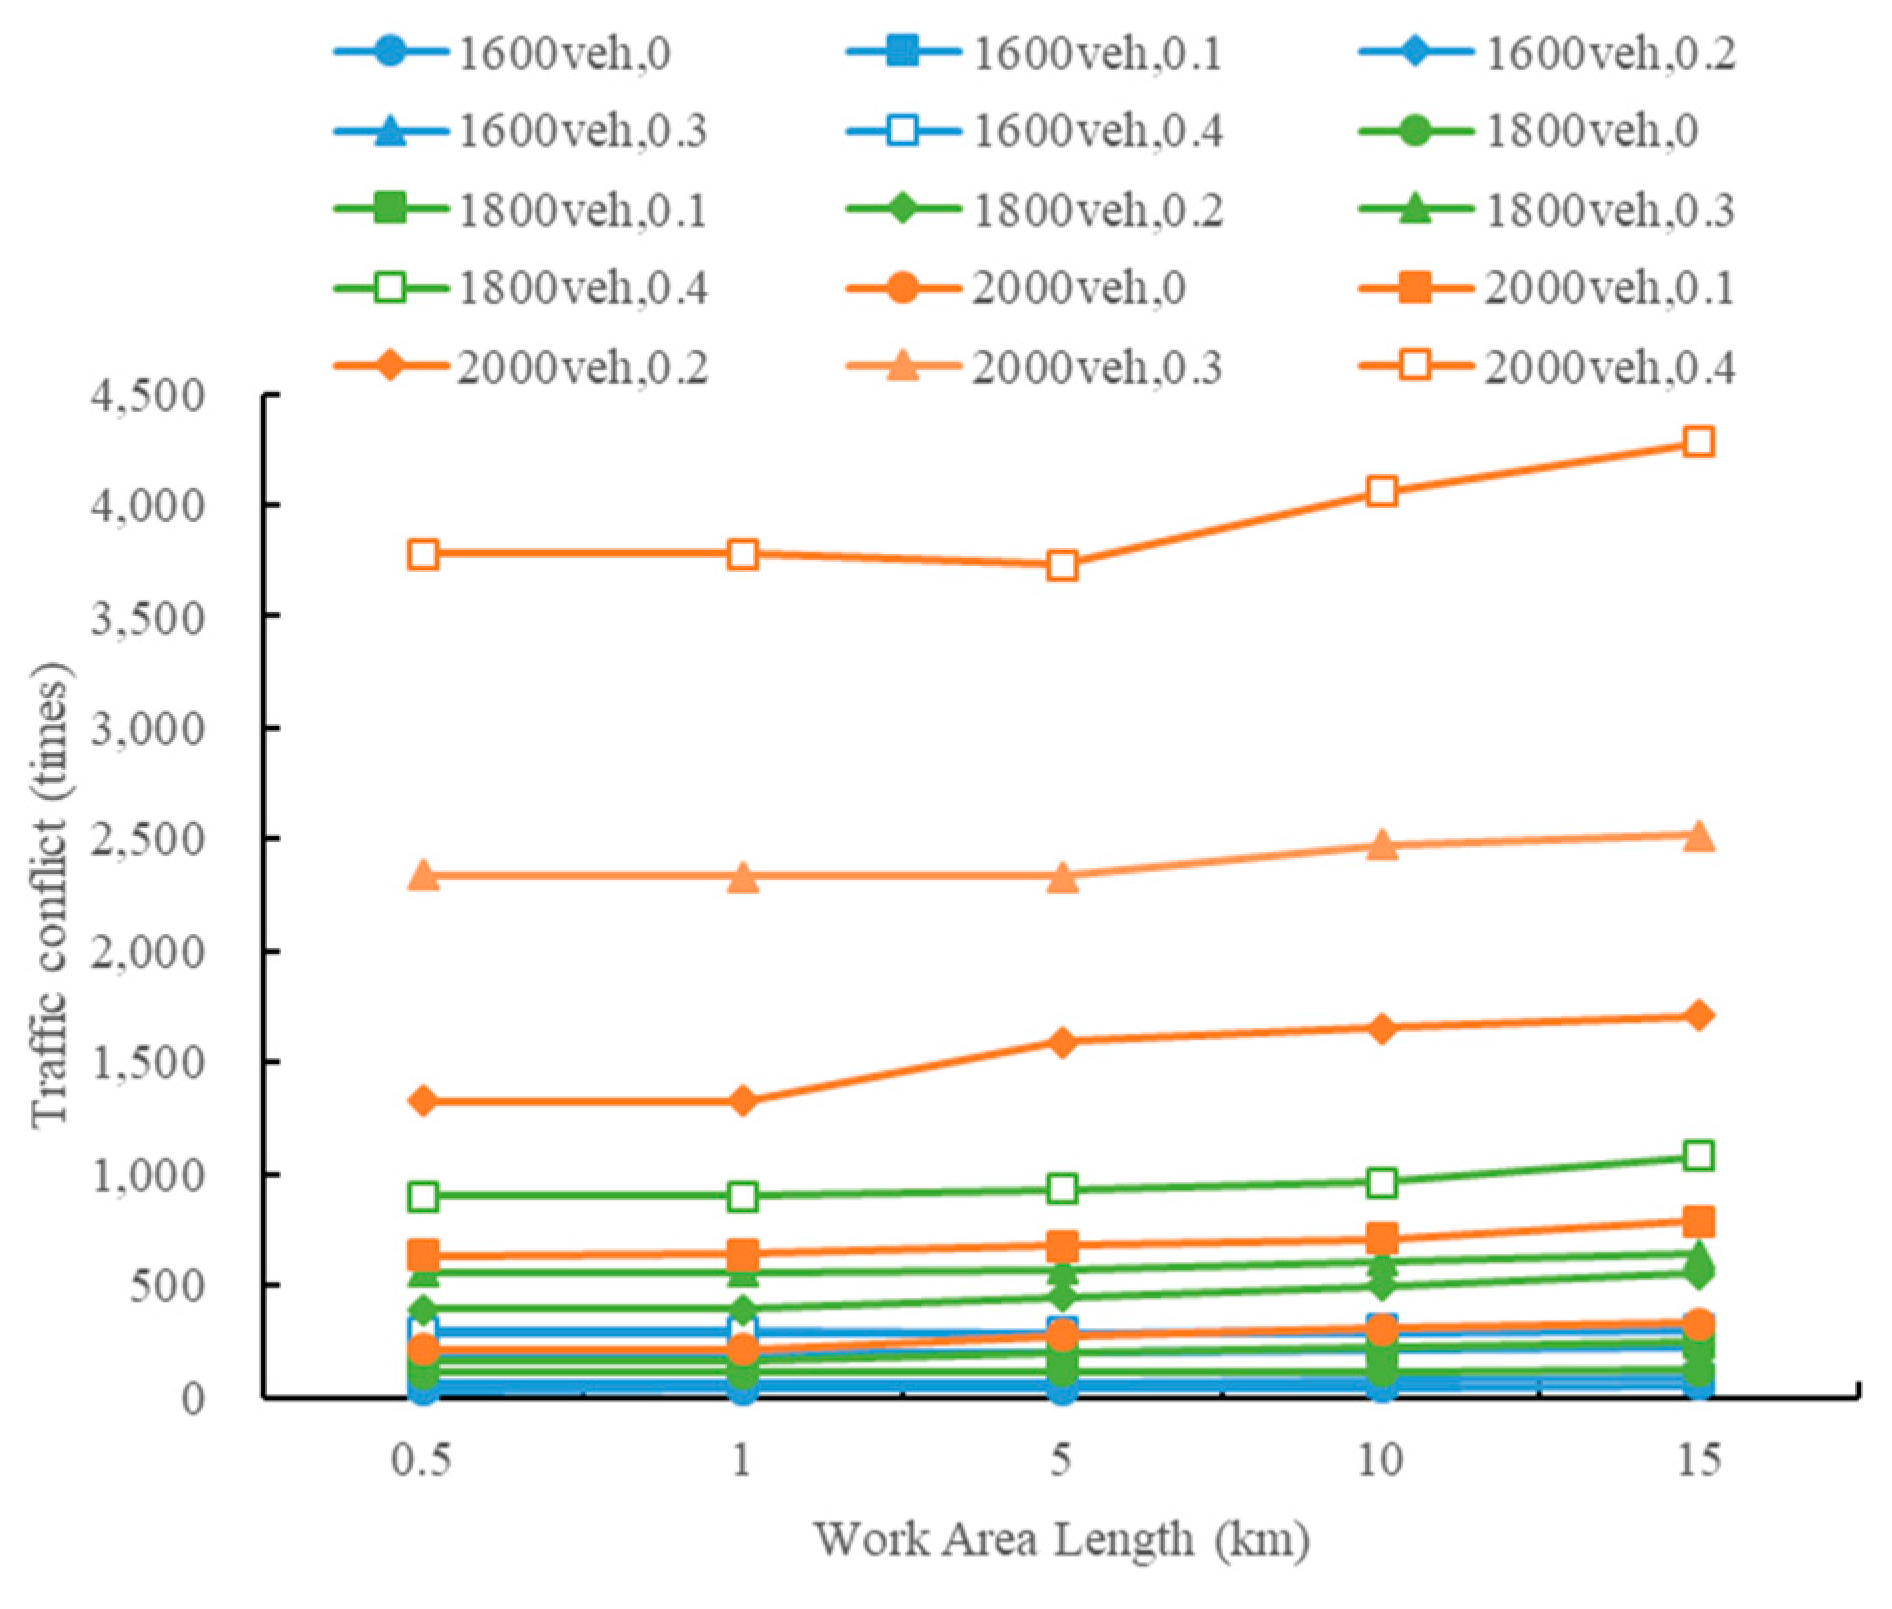
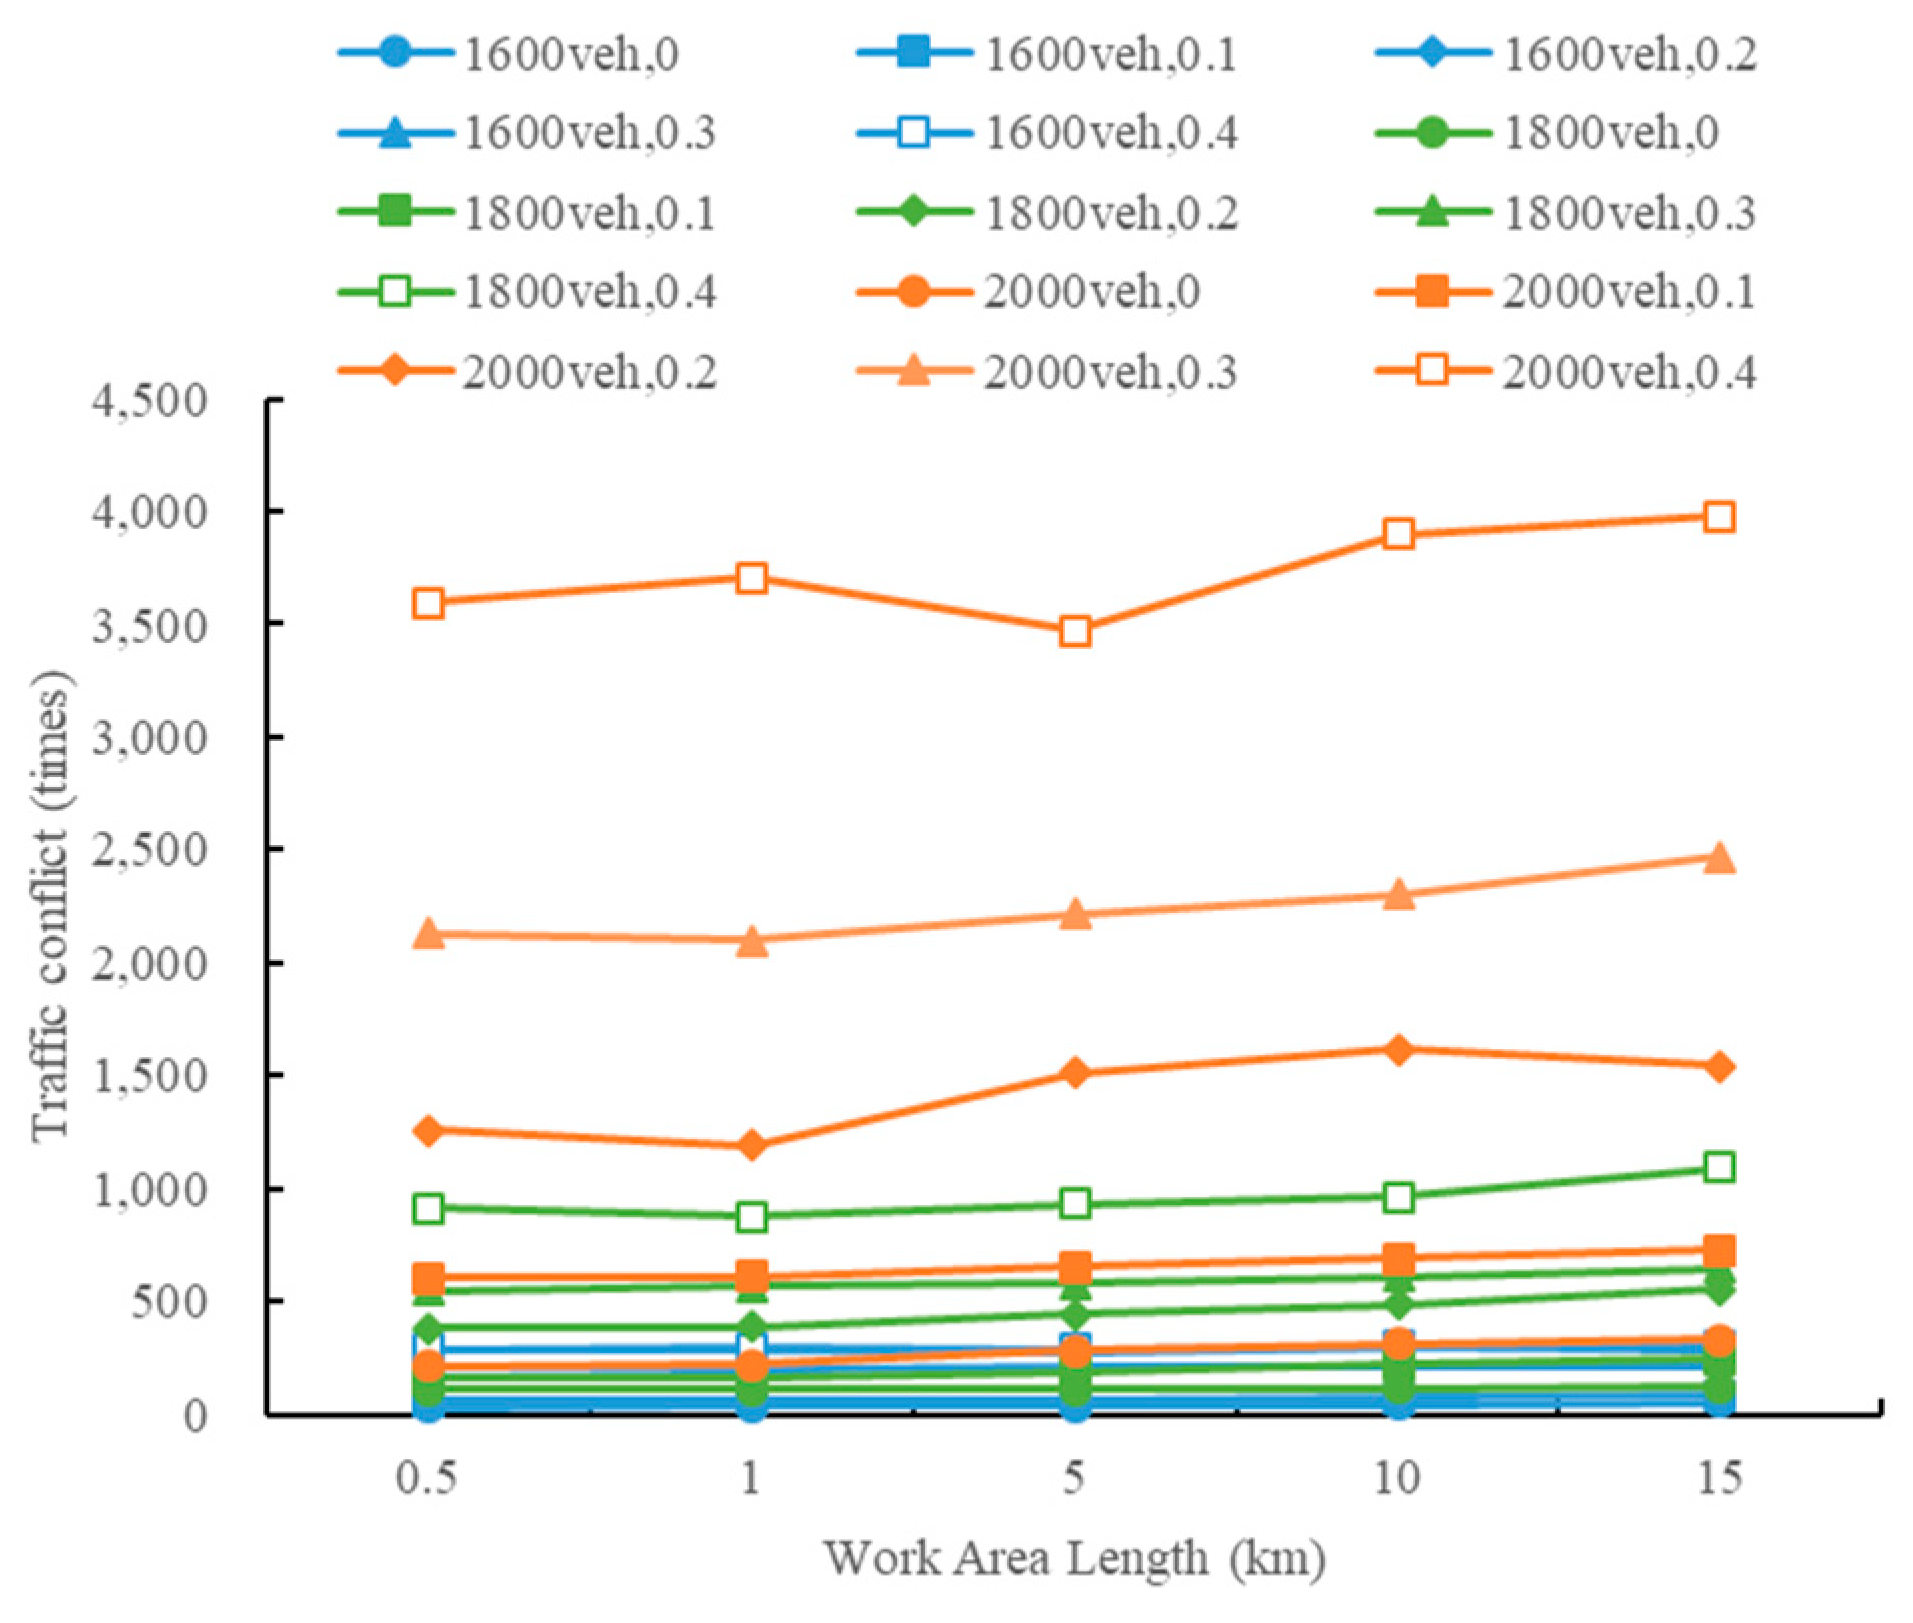
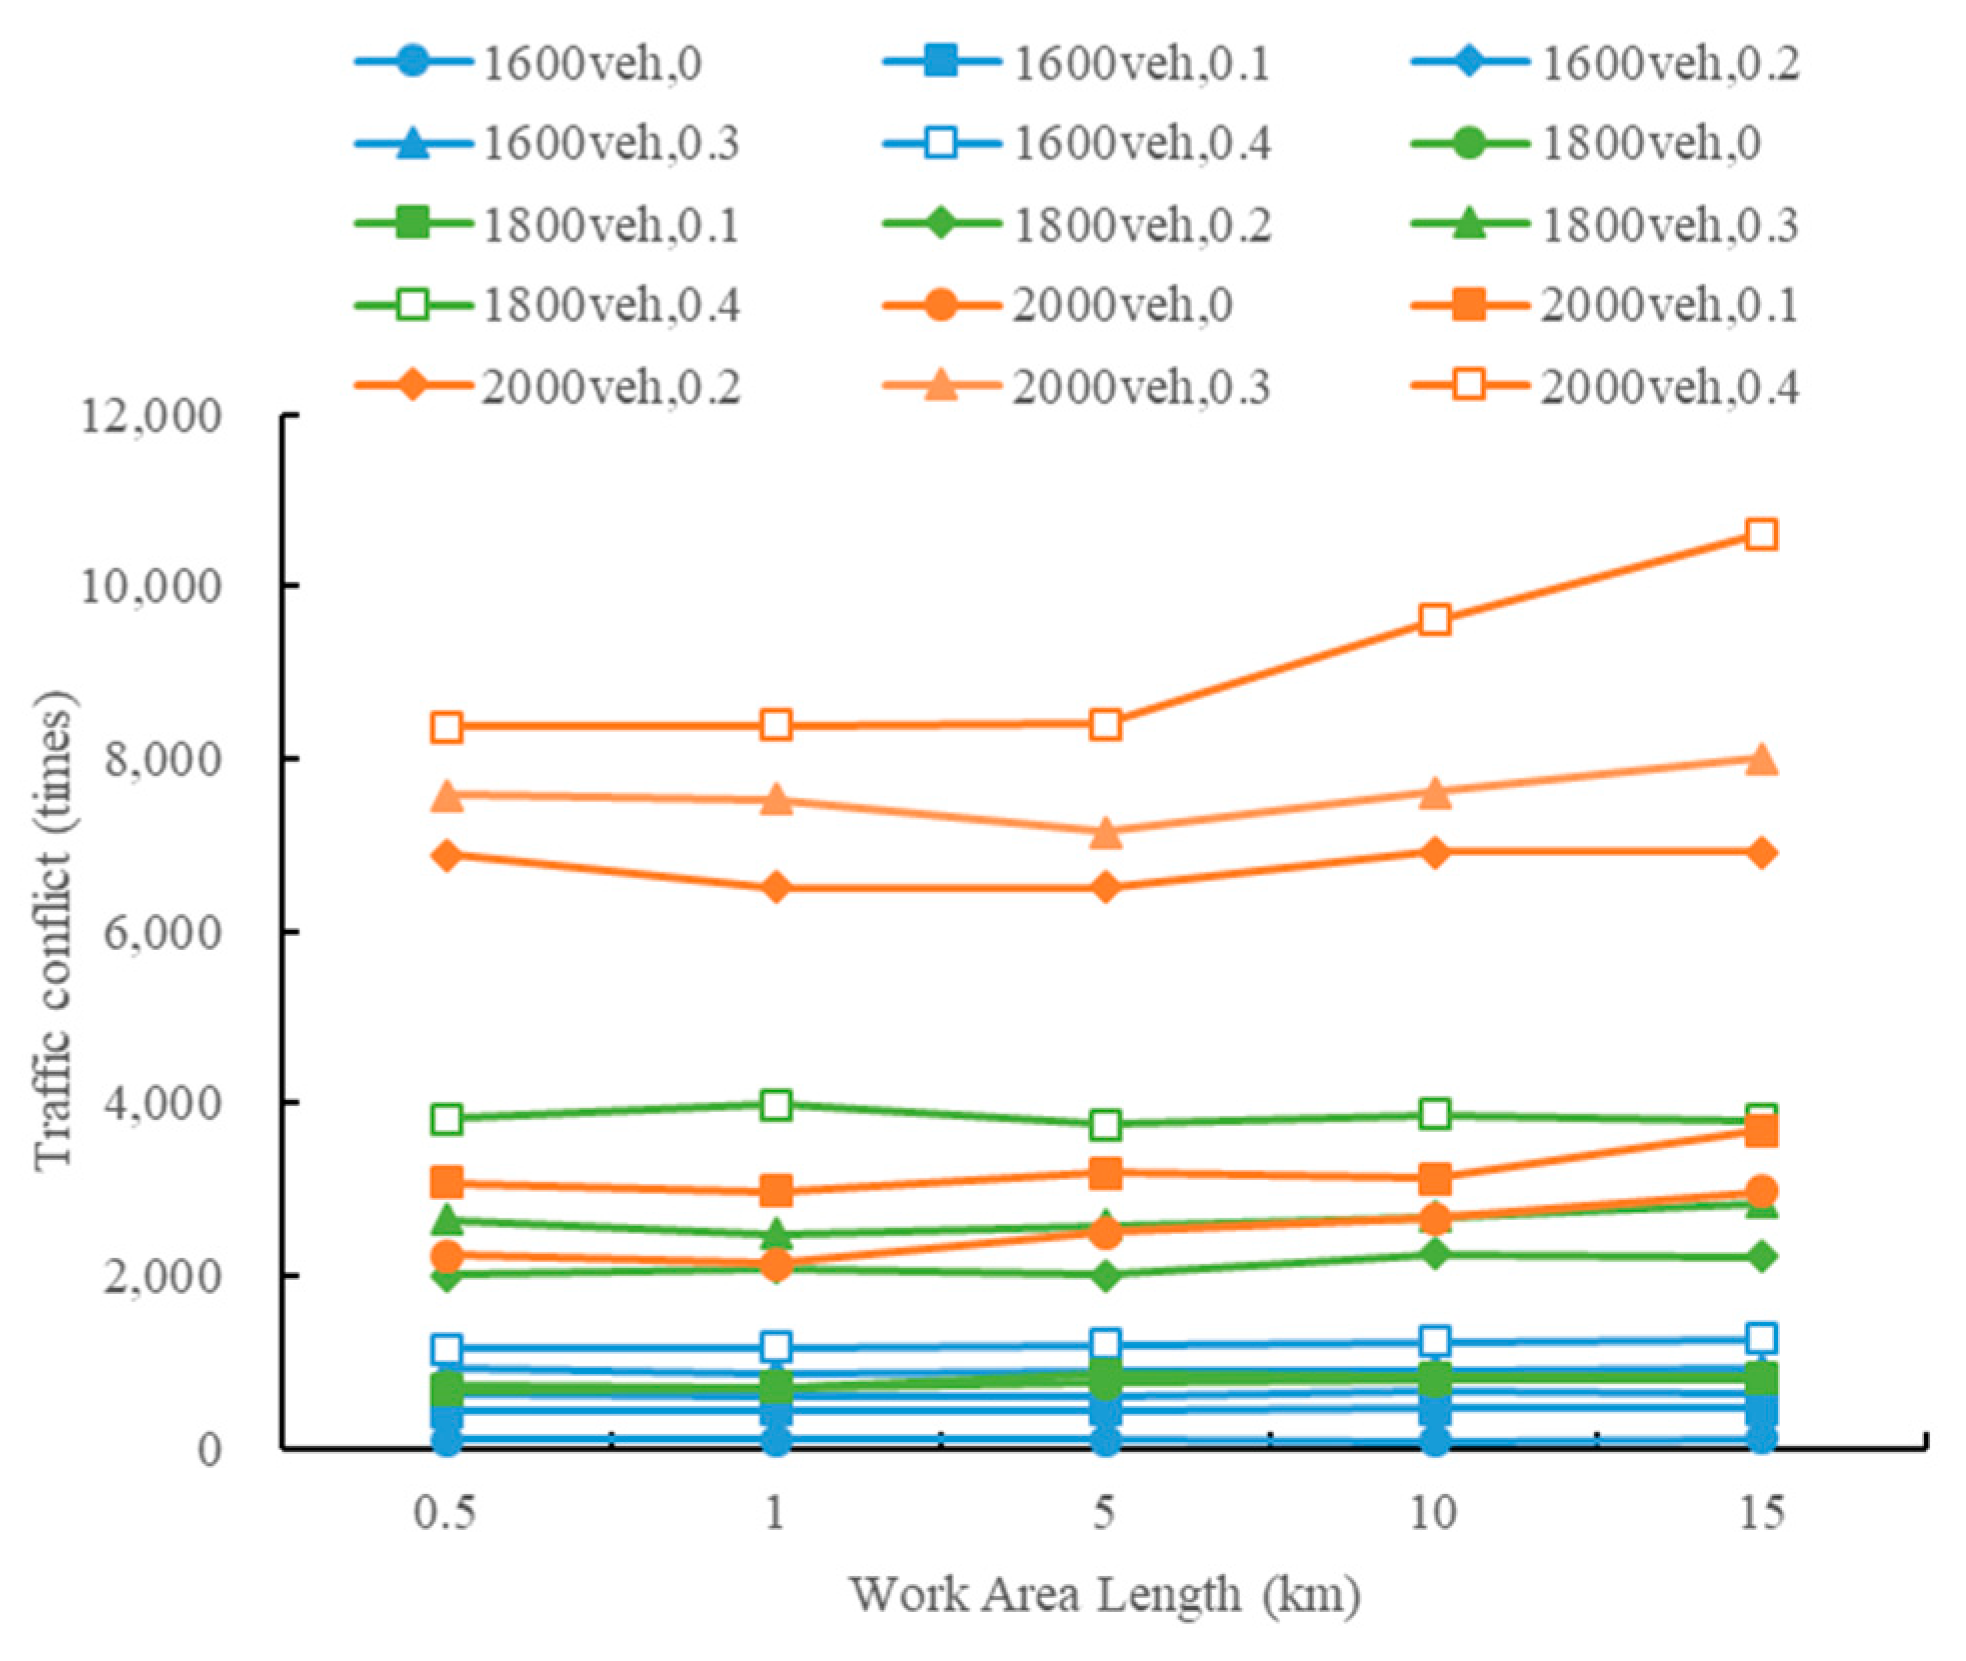
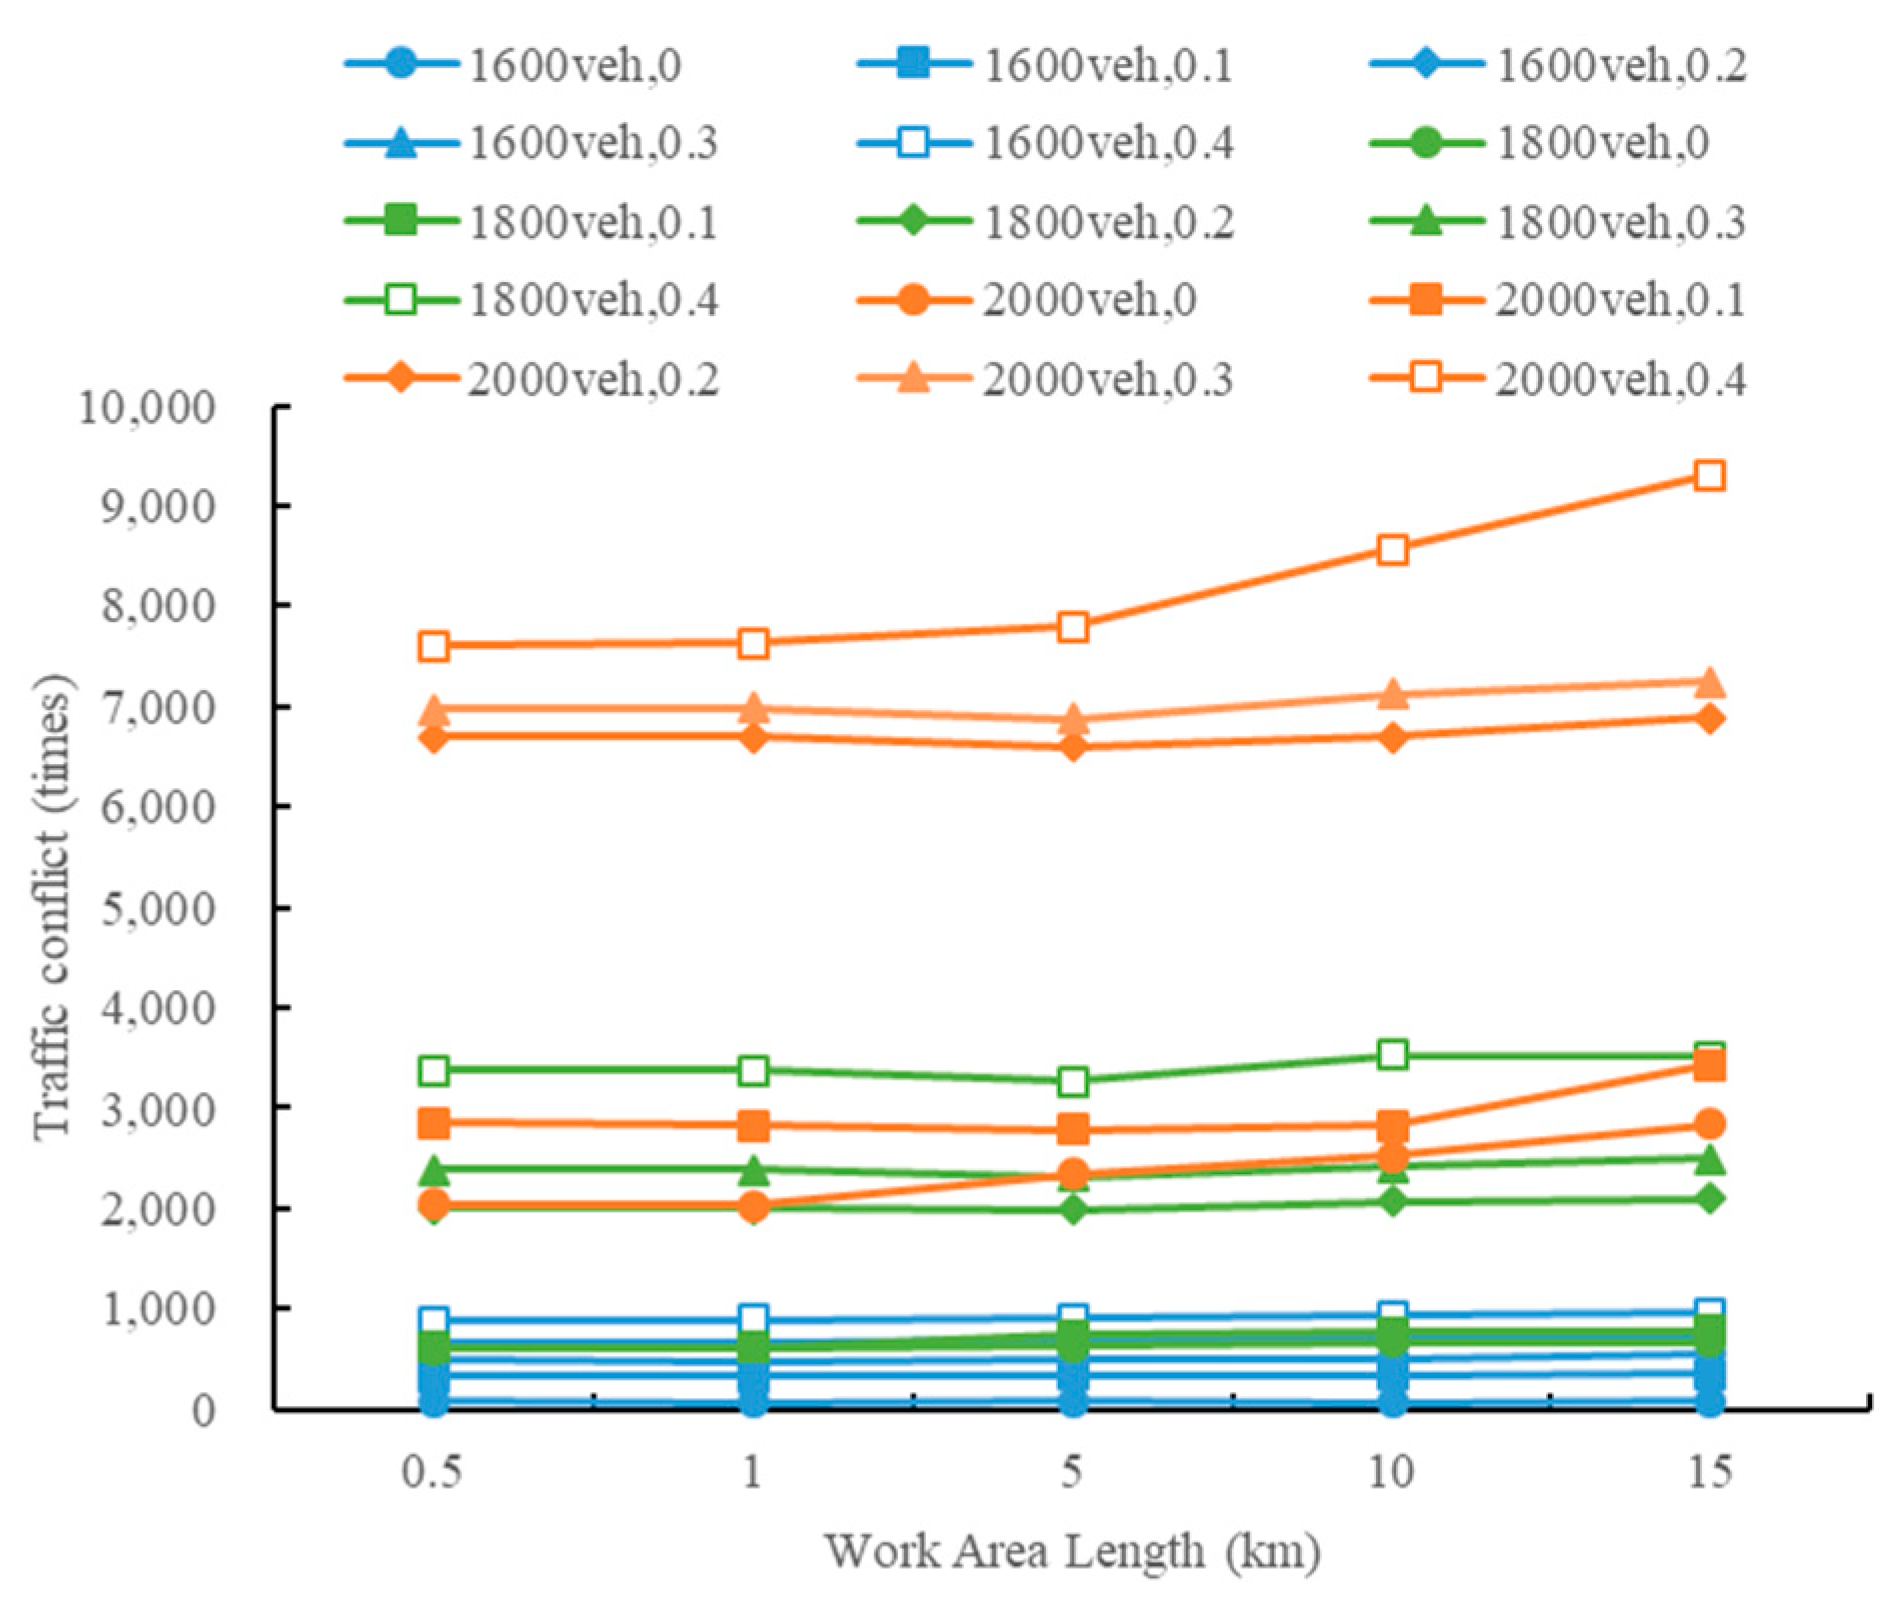
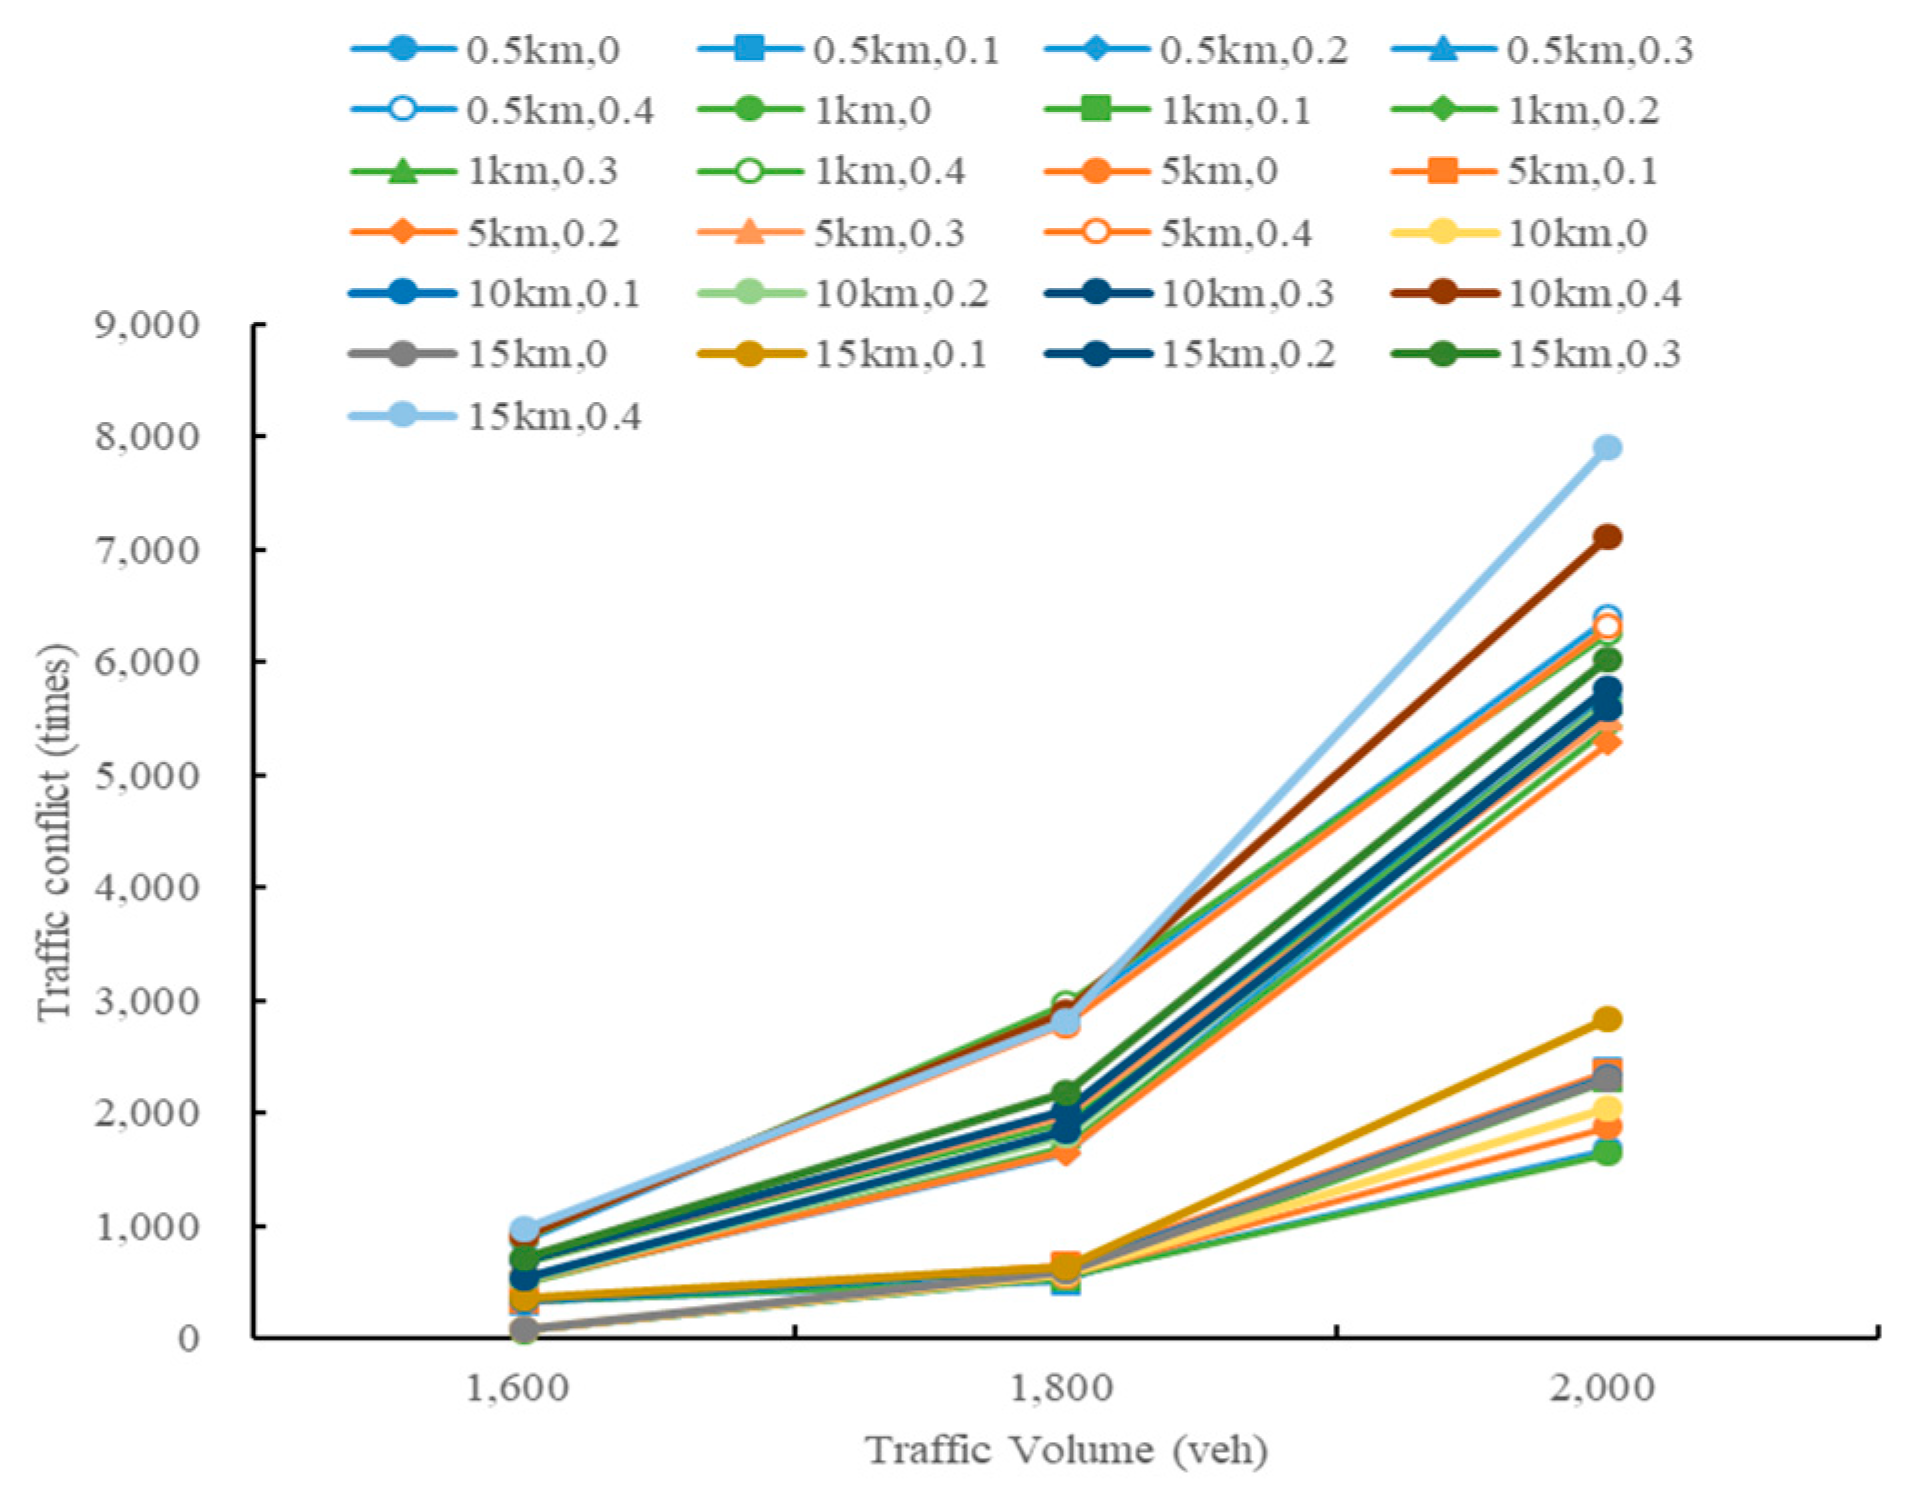
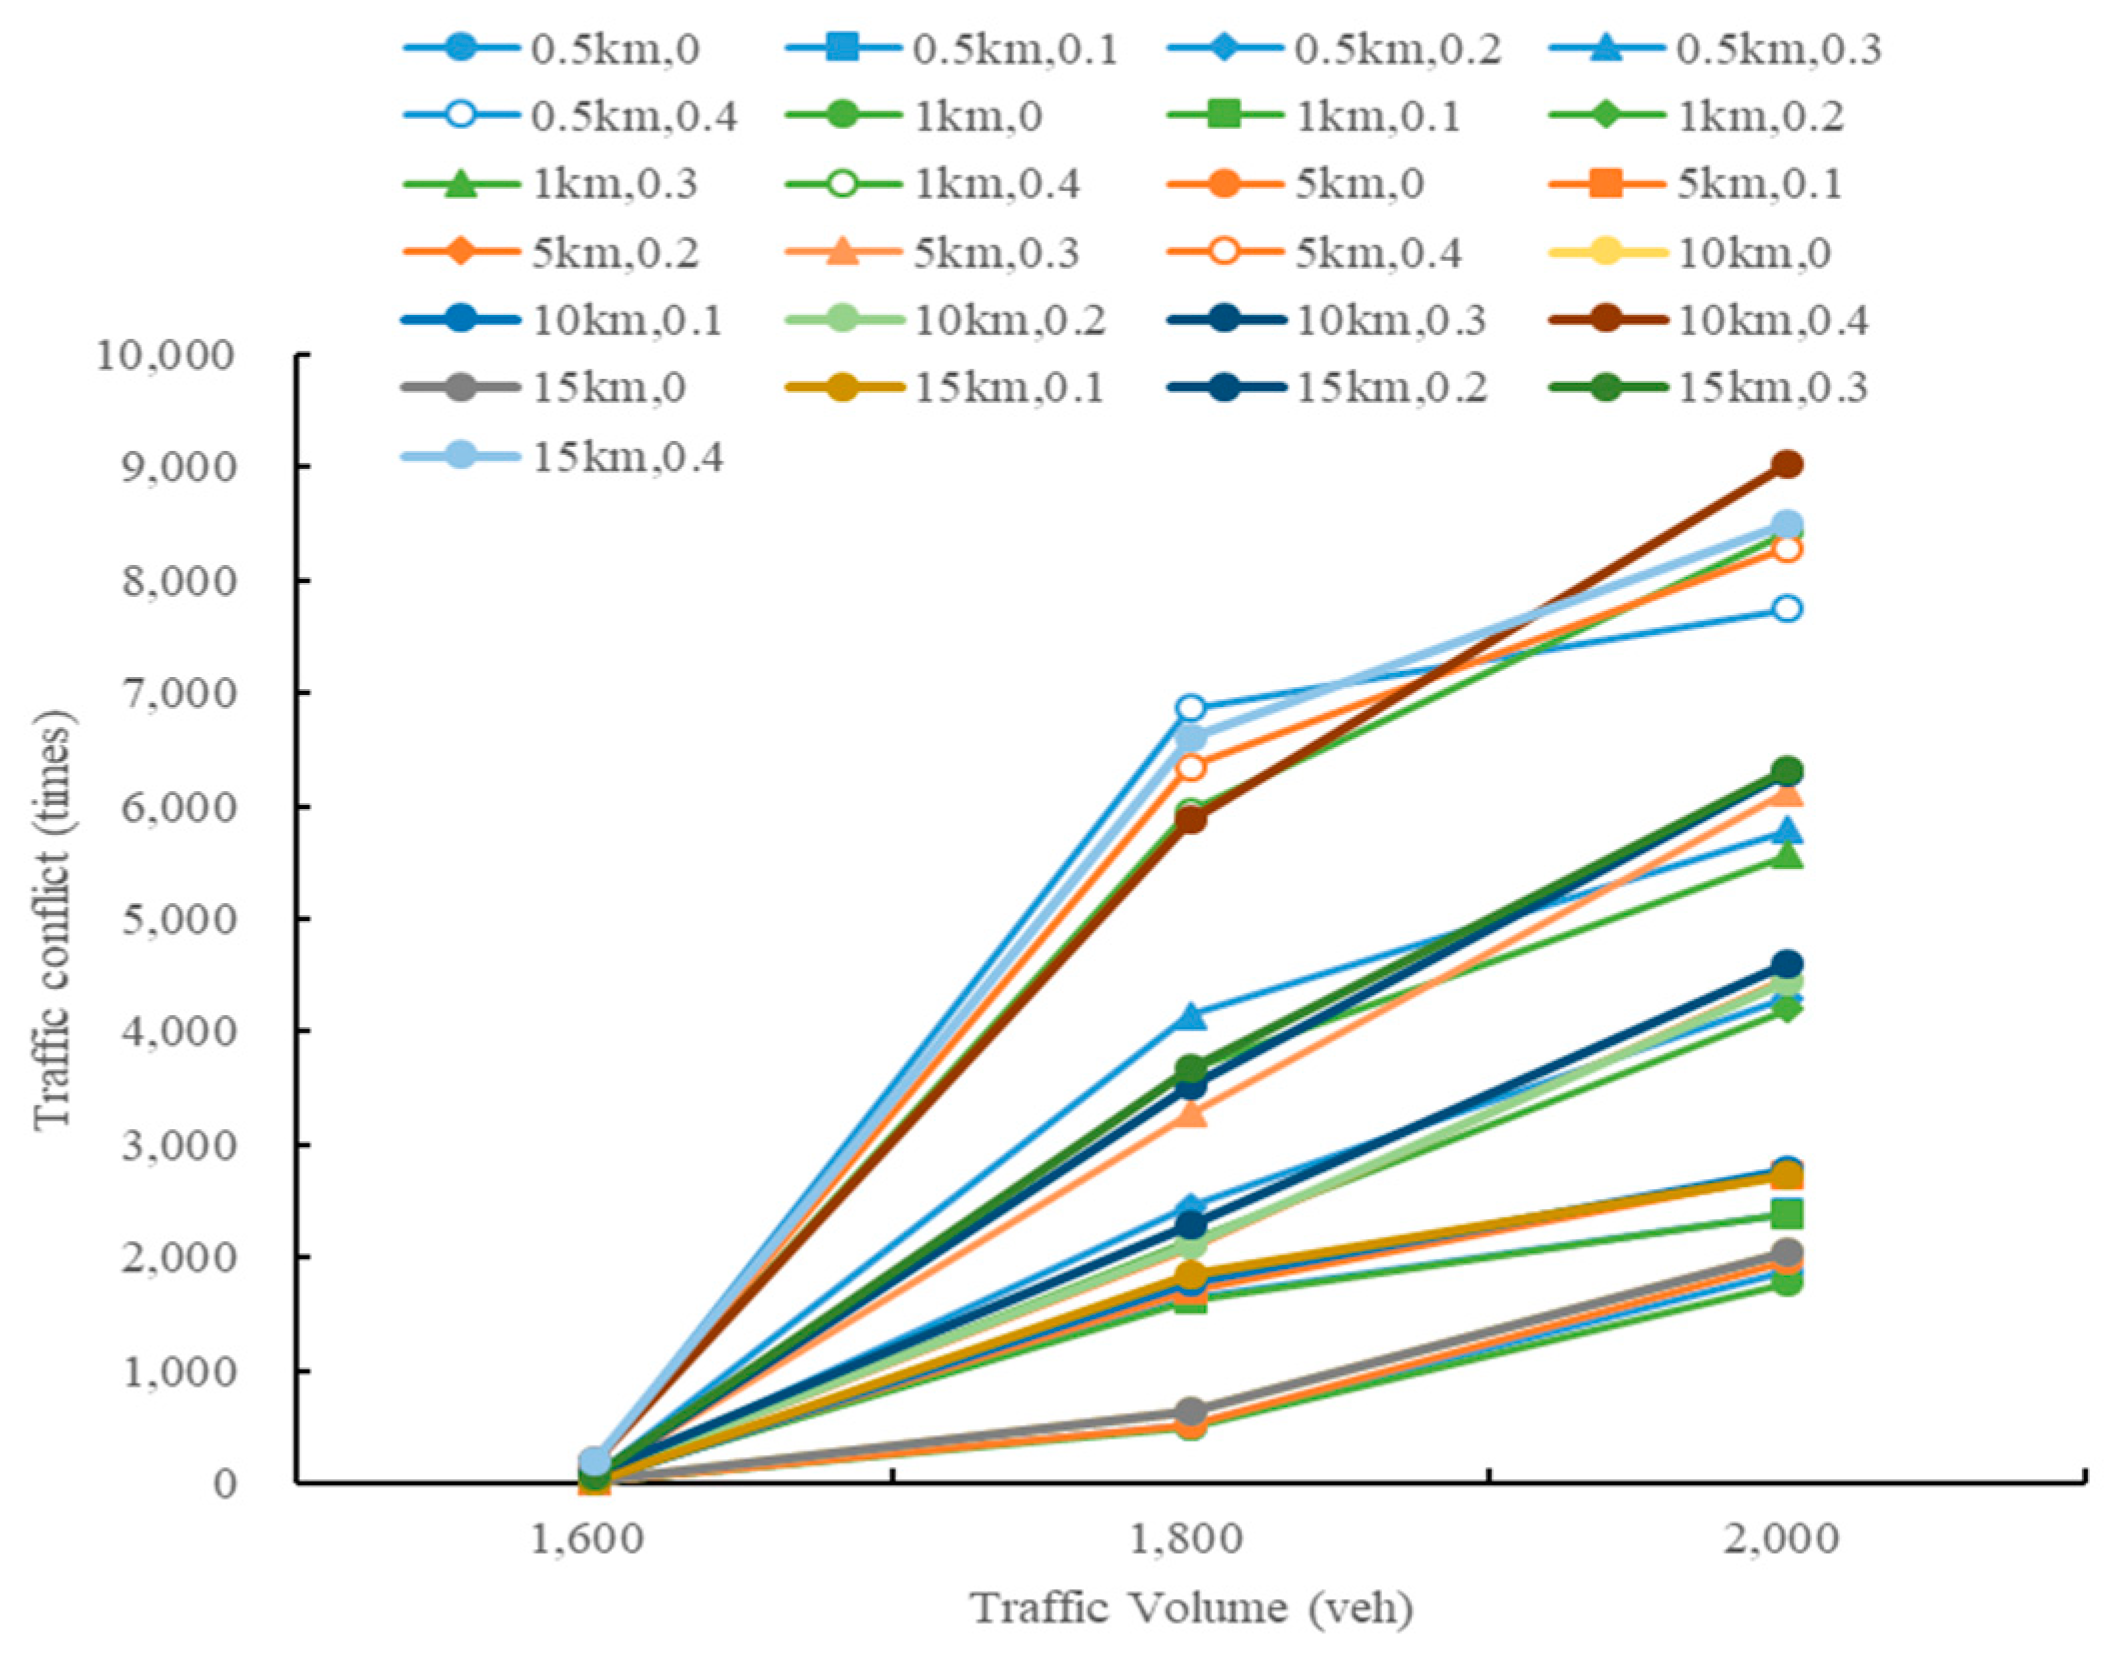
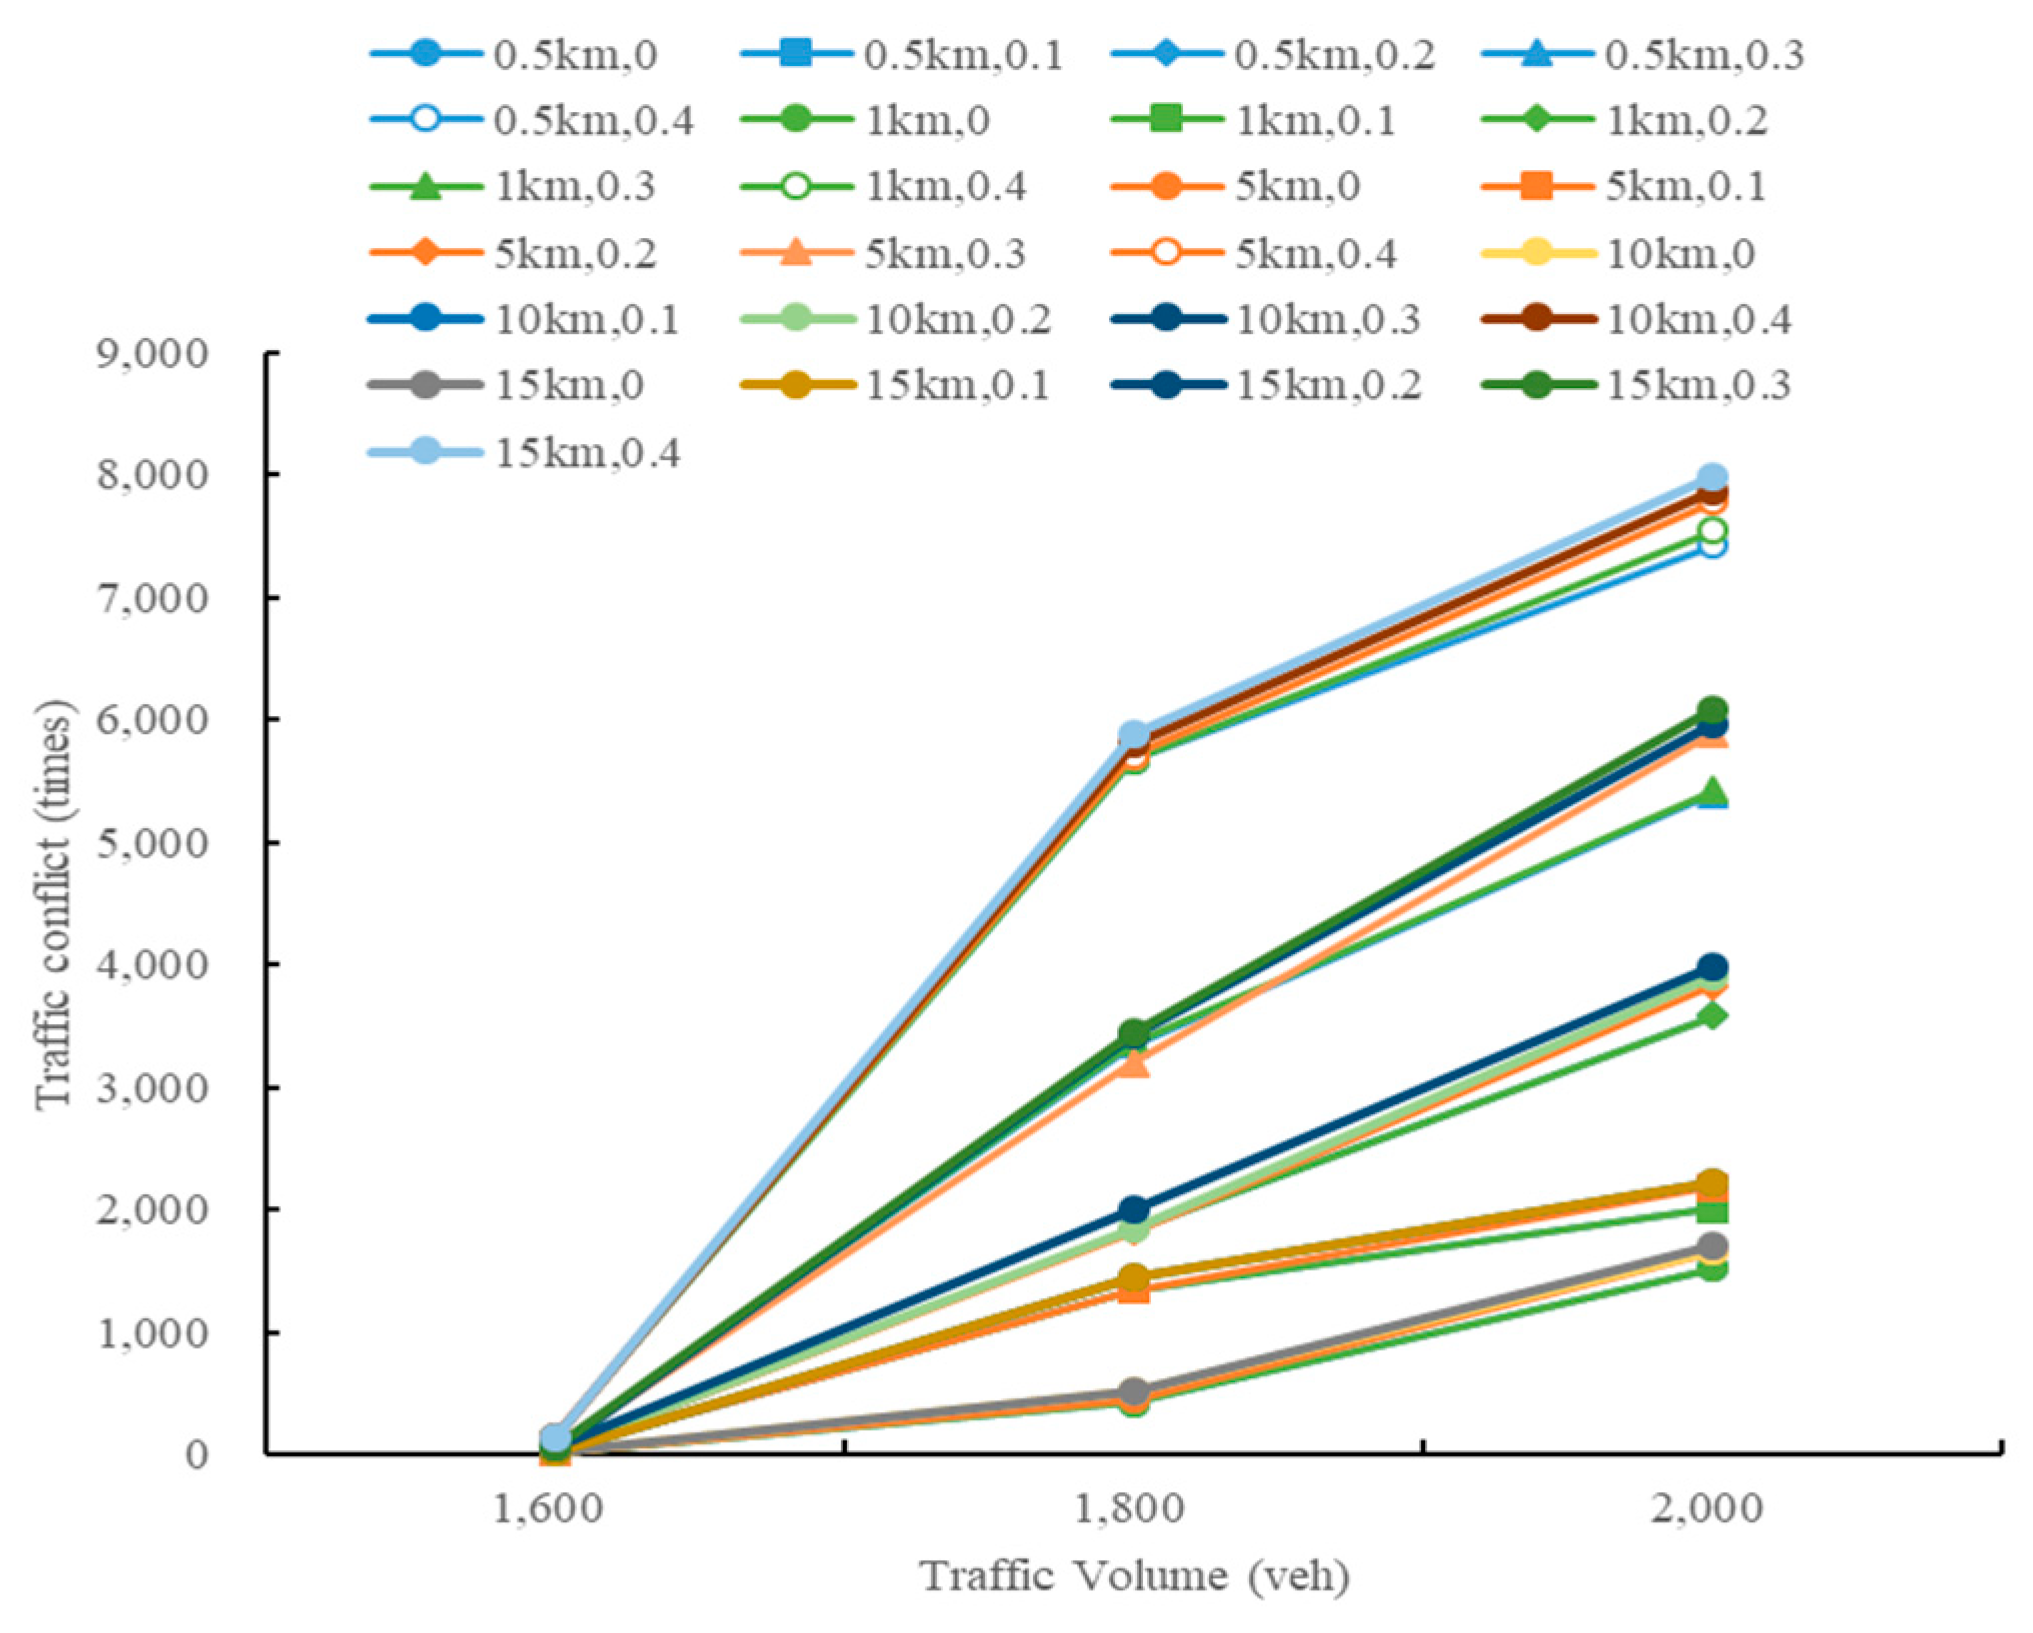
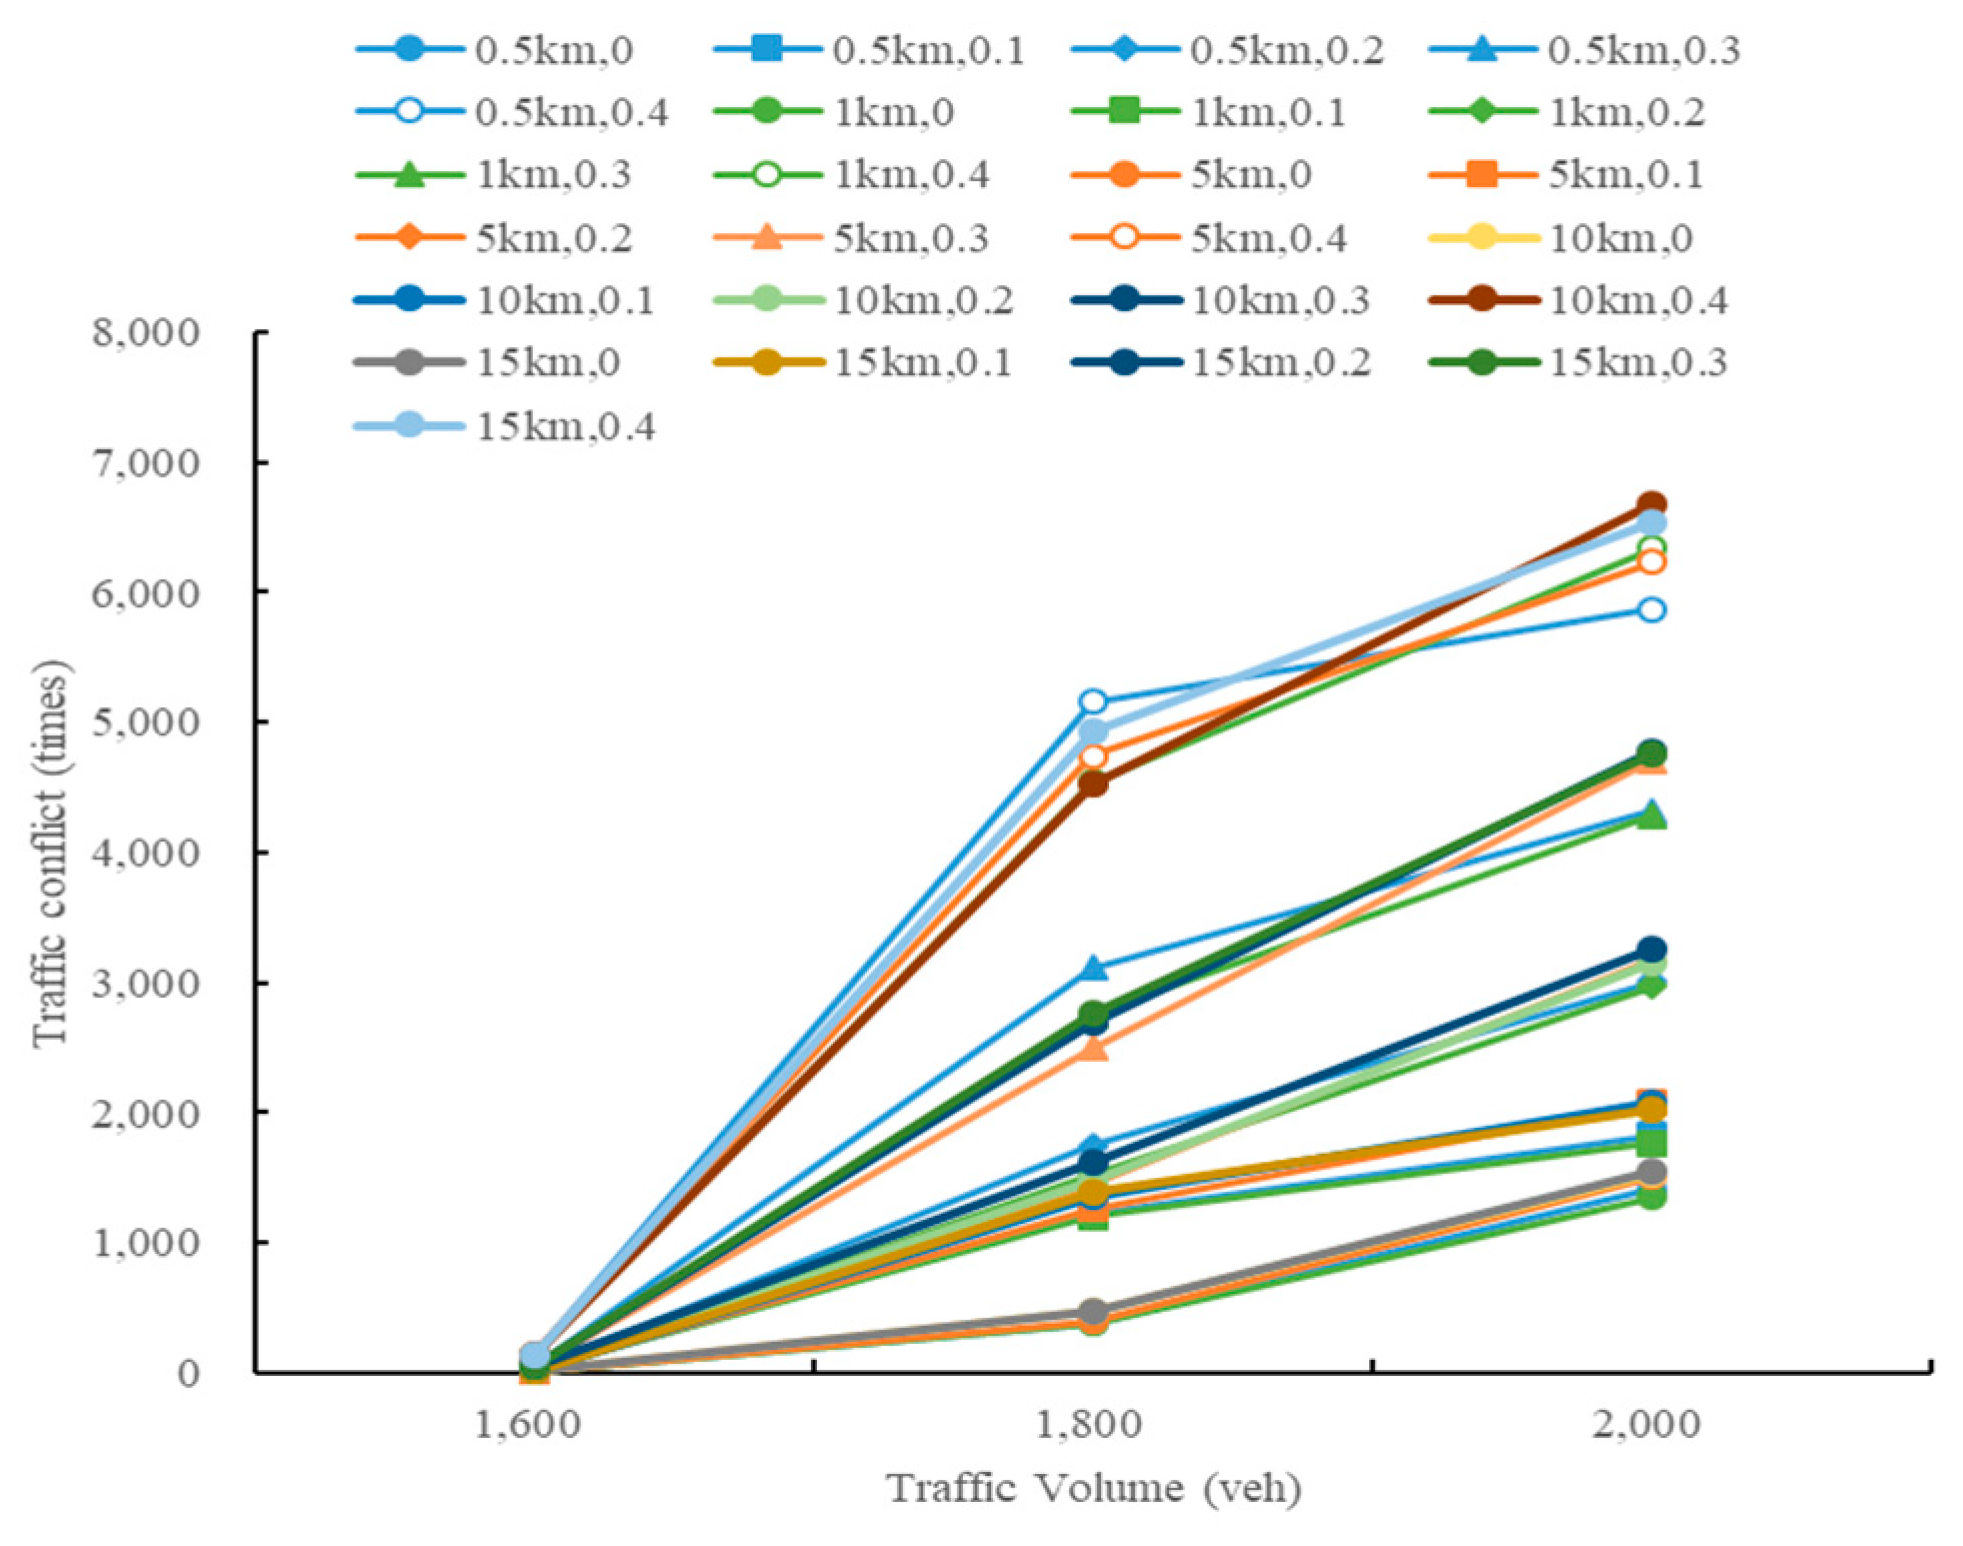
Figure 9, it can be seen that in the closed lane, with an increase in the work area length, the number of traffic conflicts for each traffic volume and the proportion of trucks did not increase significantly. When the traffic volumes were 1600 veh/(ln·h)
−1 and 1800 veh/(ln·h)
−1, the number of traffic conflicts were maintained at a stable level at different work area lengths. When the traffic volume reached 2000 veh/(ln·h)
−1, the number of traffic conflicts remained stable. The number of traffic conflicts showed a small upward trend.
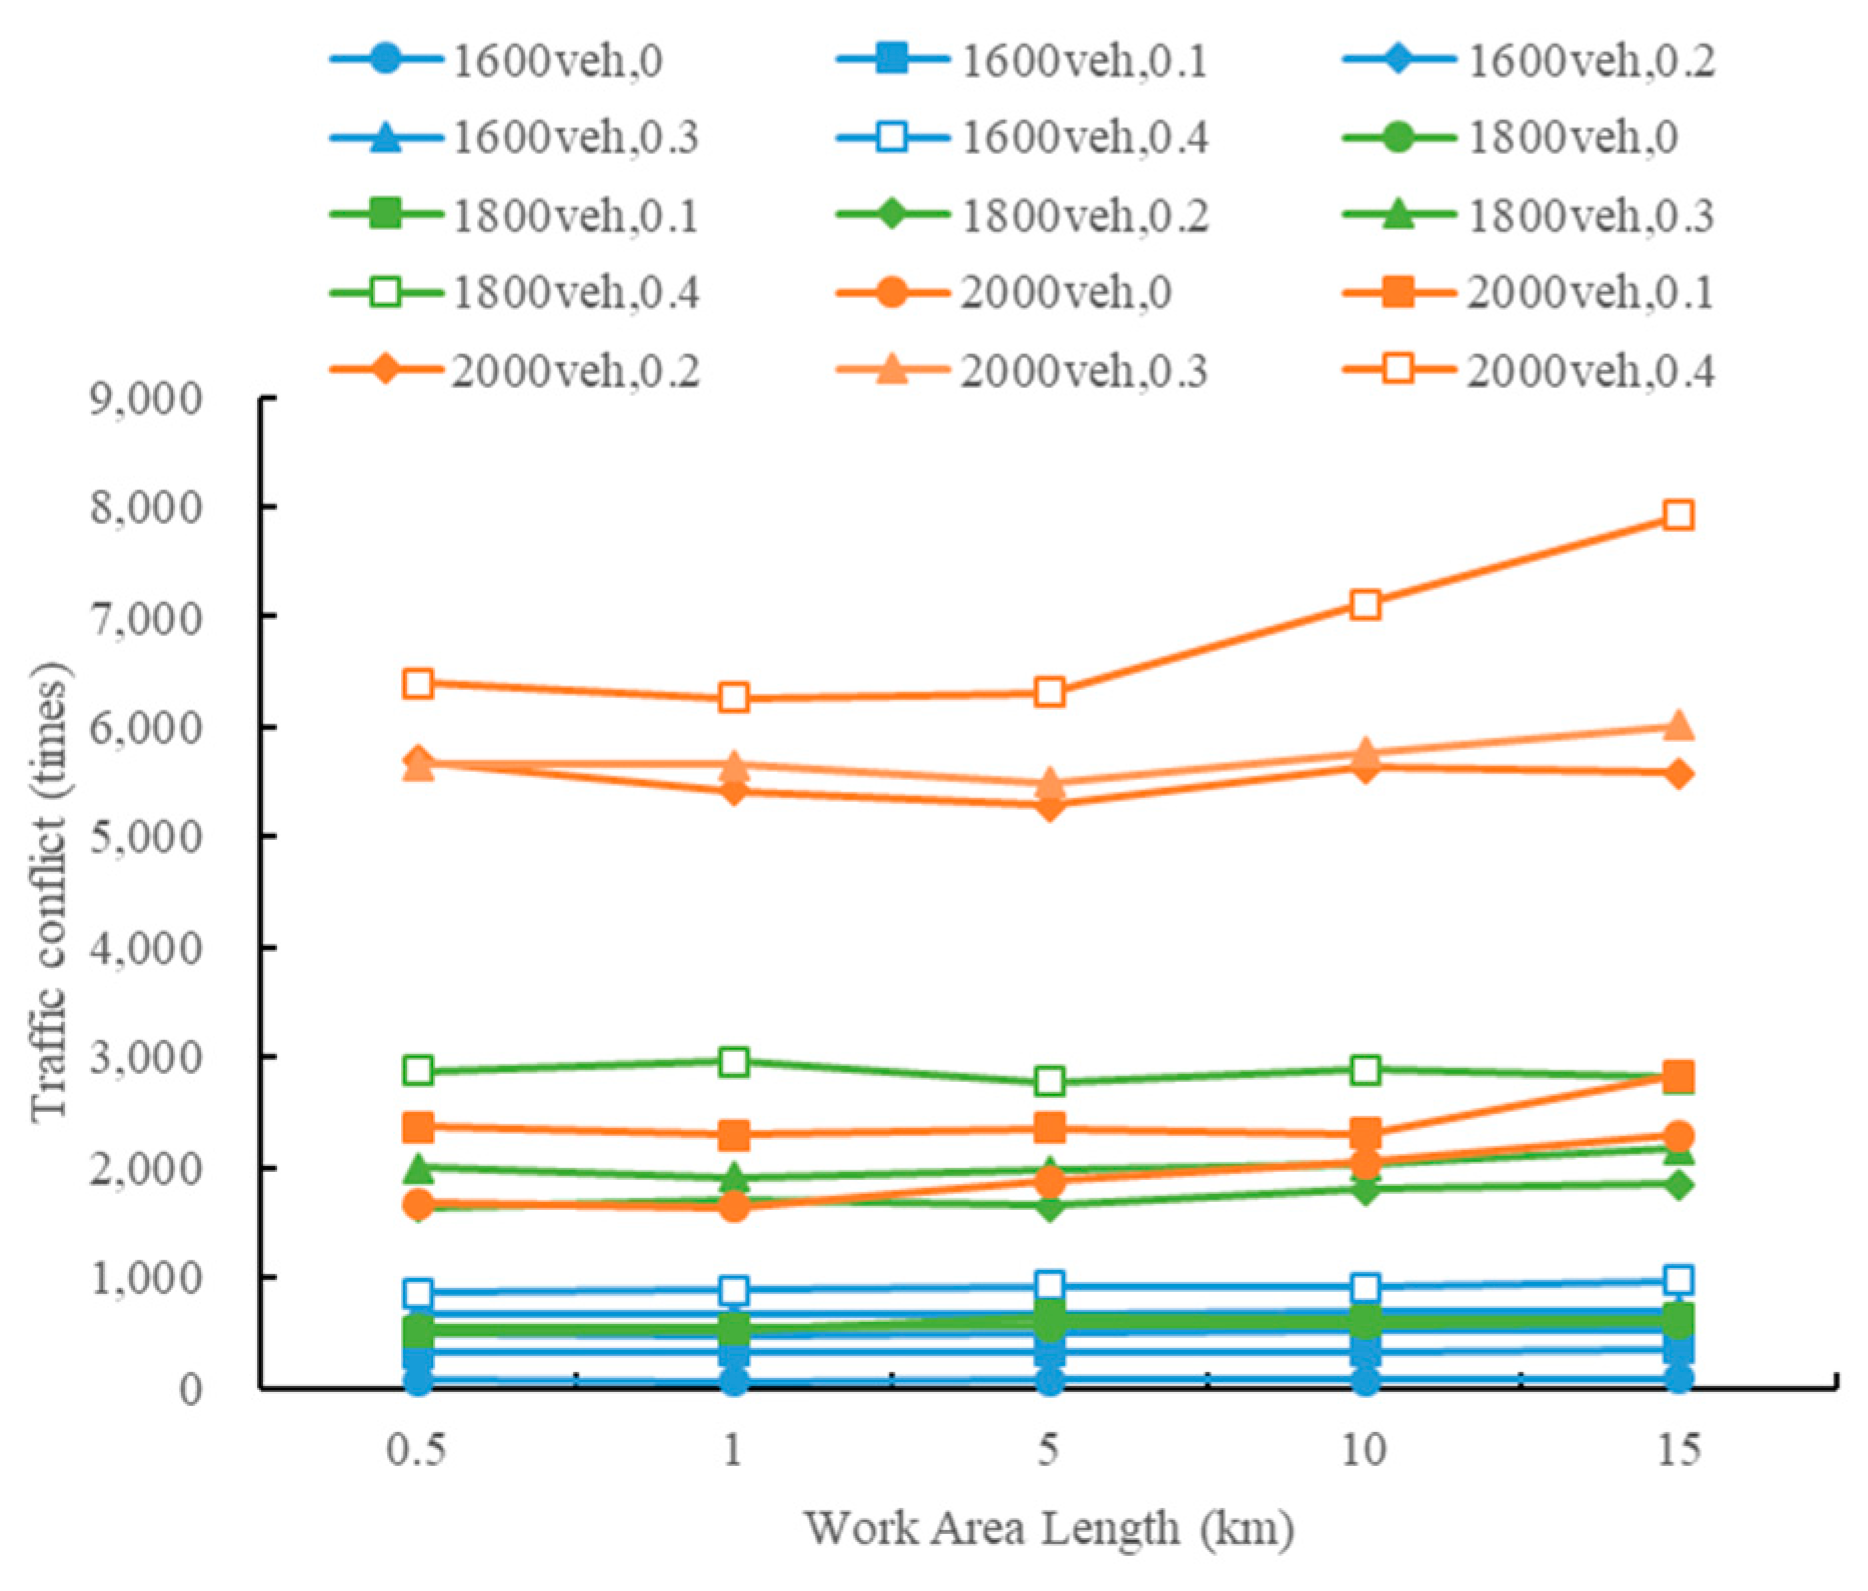
When the traffic volumes were 1600 veh/(ln·h)
−1 and 1800 veh/(ln·h)
−1, there was no significant correlation between the number of traffic conflicts and the length of the work area in the opposite lane scenario, and the number of traffic conflicts basically remained the same. When the traffic volume was 2000 veh/(ln·h)
−1 and the truck inflow rate was 0.4, the number of traffic conflicts increased obviously with the increase in the work area length. The results are shown in
Figure 10,
Figure 11 and
Figure 12.
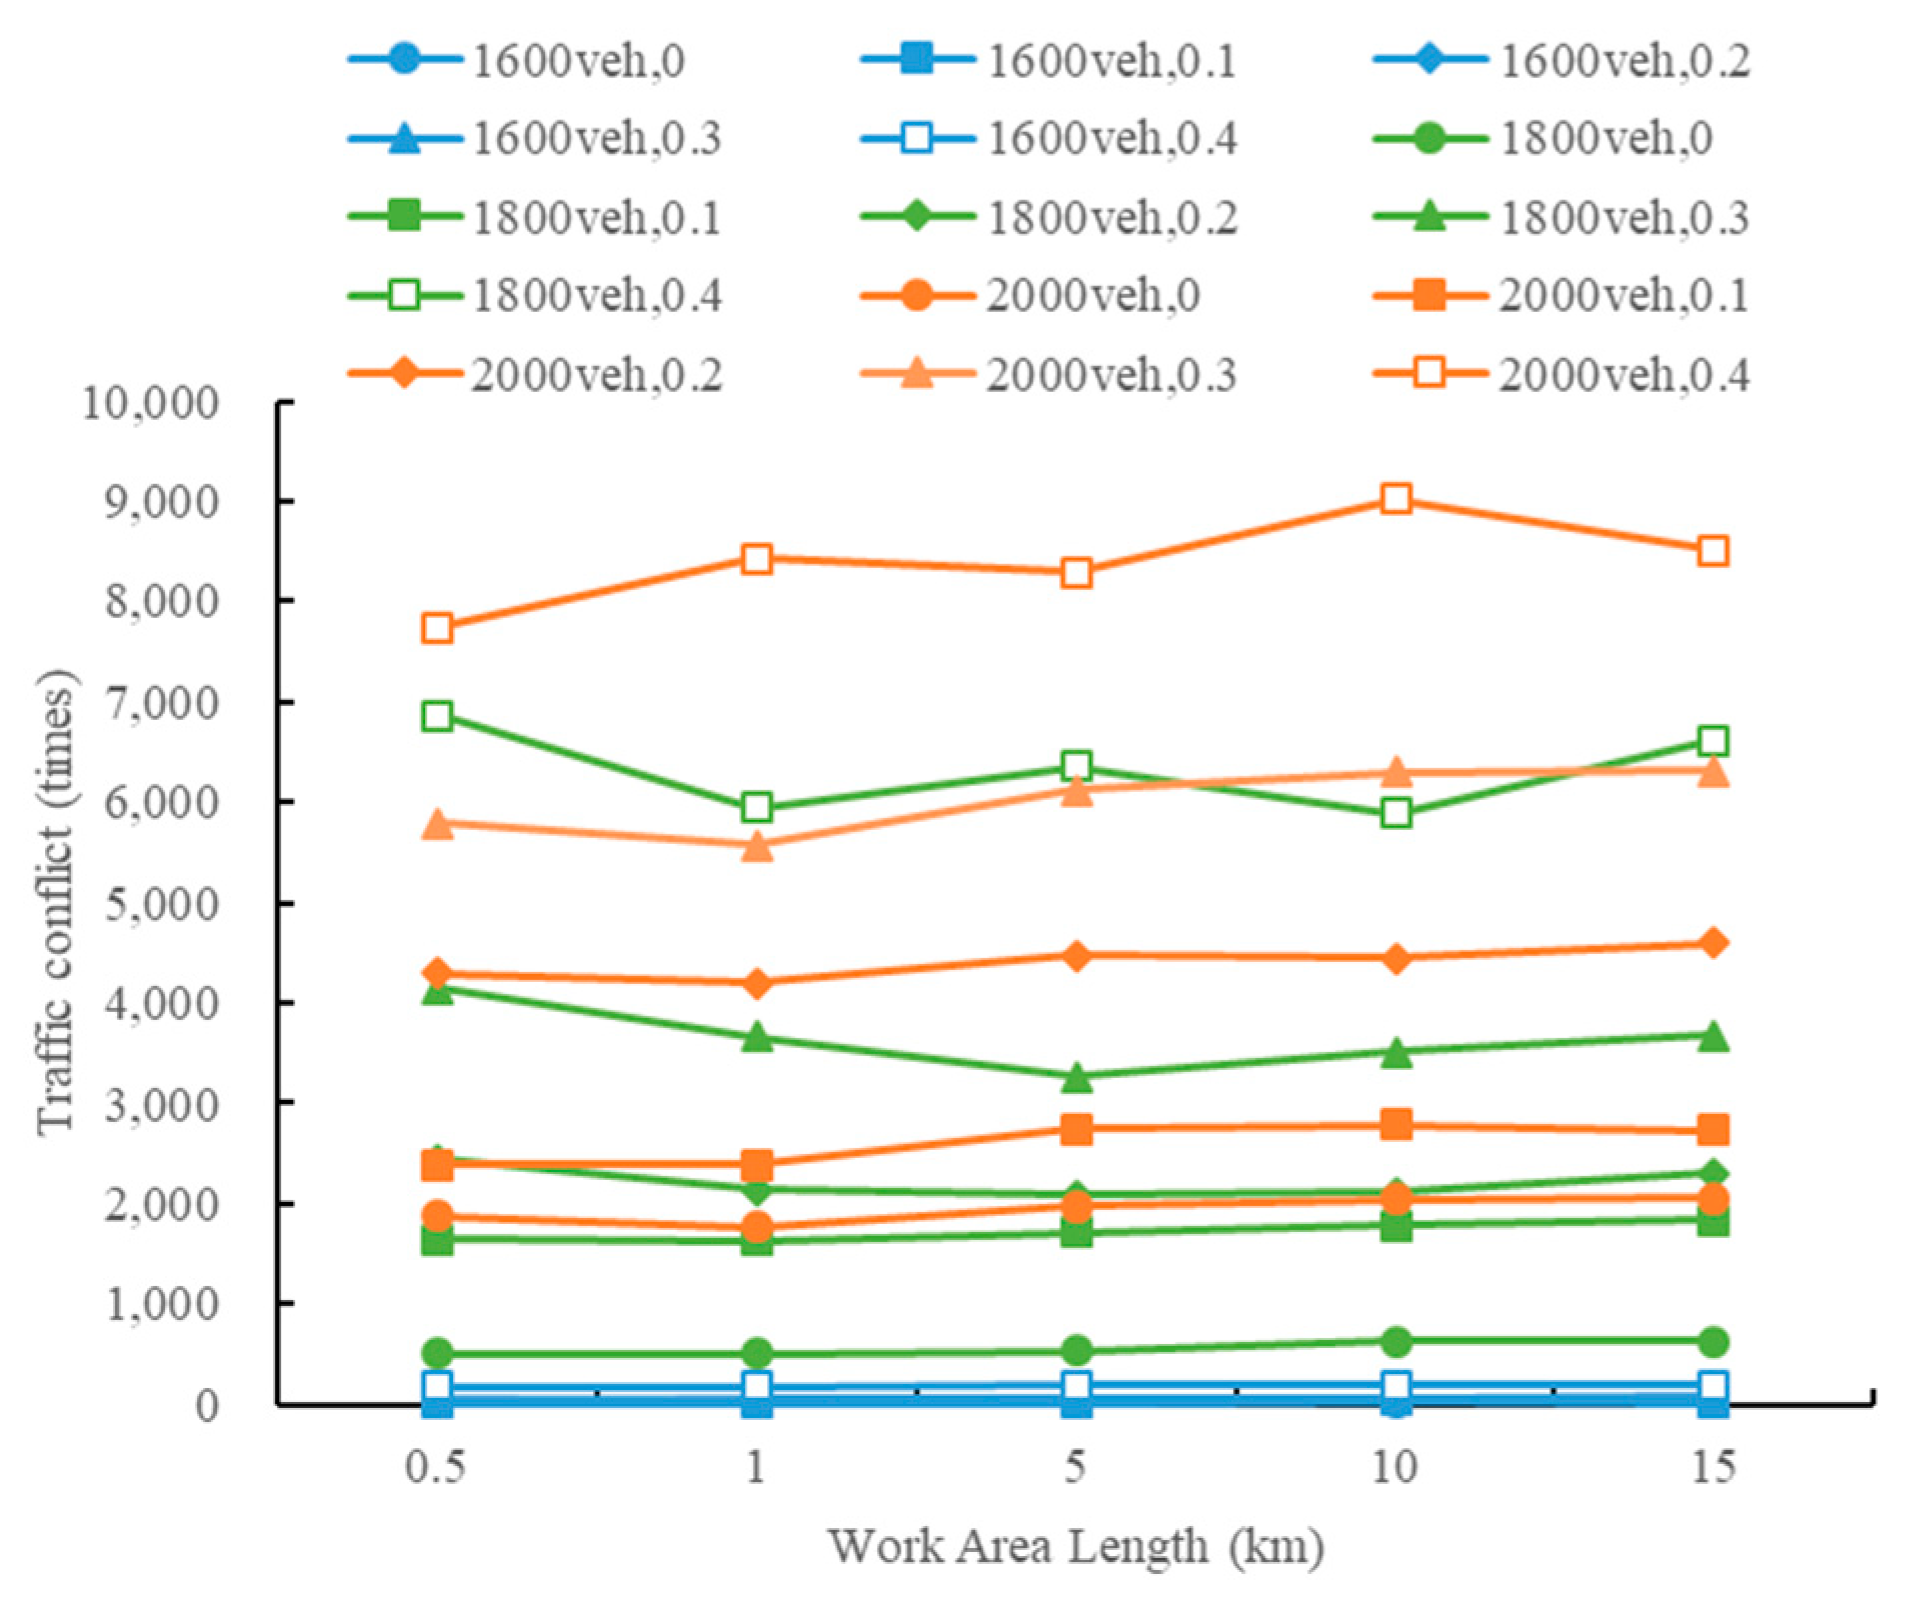
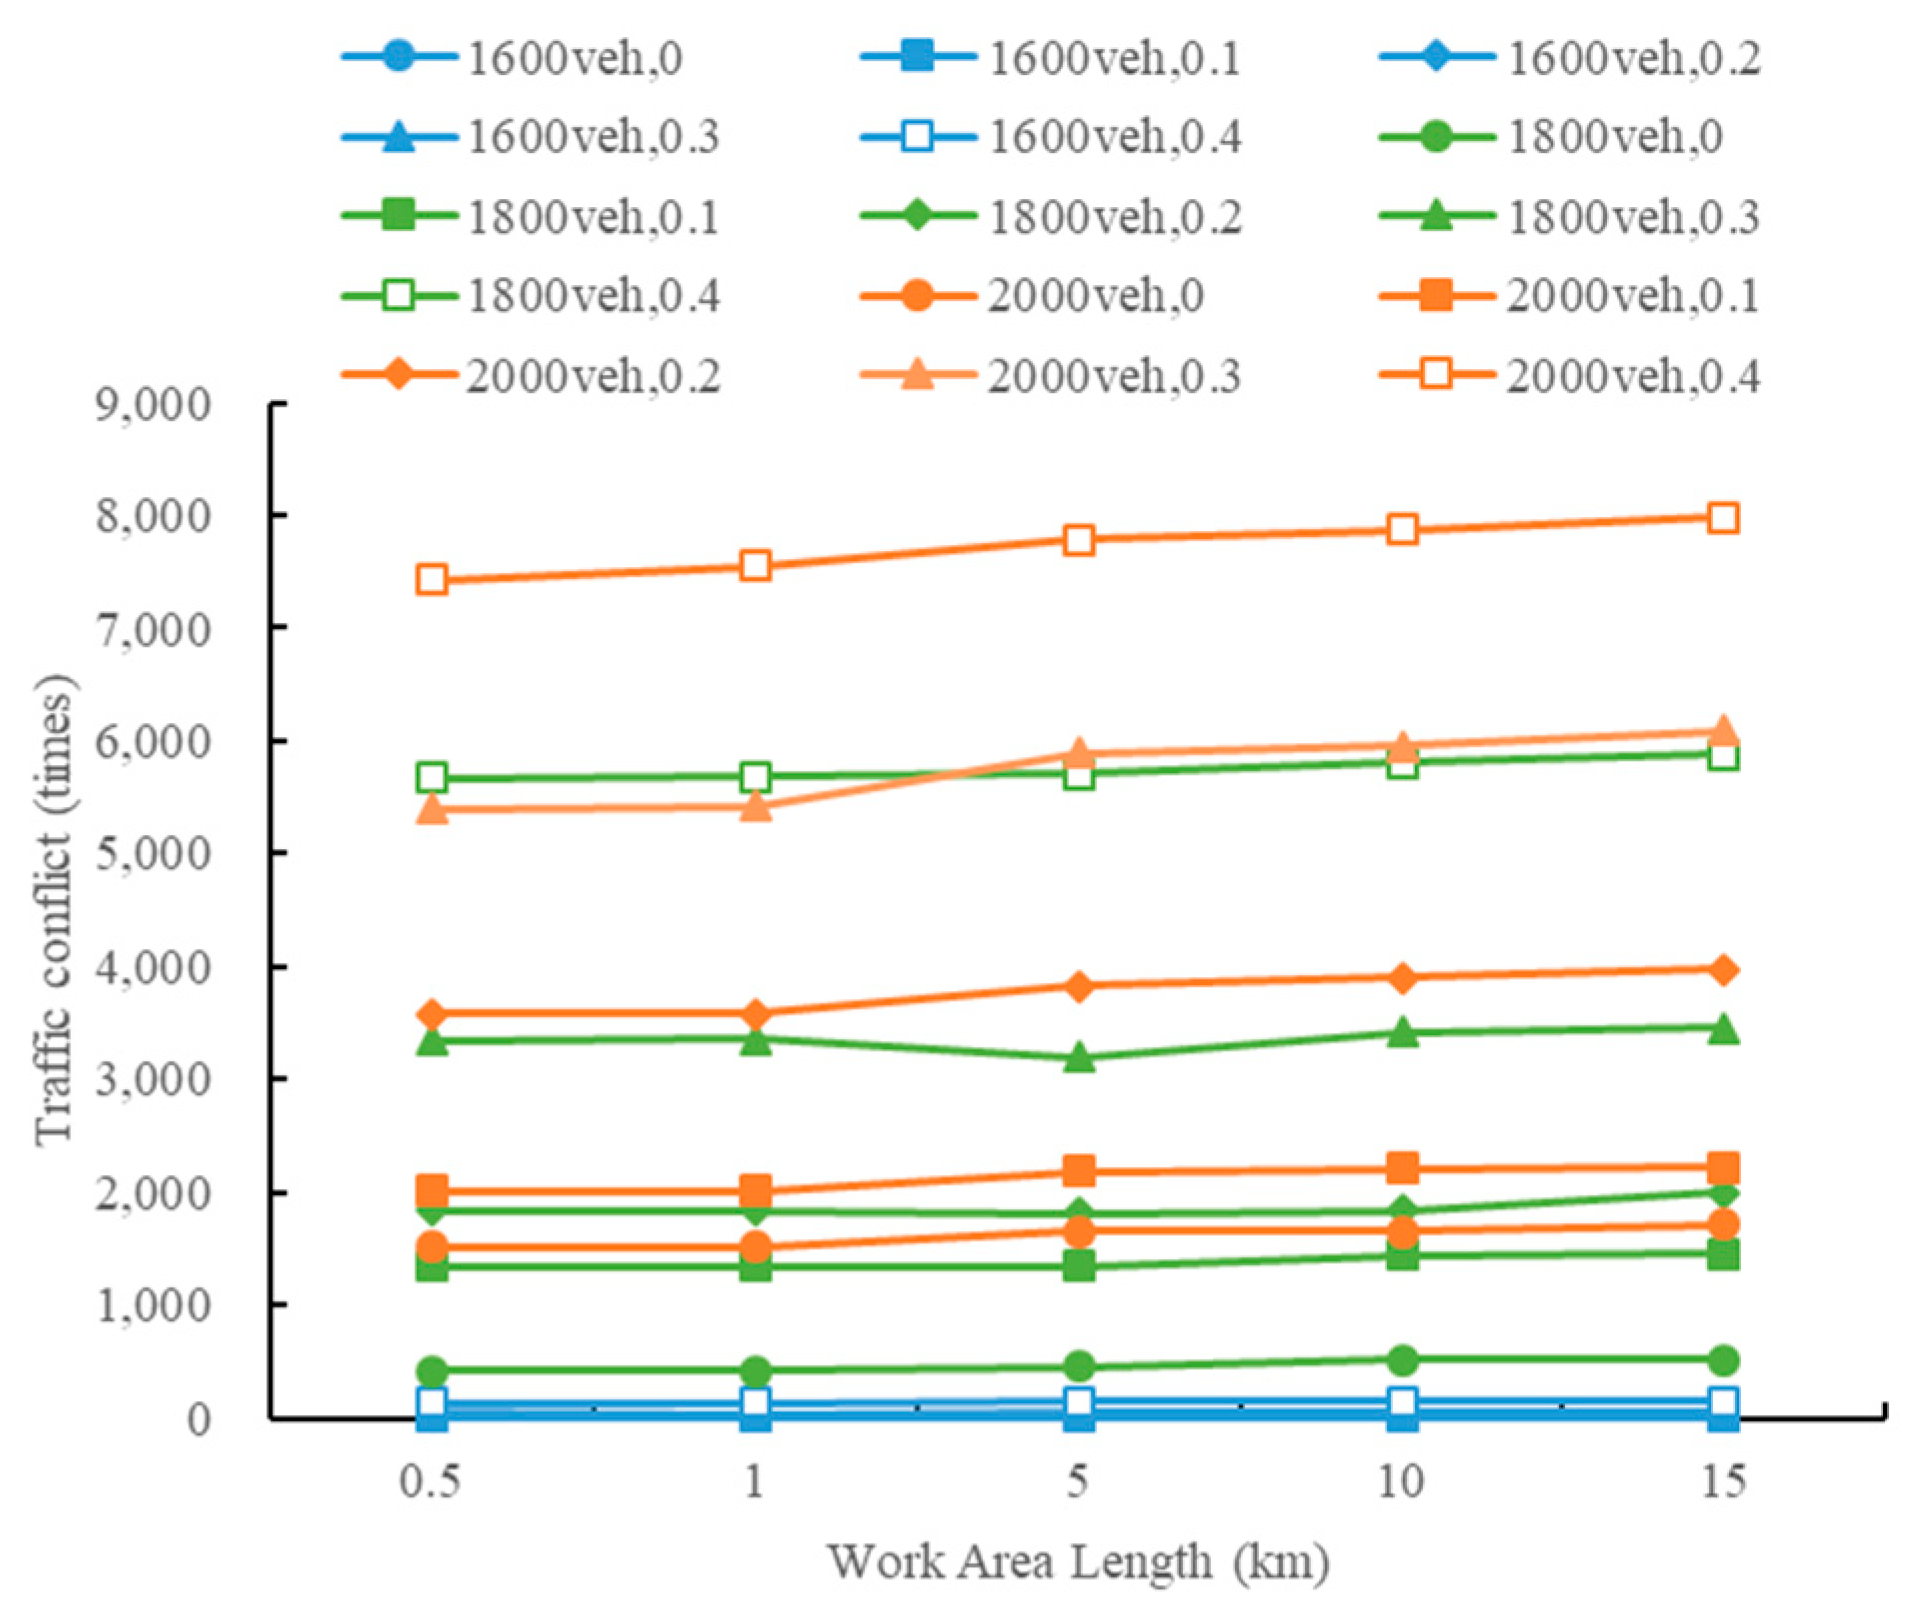
In the compressed lane scenario, when the speed limit was 60 km/h, the number of traffic conflicts had a small increasing trend with an increase in the work area length. When the speed limits were 40 km/h and 80 km/h, the number of traffic conflicts fluctuated with changes in the work area length.
A Pearson correlation was used to determine the correlation between the length of the work area and the number of traffic conflicts; the results are shown in
Table 6,
Table 7 and
Table 8.
The significance of the three scenarios was p = {0.478, 0.563, 0.732} > 0.05, and the length of the work area had no significant effect on the number of traffic conflicts.
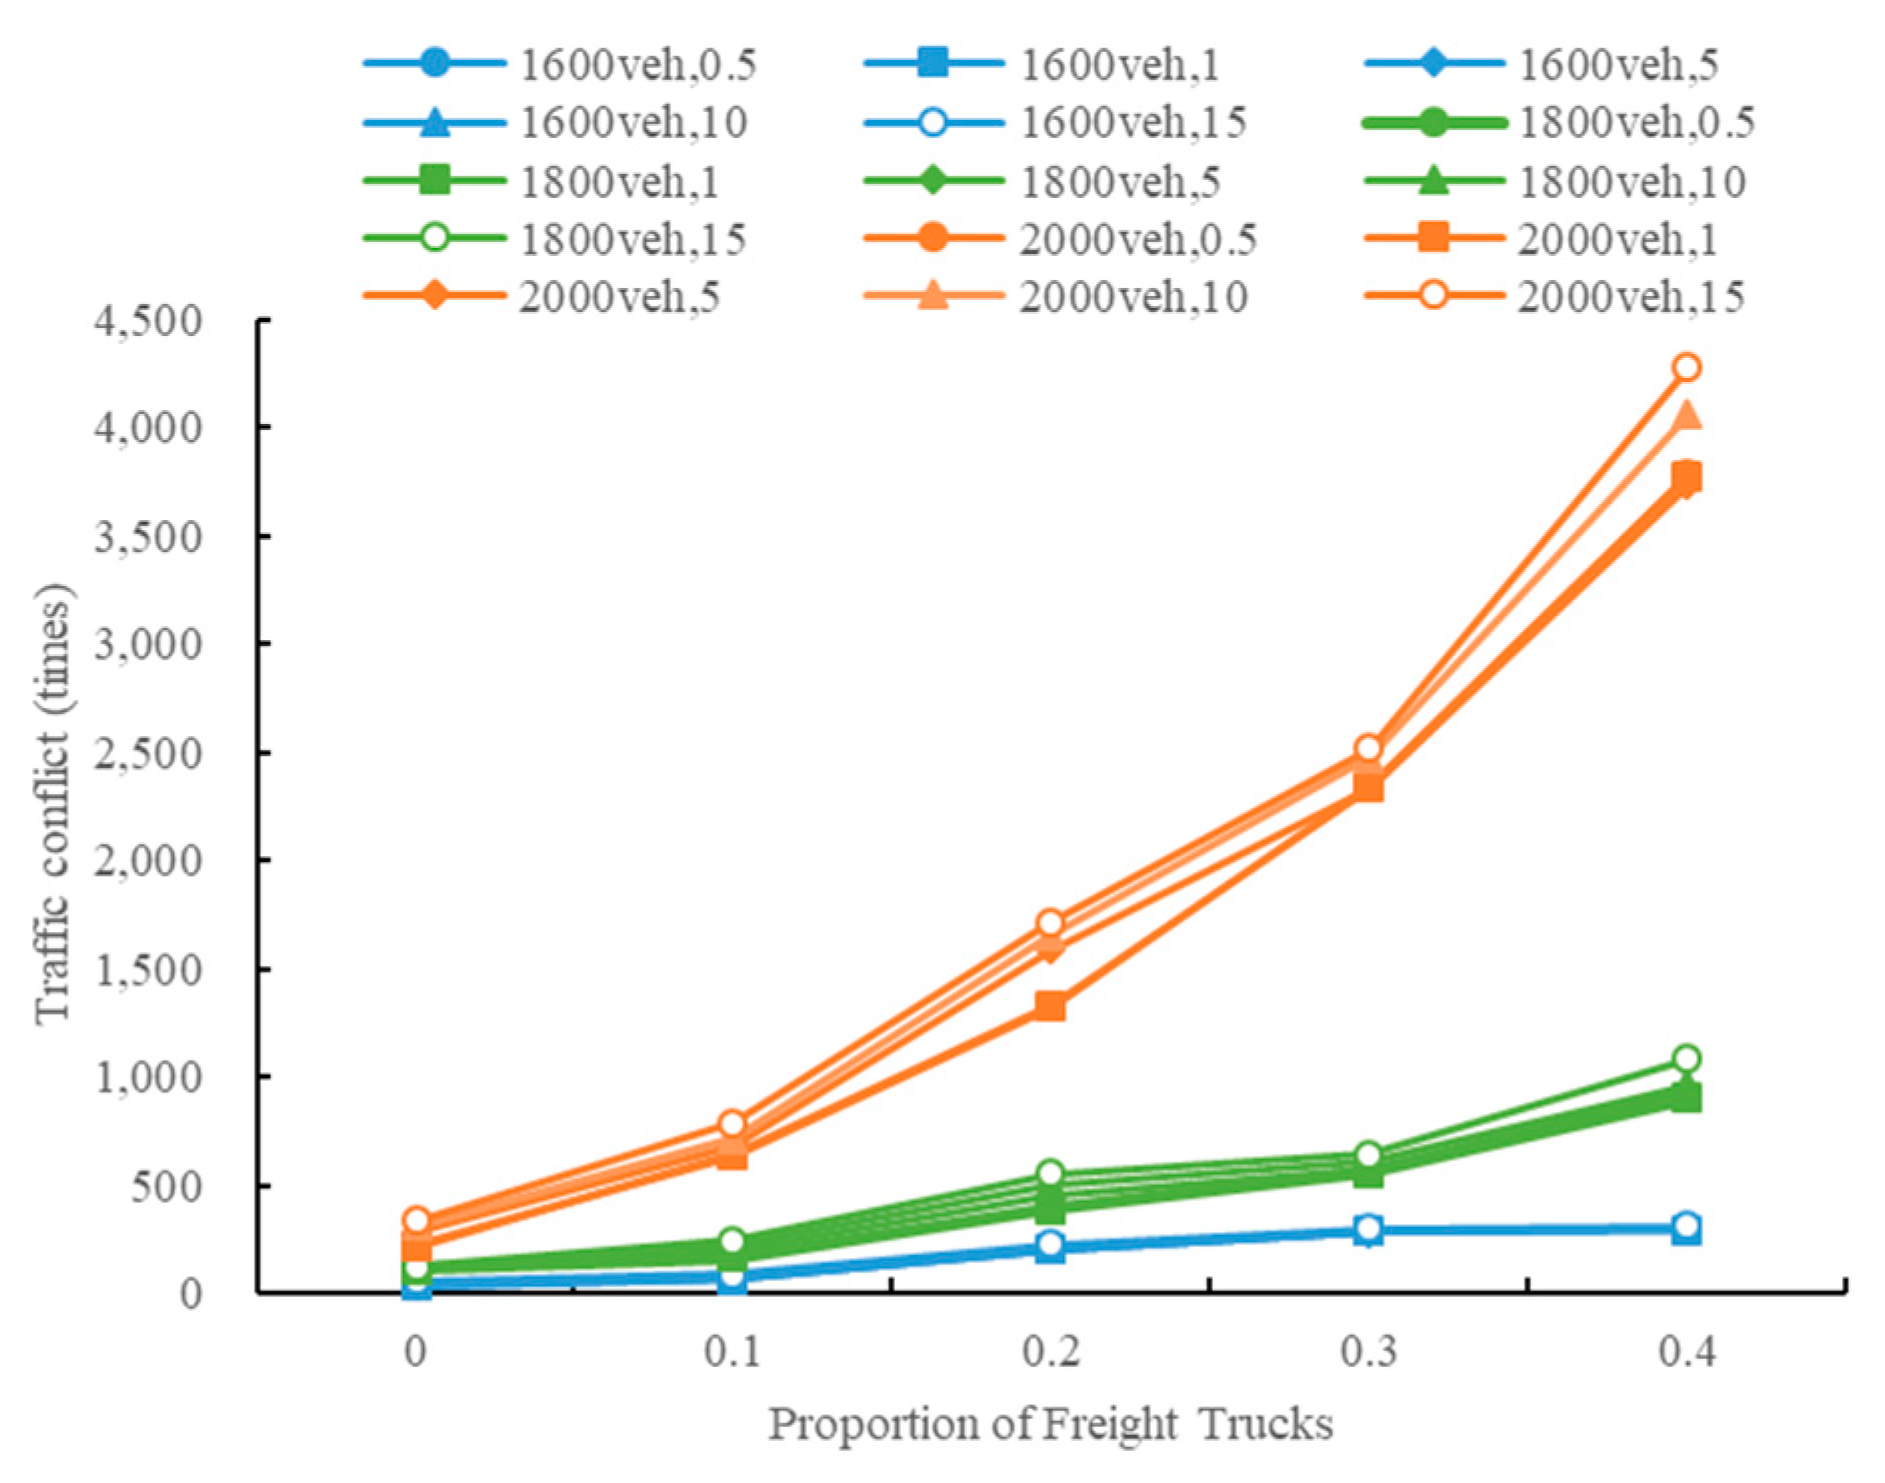
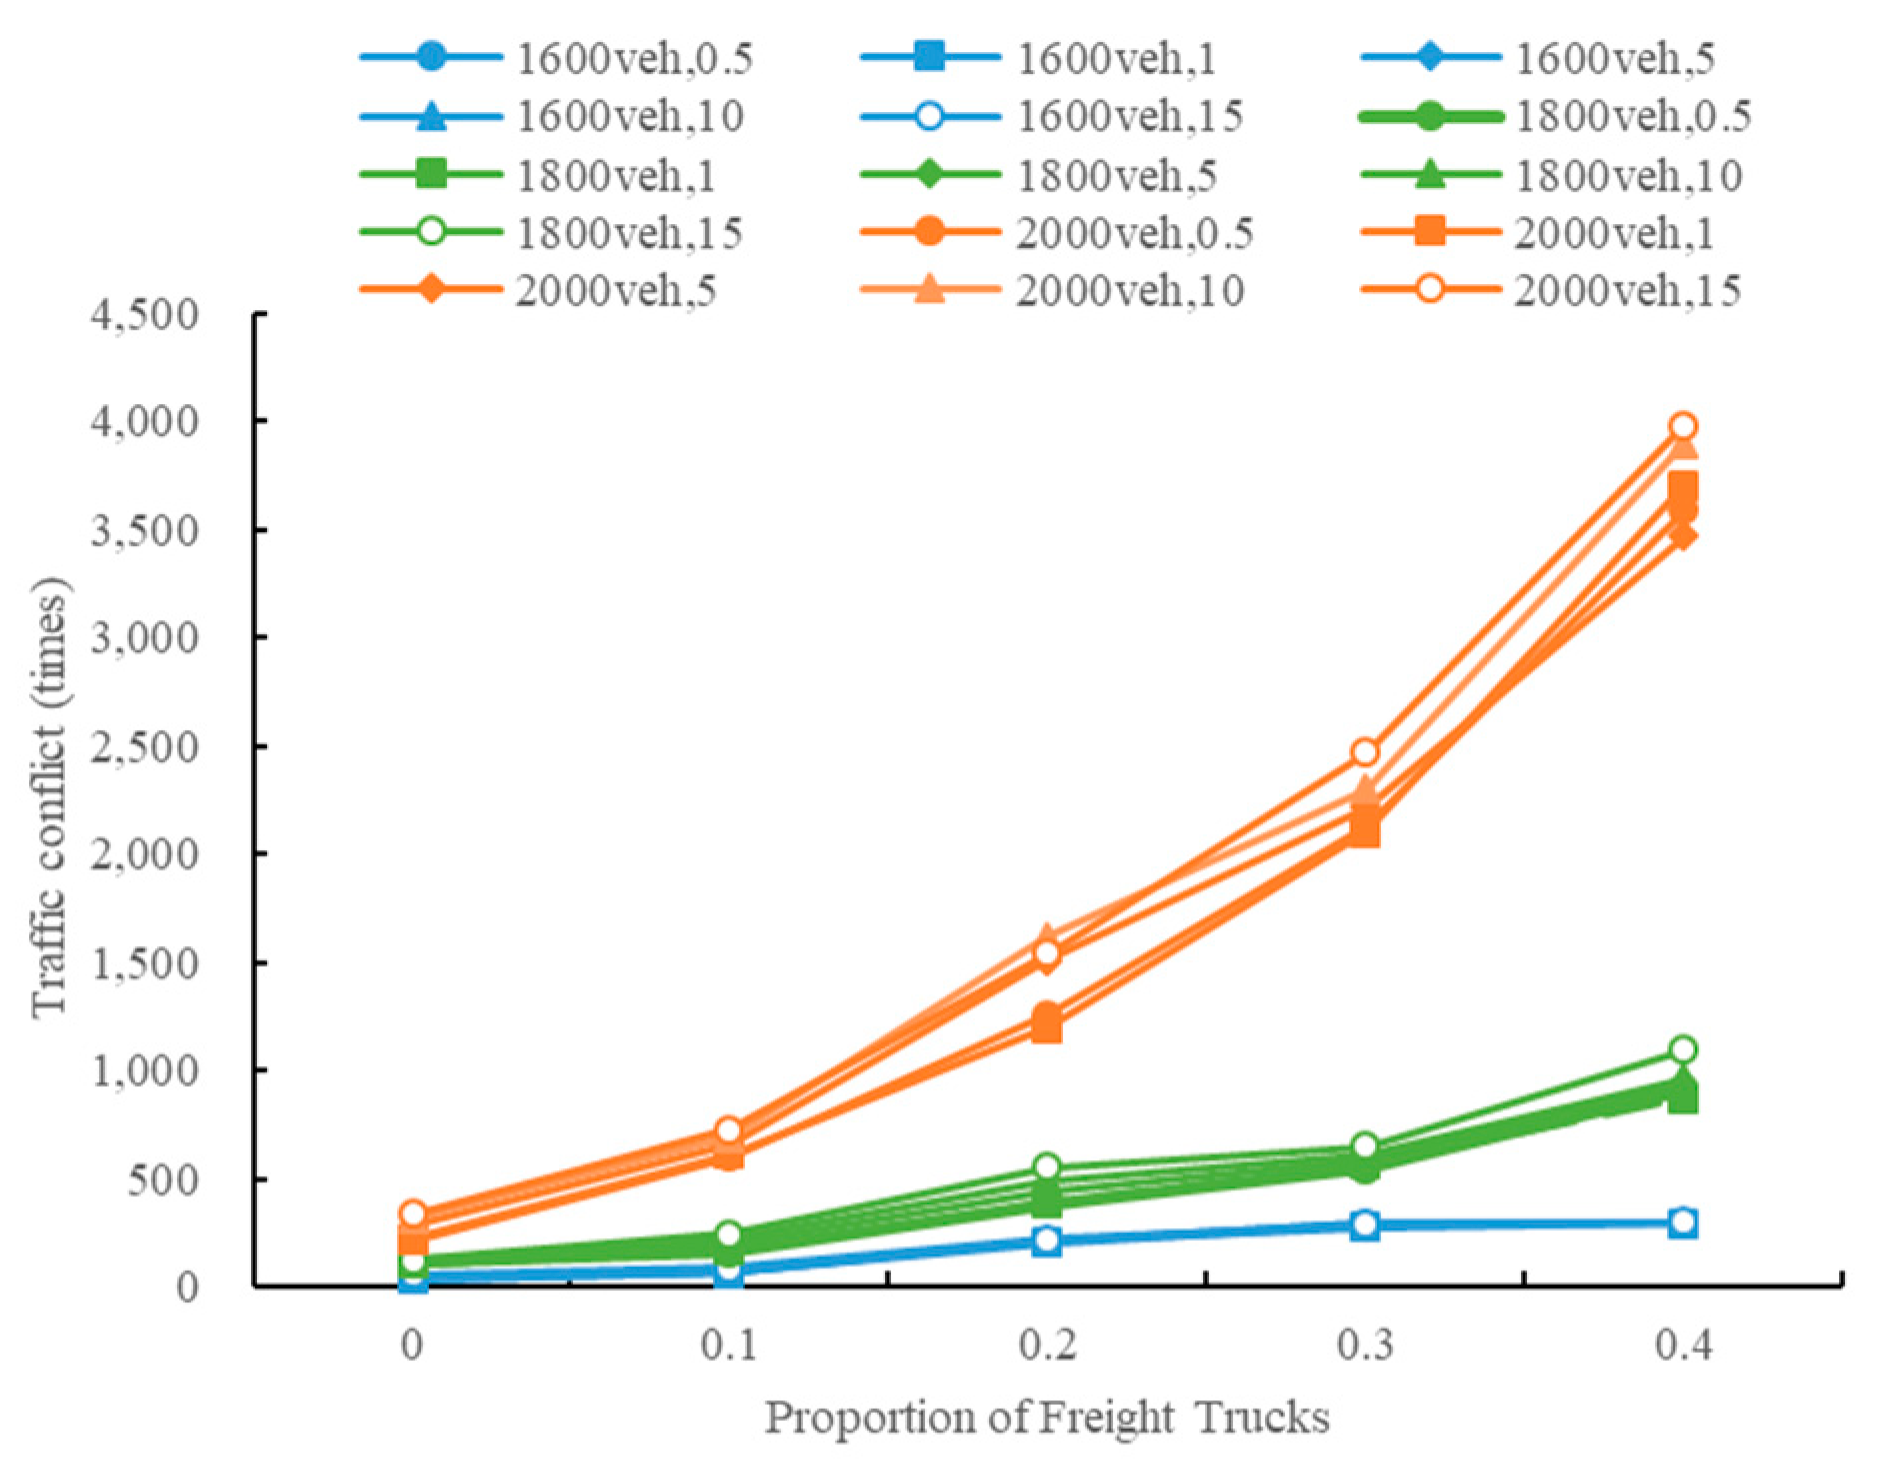
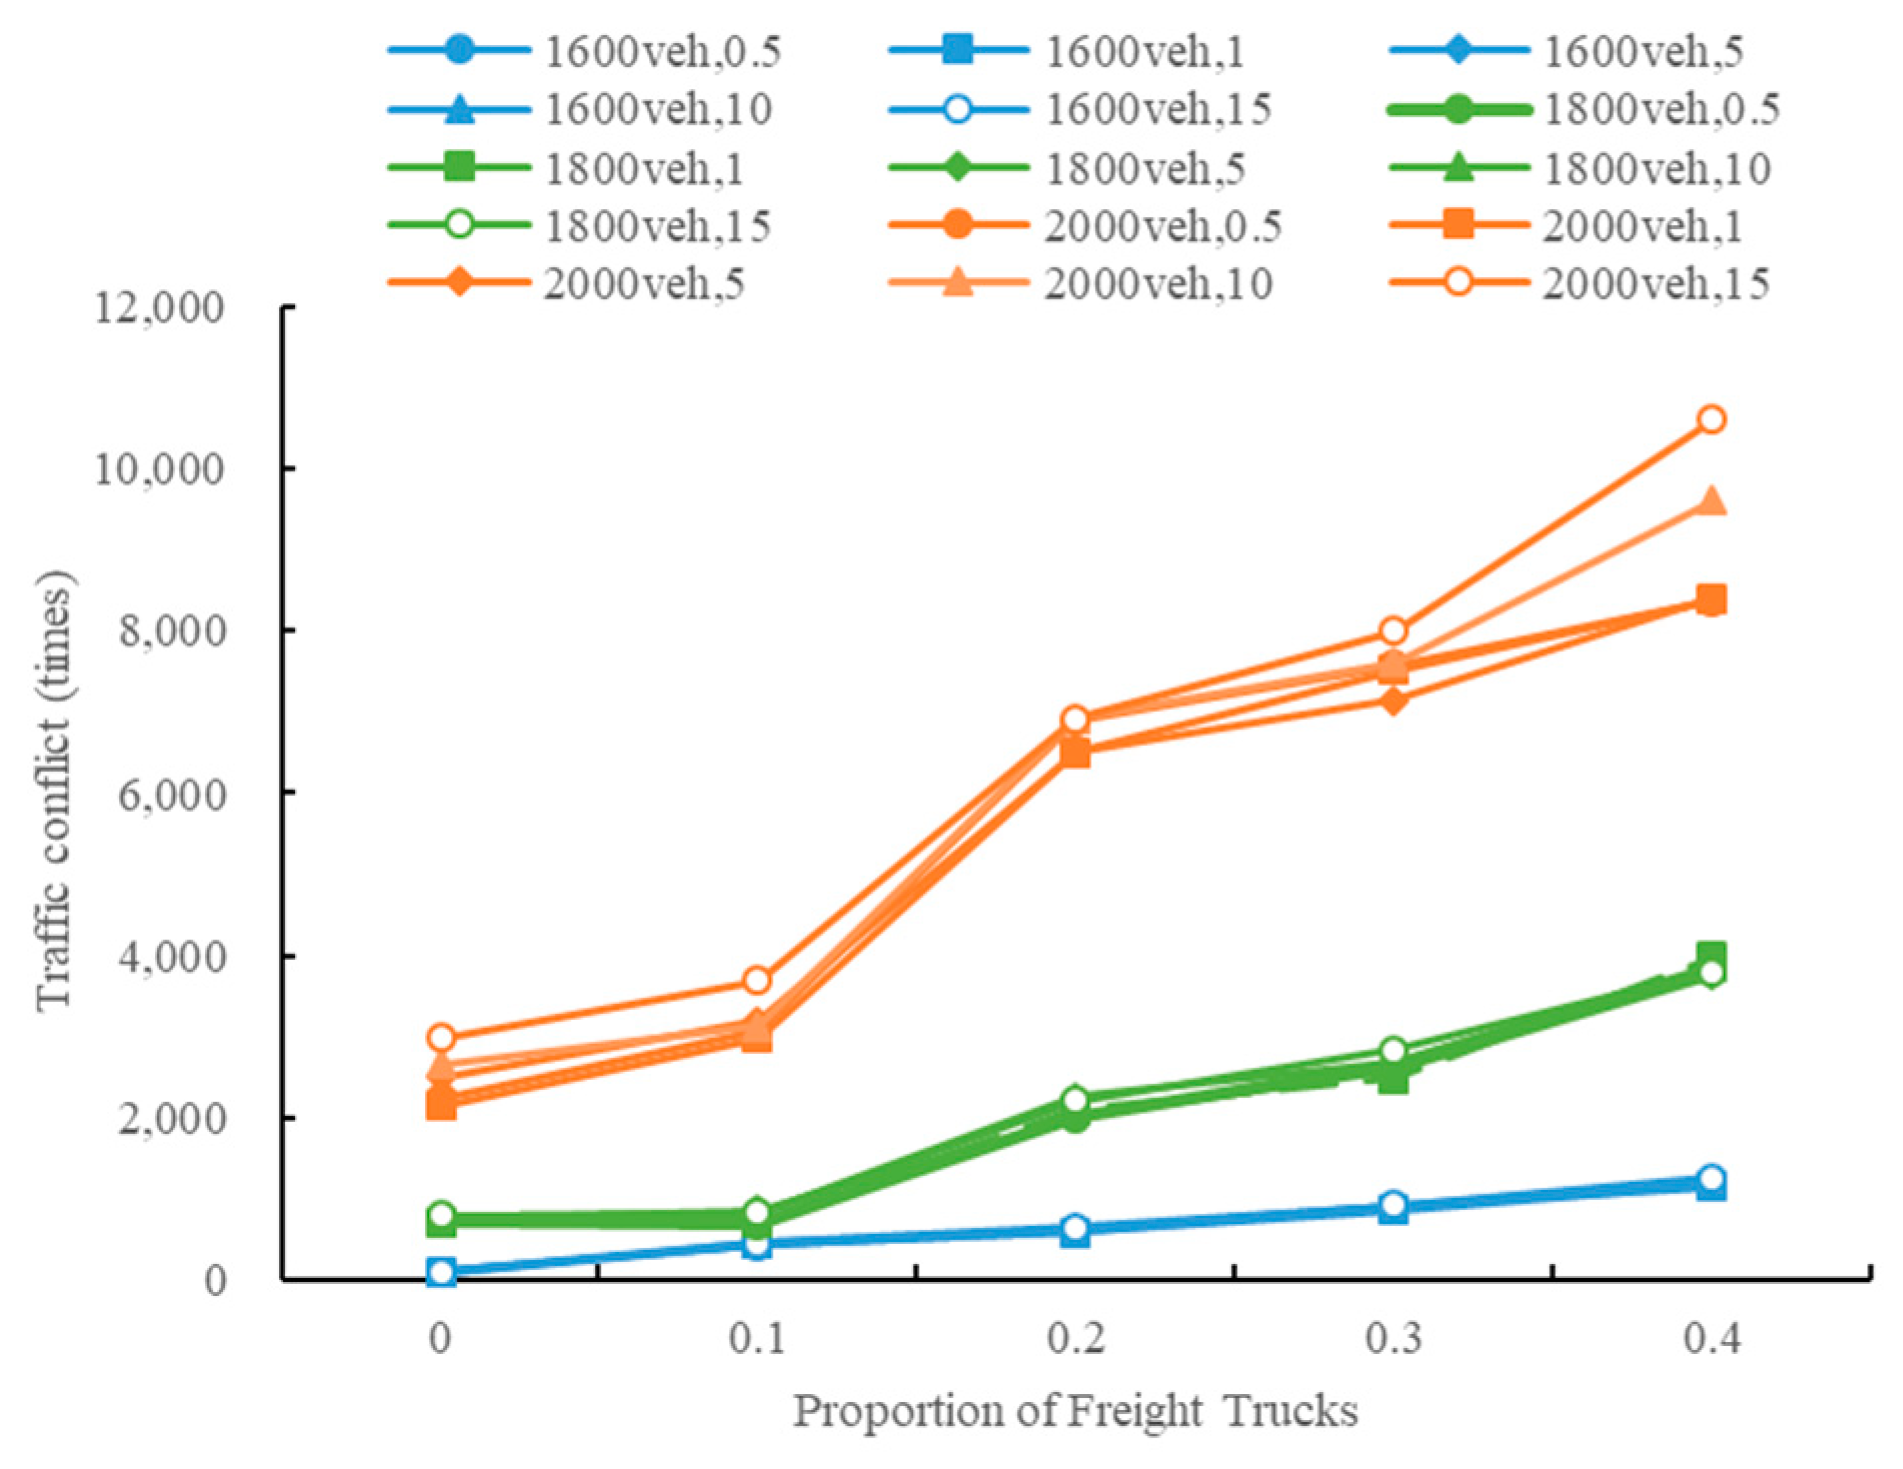
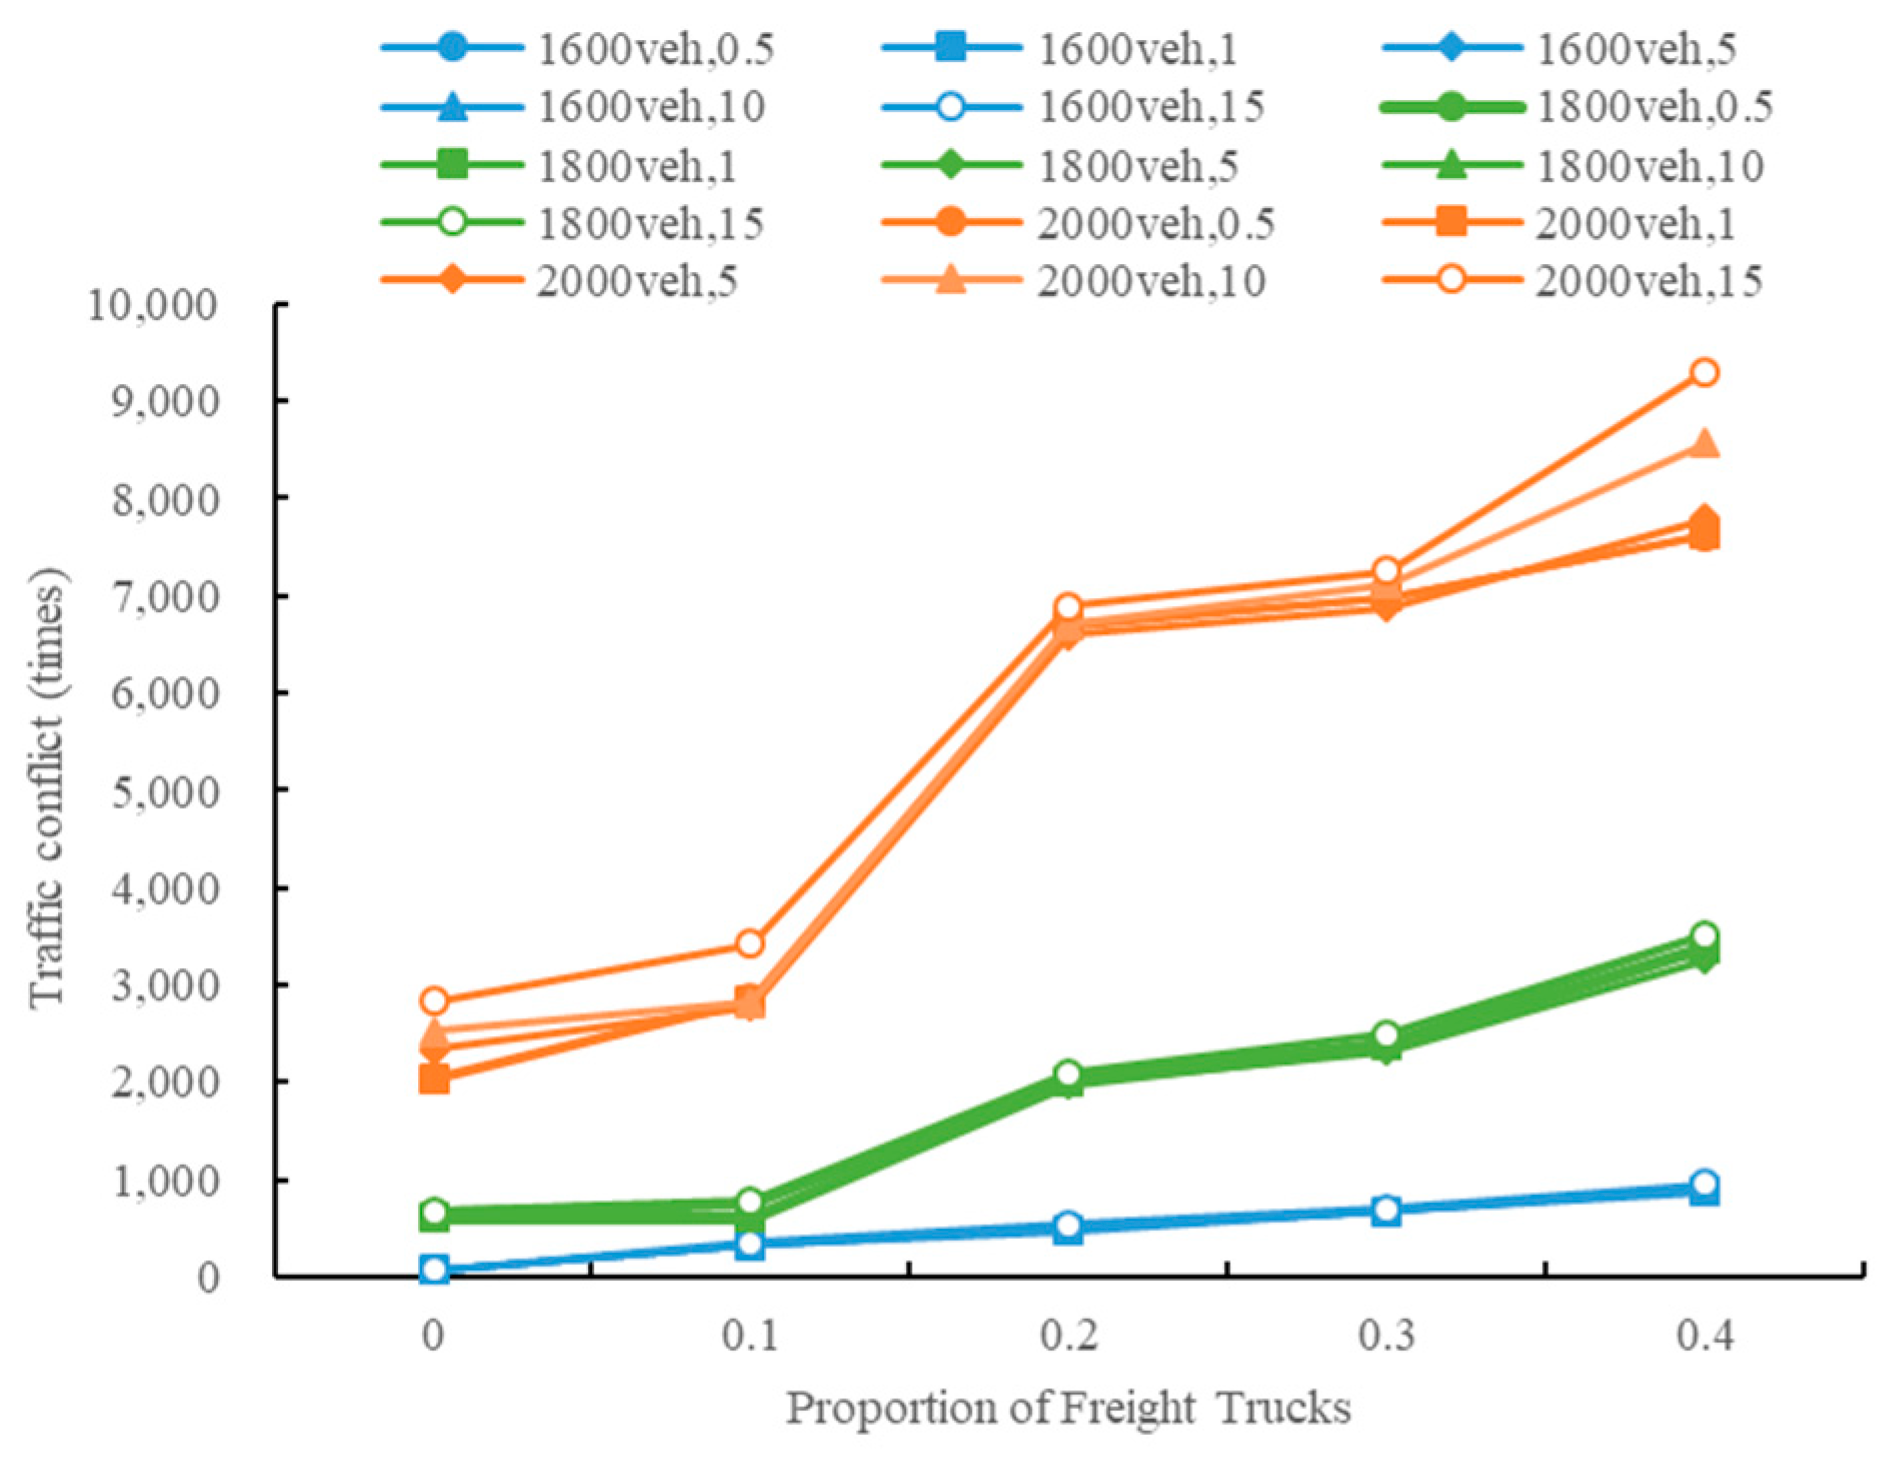
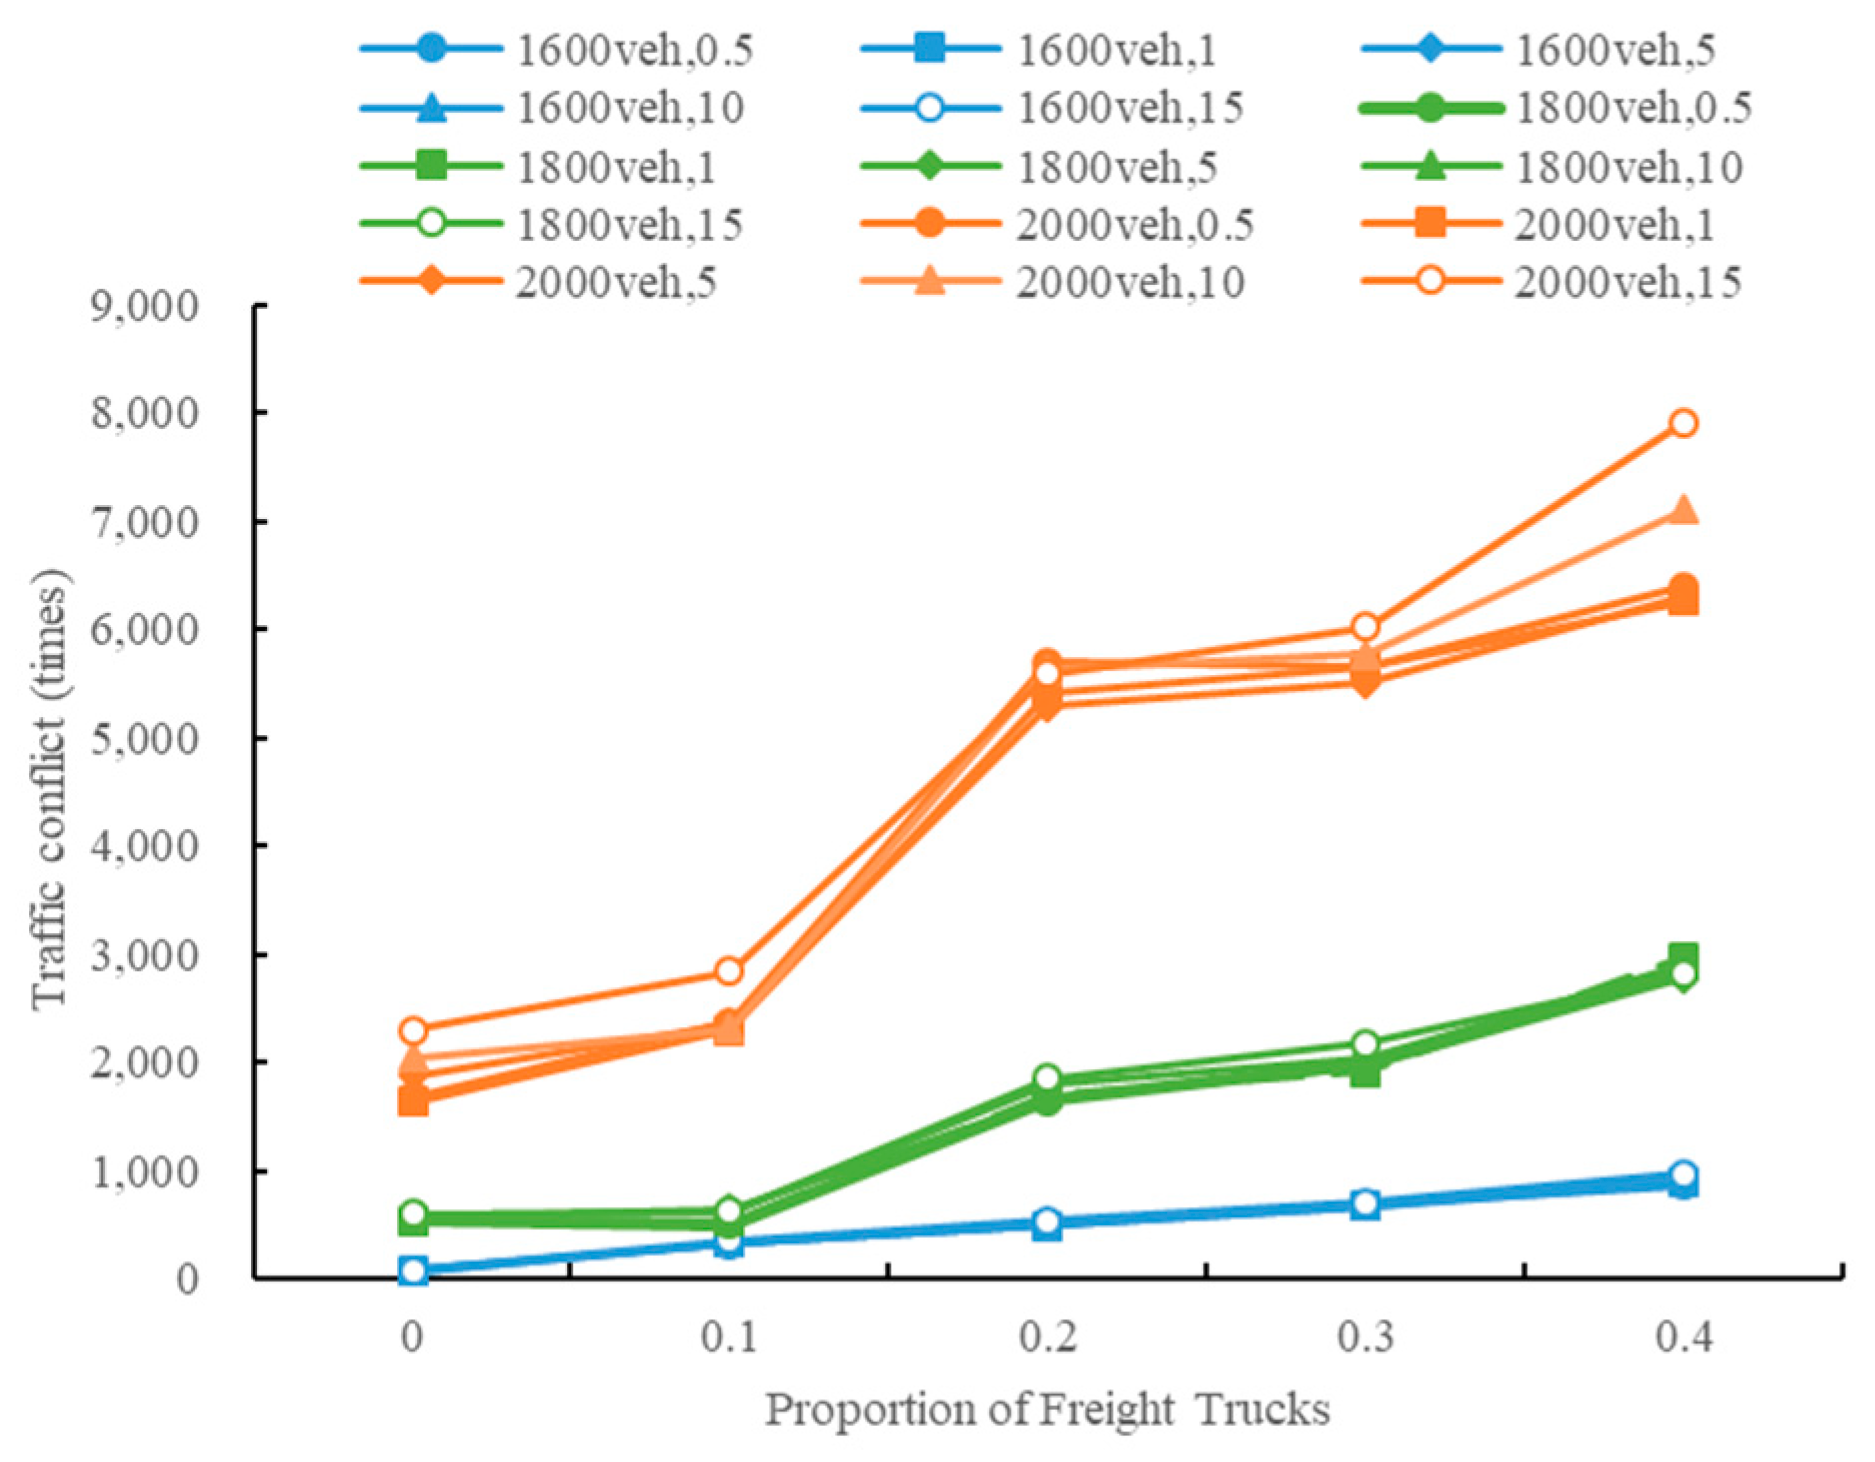
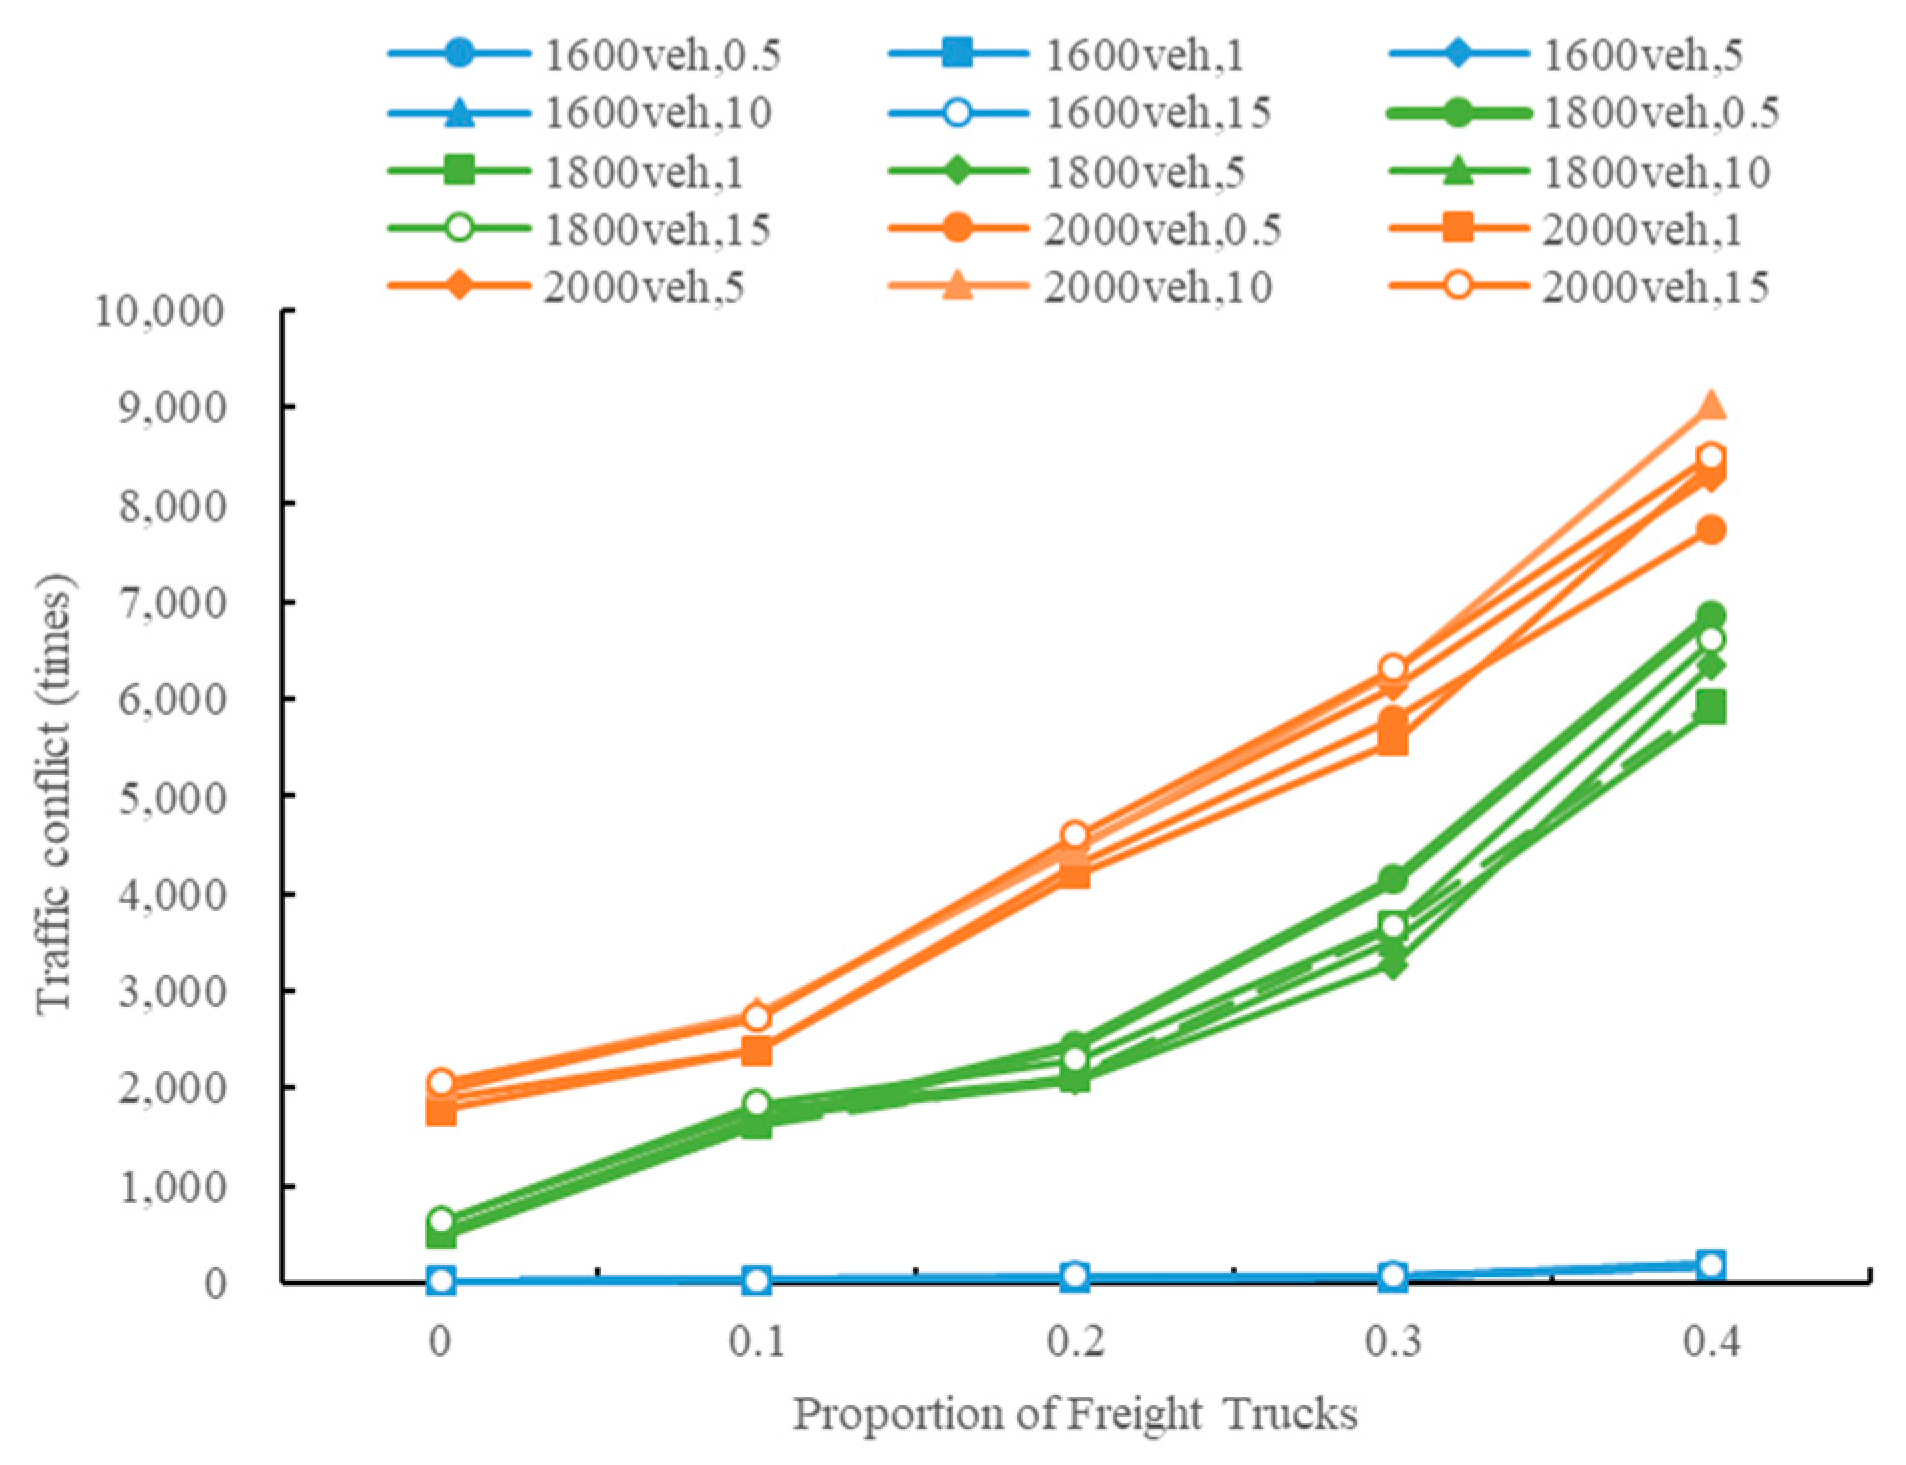
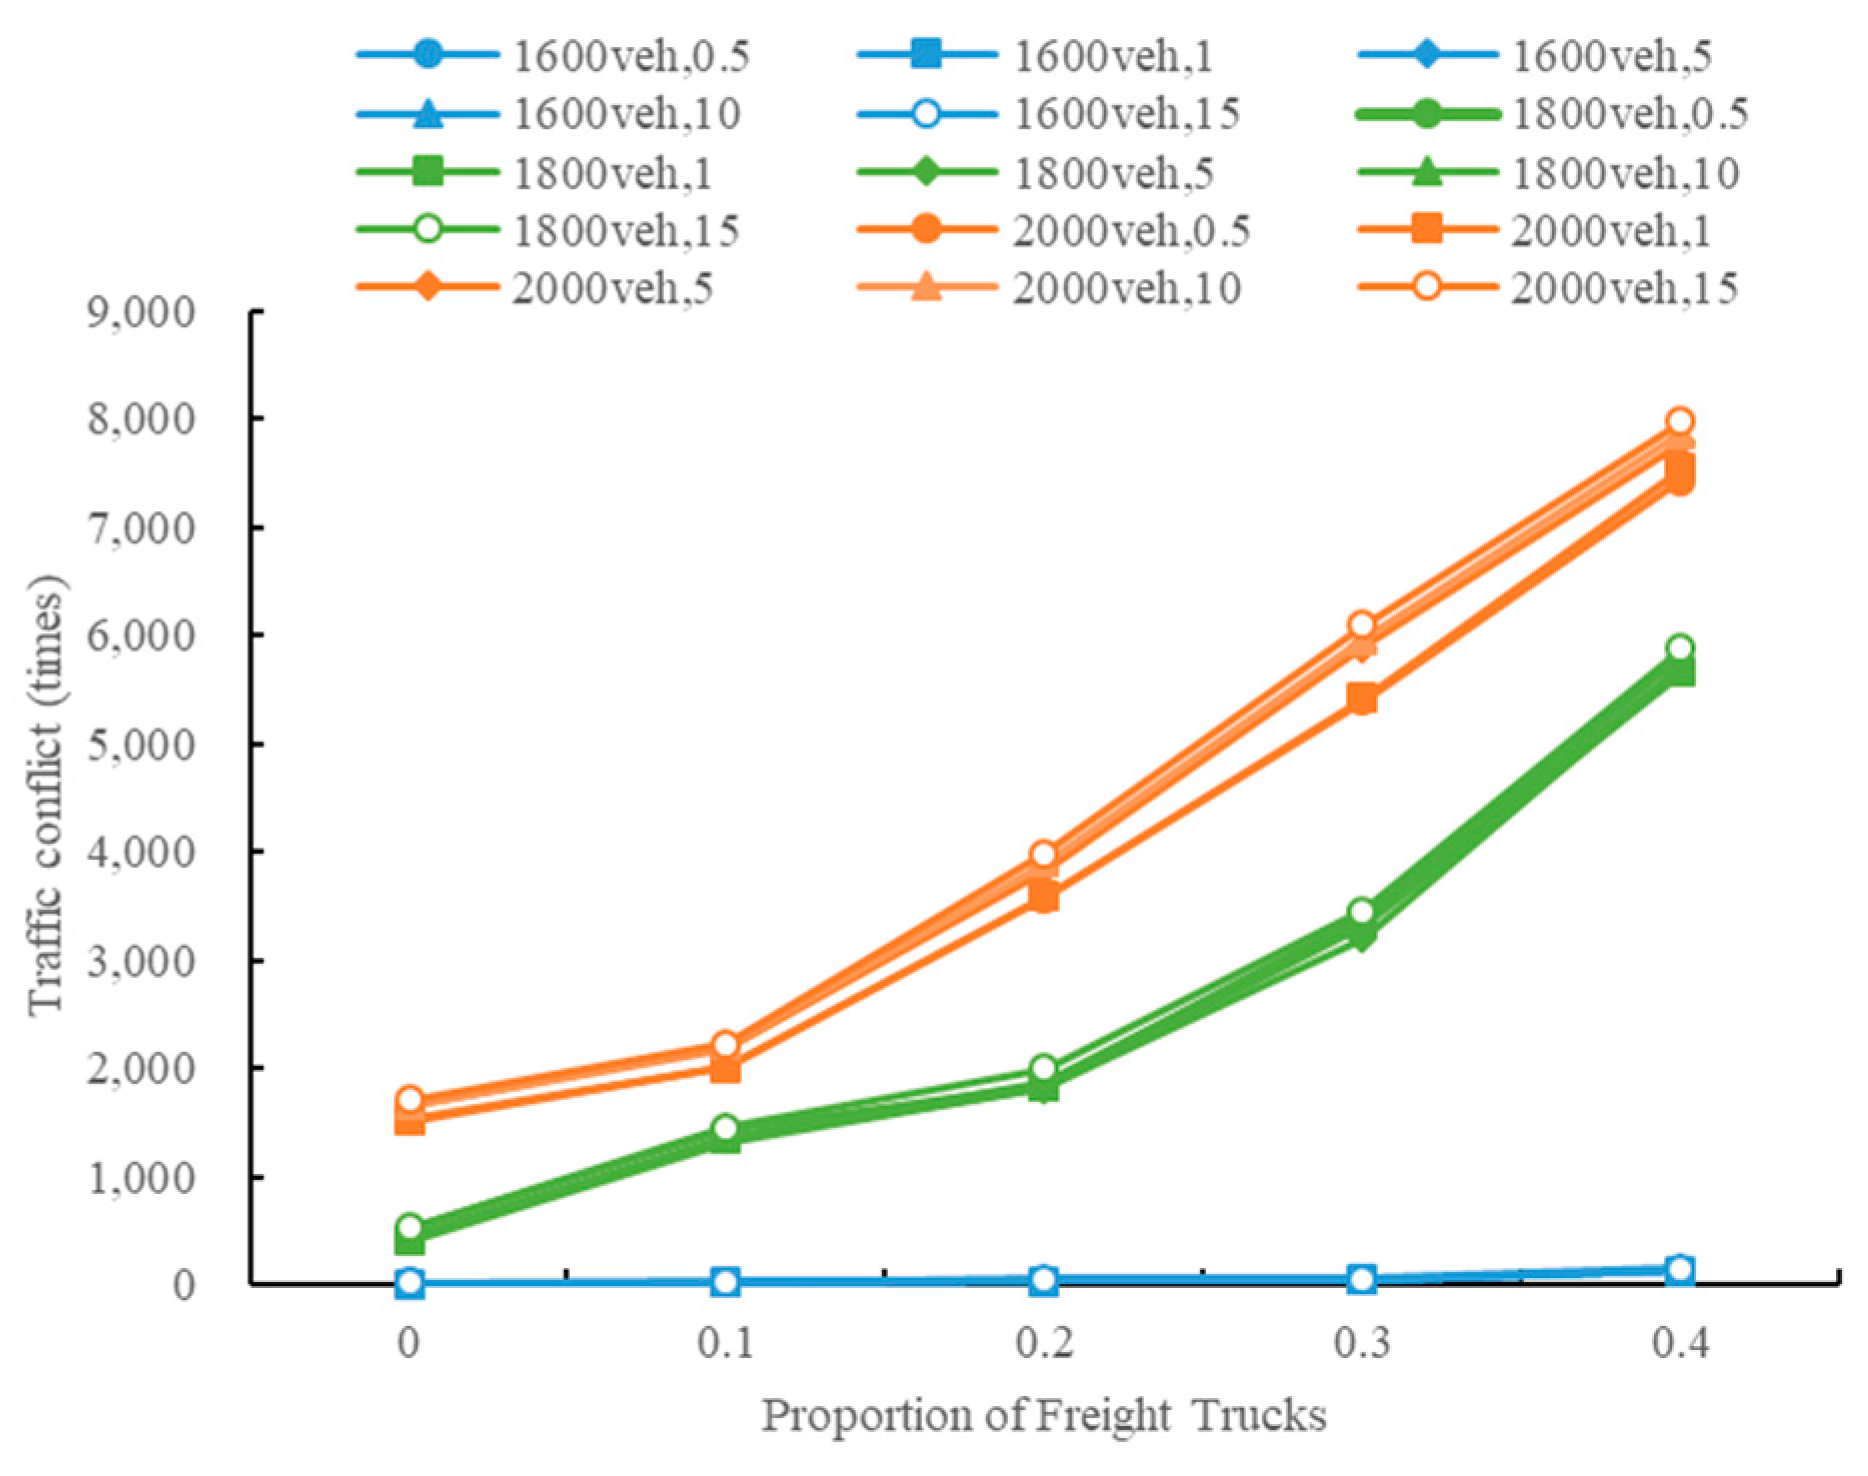
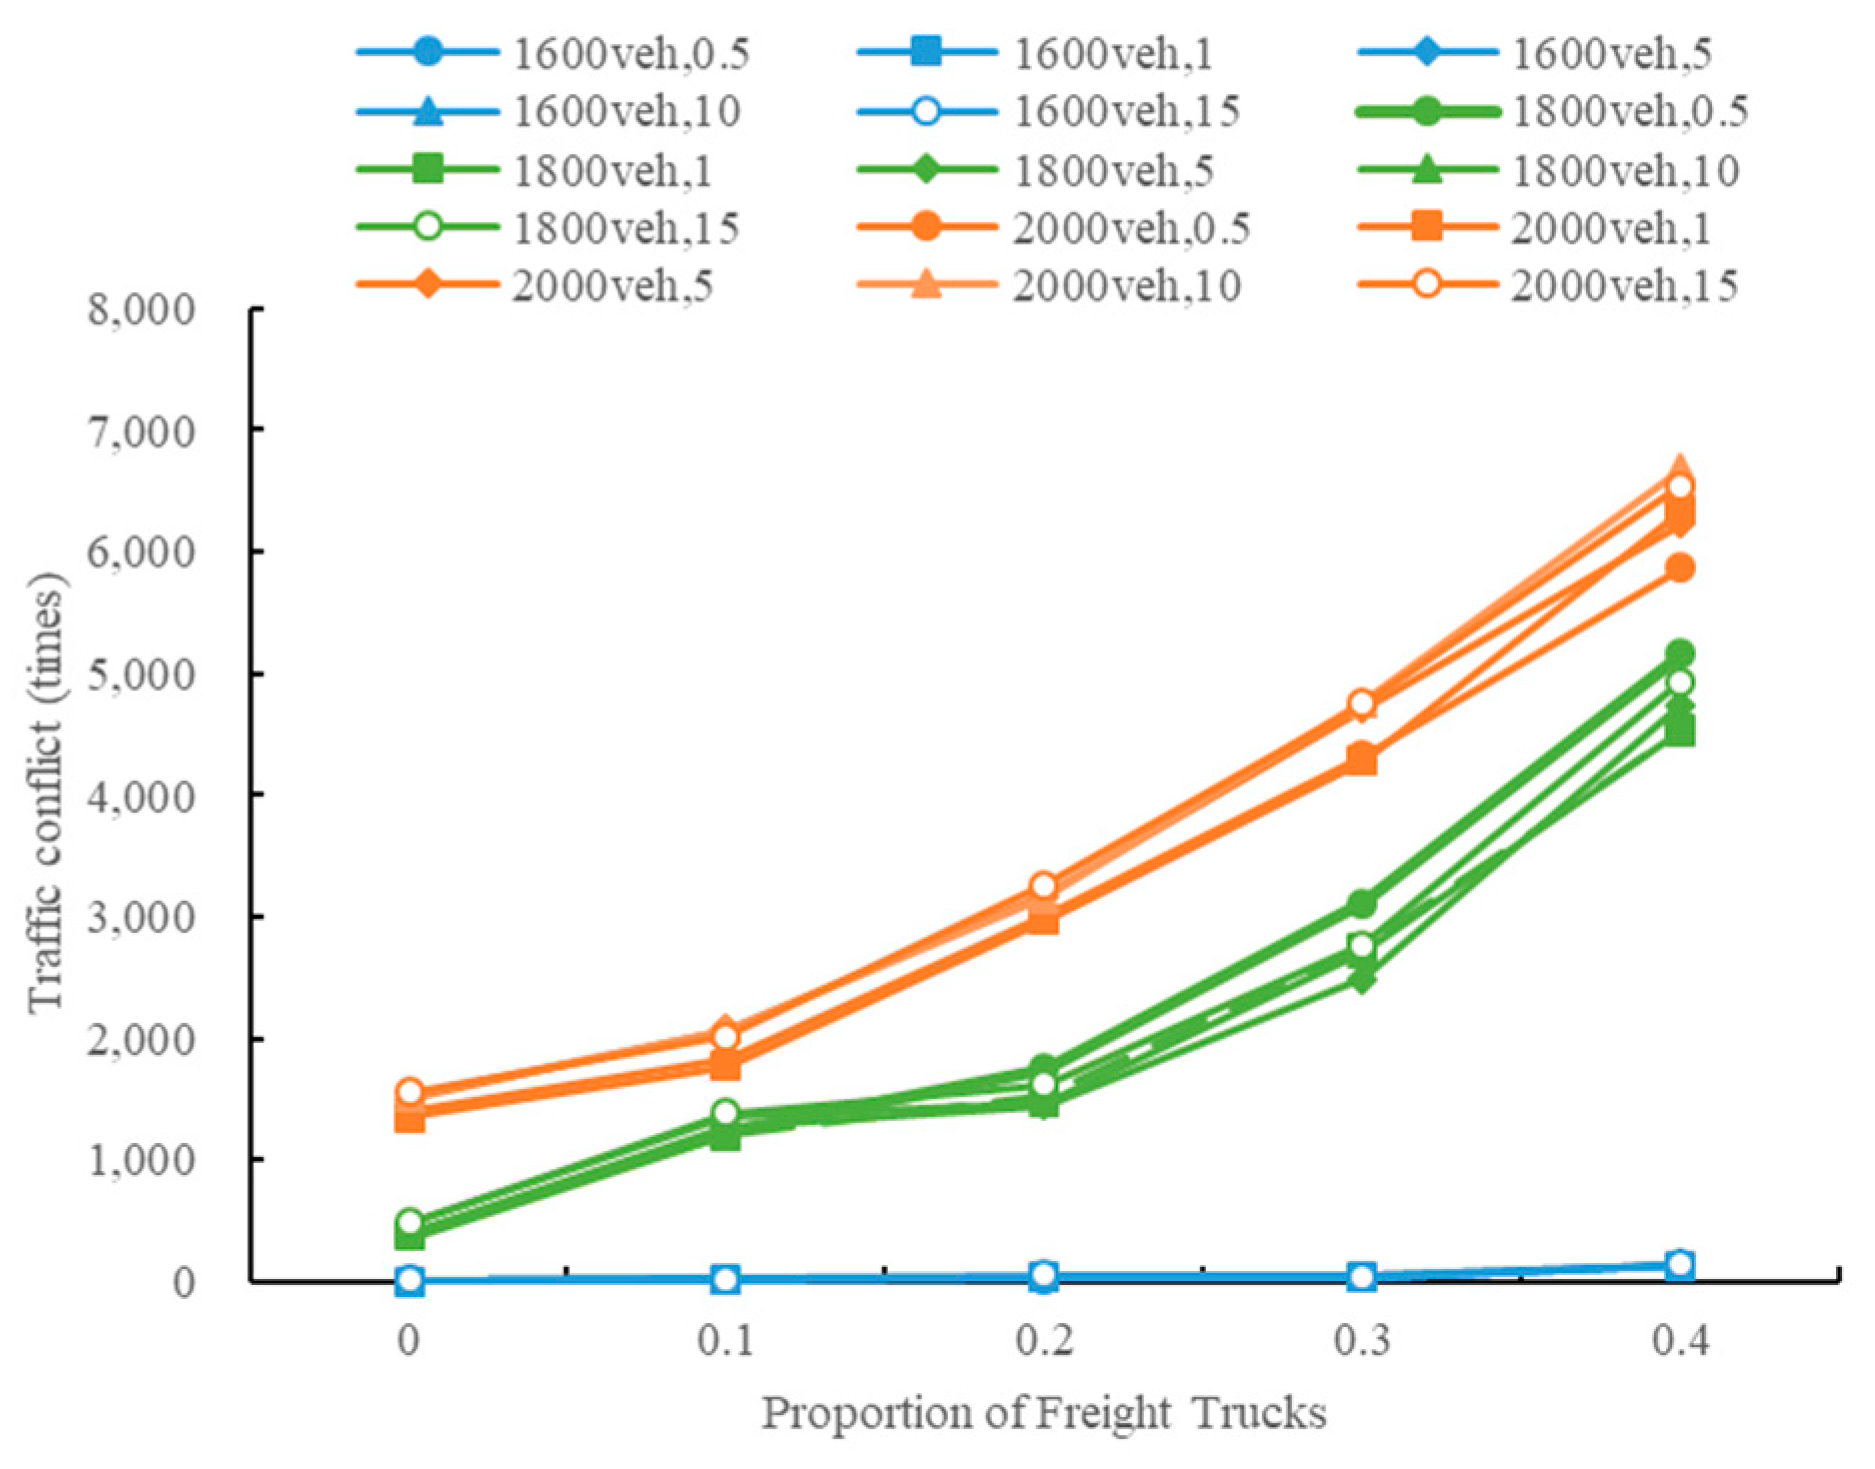
3.2. Impact of Truck Proportion on Traffic Conflicts
When the traffic volume was 1600 veh/(ln·h)−1, with an increase in truck proportion, the number of traffic conflicts in the three scenarios varied only slightly;
When the traffic volume was 1800 veh/(ln·h)−1, with an increase in truck proportion the number of traffic conflicts in the closed lane scenario increased slightly. However, the change range of the opposite lane scenario in the truck proportion range of 0.1 to 0.2 increased greatly. The change ranges were relatively slight at 0 to 0.1 and 0.2 to 0.4, and the overall change was more intense in the compressed lane scenario;
When the traffic volume was 1800 veh/(ln·h)–1, the change in the closed lane and compressed lane scenarios had a more dramatic increasing trend. The change ranges in the borrowed opposite lane scenario were relatively slight at 0 to 0.1 and 0.2 to 0.4.
There was a close linear relation between the proportion of trucks and the number of traffic conflicts. A Pearson correlation test was performed, as shown in
Table 9. The results show a significant relation between the proportion of trucks and the number of traffic conflicts (
p = 0.000 < 0.05).
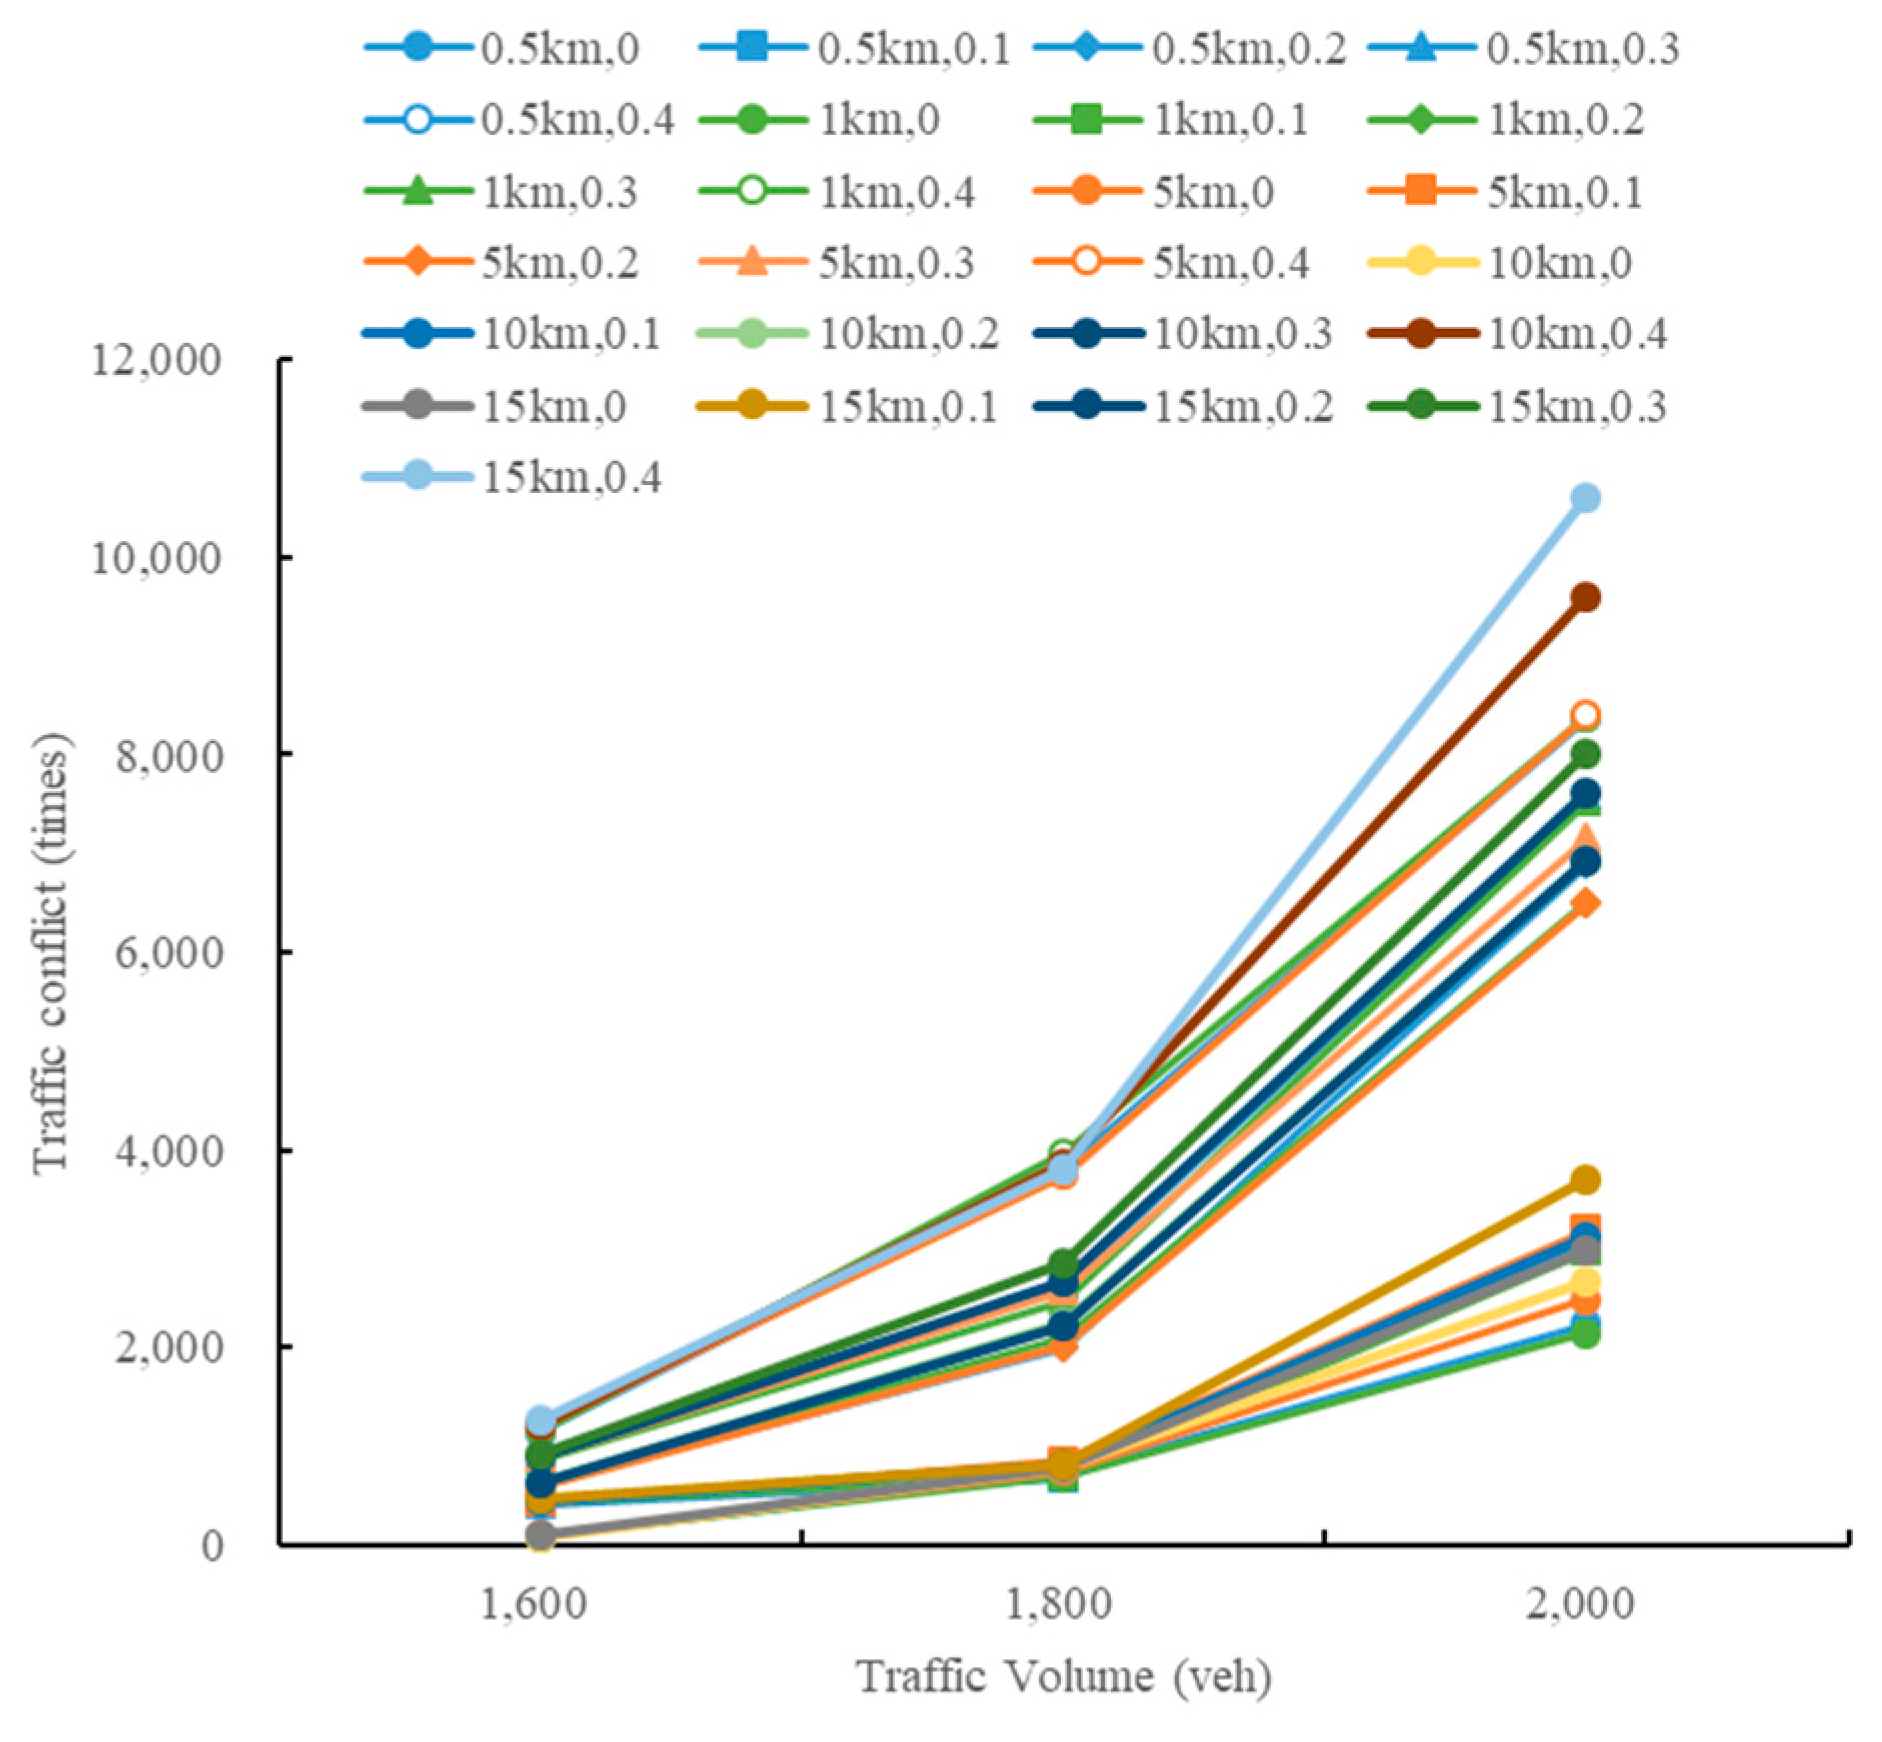
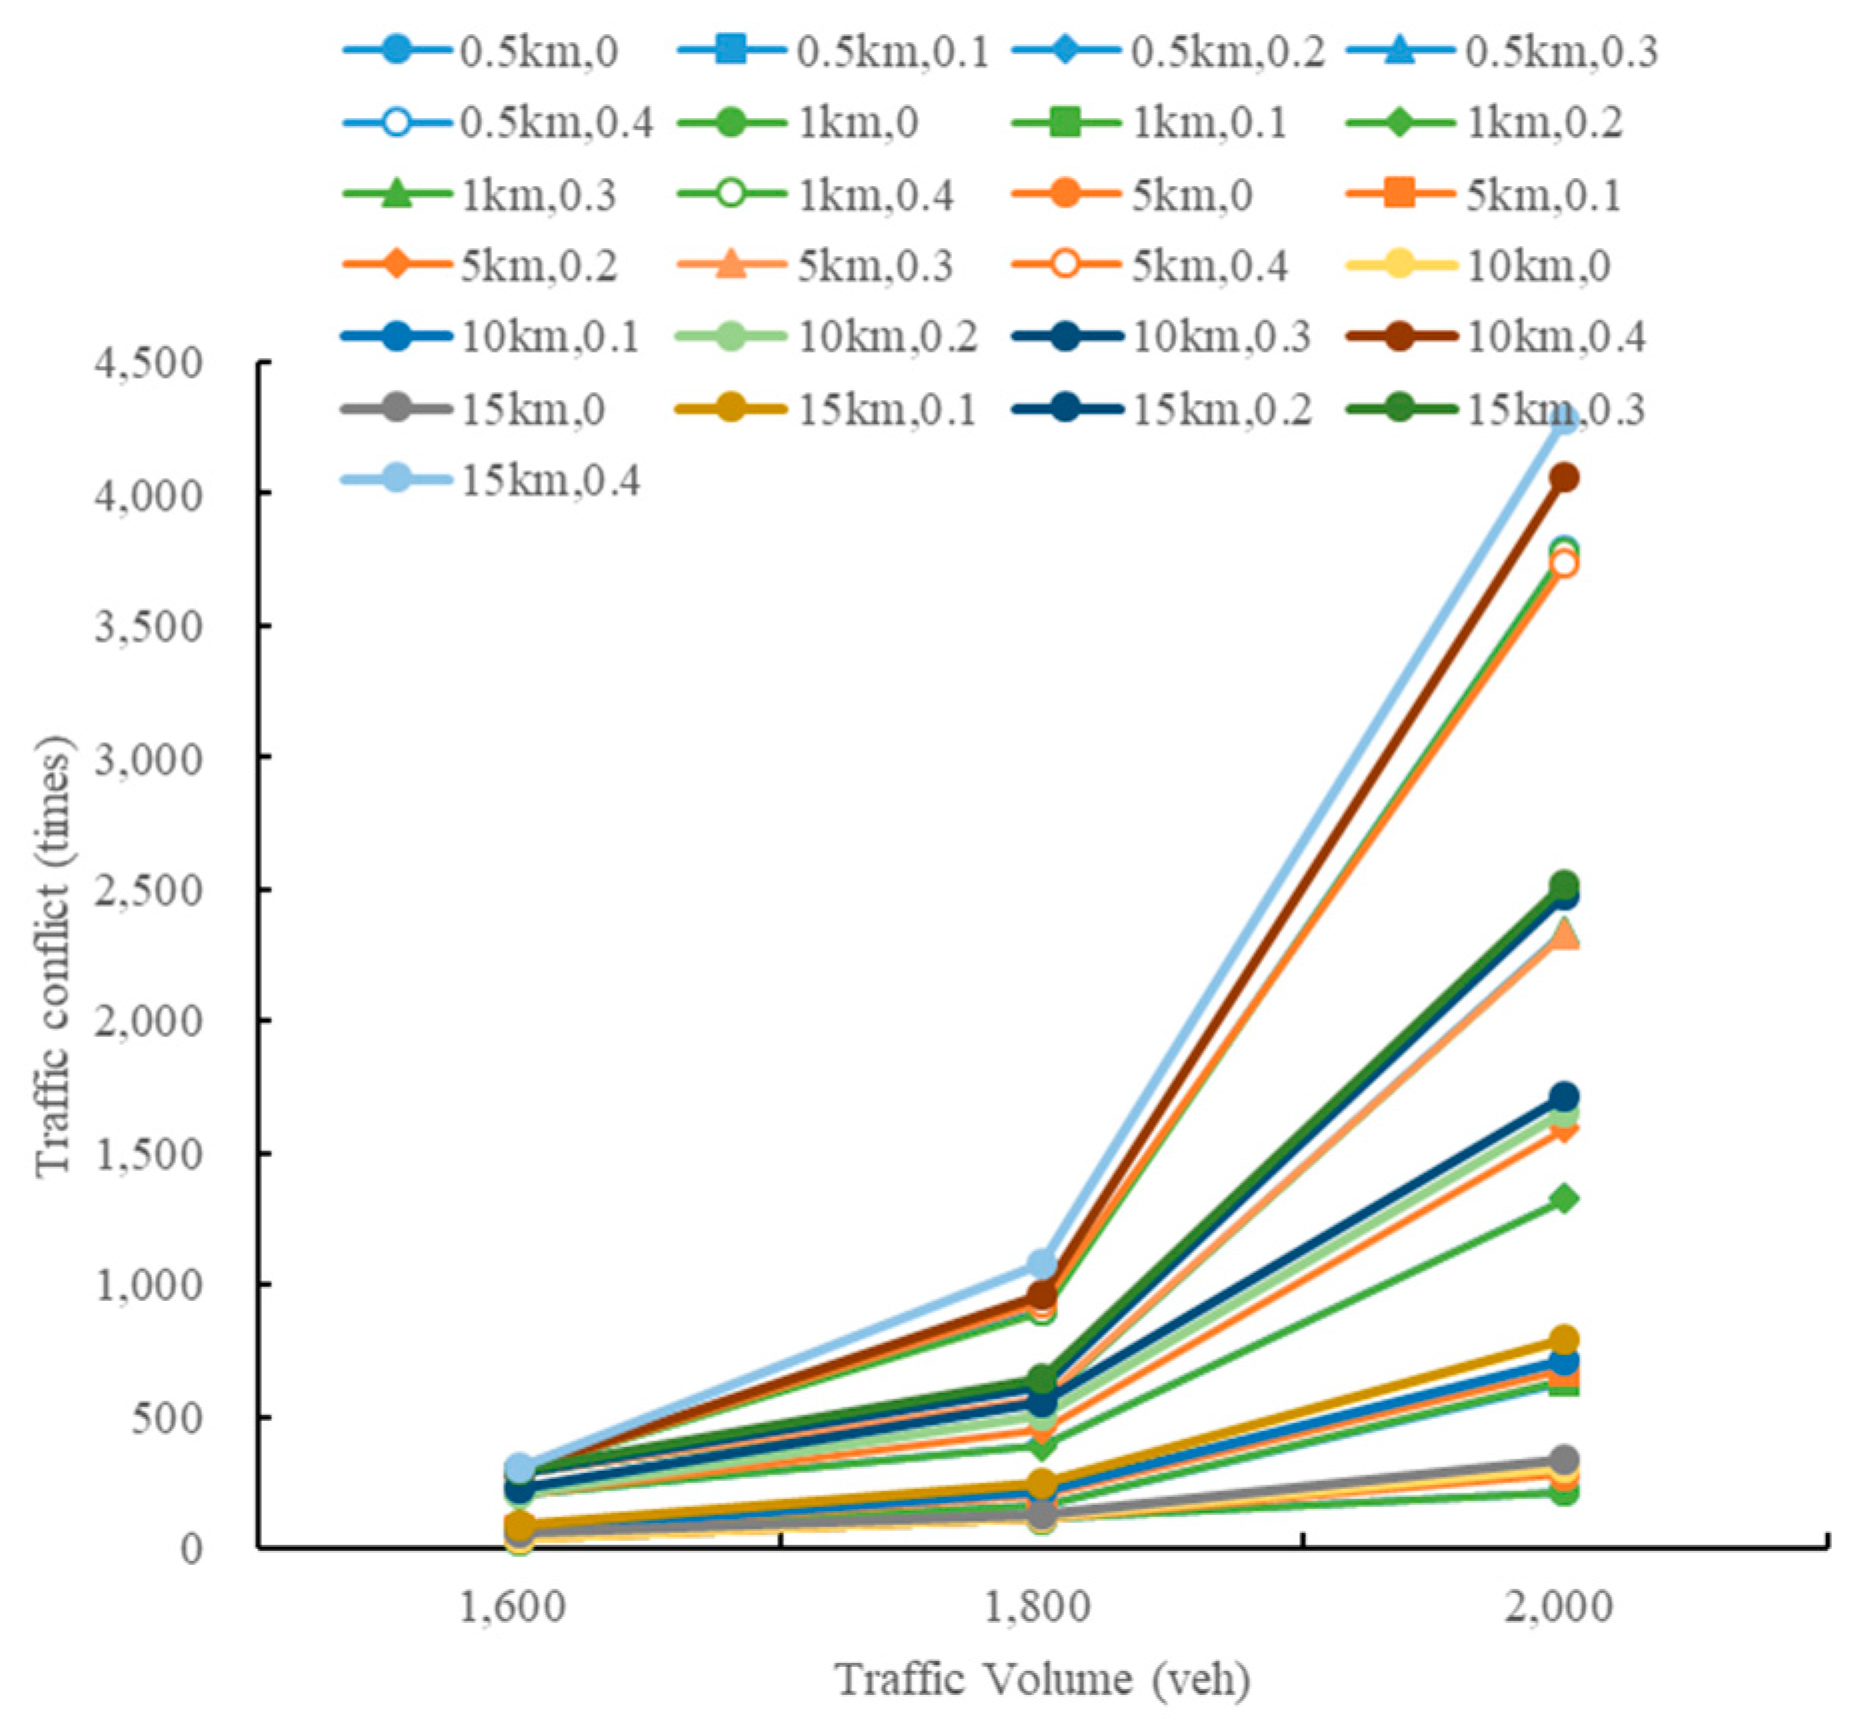
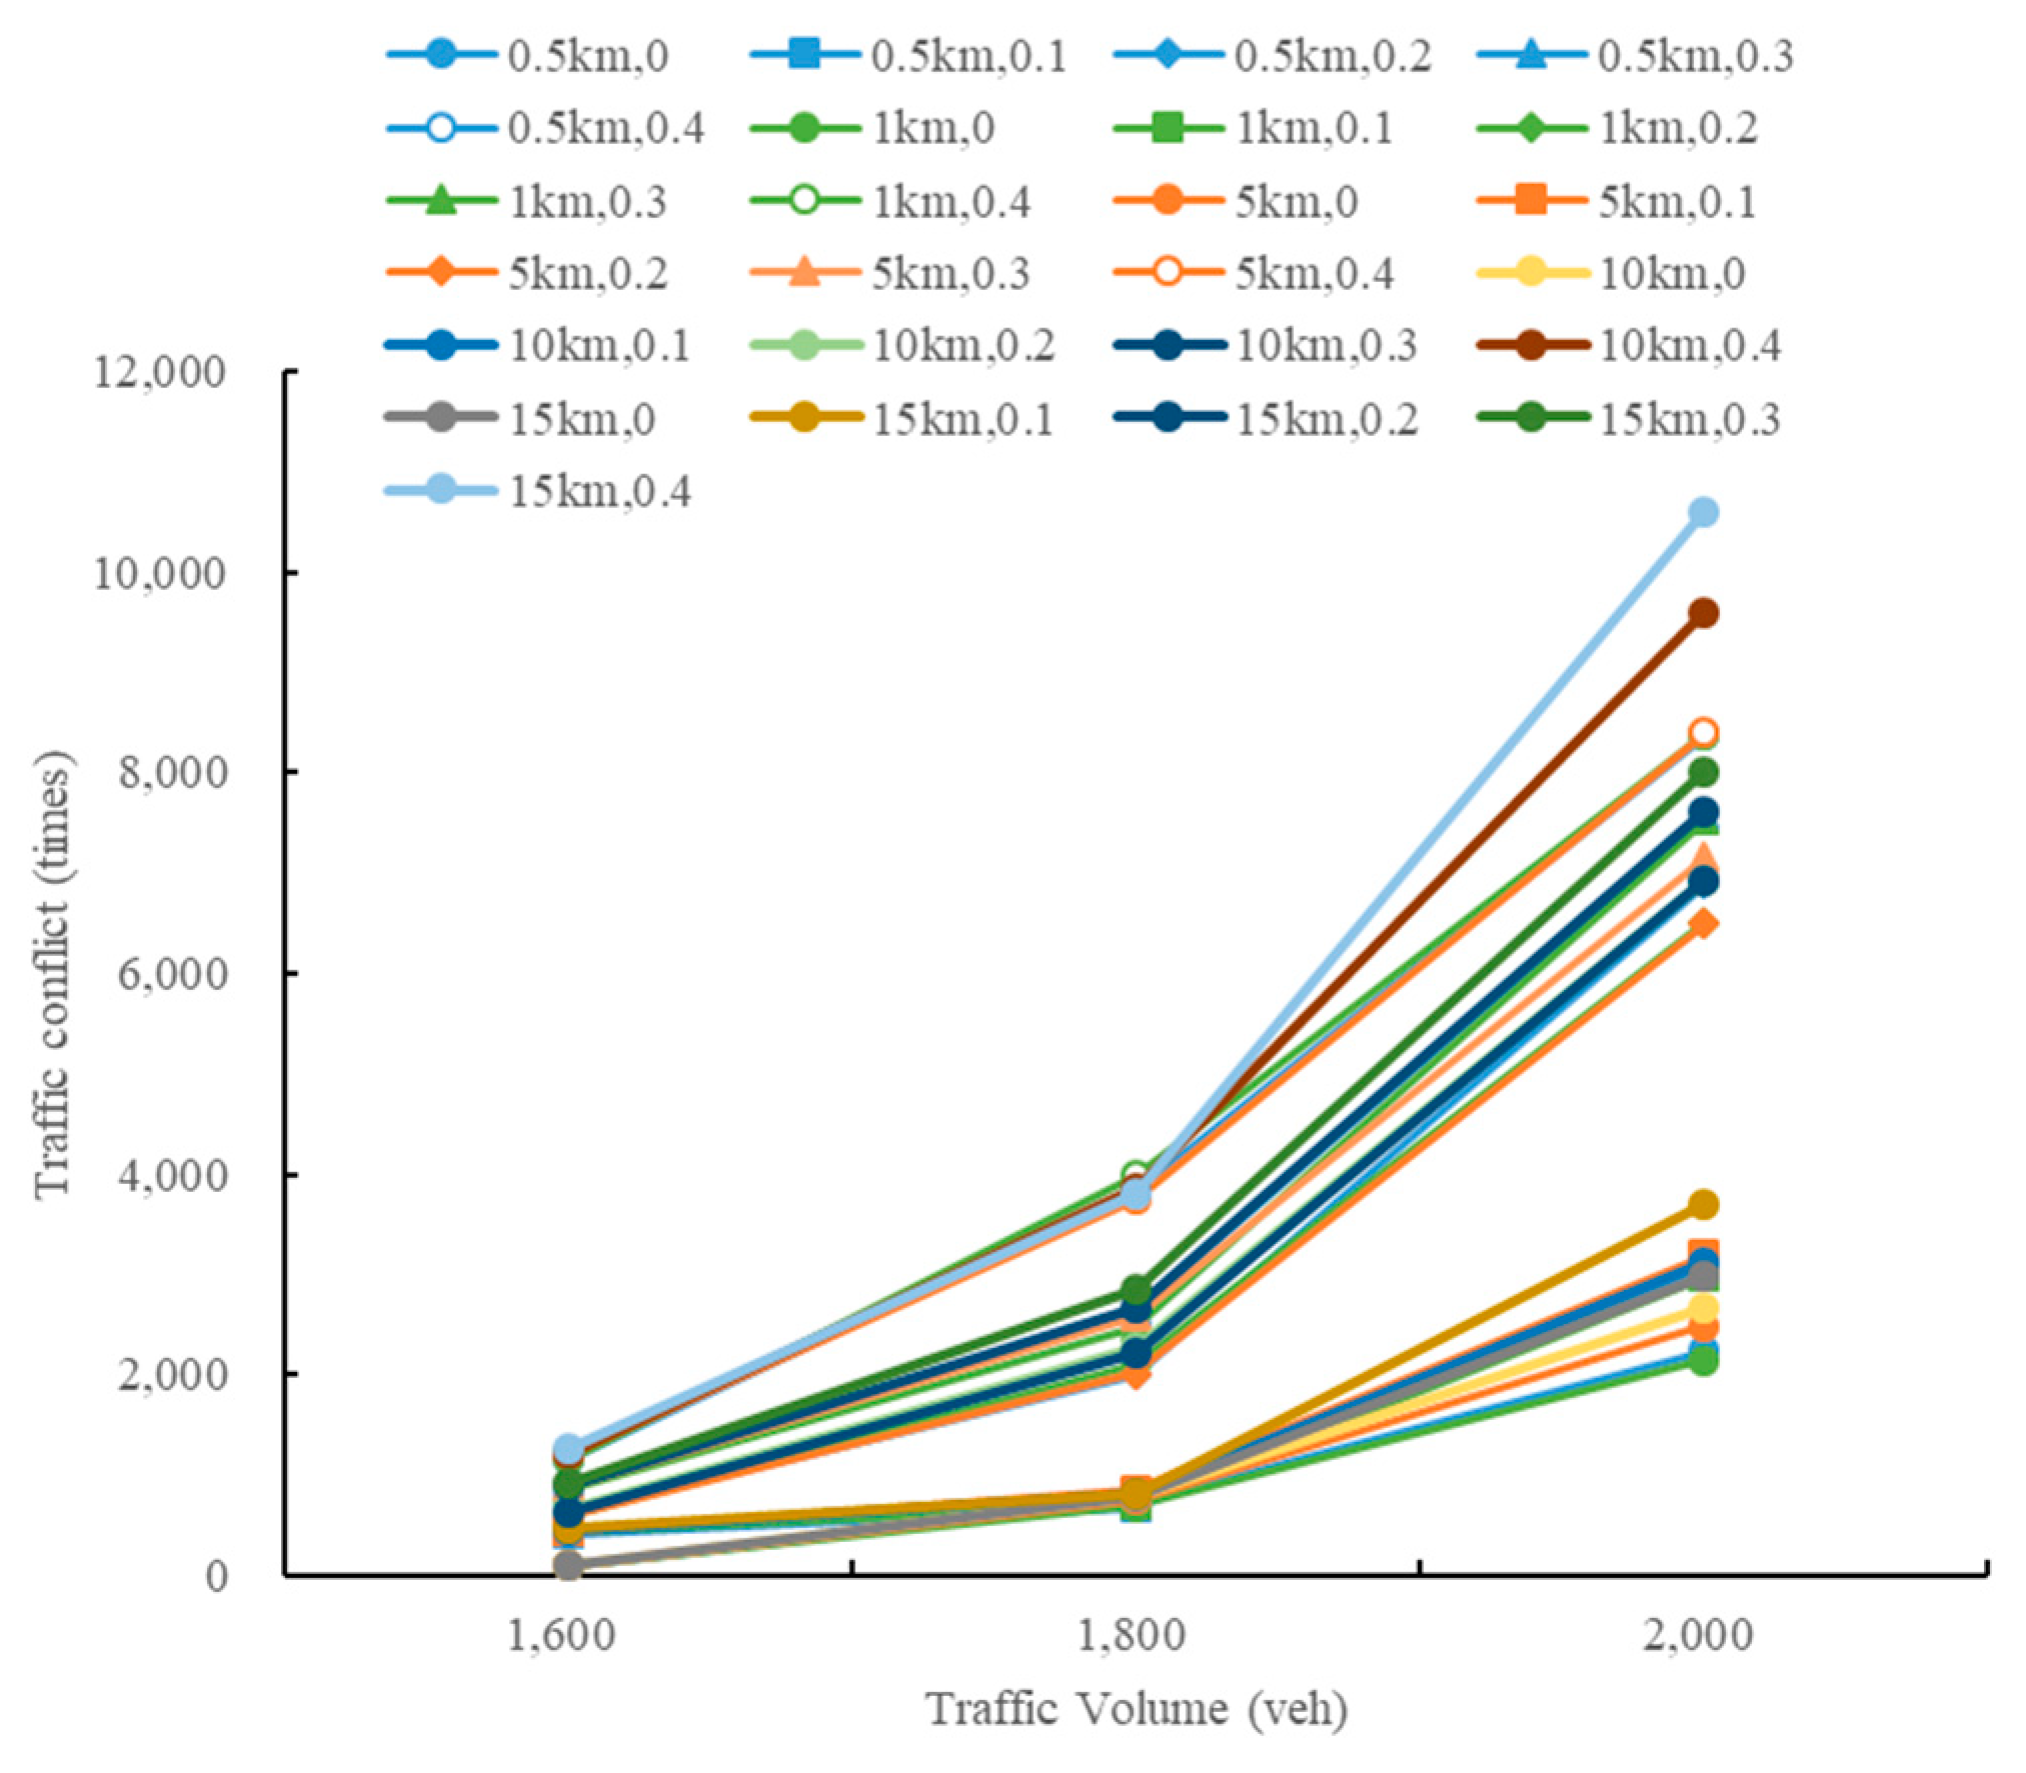
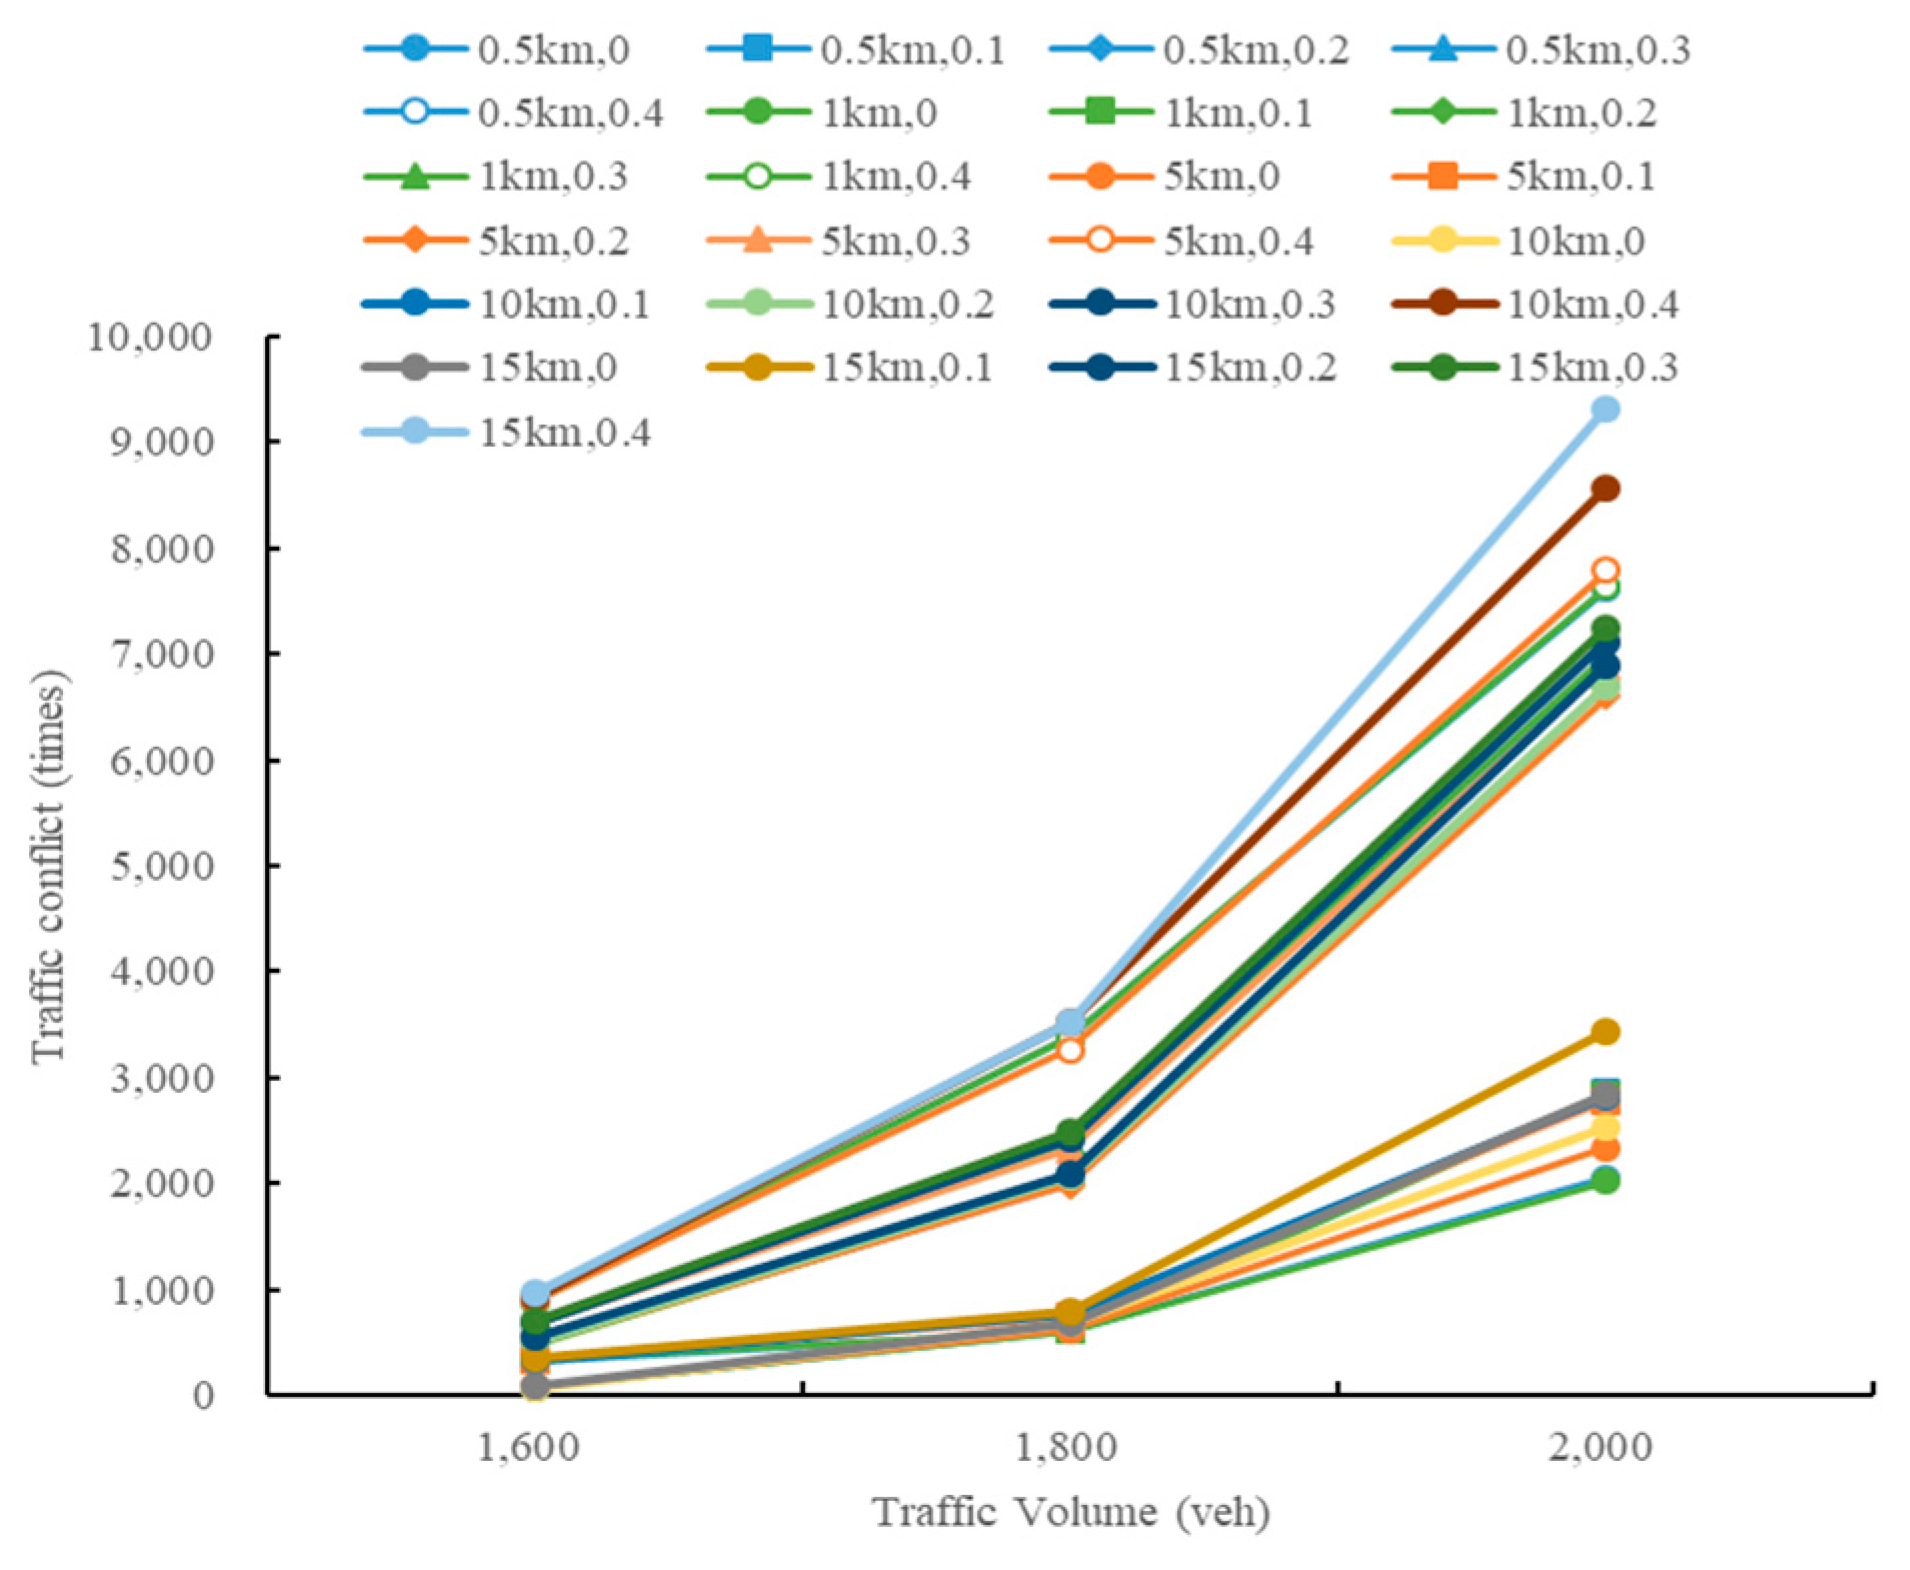
3.3. Impact of Traffic Volume on Traffic Conflict
It can be seen from
Figure 19,
Figure 20,
Figure 21,
Figure 22,
Figure 23,
Figure 24,
Figure 25,
Figure 26 and
Figure 27 that the number of traffic conflicts increased with the increase in traffic volume. In the closed lane and borrowed opposite lane scenarios, the increase in traffic conflicts was more obvious with the increase in traffic volume. In the compressed lane scenario, when the traffic volume increased from 1600 to 1800 veh/(ln·h)
−1, the number of traffic conflicts increased, and the increase range was larger. When the traffic volume increased from 1800 to 2000 veh/(ln·h)
−1, the increase in traffic conflict was basically unchanged.
A Pearson correlation analysis was performed on traffic volume and traffic conflict, and the results are shown in
Table 10:
p = 0.000 < 0.05, a significant difference.
3.4. Impact of Different Traffic Organization Forms on Traffic Conflict
There were obvious differences in the number of traffic conflicts in different forms of traffic organization. The number of conflicts in the three scenarios had a high-to-low sequence of opposite lane > closed lane > compressed lane. A Spearman correlation analysis was performed, and the results are shown in
Table 11:
p = 0.000 < 0.05. Specifying the different traffic organization forms and traffic conflicts also had important effects.
3.5. Impact of Different Speed Limits on Traffic Conflict
A Pearson correlation test was performed on the speed limit values and traffic conflicts in different scenarios; the results are shown in
Table 12:
p = 0.015 < 0.05, and there was a correlation between them.
In the VISSIM simulation experiment, the experimental vehicle reduced its speed through the secondary speed limit. In this process, different types of vehicles decelerated differently, and the speed dispersion increased, so conflicts between vehicles occurred easily. Moreover, the lower the final speed limit, the lower the road capacity, and the more likely the vehicles were to jam and queue in the merging area. This resulted in increased traffic conflicts, so the speed limit should not be lower than a certain level.
3.6. Section Reliability Analysis Based on Traffic Conflict
Section reliability refers to the probability of no accidents in a certain period. If an accident in the expressway system is defined as a failure, the failure rate is the number of accidents per unit time, and the reliability is calculated according to the failure rate. In general, most road accidents obey a Poisson distribution, and the interval time of the accidents follows a negative exponential distribution [
50,
51,
52]. In accordance with the reliability theory, the reliability of the exponential distribution is calculated as:
where
is the reliability function;
is the number of accidents per unit time, taking 1 h as the unit; and t is the time, taking 24 h as the time to study the probability of no accidents in 1 d. The number of conflicts obtained by simulation is converted to
. Based on 1 accident per 100,000 serious conflicts, the conversion is:
where
is the number of serious conflicts within 1 h.
Using Equations (1) and (2), the reliability of the experimental results was calculated, and the reliability of each scenario was determined. The reliability of the closed lane organization mode at a speed limit of 60 km/h and a flow rate of 1800 veh/h is shown in
Table 13. The reliabilities of other groups were also calculated.
Taking traffic volume, truck proportion, and speed limit values as independent variables and reliability as a dependent variable, a linear regression analysis was performed for the reliability of closed lane, borrowed opposite lane, and compressed lane scenarios, and the regression equations were obtained as follows:
Borrowed opposite lane:
where
is section reliability,
is the input flow, and
is the proportion of freight cars. The speed limit value
was 40 km/h, 60 km/h, and 80 km/h. The
R squared was 0.804,
p = 0.000 < 0.05, and the model was reliable. It can be seen from Equation (3) that the reliability decreased with the increase in flow rate and truck proportion.
The R squared was 0.934, p = 0.000 < 0.05.
The R squared was 0.868, p = 0.000 < 0.05, and the model was effective.
The regression equation shows that the reliability of the maintenance operation area in different traffic organization modes was affected by traffic volume, truck proportion, and speed limit value.
The traffic volume increased, the reliability decreased, and the traffic volume had a great influence on reliability. In a certain range, the traffic volume increased by 100 veh/(ln·h)–1, and the reliability was at least 0.1;
The increase in freight car proportion led to a decrease in reliability;
The reliability increased with an increase in the speed limit of between 40 km/h and 80 km/h;
There were differences in the reliability of the maintenance operation area in different traffic organization modes.
3.7. Application Prospect Analysis
Since the absolute number of traffic accidents is relatively small, the safety evaluation of maintenance areas based on traffic conflicts has significant advantages. Firstly, the cycle of traffic conflicts is much shorter than the cycle of accidents, and the collection of conflict data is higher. The conflict data can be obtained by real-time observation or video analysis on the scene. Secondly, the sample size of traffic conflict data is large, and the traffic conflict data can be used for expressways in a short period of time. An observation of typical sections can obtain sufficient data to meet statistical requirements.
In the process of traffic operation, an accident may cause traffic congestion or road segment interruption. After the accident is handled, the traffic operation returns to normal. This phenomenon conforms to the description of system failure in the reliability theory, that is, the failure of the system or component is uncertain and will cause the system to be interrupted. After repair or replacement, the system can resume normal operation. Therefore, the maintenance work area is highly correlated with the reliability system theory. With reference to reliability theory, the maintenance work area can be regarded as a system composed of these six control areas, including the warning area.
The evaluation model takes into account the length of the work area, traffic flow, traffic composition, and traffic organization methods commonly used in mountainous expressways. The research results show that: First, there is a significant relationship between the proportion of trucks and the number of traffic conflicts. When the proportion of trucks increases, and the number of traffic conflicts increases. There is a need to focus on the traffic diversion modes of large trucks. Second, under the three traffic organization modes, the length of the work area does not have a significant impact on the number of traffic conflicts. Therefore, the length of the work area can be appropriately extended to improve the efficiency of maintenance operations. Third, the number of traffic conflicts showed an upward trend with the increase in traffic volume. When the traffic volume exceeds a certain value, the traffic organization method needs to be adjusted in time, and methods such as forced diversion should be adopted. Fourth, different forms of traffic organization and traffic conflicts also have significant effects. The number of collisions in the compressed lane scene had the least effect, and the number of traffic collisions in the opposite lane scene had the greatest effect. The reliability-based assessment model provides a new and firm plan for the traffic organization and safety risk assessment of mountain expressway maintenance operations.
The reliability-based assessment model provides a new solution for the traffic organization and safety risk assessment of mountain expressway maintenance operations.
4. Conclusions
This study determined the influence of various working conditions on traffic safety in the maintenance area of a mountain expressway. The main conclusions are summarised as follows.
The length of the work area had no significant influence on the number of traffic conflicts, and the proportion of freight cars to traffic conflicts was close to linear. According to the Pearson correlation test, there was a significant relation between freight car proportion and traffic conflict number, and the two were positively correlated. The number of traffic conflicts increased with an increase in traffic volume. In the closed lane and borrowing opposite lane scenarios, the increase in traffic conflicts was more obvious with an increase in traffic volume. According to the Pearson correlation test, there was a significant relationship between traffic volume and the number of traffic conflicts. Moreover, there were obvious differences in the number of traffic conflicts under different forms of traffic organization. The number of conflicts in the compressed lane scenario was the lowest, the number of conflicts in the opposite lane scenario was the highest, and the number of conflicts in the closed lane scenario was in the middle. According to the Pearson correlation test, a decrease in the speed limit correlated with the number of traffic conflicts.
Taking traffic volume, truck proportion, and speed limit as independent variables and reliability as a dependent variable, reliability linear regression equations of three traffic organization scenarios, namely, closed lane, borrowing opposite lane, and compressed lane, were established, and the validity of the model was verified.
As the traffic volume increased, the reliability decreased, and the traffic volume had a great influence on reliability. In a certain range, the traffic volume increased by 100 veh/(ln·h)−1, and the reliability was at least 0.1. An increase in freight car proportion led to a decrease in reliability. The reliability increased with an increase in the speed limit between 40 km/h and 80 km/h. There were differences in the reliability of the maintenance operation area in different traffic organization modes.
These findings have theoretical significance for the application of a comprehensive operation risk assessment of maintenance areas based on reliability. Even so, more work needs to be completed in the future. Next, driver behaviour characteristics and different control methods should be studied according to different levels of traffic risk.


