Article

Water Quality Monitoring and Management of Building Water Tank Using Industrial Internet of Things

1
School of Electronics and Electrical Engineering, Lovely Professional University, Jalandhar 144411, India
2
Department of Computer Engineering, College of Computer and Information Technology, Taif University, P.O. Box 11099, Taif 21994, Saudi Arabia
3
Department of Computer Engineering, Faculty of Science and Technology, Vishwakarma University, Pune 411048, India
4
School of Electronics and Communication Engineering, University of Petroleum and Energy Studies, Dehradun 248001, India
5
Department of Information Technology, College of Computer and Information Technology, Taif University, P.O. Box 11099, Taif 21944, Saudi Arabia
*
Author to whom correspondence should be addressed.
Sustainability 2021, 13(15), 8452; https://doi.org/10.3390/su13158452
Submission received: 25 June 2021 / Revised: 17 July 2021 / Accepted: 19 July 2021 / Published: 28 July 2021
(This article belongs to the Special Issue Industrial Internet of Things (IIoTs) and Industry 4.0)

Abstract

:
Water being one of the foremost needs for human survival, conservation, and management of the resource must be given ultimate significance. Water demand has increased tremendously all over the world from the past decade due to urbanization, climatic change, and ineffective management of water. The advancement in sensor and wireless communication technology encourages implementing the IoT in a wide range. In this study, an IoT-based architecture is proposed and implemented for monitoring the level and quality of water in a domestic water tank with customized hardware based on 2.4 GHz radiofrequency (RF) communication. Moreover, the ESP 8266 Wi-Fi module-based upper tank monitoring of the proposed architecture encourages provide real-time information about the tank through internet protocol (IP). The customized hardware is designed and evaluated in the Proteus simulation environment. The calibration of the pH sensor and ultrasonic value is carried out for setting the actual value in the prototype for obtaining the error-free value. The customized hardware that is developed for monitoring the level and quality of water is implemented. The real-time visualization and monitoring of the water tank are realized with the cloud-enabled Virtuino app.

1. Introduction

According to a World Bank report, at present many countries are imposing unprecedented demand on their water resources. As the world’s population is rapidly increasing, and projections predict that, if current practices continue, then the globe would confront a 40% gap between expected demand and available water supply by 2030 [1]. Water management is crucial for utilizing the water resources rationally for the supply of water because by 2050 for feeding 9 billion people the agricultural production needs to be increased 60% over the present. Overall, 85% of freshwater is required for agricultural production by 2050 [2]. Another major issue related to water is water quality. At present, the rapid spread of industrialization is polluting the water with excessive pollutants releasing from the industries. The key reasons for water quality difficulties are the overutilization of natural resources. Moreover, in agriculture, the excessive utilization of pollutants and non-implementation of laws have led to water pollution to a large extent [3]. The problem is sometimes aggravated due to the non-uniform distribution of rainfall. Individual practices also play an important role in determining the quality of water. As the demand for environmental protection is increasing, the need to protect the water environment becomes an important factor [4]. Water scarcity unexpectedly is very common in India due to the lack of warning systems in the building tanks [5]. Systems with automatic meter systems have been developed without any human intervention to promote water management [6]. Depending upon the consumption of the water, the warning system is implemented for the water tanks [7].
The significance of retaining water quality shows the increasing necessity of advanced technologies for monitoring the water and manage the water quality [8,9]. The earlier methods require an individual to take samples of water and testing is performed done manually consume a lot of time and labor. At present, the advancement in technology has led to the development of automatic systems with global systems for mobile communication (GSM)/global packet for radio service (GPRS) technology using sensors [10,11]. However, the remote systems which are developed for water quality are having power constraints as the system is deployed in the outdoor environment where the separate infrastructure for powering the remote system is lacking [12]. Most of the remote systems are operated on battery power. The evolution of wireless sensor networks (WSN) has minimized the power consumption, as the system communicates the data regarding the sensors during the prescribed time interval [13]. Moreover, the widespread internet utilization in the global world led to the establishment of real-time monitoring technology, i.e., internet of things (IoT) [14]. IoT connects all the physical things over the virtual world through the internet and it assists to implement real-time monitoring of the water quality from any remote location [15].
In the previous studies, the system implemented for water quality and water tank management is done with IoT. However, the communication protocol namely global system for mobile communication (GSM), and wireless fidelity (Wi-Fi) that are implemented in previous studies for monitoring the water level and water quality consumes maximum power consumption during transmission. Additionally, there is a lack of a real-time system that simultaneously monitoring the level quality of water and also controls the water pump automatically with the same hardware prototype through wireless communication. To overcome the limitations, we have proposed IoT-enabled architecture and system for monitoring the water tank with customized hardware and cloud-enable Virtuino App. The main contribution of the study is as follows:
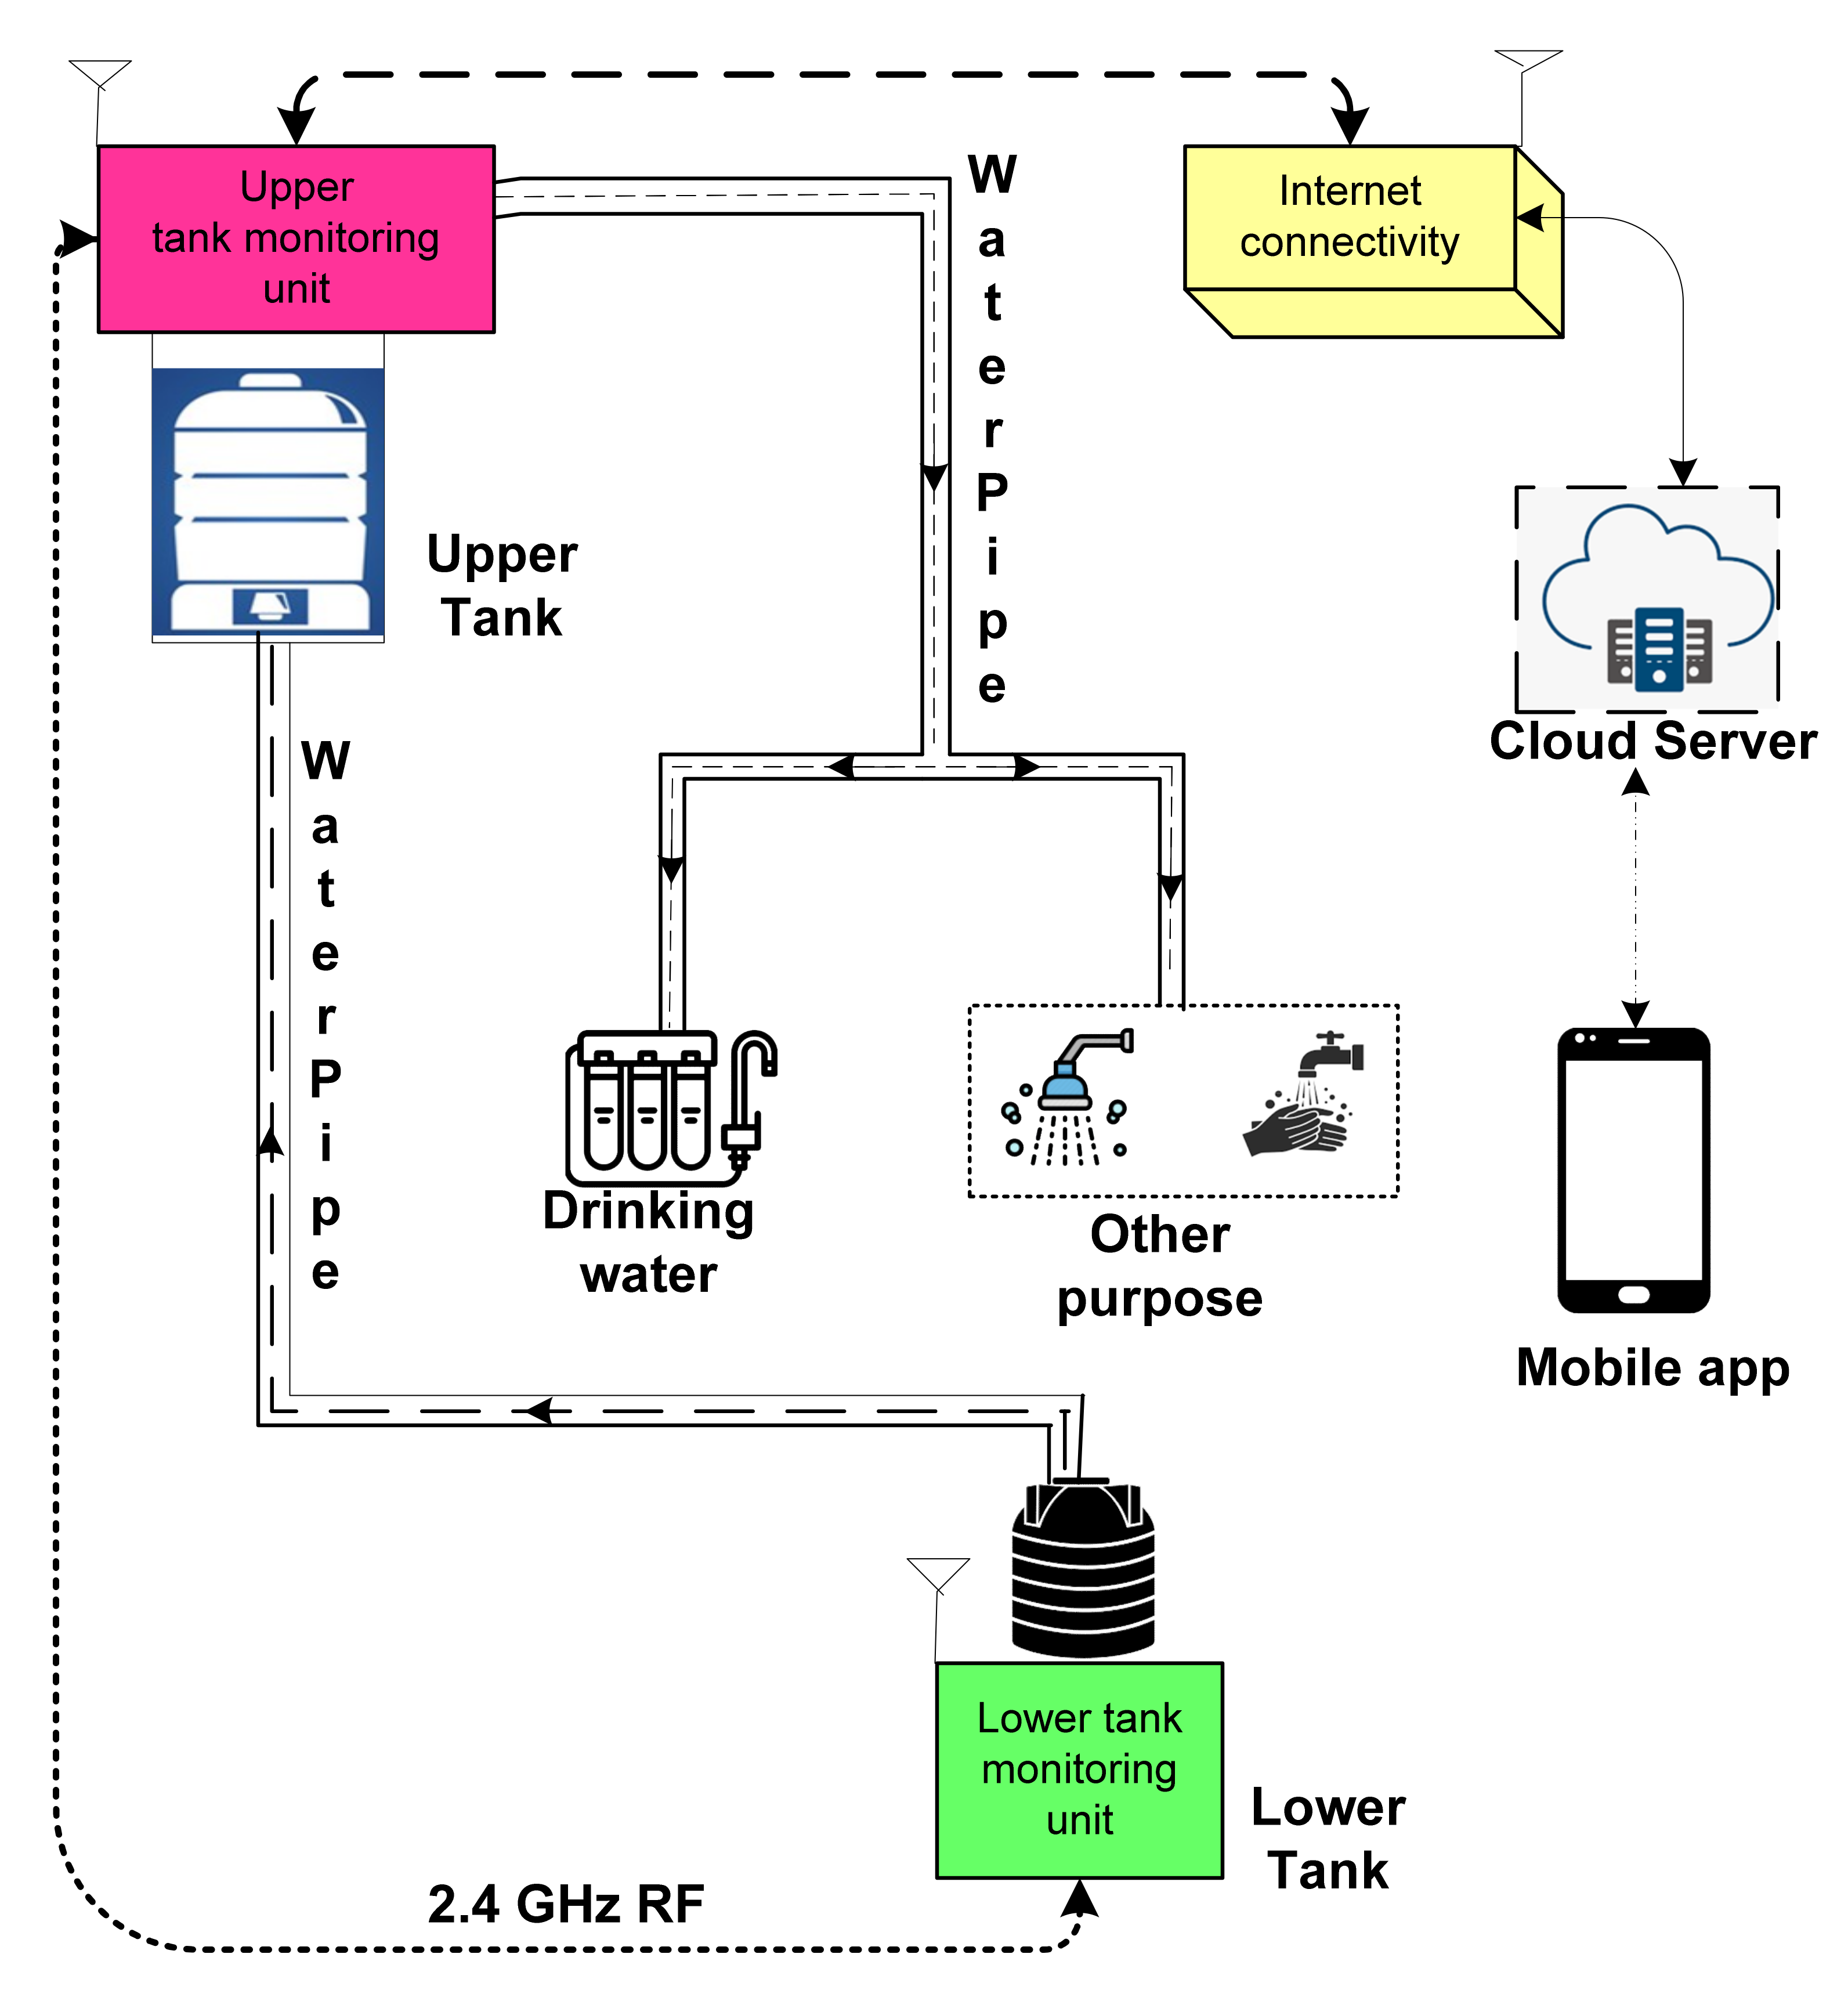
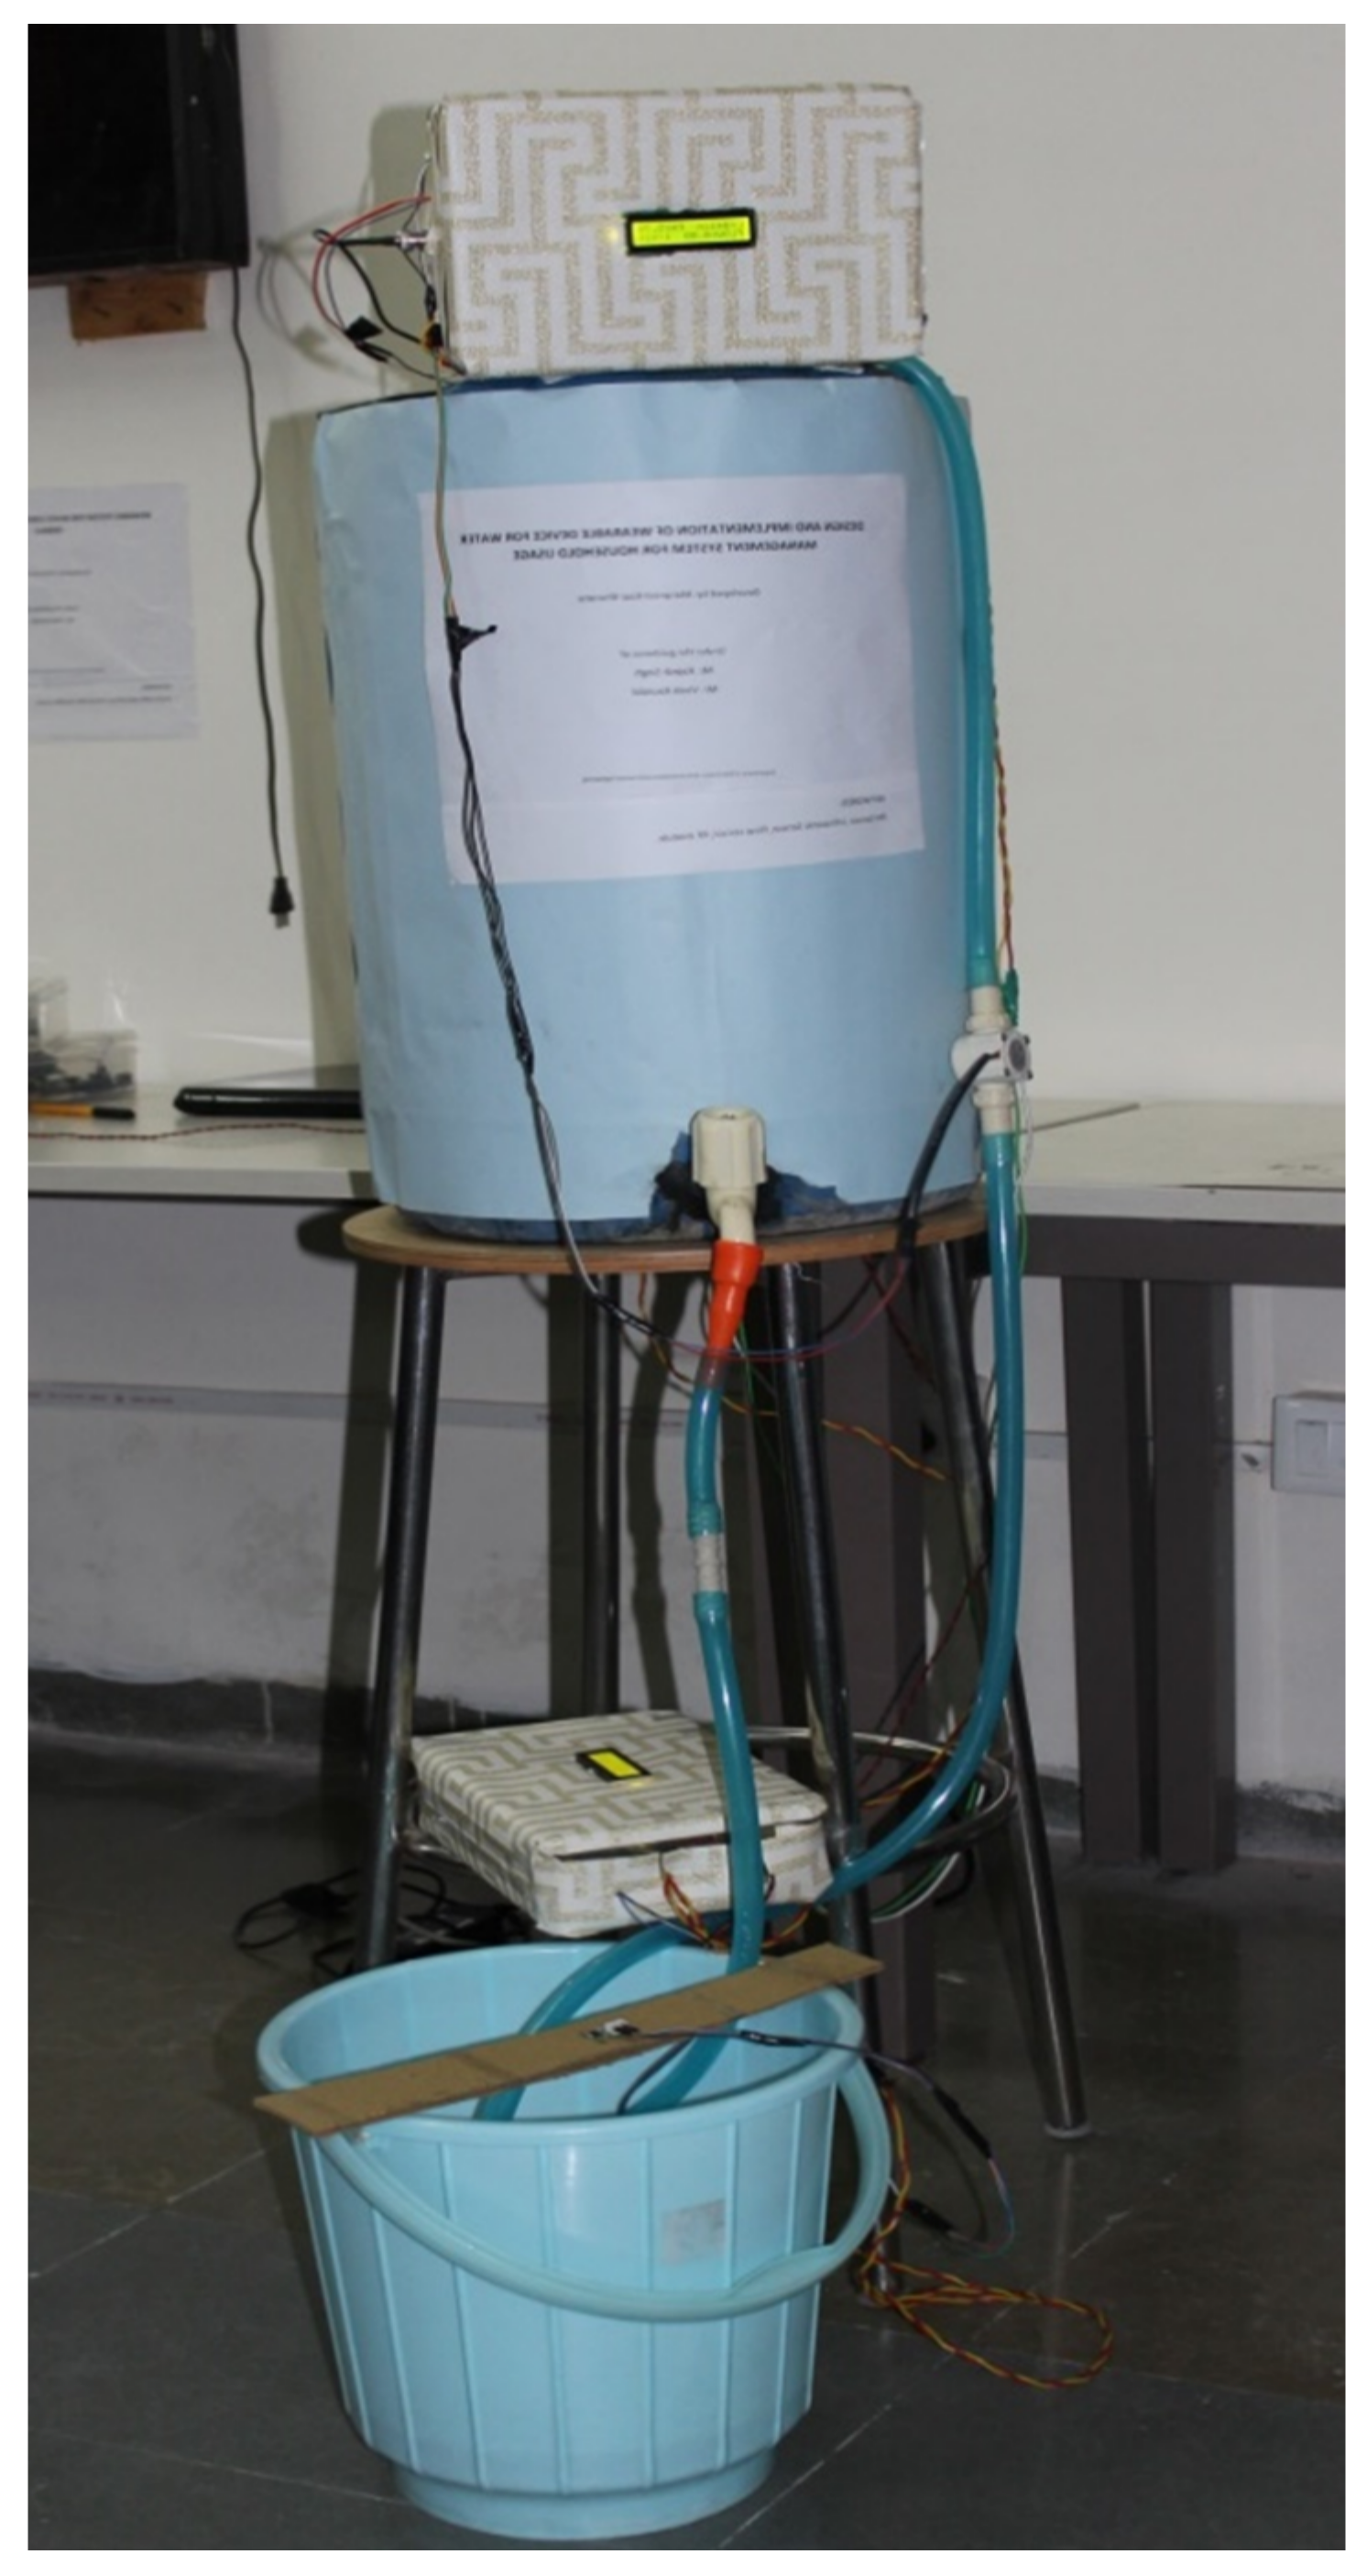
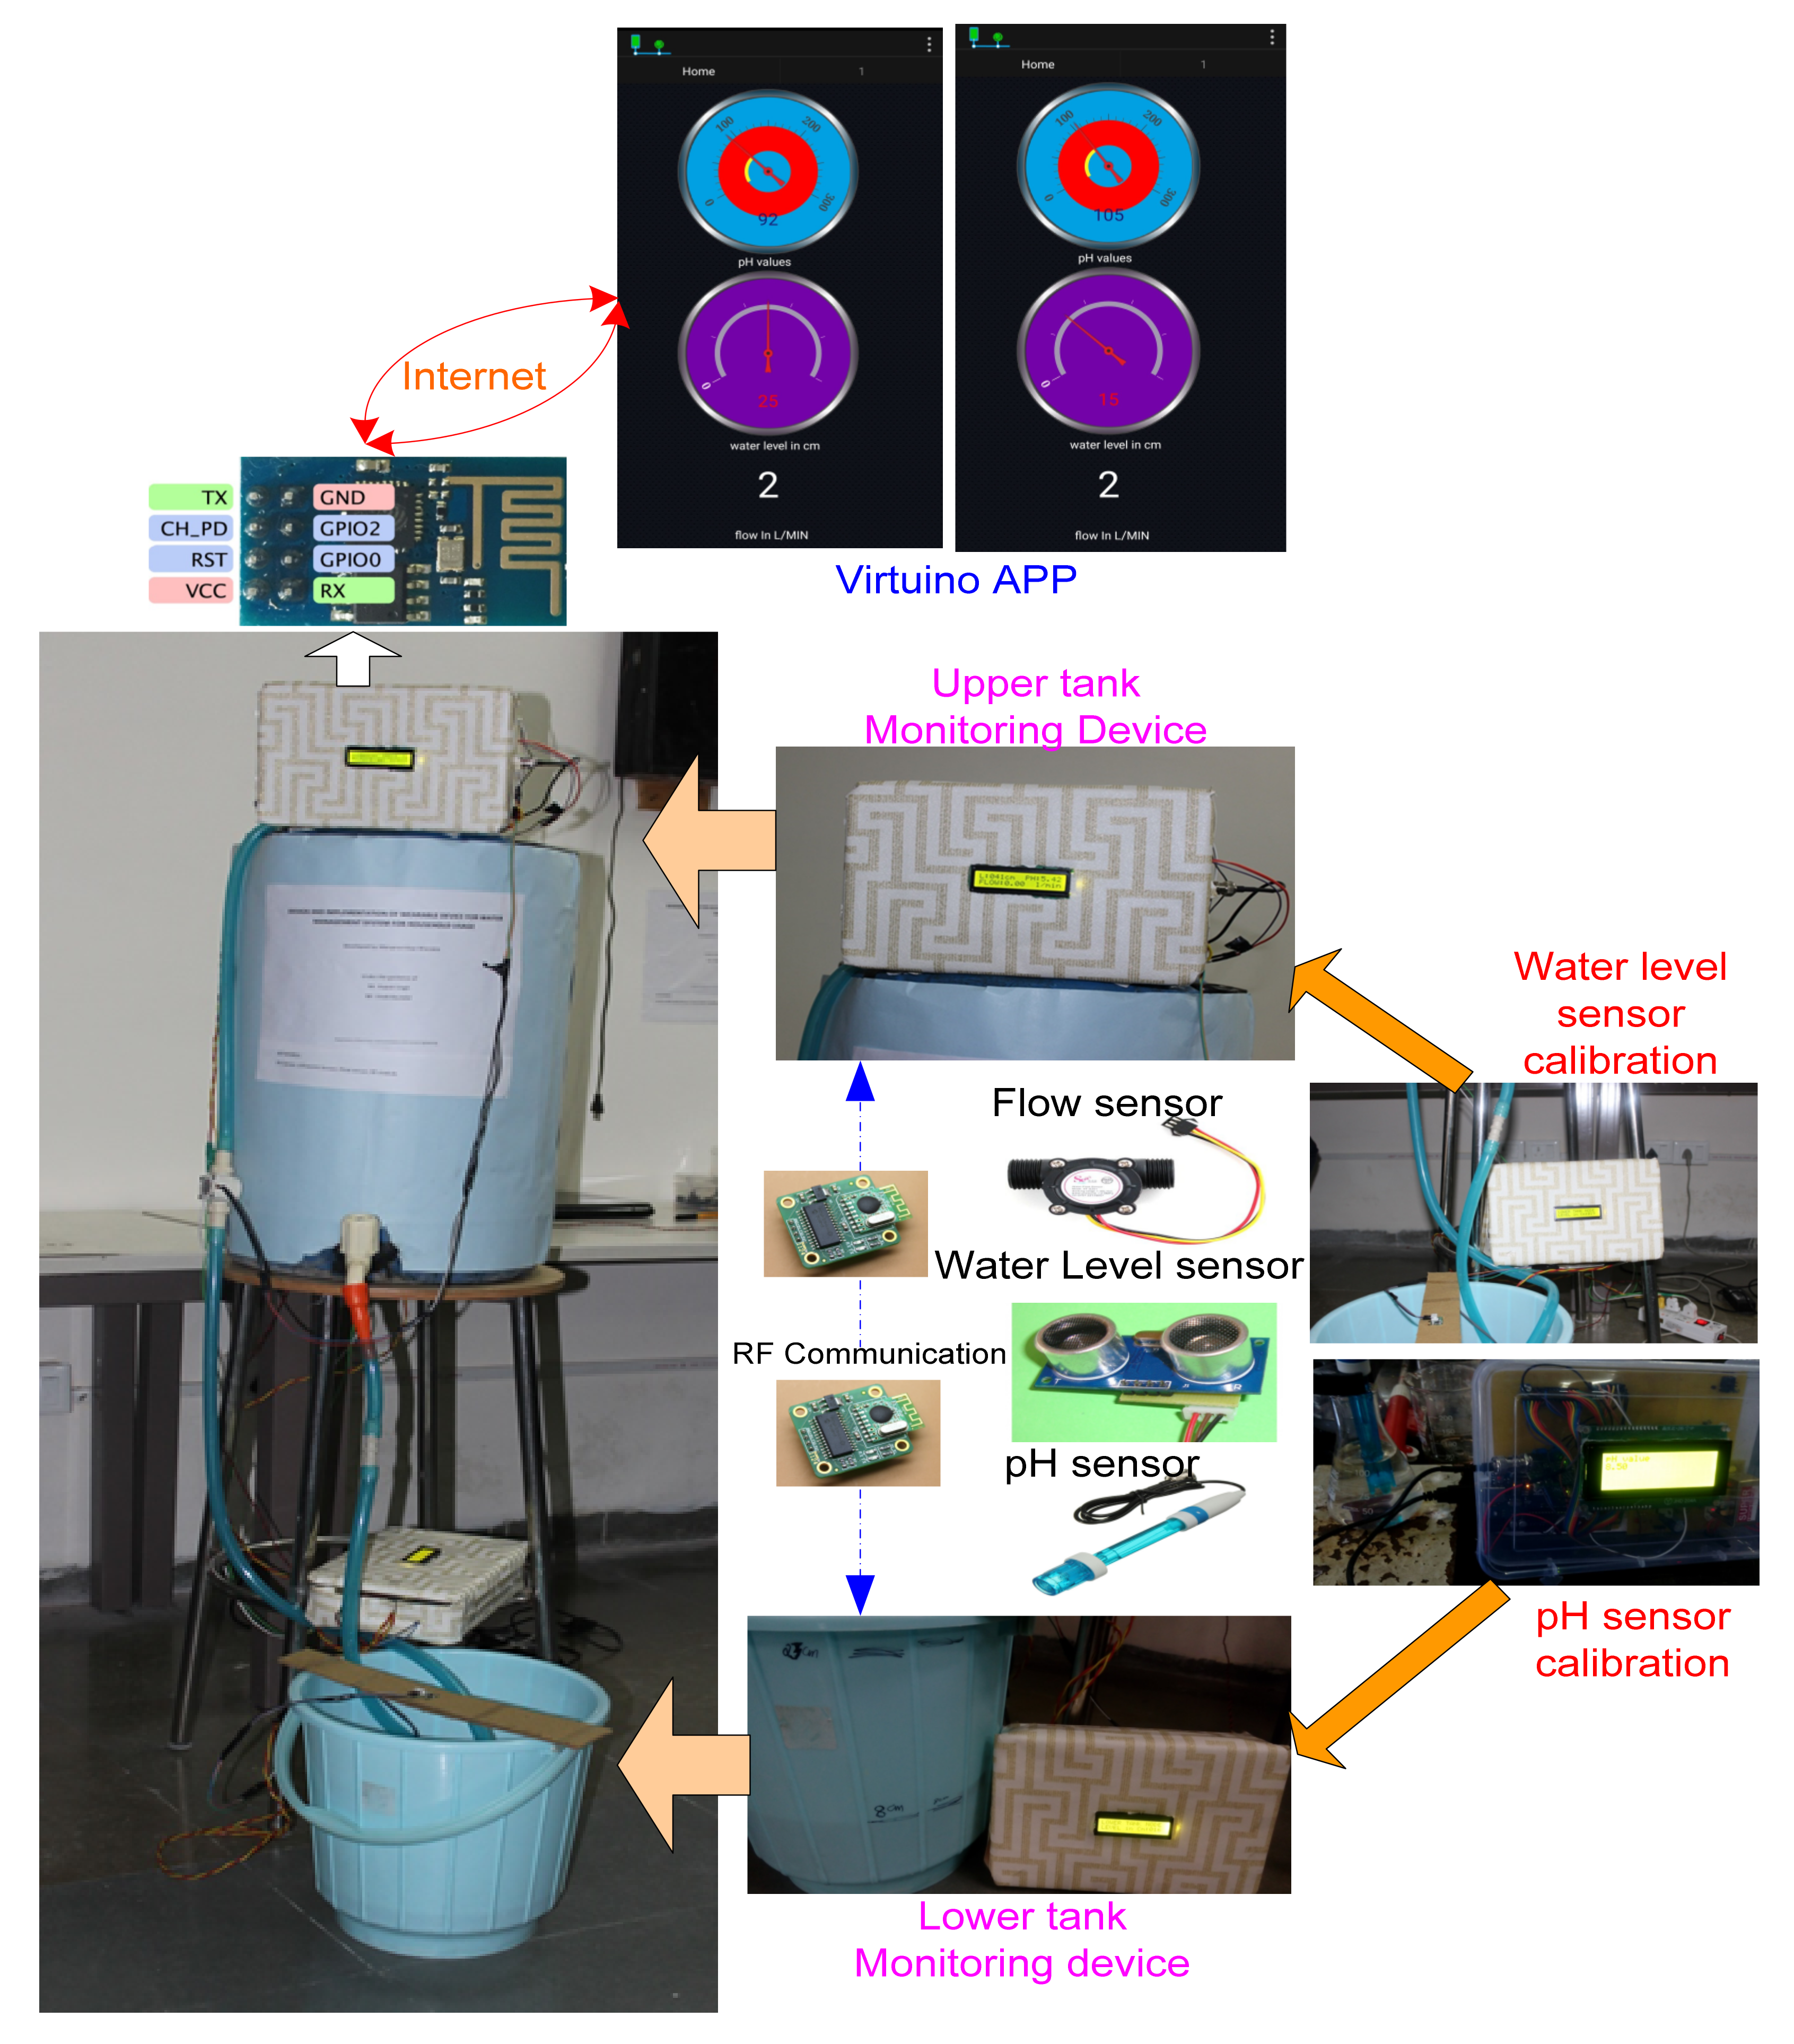
  • An IoT-enabled architecture is proposed and implemented for monitoring the level and quality of water in the domestic water tank with customized build hardware.
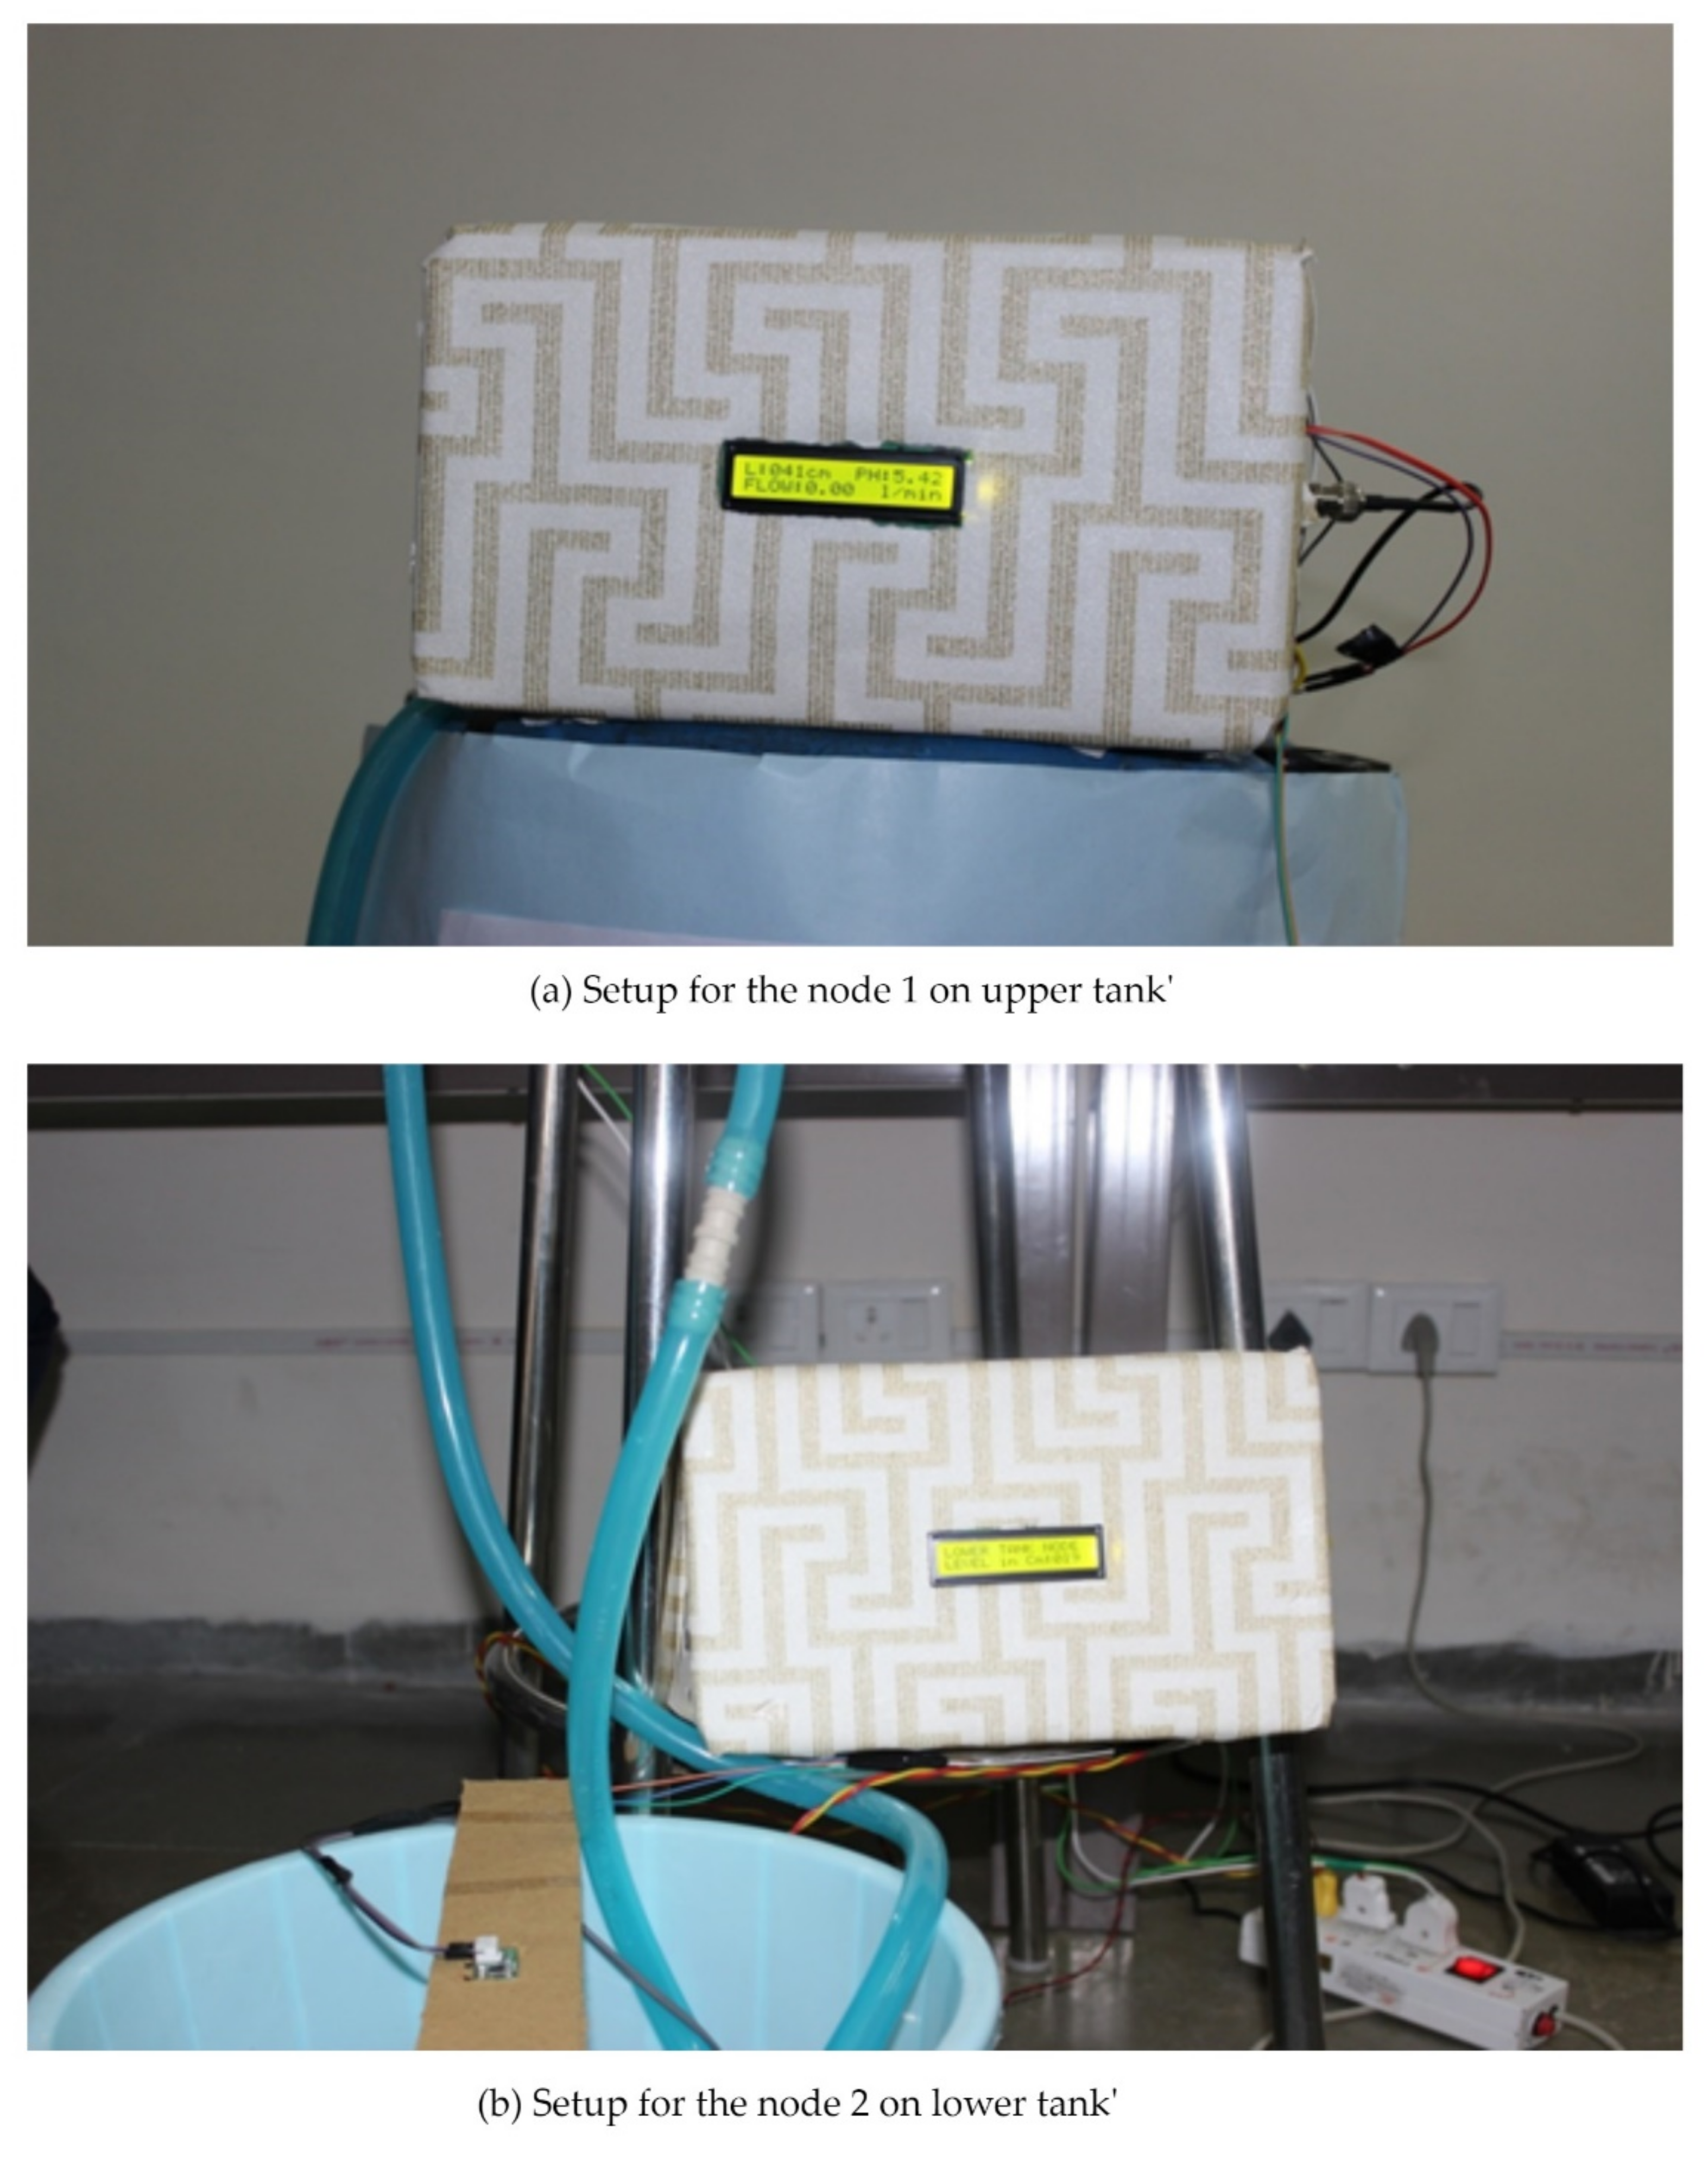
  • The customized hardware of the upper tank monitoring unit is built on a 2.4 GHz RF module to communicate with lower tank monitoring and an ESP 8266 Wi-Fi module for enabling to visualize and monitoring the status of the water tank through the internet.
  • Proteus simulation environment is utilized for designing the schematic of the customized hardware.
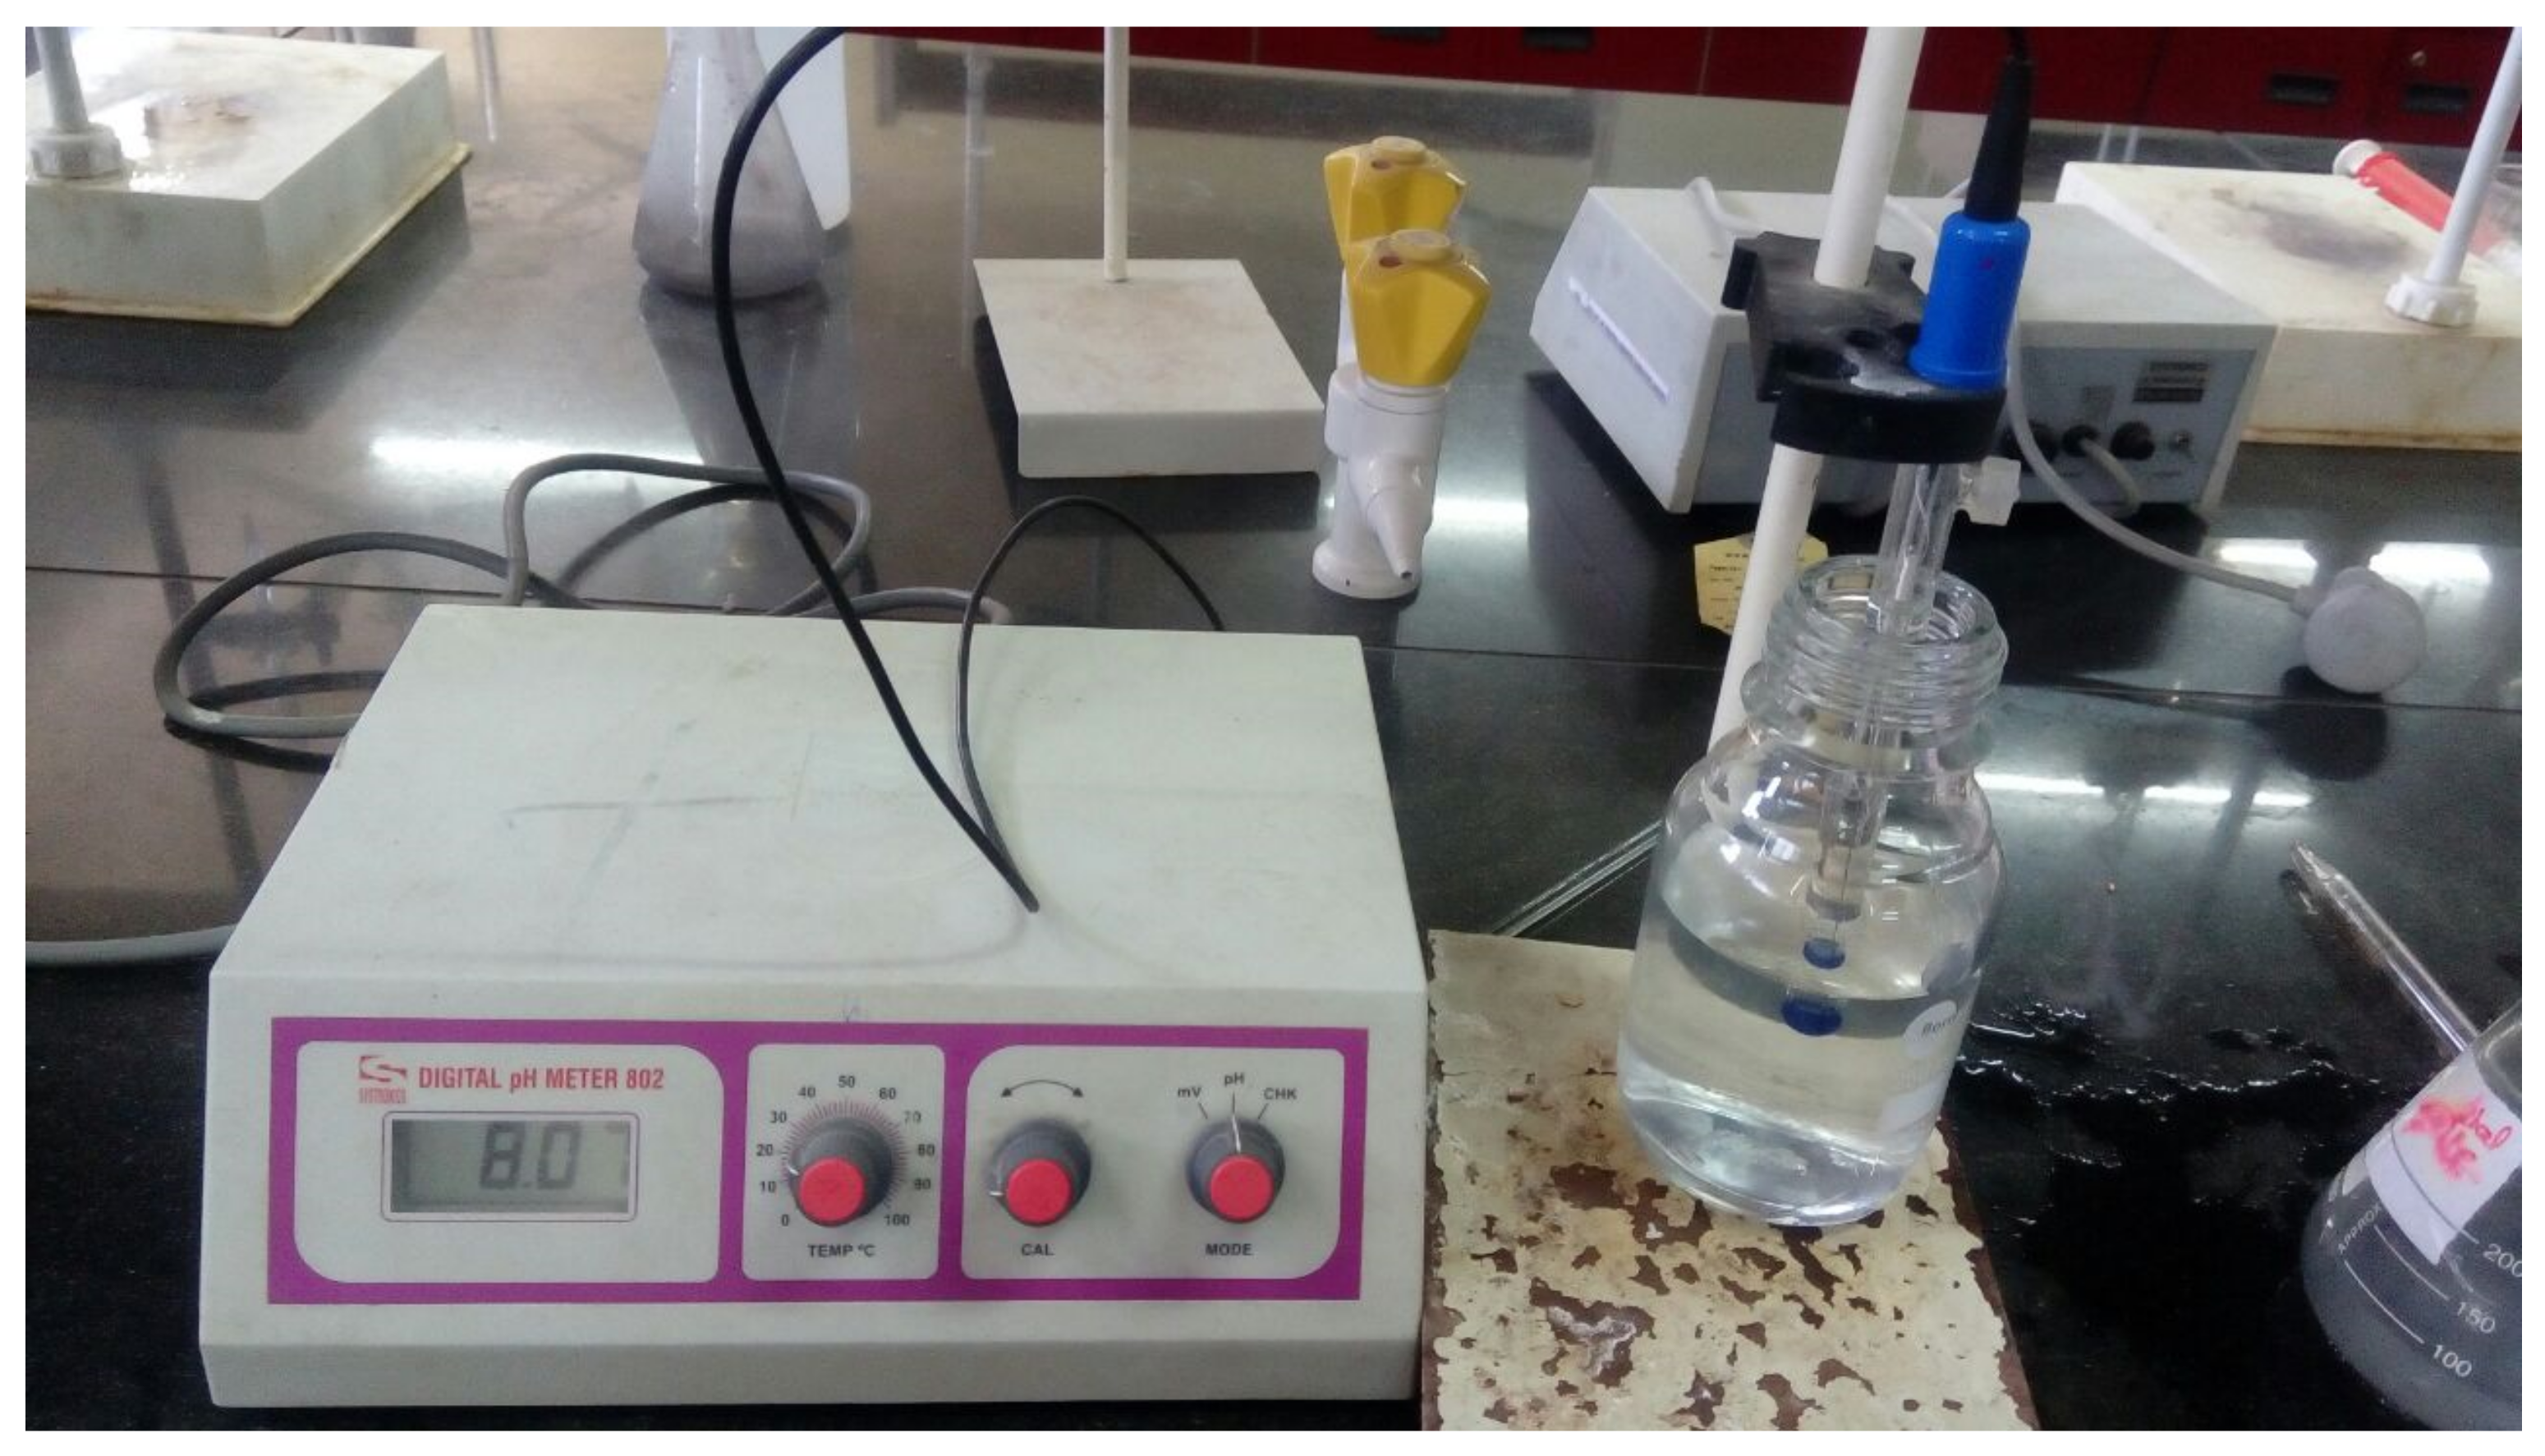
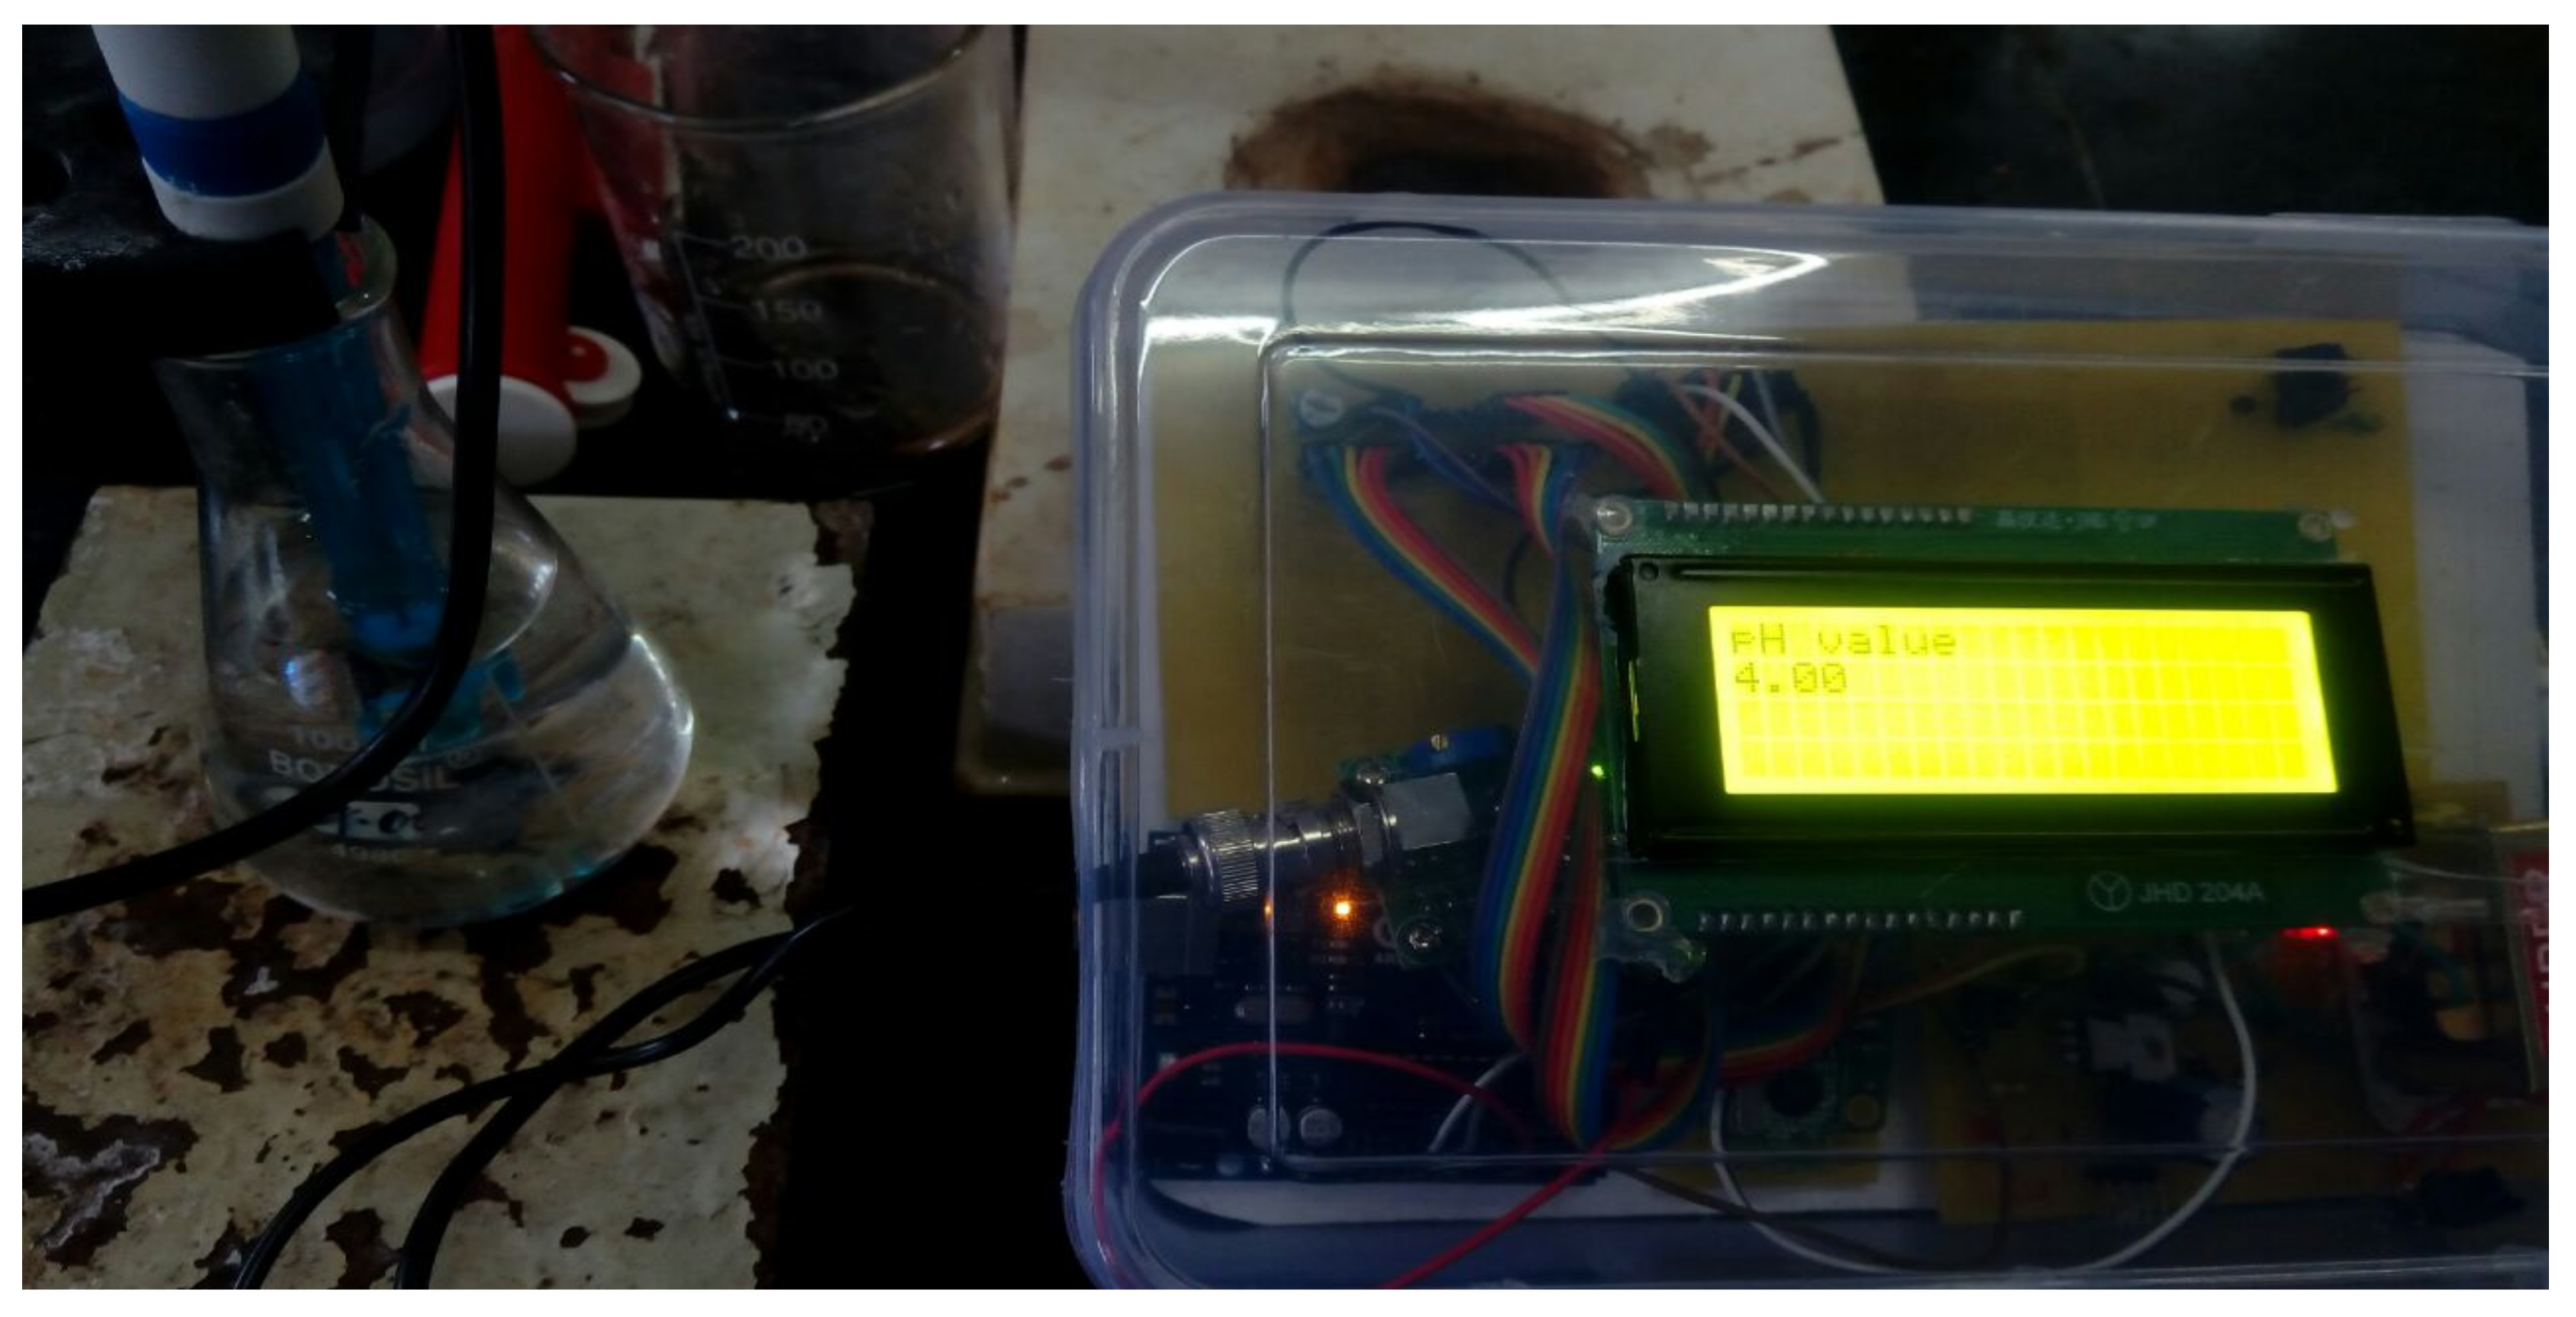
  • The calibration of the pH sensor and ultrasonic value is conducted for presetting the actual value in the hardware prototype for obtaining the error-free value during real-time implementation.
  • Cloud server enabled Virtuino app is employed for visualizing and monitoring the status of the domestic water tank.
The structure of the paper is organized as follows: Section 2 covers the literature review. Section 3 covers the proposed architecture and Section 4 covers the hardware description including schematic design. Section 5 covers the working diagram and simulation and Section 6 covers the experimental setup and results. Section 7 covers the conclusions and Section 8 presents the future scope and challenges.

2. Review of Literature

In this section, we present the previous studies that have implemented water monitoring and quality system using different methods. In a study, an algorithm is proposed for monitoring the water quality using temperature, soil moisture sensors, and the system is powered on solar power [16]. A system is proposed for evaluating the significant role of non-point sources and in the study, the contribution of nutrients and containments are evaluated [17]. A wireless aquatic environment surveillance system is presented with sensor nodes for monitoring the pH, dissolved oxygen, conductivity, and temperature [6]. A wireless monitoring system is proposed with Zigbee technology for minimizing the costs as well as flexibility and this system transmits the information related to water to the user [18]. An automatic system is proposed for realizing the automatic monitoring of artificial lake water and this system utilizes temperature, pH sensors for monitoring the water quality [19]. In this study, the significance of implementing Zigbee protocol for wireless monitoring of irrigation and Zigbee consumes low power during the transmission of the data through wireless mode [20,21]. A wireless surveillance communication model is proposed for monitoring the water distribution and this communication model utilizes flat earth double-ray model for validation [22]. A Smart Coast Multi-Sensor System is developed for monitoring the quality of water by measuring the temperature, level of phosphate, and the amount of oxygen dissolved, conductivity, pH, turbidity, and water levels [23]. A framework is proposed for monitoring water in a real-time environment with IoT and to monitor the water quality in real-time mode, Wi-Fi mode is integrated with a pH sensor [24]. Moreover, at present, long-range communication is widely implemented in many applications, as it providing reliable and efficient communication with low power and long-range during the transmission of the data from the end devices to the server [25,26]. To monitor the water quality an innovative solution is implemented and during the implementation of water quality monitoring, the pH level sensor and DO sensor with global positioning system (GPS) are employed [27]. The system adopted effectively implements the long-range system of IoT water quality monitoring without data loss; the main focus of the system is on the use of devices such as pH, temperature, turbidity and conductance [28].
The reviewed papers show the existing work done by different people all around the world on water conservation and quality management. The articles showed that previous systems were wired, with time-consuming and difficult measurement of quality by hand. In businesses and farming sectors, automatic wiring systems for water usage were then deployed. Later techniques for informing users in residences of water level have been created. The cable networks have been transformed into wireless systems. A system was created using GSM to enable users to monitor the industry or the building anywhere. RF then arrived with new sensor nodes, using wireless technology such as ZigBee. The study carried out was a comprehensive water control system that monitors water level and water quality sensor data remotely and automates the engine and data retrieved on the server through Wi-Fi. A detailed comparison of the different studies is presented in Table 1.

3. Proposed Architecture

In this section, we propose an architecture for implementing the internet of things (IoT) enabled water management and water quality of water tanks. The proposed system includes two different components for monitoring the level of water in the lower tank and upper tank and also monitoring the quality of the water in the upper tank. The two components are the lower tank monitoring unit and the upper tank monitoring unit are shown in Figure 1. Generally, these components communicate through 2.4 GHz RF communication. The main function of the upper tank monitoring unit is to check the level of the water in the tank. In case if the amount of the water is less than the threshold level then it sends a request to the lower tank monitoring unit. Here the lower tank monitoring unit also checks the level of the water in the tank. If the water level is more than the threshold level in the lower tank, then it triggers the water pump of the lower tank to fill the upper tank. Moreover, the upper tank monitoring unit is integrated with a pH sensor to check the quality of water. All the information related to both the lower tank and upper tank is logged in the cloud server through the internet connectivity that is activated by the Wi-Fi module in the upper tank. The house owner can access, monitor, and control the activities of both water tanks through the cloud-based mobile app. Moreover, the flow sensor integrated with the upper tank assists the house owner regarding the amount of water is consumed.
(a) Upper tank monitoring unit:
Upper tank monitoring is integrated for sensing the water level and water quality in the upper tank and it is shown in Figure 2. To sense the water level and water quality, it consists of the following component namely: controller unit, pH sensor, water level sensor, flow sensor, 2.4 GHz RF module, Wi-Fi module, and power supply unit. The Controller unit is for processing the sensor data and activate other components integrated into it. The water level sensor is the primary sensor for monitoring the status of the tank in terms of water level. As discussed earlier, if the amount of water in the upper tank is below the threshold level, then it sends the instructions to switch on the water pump of the lower tank. Here 2.4 GHz RF module enables communication with the lower tank related to the trigger of the water pump. pH sensor checks the pH level in the water tank and the flow sensor is for sensing the inlet and outlet of the water. ESP 8266 Wi-Fi module enables the upper tank monitoring unit to communicate the information related to the upper and lower tank to the cloud server.
(b) Lower tank monitoring unit:
Lower tank monitoring is integrated for sensing the water level and water quality in the upper tank and it is shown in Figure 3. It consists of the following components, namely: controller unit, water level sensor, 2.4 GHz RF module, relay, water pump, and power supply unit. The controller unit is for processing the sensor data and activate other components integrated into it. The 2.4 GHz RF module enables to receive the information from the upper tank monitoring unit namely to switch on the water pump for filling the upper tank. The relay is connected to this unit for controlling the water pump.

4. Hardware Description

In this section, we discuss the circuit schematic design of the upper tank monitoring unit and lower tank monitoring unit. Moreover, we present the description of the hardware utilized for developing both monitoring units. It should provide a concise and precise description of the experimental results, their interpretation, as well as the experimental conclusions that can be drawn.

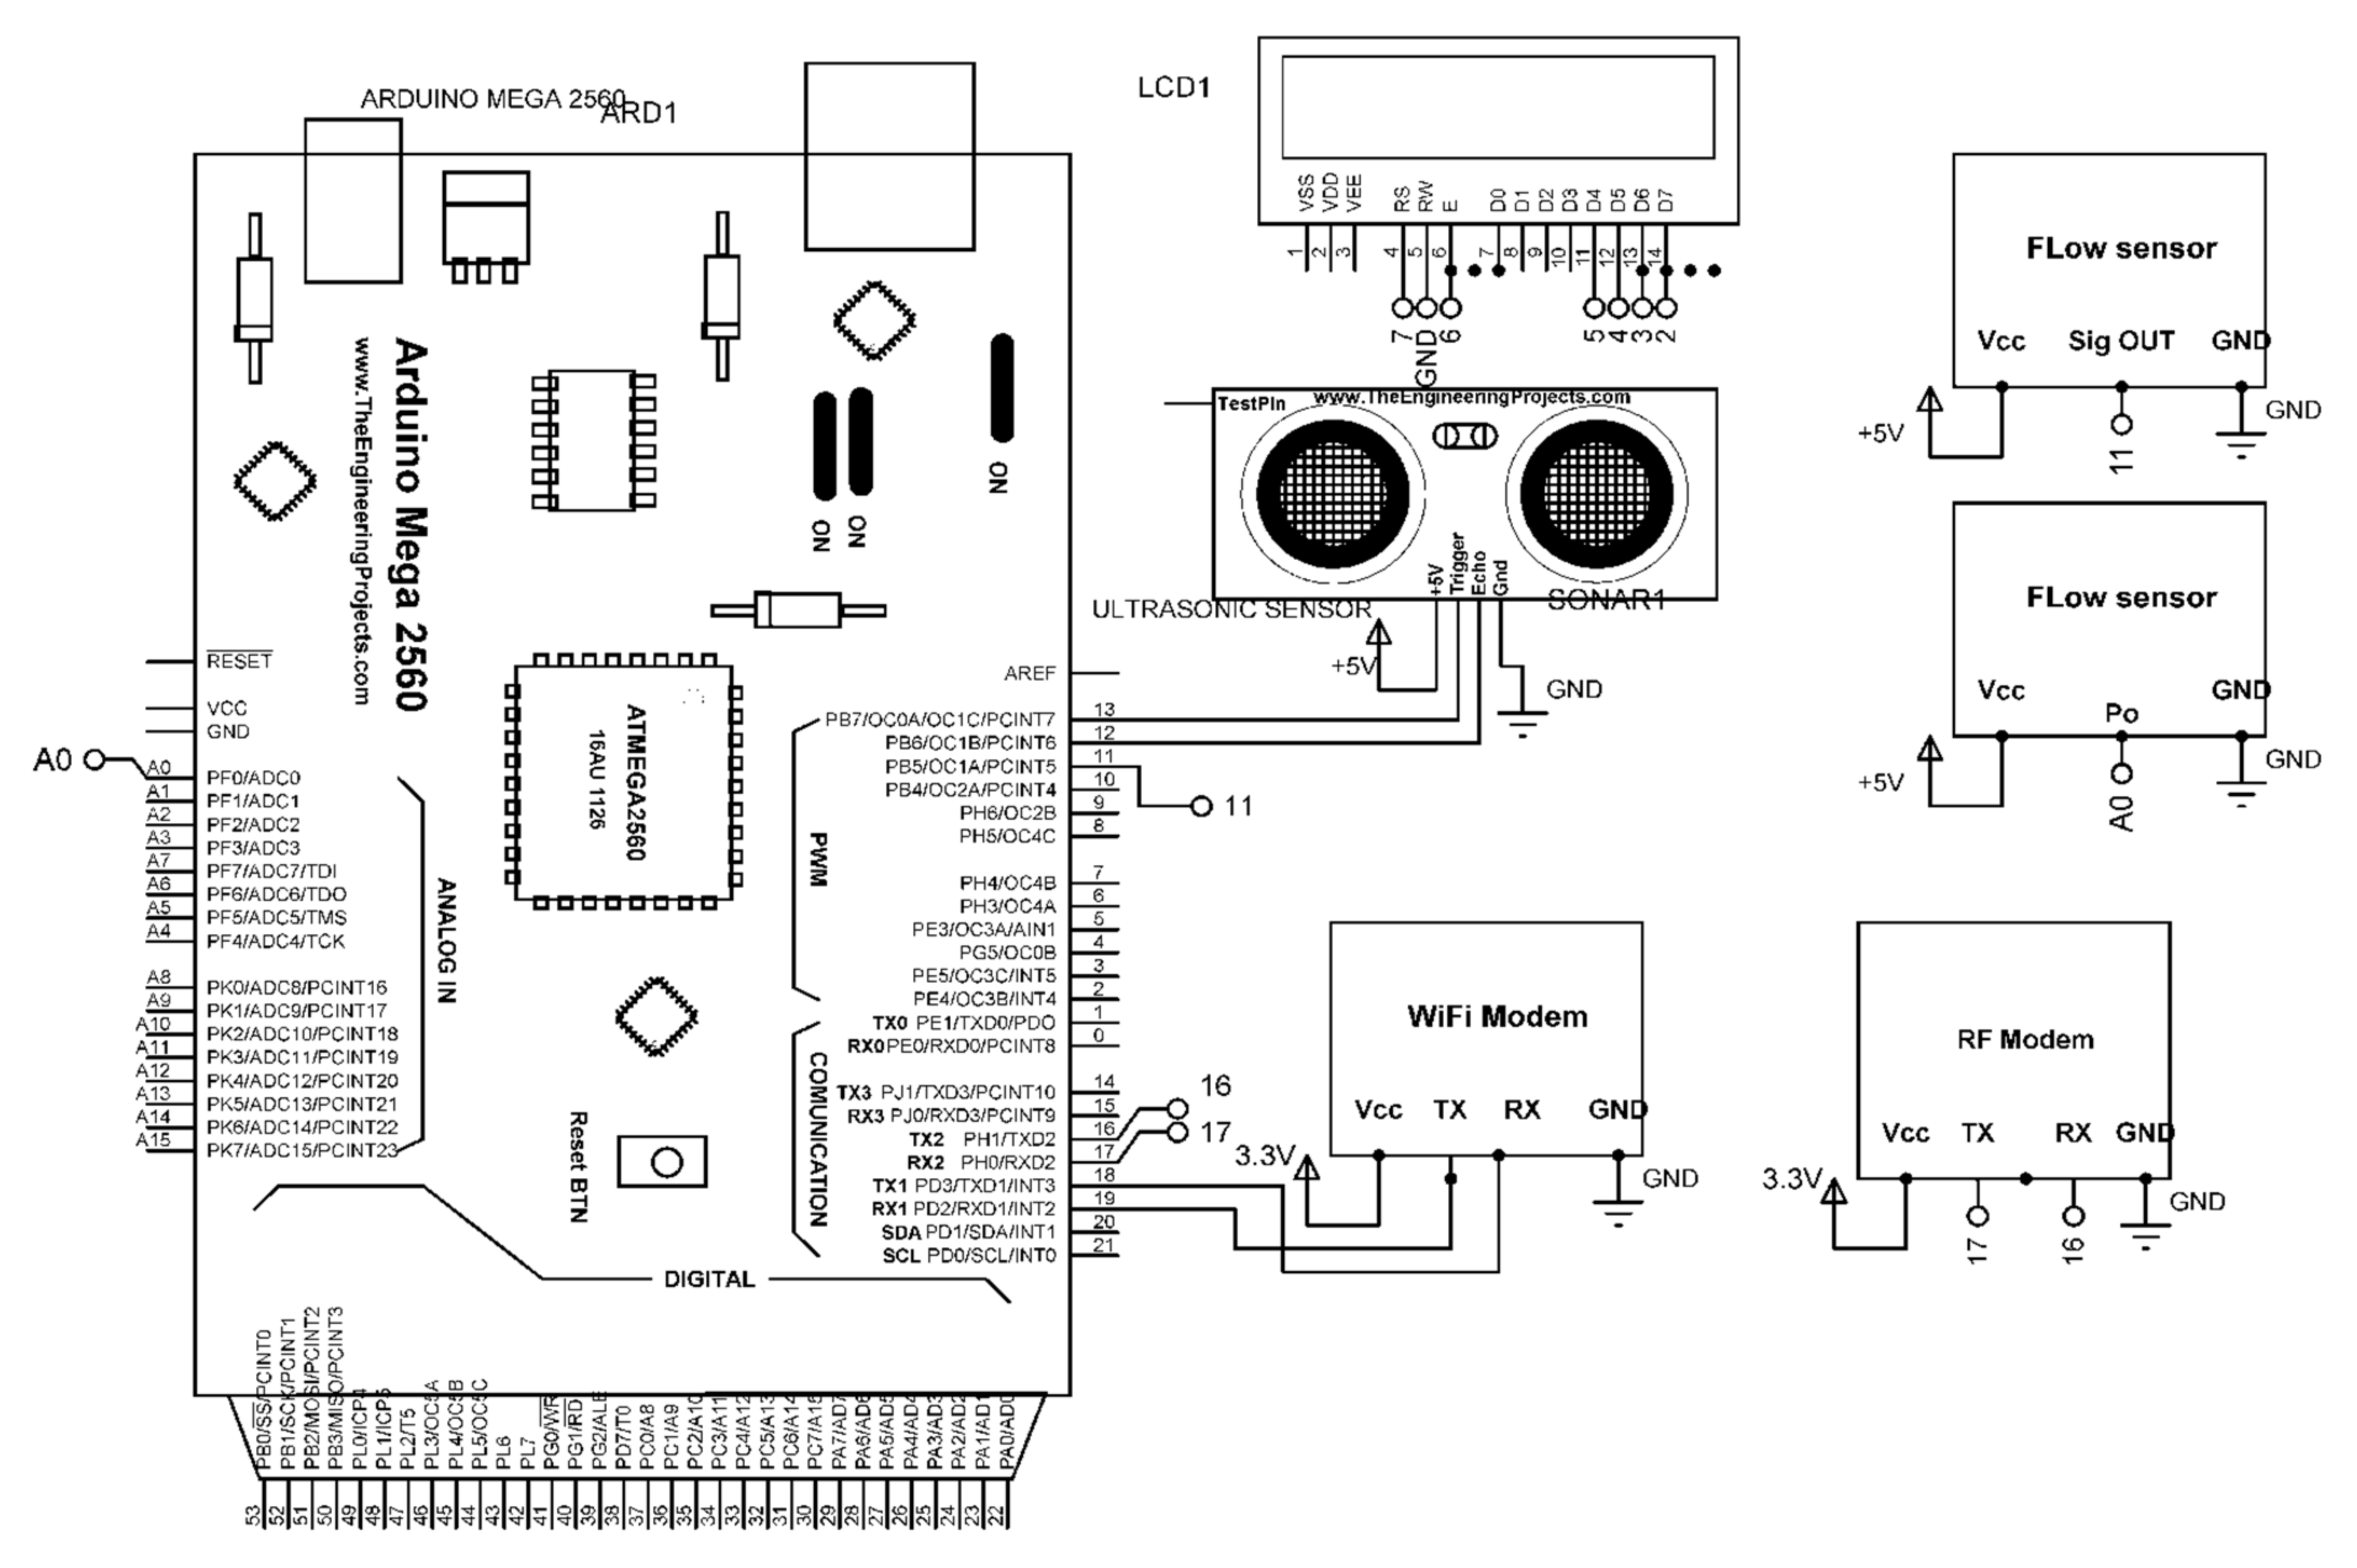
4.1. Circuit Schematic of the System

In section, the schematic circuit design of the lower tank and upper tank are presented. Here we represent the upper tank monitoring unit as node 1 transmitter and the lower tank monitoring unit as node 2 transmitter unit. Moreover the Nomenclature and pin configuration of circuit are illustrated in Table 5.

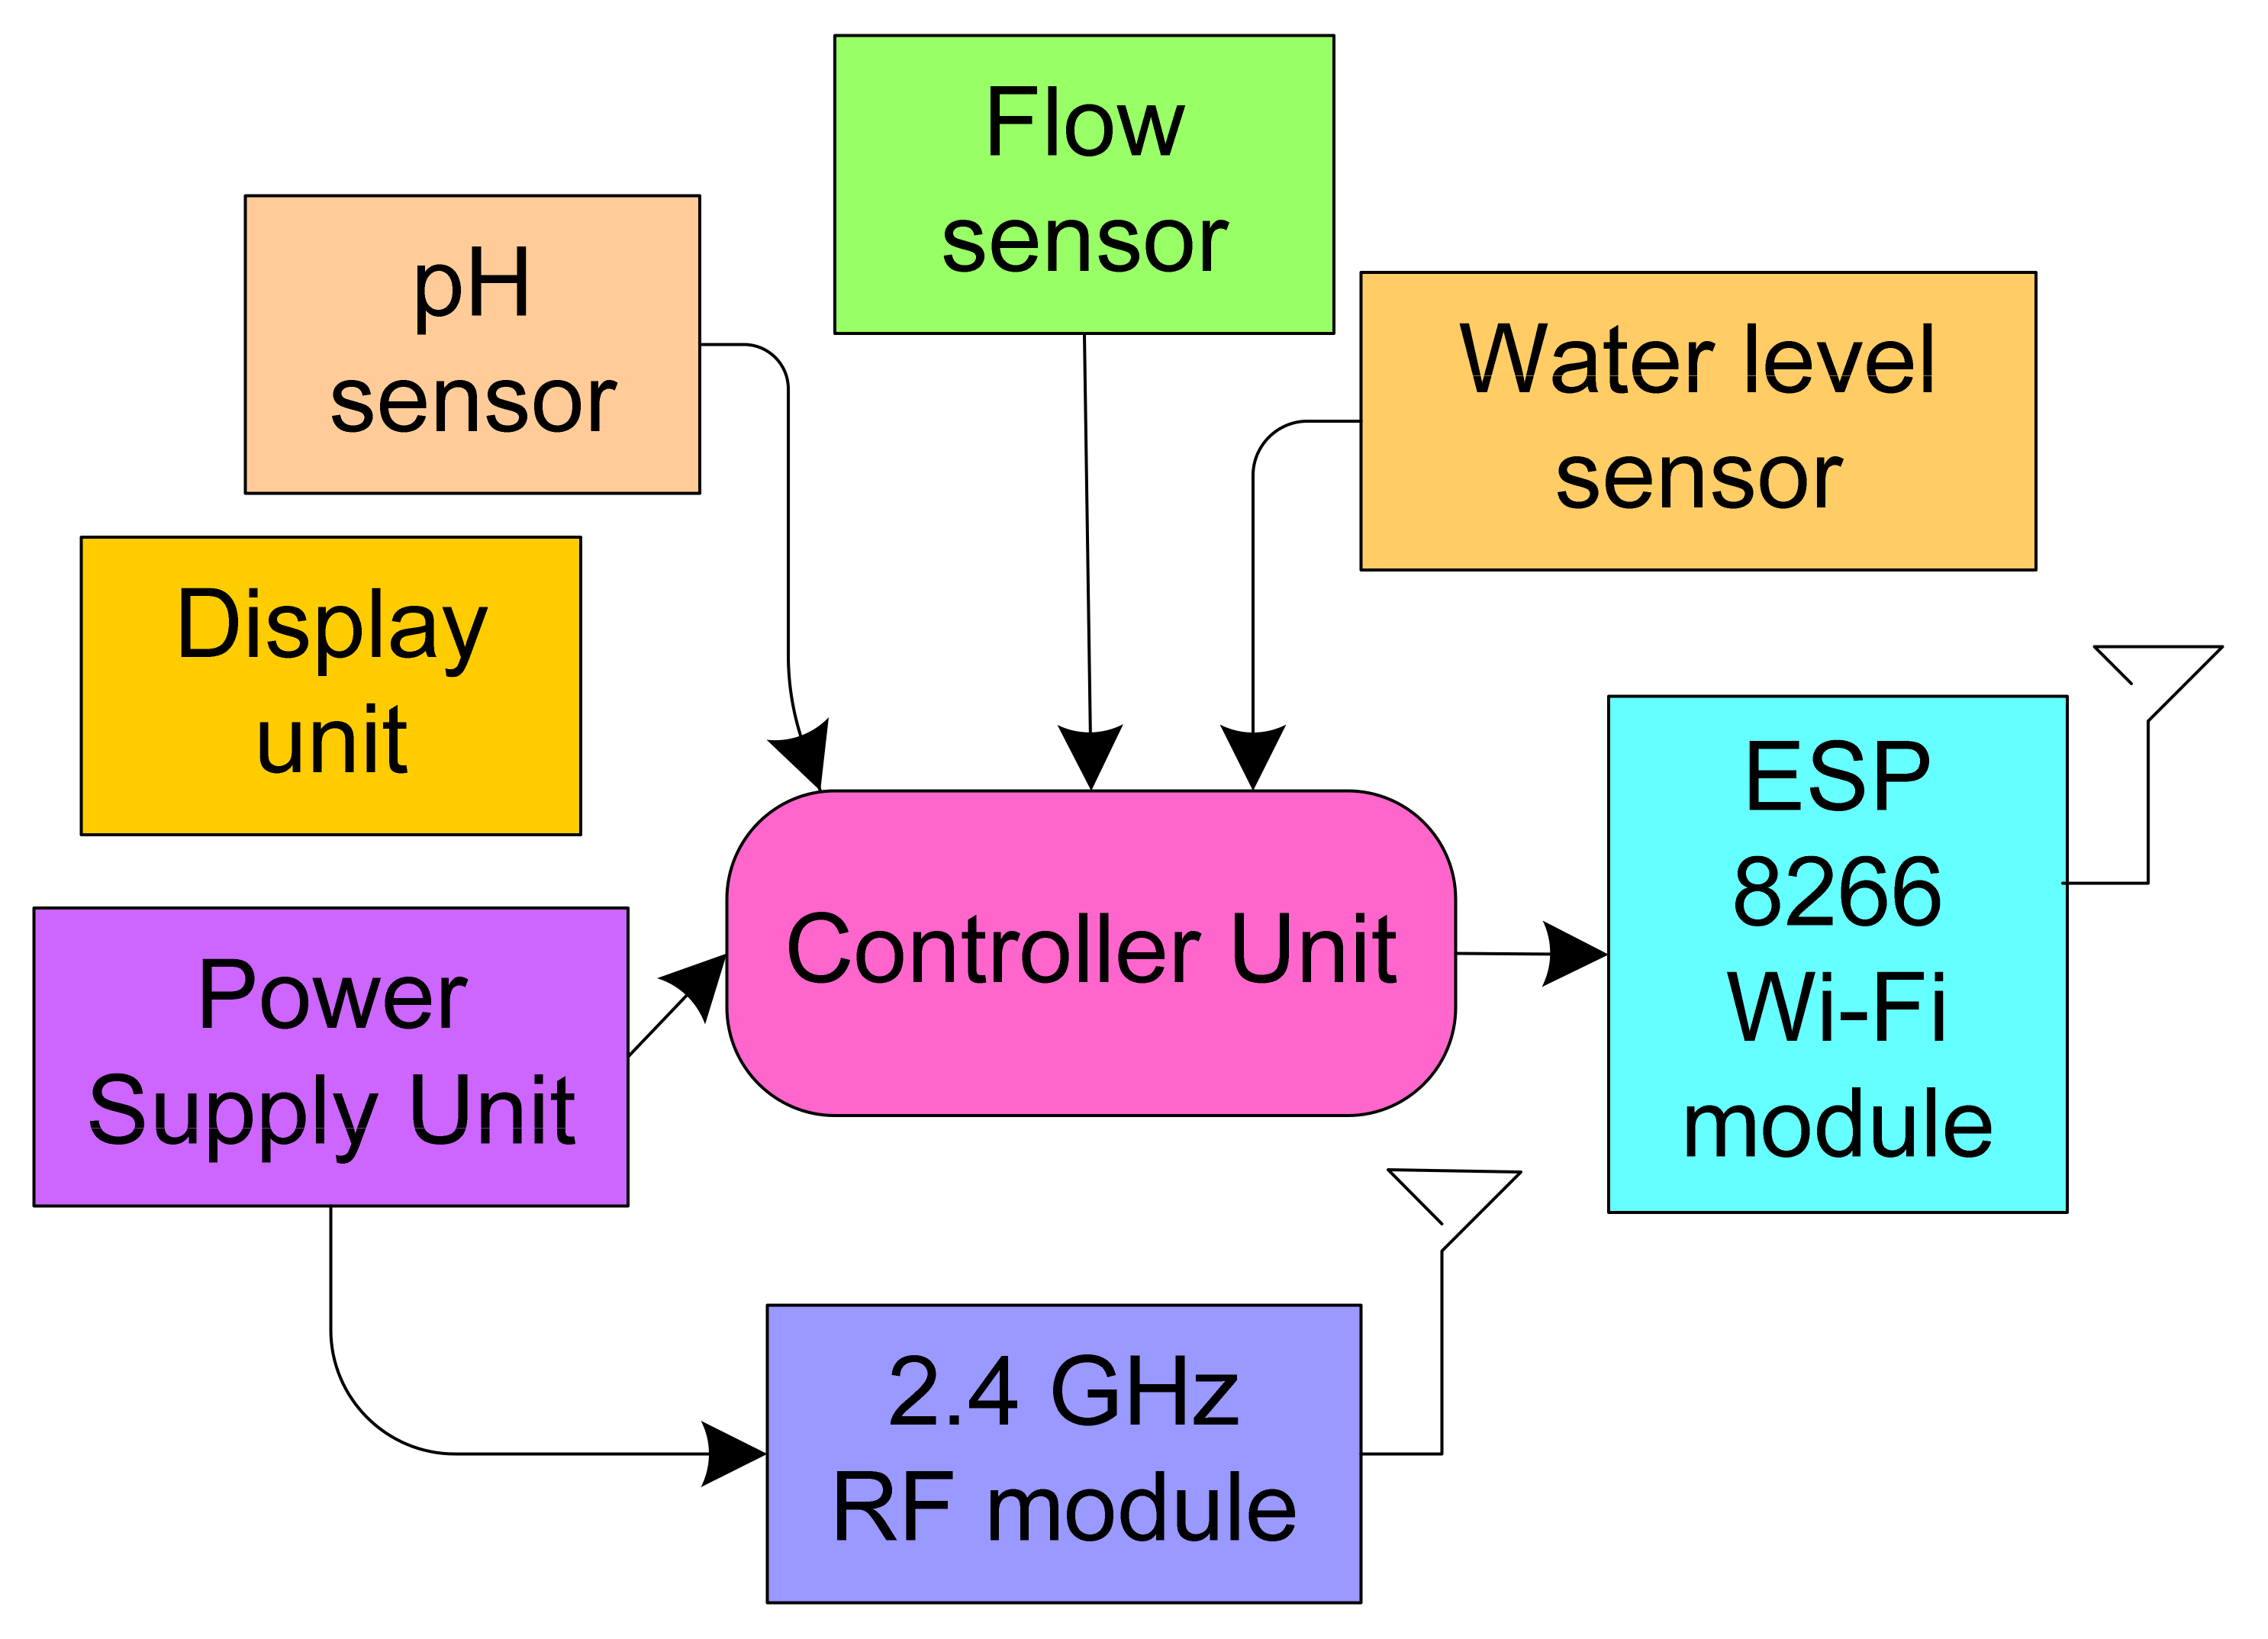
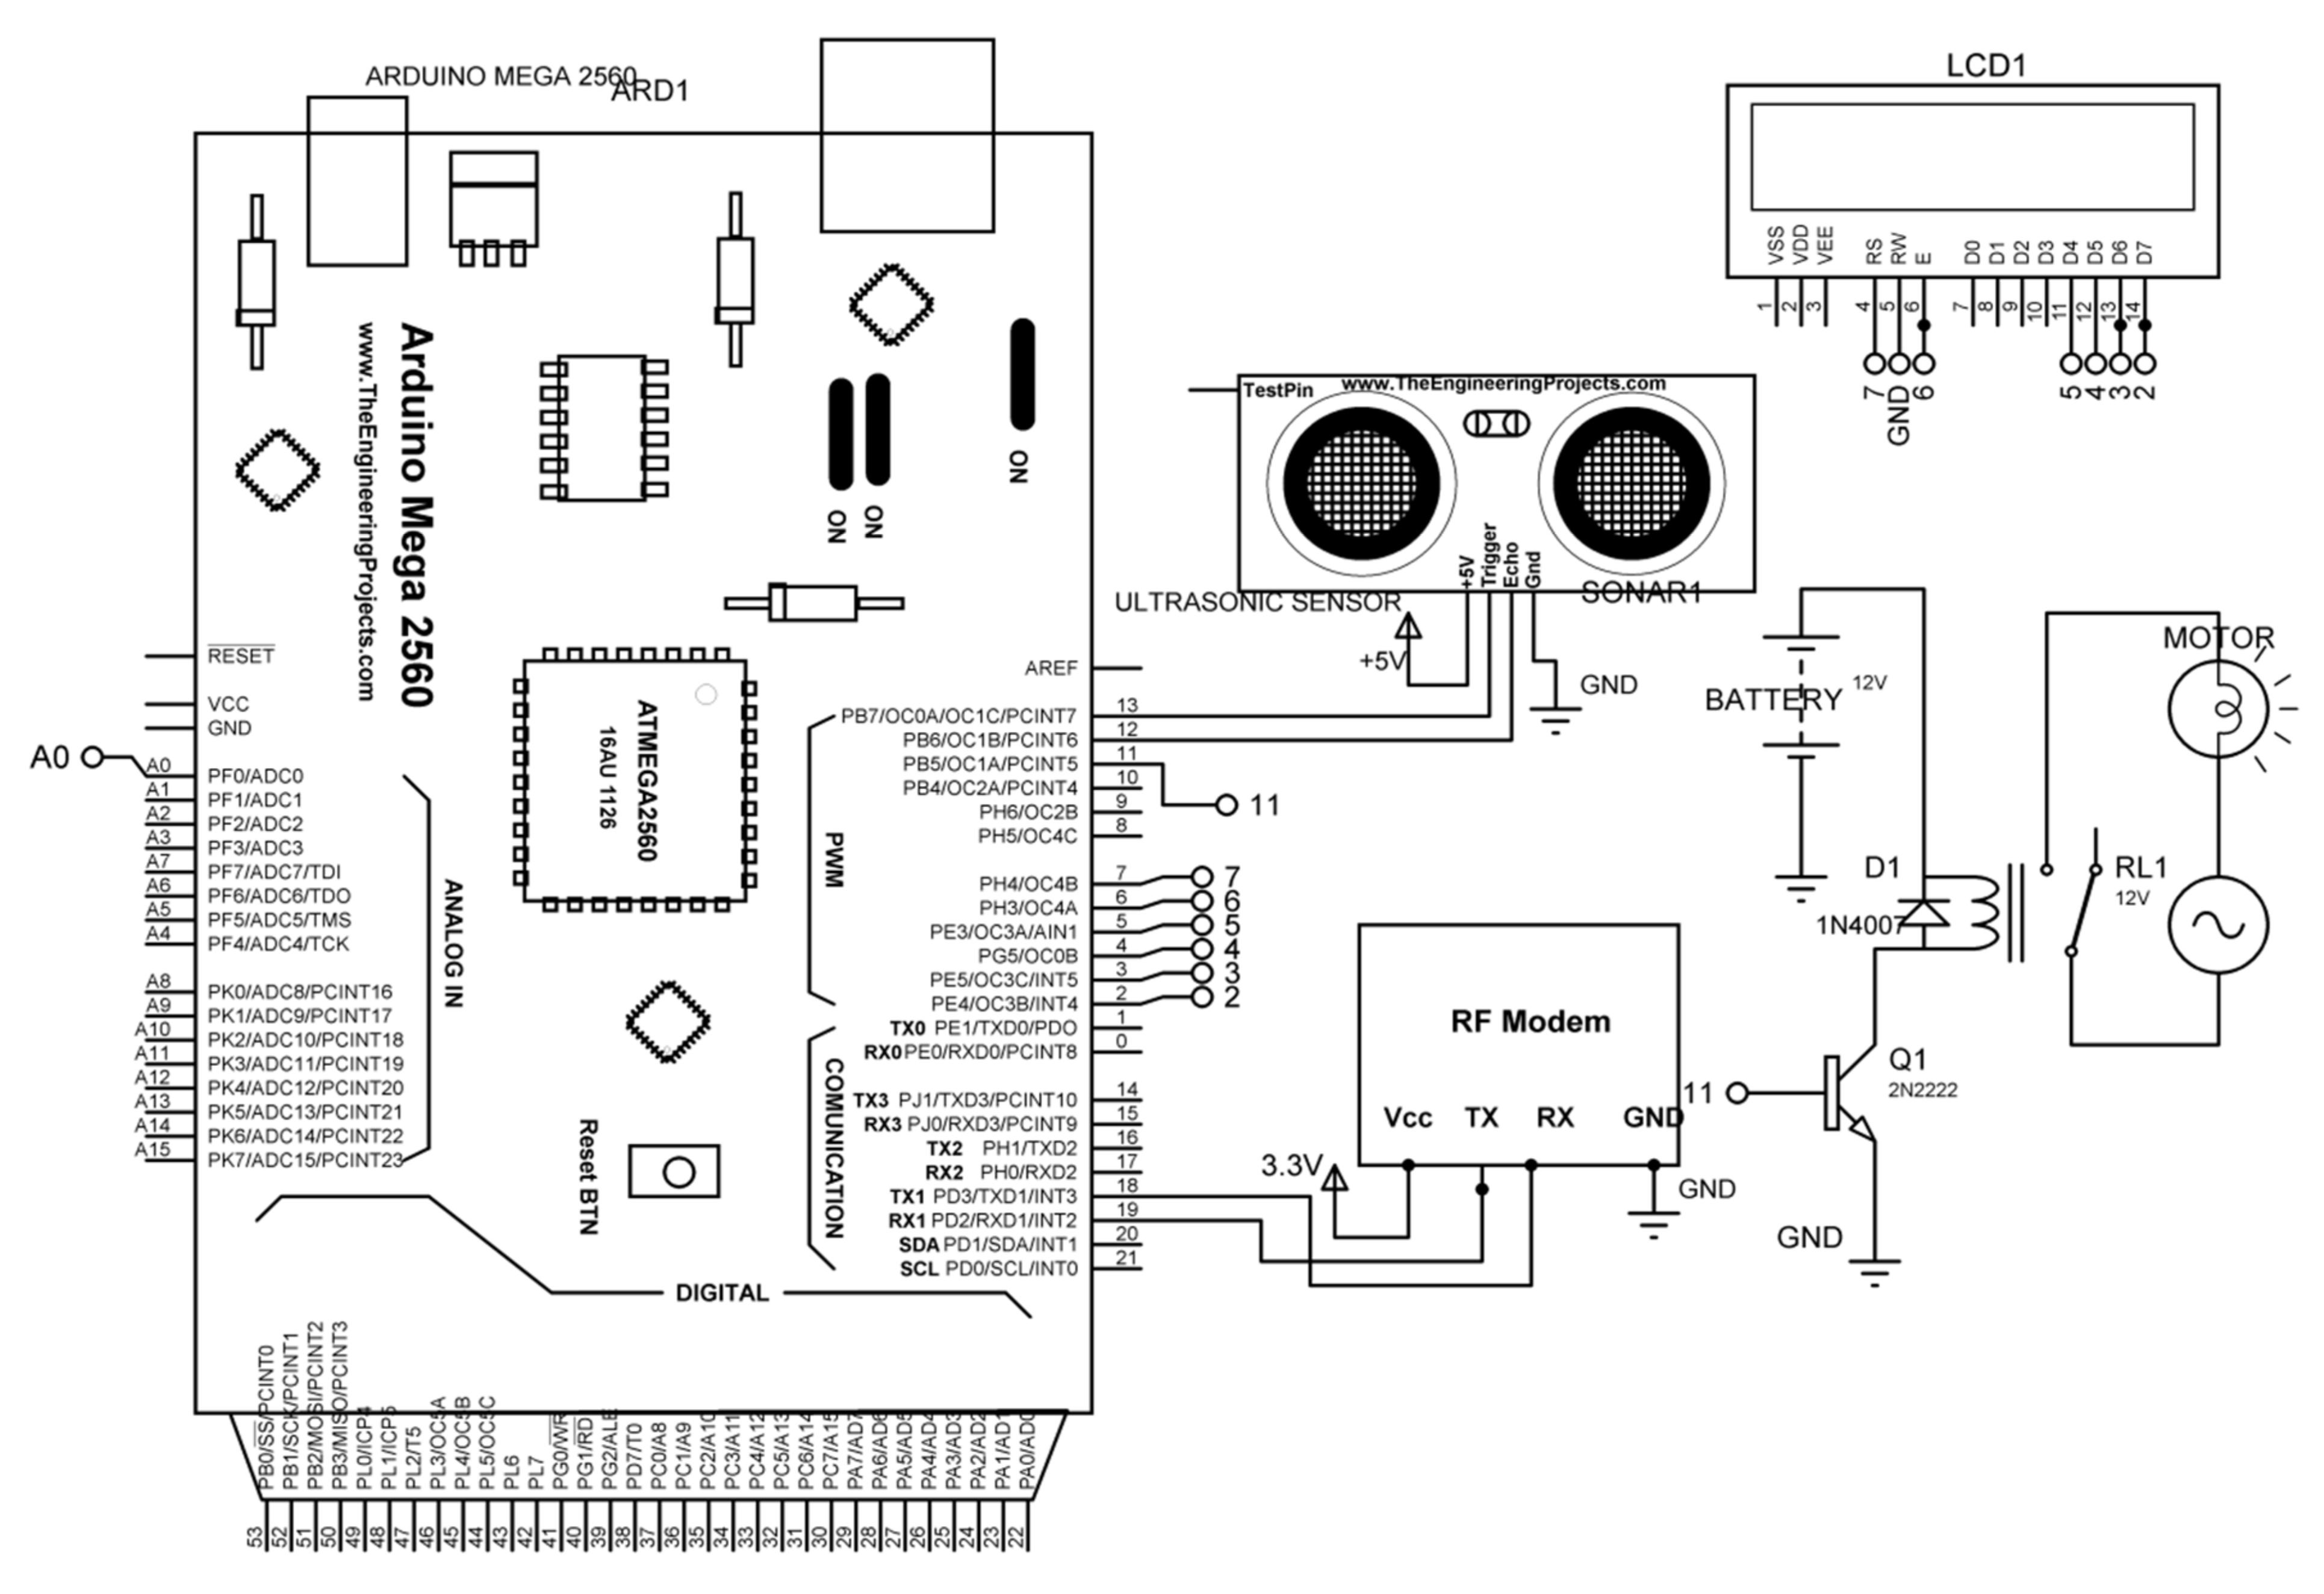
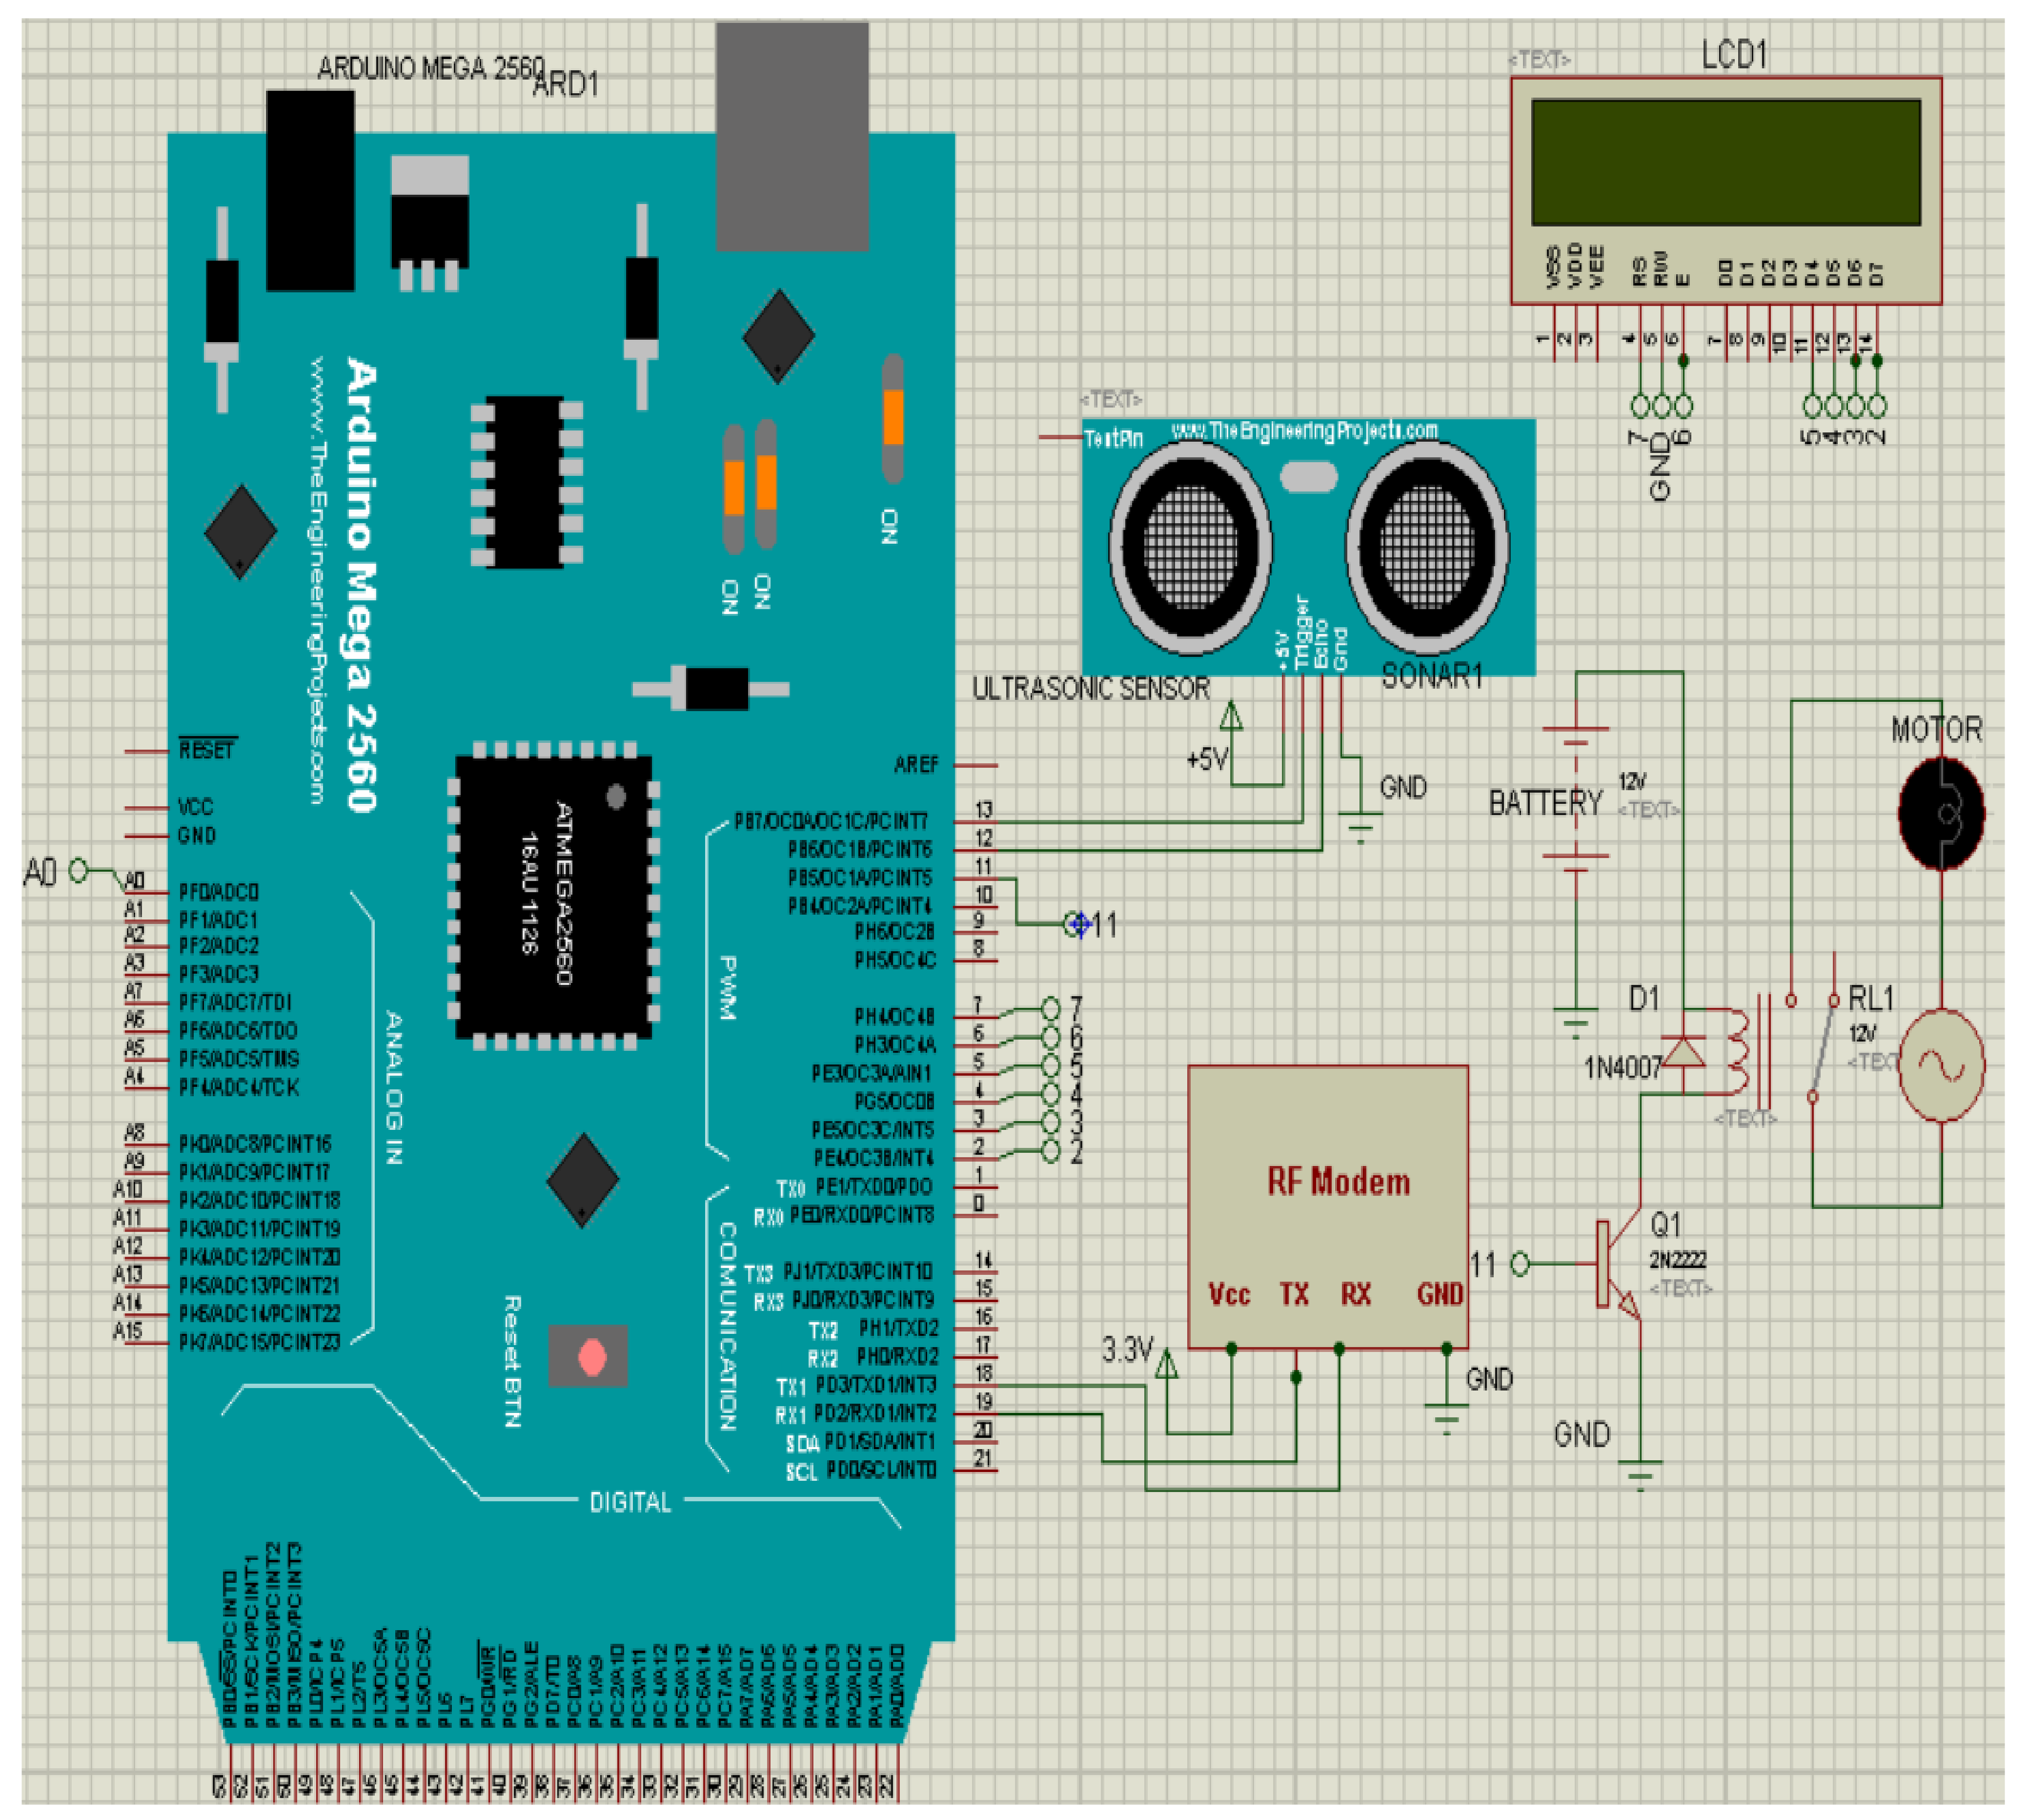
4.1.1. Node 1 Transmitter Unit

The circuit scheme of Node 1 appears in Figure 4. Flow sensor, ultrasonic HC-SR04, 2.4 GHz RF module, ESP 8266, Arduino Mega 2560, PH sensor, and LCD 16 × 2 are part of node 1. Node 1 The flow sensor is attached to the microcontroller’s digital pin 8. The ultrasonic sensor is mounted on the microcontroller’s digital pin 10. For the supply of a 3.3 V power, ESP 8266 is linked to the microcontroller’s Rx0 or Tx0 pin using AMS1117. The RF module is attached to the microcontroller’s Rx1 and Tx1 pins. The pin P0 is linked to the microcontroller’s A0 pin sensor. Digital pins 5, 4, 3, and 2 of the microcontrollers are connected to the LCD’s D4–D7 (Data pins), Register Select (RS), and enable (E) pin of LCD is connected to digital 12 and 11 of the microcontrollers respectively. The contrast levels are adjusted using a potentiometer of 10K in which the wiper of the potentiometer is connected to the VEE pin of the LCD, one pin is attached to the ground and the other to VCC (+5 V).

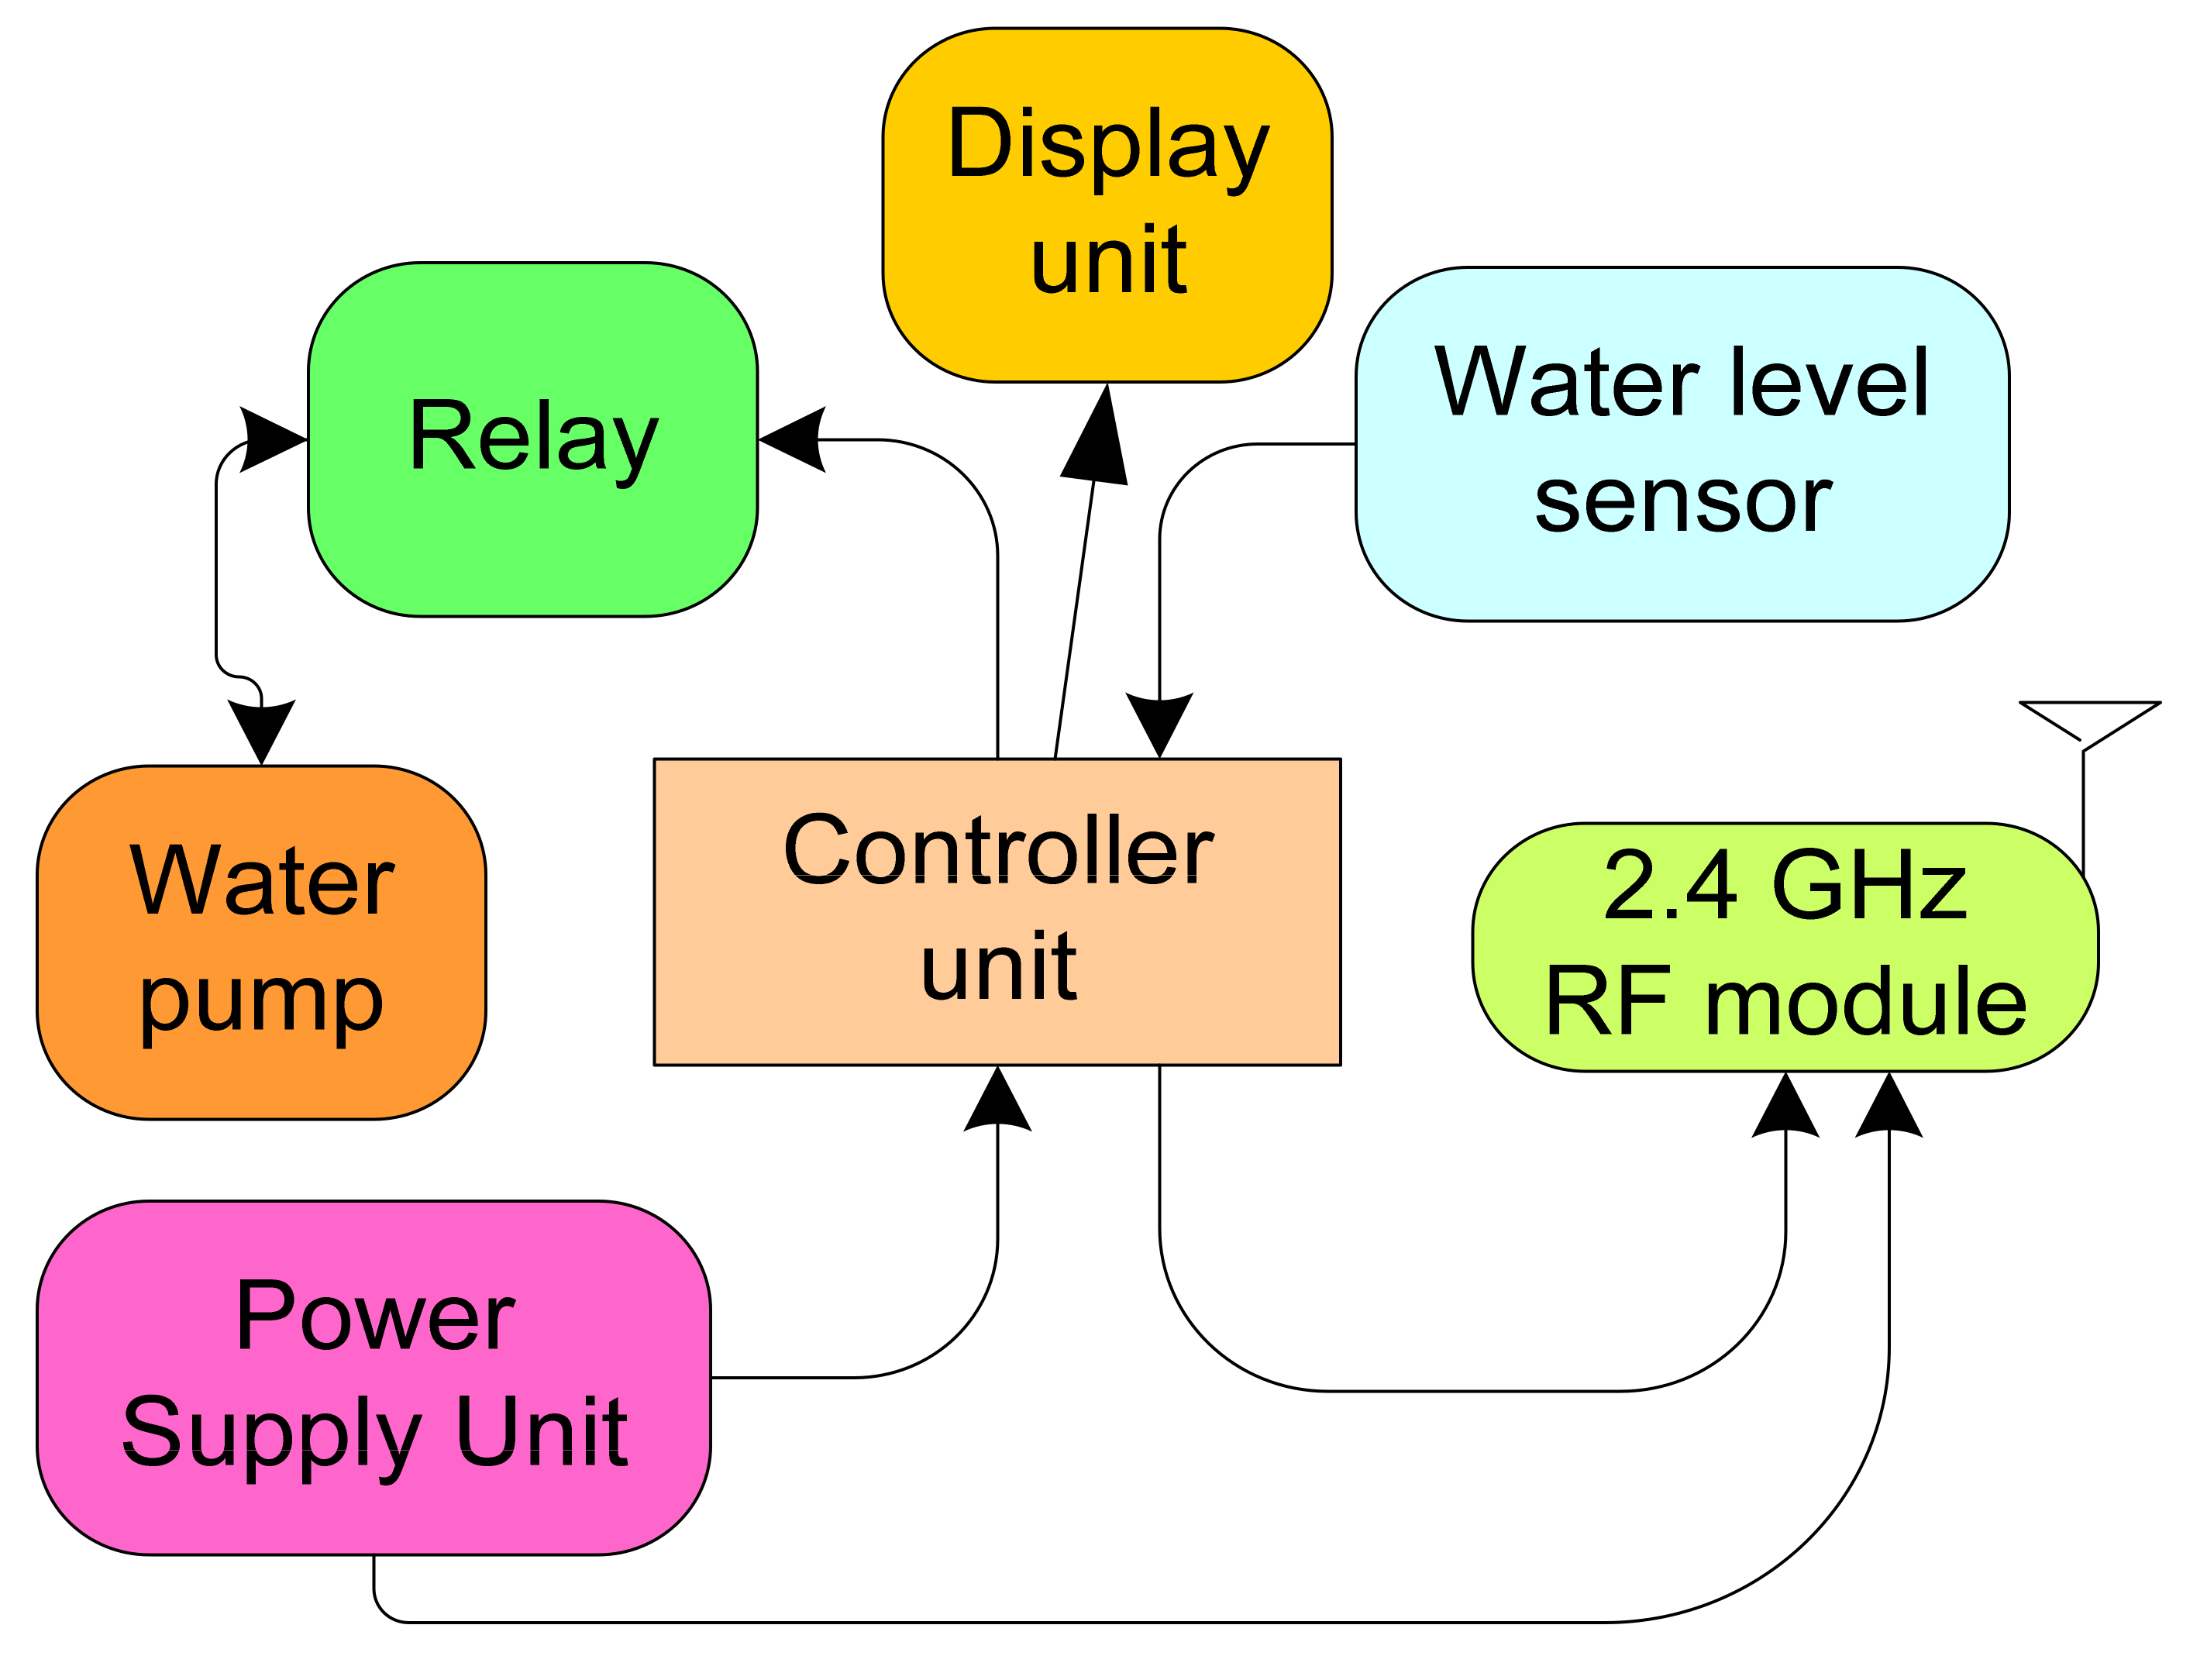
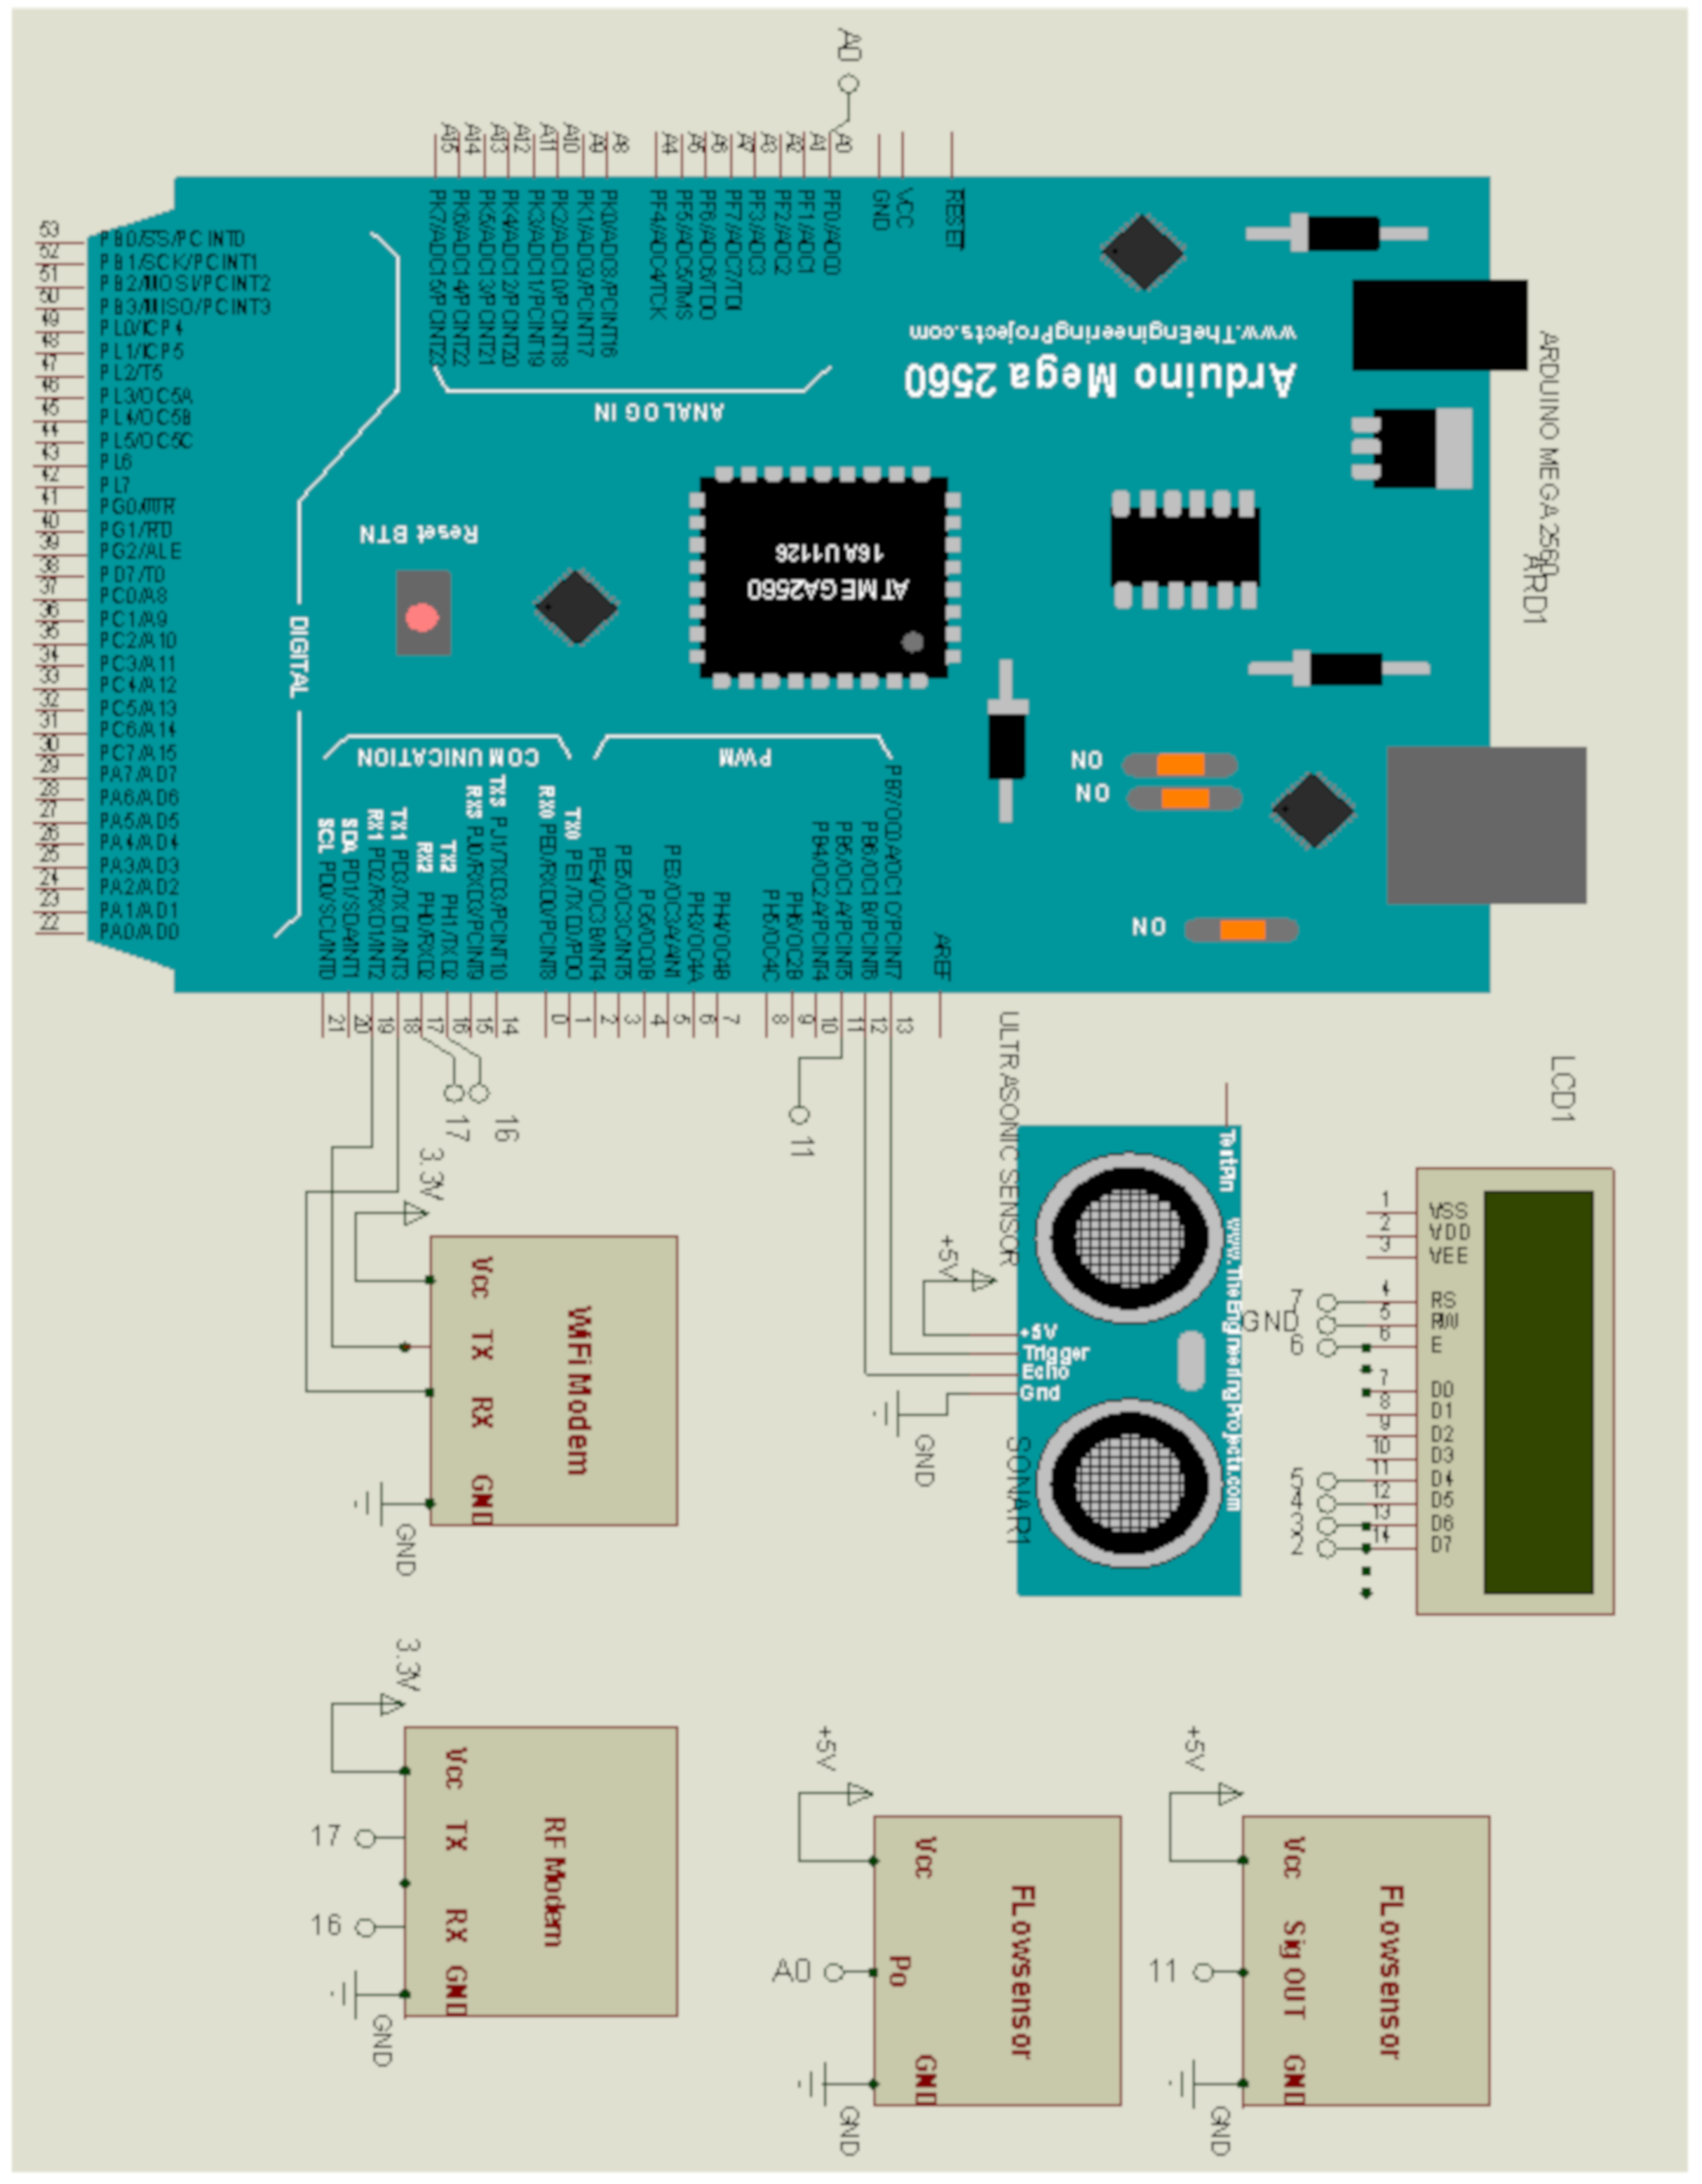
4.1.2. Node 2 Transmitter Unit

Figure 5 displays the node 2 transmitter circuit schematic. It comprises a motor, ultrasonic sensor, radio module, Arduino Mega 2560, and LCD relay circuit. Pin 8 of the microcontroller is mounted to the relay circuit. Pin 8 of the microcontroller is connected to the ultrasonic sensor. The module RF is linked to the microcontroller’s Rx1 and Tx1. The data pins D4–D7 of the LCD are attached to digital pins 5, 4, 3, and 2 of the microcontrollers. Register Select (RS) and enable (E) pin of LCD is connected to digital 12 and 11 of the microcontrollers respectively. The contrast levels are adjusted using a potentiometer of 10K in which the wiper of the potentiometer is connected to the VEE pin of LCD, one pin is attached to the ground and the other to VCC (+5 V).

4.2. Description of Hardware Components

In this section, the explanation of each component that is embedded in the circuit is presented detail. The components explained are Arduino Mega 2560, ultrasonic sensor HC-SR04, pH sensor, flow sensor, liquid crystal display (LCD), ESP 8266 Wi-Fi module, and radio frequency (RF module).

4.2.1. Arduino Mega 2560

The Mega 2560 is an ATmega2560 based microcontroller board [36]. It consists of 54 digital input/output pins (of which 15 can be used as PWM outputs), 16 analog inputs, 4 UARTs (hardware serial ports), 16 MHz crystal oscillator USB connection, a power jack, ICSP header, and reset button.

4.2.2. Ultrasonic Sensor (HC-SR04)

Sonar is used by the ultrasonic sensor (HC-SR04) to locate the distance from the object [37]. The observed non-contact range is precise and reliable. The distance measured ranges between 2 cm and 400 cm. Sharp rangefinders do not impact the range of the sole or the black substance. It is a combination of an ultrasonic transmitter and receiver module. A pulse of 5 V (high) lasting at least 10 us should be given to the sensor triggers. This permits the sensor to broadcast 8 cycles of ultrasound explosion at 40 kHz and wait until the reflected ultrasound explosion begins to measure. When the sensor detects the ultrasound received, it sets the Echo pin to 5 V and delays the distance. By measuring the width of the echo pin, the distance is achieved.

4.2.3. pH Sensor

The pH of a solution shows how the solution is acidic or basic (alkaline). The pH term converts the concentration of hydrogen ions. The value is from 0 to 14. There is a pH of 7 for a neutral solution such as water. This electronic circuit amplifies the voltage values to be fed to the microcontroller for further processing [38]. This sample is immersed in the pH measuring solution. The pH of a solution shows how the solution is acidic or basic (alkaline). The pH term converts the concentration of hydrogen ions. The value is from 0 to 14. There is a pH of 7 for a neutral solution such as water. The Components of the pH measurement loop are a pH sensor, preamplifier, and analyzer(transmitter). The pH sensor includes a measuring electrode, reference electrode, and temperature sensor [39]. The measuring loop is a battery in which the measuring electrode is the positive terminal, and the negative terminal is the reference electromagnetic. The electrode responds to the ion of the hydrogen. The measuring electrode produces a voltage directly linked to the solution’s hydrogen ion concentration. The reference electrode gives a significant potential in comparison to the electrode measurement. The pH sensor components comprise a single device called a pH electrode combination.

4.2.4. Flow Sensor

The sensor is used for water flow measurement and is positioned according to the water supply [40]. Flow measurement by use of a sensor pinwheel. A magnet is fixed to the pinwheel, and a Hall effect magnetic sensor on the opposite side of the plastic tube measures the spins the pinwheel has made through the plastic wall. There are three wires of the sensor: red, black, and yellow (Hall effect pulse output). The motion of the fluid is monitored by measuring the pulses from the sensor output. Every pulse is 2.25 mL.

4.2.5. ESP 8266 Wi-Fi Modem

The Wi-Fi Module ESP8266 is an autonomous chip system (SOC) [41]. TCP/IP protocol stack is interlaced with which the microcontroller has Wi-Fi connectivity. AT command set firmware is already in place for the module. The processing and storage capabilities are solid. It can be coupled via GPI0s with the sensors. An external logic level converter is required for the ESP8266 module. There are 8 pins in the module. The pins of the module are VCC: Power 3.3 V, GND: Common Ground, RX (Receiver): It receives data transmitted by host, TX (transmitter): It transmits data received by the host, RESET: connected to the ground while flashing.
GPIO0: It is used as the program pin by the firmware. It must be low while flashing the ESP 8266 module, GPIO2: It is free GPIO and CH_PD: It is the power down signal which pulled to VCC (3.3 V).

4.2.6. RF Module

This module operates in a half-duplex mode that is at an instance it can either transmit or receive [42]. After each transmission, the module switches to receiver mode automatically. The TX and RX LED shows receiving or transmitting of data. During transmission of data, if any data is input to the transmitter, the data is kept in the buffer for the next transmission cycle. The incoming data is stored in the incoming buffer so that the data is not lost when the module is transmitting data actively. at the time of submission, please state that they will be provided.

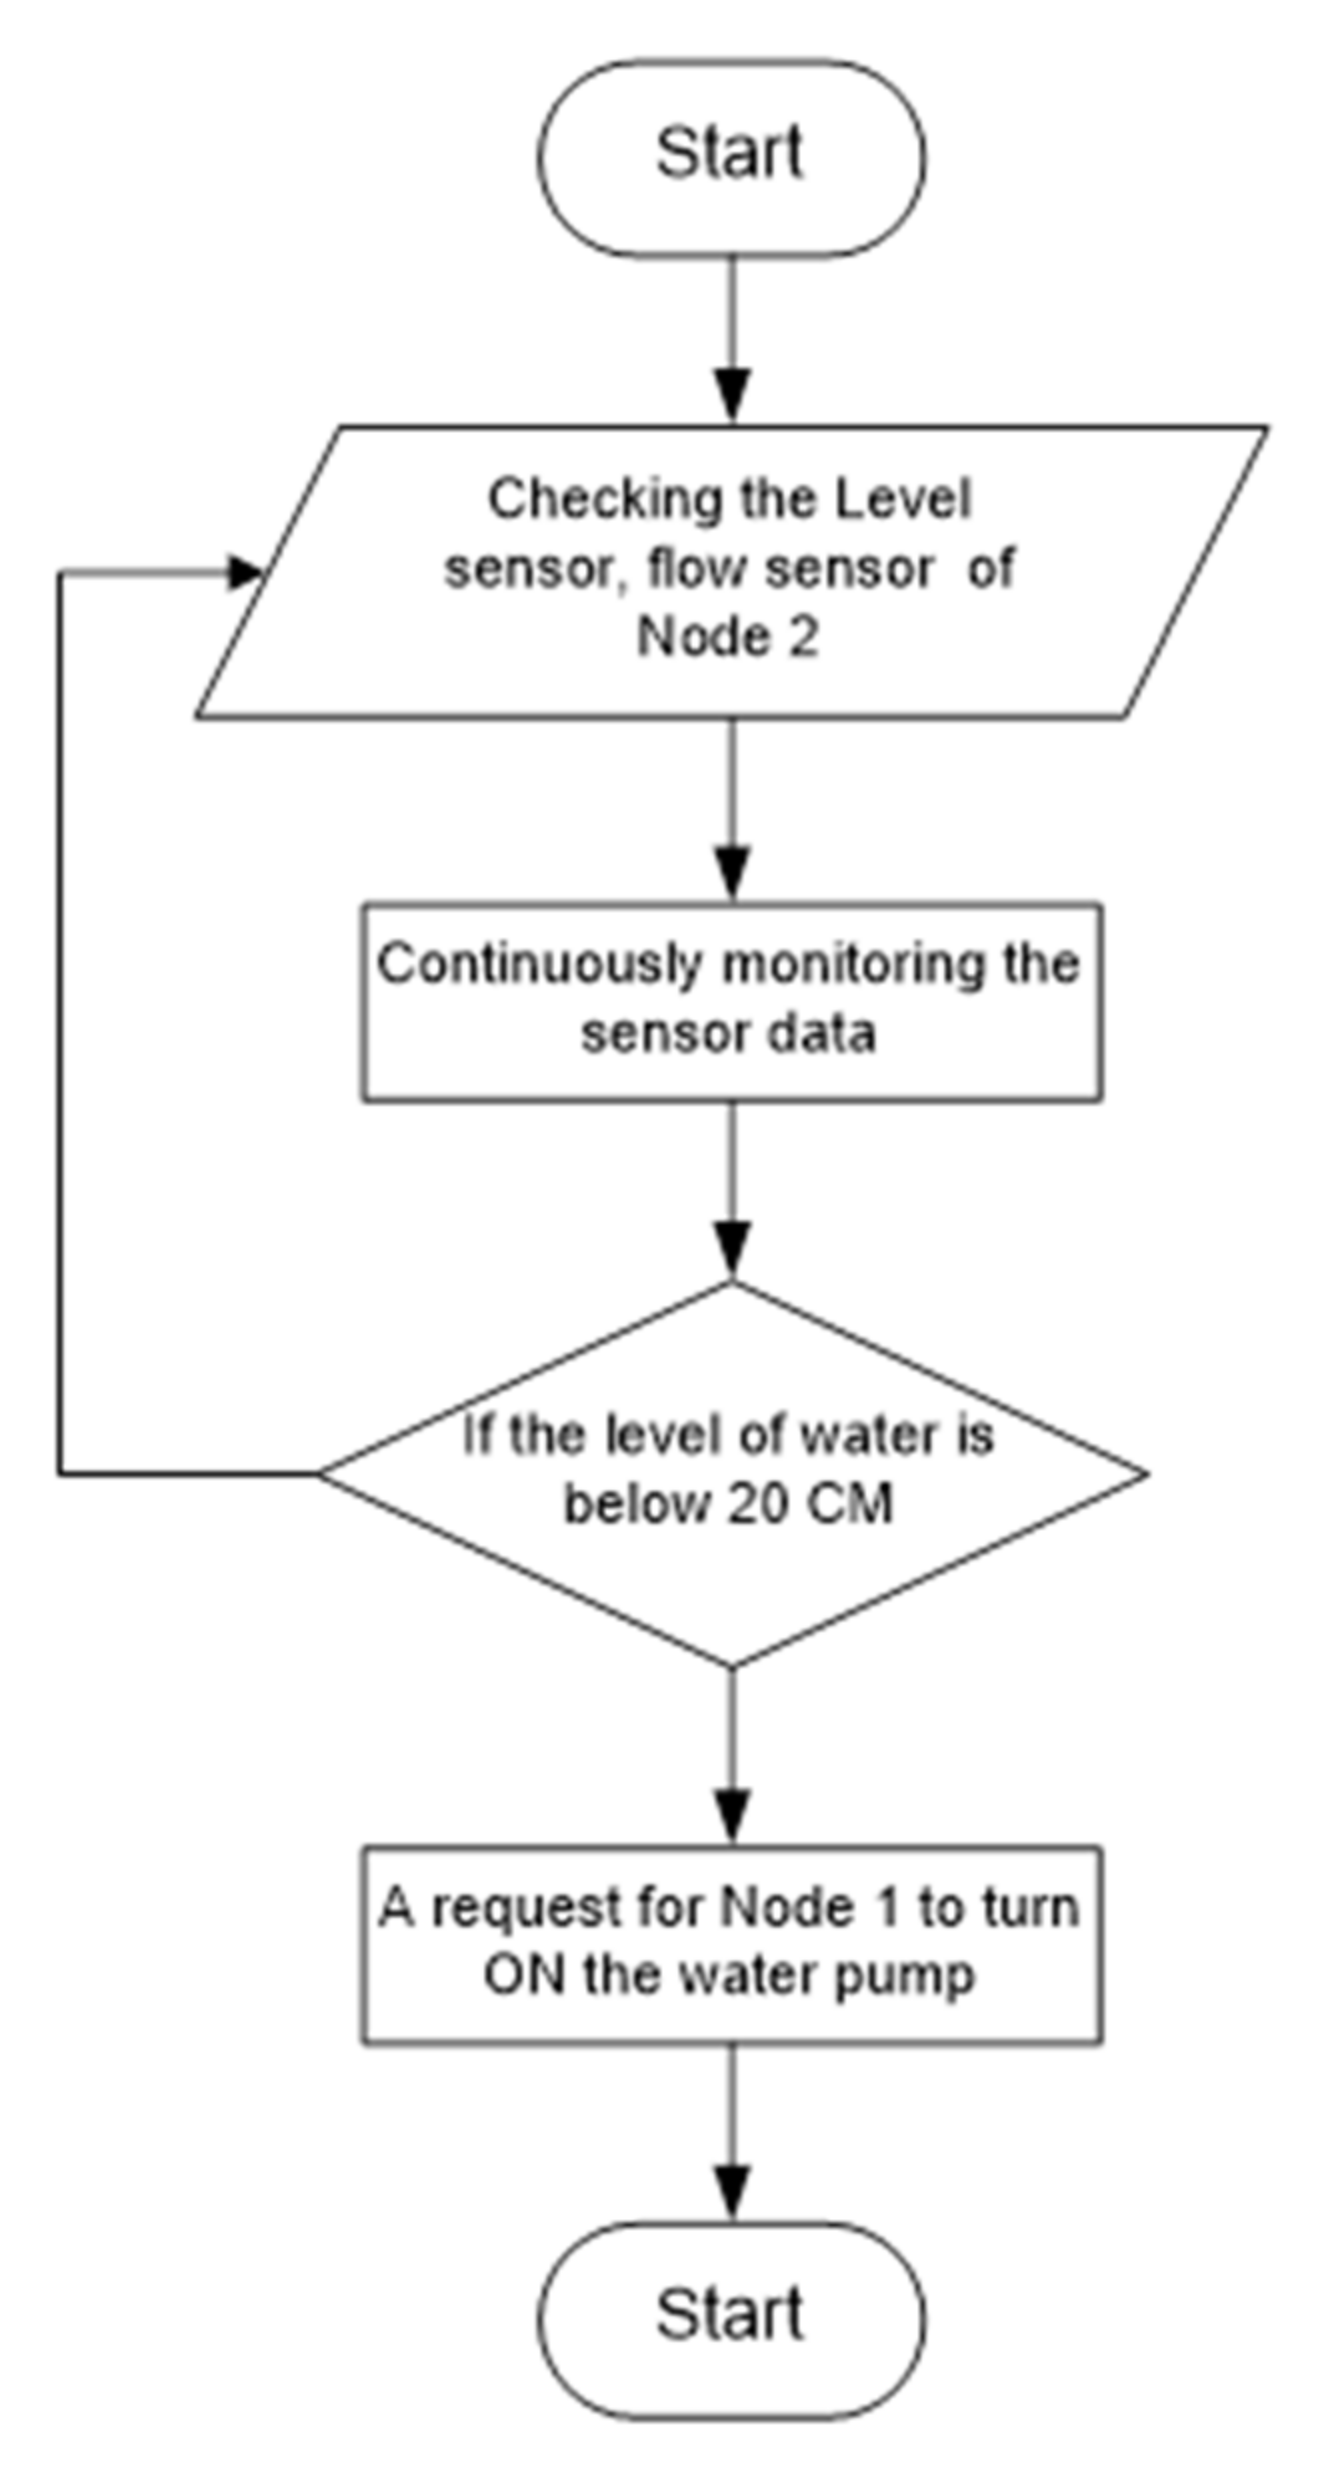
5. Working and Simulation

In this section, we present the working of the hardware component for water level monitoring. Moreover, we also present the simulation of node 1 and node 2 in the proteus simulation.

5.1. Working Diagram

In this section, we present the working of the proposed architecture, and it is shown in Figure 6. During the code, the following flow diagram is followed for automatic water level monitoring in the upper tank. The level sensor continuously monitoring the level of the water in the upper water tank. If the value of the level sensor exceeds < 20 cm then it sends a request to node 2 through 2.4 GHz communication for switching on the water pump.

5.2. Proteus Simulation

Proteus simulation is used as software for hardware simulation. The viability of this software is evaluated before the hardware implementation. The design version of the circuit is version 7 of Proteus. Figure 7 shows the Proteus simulation of the node 1 transmitter. The Proteus simulation includes the Arduino mega 2560, LCD 16 × 2, pH sensor, flow sensor, ESP 8266 Wi-Fi module, and RF module. The model shows the connection between different components and the hardware verification of the software. Also, the node depicts that data from the sensors will be displayed on the LCD and data transmitted through the RF module and ESP 8266 Wi-Fi module.
Figure 8 shows the Proteus simulation of the node 2 transmitters. The Proteus model includes the microcontroller Arduino Mega 2560, LCD 16 × 2, level sensor, relay circuit, RF module. The model shows the connection between different components and the hardware verification of the software. The model shows the triggering of the motor (relay circuit) by node 1 and getting the data on LCD.

6. Experimental Results

In this section, we present the calibration of the sensors before implementing them in the real-time scenario with the standard instrument. Calibration is a set of adjustments made to a sensor or instrument to make it operate correctly and error-free as feasible. Correct sensor calibration will result in inaccurate measurements, allowing for better process control. The calibration, calculation, and validation of the ultrasonic sensor and pH sensor are presented in this section in detail. After calibrating the sensors, the complete system is implemented in a real-time environment, where we have employed a cloud-enabled Virtuino app for logging the value of the sensor of pH, flow sensor, and ultrasonic sensor. Moreover in this section, the Nomenclature of pin configuration are also presented in Table 5.

6.1. Calibration of Sensors

This section is not mandatory but can be added to the manuscript if the discussion is unusually long or complex. The experimental setup includes the two tanks, where one tank is placed at a height and the other is placed at ground level. Nodes designed for each tank are placed on them. Figure 9 shows the experimental setup of the system depicting the overhead tank and the lower tank and the nodes. The overhead tank has a transmitter node with a water level sensor, water flow sensor, and pH sensor.
The reading of all three sensors is displayed on the LCD and transmitted to the receiver node. The lower tank has a water level sensor a motor attached to it. The sensor value is displayed on the LCD. Whenever the water level is less in the overhead tank the motor in the lower tank is triggered and the water is pumped to the overhead tank from the lower tank.
Figure 10a illustrates the setup of node 1 on the upper tank. The figure shows the reading of the sensors on node 1 on the LCD. Figure 10b shows the setup of node 2 on the lower tank. The figure shows the reading of the sensor on node 2 on the LCD. Data are transferred to the receiver using RF modules and data are received on the server using the Wi-Fi ESP8266 module, therefore the suggested model is a handheld device that enables the user to verify the quantity and the quality of water used at each location. The pH of the water was discovered to vary from 6.5 to 8.5 for various types of water and water pollution is a result of any value below or above this. It was also found, although ESP8266 consumes less than 500 mA in current, more current than RF modules. Therefore, a minute of 1 A of current supply is required for the entire circuit. Also, Esp8266 requires a separate power supply of 3.3 V which cannot be provided by the Arduino board.

6.1.1. Ultrasonic Sensor HC-SR04
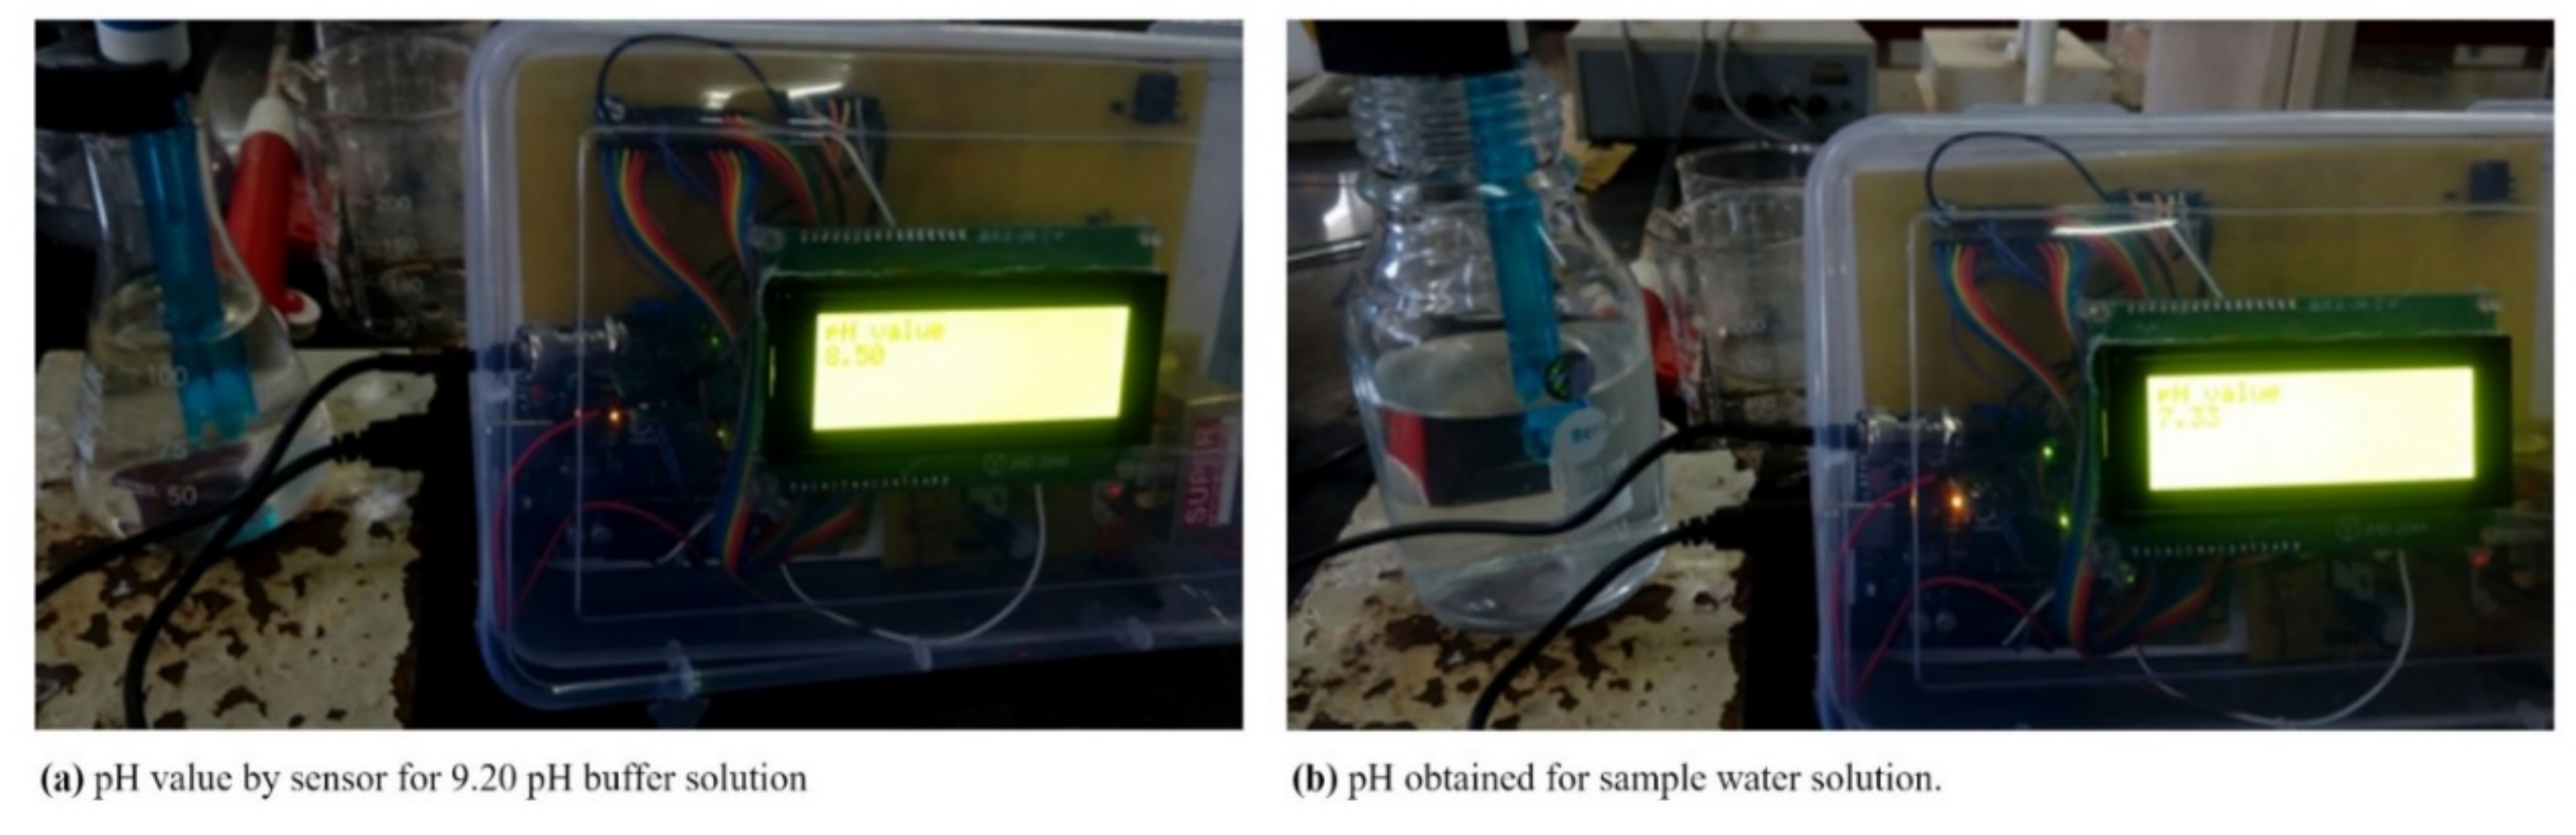
The results of the Ultrasonic Sensor HC-SR04 include the calculation used to measure the distance and the calibration involved to measure the distance accurately. The validation of the sensor is done, and error was calculated.
(i) Calibration
The Ultrasonic sensor senses the distance of a minimum of 3 cm and a maximum of 400 cm. A distance less than 3 cm will not be sensed by the sensor. The sensor sends a trigger pulse of 10 us and the echo signal length is calculated. The duration of the Echo signal is converted to distance.
(ii) Calculation
It includes the formula for calculating the distance from the duration of echo and echo signal length. The speed of sound is 340 m/s, i.e., 0.034 cm/us. Equation (1) determines the formula for calculating the distance and Equation (2) determines the calculation of the distance by ultrasonic sensor.
D i s t a n c e = S p e e d T i m e                                                                          
D i s t a n c e   f r o m   s e n s o r = d u r a t i o n   o f   p u l s e   0.034 2
(iii) Validation
The validation has been done by a measuring scale and comparing the result of the measuring scale and the sensor. Finally, the error of the Ultrasonic Sensor was calculated.
Figure 11 shows the validation of the Ultrasonic Sensor using a measuring scale to compare the reading and get the error between the readings. Different readings from the sensor and the scale were taken and the error is calculated with Equation (3).
U l t r a s o n i c   r e a d i n g = 23 H e i g h t   o f   t a n k S e n s o r   R e a d i n g
Table 2 shows a comparison of the reading of the measuring scale and the ultrasonic sensor. It has been seen that an error of 1 cm is present, i.e., the ultrasonic sensor shows 1 cm less reading than the measuring scale.

6.1.2. pH Sensor

The results of the pH sensor comprise the process of calibrating the sensor and comparing the accuracy of the sensor with a digital pH meter.
(i) Calibration
The steps to calibrate a pH sensor are to take two buffer solutions with pH 4.00 and pH 9.20. First, dip the probe in the 4.00 pH buffer solution and set the sensor to read the pH as 4.00. Wash the probe with distilled water. Dip the probe in the 9.20 pH buffer solution and check the sensor reading. The reading could be less or more than 9.20. The difference in the reading is the error. Then take the solution for which the pH is to be obtained. Dip the probe into the solution and get the reading. Finally, the actual pH is calculated with Equation (4).
Actual   pH = pH   reading + /   error  
(ii) Calculation
The first step is to save the average value of 6 sample values in a buffer. Then, by applying the following formula, the analog mean value is converted to millivolt (mV) with Equation (5).
Value = average   value   5 1024 6  
Then, the pH value is calculated using Equation (6) and it is as follows
pH   value = 3.5 value + offset  
Convert the millivolt into pH value and here, offset is a parameter to change for the calibration.
(iii) Validation
The pH sensor used is validated using a standard digital pH meter 802 by Systronics. The validation was done by first calibrating the digital pH meter. To calibrate it, first, the sensor was set using pH 4.00 buffer solution and then the pH of 9.20 pH buffer solution was measured. Figure 12a shows the process of calibrating the digital pH meter to get the 4.00 pH for the 4.00 pH buffer solution. Figure 12b shows the obtained pH of a buffer solution with pH 9.20 to get the error in the pH meter. pH of buffer solution 9.20, obtained = 8.90, Error = 9.20 − 8.90 = 0.30, pH of sample water obtained by the meter = 8.07 and Actual pH = pH obtained pH + error = 8.07 +0.30 = 8.37.
Figure 13 shows the obtained pH of the sample water solution. The actual pH will be the sum of the pH obtained and the error. Now, the pH sensor used in the research is calibrated using a 4.00 pH buffer solution by setting the offset in the programming.
Figure 14 shows the sensor calibration using a 4.00 pH buffer solution to get a pH of 4.00 by setting the offset value. Now, the pH value for the 9.20 pH buffer solution is obtained as 8.50. So, the error is 9.20 − 8.50 = 0.70.
Figure 15 shows the pH value obtained for the 9.20 pH buffer solution to calculate the error. The error obtained will be added to the pH of the solutions measured. Now, the pH of the sample water is measured using the sensor. pH value obtained = 7.33, Error = 0.70 and Actual pH = pH obtained + Error = 7.33 + 0.70 = 8.03.
Table 3 summarizes details regarding the calibration of pH sensors. Generally, during the implementation of any sensor with a hardware prototype, they are a requirement of calibration because it assists the hardware prototype to senses the error-free values. Here to calibrate the pH sensor, two different buffer solutions namely pH 4.00 and pH 9.20 are chosen. In the case of the pH 4 buffer solution, the sensor value is accurate. However, with the pH 9.20 solution, there is a bit of difference between the sensor obtained value and the actual value. Here the calibration is conducted in two different cases, in the first case, the sensor value obtained for pH 9.20 buffer solution is 8.90. It indicates there is an error in the sensor value, i.e., 0.30. Now, the pH value obtained for water is 8.07, so the error obtained by the sensor during the measurement of the pH 9.20 solution is needed to add with a pH value of water to get the actual pH value. After adding the pH value, the actual pH value of water is 8.37. In the second case, the sensor value obtained for the 9.20 pH buffer solution is 8.50. It indicates there is an error in the sensor value, i.e., 0.70. Now the pH value obtained for water is 7.33, so the error obtained by the sensor during the measurement of the pH 9.20 solution is added to the obtained pH value of water to get the actual pH value. After adding the pH value, the actual pH value of water is 8.07.

6.2. Virtuino App for Logging and Visualizing Sensor Values

In the above section, we have calculated, calibrated, and validated the sensor values with a real instrument. Now, we will discuss the sensor values logging into a cloud-based app. Figure 16 presents the real experimental setup with the cloud application. Figure 16 clearly illustrates the deployment of the lower tank monitoring unit and upper tank monitoring unit. Upper tank monitoring and lower tank monitoring unit based on 2.4 GHz RF communication. Moreover, the upper tank monitoring unit is integrating with ESP 8266 Wi-Fi module. This enables the transmission of the sensory values of pH, flow, and ultrasonic sensors on the Virtuino cloud application through internet connectivity. Additionally, the Virtuino application assists the user to monitor and visualize the status of the upper tank through the internet.
The Virtuino application provides a graphical user interface-based dashboard to control and visualize the data of the physical things and sensors. The Virtuino application is based on the Virtuino server. Virtuino is useful for controlling the hardware boards that are integrated with Virtuino through Bluetooth and Wi-Fi.
Figure 17 illustrates the sensory value of the upper tank monitoring unit on the Virtuino app. As discussed earlier, the three different sensors are utilized in the upper tank for monitoring the level of water, pH value of water, and flow rate of water. The sensory values of the ultrasonic sensor are represented in centimeters (cm), the flow rate of water is represented as liters per minute (L/MIN) and the pH value does not have any units to represent. Generally, if the pH value is below 7, then it is considered as an acidic substance and if the pH value is above 7 then it is considered as a basic substance.
Here, the Virtuino application is visualizing the three sensor values at three different time intervals. In Figure 17a the level of the water in the upper tank is visualized as 15 cm with a flow rate of 2 L/MIN and the pH value of the water is visualized as 7. In Figure 17b the level of the water in the upper tank has remained the same i.e.,15 cm with the same flow rate of 2 L/MIN, and however the pH value of the water is increased to 8. Here the water pump is switched and the amount of water in the upper tank is increased to 20 cm with the same flow rate of 2 L/MIN and however, the pH value of the water remains constant, i.e., 8. Finally, the results conclude that the proposed architecture for upper water monitoring is performing effectively, as the upper tank monitoring unit can log the sensory value of the level sensor, pH sensor, and flow rate sensor on the cloud-enabled Virtuino app. Table 4 summarizes the sensor value obtained on the Virtuino dashboard, where the pH sensor, water level, and flow rate of three Virtuino dashboards are presented (see Table 4 and Table 5).

7. Conclusions

Water management is the primary task of any individual in building for efficiently managing the water for avoiding the scarcity of the water. With the advancement in technology, physical things are automating with the assistance of sensors and communication technology. In this study, we have proposed an IoT-enabled architecture for monitoring the water level and water quality in the domestic water tank. Here the architecture comprises two different units namely upper water tank monitoring and lower tank monitoring unit. The level sensor in the upper tank monitoring continuously monitors the level of the water in the upper water tank. In case the value of the level sensor exceeds the threshold level then it sends a request to the lower tank monitoring through 2.4 GHz communication for switching on the water pump. Moreover, the upper tank is integrated with ESP 8266 Wi-Fi module for initiating the communication with the cloud server. Here the user with the assistance of a mobile app can control, monitor the water tank activities through internet connectivity. A proteus simulation of the upper tank monitoring and lower tank monitoring. The calibration of pH sensor and ultrasonic are carried out with standard instruments for setting the accurate values in the prototype for obtaining the error-free during real-time experimental implementation with these sensors. Finally, a real-time experimental setup is performed for evaluating the performance of the proposed system. Moreover, a validation of the ultrasonic level sensor and pH sensor is also addressed in the article. Cloud server enabled Virtuino app is utilized in this study for monitoring and visualizing the sensory value on graphical user interface (GUI) dashboard. This system assists the users in real monitor the amount of water that is consumed from the tank through the flow sensor.

8. Future Scope and Challenges

In the future, we will be integrating a few more sensors like the dissolved oxygen sensor, conductivity sensor, and temperature sensor to deliver a more reliable system for the domestic water tank. Moreover, an edge computing-enabled vision device based on machine learning can be implemented for detecting the distinct kind of bacteria and harmful particles instantly in a short interval time. Regarding challenges, the calibration of the sensor and placement of the system should be carefully implemented for enhancing the error-free sensor value and protection to the system deployed.

Author Contributions

R.S., A.G. and M.K. made contributions to conception and manuscript writing; M.B. and S.S.A. examined and supervised this research and outcomes; M.R., S.V.A. and A.S.A. revised and polished the manuscript. All authors have read and agreed to the published version of the manuscript.

Funding

This research was supported by Taif University Research Supporting Project number (TURSP-2020/239), Taif University, Taif, Saudi Arabia.

Institutional Review Board Statement

Not applicable.

Informed Consent Statement

Not applicable.

Data Availability Statement

Not Appliacble.

Conflicts of Interest

The authors declare no conflict of interest.

Abbreviations

IoTInternet of Things
RFRadio frequency
Wi-FiWireless fidelity
IPInternet protocol
GSMGlobal system for mobile communication
GPRSGlobal packet for radio service
WSNWireless sensor network
GPSGlobal positioning system
DODissolved oxygen
GUIGraphical user interface
UHFUltra high frequency
RSRegister select
RWRead/write
VCCVoltage at common collector
VEEVoltage at common emitter
LCDLiquid crystal display
D4-D7Data pins
EEnable pin
UARTUniversal asynchronous receiver/transmitter
ICSPIn-circuit serial programming (ICSP)
PWMPulse wave modulation
USBUniversal serial bus
SOCSystem on chip
LEDLiquid emitting diode
cmCentimeter
GNDCommon ground
RXReceiver
TXTransmitter
ADCAnalog to digital converter
INTInterrupt pin

References

  1. Water Resources Management Overview. Available online: https://www.worldbank.org/en/topic/waterresourcesmanagement (accessed on 11 June 2021).
  2. FAO (Food and Agriculture Organization of the United Nations). The State of the World’s Land and Water Resources: Managing Systems at Risk; Food and Agriculture Organization of the United Nations: Rome, Italy, 2011. [Google Scholar]
  3. Food and Agriculture Organization of the United Nations. Agriculture: Cause and Victim of Water Pollution, but Change is Possible. Available online: http://www.fao.org/land-water/news-archive/news-detail/en/c/1032702/ (accessed on 11 June 2021).
  4. Johari, A.; Abd Wahab, M.H.; Latif, N.S.A.; Ayob, M.E.; Ayob, M.I.; Ayob, M.A.; Mohd, M.N.H. Tank water level monitoring system using GSM network. Int. J. Comput. Sci. Inf. Technol. 2011, 2, 1114–1115. [Google Scholar]
  5. Shankari, M.; Jyothi, M.E.; Naveen, I.; Herle, H. Wireless automatic water level control using radio frequency communication”. Int. J. Adv. Res. Electr. Electron. Instrum. Eng. 2013, 2, 1320–1324. [Google Scholar]
  6. Jin, N.; Ma, R.; Lv, Y.; Lou, X.; Wei, Q. A Novel Design of Water Environment Monitoring System Based on WSN. In Proceedings of the 2010 International Conference On Computer Design and Applications, San Jose, CA, USA, 7–11 November 2010; Volume 2, pp. 2–593. [Google Scholar]
  7. Jatmiko, S.; Mutiara, A.B.; Indriati, M. Prototype of water level detection system with wireless. J. Theor. Appl. Inf. Technol. 2012, 37, 52–59. [Google Scholar]
  8. Xu, Y.; Liu, F. Application of Wireless Sensor Network in Water Quality Monitoring. In Proceedings of the 22017 IEEE International Conference on Computational Science and Engineering (CSE) and IEEE International Conference on Embedded and Ubiquitous Computing (EUC), Guangzhou, China, 21–24 July 2017; Volume 2, pp. 368–371. [Google Scholar]
  9. Singh, R.; Gehlot, A.; Thakur, A.K.; Swain, M.; Akram, S.V. Wireless Sensor Network with Power Management System for Water Level Regulation in Paddy Fields. Int. J. Innov. Technol. Explor. Eng. (IJITEE) 2020, 9, 1243–1246. [Google Scholar]
  10. Haron, N.S.; Mahamad, M.K.B.; Aziz, I.A.; Mehat, M. A system architecture for water quality monitoring system using wired sensors. In Proceedings of the 2008 International Symposium on Information Technology, Kuala Lumpur, Malaysia, 26–28 August 2008; Volume 4, pp. 1–7. [Google Scholar]
  11. Jian, C.; Suxiang, Q.; Hongsheng, H.; Gongbiao, Y. Wireless Monitoring and Assessment System of Water Quality Based on GPRS. In Proceedings of the 8th International Conference on Electronic Measurement and Instruments, Xi’an, China, 16–18 August 2007; pp. 2–124. [Google Scholar]
  12. Postolache, O.; Girão, P.S.; Pereira, J.; Ramos, H. Self-Organizing Maps Application in a Remote Water Quality Monitoring System. IEEE Trans. Instrum. Meas. 2005, 54, 322–329. [Google Scholar] [CrossRef]
  13. Olatinwo, S.O.; Joubert, T. Enabling Communication Networks for Water Quality Monitoring Applications: A Survey. IEEE Access 2019, 7, 100332–100362. [Google Scholar] [CrossRef]
  14. Malik, P.K.; Sharma, R.; Singh, R.; Gehlot, A.; Satapathy, S.C.; Alnumay, W.S.; Pelusi, D.; Ghosh, U.; Nayak, J. Industrial Internet of Things and its Applications in Industry 4.0: State of The Art. Comput. Commun. 2021, 166, 125–139. [Google Scholar] [CrossRef]
  15. Nord, J.H.; Koohang, A.; Paliszkiewicz, J. The Internet of Things: Review and theoretical framework. Expert Syst. Appl. 2019, 133, 97–108. [Google Scholar] [CrossRef]
  16. Gutiérrez, J.; Villa-Medina, J.F.; Nieto-Garibay, A.; Porta-Gándara, M.Á. Automated irrigation system using a wireless sensor network and GPRS module. IEEE Trans. Instrum. Meas. 2013, 63, 166–176. [Google Scholar] [CrossRef]
  17. Zia, H.; Harris, N.R.; Merrett, G.; Rivers, M.; Coles, N. The impact of agricultural activities on water quality: A case for collaborative catchment-scale management using integrated wireless sensor networks. Comput. Electron. Agric. 2013, 96, 126–138. [Google Scholar] [CrossRef] [Green Version]
  18. Rasin, Z.; Hamzah, H.; Aras, M.S.M. Application and Evaluation of High Power Zigbee Based Wireless Sensor Network in Water Irrigation Control Monitoring System. In Proceedings of the 2009 IEEE Symposium on Industrial Electronics & Applications, Kuala Lumpur, Malaysia, 4–6 October 2009; Volume 2, pp. 548–551. [Google Scholar]
  19. Jiang, P.; Xia, H.; He, Z.; Wang, Z. Design of a Water Environment Monitoring System Based on Wireless Sensor Networks. Sensors 2009, 9, 6411–6434. [Google Scholar] [CrossRef] [Green Version]
  20. Zhou, Y.; Yang, X.; Wang, L.; Ying, Y. A Wireless Design of Low-Cost Irrigation System Using ZigBee Technology. In Proceedings of the 2009 International Conference on Networks Security, Wireless Communications and Trusted Computing; Institute of Electrical and Electronics Engineers (IEEE), Wuhan, China, 25–26 April 2009; Volume 1, pp. 572–575. [Google Scholar]
  21. Nasser, N.; Ali, A.; Karim, L.; Belhaouari, S.B.; Ali, A. An efficient Wireless Sensor Network-based water quality monitoring system. In Proceedings of the 2013 ACS International Conference on Computer Systems and Applications (AICCSA), Ifrane, Morocco, 27–30 May 2013; pp. 1–4. [Google Scholar]
  22. Gehlot, A.; Singh, R.; Thakur, A.K.; Pandey, R. Design and Development of Wireless Fan Regulator using ZigBee Concept. Int. J. 2020, 9. [Google Scholar] [CrossRef]
  23. O’Flynn, B.; Martinez-Catala, R.; Harte, S.; O’Mathuna, C.; Cleary, J.; Slater, C.; Regan, F.; Diamond, D.; Murphy, H. SmartCoast: A Wireless Sensor Network for Water Quality Monitoring. In Proceedings of the 32nd IEEE Conference on Local Computer Networks (LCN 2007), Dublin, Ireland, 15–18 October 2007; pp. 815–816. [Google Scholar]
  24. Tripathy, A.K.; Das, T.K.; Chowdhary, C.L. Monitoring Quality of Tap Water in Cities Using IoT. In Emerging Technologies for Agriculture and Environment; Springer: Singapore, 2020; pp. 107–113. [Google Scholar]
  25. Rajalashmi, K.; Yugathian, N.; Monisha, S.; Jeevitha, N. IoT based water quality management system. Mater. Today Proc. 2021, 45, 512–515. [Google Scholar] [CrossRef]
  26. Akram, S.V.; Singh, R.; Al Zain, M.A.; Gehlot, A.; Rashid, M.; Faragallah, O.S.; El-Shafai, W.; Prashar, D. Performance Analysis of IoT and Long-Range Radio-Based Sensor Node and Gateway Architecture for Solid Waste Management. Sensors 2021, 21, 2774. [Google Scholar] [CrossRef] [PubMed]
  27. Swain, M.; Zimon, D.; Singh, R.; Hashmi, M.F.; Rashid, M.; Hakak, S. LoRa-LBO: An Experimental Analysis of LoRa Link Budget Optimization in Custom Build IoT Test Bed for Agriculture 4. Agronomy 2021, 11, 820. [Google Scholar] [CrossRef]
  28. Kinar, N.J.; Brinkmann, M. Development of a sensor and measurement platform for water quality observations: Design, sensor integration, 3D printing, and open-source hardware. Res. Sq. 2021. [Google Scholar] [CrossRef]
  29. Lasrado, R.; Melroy, F.; Anil, M.; Prinson, V. Automation of Water Management System Using Labview. J. Mech. Eng. Autom. 2015, 5, 88–93. [Google Scholar]
  30. Kulkarni, S.; Raikar, V.D.; Rahul, B.K.; Rakshitha, L.V.; Sharanya, K.; Jha, V. Intelligent Water Level Monitoring System Using IoT. In Proceedings of the 2020 IEEE International Symposium on Sustainable Energy, Signal Processing and Cyber Security (iSSSC), Gunupur Odisha, India, 16–17 December 2020; pp. 1–5. [Google Scholar]
  31. Masoumi, S.; Haghkhah, M.; Mehrabani, D.; Ghasempour, H.R.; Esmaeelnejad, Z.; Ghafari, N.; Saeedzadeh, A.; Moradi, F.; Rezaeianzadeh, A. Quality of drinking water of household filter systems in Shiraz, Southern Iran. Middle-East J. Sci. Res. 2013, 17, 270–274. [Google Scholar]
  32. Cao, H.; Guo, Z.; Wang, S.; Cheng, H.; Zhan, C. Intelligent Wide-Area Water Quality Monitoring and Analysis System Exploiting Unmanned Surface Vehicles and Ensemble Learning. Water 2020, 12, 681. [Google Scholar] [CrossRef]
  33. Eichhorn, M.; Ament, C.; Jacobi, M.; Pfuetzenreuter, T.; Karimanzira, D.; Bley, K.; Boer, M.; Wehde, H. Modular AUV System with Integrated Real-Time Water Quality Analysis. Sensors 2018, 18, 1837. [Google Scholar] [CrossRef] [Green Version]
  34. Hong, W.J.; Shamsuddin, N.; Abas, E.; Apong, R.A.; Masri, Z.; Suhaimi, H.; Gödeke, S.H.; Noh, M.N.A. Water Quality Monitoring with Arduino Based Sensors. Environments 2021, 8, 6. [Google Scholar] [CrossRef]
  35. Olatinwo, S.O.; Joubert, T.-H. Optimizing the Energy and Throughput of a Water-Quality Monitoring System. Sensors 2018, 18, 1198. [Google Scholar] [CrossRef] [PubMed] [Green Version]
  36. Arduino Mega 2560 Pinout. Available online: https://www.electroschematics.com/arduino-mega-2560-pinout/ (accessed on 11 June 2021).
  37. Voltage, S.; Current, S.; Format, O.D. Ultrasonic Distance Sensor-Serial Out [1166]: Sunrom Electron-ics/Technologies. Available online: https://www.sunrom.com/get/984800/ (accessed on 20 June 2021).
  38. Liquid PH Value Detection Detect Sensor Module Monitoring Control for Arduino-Scion Electronics. Available online: https://scionelectronics.com/product/liquid-ph-value-detection-detect-sensor-module-monitoring-control-for-arduino/ (accessed on 11 June 2021).
  39. New Arrival PH Electrode Probe BNC Connector for Aquarium PH Controller Meter Sensor gib Best Promotion: Industrial & Scientific. Available online: https://www.amazon.com/Electrode-Connector-Aquarium-Controller-Promotion/dp/B07KDQVY6X (accessed on 11 June 2021).
  40. SeeedStudio Water Flow Sensor (1/2)-RobotShop. Available online: https://www.robotshop.com/en/seeedstudio-water-flow-sensor.html (accessed on 11 June 2021).
  41. ESP8266 Introduction|FabAcademy-Tutorials. Available online: http://fabacademy.org/2019/docs/FabAcademy-Tutorials/week15_networking_and_communications/esp8266.html (accessed on 11 June 2021).
  42. RF Serial Data Link UART, 2.4 Ghz [1418]: Sunrom Electronics. 2007, Volume 3, pp. 154–196. Available online: https://www.sunrom.com/get/349000 (accessed on 20 June 2021).
Figure 1. Proposed IoT architecture for water tank monitoring and water quality monitoring.
Sustainability 13 08452 g001
Figure 2. An upper tank monitoring unit.
Sustainability 13 08452 g002
Figure 3. Lower tank monitoring unit.
Sustainability 13 08452 g003
Figure 4. Circuit diagram of transmitter Node 1.
Sustainability 13 08452 g004
Figure 5. Circuit diagram of transmitter Node 2.
Sustainability 13 08452 g005
Figure 6. Working on the proposed architecture.
Sustainability 13 08452 g006
Figure 7. Proteus simulation of node 1 transmitter.
Sustainability 13 08452 g007
Figure 8. Proteus simulation of node 2 transmitter.
Sustainability 13 08452 g008
Figure 9. Experimental setup of the system.
Sustainability 13 08452 g009
Figure 10. Setup of node 1 and node 2.
Sustainability 13 08452 g010
Figure 11. Setup for validation of the Ultrasonic sensor.
Sustainability 13 08452 g011
Figure 12. Calibration of pH sensor.
Sustainability 13 08452 g012
Figure 13. pH of the water sample from pH meter.
Sustainability 13 08452 g013
Figure 14. Sensor calibration by 4.00 pH buffer solution.
Sustainability 13 08452 g014
Figure 15. pH value by the sensor for 9.20 pH buffer solution and sample water solution.
Sustainability 13 08452 g015
Figure 16. pH obtained for sample water solution.
Sustainability 13 08452 g016
Figure 17. Virtuino dashboard displaying sensor values.
Sustainability 13 08452 g017
Table 1. Findings of the previous studies.
ReferenceFindingsConclusion
[5]Radio Frequency (RF), Global System for Mobile Communications (GSM), Graphical
User Interface (GUI), Ultra High Frequency (UHF), General Packet Radio Service (GPRS)
Wireless Automatic Water Level Control using
Radio Frequency Communication.
[7]Water level detection system with wirelessThe ping sensor is used as a distance sensor for detecting water levels by measuring the distance between the sensor and water surfaces.
[18]Water level monitoring using pH sensors and FSRWater Monitoring System Using Wireless Sensor Network
[19]Level control using fuzzy logicWater management system with remote access having intelligence.
[29]Automation of Water Management System Using LabVIEWWater Management, LabVIEW, Automation
[30]Water level; water pump; water conductivity monitoring using microcontroller and GSM modemAutomated Water Level Management System
[31]Water filter system bacterial contamination drinking waterDetermine the microbiological quality of drinking water from building water filter systems
[32]The ensemble learning method is recommended to examine water quality, which requires a scientific basis for wide-area water quality testing The results of the experiments show and validate that the proposed system can meet water quality monitoring criteria and improve overall working efficiency.
[33]Technical implementation and practical utilization for real-time acquisition of water quality indicators on fish farms of a mini-converted sensor system integrated with an autonomous underwater vehicleAutonomous underwater vehicle (AUV) and the principle of the sensor system
[34]Examining the feasibility of employing for water quality monitoring with Arduino.The testing at different locations should generate much-needed additional data and accuracies for the assessment and validation of the river health system.
[35]The new algorithms have improved the system performance by 36% and the fairness index by 13% for two-sensor systems.The recommended WIPT system is energy-efficient and confirms sustainable communication.
Table 2. Reading of the measuring scale.
Measuring Scale Reading (cm)Ultrasonic Sensor Reading (cm)
823 − 16 = 7
1023 − 14 = 9
1223 − 12 = 11
1423 − 10 = 13
1623 − 8 = 15
Table 3. Calibration of the pH sensor at pH 9.20 buffer solution.
Case ‘1’Case ‘2’
pH Sensor value obtained for pH 9.20 buffer solution = 8.90pH Sensor value obtained for pH 9.20 buffer solution = 8.50
Error value = 9.20 − 8.90 = 0.30Error value = 9.20 − 8.50 = 0.70
pH value obtained for water = 8.07pH value obtained for water = 7.33
Actual pH value = 8.07 + 0.30 = 8.37Actual pH value = 7.33 + 0.70 = 8.03
Actual pH value = 8.37Actual pH value = 8.03
Table 4. Sensor value of pH, water level and flow rate of the water tank.
DashboardpH SensorWater Level (cm)Flow Rate (L/min)
Dashboard ‘1′7152
Dashboard ‘2′8152
Dashboard ‘3′8202
Table 5. Nomenclature of pin configuration.
Pin Configuration in Arduino Mega 2560Connection
Pin 16: Tx2Transmitter 2 for serial communications
Pin 17: Rx2Receiver 2 for serial communication
Pin 18: Tx1Transmitter1 for serial communication
Pin 19: Rx1Receiver 1 for serial communication
Pin 11: OC1A/PCINT5Digital pin 11
Pin 12: PB6 (OC1B/PCINT6)Digital pin 12
Pin 13: PB7 OC0A/OC1C/PCINT7Digital pin 13
PF0 (ADC0)Analog pin 0
Pin configuration in Wi-Fi modemConnection
VccPower supply for Wi-Fi (3.3 V)
RxReceiver pin connecting to RX1 pin of Arduino Uno
TxTransmitter pin connecting to TX1 pin of Arduino Uno
GNDCommon ground
Pin configuration in RF modemConnection
VccPower supply for RF modem (3.3 V)
RxReceiver pin connecting to RX 2 pin, i.e., 16th pin of Arduino Uno
TxTransmitter pin connecting to TX 2 pin i.e., 17th pin of Arduino Uno
GNDCommon ground
Pin configuration in Flow sensorConnection
VccPower supply for flow sensor (+5 V)
PoPulse output connect to A0 pin of Arduino Uno
Sig OUTSignal connected to 11 pin of Arduino Uno
GNDCommon ground
Pin configuration in Ultrasonic sensorConnection
+5VPower supply to sensor
TriggerTrigger the ultrasonic sound pulses and it is connected to pin 13 of Arduino Uno
EchoPin produces a pulse when the reflected signal is received, and it is connected to pin 12 of Arduino Uno
GNDCommon ground
Pin configuration in LCDConnection
Pin 4: RSPin 7 of Arduino Uno
Pin 5: RWGnd to the Arduino Uno
Pin 6: EPin 6 of Arduino Uno
Pin 11: D 4Pin 5 of Arduino Uno
Pin 12: D 5Pin 4 of Arduino Uno
Pin 13: D 6Pin 3 of Arduino Uno
Pin 14: D 7Pin 2 of Arduino Uno
Publisher’s Note: MDPI stays neutral with regard to jurisdictional claims in published maps and institutional affiliations.

