1. Introduction
Building a resource-conserving society is important after an in-depth study of the history of the political, economic, and social development at home and abroad, in accordance with China’s social and economic development, and it is also a scientific plan for China’s future social development model. Energy saving is an important part of building a resource-saving society, and as one of the three major sectors of energy consumption, building energy consumption represents about one-third of the energy consumption of the whole society, and is the biggest potential energy-saving area [
1].
Energy revolution is the first step to build a resource-saving society, and the fundamental task of energy revolution is to change the energy structure dominated by fossil fuels into a low-carbon energy system dominated by renewable energy, so as to cope with the threat of climate change, reduce China’s external dependence on energy, and achieve sustainable energy development. Among the many renewable energy sources, solar energy is focused on because of its unique cleanliness, low cost, high efficiency, and abundant reserves [
2].
China has a vast territory, abundant solar energy resources, and huge resource potential. The maximum annual solar radiation in all regions of mainland China is 8364 MJ/m
2, the minimum is 3324 MJ/m
2, and the average is 5749 MJ/m
2; The total annual solar radiation received by the land surface of the country is about 50 × 10
18 kJ, which is equivalent to 2.4 × 10
4 million tons of standard coal, which provides a good prerequisite for the utilization of solar energy resources in the country [
3]. As a typical technology form of solar energy application, photovoltaic (PV) power generation uses the photovoltaic effect to directly convert solar radiation energy into electric energy, which is one of the most promising renewable energy technologies to realize sustainable development, and it is also a means to realize zero energy building [
4]. At the same time, PV power generation, as a solution to the increasing demand for electricity, can also minimize environmental and social problems related to fossil fuels and nuclear fuels [
5]. Driven by energy and environmental benefits, PV systems have developed rapidly in recent years, with an average annual growth rate approaching 50%, and have begun to gradually replace coal-fired power generation. With the advancement of technology and the increase in market demand, solar power generation has formed two more mature power generation models—centralized and distributed. Compared with the distributed PV power generation system, the centralized PV system has a relatively early development and mature technology, and its proportion in the cumulative installed capacity is higher than that of the distributed PV system [
6]. In 2017, the new installed capacity of China’s centralized PV power generation system reached 33.49 GW. In contrast, from 2013 to 2016, the cumulative installed capacity of the distributed PV power generation accounted for only 15% to 20% of the total PV power generation. However, in recent years, distributed PV systems have received more and more attention because of their unique advantages over remote large-scale centralized PV power plants. Its main advantages include being able to be installed on the roof near the electricity consumption area so as to obtain a lower transmission cost and power loss [
7,
8]. The new capacity of the distributed PV system increased significantly from 4.26 GW in 2016 to 19.44 GW in 2017, which shows the huge development potential of distributed systems [
9].
There are considerable solar resources on roofs, which are also convenient for the installation of PV systems. Therefore, PV roofs have become one of the main application forms of distributed PV systems. Vardimon R et al. [
10] used a complete set of GIS data covering the whole country to evaluate the available PV roof area in Israel. There are also some studies on the calculation and analysis of the roof PV power generation potential in some areas such as the United States and Austria [
11,
12]. In addition, Fina B [
13], Senatla M [
14], and Miranda R F C [
15] et al. also analyzed the economic potential of rooftop PV systems in Australia, South Africa, and Brazil, respectively. However, with the rapid development of the urban economy, land value in urban areas is getting higher and higher, and there are more high-rise buildings. For high-rise buildings in urban areas, the roof area is very limited, and the area of PV systems that can be installed is also very limited. In rural areas, because the building density is smaller than in cities, and it is mostly one-story or two-story buildings, more roof area can be used to install PV systems, so there is a greater application potential for PV systems. Especially in Xinjiang, Inner Mongolia, Qinghai, Tibet, Ningxia, Gansu, Yunnan, and remote mountainous areas, where power is scarce, power transmission costs are high, but solar energy resources are abundant and land costs are low. Moreover, with the deepening of the country’s new rural construction and PV precise poverty alleviation policies, the PV power generation industry has developed rapidly in the countryside, so these areas have great potential for installing PV power generation systems. On the other hand, because of the wide range of rural areas, the rural distribution network generally consists of a simple radiation chain structure, with a scattered power load, long distribution distance, and relatively unstable power supply quality. Using the performance characteristics of PV power generation, applying distributed PV power generation to rural areas according to local conditions can not only solve the impact of rural grid voltage instability, three-phase imbalance, and other problems, thus solving the power demand of rural users, but also promotes the high-quality development of the PV industry [
16].
China is committed to “peak carbon dioxide emissions” and “carbon neutrality” in the future. Photovoltaic is considered to be one of the main energy situations in the future. The distributed photovoltaic system combined with buildings has many advantages, and is considered to be one of the important technical solutions to achieve “peak carbon dioxide emissions” and “carbon neutrality” in the future. At present, China needs to calculate the installed capacity and power generation that can be achieved by building integrated distributed photovoltaics. In this way, the relevant institutions can develop policies to improve data support and help. Recently, a number of provinces in China have formulated the building roof photovoltaic installation plans of cities and counties [
17,
18,
19,
20,
21]. The calculation of the PV installed capacity in China’s provinces in this study can provide assistance for the implementation of the plan.
3. Calculation of PV Module Power Generation Area
3.1. The Annual Solar Radiation
Because of the vast land area in China, the solar radiation intensity also varies greatly in different regions. Therefore, in the calculation process, we first divided China into several sub regions (in each partition, the intensity of solar radiation is roughly the same) according to the annual total solar radiation level, and on this basis, the installed capacity and annual power generation of PV modules in each zone were calculated. In the process of regional division, we first divided different provinces into different regions, and then divided each province into several regions with different radiation levels according to the difference of total solar radiation in each province. The annual solar radiation intensity of typical cities in each radiation area was selected as the annual total radiation calculation data of the whole area.
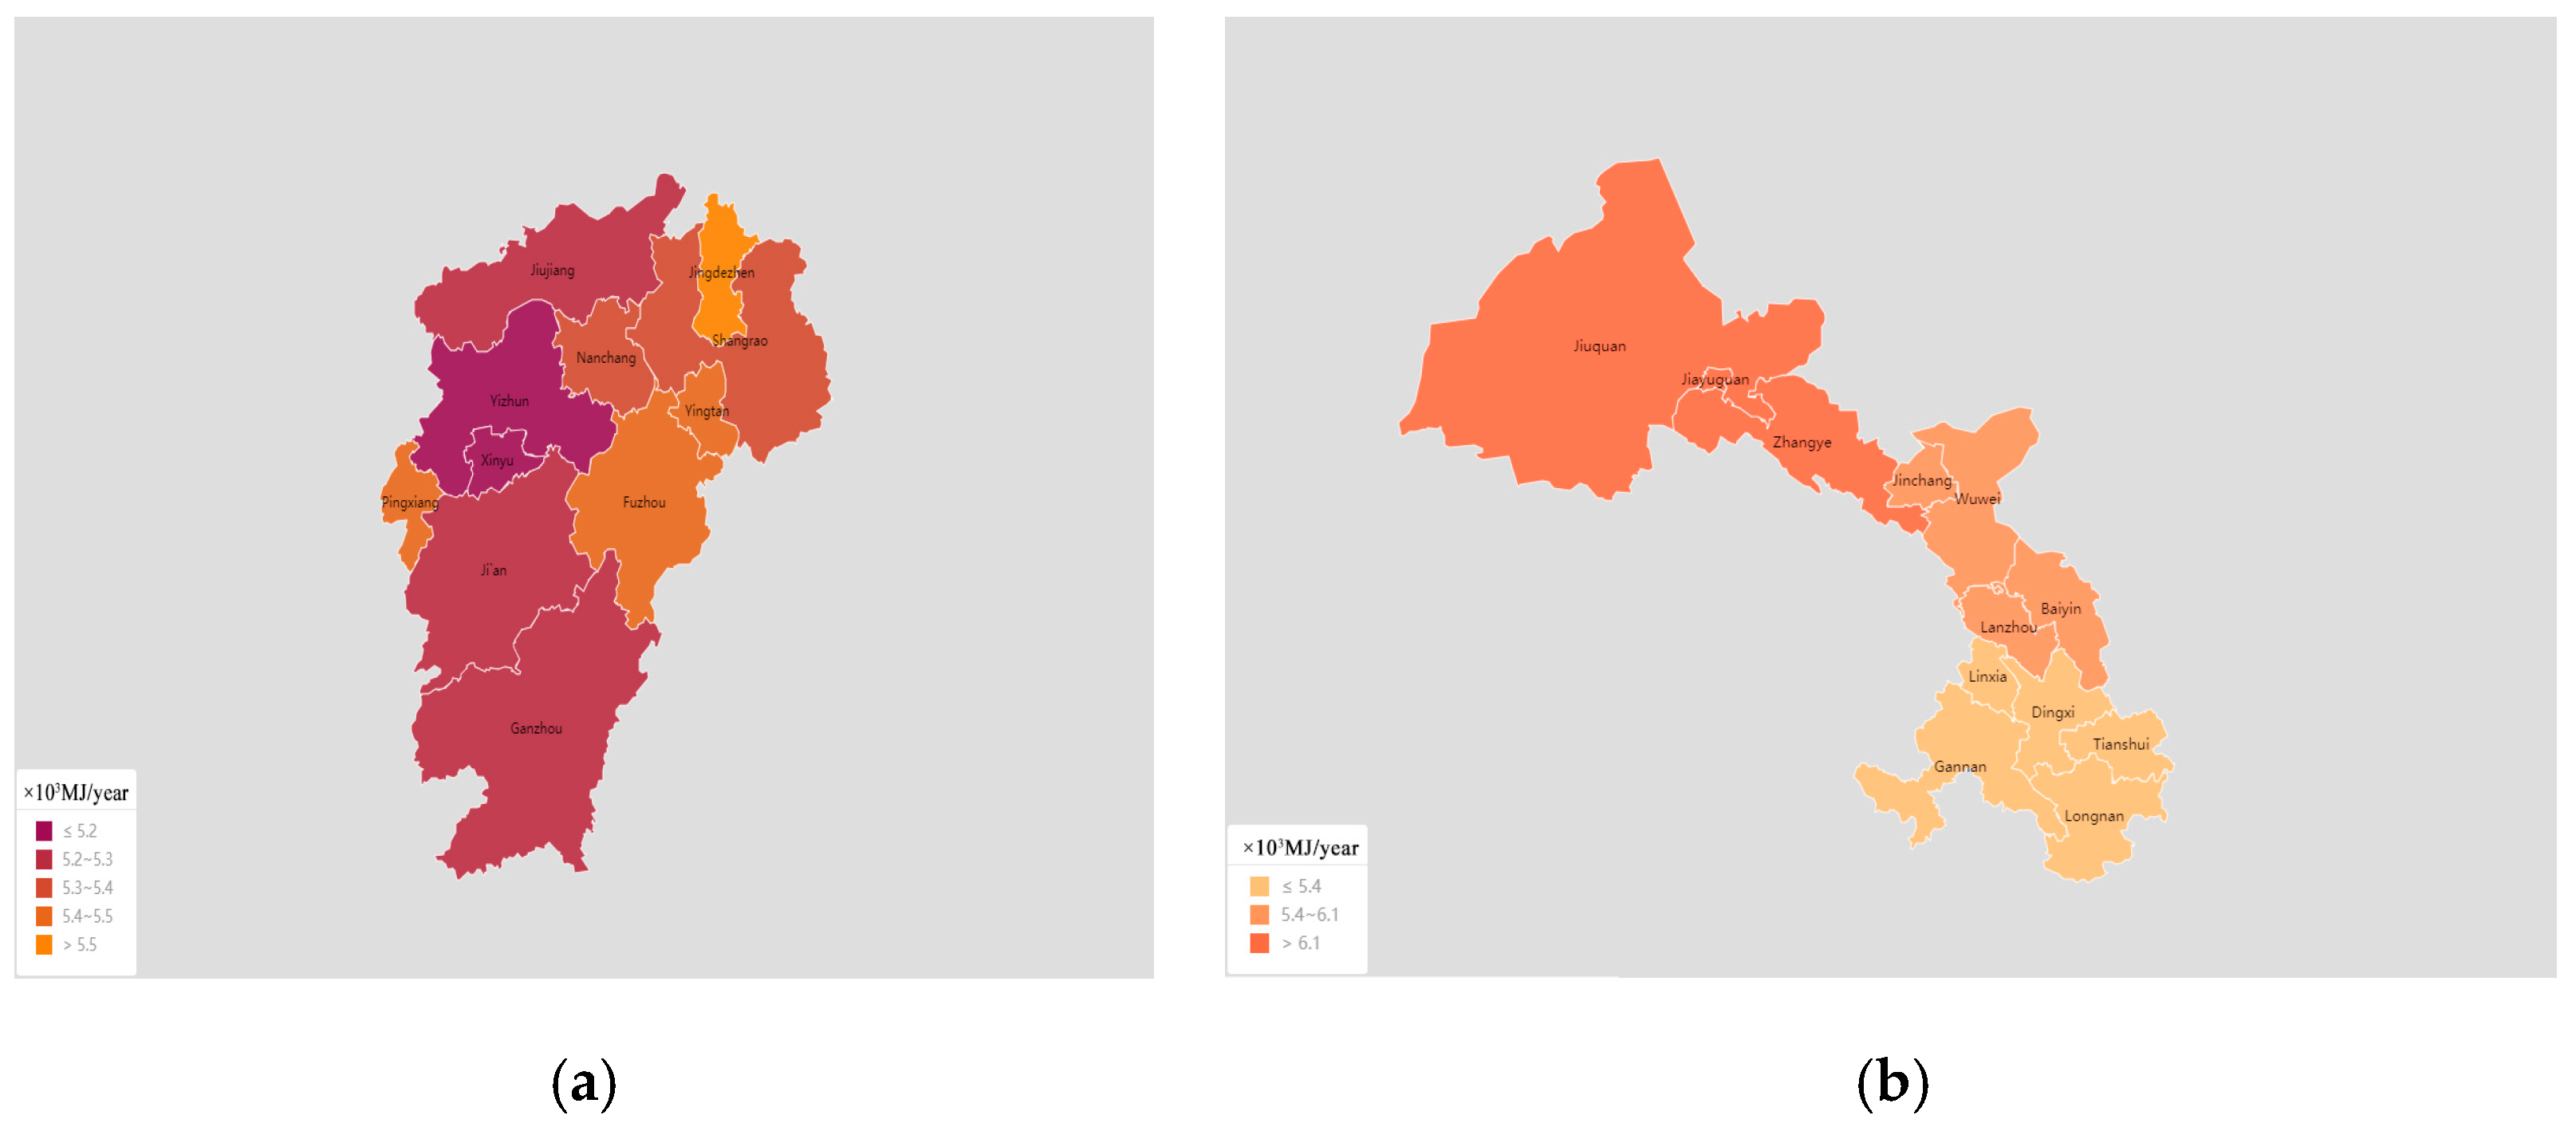
As shown in
Figure 2, taking Jiangxi Province and Gansu Province as examples, there was no significant difference in the solar radiation intensity of each city in Jiangxi Province. The annual solar radiation amount was about 5400 MJ/m
2. Therefore, as an irradiated area, Jiangxi Province was no longer divided internally, and Ganzhou was taken as a typical city for calculation. In addition, the solar radiation resources in Gansu Province could be roughly divided into the following three areas: rich area, relatively rich area, and available area. The solar-rich areas included Jiuquan, Zhangye, and Jiayuguan in the Hexi corridor. The total annual solar radiation of the whole area is more than 6100 MJ/m
2, and the solar energy resources are stable. Jiuquan is regarded as a typical city in this area; solar energy resources are relatively rich in certain areas, including Jinchang, Wuwei, Minqin, Gulang, Tianzhu, Jingyuan, Jingtai, and Dingxi, Lanzhou, and Linxia. The total annual solar radiation in this area was between 5400~6100 MJ/m
2, and Minqin was selected as a typical city. The available areas included Tianshui, Longnan, and Gannan. The total solar radiation was between 4700~5400 MJ/m
2. Lanzhou City was used as a typical city in this area.
The annual total solar radiation data for each typical city came from the China Meteorological Data Network, and the main data come from the “Daily Data Set of Meteorological Radiation Basic Elements in China”. The observation data collected in this data set include total radiation, scattered radiation, direct radiation, and net total radiation. The data used in this paper are the annual total radiation data of the radiation measurement stations in typical cities of each province, with the unit of MJ/m2.
3.2. The Rural Building Footprint Area
Rural buildings in mainland China are generally low in height, coupled with the surrounding environment’s shielding effect, resulting in a low income from installing distributed PV systems on the facade. Therefore, this calculation only considers the roof of the building as the best installation area for the distributed PV system. The calculation of the building roof area (BFA) needs to use rural building area (BA) data, which mainly comes from the sum of “township housing area at the end of the year” and “village housing area at the end of the year” in the “Statistical Yearbook of Urban and Rural Construction in China”.
After obtaining the rural building area data, Formula (1) can be used to calculate the roof area of rural buildings in various regions.
where
f is the average number of floors. In order to obtain data on the average number of floors in each area, we conducted relevant investigations and studies, the survey results show that the existing rural buildings in various regions of mainland China are mostly one- to three-story independent buildings. The average number of floors is greatly affected by the level of local economic development; the average number of floors in areas with higher economic levels is larger. Therefore, we divided the mainland into three categories based on the current economic development.
(1) Economically developed provinces: mainly including Beijing, Shanghai, Chongqing, Tianjin, Jiangsu, Zhejiang, Shandong, and Guangdong. Most of these buildings are not less than two floors, mainly two floors, so f = 2.
(2) Medium economic areas: Heilongjiang, Jilin, Liaoning, Hebei, Shanxi, Sichuan, Hubei, Anhui, Fujian, Henan, Hunan, Hainan, Guangxi, Jiangxi, Shaanxi, and Yunnan. These provinces have a medium economy, with slightly more two-story buildings than one story buildings, so f = 1.6;
(3) Poorer economic areas: Qinghai, Ningxia, Gansu, Guizhou, Xinjiang, Tibet, and Inner Mongolia. The rural buildings are mainly on the first floor, while the second and third floors are relatively less frequent, so f = 1.2.
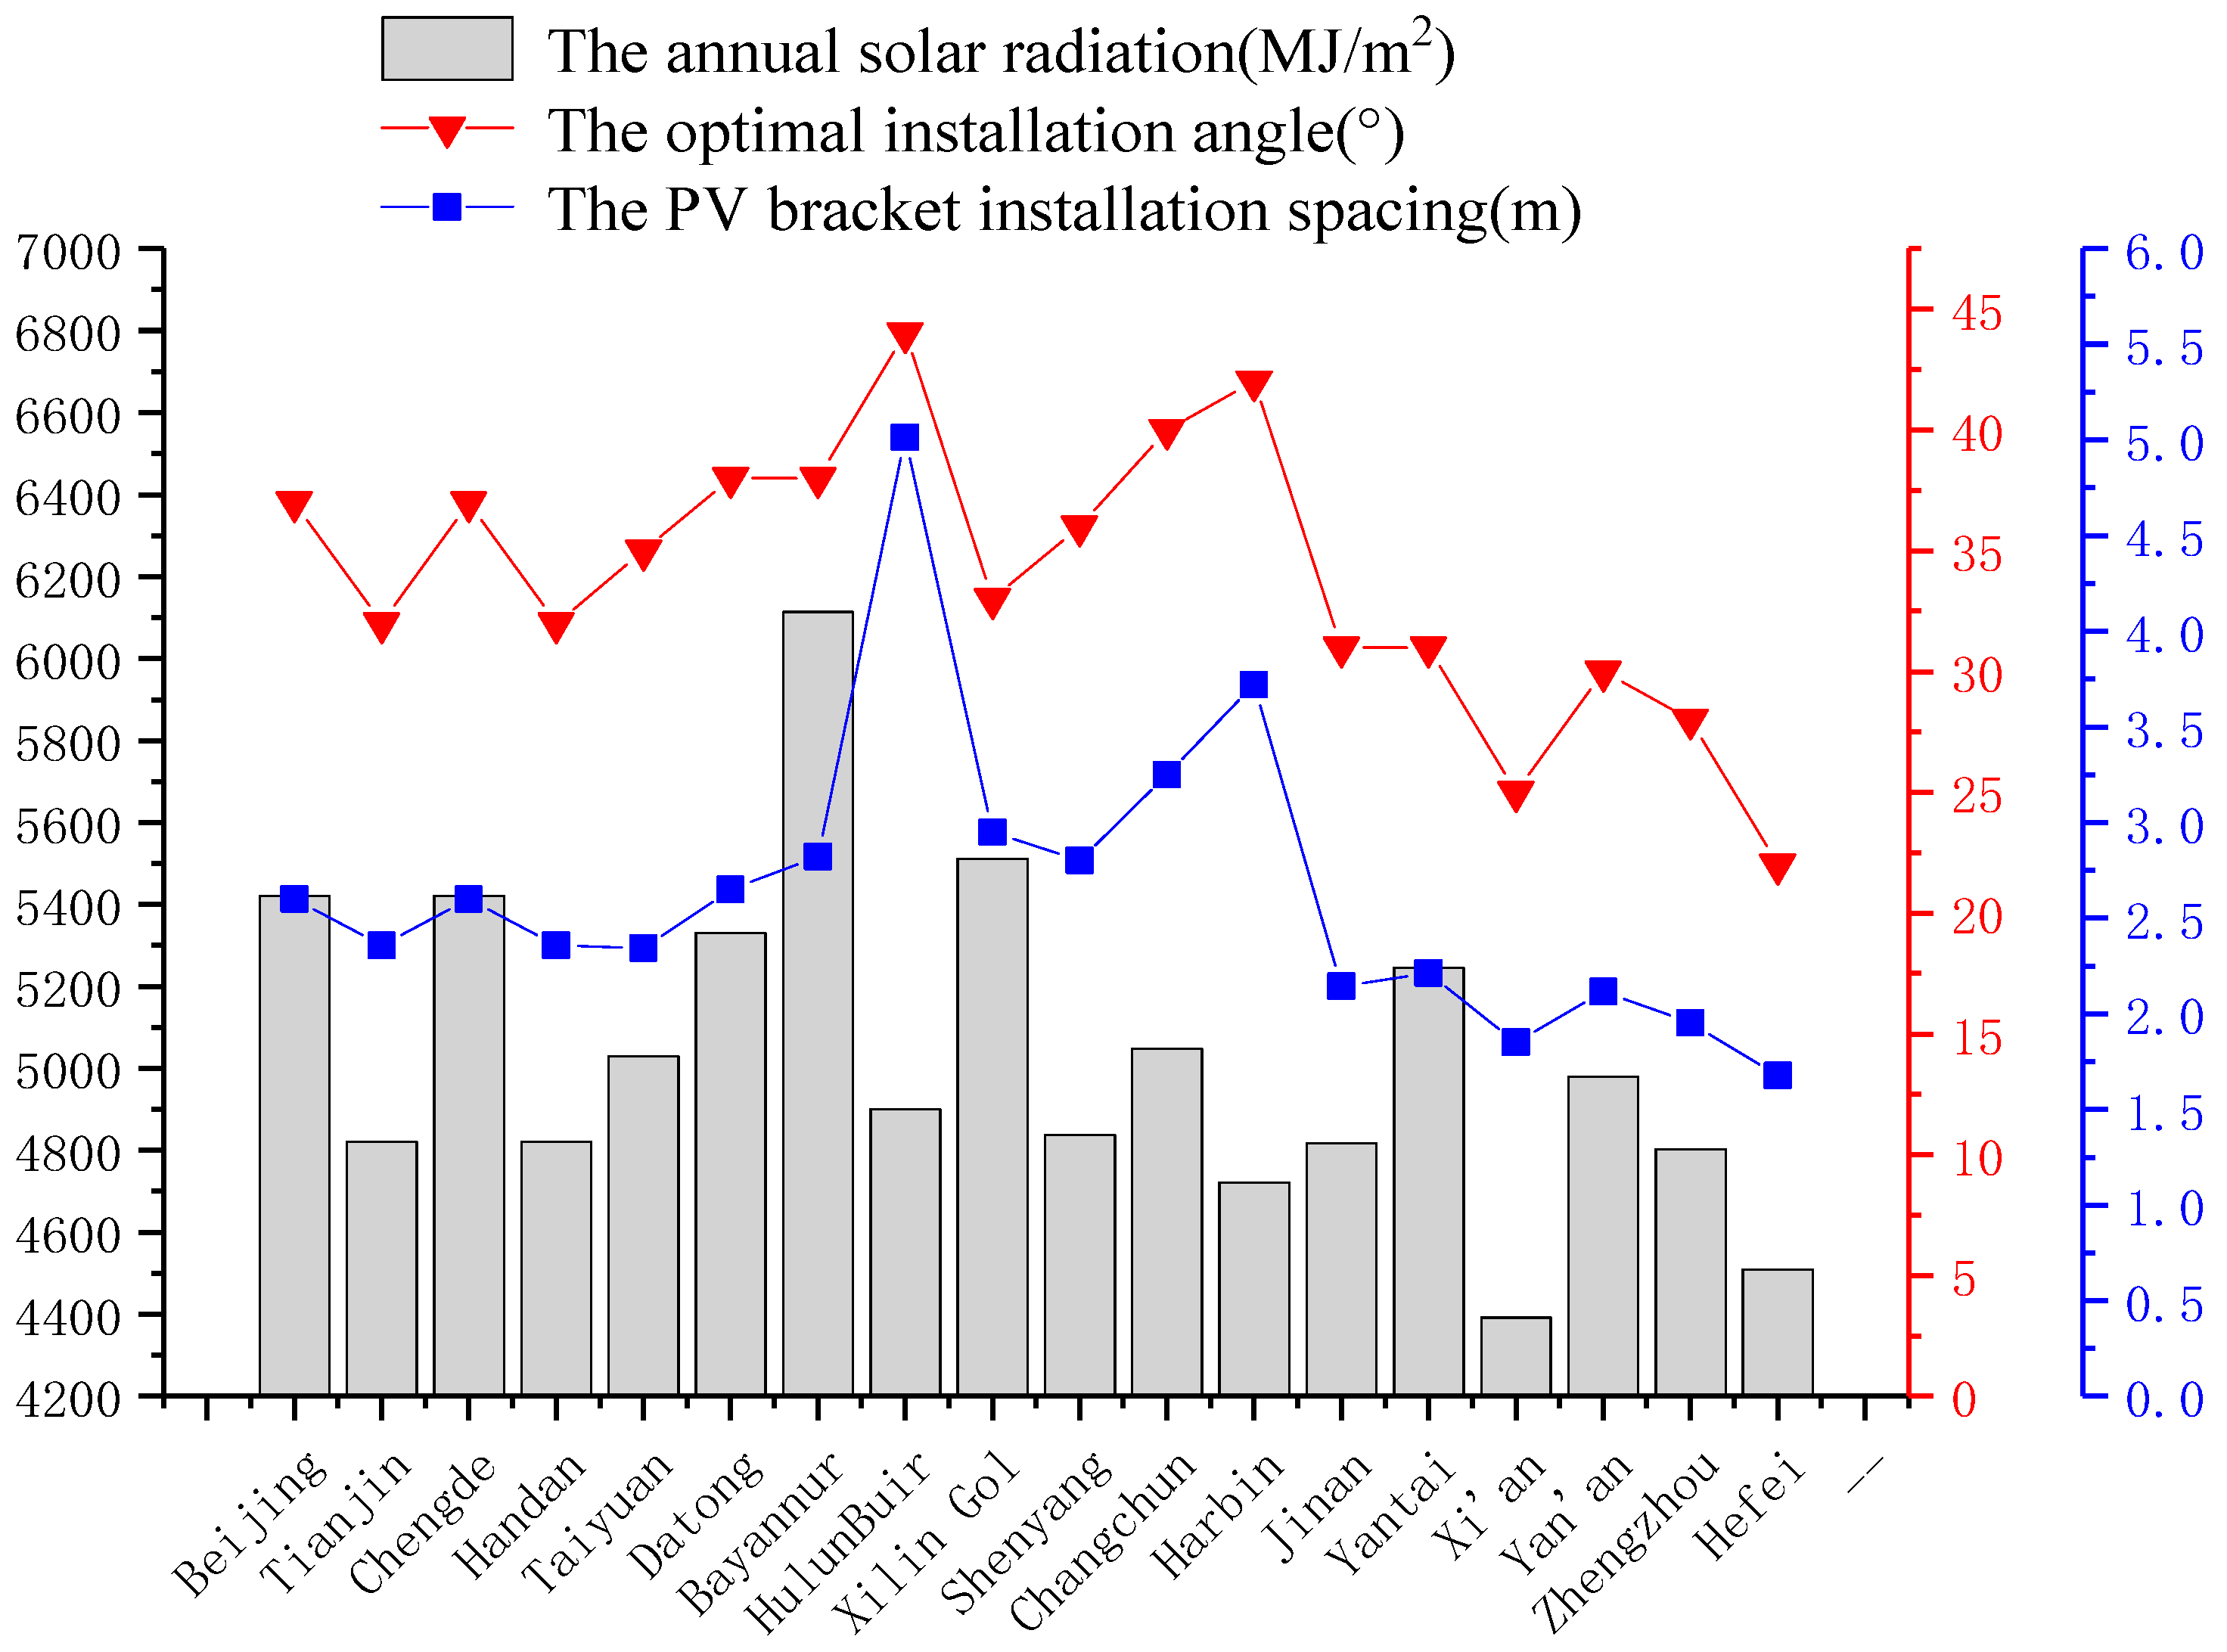
3.3. The Optimal Installation Angle of PV Module
Affected by cultural customs, climate, and other factors, the architectural styles of rural residential buildings in different regions of China are also different. From the perspective of the roof form, rural residential buildings can be divided into two categories: flat roof and sloping roof. For all of the provinces in China, the rural residential buildings in Henan, Anhui, Shanxi, and other northern provinces, considering the factors of water storage, the roofs are mostly flat roofs, while in Jiangsu, Zhejiang, Guangdong, and other southern provinces, due to the large amount of precipitation, in order to facilitate drainage, rural residential buildings mostly adopt a slope roof. As there are fewer sloping roofs in rural buildings in the northern provinces and less flat roofs in rural buildings in southern provinces, this work did not consider these as part of the buildings; that is, we assumed that all the residential buildings in the northern rural areas were flat roofs, while all the residential buildings in the southern rural areas were sloping roofs.
As the power output of the PV module increases with the increase in the direct sunlight intensity, when installing the PV module on a flat roof, we aimed to get the maximum amount of direct sunlight on the PV panel. There are three main installation methods for PV panels on flat roofs: horizontal installation, fixed angle installation, and tracking PV. Among them, the tracking PV can automatically adjust the height angle and azimuth angle as the sun moves, so as to increase the amount of solar radiation received, thereby increasing the amount of power generated; this method gets the most solar energy among the three installation methods. However, because of the high investment cost in the early stages and the need for certain maintenance in the later stage, the same installation capacity requires more floor space, and the cost-effectiveness is lower for large-scale installation, so this study did not consider this type of installation. The solar energy of fixed bracket installation is less than that of tracking PV, and its price is low, the structure is stable, and it is basically maintenance-free. It can also get more solar energy than horizontal installation when installed at the optimal installation angle, which is very suitable for use in rural areas. The most important thing for the fixed bracket installation to obtain the maximum solar radiation is to determine the optimal installation angle and bracket spacing in different regions. This section mainly describes the calculation of the best inclination.
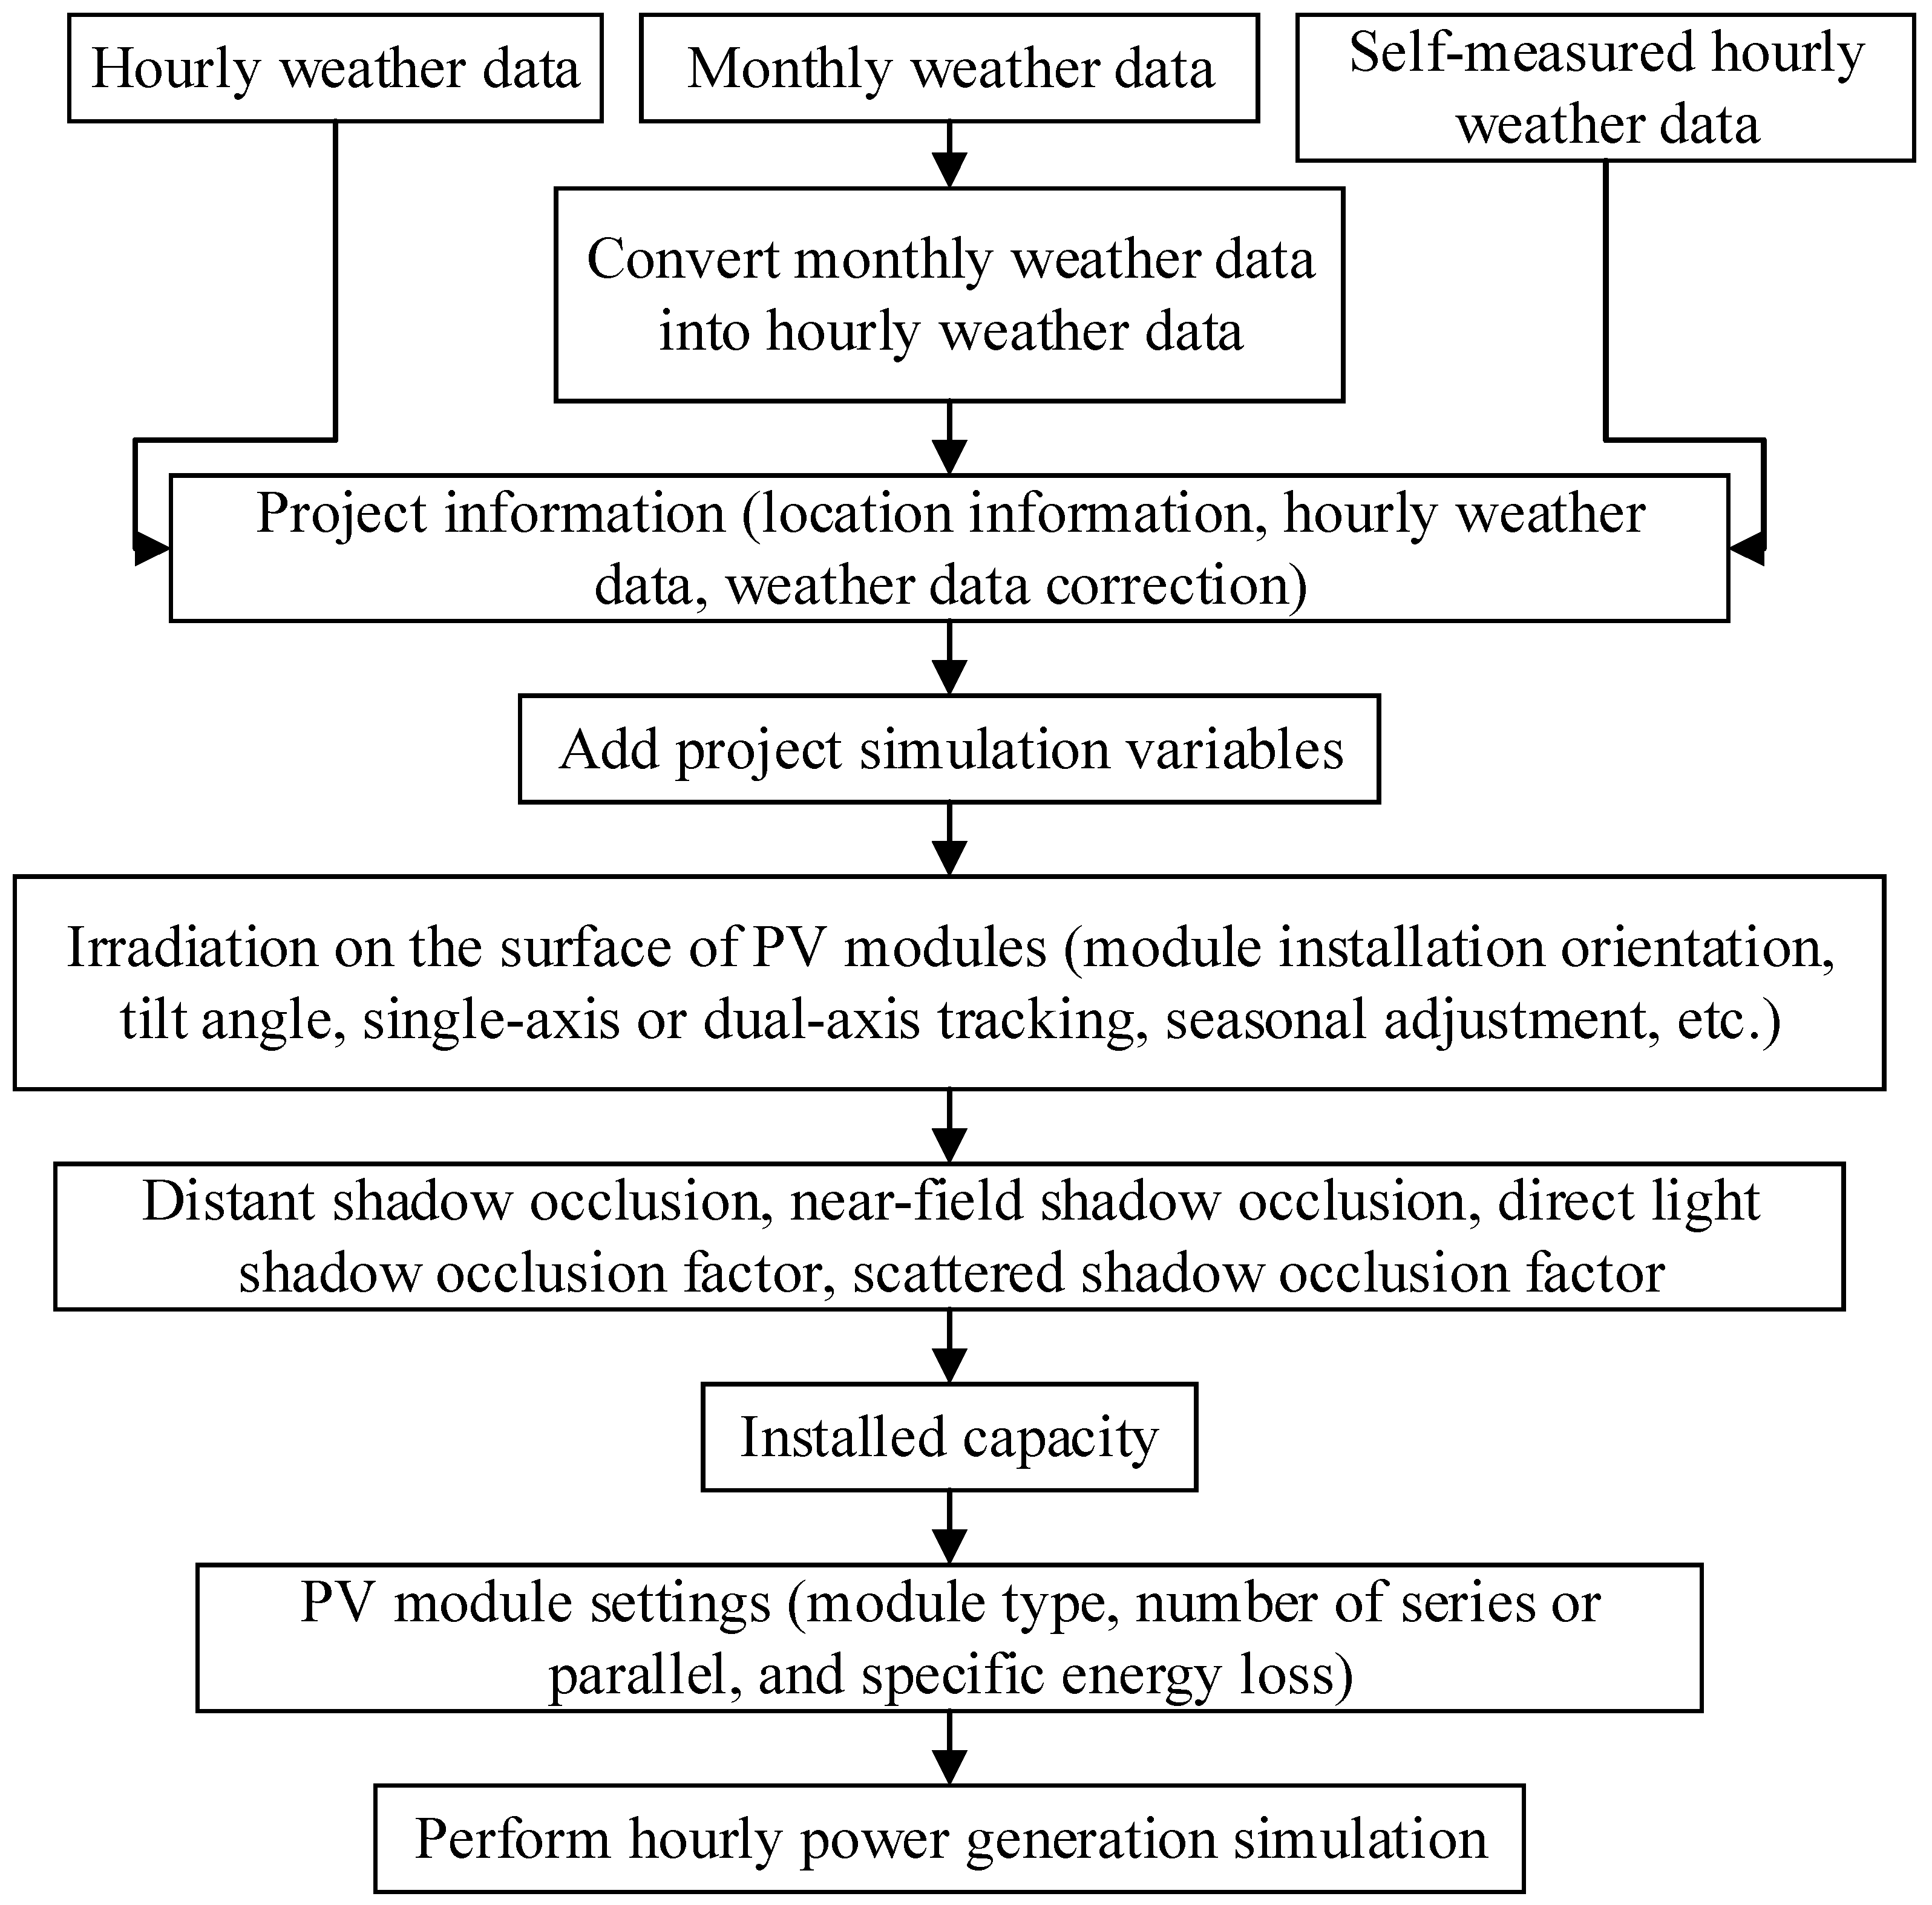
The determination of the optimal inclination angle is generally obtained by comparing the annual total power generation of the PV module at different inclination angles, and the inclination corresponding to the maximum annual power generation is the optimal installation angle of the PV modules in this region. There are generally two methods for calculating the amount of power generated—experimental measurement and simulation calculation. Because of the difficulty conducting experimental measurements in different regions and the longer time period, we used the method of simulation calculation. The specific calculation steps are as follows:
(1) Calculate the hourly plane-of-array (POA) solar irradiance from the horizontal irradiance, latitude, longitude, and time in the solar resource data, and from the array type, tilt, and azimuth inputs.
(2) Calculate the effective POA irradiance to account for reflective losses from the module cover, depending on the solar incidence angle.
(3) Calculate the cell temperature based on the array type, POA irradiance, wind speed, and ambient temperature. The cell temperature model assumes a module height of 5 meters above the ground and an installed nominal operating cell temperature (INOCT) of 49 °C for the fixed roof mount option, and of 45 °C for the other array type options.
(4) Calculate the array’s DC output from a DC system size at a reference POA irradiance of 1000 W/m2, and the calculated cell temperature, assuming a reference cell temperature of 25 °C, and temperature coefficient of power of −0.35%/°C for the premium type.
(5) Calculate the system’s AC output from the calculated DC output and system losses and nominal inverter efficiency input (96% by default) with a part-load inverter efficiency adjustment derived from empirical measurements of the inverter performance.
The Chinese meteorological data were taken from The ASHRAE International Weather for Energy Calculations Version 1.1 (IWEC) and the Solar and Wind Energy Resource Assessment Program (SWERA). The solar radiation data were taken from the “typical year” solar radiation values in these databases. We combined the solar resource data of the selected location with the 30-year historical temperature and wind speed data of the nearest weather station, the characteristics of the solar panel, and the direction of the solar panel relative to the sun.
In addition, the corresponding assumptions needed to be made before the calculation [
22]: for a 10 kW high-quality crystalline silicon solar PV panel with a photoelectric conversion efficiency of 19%, the temperature coefficient was −0.0035/°C and the efficiency loss was 10%, and we assumed that all panels were facing south with an azimuth of 180°. Based on this assumption and combined with the meteorological data, the annual power generation of the system could be calculated preliminarily. After that, the annual power generation capacity under different inclination angles was compared to obtain the optimal installation angle.
In addition, it should be pointed out that this method could only be used in the preliminary design, but it had a high reliability to determine the optimal installation angle of the PV modules.
3.4. The PV Bracket Installation Spacing
When the PV module is installed on the sloped roof, it should be installed parallel to the inclined roof. For PV modules installed at a fixed angle on a flat roof, it is necessary to determine the spacing between each row of the PV modules, because the power generation of the PV modules will be affected by the self-shadow effect, the self-shadow effect is caused by the previous row of PV modules, and is applicable to all PV modules except the first row. If the installation distance of the PV bracket is too small, the PV module cannot be fully applied because of the self-shadow effect, resulting in a waste of PV modules. However, if the distance is too large, the available roof area will be wasted, so we need to balance these two aspects and choose an optimal installation distance for the PV bracket.
In the Northern Hemisphere, the solar elevation angle is the lowest and the solar radiation is the smallest during the solstice day; at this time, if the system is required to have no self-shadow effect, theoretical maximum array spacing is required. On the day of the summer solstice, the solar altitude angle is the highest, and the solar radiation is at its maximum value; at this time, the theoretical minimum distance is calculated. In this study, in order to calculate a more conservative power generation value, the maximum array spacing was used, that is, the component spacing was greater than the maximum length of the shadow at 09:00 a.m. and 15:00 p.m. on the winter solstice. As long as no occlusion occurs during this period, there will be no occlusion within the solar module’s optimal utilization range of solar radiation during the year.
The schematic diagram for calculating the array spacing is shown in
Figure 3.
In
Figure 3,
D is the distance between the two rows of brackets. The distance between the PV arrays or the vertical distance between the shield and the bottom of the array should not be less than
D. The calculation formula for the array spacing
D is as follows:
where
L is the length of the slope of the PV module. At present, most crystalline silicon PV modules on the market have a width of about one meter, so the value of
L here is 1 m;
β is the installation angle of the PV modules, using the optimal installation angle calculated from
Section 3.3;
ψ is the latitude of the location of the PV array;
δ is the solar declination on the winter solstice,
δ = −23.5°; and
ω is the hour angle, and the corresponding
ω values at 09:00 a.m. and 15:00 p.m. are 45° and −45°, respectively. The PV array spacing calculated according to the above formula is shown in
Figure 4.
3.5. Availability Factor
In order to obtain the effective PV-available roof area (
PVA) in China, from the rural building footprint area (
BFA), we defined the availability factor
as the ratio of the effective area of solar PV panels installed on the roof to the total building footprint area.
The availability factor was introduced because under the influence of various factors, the entire roof area cannot be fully used to install PV systems. The main influencing factors are as follows.
(1) Shadows caused by nearby buildings, trees, or some other structures of the roof itself.
(2) The roof area is used for other purposes, such as other household facilities installed on the roof, such as air-conditioning external units.
(3) Part of the area needs to be reserved for the inspection and maintenance of the PV modules by the staff.
Cheng-Dar Yue et al. [
23] evaluated the solar energy potential of Taiwan Province based on the land use situation, and used the value of coefficient
as 0.4–0.5 in this evaluation process. This value was based on the solar energy building experience rule of the Building Integrated PV (BIPV) potential calculation, and the applicability of the building and solar energy was considered. The suitability of the building included corrections due to construction (HVAC, elevators, terraces, etc.), historical factors, shadow effects, and available surfaces for other purposes. Scartezzini, J et al. [
24] set the average value of the availability factor to 0.723 when evaluating the solar energy potential in the urban environment of Europe. J. Ordonez et al. used the sampling, analysis. and then mapping of the whole city method when analyzing the solar capacity of residential roofs in Andalusia (Spain), and set the availability factor of flat roofs in residential buildings to 0.796 and the usability coefficient of the sloped roof houses to 0.983 [
25].
As the object of this study was rural buildings and the above-mentioned studies were all aimed at urban buildings, the values of the available coefficients is also different. Compared with the urban buildings, the high-rise buildings in the rural area are relatively less, so the probability of shadow shading is also small, and the proportion of equipment installed on the roof of rural residential buildings is also low, so there is a more complete space for setting up PV systems. Therefore, in the case of a reasonable arrangement of the PV system, it is only necessary to focus on the third influencing factor above, that is, to reserve part of the area for the inspection and maintenance of the PV modules by the staff. Combined with the values of the available factors in the other studies, for conservative calculations, the availability factor of flat roof buildings in the northern provinces was taken as 0.8, and the availability factor of the southern slope roof buildings was taken as 0.9.
3.6. The Panel Loss Factor
The panel loss of the solar PV module refers to the part where the surface area of the module cannot be fully used to receive solar radiation because of surface contamination, wiring, nameplates, etc., so the area of the PV module’s power generation area is relatively reduced.
The panel loss factor is 1 minus panel loss (expressed as a fraction), assuming that panel losses (excluding transmission and distribution losses) include contamination (2%), mismatch (2%), wiring (2%), connections (0.5%), light-induced degradation (1.5%), shielding of the nameplate (1%), availability (0.5%), and shading (0.5%).
Then, the panel loss factor is as follows:
3.7. Area of PV Modules That Can Generate Electricity
3.7.1. In the Northern Province
For flat roof buildings in rural areas in the northern provinces, the formula for the area of PV modules that can be installed to generate electricity is as follows:
where
BFA is the floor area of the building;
D is the calculated spacing of the PV array; and
L is the width of the installed PV module, which is 1 m.
and
are the availability factor and the panel loss factor, respectively.
3.7.2. In the Southern Provinces
For rural residential buildings in the southern provinces of China, because of the large amount of precipitation in these provinces, in order to facilitate building drainage, the roof forms are mostly sloped roofs, and for such buildings, PV modules should be installed at an angle parallel to the roof. As the slope of the pitched roof varies from 30° to 45°, in order to obtain more conservative data, it was assumed that the slope of all pitched roofs was 30°. Moreover, only installing PV modules in the south, southeast, southwest, east, and west directions of the sloping roof could obtain greater benefits. Therefore, only one side of the slope roof was taken as the installable area of the PV module in this calculation, that is, the area conversion factor. Therefore, the formula for calculating the area of PV modules that can be installed to generate electricity on the sloped roof buildings in southern provinces is as follows:
where
θ is the slope of the pitched roof,
θ = 30°;
is the area conversion factor of the buildings in southern provinces,
; and
and
are the availability factor and the panel loss factor, respectively.
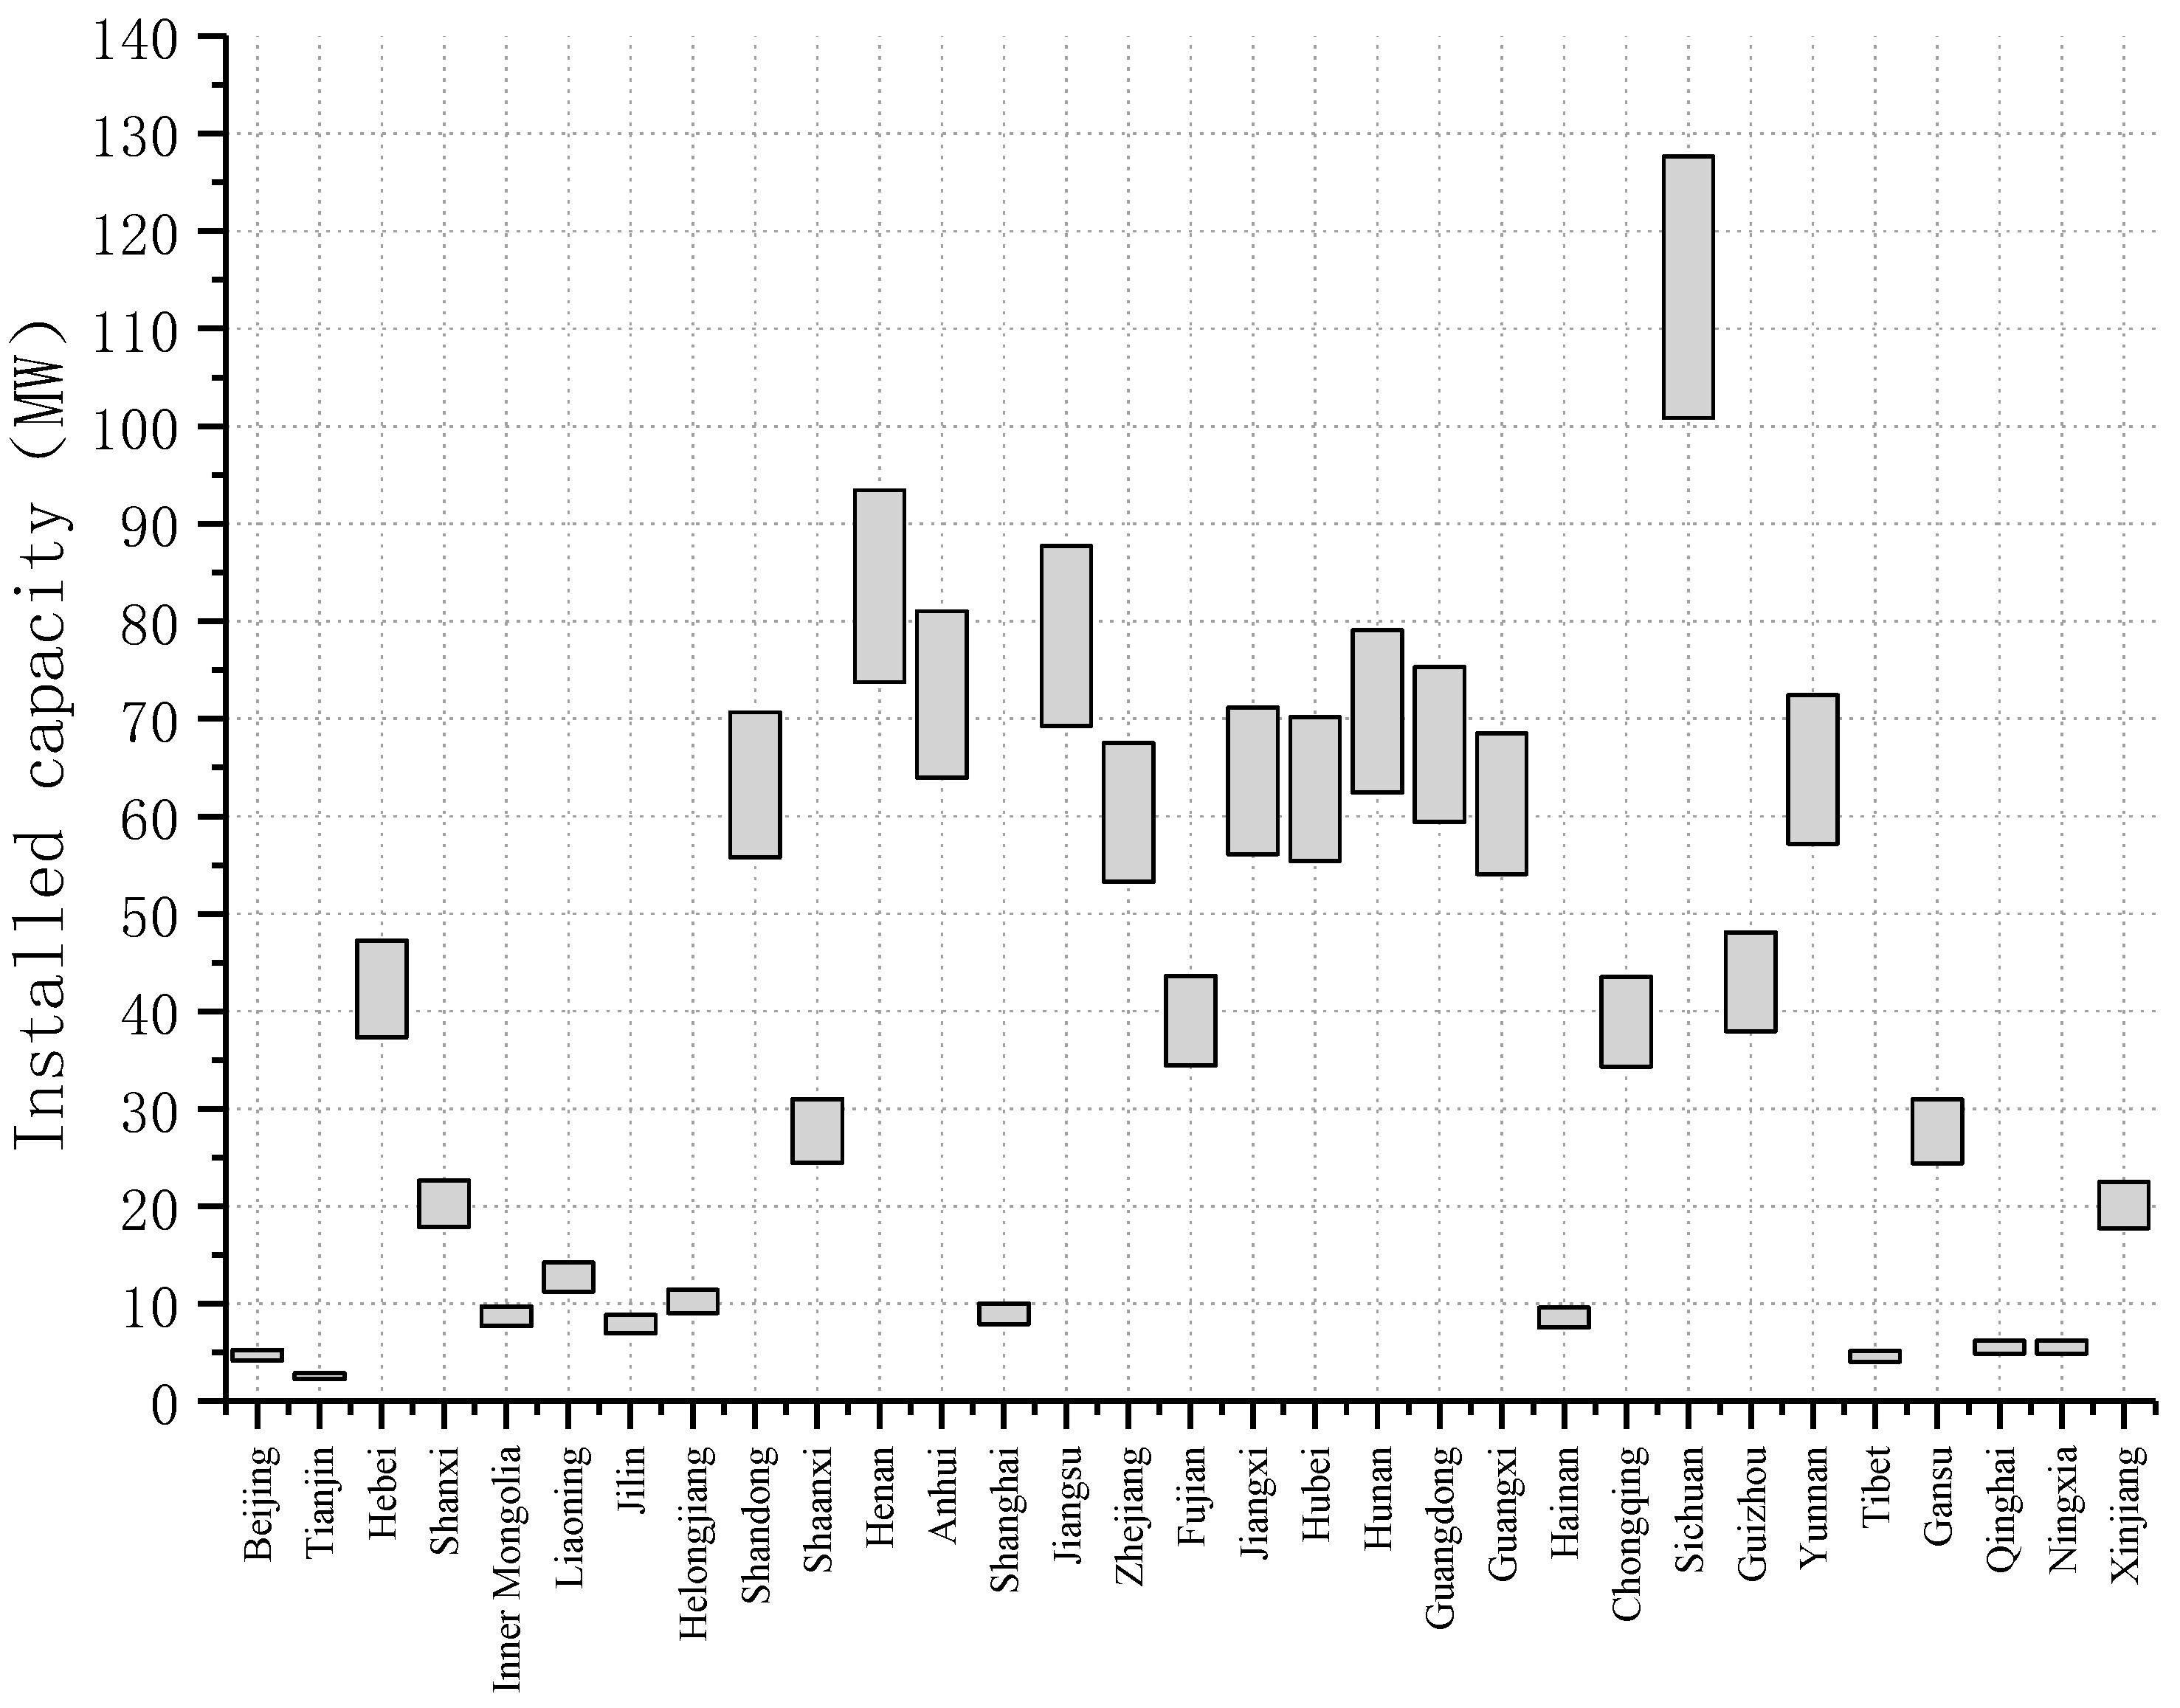
Table 1 shows the Solar irradiance intensity, optimum installation angle,
BA (building area), and
BFA of typical cities in China, and obtains the calculation results of area of PV modules that can generate electricity (
Ag) of typical cities.
5. Economic Feasibility Analysis
Since 2013, China has implemented a net measurement policy to encourage residential users install distributed PV systems; under this policy, the electricity generated by the distributed PV system can be used not only by the users themselves, but can also be sold to the power grid. A typical distributed PV system is mainly composed of five parts: PV modules, batteries, electrical loads, inverters, and power grid. The PV module converts the solar energy irradiated on its surface into electrical energy, and then the electrical energy can be stored in the battery or be directly supplied to the inverter, and the inverter converts DC power to AC power to meet the user’s power needs. In addition, the connection of distributed PV systems to the grid not only means that excess electricity can be sold to the grid for profit, but the grid can also provide users with electrical support [
28].
5.1. Cost Calculation of PV System
In this study, the monetary unit used in the analysis of the economy was RMB yuan.
PV modules are one of the key parts of a distributed PV system, which directly affects the operation and power generation costs of the system. In the past ten years, with the rapid development of the PV industry and the continuous expansion of the production scale, the capital cost of PV modules in China dropped from 7.4 yuan/W in 2012 to 1.75 yuan/W in 2019. In addition to PV modules, inverters and batteries are also an indispensable part of distributed PV systems.
Table 2 is the current economic data and main technical characteristics of the relevant components of PV systems [
28,
29]. The cost of other PV system components not mentioned in
Table 2 (wires, control system, and renovation costs, etc.) are not included in the cost analysis in this research. On the whole, the current cost of inverters and batteries in China is about 500 to 1000 yuan, which is still slowly decreasing.
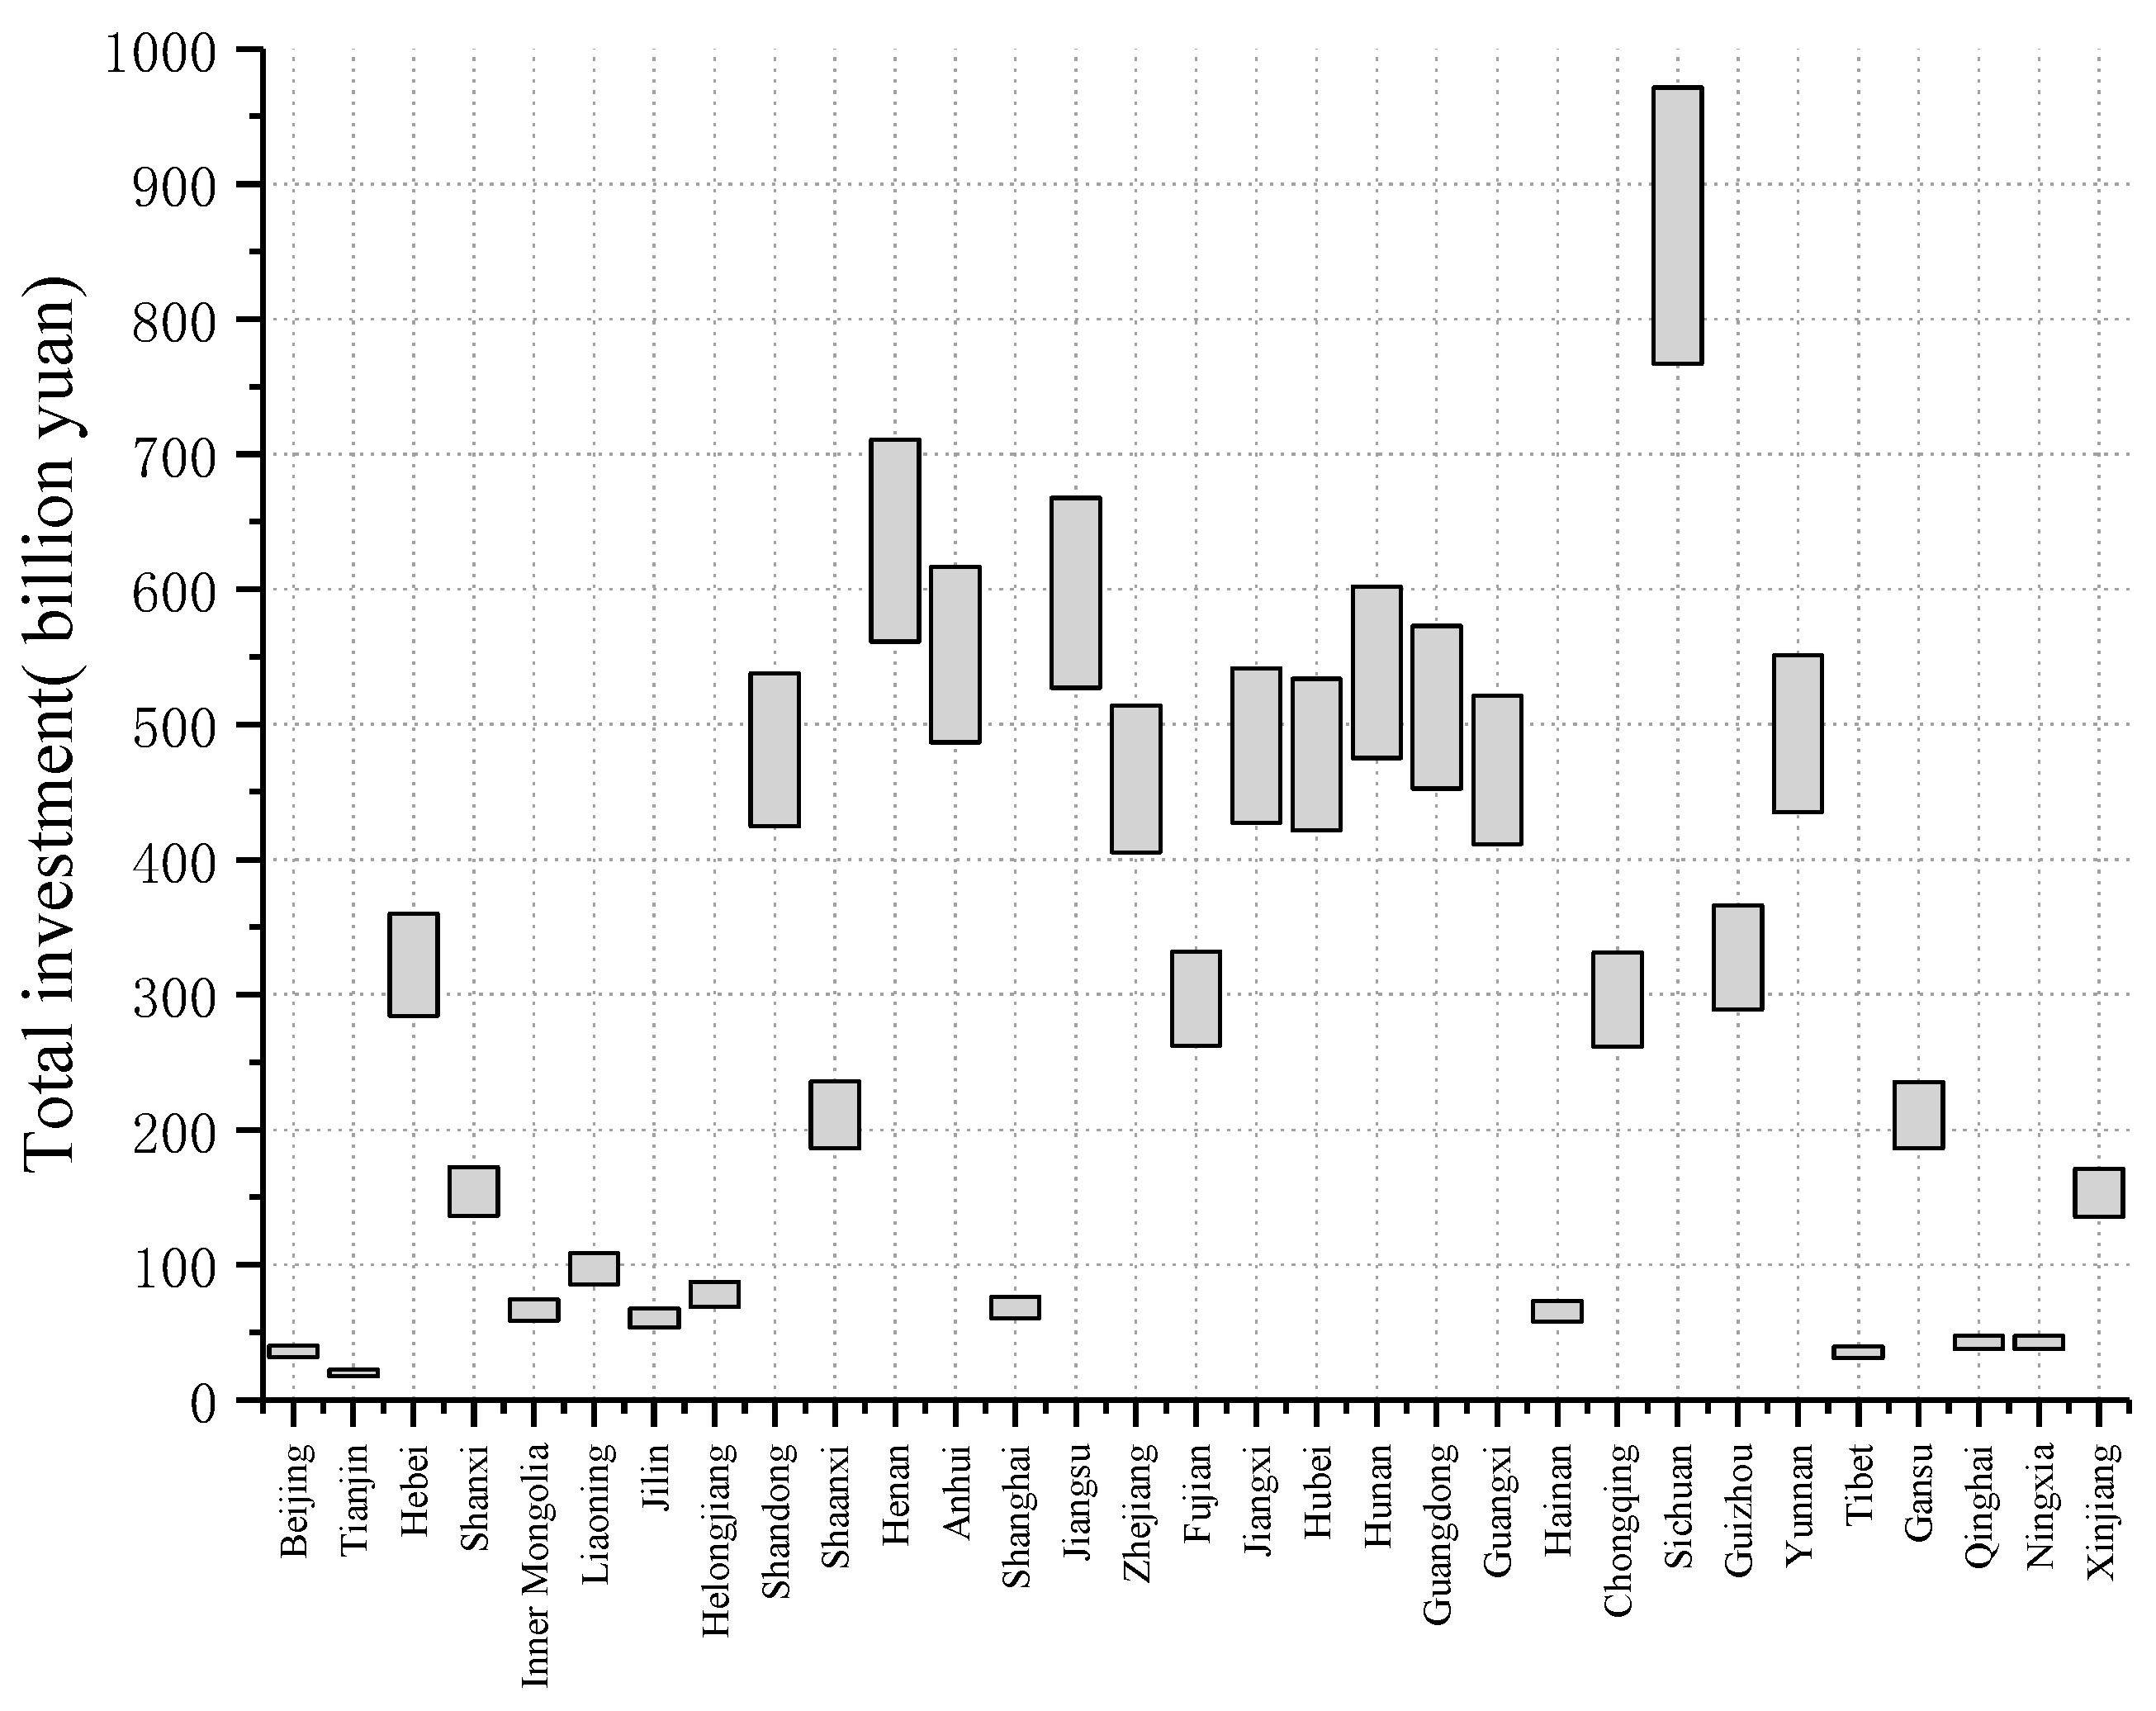
As the design service life of the PV system of this project is 25 years, in addition to the initial investment, the replacement cost of batteries and inverters should also be added when calculating the total investment cost. For example, if the service life of the battery is 5 years, the battery needs to be replaced every five years. With economic development and the popularization of the PV industry, the cost of the battery and other related equipment will be reduced accordingly; assuming that the cost of the battery is reduced by 10% every five years, the total cost of the battery in 25 years will be 2457 yuan/kW, and assuming that the inverter price is reduced by 20% after 15 years, the total cost of the inverter will be 1350 yuan/kW. Based on comprehensive calculations, the total fixed investment cost of the PV system for 25 years of operation will be 5557 yuan/kW, and the fixed operation and maintenance cost will be 35.66 yuan/kW∙ year. On this basis, the initial investment cost and operation and maintenance costs of distributed PV systems in each province were calculated, and the results are shown in
Figure 8.
5.2. The Benefit Analysis
If the PV module is installed on the roof of the building, because of the heat absorption of the module, the temperature in the roof and indoors can be reduced by 3–5 °C when the temperature is high in summer, achieving the effects of thermal insulation, energy saving, and emission reduction. On rainy days, PV modules can also buffer the impact of rain, effectively reducing the noise generated by rain on the roof. At the same time, it can also resist the direct rays of the ultraviolet rays on the roof and prolong the service life of the roof. In addition, users who install distributed PV systems will also receive some economic benefits.
Since the implementation of the net measurement policy in China in 2013, in addition to saving part of the electricity costs, residential users who invest in the construction of distributed PV systems can also benefit from two aspects, these are the government subsidies for distributed PV system power generation and the proceeds from the sale of surplus electricity to the State Grid, separately. In 2013, the Chinese government implemented a net measurement subsidy of 0.42 yuan/kWh for distributed PV power generation; after that, with the decline of PV power generation costs and the rapid development of the PV industry, the net metering subsidy was reduced to 0.37 yuan/kWh in 2018. In addition, the Chinese government requires grid companies to purchase renewable energy power according to the local benchmark feed-in tariff. Therefore, users of distributed PV systems can also sell excess power to the grid and make a profit from it; this is the second source of revenue [
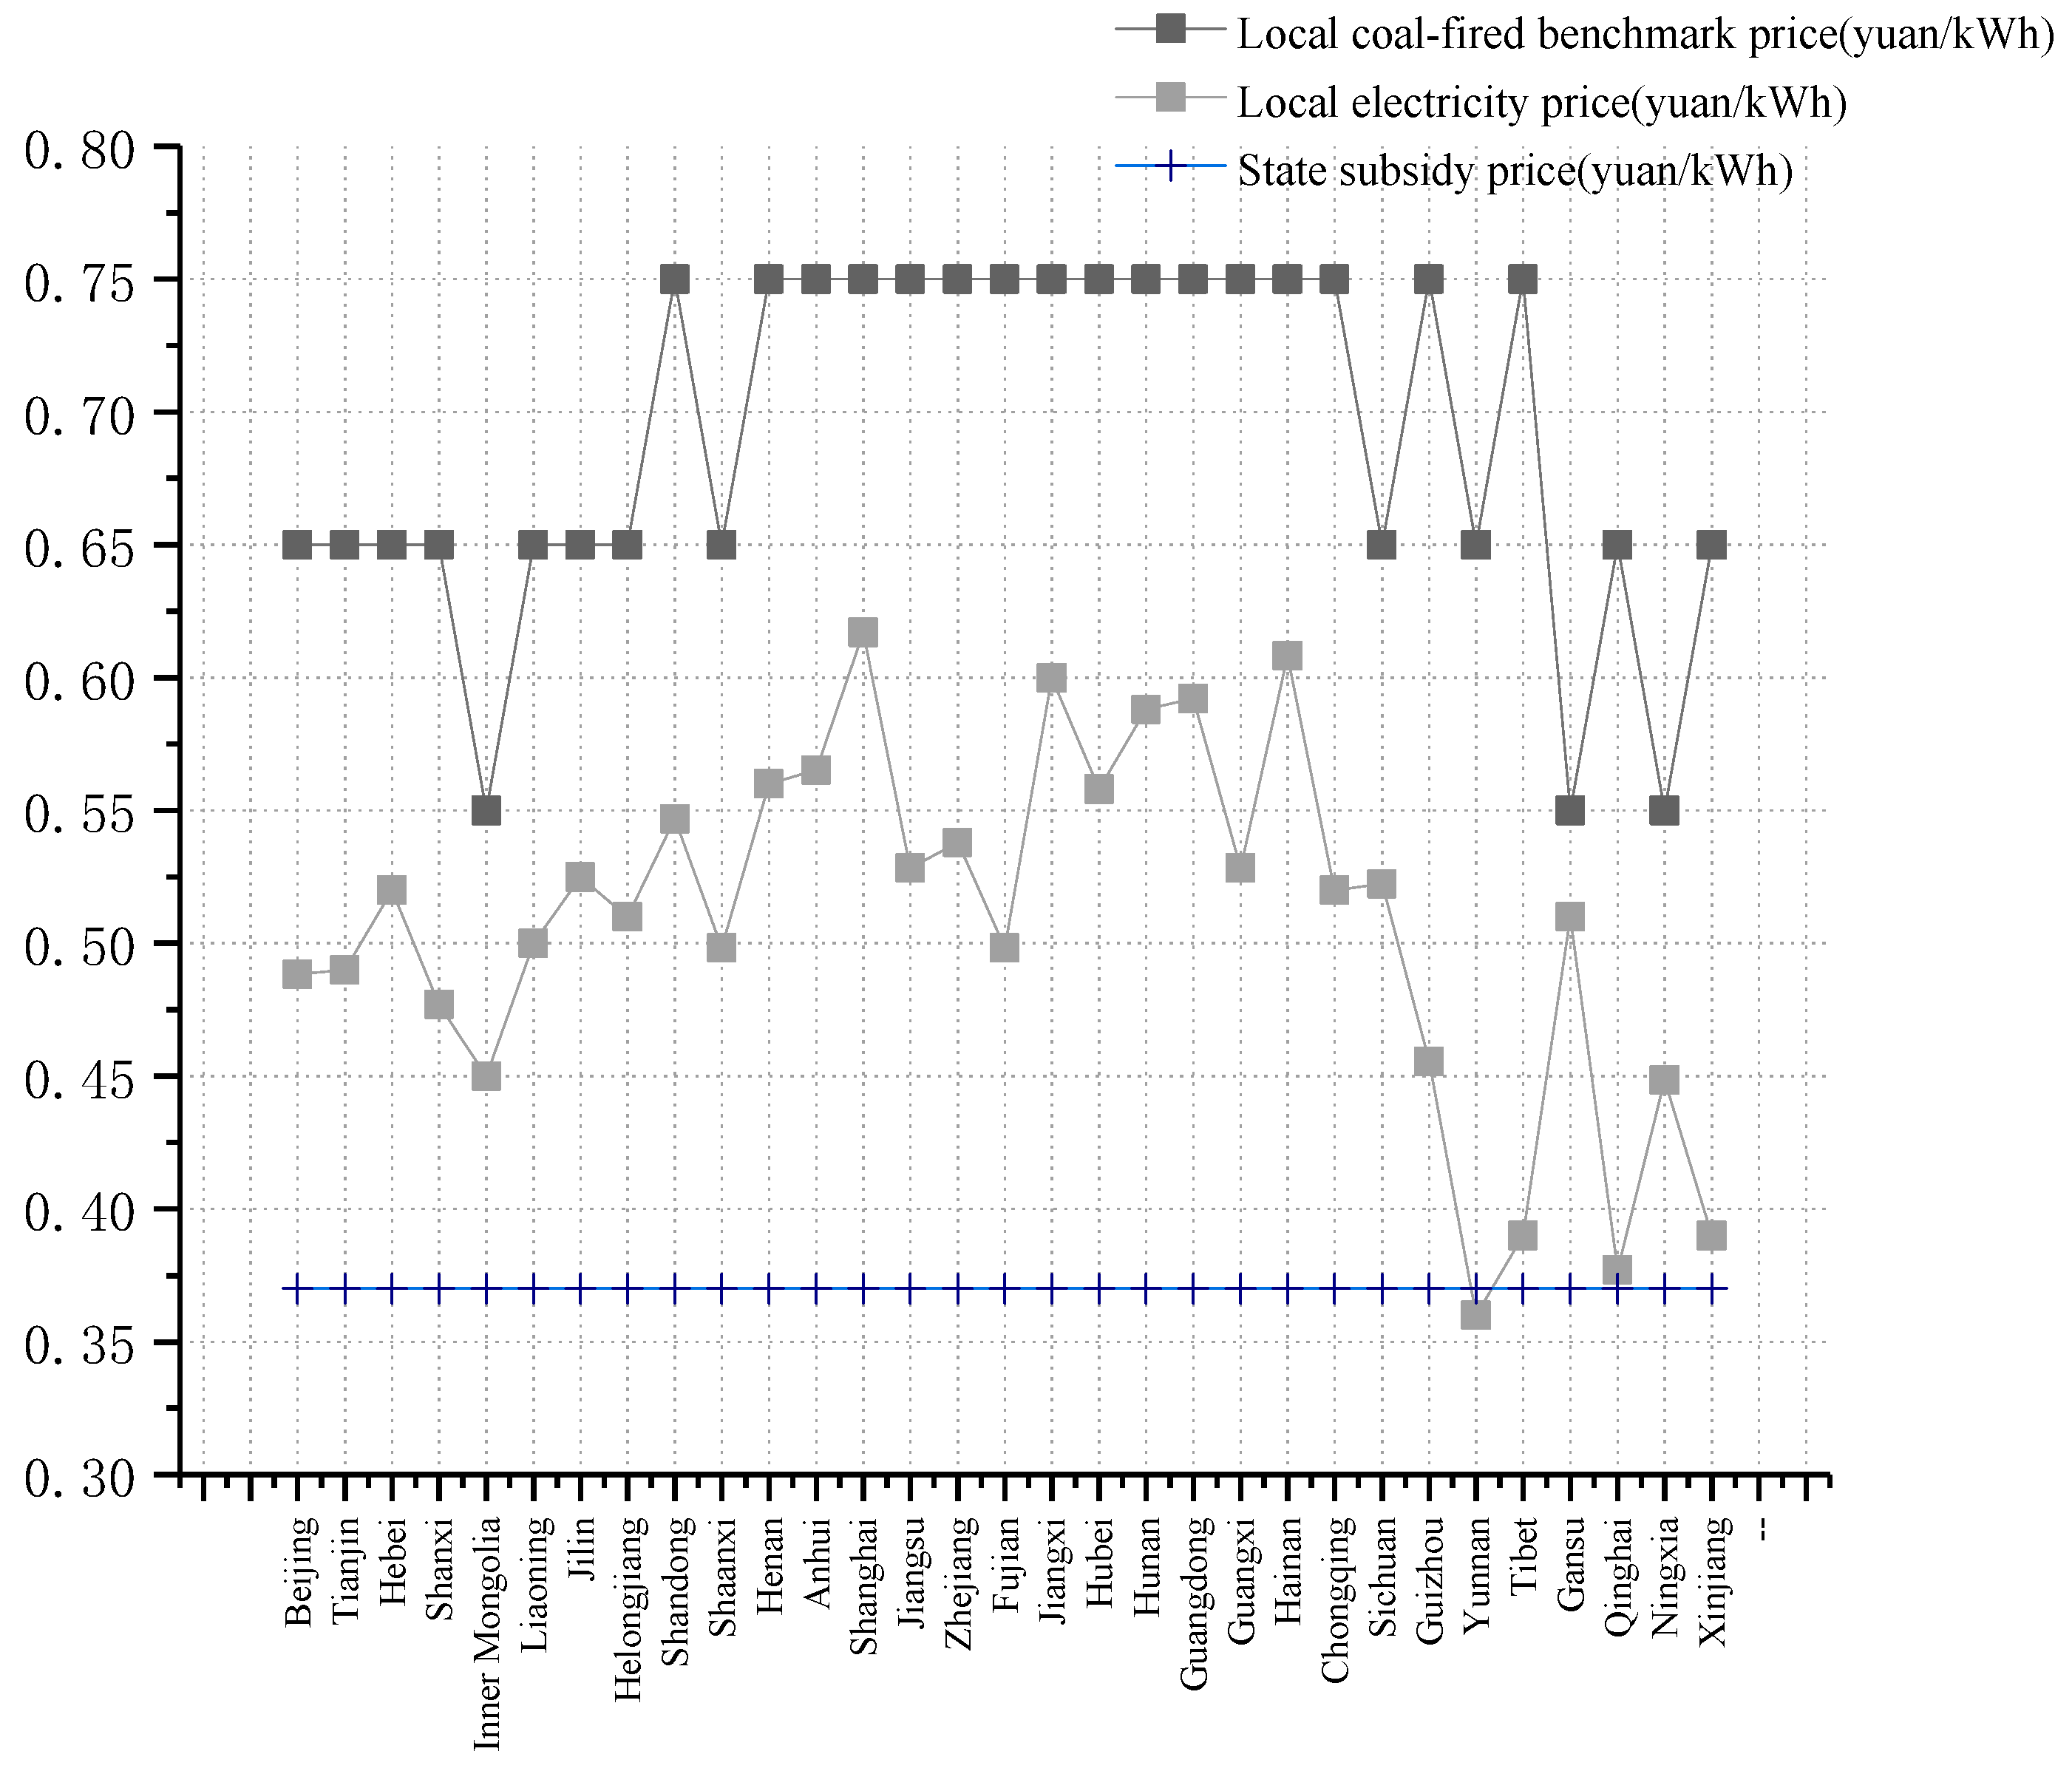
30]. At the same time, there are also the energy-saving benefits brought about by the environmental changes after the installation of a PV system to reduce the building load. However, this is greatly affected by the climate, and its income is low and unstable. Therefore, this benefit was not considered in this research. We used the following formula to represent the profits of users who invested in distributed PV systems:
where
R is the total annual income of users who invested in distributed PV systems, yuan/year;
is the part of power generation used by the users themselves, kWh/year;
is the excess electricity sold to the national grid, kWh/year;
is a subsidy for the electricity implemented by the government, yuan/kWh;
is the local coal-fired grid-connected electricity price, yuan/kWh; and
is the user’s local residential electricity price, yuan/kWh. The specific price is shown in
Figure 9.
The electrical energy generated by distributing PV systems has two main directions, namely, its own use and the sale of energy to the local power grid. Different regions will lead to different generations and demands from the PV system. The power resources used by households who install a distributed PV system consist of two parts, one of which is the electricity generated by the PV modules. When the electricity generated by the PV modules is insufficient to support the user’s use, the insufficient electricity will be purchased from the local power grid. Xinyu Jia et al. [
19] selected five typical cities as research objects from five regions with different solar radiation levels in China, then analyzed the benefits of China’s household distributed PV system. These five cities were Chongqing, Guangzhou, Beijing, Yushu, and Lhasa. They input the PV system configuration into the HOMER software to simulate the electricity consumption of the actual residents. The simulation results show that in terms of electricity consumption, the electricity sold to the local grid in the PV systems of the five cities accounted for about 30%, which means 70% of the electricity generated by the PV systems was used by the users themselves. Therefore, in this study, 70% of the average annual power generation was taken as the self-consumption of the first year, and the remaining 30% was taken as the electricity sold to the local grid in the first year. Based on this, the profit of the users investing in the distributed PV system was calculated according to the above formula.
With the increase in operating time, the aging and wear of the relevant components of the PV system will cause the power generation to decrease year by year. Therefore, the annual power generation of PV modules were reduced by 5% per year when calculating economic benefits. The development and popularization of the PV industry will lead to a year-by-year reduction in China’s subsidies for PV power generation and grid-connected benchmark electricity prices, and the reduction ratio was also set to 5%. With the development of the economy, the price of electricity for residential users will increase year by year, and the electricity consumption will increase accordingly, which will cause the proportion of electricity used by the users themselves in the power generation of PV systems to increase year by year; these three growth rates were all set to 5%. In addition, the purpose of the PV power generation subsidy implemented by the state is to stimulate the application and development of the PV industry, and the PV system has developed rapidly in recent years and has been applied in a large number of provinces, so the PV subsidy could be cancelled in the next few years. Therefore, the subsidy income will become a very uncertain income. In order to determine the impact of government subsidies on PV revenue, this study also calculated the total revenue that users who installed PV systems could get without a subsidy revenue.
Table 3 shows the income and payback time of a PV system in Jiangsu Province.
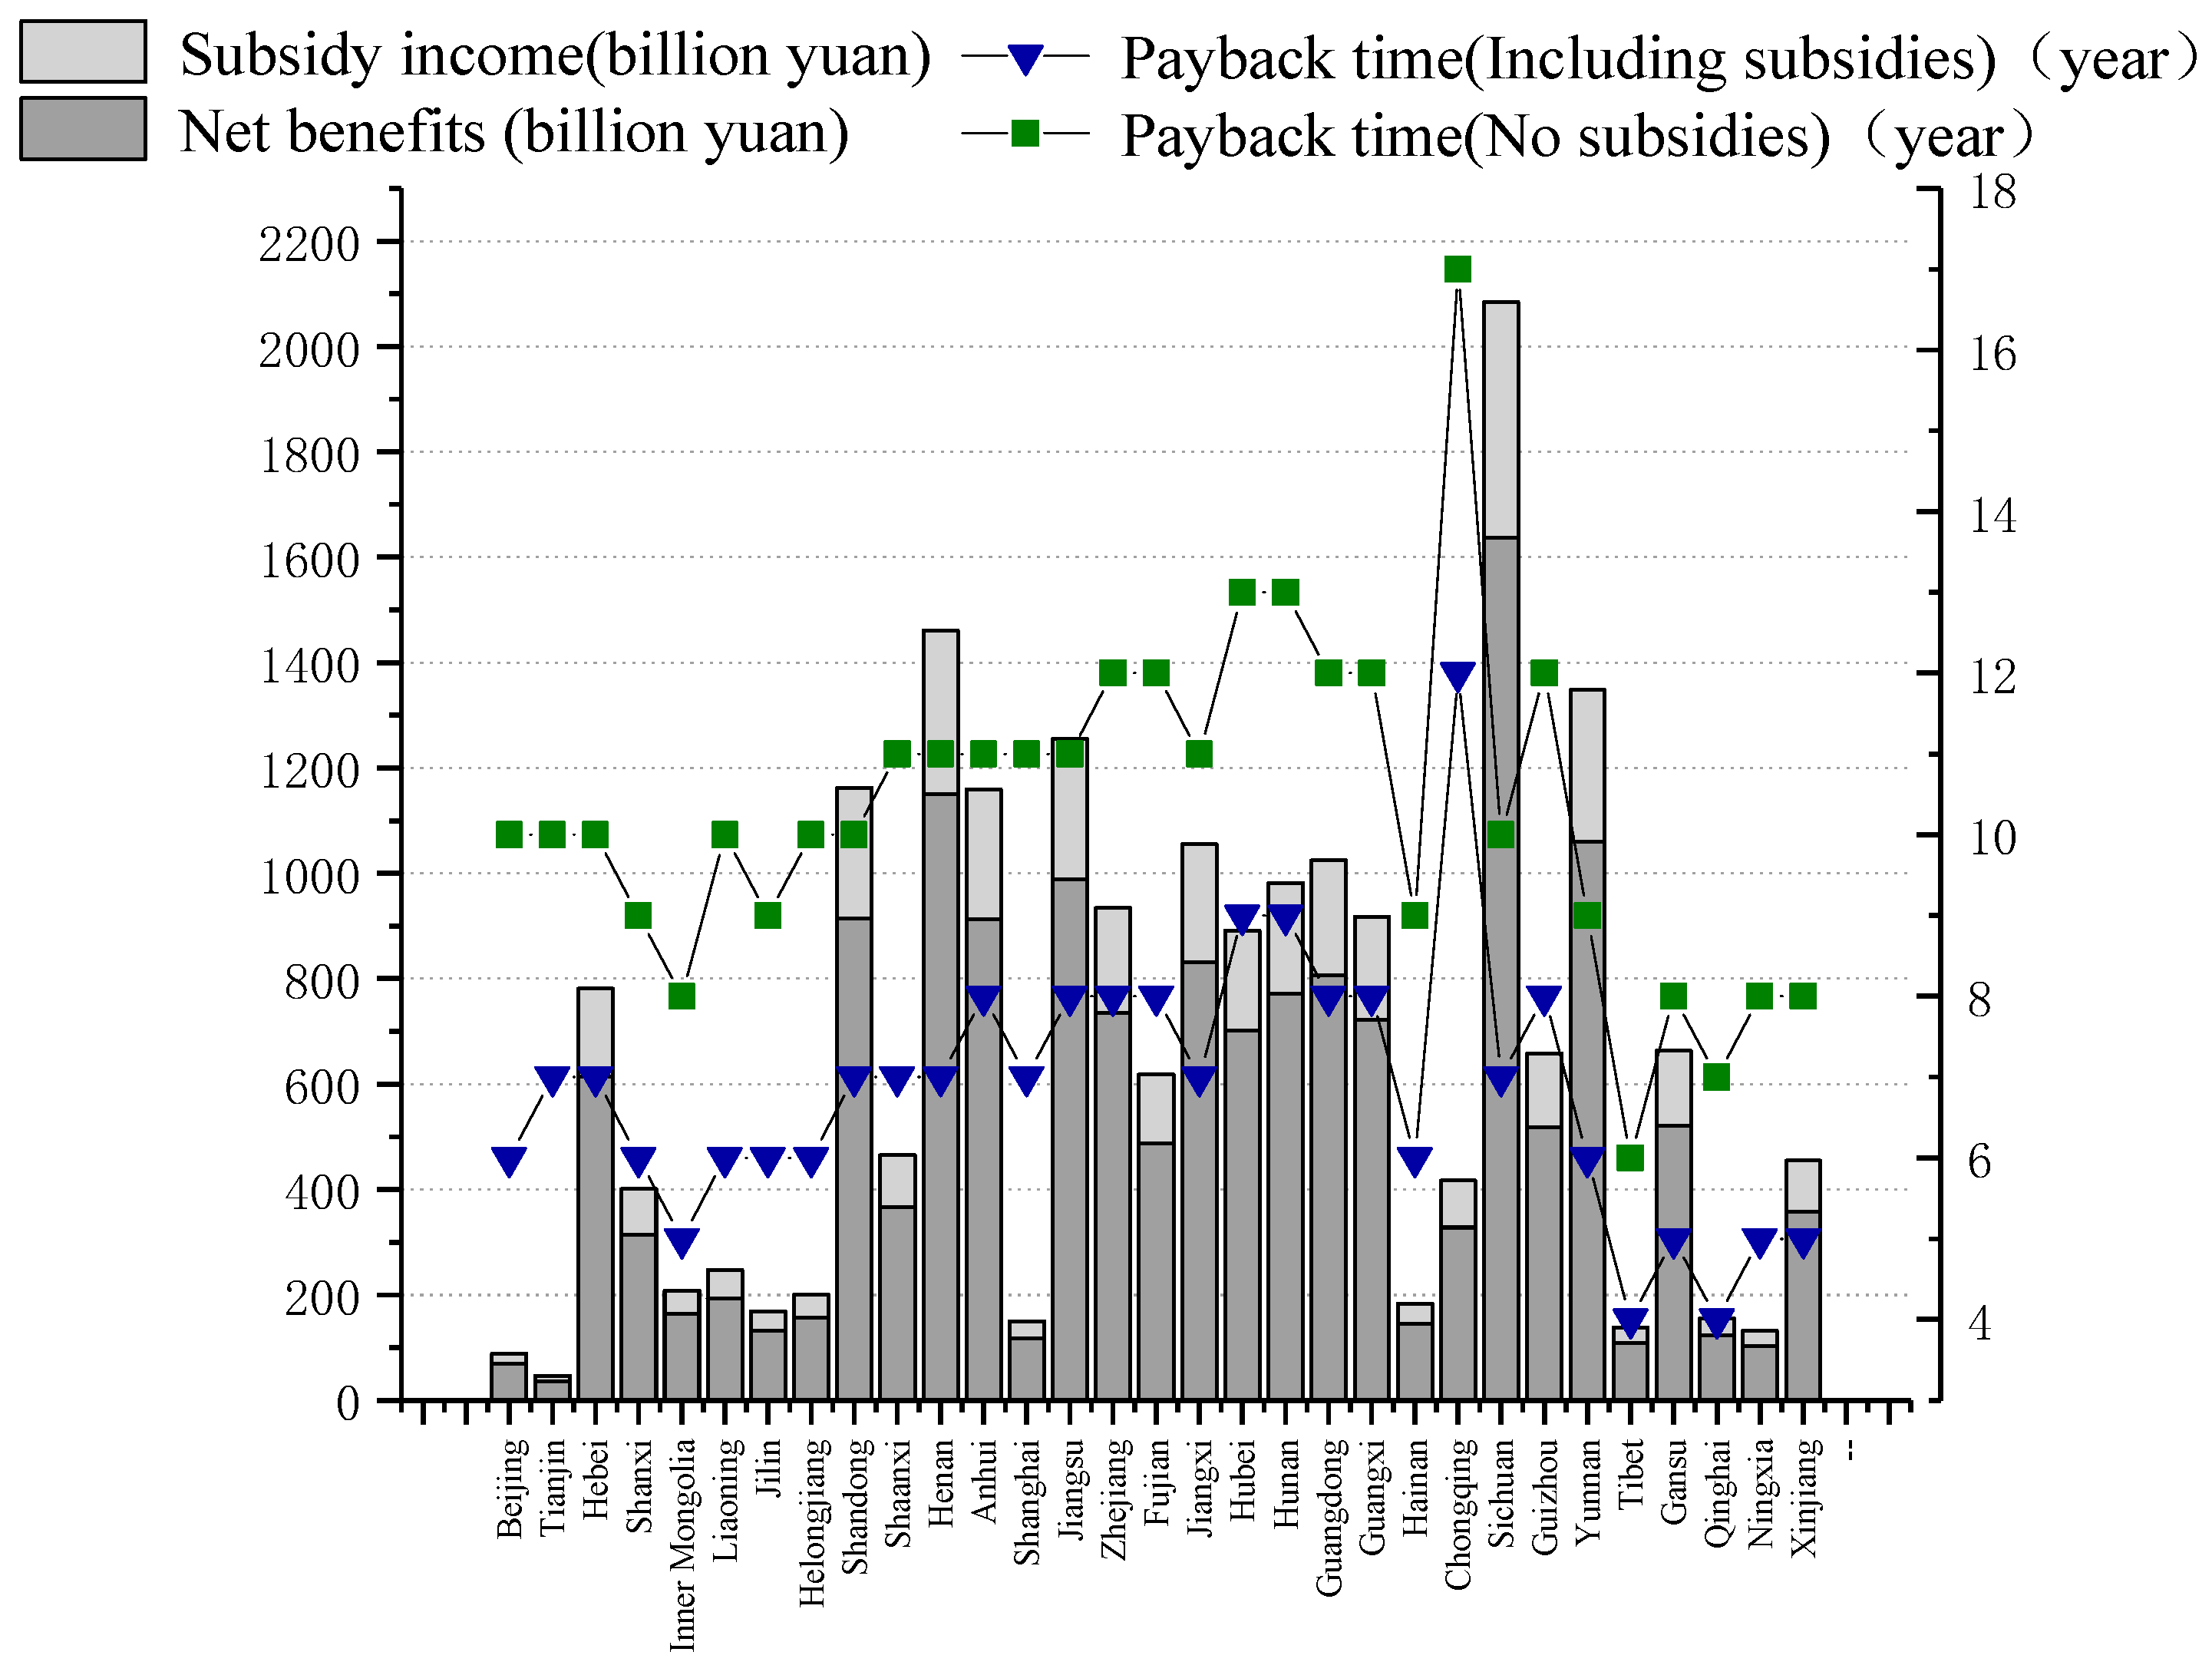
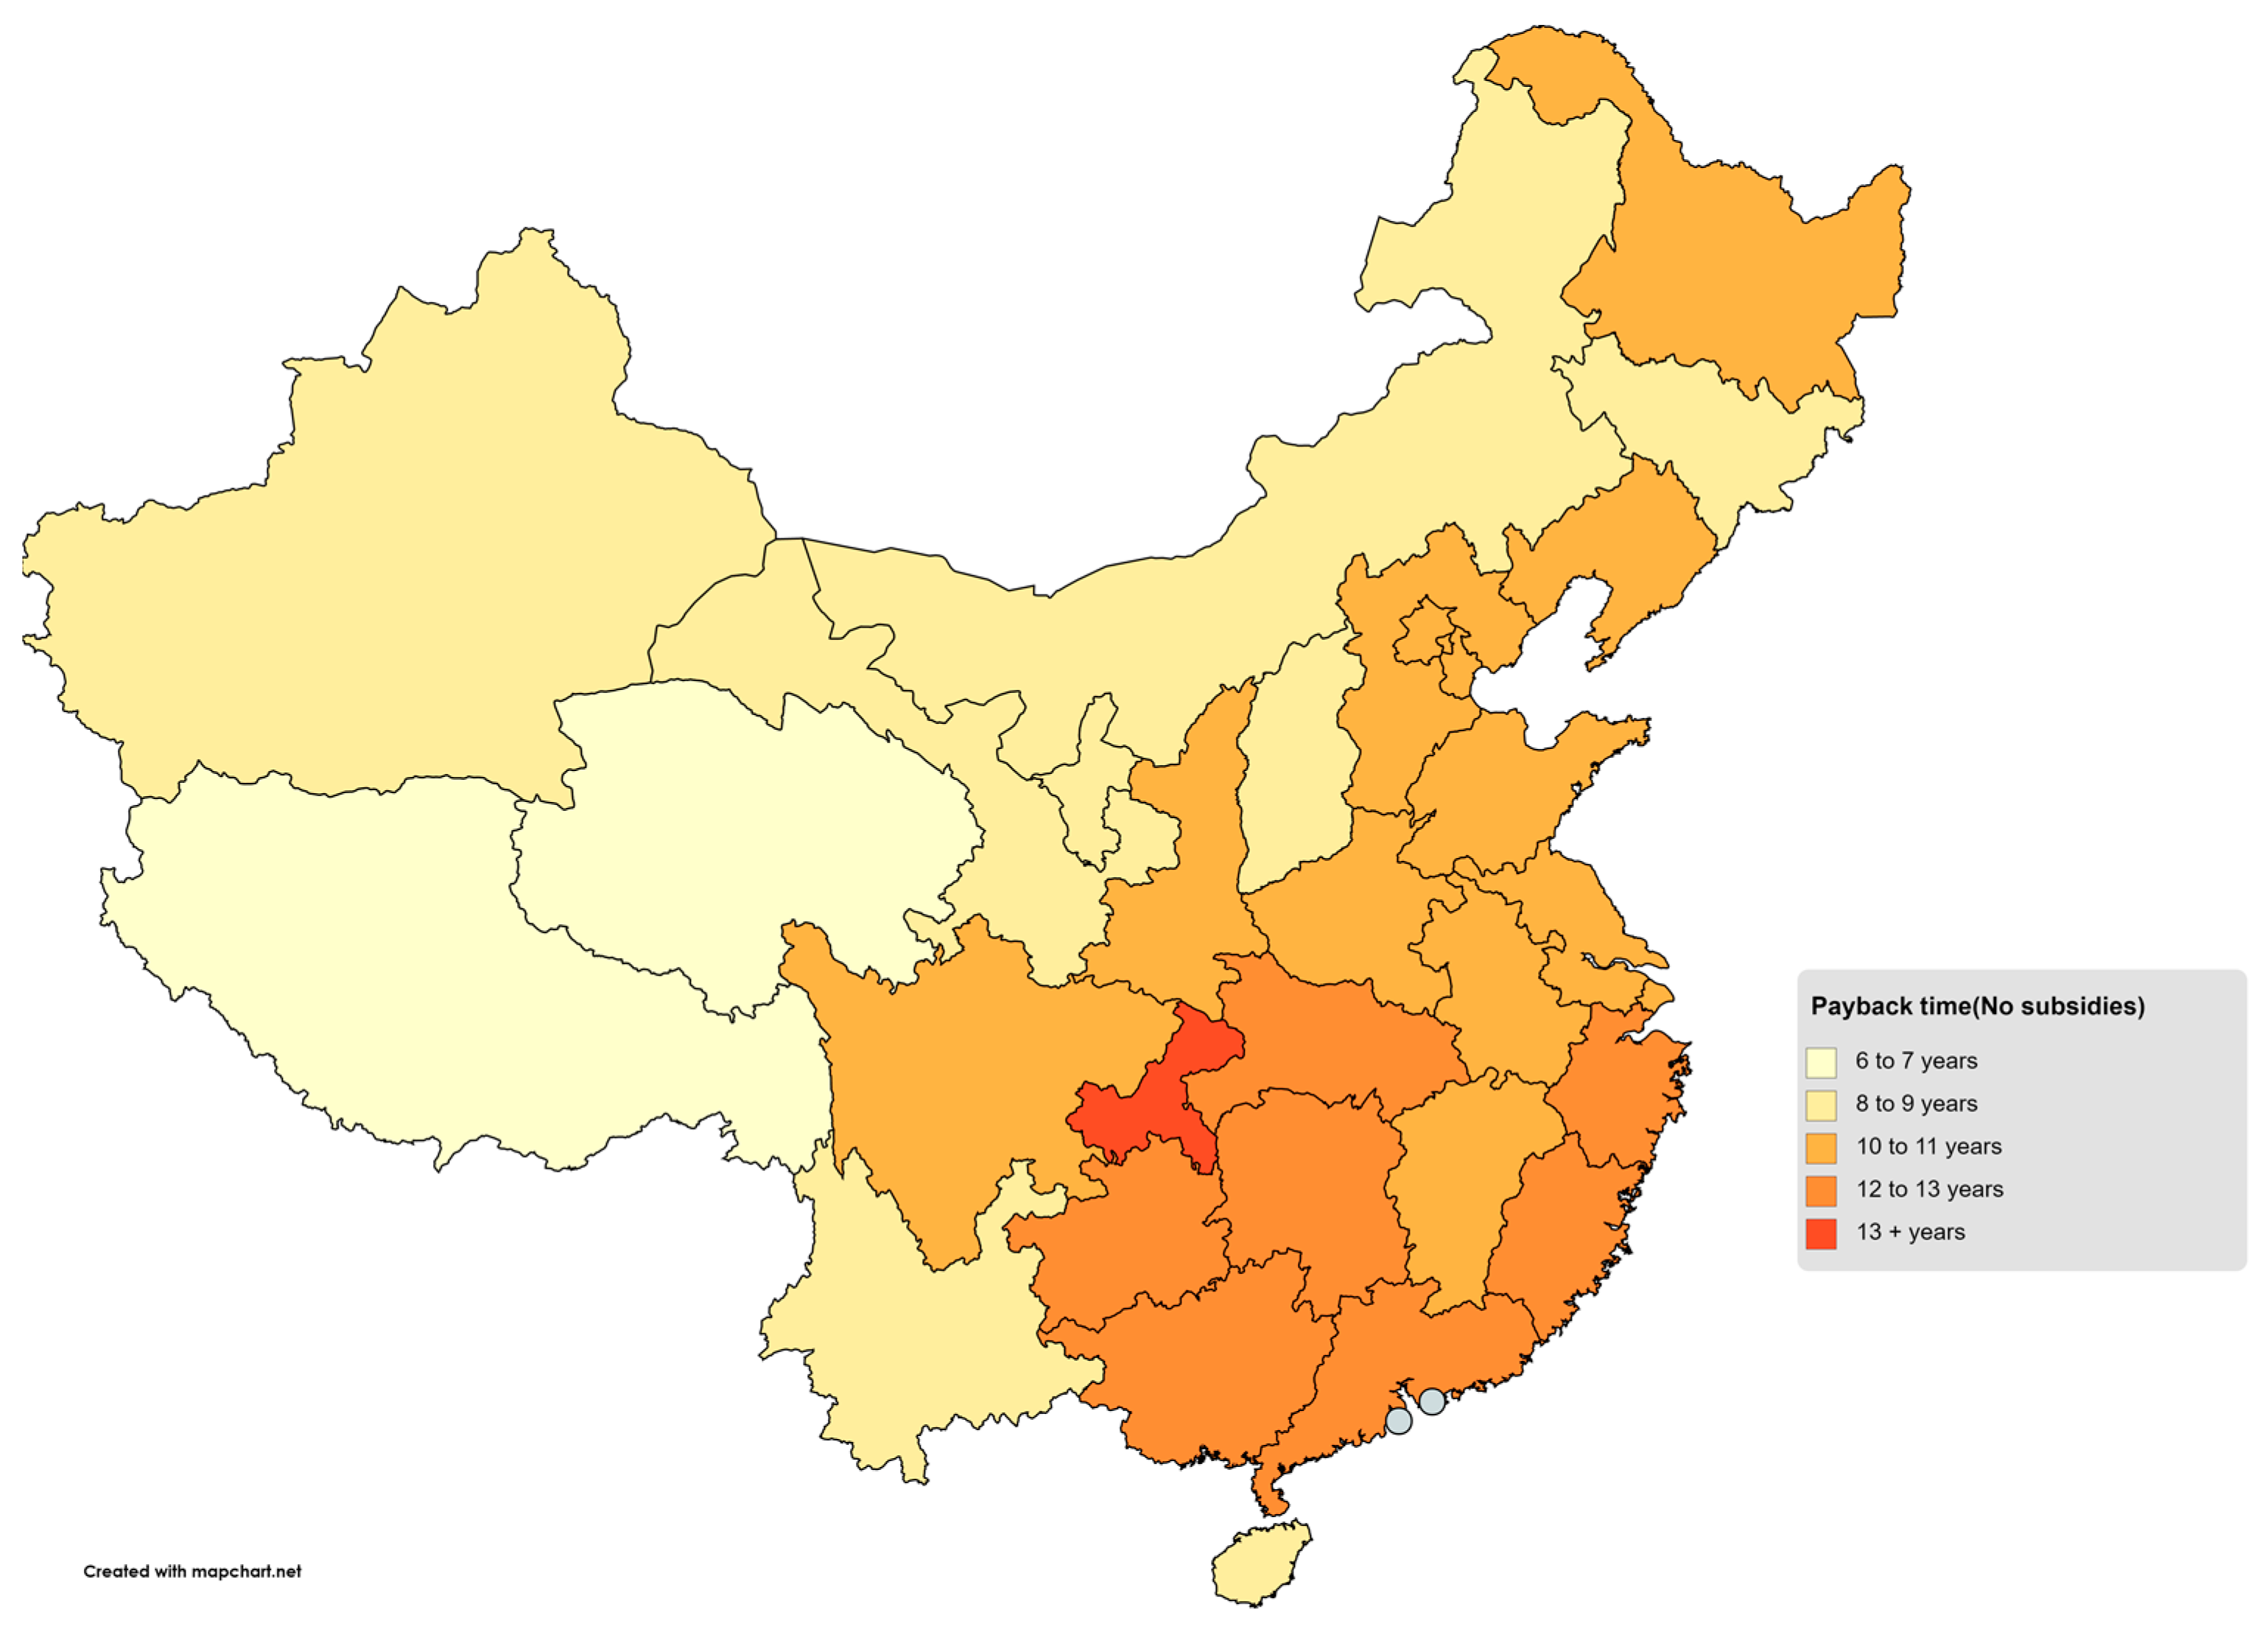
The initial investment in PV systems in Jiangsu Province was 446.6 billion Yuan. The calculation results show that when the power generation subsidy was included, the distributed PV systems installed in rural buildings in Jiangsu Province could recover the investment in the eighth year of operation, and the total income obtained over 25 years would be 125.59 billion Yuan, which is 2.8 times that of the initial investment. After removing the subsidy income, the payback period was extended to 11 years, and the total income was reduced to 98.792 billion Yuan—still more than twice the initial investment. From a data point of view, although the payback time for installing distributed PV systems in rural areas is slightly longer, it is still a lucrative investment. Using the same method to calculate the total revenue and payback time of the other provinces in China, the calculation results are shown in
Figure 10. Excluding subsidies, the distribution of the investment payback period of rural photovoltaic systems in mainland China is shown in
Figure 11.
5.3. Result Analysis
The results show that when PV subsidies were included, the payback period of investment in most areas of China was within eight years. However, Xinjiang, Tibet, Qinghai, and Gansu have a high solar radiation intensity, which is more conducive to the investment and construction of PV systems, and so the initial investment could be recovered within five years. The operating life of the PV system was set to 25 years. The first five years would be used to recover the investment, and the next twenty years would bring very considerable net profits to the users. Therefore, the shorter the payback period, the greater the benefits users can get.
Because of the great uncertainty of PV subsidies, this paper mainly analyzed the economic benefits when PV subsidies were not included. After the government subsidies for PV systems are removed, the total revenue that users can get in 25 years will shrink, the economic income of each province will be reduced by about 20%, and the payback period of investment will be extended by 3–4 years. According to the economic and energy benefits, the potential of solar energy resources in the Chinese mainland can be divided into three categories. The first is the area where the distributed PV system is recommended to be popularized, that is, the area with the highest economic benefit, which mainly includes inner Mongolia, Jilin, Hainan, Tibet, Gansu, Qinghai, and Ningxia. These provinces are rich in solar energy resources and the investment recovery period will be within 9 years; the installation of the distributed PV systems will bring considerable benefits to users in the next 25 years, which is very suitable for the investment and installation of distributed PV systems. The third kind of areas are the areas with a low economic efficiency for using solar radiation resources, mainly in Chongqing and Guizhou Province. These places are located in the basin, receive less solar radiation, and obtain less power generation under the same installed capacity compared with other provinces, so it takes a longer time to recover the initial investment, which will take 14–17 years. Compared with other provinces, the economic benefit of investment in the construction of PV system is the lowest. Besides the first and third categories of areas, the other provinces belong to the second category of resource areas, which mainly includes some central provinces that have medium solar energy resources and the investment recovery period is within 10–12 years. Although the economic benefits are not as great as those in the first category, the total income of the PV system after 25 years of operation could still reach more than twice the initial investment. In addition, these provinces have a large rural construction area and a large roof area for power generation. In terms of energy efficiency, these provinces can generate more electricity, most of the electricity in the whole country comes from these areas, and the energy efficiency is the most considerable. Therefore, these provinces will become the main force of PV power generation in China in the next few decades, and the investment and construction of distributed PV systems in these areas should be vigorously promoted.
From the perspective of overall economic benefits, even if government subsidies are not included, the total income of PV systems in most areas of China for 25 years will be more than twice the initial investment. This part of the income could not only increase the income of rural residents and reduce the gap between the rich and poor between urban and rural areas, but could also show the application potential of PV systems and stimulate the promotion and application of the PV industry in rural areas.
5.4. Social Benefit
In addition to direct economic benefits, comprehensive utilization of PV power generation can also bring other benefits, such as reducing pollutant and greenhouse gas emissions, providing jobs, ensuring energy security, and improving the safety of electricity for life and production in rural and remote areas in China.
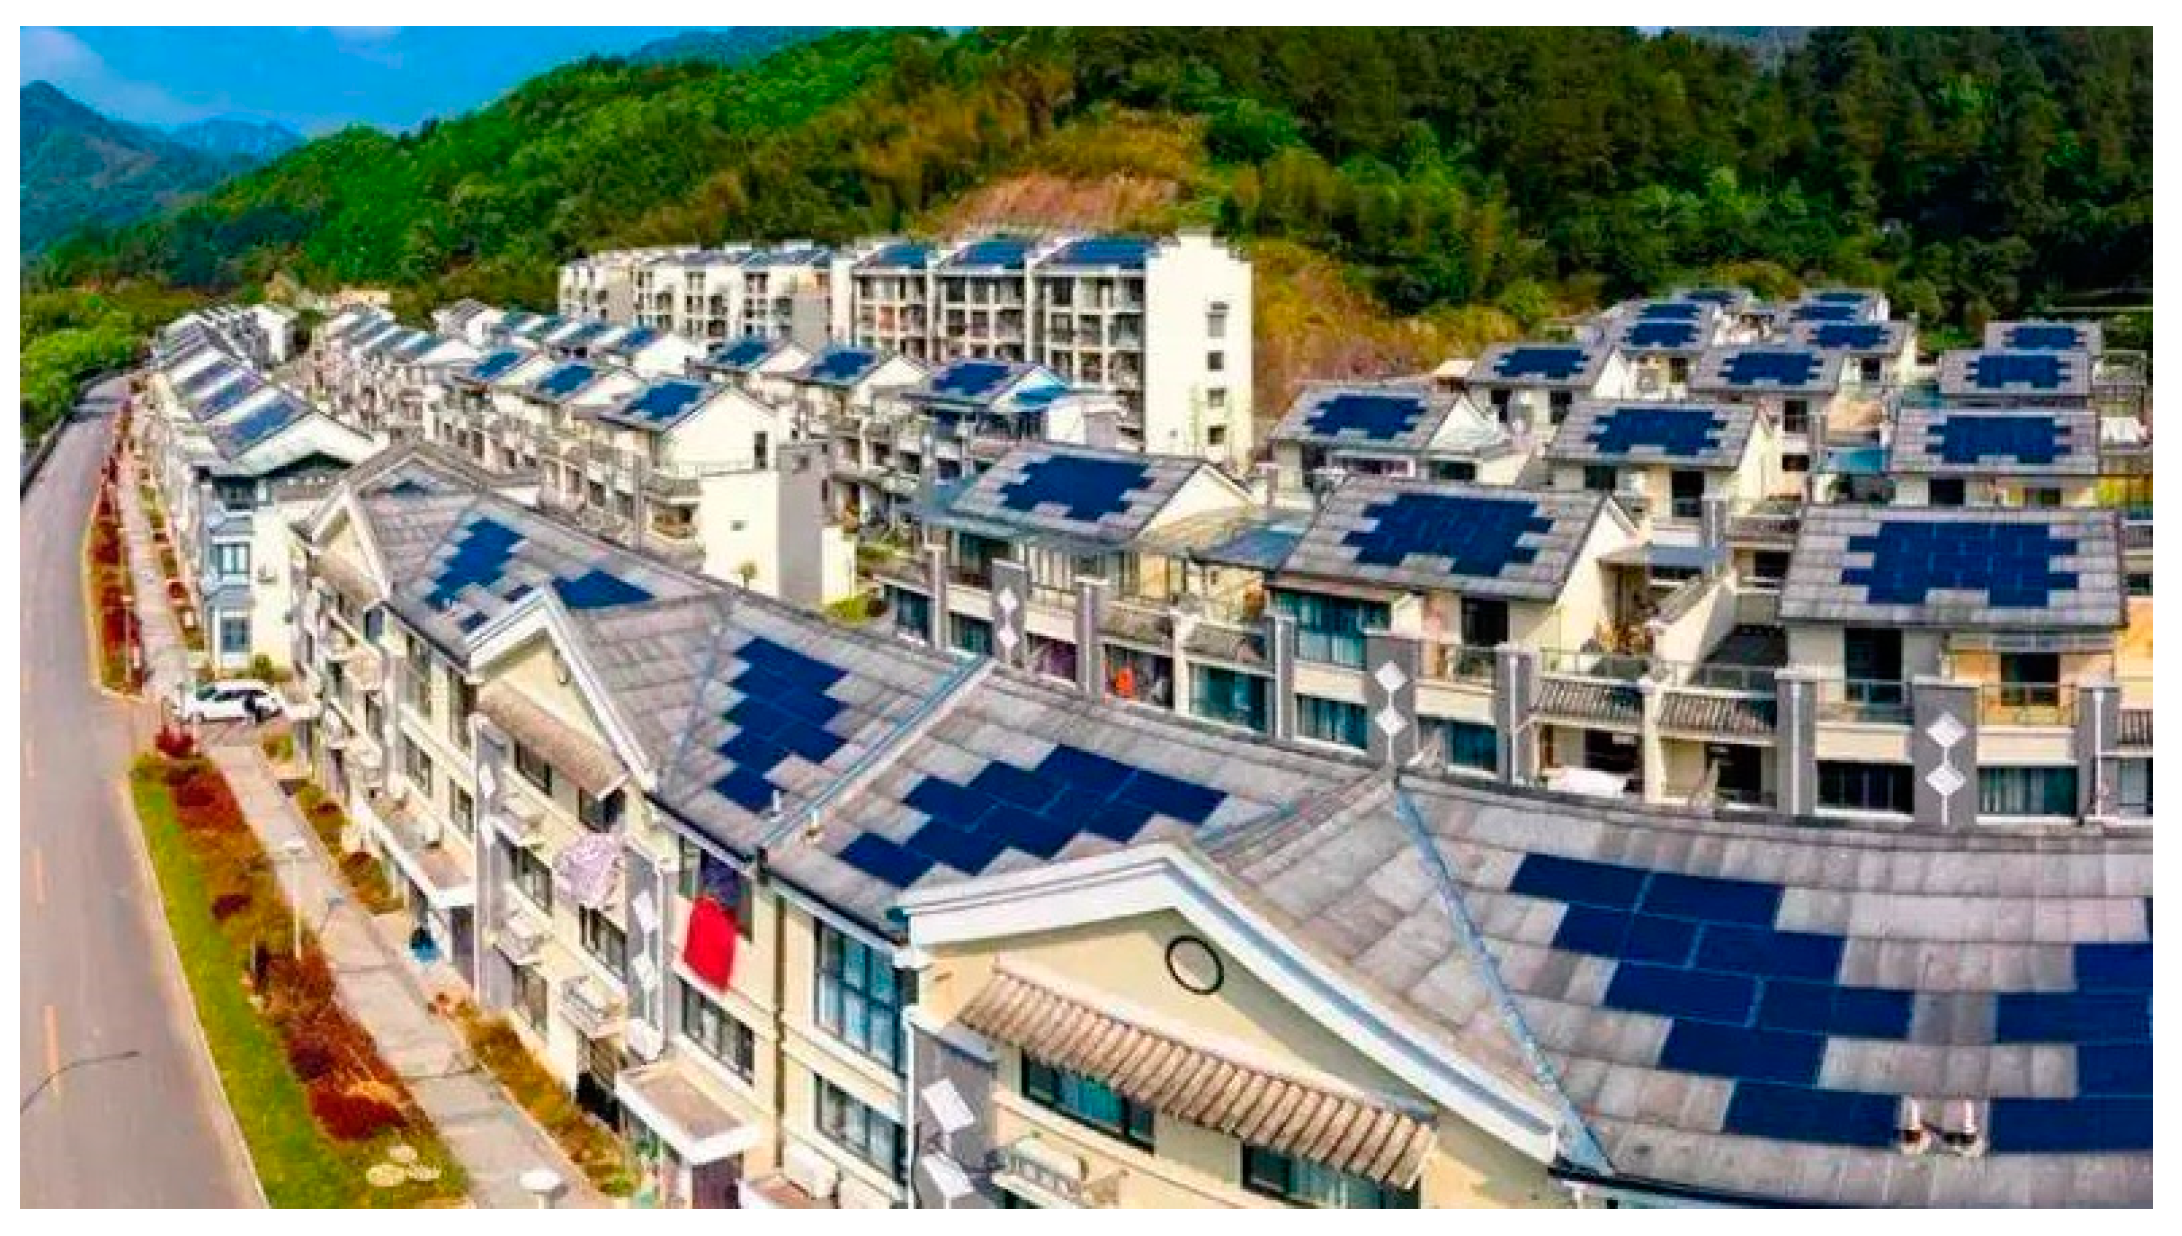
Take Li’ao Village, Ningbo City, Zhejiang Province as an example, as shown in the
Figure 12. The village invested 6 million Yuan in 2016 to install a 600 kw distributed PV power station on the roof of the village’s residential houses. This practical application showed that the PV power station had an annual power generation capacity of 720,000 kWh, with an average annual income of more than 600,000 Yuan. At the same time, the installation of PV panels can also play a role in thermal insulation inside the building. It can reduce the indoor temperature by 5–7 °C in spring and summer, and can increase it by 2–3 °C in autumn and winter, saving electricity costs for heating, cooling, and air conditioning. In addition, if the power generation is calculated at 720,000 kWh per year, 288 tons of standard coal can be saved annually. The emission reduction of 576 tons of carbon dioxide, 157 tons of dust, 4.5 tons of sulfur oxides, and 1.5 tons of nitrogen oxides is equivalent to planting 16,000 trees, which would promote the sustainable development of the ecosystem.
Therefore, the promotion of the distributed PV systems in rural areas does not only provide better investment costs and returns compared with traditional power generation, it also has extremely important social practical significance and economic value for building a new rural power supply system that is safe, reliable, energy-saving, environmentally friendly, and technologically advanced.
In addition, since the Chinese government put forward the goals of reaching a “carbon peak” and becoming “carbon neutral”, adjusting the energy structure and improving the efficiency of energy use have to become the top priority of the society, and the use of renewable energy will undoubtedly be accelerated. If the PV power generation system can be widely used in rural areas of our country, this achieve a significant step forward towards the “3060 plan”. In order to implement this plan, all provinces across the country have stepped up the introduction of relevant policies to stimulate PV development, and there may even be a new round of PV subsidies issued to stimulate rural residents to install PV systems.
In summary, the popularization of PV systems in rural areas can not only provide villagers with huge economic benefits, but can also play an important role in reducing carbon emissions, protecting the ecological environment, and promoting sustainable ecological development. Therefore, the popularization of PV systems can be said to be a necessary means for China to develop rural areas and to achieve carbon neutrality.
6. Conclusions
This paper takes the rural residential buildings in mainland China as the research object, carries out the solar energy resource application potential evaluation and eco-nomic benefit analysis, and draws the following conclusions.
China’s rural areas are rich in space resources for the investment and installation of a distributed PV system, and the annual power generated by a PV system can bear the power load of the rural areas. The calculation results show that there are still more than 6.4 billion m2 of building roof area in rural areas that can be used for the investment and installation of distributed PV systems, and if used rationally, the power generation will be able to reach 1.55 times the total power consumption in rural areas. The research also gives the PV installable resources in rural areas of China, which can provide some data support for China’s future plan of “carbon neutrality”.
Promoting the popularization of distributed PV systems in rural areas will not only bring energy benefits and alleviate environmental problems, but also bring certain economic benefits to rural farmers. Comprehensively considering economic and energy benefits, mainland China is divided into three types of resource areas, and each resource area should reasonably formulate relevant policies based on its own characteristics and advantages in order to promote the development of the PV industry in rural areas.
In this paper, the purpose of PV related prediction is to serve the formulation of relevant policies, so as to predict the total amount of energy that the distributed PVs can provide in China’s rural areas in the future. It can provide assistance for many provinces in China to formulate the building roof PV installation plans of cities and counties in the near future. This study only calculated and analyzed the PV application prospects of rural building roofs in China, and lacked an analysis of the PV power generation potential of rural abandoned land in China, which would not reflect the overall PV power generation potential of China. Therefore, further work could be done to forecast the energy and economic benefits of PV technology in China.


