Article

The Academic Portfolio System (APS) Usage Intention of Senior High School Students in Taiwan

1
Department of Creative Design, National Yunlin University of Science and Technology, Yunlin 640, Taiwan
2
Graduate School of Design, National Yunlin University of Science and Technology, Yunlin 640, Taiwan
*
Author to whom correspondence should be addressed.
Sustainability 2021, 13(15), 8394; https://doi.org/10.3390/su13158394
Submission received: 19 May 2021 / Revised: 8 July 2021 / Accepted: 22 July 2021 / Published: 27 July 2021
(This article belongs to the Special Issue Sustainability on Education Policies)

Abstract

:
Taiwan began to implement a new high school syllabus nationwide, in 2019. The Ministry of Education has also established a high school student Academic Portfolio System (APS) to collect the learning process of high school students for future university admissions references. However, during this period, high school students and their parents had many opinions on the implementation of the new system. There were even groups of students protesting. The main purpose of this research is to explore the factors that affect the system usage intentions of high school students. Based on the theory of reasoned action (TRA) and the technology acceptance model (TAM), this research established a research model. The research variables include system interface design, usefulness, ease of use, attitude, subjective norms, and usage intentions. A total of 712 questionnaires were collected from high school students in northern Taiwan. Data analysis is carried out in three stages: descriptive analysis, measurement model verification, and structural equation modeling. The results of the study found that system interface design has a significant impact on the perceived ease of use. Factors such as ease of use, usefulness, attitude, and subjective norms also have a significant positive impact on usage intention; ease of use and usefulness positively affect attitudes toward using. Finally, according to the results, some practical implications were proposed for implementation references from the perspectives of education authority, high schools, teachers, and students.

1. Introduction

In Taiwanese society, because of the traditional cultural motto that “everything is inferior, only learning is good”, education can not only be used as a tool to increase income and choose better occupations, but it also has a very important social status compared with occupations or income [1]. “Diplomacy” has made diplomas a goal that many people strive to pursue, so the “Credentialism” have been improved accordingly [2,3]. In this kind of educational atmosphere, many learning contents are only aimed at entering better schools. For students and parents in Taiwan, the level of test scores has become the most important thing. For a long time, the fierce competition for Taiwanese students to enter schools has been the most serious problem in the education industry [4,5].
In the past, examinations were used as the only way to enter the schools. Later, after the teaching reform, the multiple enrollment plans got rid of the passive selection model and provided students with a variety of appropriate entrance pathways. The school began to pay attention to the learning process of students, respecting their talents and interests, and encouraging their motivation to learn [6]. The Ministry of Education stipulated that all national high schools establish a digital platform for the learning history files of high school students [7]. The platform needs to collect complete records of high school students’ academic performance in the Academic Portfolio System (APS) [8]. APS will regularly collect and record all students’ high school basic information, including class records, course performance, and various performances. It can be used to select and apply review materials for future university admission. At present, the number of senior high school students in Taiwan is about 216,000 in the first grade, 222,000 in the second grade, and about 238,000 in the third grade [9].
In addition to the test results, through the Academic Portfolio System (APS), the learning trajectory, personal characteristics, and ability development of students can be more realistically presented. With regular and long-term records, it is hoped that students will be relieved of the burden of collecting and reviewing data in the third year of high school [10]. In addition, university admissions can also customize the content and methods of the learning process for different admission channels [11]. Significantly increasing the percentage of points scored by the Academic Portfolio System (APS) is the trend of future university admissions [12]. Through 4R model of recording, reflection, refinement, and reinforcement, it is possible to generate a positive learning cycle and enhance the effect of the learning process.
The design of Academic Portfolio System (APS) has a good intention, but there have been many backlashes in the past year. The National Development Commission in Taiwan promoted the “Public Policy Network Participation Platform” and the public proposed “the requiring 108 new syllabus high school curriculum to remove Academic Portfolio System (APS)” [13]. In less than three days, the secondings were over 5000, and there were 8000 secondings in total. This proposal once again set off a heated discussion about the new university admissions and the learning history archive system. It has really attracted many opinions and concerns from the education sector, which affects all students and parents [14]. Since the implementation, students have repeatedly complained that the system capacity was too small, the resolution was poor, and that the upload time conflicted with the final exam. Due to inconsistent course codes and file capacity, system operation, student status interface, data format, or field errors, the school also caused upload delays [15].
However, when the policy is generally promoted, there are inevitably numerous problems in the methods of implementation and system operations. Schools, teachers, parents, and academia naturally have different opinions. The Ministry of Education organized a total of 50 discussions, including the outlying islands. A total of 1164 middle-school teachers and students, parents, and 172 professors from 21 universities were invited to discuss their views on the Academic Portfolio System (APS). It is even planned to announce the guiding principles and to set up a communication platform and other corresponding measures [16]. It is sufficient for high-achieving students to prepare for the original entrance exam in the third year of high school. Due to the implementation of this system, even if students are not interested in the subject, they are required to make a learning history file of every subject. This exhausts students of good academic performance and creates high expectations with even greater pressure. The 108 curricula and the Academic Portfolio System (APS) has been online for more than a year, and some scholars have put forward some discussions on policies and systems [8,10,17]. However, there is still a lack of relevant empirical research on the interface and functions of the learning history archive system currently used by students.
The overviews of university application documents in various countries are mainly personalized. Even if they are supplemented by systematic collection, they are still used as pieces of evidence for personal references. It is rare in the world to use the power of national policies to promote and build a system that collects all students’ school learning history archives, and even more so, a back-end university admission selection design that links learning history to entrance exams. The research is based on the implementation of the Academic Portfolio System (APS) in Taiwan in the past two years, which is, due to the diversified admission channels of universities, caused by the education reform. It has been causing a backlash from many high school students, parents, and teachers. Especially, high-school administrators and teachers face many difficulties to promote this system. Therefore, this research conducted an investigation based on the viewpoints of high school students, hoping to understand the reasons that affect their intention for using the system. This research started from the perspective of students and explored their understanding of the policy content related to APS. Based on the technology acceptance model (TAM) and rational behavior theory (TRA), this research designed a research model to explore the impact of system user interface design on system ease of use perception, thereby verifying ease of use and ease of use attitude. In addition, this study also explored students’ views and feelings on the practical operation of the learning history archive file system. This research hopes to have a deeper understanding of the influencing factors of vocational high school students’ system use intentions and to provide references for system promotion and implementation mechanisms.

2. Literature Review and Hypothesis Development

2.1. Education Policy

Since the 1990s, educational policy research has been demanded by the educational research fields [18]. Policy research initially focused on the scientific method of policy. The so-called policy formulation refers to proposing the best course of action to implement a decision or achieve a goal [19]. Since then, education policy research has also begun to be multi-faceted and diversified. To date, the Education Policy Research Association elaborated on the origin of the policy. In addition, empirical research is also conducted on the impact of policymaking. Furthermore, when discussing the implementation of the education policy, the reactions of parents, teachers, and students to the policy may comprise acts of the boycott. In addition, the limitations of policymaking and the interactive process are also discussed [20,21,22,23].

2.2. Portfolio

Portfolio is the systematic collection and presentation of learner information, which helps to fully understand the learning process and results, and indeed provides a review mechanism for reflection and growth [24,25]. If combined with an e-portfolio in the form of a network, it can overcome the limitations of data query, modification, storage, and management in the process of building paper files in the past. It can also provide further collective thinking to promote interactive communication between teachers and students [26,27]. Moreover, Palmer, Holt, Hall, and Ferguson found that making good use of APS to collect academic documents, to display learning results, and to write reflective feedback helps students store, share, and innovate knowledge [28]. Moreover, Metz and Albertnhe-Giordan believed that reflection can stimulate learners’ innovative thinking [29]. Subsequently, through timely feedback from systematic digital learning files, the students’ experience and knowledge can improve their motivation for creativity, modify their applicability, and derive a positive effect for learning. To sum up, the learning history file is of great importance for self-assessment and learning observation, and focuses on cultivating soft skills such as planning, creative thinking, and adaptation to changes, which cannot be tested through examinations. It can be used not only to show students’ hard work, progress, and achievement in a certain field, but also to provide students with the actual situation of self-reflection on changes in their cognitive processes and learning strategies.

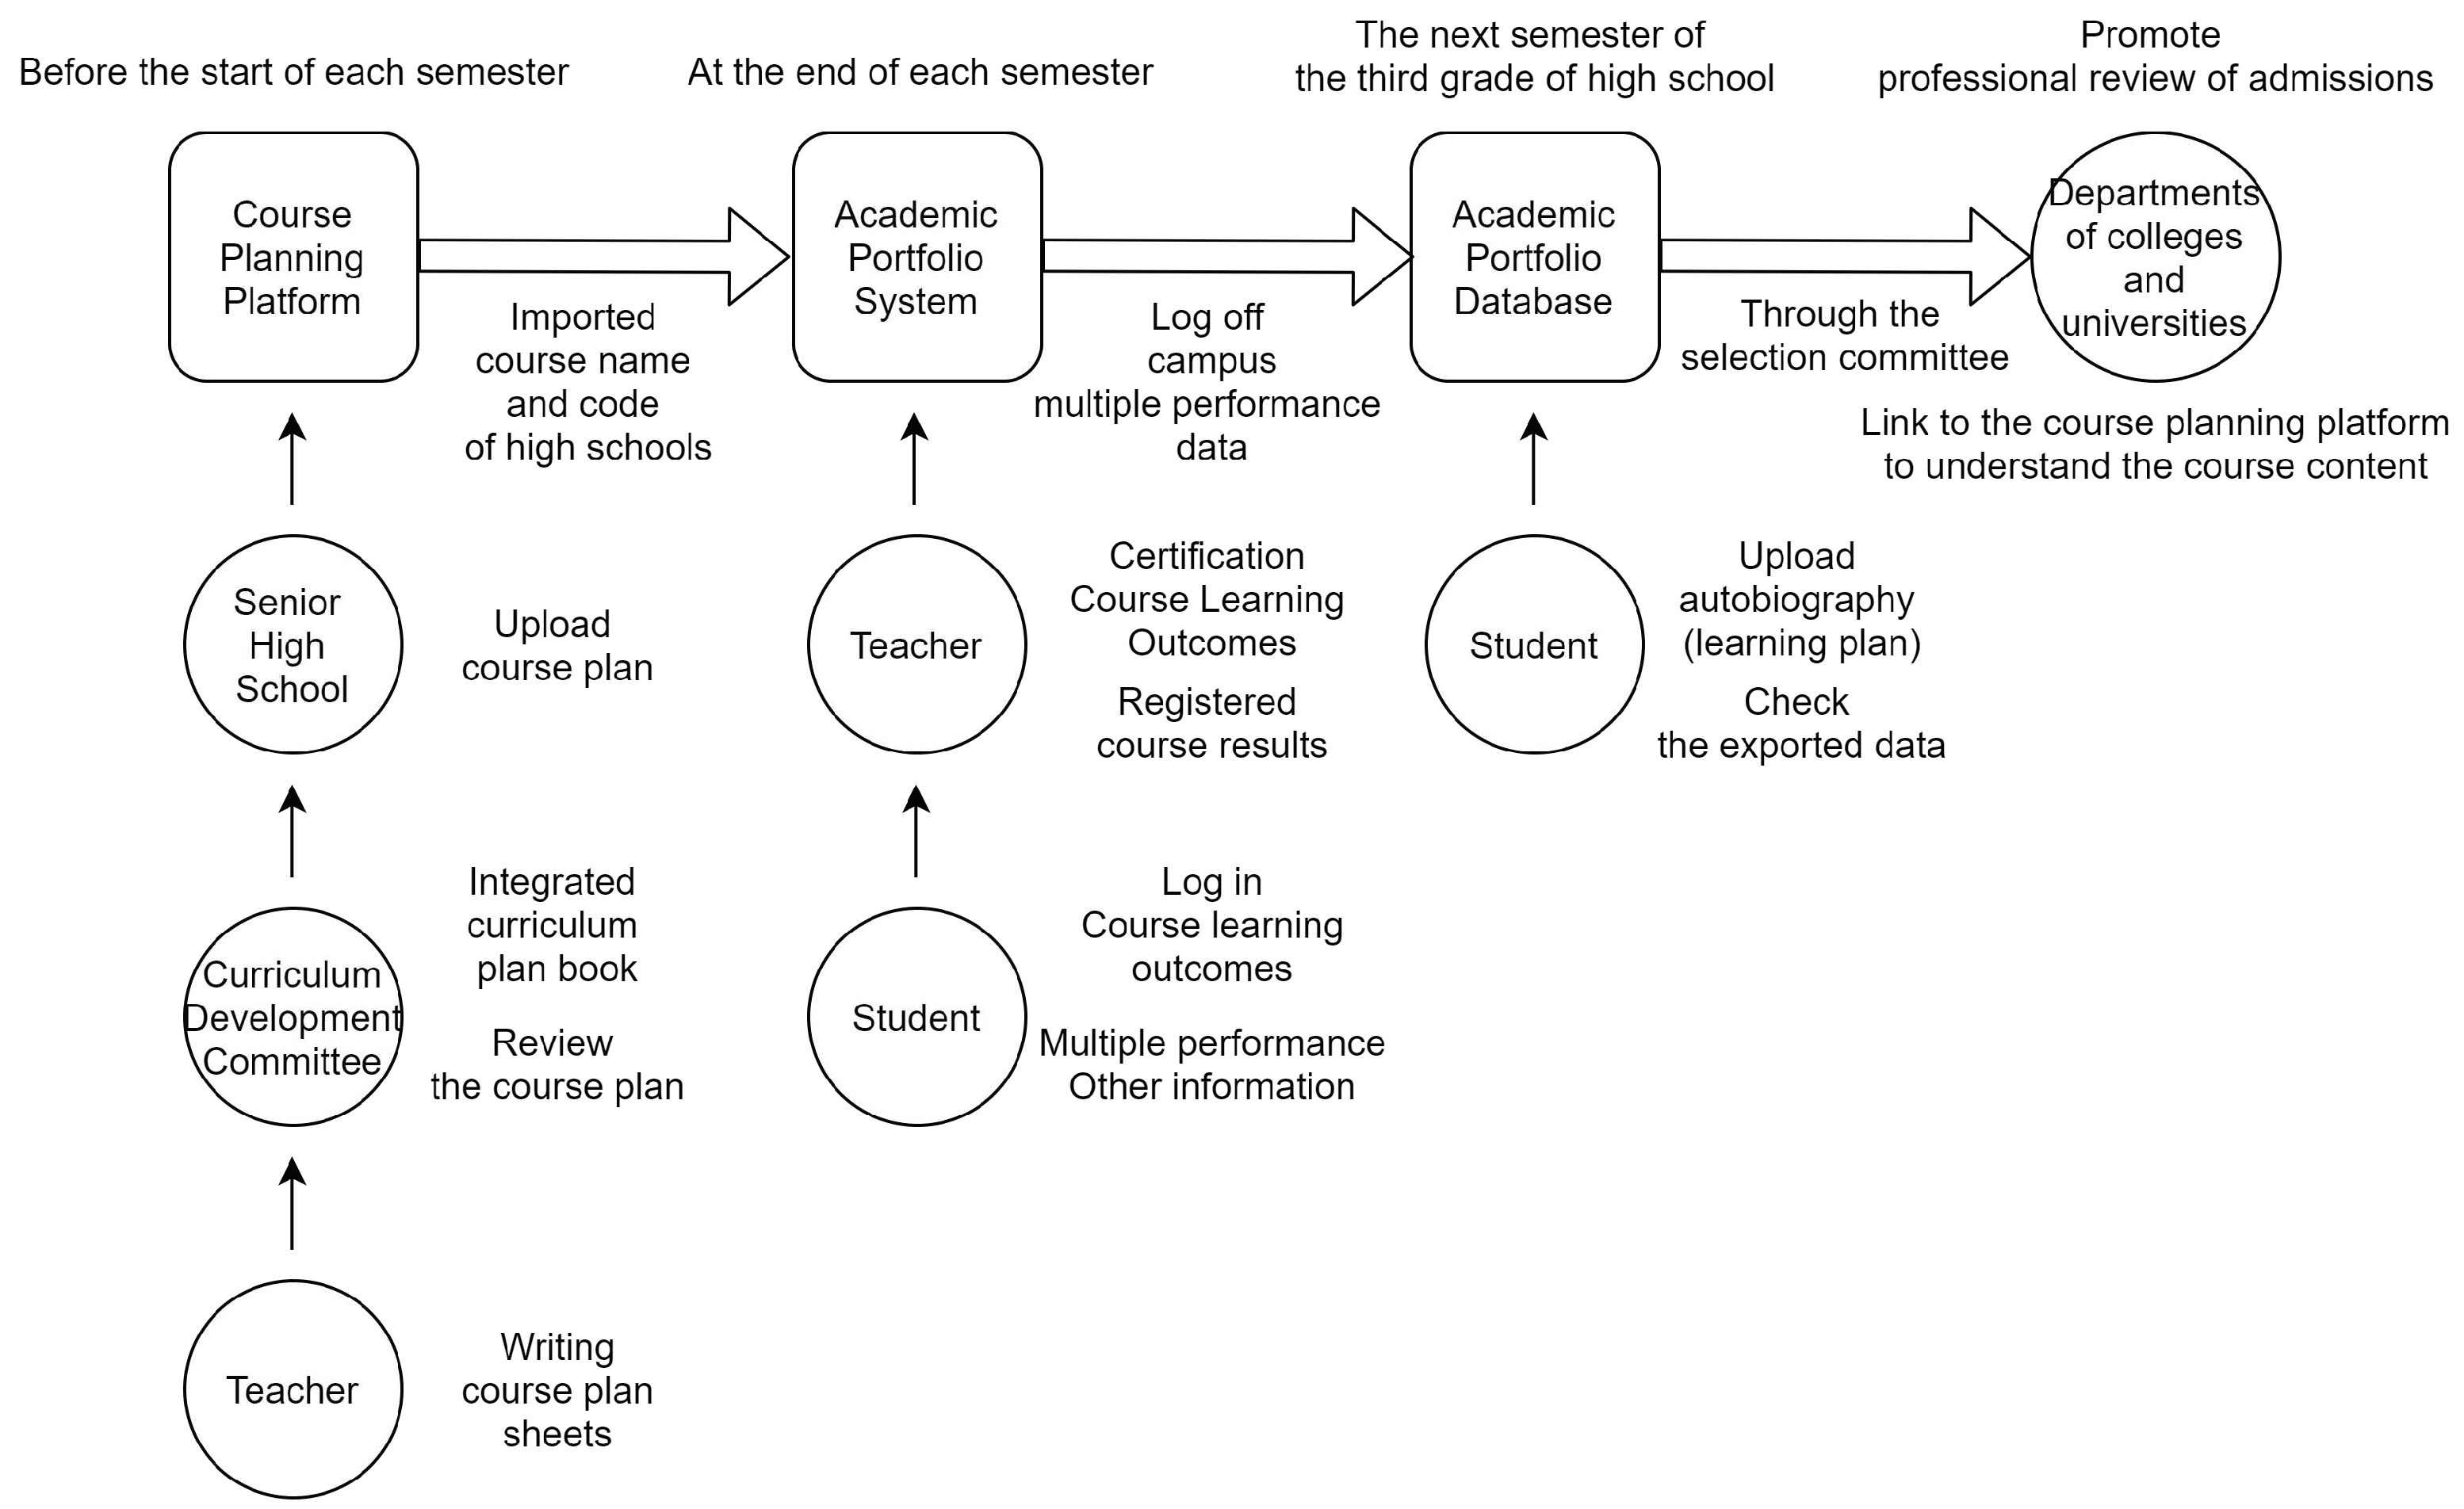
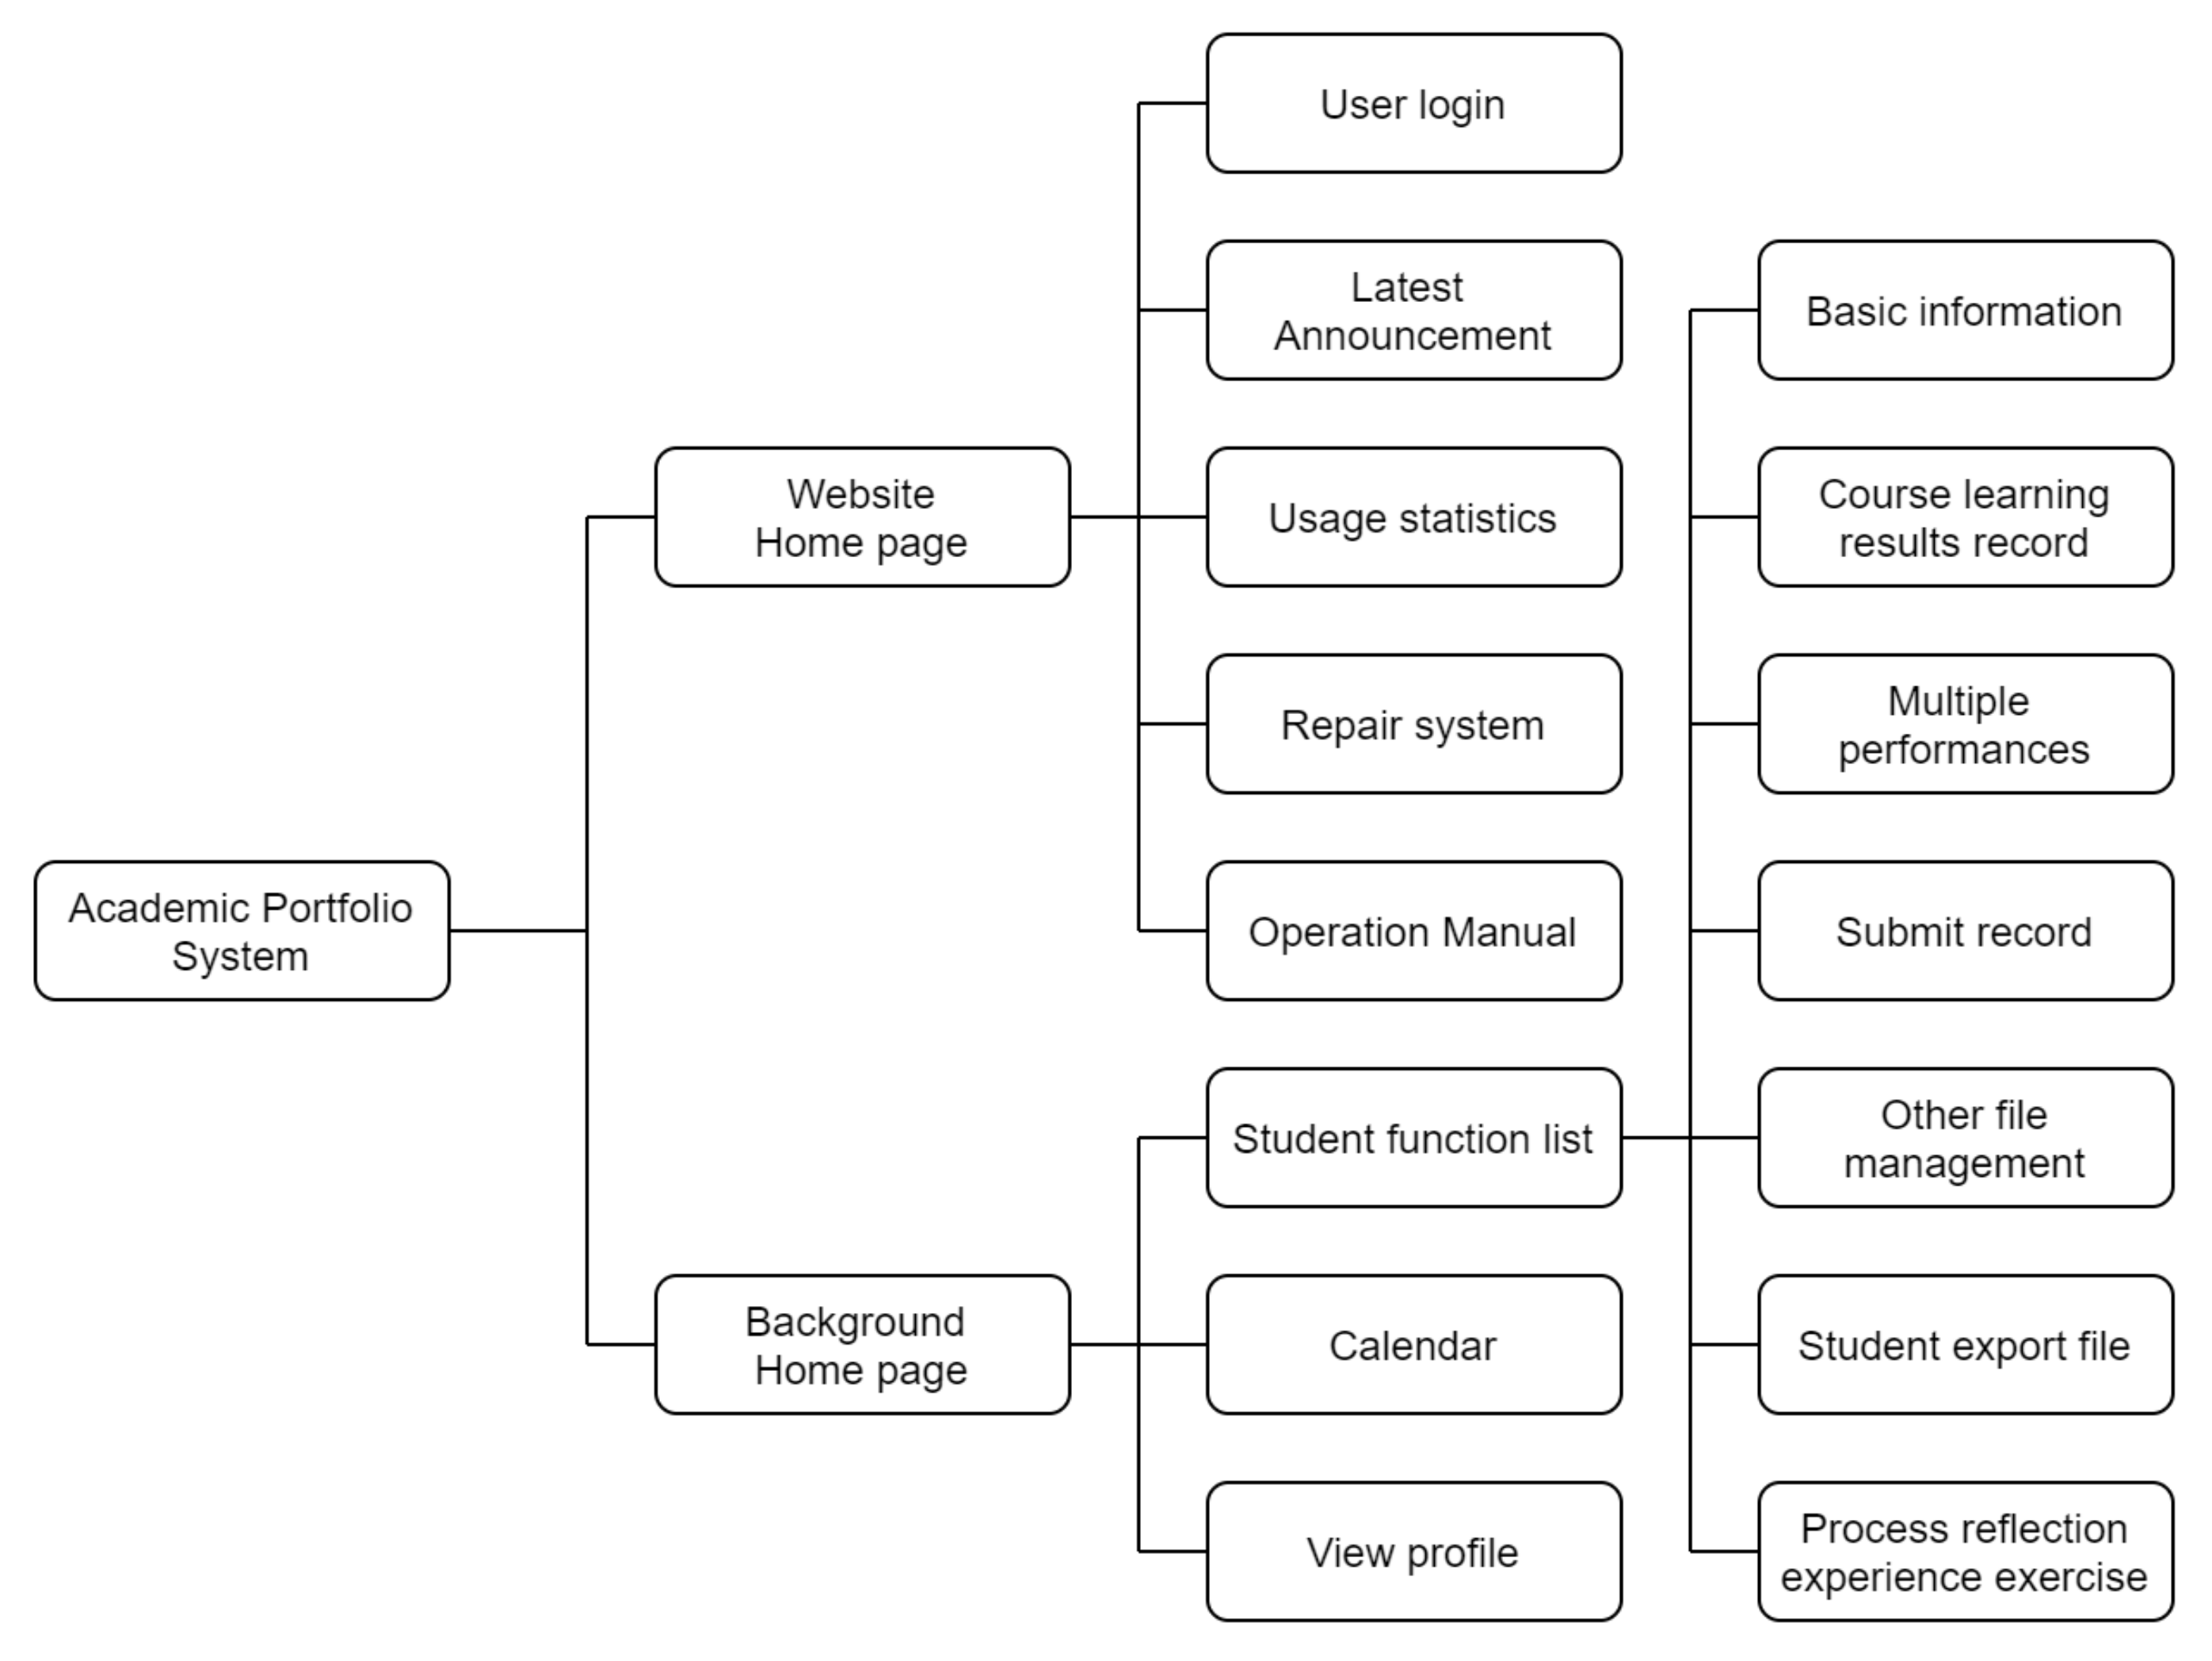
2.3. Academic Portfolio System (APS) in Taiwan

The Elementary School and the Pre-school Education Department of the Ministry of Education in Taiwan announced the 12-year national education “appropriate talent development” plan and the 12-year national basic education syllabus in 2014 [30]. In the overall syllabus, it is stipulated that high schools should complete the collection, processing, and use of students’ academic learning records [31]. National Jinan International University was commissioned to establish the “National High School Student Academic Portfolio Database”, and to develop the public version of the high school student academic portfolio system module. By integrating the students’ academic (such as school performance and course learning results) and non-academic performance (such as activities, competition results, cadre experience, and certifications or licenses) and other data during the school period, a complete track record of the students’ learning would provide colleges and universities with appropriate admission selection. It should gradually simplify the student admission application process and achieve the vision of multiple admissions instead of entry examination only.
After the APS implementation, the student learning history file will be gradually submitted to the central database every semester (or every school year). Therefore, high school students do not need to prepare other review materials when applying to universities. According to the admission requirements of the university and departments, students can check the items in the database and upload the material to the university [32]. Moreover, since the APS file format is unified, the university professor can conduct a review with a clear and consistent data structure. It not only reduces the time of review but also optimizes the quality of the review. The purpose of the APS is to completely record the learning trajectory of students during high school. The information collected includes not only the students’ academic performance but also the non-academic achievements not reflected in the school exam. The collected information is divided into four major items: basic information, course records, course learning results, and diverse performance, as shown in Table 1. All high schools need to upload to the learning history file database within the time specified in the announcement of the National Education Department. The uploaded materials shall not be backtracked to ensure that the students’ learning performance can be recorded instantly, accurately, and neutrally. The operation process of the APS is shown in Figure 1.
The homepage of the APS website is shown in Figure 2. Students, teachers, and administrative staff must log in with their accounts through this platform to operate related functions. The user interface of the APS is mainly divided into two parts: the main homepage and the background homepage. The task-related functions of the APS for students are mainly on the background home page. Figure 3 displays the APS user interface hierarchy structure.

2.4. User Interface Design

User interface design (UI) is very important for the usage of a platform, since it would impact user experience directly, including the ease of use of a new platform [33]. User interface design (engineering) refers to the user interface design of computers, electrical appliances, machines, mobile communication devices, software or applications, and websites under the guidance of user experience and interaction. The goal of user interface design is to make the communication between users and the designed object as simple and efficient as possible when completing users’ tasks. Subsequently, the user interface design process must find a balance between technical functions and visual elements to make the system functional, easy to use, and adaptive to the needs of users [34]. Cox and Walker believed that a good user interface should have at least the following characteristics: user control, learnability, consistency, simplicity, affinity, giving feedback, providing appropriate language, providing user guidance (user manual), and improving user accessibility [35]. Moreover, from the perspective of software design, the user interface refers to the design of communication symbols used by computers and people when interacting [36], generally also known as “Human Machine Interface”. Furthermore, according to Hiltunen, Laukka, and Luom, the user interface (UI) in mobile learning refers to the user environment including menus and various functions used to control mobile devices [37]. In short, the user interface in this study refers to the APS web pages, and the screens that students see when operating the system. We believe that the quality of the system interface design will affect students’ willingness to use it.
There are many related empirical studies on user interface design, including Zhao Yuling and Li Tingting’s research on the use of clinical information systems by nurses in the intensive care unit. Zhao Yuling and Li Tingting believed that if data processing and network speed can be improved, supplemented by interface design that met user needs, it would definitely increase personnel satisfaction with the technology [38]. In addition, according to Zhang Jiaci and Chen Jianxiong, the interface design of the delivery ordering system would indeed affect the utilization rate and satisfaction of the delivery ordering system of chain fast-food restaurants [39]. Furthermore, Guo Junju’s research results found that the expectation of utility and interactivity aspects of the reading interface design on e-magazine applications would clearly affect the users’ willingness to use [40]. Lu Jiazhen, Huang Guoliang, and Shen Yuzhe also specifically mentioned this point in their research on the operation interface for the elderly. For a better understanding, it is very important to simplify the content of the interface and the detailed description of the interface information [41]. In summary, interface design does affect user’s behavior when operating the computer system, website, software, or mobile application.

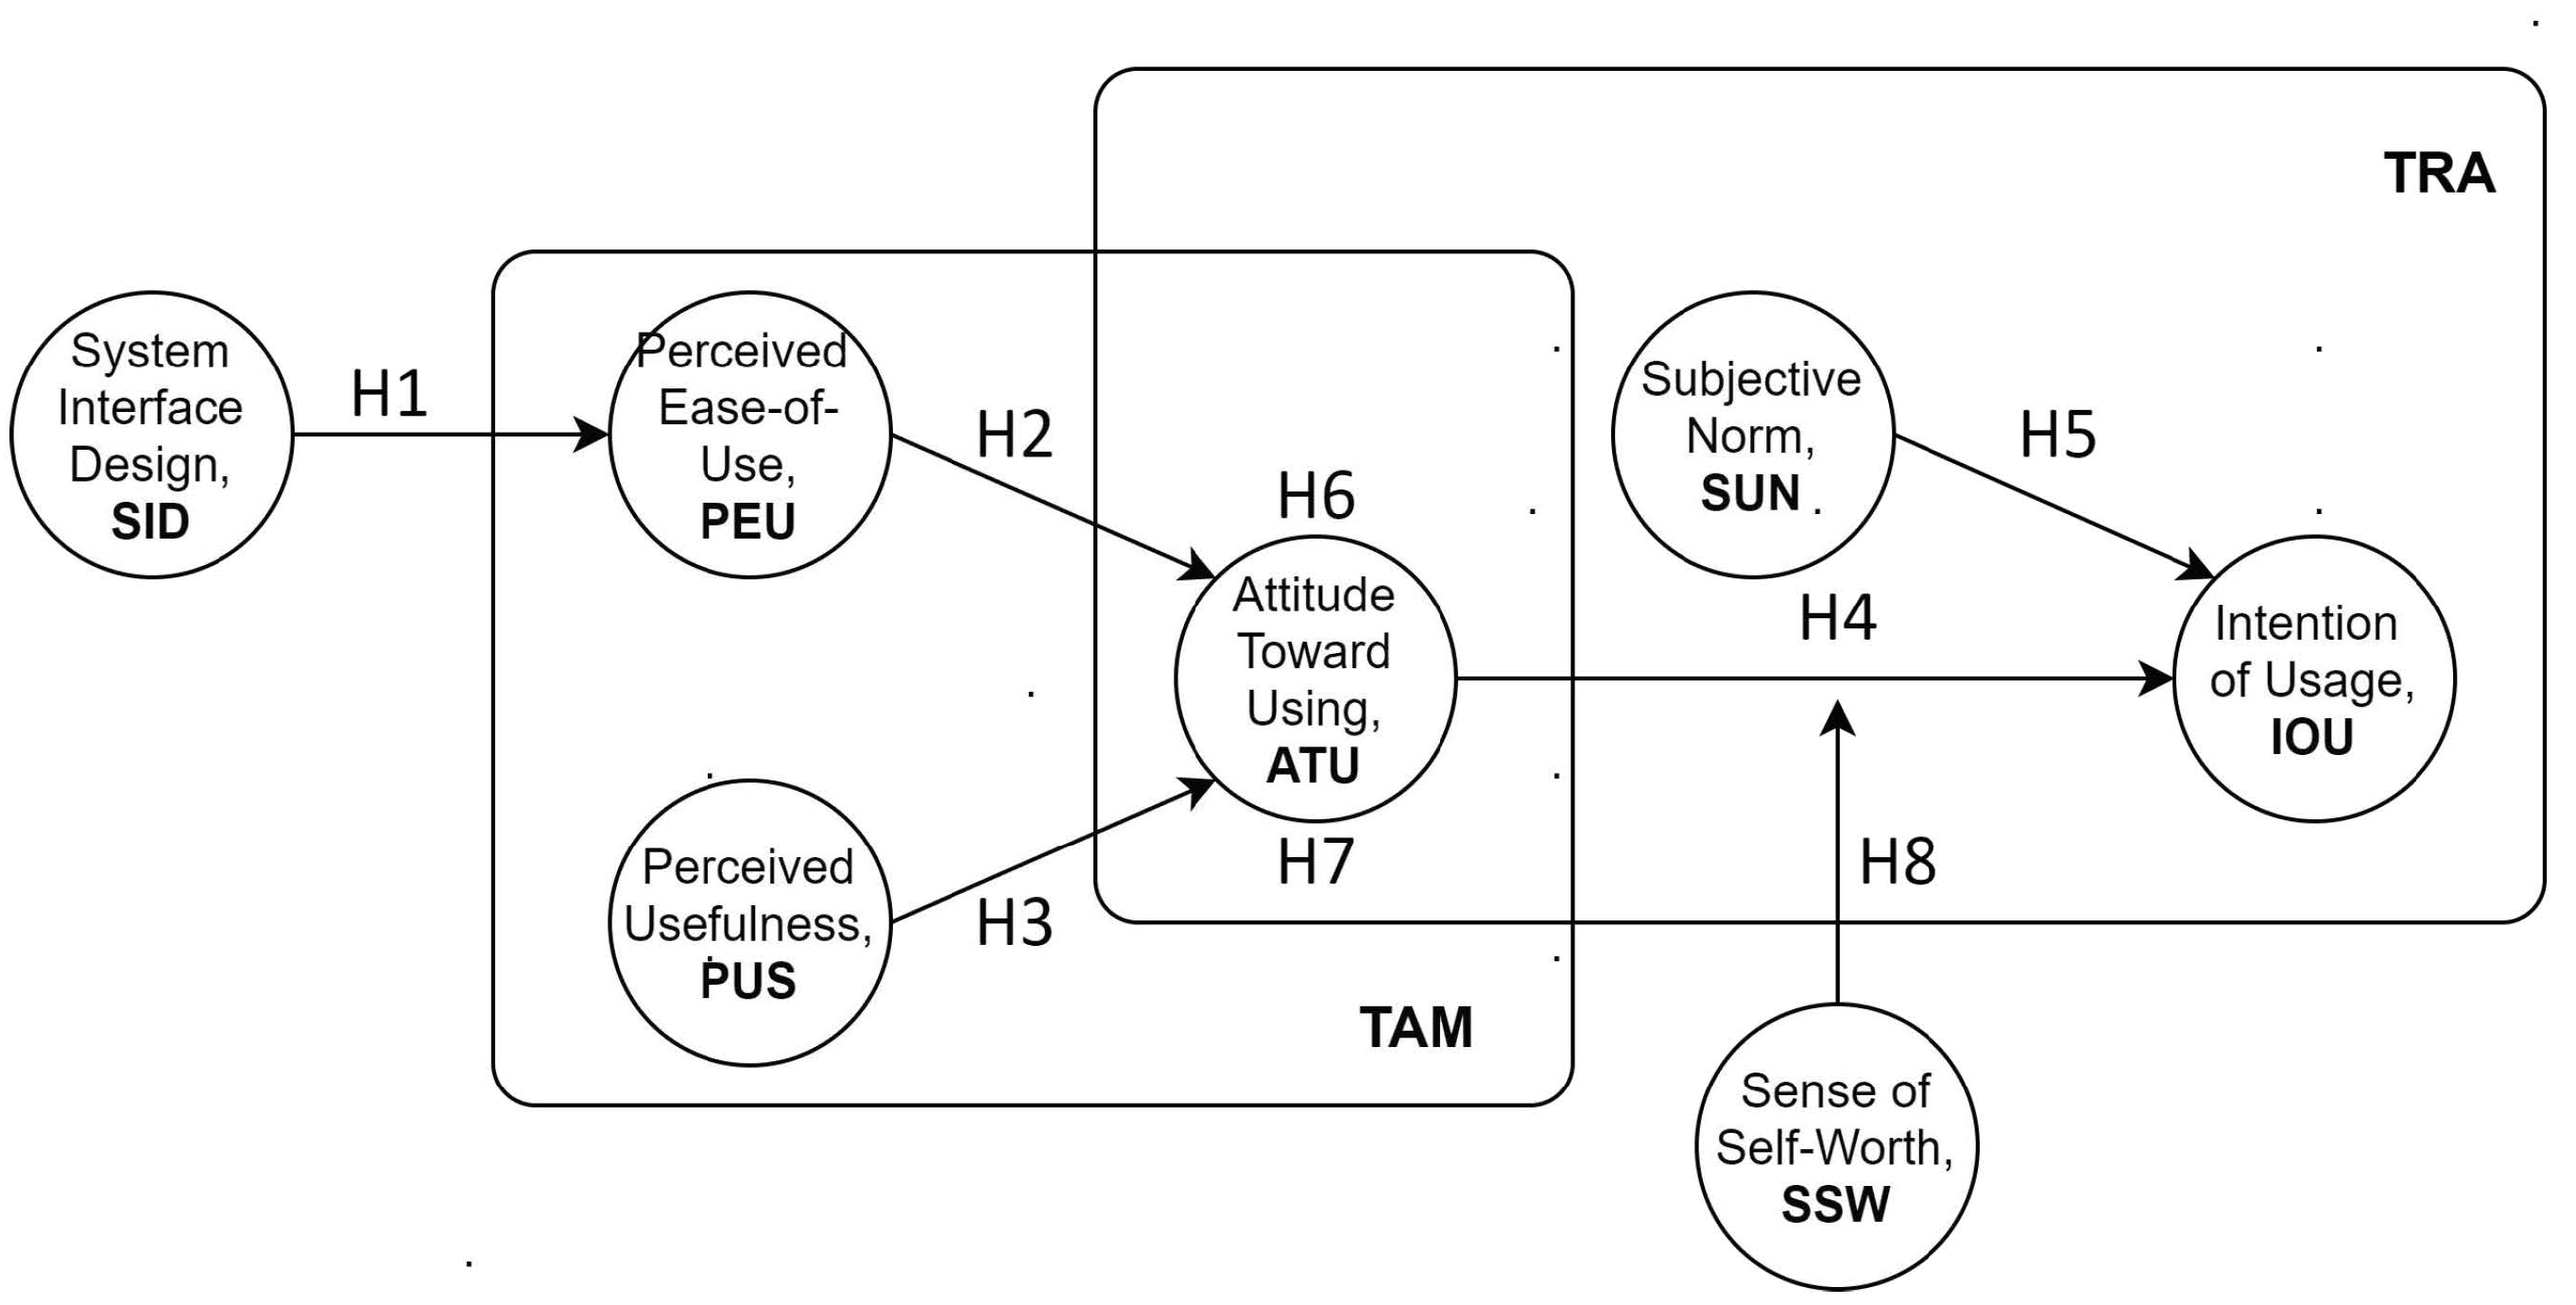
2.5. Technology Acceptance Model (TAM)

Technology acceptance model (TAM) is proposed on the basis of Theory of Reason Action (TRA) [42]. The TAM can explore the user’s acceptance of innovative information technology and explain the individual’s acceptable behavior and attitude toward innovative information systems [43]. The purpose is to provide a theoretical basis for finding the determinants of user acceptance of computers, to improve common explanations, to cross the boundaries of user groups, and to explain and predict user behavior [44,45]. The TAM is similar to the TRA; both of them believe that attitude and intention are affected by belief. The TAM divides belief into two variables, namely, perceived usefulness and perceived ease of use, both of which affect users’ attitudes, and behavioral intentions of information systems. Perceived ease of use refers to the degree to which potential users subjectively believe that learning the operation of an information system is easy. Conversely, if the perceived ease of use is low, it means that the user believes that using the system requires considerable effort. When users perceive that the system is easier to use, they will have a more positive attitude toward the system [44]. In this research, ease of use refers to the degree to which students are aware of the ease of use of the APS. When the perceived ease of use is high, it means that the user would have positive attitude toward the APS.
There are many empirical studies on the relationship between the user interface and perceived ease of use, including the research carried out by Chen et al. on the Coursera interface, which proves that the improvement of Coursera user interface design has significantly improved the cognitive ease of use of the Coursera users [33]. Furthermore, studies on the acceptance of digital learning in an online environment [46], combined with TAM research on user interface and personal innovation [47], all found that user interface design is an important factor that affects learners’ perceived usefulness and ease of use. Moreover, in the investigation of factors affecting behavioral use of mobile devices, it is mentioned that the construction of user interface has three dimensions: design, guidance, and interactivity. When the design of the user interface facilitates user guidance and interaction, users can easily use the system [48].
From the above-mentioned articles, we can conclude that the user interface design has an important influence on the user’s perceived ease of use. This research is aimed at high school and vocational high school students. This research can assume that the students’ perception of the interface design of the APS will positively and significantly affect their perception of ease of use. The research hypothesis H1 is proposed as follows.
Hypothesis 1.
The students’ perception of APS interface design will positively and significantly affect their perception of APS’s ease of use.
The scholars thought that the usage attitude is the user’s feelings about the use of the information system, which may or may not be beneficial to them. The user’s attitude toward using information technology will be affected by both perceived usefulness and perceived ease of use. [49]. In addition, many scholars have pointed out that perceived usefulness and perceived ease of use will positively affect the attitude of using technology products and thus affect the willingness to continue using them. The user’s perceived ease of use of technology products will strengthen the user’s perceived usefulness of technology products, and both the perceived usefulness and perceived ease of use will be affected by external variables [50]. Cheong and Park [51] believed that if users do not need to spend too much time thinking about new information technology, they would feel more positive about this technology. Moreover, Davis and Venkatesh supported the idea that perceived usefulness and perceived ease of use would positively affect the attitude of using technology products, subsequently affecting specific behavioral intentions [52]. Scholars argue that the perceived usefulness and perceived ease of use will positively affect the attitude of using technological products, which, in turn, will affect specific behavioral intentions. In a study on sports health combined with technological acceptance models to explore the behavior of sports bracelets and smartphone users, it is verified that the perceived usefulness and ease of use affect the usage intention, and positively and significantly affect the user behavior [53]. In a study on tourists’ willingness to use agricultural specialty product marketing platforms based on the technology acceptance model, it is proved that both perceived ease of use and perceived usefulness positively and significantly affect attitudes toward using [54].
The above articles show that the perceived usefulness and ease of use affect users’ attitudes and behavioral intentions toward information technology. Based on the APS scenario, this study proposes the following two hypotheses:
Hypothesis 2.
The students’ perception of APS’s ease of use will positively and significantly affect their attitude toward using APS.
Hypothesis 3.
The students’ perception of APS’s usefulness will positively and significantly affect their attitude toward using APS.

2.6. Theory of Reasoned Action, TRA

Theory of reasoned action (TRA) is widely used in social psychology to study the relationship between attitude, intentions, subjective norms, and behaviors. Personal attitudes and subjective norms would affect behavioral intentions, that is, actual behaviors would be affected by the determination of behavioral intentions [55]. Behavioral intention refers to the subjective intensity with which an individual would engage in certain behaviors. The actual behavior is often measured by behavioral intention instead. Secondly, behavior attitude refers to the cognitive beliefs and subjective attitudes that individuals hold when performing certain behaviors. Finally, subjective norms are mainly defined as the influence given by the social environment felt by individuals when they engage in certain behaviors. The main purpose of the theory of reasoned action is to understand the actual behavior of individuals through behavioral intentions and attitudes. Hsu and Lin used the theory of reasoned action as the foundation when studying the acceptance intention of blogs. They proved that technology acceptance and knowledge-sharing factors would affect the attitude of blog users. The attitude of blog users and social influencing factors would further affect the intention of blog users [56].
After many practical verifications, the theory of reasoned action has been widely used in predicting or explaining personal behavior research, including the research carried out by Li Y.-H. et al. on the actual behavior of Instagram users based on the consumer value theory and theory of reasoned action. Li Y.-H. et al. found that attitudes have a significant positive impact on behavioral intention, and behavioral intention has a significant positive impact on actual behavior [57]. Moreover, the study by Yang W.-G. et al. on line graph purchase intention based on rational behavior theory proved that perceived value has a positive impact on attitudes. Perceived value, attitude, and subjective norms would positively affect purchase intention [58]. In addition, Huang P. et al. investigated pregnant women’s exercise behavior and the influencing factors. They verified that the behavioral intentions, behavioral attitudes, and subjective norms would affect actual behaviors [59]. Studies carried out by others, such as online knowledge payment behavior [60], BIM content library website knowledge-sharing behavior [61], marketing field [62], the use of information systems [63,64], and e-commerce transaction behavior [65,66], are widely applied by the theory of reasoned action. Therefore, in this research, based on the theory of reasoned action, the intention to use will be viewed from the perspective of motivational use attitude, and the mediating factors of subjective norms and self-worth will be added to understand their influence on students’ usage intention on the learning history archive system’s website.
Hypothesis 4.
The students’ attitude toward using APS will positively and significantly affect their usage intention of APS.
Hypothesis 5.
The students’ subjective norms of APS will positively and significantly affect their usage intention of APS.
Hypothesis 6.
The students’ perception of APS’s ease of use will positively and significantly affect their usage intention of APS through their attitude toward using APS.
Hypothesis 7.
The students’ perception of APS’s usefulness will positively and significantly affect their usage intention of APS through their attitude toward using APS.

2.7. Self-Worth

The sense of self-worth is the individual’s perception and evaluation of the self (me) as an object in social life to the social subject, including groups and others. The positive self-emotional experience contains a variety of psychological components such as cognition, emotion, attitude, evaluation, and other factors. Its core is self-value judgment and experience. It has a diffuse effect on the individual’s cognition, emotion, and behavior.
Yang Y.-H.’s research found that students’ sense of self-worth as being too high or too low would affect their growth. People with low self-worth could not understand and accept themselves, they are full of conflicts and struggles, and are prone to psychological problems such as anxiety. However, a high sense of self-worth is not necessarily conducive to people’s healthy growth. If higher self-worth is based on unrealistic, excessively exaggerated, or elevated self-concepts, then the sense of self-worth will be higher. It would be more likely to inflate, leading to self-deception or even narcissism [67]. Youth is a stage where self-concepts are formed and tend to mature. Exploring the characteristics of young students’ sense of self-worth will help to further understand the psychological characteristics of young students, thereby providing a psychological basis for cultivating well-rounded talents. Wang H.-M. believed that the sense of self-worth of vocational high school students is the positive emotional experience they have produced in their cognition and evaluation in their study life. The level of self-worth to a large extent determines the success and failure of an individual, which is an important prerequisite and basis for the development of an individual’s personality. It also affects the individual’s physical and mental health. People with a high sense of self-worth will give full play to the inner potential and achieve success in study, work, life, and career [68].
According to Coopersmith S.’s research, people with high self-worth are usually “internally controlled” people rather than “externally controlled” people [69]. Their goal orientation and achievement motivation levels are both high [70,71]. In addition, Lu H.-C.’s research found that people with a high sense of self-worth are more likely to adopt problem-solving and help-seeking methods, rather than practicing patience, giving in to fantasy, or embracing emotional coping attitudes [72]. Huang H.-C.’s research found that an appropriate sense of self-worth will help individuals to correctly attribute success and failure [73] and will also help individuals to actively socialize [74]. In addition, Wu H.-Y. and Zhao Y.-F.’s research also found that poor college students’ overall sense of self-worth, general self-worth, physical self-worth, and socially-oriented interpersonal and psychological self-worth are lower than non-poor college students [75,76]. The research carried out by Kong X.-W. et al. has shown that self-worth has a mediating role in the influence of family and gender concepts on the positive development of female college students [77]. In short, this study intends to reveal if the self-worth of vocational high school students affects the relationship between attitude toward using and their intention of usage of APS. Hypothesis eight is proposed as the following statement.
Hypothesis 8.
Self-worth has a moderating effect on the relationship between students’ attitude toward using and intention of usage of APS.
The following Figure 4 is the research framework of this study, based on the technology acceptance model and theory of reasoned action, to explore the influence of those factors on Taiwan high school students’ intention to use APS and the relationship between the factors. The perceived ease of use and attitude toward using APS are mediating variables, and sense of self-worth is a moderating variable, as shown in the figure below.

3. Methodology

3.1. Data Collection

The research objects are second-year students of regular and vocational high schools in Taiwan, in the 2020 academic year. This study applied a convenient sampling strategy. The sampling scope includes two public high schools, two public comprehensive high schools, two public high vocational schools, two private high schools, two private comprehensive high schools, and two private vocational high schools: a total of twelve high schools. The survey was conducted from 10 November to 20 December 2020. The second-grade students are the first users of the APS. A total of 805 questionnaires were collected. After deducting 93 copies of invalid questionnaires, 712 valid questionnaires were obtained.

3.2. Measurement Instrument

This research questionnaire is divided into two parts: The first part is the items for research variables, including system interface design, perception of ease of use, perceived usefulness, attitude toward using, subjective norm, intention of usage, and sense of self-worth. The questionnaire was designed using Likert’s seven-point scale; “1” means totally disagree, and “7” means totally agree. After the design of the questionnaire was completed, it was reviewed by several scholars. The second part is the students’ basic information, including gender, subject, residence area, parent’s education level and occupation, family economic status, and tutor’s teaching subject. In this study, each latent variable is broken down into 4–9 specific observed variables. Observed variables refer to related research and are described as follows.

3.2.1. Perceived Ease-of-Use (PEU) and Perceived Usefulness (PUS)

According to previous studies, this study designed measurement four items for perceived ease of use [33,44,46,78,79,80], such as whether the APS is simple and time-saving, whether the system user interface is friendly, and whether it requires other people’s teaching to use it. Then, five items were designed for perceived usefulness construct, such as whether the APS can be used to complete the learning track, improve learning results, and multiple performances, and whether it is easier to display learning results, by referencing studies from Hamidi and Chavoshi, Chou, Yun, and Hui, Davis, Chou and Luo, Liao and Wang [44,81,82,83,84].

3.2.2. System Interface Design (SID)

Chen, Teng and Yu [33] believe that the quality of the user interface design will affect the user’s cognitive ease of use of the system or new technology. This research references studies by Liu et al., Lee et al., and Chen et al. to develop items of interface design construct [33,46,78]. The five items included layout configuration, font style, page color, humanized, and overall satisfaction.

3.2.3. Attitude toward Using (ATU)

Attitude is how a person likes and dislikes behaviors or things [85]. Usage attitude refers to the user’s positive or negative evaluation of user behavior. The proposed measurement items are cognitive usefulness, cognitive ease of use, pleasure, and attractiveness [86]. Attitude toward use in this study is defined as students’ positive feelings about using the APS and is affected by the learner’s beliefs such as system interface design, perceived usefulness, and perceived ease of use. According to the previous studies by Ajzen and Fishbein, Chu P.-Y. et al., Fishbein and Ajzen, Guo et al., and Wu M.-Y. and Lin, four items are proposed for measuring attitude toward the usage of the APS, including helpfulness, ease of use, willingness to use, and having a delightful user experience [55,79,86,87,88,89].

3.2.4. Intention of Usage (IOU)

Intention of usage refers to the intensity or frequency of a person’s willingness to engage in a specific behavior. It is an indicator of predictive behavior [55,88]. This study defines the intention of usage as the students’ subjective belief that they are willing to continue to use the APS in the future or further recommend it to others. According to Venkatesh and Davis’s study, “willing to use” and “wish to use” are the indicators for exploring the intention of usage [90]. In addition, referring to Lee and Ke, Tsay and Liang, Chang et al., and Chou and Luo’s studies, four items are proposed to measure intention of usage, including willingness and continuous use, overall willingness to use, and recommending others to use [83,86,91,92].

3.2.5. Subjective Norm (SUN)

Subjective norms are mainly based on “normative beliefs”, which refer to certain behaviors that individuals adopt based on personal perceptions and the expectations or pressures of reference groups such as peers, parents, teachers, and elders. The individuals are determined by reference groups to adopt a “motivation to comply”: the will and motivation for a certain behavior. When the positive subjective norm is stronger, the easier it is to induce the individual to have the behavioral intention to engage in the behavior. According to the previous studies by Hsu and Yu, Fishbein and Ajzen, Chang and Cheng, Ajzen and Driver, it is measured by 6 items pertaining to school, teachers of different identities, classmates, and parents [55,93,94,95,96]; two of which are “The school encourages me to use the Academic Portfolio System” and “My tutor actively encourages me to use the Academic Portfolio System”.

3.2.6. Sense of Self-Worth (SSW)

Sense of self-worth is an important aspect that has a diffuse influence on people’s cognition, emotions, and behaviors. It is also an important aspect that affects people’s mental health. Self-worth is the positive self-emotional experience of an individual in social life that recognizes and evaluates the self (me) as the object to the social subject. It contains a variety of psychological components such as cognition, emotion, attitude, evaluation, and other factors. The core is self-value judgment and experience. The formation of self-worth is closely related to the individual’s environment, and gradually forms one’s own self-evaluation after encountering the environment and the interaction between people. According to the previous studies, by Huang et al., Yang, Safa and Von Solms, Hsu and Chen, Zheng, five items are proposed to measure the sense of self-worth [67,76,97,98,99]; two of those are “For the current study, I feel that my strengths can be used” and “Regardless of success or failure, I believe in the path I choose”.

3.3. Data Analysis

The data analysis of this study will be carried out in three stages: descriptive analysis, measurement model verification, and structural equation model. The first stage, descriptive analysis, includes statistical analysis of population variables, as well as calculating the average and standard deviation of each facet. The second stage is to test the measurement model [100], which would process the reliability and validity of the item through confirmatory factor analysis (CFA), including composite reliability, which measures the degree of internal consistency of various variables, as well as convergent validity and discriminant validity. The third stage is the structural equation model (SEM), which would test the fit of the research model and the hypotheses of the research framework, including model fit analysis, path analysis, and mediation effect analysis.

4. Results

4.1. Descriptive Statistical Analysis

The descriptive statistical analysis of this study includes frequency distribution, item statistical analysis, and differentiation analysis.

4.1.1. Frequency Distribution

The basic information investigated by this research includes 6 items, which are gender, school, high school group, psychological counselor, tutor, and course counselor, as shown in Table 2. In the sample of this study, the ratio of males to females is balanced, with males accounting for 52.11%. The school attributes are public (national and county) and private, accounting for 65.45% and 34.55%, respectively. The general, comprehensive, and technical high schools accounted for 39.04%, 9.97%, and 50.98%. Most of the responsibility for promoting APS lies with high school teachers now. This study surveyed students’ views on the promotion of different teachers, including psychological counselors, tutors, and course counselors. The results of the students’ perception of whether different teachers are helpful to the improvement of APS, the proportions of psychological counselors, counselors, and course counselors who think positively help the system operation are 85.53%, 85.39%, and 89.47%, respectively.

4.1.2. Item Statistical Analysis

From the statistics of each question item, as shown in Table 3, the mean values are between 3.184 and 5.163, and the standard deviations (SD) are between 1.115 and 1.689. The skewness values are between −0.558 and −0.351, and the kurtosis values are between −0.771 and −0.413. All meet the criteria suggested by Kline [101] for judging whether variable data is a normal distribution, according to which the skewness value should be less than 3 and kurtosis value should be less than 10. Then, the lowest average number of items is 3.184, which is “Using the Academic Portfolio System is an enjoyable experience” in the Attitude Toward Usage (ATU) aspect. The highest is “I can value myself” in the Sense of Self-Worth (SSW) dimension, with an average of 5.076. The one with the lowest standard deviation is “I am very familiar with the relevant content of the Academic Portfolio System” in the Perceived Ease-of-Use (PEU) dimension, with the value of 1.115. The one with the highest standard deviation is also a Perceived Ease-of-Use (PEU) aspect, “It does not take much time to learn to use the Academic Portfolio System,” with a value of 1.689.

4.1.3. Differentiation Analysis

In the system interface design aspect, the F-test of the tutor’s assistance to the use of the system reached a significant level (F = 29.40, p = 0.000 < 0.05). After comparing with the Scheffe method, it is found that the students who find the tutor very helpful have a statistically significant difference in the perception of the system design interface compared with other student groups. In addition, in the self-worth dimension, the F test of the degree of assistance of the tutor to the use of the system reached a significant level (F = 12.04, p = 0.000 < 0.05). After comparing with the Scheffe method, it is found that the students who find the tutor very helpful and other groups have a statistically significant difference in their sense of self-worth. The test results are listed in Table 4.

4.2. Measurement Model Verification

The measurement model of this study will be tested for validity, which is convergent validity and discriminant validity.

4.2.1. Convergent Validity

This study used the two-step method of structural equation modeling (SEM) proposed by Anderson and Gerbing to evaluate the measurement and structural models [100]. The first step of using confirmatory factor analysis (CFA) checks the reliability and validity of the constructed model. The second step tested the path effect and its importance to the structural model. The measurement model was evaluated by using maximum likelihood estimation (MLE) in terms of factor loading, measurement reliability, convergence validity, and discriminant validity. Table 5 summarizes the unstandardized factor loading, the standardized factor loading, the standard error, the significance test, the square multiple correlations, the composite reliability (CR), and the extracted average variance (AVE). As Table 4 shows, all standardized factor loadings of questions are from 0.519 to 0.937, falling into a reasonable range. This demonstrates all questions having convergent validity. Then, all the composite reliabilities of the constructs ranging from 0.885 to 0.953 exceed the 0.7 recommended by Nunnally [102]. All constructs have internal consistency. Lastly, all average variance extracted (AVE) ranging from 0.604 to 0.821 exceed the 0.5 suggested by J. F. Hair, Anderson, Tatham, and William and Fornell and Larcker, showing all constructs having adequate convergent validity [100,103]. In statistics and research, internal consistency is an important measure based on the correlations between different items on the same test. It measures whether these items that propose to measure the research construct produce similar scores. According to the above standards, in this study, the internal convergence validity of all constructs meet the standards.

4.2.2. Discriminant Validity

In order to judge the validity, the square root of the average variance extraction (AVE) of a given structure is compared with the correlation between that structure and other structures [103]. If the square root of the constructed AVE is greater than the off-diagonal elements in the corresponding rows and columns, it indicates that the index is more closely related to the structure. As shown in Table 6, the bold numbers on the diagonal indicate the square root of AVE. The discriminative validity analysis is to verify whether there is a statistical difference in the correlation between two different constructs. The topics in different constructs should not be highly correlated. If they are highly correlated, it means that these constructs are measuring the same thing. According to the above standards, since all the numbers on the diagonal are greater than the numbers on the diagonal, the validity of the discrimination seems to be acceptable for all constructions.

4.3. Structural Equation Model

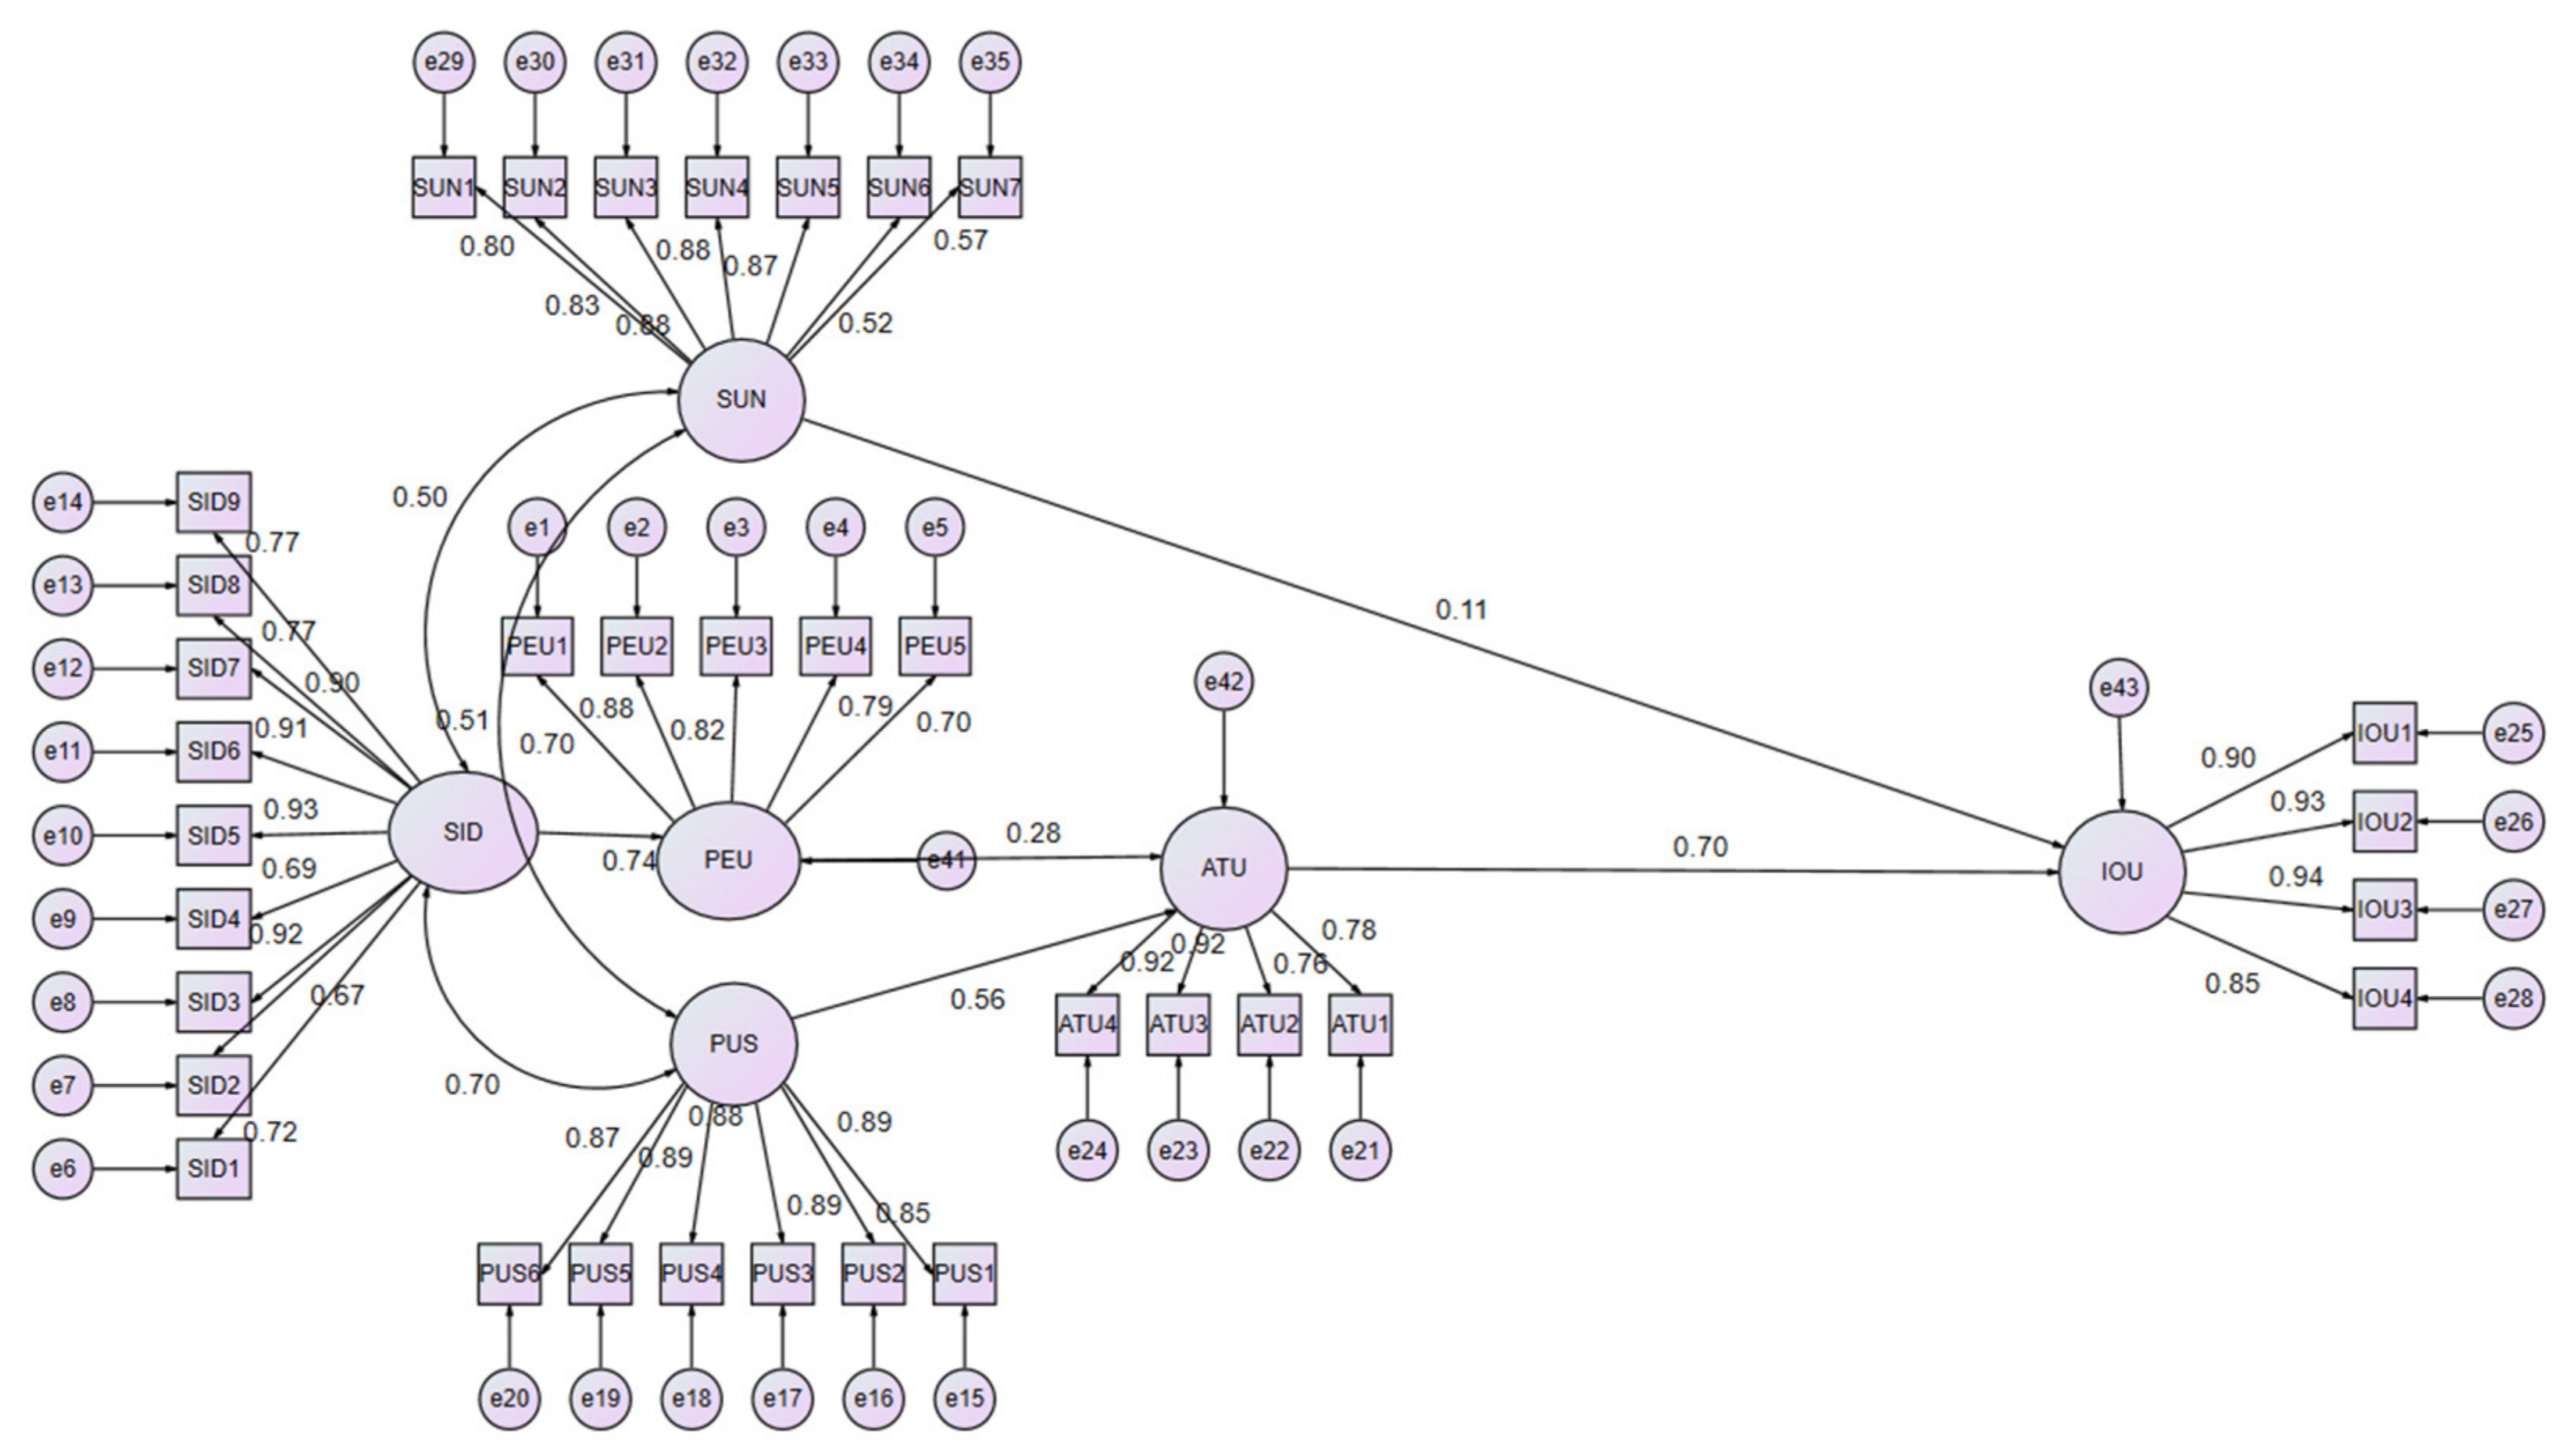
4.3.1. Structural Model Analysis

Schumacker and Lomax [104] and Kline [101] pointed out that due to the analysis of a large number of samples, the p-value will be less than 0.05. The model fitting will be adversely affected. Therefore, quantitative research should use several different methods to test the fit of the model. This study implemented several general models that are applicable to the verification methods proposed by Jackson et al. [105]. Divide chi-square by the degrees of freedom (DF), and the ideal result should be less than 3. In addition, other standards provide more stringent values for model fit verification, as shown in Table 7. For example, the RMSEA value should be less than 0.08 [106]. The CFI standard should be greater than 0.9. The test results are shown below. All tested model fitting standards meet the recommended standards [104].

4.3.2. Path Analysis

Table 8 shows the results of path coefficients. System interface design (b = 0.654, p < 0.001) significantly impacts perceived ease of use. Perceived ease of use (b = 0.404, p < 0.001) and perceived usefulness (b = 0.511, p < 0.001) significantly impact attitude toward using. Attitude toward using (b = 0.897, p < 0.001) and subjective norm (b = 0.141, p = 0.001) significantly impact intention of usage. The results support the research question regarding the validity of the research model. The 54.6% of perceived ease of use can be explained by system interface design. The 55.3% of attitudes toward using can be explained by perceived ease of use and perceived usefulness. The 55.5% of the intention of usage can be explained by attitude toward using and subjective norm. Figure 5 displays the SEM verification result.

4.3.3. Analysis of Mediation Effects

As shown in Table 9, the total effect PEU → IOU, p < 0.05, bias-corrected confidence interval (CI) does not include 0 (CI of PEU → IOU = [0.23 0.522]). The total indirect effect PEU → ATU → IOU does not include 0 (CI of PEU → ATU → IOU = [0.23 0.522]). The total effect PUS → IOU, p < 0.05, bias-corrected confidence interval (CI) does not include 0 (CI of PUS → IOU = [0.319 0.598]). The total indirect effect PUS → ATU → IOU does not include 0 (CI of PUS → ATU → IOU = [0.319 0.598]). The existence of total indirect effect was supported.
Sense of self-worth is a moderator in our proposed model. However, ATU*SSW to IOU is 0.008 (z = |0.076| < 1.96, p = 0.940). As p ≥ 0.05, moderating effect does not exist, as shown in Table 10.

5. Conclusions and Discussion

The aim of this research is mainly to investigate the behavioral intention of Taiwanese high school students to use APS and explore its influencing factors. Based on the theory of reasoned action (TRA) and the technology acceptance model (TAM), combined with the “system interface design” factor along with attitude as the mediating variable, and self-worth as the moderating variable, the research framework and related hypotheses are proposed. After collecting data through questionnaire surveys, the model is tested by the structural equation model, and the related hypotheses are verified.

5.1. Theoretical Implication

5.1.1. The Influence of System Interface Design, Perceived Ease of Use, and Perceived Usefulness on Students’ Attitudes toward Using APS

From the results of this study, the system interface design of APS (b = 0.739, p < 0.001) has a significant positive impact on the perceived ease of use. The proportion is very high. This result is the same as the results from previous studies [33,46,47,48]. In the aspect of “System Interface Design”, the average score is 4.563, showing a generally positive view. Students are generally slightly satisfied with the overall system layout, font style, layout color, and interface control. The average scores on perceived ease of use and perceived usefulness are 4.093 and 4.106, which are generally positive. The results are the same as the results of previous studies [33,46,47,48]. The item average score of “I am very familiar with the relevant content of the Academic Portfolio System” reaches 4.562 (SD = 1.115). Most students actually agree on APS. It also means that the school has put considerable effort into the promotion of relevant content before implementing the system. Moreover, the item average score of “It does not take much time to learn to use the Academic Portfolio System” is only 3.545 (SD = 1.689). Students feel more hesitant and expect to spend more time learning how to use APS. It is not easy to get started using APS for students. This is an important fact for system designers when developing APS revision.
Particularly worth mentioning is the attitude toward using the construct: the average score is only 3.642. Item three, “I like to use the Academic Portfolio System” (Mean = 3.199), and item four, “Using the Academic Portfolio System is an enjoyable experience” (Mean = 3.184), are far below 4. The students’ attitude toward the use of APS is obviously not good. How to improve the students’ perception of the usage attitude is an important topic. In addition, the perceived ease of use (b = 0.284, p < 0.001) and perceived usefulness (b = 0.556, p < 0.001) have a significant positive impact on the attitude toward using APS. The results are the same as those presented by previous studies [49,50,51,52,53,54], which are in line with the framework of the technology acceptance model (TAM). Among them, perceived usefulness (b = 0.556) is more important than perceived ease of use (b = 0.284) for predicting usage attitude.

5.1.2. The Influence of Subjective Norms, Attitudes toward Using, and Sense of Self-Worth on the Intention of Usage

From the results of this research, students’ attitudes toward using (b = 0.696, p < 0.001) and subjective norms (b = 0.109, p = 0.001) have a significant positive impact on the intention of usage. This result is the same as the result of past research [55,56,57,58,59,60,61,65,66], which is in line with the framework of the theory of reasoned action (TRA). Among them, the average number of items in the “subjective norms” dimension is 4.882~5.056. Based on the items, schools and teachers actively promote and encourage students to use APS. However, peers (Mean = 3.588) and parents (Mean = 3.909) have low average scores, having less influence on students. In addition, among all the items in the sense of self-worth construct, item 1, “For the current study, I feel that my strengths can be used”, has the lowest average: 4.212. The other four items have the average of 4.212~5.048, which means that students have a positive sense of self-worth. Moreover, the sense of self-worth is a moderating variable between the attitude toward using and intention of usage, ATU*SSW to IOU being 0.008 (z = |0.076| < 1.96, p = 0.940). As p ≥ 0.05, the sense of self-worth does not have a significant moderating effect between students’ attitude and intention.

5.1.3. The Influence of Perceived Ease of Use, Perceived Usefulness, and Attitudes on the Intention of APS

Analysis of Mediation Effects shows that the total effect of perceived ease of use on intention of usage is positively significant (p < 0.05) (bias-corrected confidence interval (CI) of PEU → IOU = [0.23 0.522]). The total effect of perceived usefulness on intention of usage is positively significant (p < 0.05) (bias-corrected confidence interval) (CI of PUS → IOU = [0.319 0.598]). Moreover, the total indirect effect of perceived ease of use, which affects intention of usage through attitude toward using, is positively significant (CI of PEU → ATU → IOU = [0.23 0.522]). The total indirect effect of perceived usefulness, which affects intention of usage through attitude toward using, is positively significant (CI of PUS → ATU → IOU = [0.319 0.598]). This result is the same as the results of previous studies [55,56,57,58,59,60,61,65,66].
Through the analysis of variance, the F test of the degree of assistance of the instructor to the use of the system in the interface design dimension reached a significant level (F = 29.40, p = 0.000 < 0.05). After comparing with the Scheff method, the two groups of students who think the instructor is very helpful (83 people) and helpful (258 people) really feel that the interface design is better, achieving a significant level. In addition, in the self-worth dimension, the F test of the degree of assistance of the tutor to the use of the system reached a significant level (F = 12.04, p = 0.000 < 0.05). After comparing with the Scheff method, in the two groups of students who think that the tutor is very helpful (83 people) and helpful (258 people), the sense of self-worth is also higher and achieves a significant level. Obviously, the encouragement attitude and sense of self-worth of the instructor have a positive and significant impact on the system interface design.

5.2. Practical Implication

In order to implement the twelve-year national education plan of “appropriate talent development”, the Taiwan Ministry of Education has established a national senior high school APS to consolidate students’ academic performance during school. It also includes non-academic performance such as activities, competition results, cadre experience, and certificates. APS would provide complete records of student learning trajectories as an appropriate selection of colleges and universities admission. APS would gradually simplify the student admission application process and achieve the vision of multiple enrollments. In addition, the advantages of APS include responding to the 108 new syllabi with multiple curriculum features, showing students’ characteristics, learning trajectories, and accumulating a three-year high school learning track.
However, since the official implementation of the 108 syllabi in 2019, there have been many controversies, such as “the uncertainty of teachers, students, and parents about unknown results”, “traditional ideological stereotypes for entering higher education”, and “obvious lack of sufficient support measures”. Although the purpose is good, this unknown and untried area worries students and parents. Many students and parents strongly oppose APS and demand that the government abolish it. In addition, in the early stages of implementation, various problems caused by unclear policy details or system operations have appeared. This research shows that APS has a high degree of satisfaction in terms of layout, font style, layout color, and overall interface. However, schools still need to strengthen learning support resources. Students are also strongly encouraged to use APS from the school and related personnel. Indeed, students also have a high sense of self-worth, but they still cannot perceive and relate to the future use of APS, which greatly reduces the willingness and attitude to use it. This is indeed an important reference for future policies to promote improvement.
Therefore, based on the results of this research, the following five aspects are recommended to enhance students’ behavioral intentions in using APS.
  • Education Policy
This study found that students’ attitudes and intentions are very low. Obviously, because this policy promotes insufficient communication and eager implementation, it leads to a passive and repulsive mentality among students. The authorities should enhance the promotion and explain the benefits of APS. It is hoped that students will be able to fully experience the advantages of digitization, systematization, and certification of university admission materials. In this vision, the education authorities should also urge the university departments to clearly announce the participation and evaluation scales. Moreover, the implementation problems of high schools need to be treated as a top priority.
2.
APS usage
This study found that there is still room for improvement in APS system interface design (SID). APS should continue conducting user research and collecting user feedback to optimize user-related interfaces, functions, and processes, and provide detailed system operation instructions, guides, videos, or animation. Moreover, providing help desks to deal with related problems would be a good idea. Additionally, the system development may address concerns in real-time, making the system operation friendlier and more comfortable.
3.
High school promotion
This study found that high schools do their best to promote APS and actively encourage students to use it. However, due to insufficient attitude and intention of students toward APS, it is difficult to achieve significant performance in the short term. It is recommended that high schools should strengthen communication, implement counseling work, and actively care for students’ needs, establish a dedicated webpage to continuously collect and update relevant information, introduce external training resources, provide examples of demonstration, train class seed teachers, share resources, deepen the content, and achieve both quantitative and qualitative changes.
4.
Teachers
This study found that the school’s front-line mentors, curriculum consultants, and tutors who face students can gain high trust from students. They are an important driving force and have a positive and significant impact on the promotion of policies and systems. Therefore, it is recommended that relevant teachers take a positive attitude toward learning, encourage and supervise students to have a deep understanding of APS, and to implement individual and group consultations for career exploration, guidance, suggestions, and certification.
5.
Students
This study found that although students have a poor attitude and intention to use the system, they still show a high sense of self-worth. It is suggested that students should really understand the good intentions behind the establishment of the system and the development of APS, that is, gradually collect the complete learning process, year by year. APS would improve the quality of review data, which would effectively display students’ personal learning trajectory, growth potential, exploration enthusiasm, and learning attitude when applying for college. It is difficult to see the perfect benefits of any system and strategy in the short term. Only through continuous adjustments and amendments can the system be perfected.

5.3. Research Limitations and Future Direction

This study mainly sampled high school students in northern Taiwan. The proportions of public and private schools in the sample are 65.45% and 34.55%. However, public and private schools may face differences in APS promotion strategies and may not be able to fully present different types of students. In addition, the majority of students in this sample are technical (50.98%), general (39.04), and comprehensive (9.97%) high school students. In the future, the research target could be further extended for general and comprehensive high school students. Furthermore, this research is mainly based on students. In the future, other relevant stakeholders can be adopted as the research objects, such as high school administrative staff, tutors, class teachers, course consultants, or students’ parents. There are more aspects to understand about the promotion and use of APS.

Author Contributions

All authors contributed to the paper. Conceptualization, Y.-C.C. and T.-Y.C.; writing—original draft preparation, Y.-C.C.; writing—review and editing, T.-Y.C.; visualization, T.-Y.C. All authors have read and agreed to the published version of the manuscript.

Funding

This research received no external funding.

Institutional Review Board Statement

Not applicable.

Informed Consent Statement

Informed consent was obtained from all subjects involved in the study.

Data Availability Statement

Not applicable.

Conflicts of Interest

The authors declare no conflict of interest.

References

  1. Huang, I.-C.; Chen, I.-C. The Problem of Entering Advanced Schools in Taiwan: A Sociology of Education Review on Theory and Research. Taiwan J. Sociol. Educ. 2005, 5, 77–118. [Google Scholar]
  2. Yang, K.-S.; Yeh, C.-C. Current Social Problems in Taiwan: Educational Issues under Progressionism; Chuliu Publisher: Taipei, Taiwan, 1984. [Google Scholar]
  3. Chu, H.-Y. Pursue high educational achievement: An Analysis of Taiwan’s Educational System and Value during Qing Dynasty and the Japanese occupation period. Taiwan J. Sociol. Educ. 2003, 3, 1–39. [Google Scholar]
  4. Wang, C.-W.; Lin, W.-Y. Progression System and Syndrome of Progression; Avant-garde Publisher: Taipei, Taiwan, 1994; pp. 502–539. [Google Scholar]
  5. Huang, C.-C.; Wu, W.-H.; Li, L.-S.; Lin, S.-T. Educational Reform of Senior High Schools in 2000 in Taiwan; National Institute of Educational Resources and Research: Taipei, Taiwan, 1994.
  6. Tang, C.-M. Review and Improvement of the Multiple Enrollment Plan for Senior High School Vocational Education. Theory Policy 2003, 16, 89–107. [Google Scholar]
  7. Education, M.O. The Ministry of Education’s 12-Year National Basic Education 108 Curriculum Information Network: Student’s Academic Portfolio. Available online: https://12basic.edu.tw/edu-3.php (accessed on 20 February 2021).
  8. Fang, C.-F.; Cheng, C.-C. Development f a Coomprehensive Tutoring Student’s Academic Portfolio in a Technical High School—Mechanical Department as an Example. Taiwan Educ. Rev. Mon. 2020, 9, 121–128. [Google Scholar]
  9. Education, M.o. Estimated Results of the Number of Students in the Expected Education Stage for the 107–122 Academic Year. Available online: https://reurl.cc/Q7MQNo (accessed on 28 April 2021).
  10. Lin, I.-C. Student’s learning journey -high school practice. Taiwan Educ. Rev. 2020, 724, 33–37. [Google Scholar]
  11. Huang, H.-F. Observation of New Curriculum Students Academic Portfolio in the practice scene of ordinary senior middle schools. Taiwan Educ. Rev. 2020, 724, 25–32. [Google Scholar]
  12. Chan, P.-H.; Hou, H.-T. Exploring the Application Mode of High School Learning Process Archives from the Theory of Social Cognitive Career. Taiwan Educ. Rev. Mon. 2017, 6, 201–208. [Google Scholar]
  13. Peng, A. Request 108 Curriculum Guidelines High School Curriculum to Remove the Academic Portfolio Item. Available online: https://join.gov.tw/idea/detail/3e6063a1-5be0-4791-86c9-3801532c75d4 (accessed on 28 April 2021).
  14. Chen, Y.-Y. Is the Academic Portfolio Helpful for Exploration, or Is It a Waste of Time? Available online: https://flipedu.parenting.com.tw/article/6185 (accessed on 27 April 2021).
  15. Chao, Y.-N. Is It Time for High School Students to Upload Their Academic Portfolios? The K-12 Education Administration Allows Extension of Time. Available online: https://udn.com/news/story/121690/5010358 (accessed on 28 March 2021).
  16. Wu, S.-H. Is the Candle Burning at Both Ends? Lots of Chaos in the Academic Portfolio. The Ministry of Education Intends to Announce the Guiding Principles and Establish a Communication Platform. Available online: https://www.storm.mg/article/3199847 (accessed on 10 April 2021).
  17. Chang, P.-C.; Tseng, C.-C. Inquiry into the Teaching Design and Practice of Learning Process in the New Curriculum Guidelines of High School Mathematics. Sci. Educ. Mon. 2020, 428, 58–64. [Google Scholar] [CrossRef]
  18. Ball, S.J. Policy Sociology and Critical Social Research: A Personal Review of Recent Education Policy and Policy Research. Br. Educ. Res. J. 1997, 23, 257–274. [Google Scholar] [CrossRef]
  19. Fay, B. Social Theory and Political Practice (RLE Social Theory); Routledge: London, UK, 2014. [Google Scholar]
  20. Ball, S.; Maguire, M.; Braun, A.; Perryman, J.; Hoskins, K. Assessment Technologies in Schools: ‘Deliverology’ and the ‘Play of Dominations’. Res. Pap. Educ. 2012, 27, 513–533. [Google Scholar] [CrossRef]
  21. Heimans, S. Education Policy Enactment Research: Disrupting Continuities. Discourse: Stud. Cult. Politics Educ. 2014, 35, 307–316. [Google Scholar] [CrossRef]
  22. Webb, P.T.; Gulson, K.N. Policy Scientificity 3.0: Theory and Policy Analysis in-and-for this World and Other-Worlds. Crit. Stud. Educ. 2015, 56, 161–174. [Google Scholar] [CrossRef]
  23. Aikens, K.; McKenzie, M.; Vaughter, P. Environmental and Sustainability Education Policy Research: A Systematic Review of Methodological and Thematic Trends. Environ. Educ. Res. 2016, 22, 333–359. [Google Scholar] [CrossRef]
  24. Lougheed, P.; Bogyo, B.; Brokenshire, D.; Kumar, V. Formalizing electronic portfolios in the SPARC ePortfolio tool. In Proceedings of the SW-EL/05: Applications of Semantic Web Technologies for E-Learning Workshop at K-CAP/05 International Conference, Amsterdam, The Netherlands, 18–22 July 2005; pp. 9–18. [Google Scholar]
  25. Cavaller, V. Portfolios for Entrepreneurship and Self-Evaluation of Higher Education Institutions. Procedia Soc. Behav. Sci. 2011, 12, 19–23. [Google Scholar] [CrossRef] [Green Version]
  26. Strudler, N.; Wetzel, K. Costs and Benefits of Electronic Portfolios in Teacher Education: Faculty Perspectives. J. Comput. Teach. Educ. 2008, 24, 135–142. [Google Scholar] [CrossRef]
  27. Barrett, S. A portfolio system of climate treaties. Post Kyoto Int. Clim. Policy Implement. Archit. Agreem. 2010, 8, 240–270. [Google Scholar]
  28. Palmer, S.; Holt, D.; Hall, W.; Ferguson, C. An Evaluation of an Online Student Portfolio for the Development of Engineering Graduate Attributes. Comput. Appl. Eng. Educ. 2011, 19, 447–456. [Google Scholar] [CrossRef] [Green Version]
  29. Metz, S.M.-V.; Albernhe-Giordan, H. E-Portfolio: A Pedagogical Tool to Enhance Creativity in Student’s Project Design. Procedia Soc. Behav. Sci. 2010, 2, 3563–3567. [Google Scholar] [CrossRef]
  30. Ministry of Education. Curriculum Guidelines of 12-Year Basic Education_General Guidelines; Ministry of Education, Ed.; Ministry of Education: Taipei City, Taiwan, 2014.
  31. K-12 Education Administration. The Main Points for Promoting the Work of Students’ Academic Portfolio in Senior High Schools; Ministry of Education: Taipei City, Taiwan, 2019.
  32. Chen, Y.-J. Analysis of Academic Portfolio in the 108 Curriculum Guidelines. Taiwan Educ. Rev. Mon. 2020, 9, 91–93. [Google Scholar]
  33. Chen, Y.; Teng, F.; Yu, Z. A Study on the User’ Actual Use and the Behaviors Influencing Factors in Online Learning Platform of Coursera. Adv. Educ. 2018, 8, 254–268. [Google Scholar] [CrossRef]
  34. Kunjachan, M.A.C. Evaluation of Usability on Mobile User Interface; University of Washington: Bothell, WA, USA, 2011. [Google Scholar]
  35. Cox, K.; Walker, D. User-Interface Design; Prentice-Hall, Inc.: Hoboken, NJ, USA, 1992. [Google Scholar]
  36. Li, S.-C. A Discussion of the User Interface. Audio-Vis. Educ. Bimon. 1993, 36, 49–57. [Google Scholar]
  37. Hiltunen, M.; Laukka, M.; Luomala, J. Mobile User Experience; Hanvit Media: Seoul, Korea, 2007. [Google Scholar]
  38. Chao, Y.-L.; Lee, T.-T. A Study of the Satisfaction of Nurses with the Clinical Information System in Intensive Care Units. J. Nurs. Healthc. Res. 2015, 11, 109–118. [Google Scholar] [CrossRef]
  39. Chang, C.-T.; Chen, C.-H. The Research on the Interface Usability of Chain Fast Food Delivery and Ordering Platform. Ind. Des. 2019, 139, 31–36. [Google Scholar]
  40. Kuo, J.-J. A Study on Reading Interface Design of Electronic Magazine Apps. J. InfoLib Arch. 2019, 92–127. [Google Scholar] [CrossRef]
  41. Lu, C.-C.; Huang, K.-L.; Shen, Y.-C. The Impact of the Design of Interface of Multimedia Information System on the Usability of Elderly Users. J. Des. 2017, 22, 49–66. [Google Scholar]
  42. Davis, F.D.; Bagozzi, R.P.; Warshaw, P.R. User Acceptance of Computer Technology: A Comparison of Two Theoretical Models. Manag. Sci. 1989, 35, 982–1003. [Google Scholar] [CrossRef] [Green Version]
  43. Schepers, J.; Wetzels, M. A Meta-Analysis of the Technology Acceptance Model: Investigating Subjective Norm and Moderation Effects. Inf. Manag. 2007, 44, 90–103. [Google Scholar] [CrossRef]
  44. Davis, F.D. Perceived Usefulness, Perceived Ease of Use and User Acceptance of Information Technology. MIS Q. 1989, 13, 319–340. [Google Scholar] [CrossRef] [Green Version]
  45. Bagozzi, R.P.; Davis, F.D.; Warshaw, P.R. Development and Test of a Theory of Technological Learning and Usage. Hum. Relat. 1992, 45, 659–686. [Google Scholar] [CrossRef]
  46. Liu, I.-F.; Chen, M.C.; Sun, Y.S.; Wible, D.; Kuo, C.-H. Extending the TAM Model to Explore the Factors that Affect Intention to Use an Online Learning Community. Comput. Educ. 2010, 54, 600–610. [Google Scholar] [CrossRef]
  47. Joo, Y.J.; Lee, H.W.; Ham, Y. Integrating User Interface and Personal Innovativeness into the TAM for Mobile Learning in Cyber University. J. Comput. High. Educ. 2014, 26, 143–158. [Google Scholar] [CrossRef]
  48. Nikou, S.A.; Economides, A.A. Mobile-Based Assessment: Investigating the Factors that Influence Behavioral Intention to Use. Comput. Educ. 2017, 109, 56–73. [Google Scholar] [CrossRef]
  49. Taylor, S.; Todd, P.A. Understanding Information Technology Usage: A Test of Competing Models. Inf. Syst. Res. 1995, 6, 144–176. [Google Scholar] [CrossRef]
  50. Benbasat, I.; Dexter, A.S.; Todd, P. The Influence of Color and Graphical Information Presentation in a Managerial Decision Simulation. Hum. Comput. Interact. 1986, 2, 65–92. [Google Scholar] [CrossRef]
  51. Cheong, J.H.; Park, M.C. Mobile Internet Acceptance in Korea. Internet Res. 2005. [Google Scholar] [CrossRef]
  52. Davis, F.D.; Venkatesh, V. A Critical Assessment of Potential Measurement Biases in the Technology Acceptance Model: Three Experiments. Int. J. Hum. Comput. Stud. 1996, 45, 19–45. [Google Scholar] [CrossRef] [Green Version]
  53. Chang, C.-M.; Hus, C.-C.; Chao, C.-S.; Shih, K.-S. A Study of the Behavior of Smart Phones and Fitness Trackers Users through Health Belief Model Combined with Technology Acceptance Model. J. Sport Recreat. Res. 2020, 14, 1–13. [Google Scholar] [CrossRef]
  54. Chen, H.-T.; Wang, C.-H.; Lee, M.-Y.; Cheng, H.-Y.; Chen, Y.-C.; Chiu, S.-H.; Cheng, H.-R.; Huang, P.-W.; Liu, Y.-C. Exploring the Tourists’ Intention of Use on Agricultural and Special Product Marketing Platform by Technology Acceptance Model. J. Leis. Recreat. Ind. Manag. 2020, 13, 63–84. [Google Scholar] [CrossRef]
  55. Fishbein, M.; Ajzen, I. Belief, Attitude, Intention and Behavior: An Introduction to Theory and Research. Philos. Rhetor. 1977, 10. [Google Scholar] [CrossRef]
  56. Hsu, C.-L.; Lin, J.C.-C. Acceptance of Blog Usage: The Roles of Technology Acceptance, Social Influence and Knowledge Sharing Motivation. Inf. Manag. 2008, 45, 65–74. [Google Scholar] [CrossRef]
  57. Li, Y.-H.; Huang, J.-W.; Chiu, Y.-J. The Study of the Actual Behavior of Instagram Users: Theory of Consumption Value and Theory of Reasoned Action. Manag. Res. 2016, 16, 31–57. [Google Scholar]
  58. Yang, W.-G.; Yang, S.-T.; Yang, C.-C. A Study of The Theory of Reasoned Action on LINE Stickers Purchase Intention. J. Sport Recreat. Manag. 2016, 13, 94–106. [Google Scholar] [CrossRef]
  59. Huang, P.; Peng, W.-T.; Luo, B.-R. A Survey and Analysis of Exercise Among Pregnant Women Conducted Using the Theory of Reasoned Action. J. Nurs. 2016, 63, 50–59. [Google Scholar] [CrossRef]
  60. Li, G.; Lu, Y.-Q.; Teng, S.-Y. Analysis of Knowledge Payment Behavior Based on Theory of Planned Behavior. Res. Libr. Sci. 2018, 10, 49–60. [Google Scholar]
  61. Lin, H.; Chang, C.-Y. Research on Knowledge Sharing Behavior of BIM Content Database Websites Based on the Theory of Reasoned Action. Proj. Manag. Technol. 2016, 1, 14–19. [Google Scholar]
  62. Oliver, R.L.; Bearden, W.O. Disconfirmation Processes and Consumer Evaluations in Product Usage. J. Bus. Res. 1985, 13, 235–246. [Google Scholar] [CrossRef]
  63. Liker, J.K.; Sindi, A.A. User Acceptance of Expert Systems: A Test of the Theory of Reasoned Action. J. Eng. Technol. Manag. 1997, 14, 147–173. [Google Scholar] [CrossRef]
  64. Mykytyn, P.P., Jr.; Harrison, D.A. The Application of the Theory of Reasoned Action to Senior Management and Strategic Information Systems. Inf. Resour. Manag. J. IRMJ 1993, 6, 15–26. [Google Scholar] [CrossRef]
  65. Gentry, L.; Calantone, R. A Comparison of Three Models to Explain Shop-Bot Use on the Web. Psychol. Mark. 2002, 19, 945–956. [Google Scholar] [CrossRef]
  66. Korzaan, M.L. Going with the Flow: Predicting Online Purchase Intentions. J. Comput. Inf. Syst. 2003, 43, 25–31. [Google Scholar]
  67. Yang, Y.-H. My Opinions on the Cultivation of Higher Vocational College Students’ Sense of Self-worth. Sci. Technol. Inf. 2012, 1, 309–319. [Google Scholar]
  68. Wang, H.-M. The Status Quo and Countermeasures of Higher Vocational High School Students’ Self-worth. Hum. Resour. Manag. 2009, 9, 57–58. [Google Scholar]
  69. Coopersmith, S. The Antecedents of Self-Worth; H Freeman and Company: San Francisco, CA, USA, 1965. [Google Scholar]
  70. Chang, Y.; Huang, H.-T. The Characteristics of Achievement Motivation of People with Low Feeling of Self-Worth. J. Southwest Univ. Soc. Sci. Ed. 1999, 25, 82–86. [Google Scholar]
  71. Zheng, H.-Y.; Liu, X.-M.; Mo, L. The Relationship between Eighth Graders Perceived Teacher-Expectancy, Self-Worth and Goal Orientation. Psychol. Dev. Educ. 2004, 20, 16–22. [Google Scholar]
  72. Lu, H.-C. A Study of the High School Students’ Sense of Self-Worth, Coping Styles and Mental Health. Chin. J. Clin. Psychol. 2002, 10, 195–196. [Google Scholar]
  73. Huang, H.-C. The function of self-worth and its enlightenment to education. J. Fujian Norm. Univ. Philos. Soc. Sci. Ed. 2001, 2, 127–132. [Google Scholar]
  74. Leary, M.R.; Downs, D.L. Interpersonal Functions of the Self-Worth Motive. In Efficacy, Agency and Self-Worth; Springer: Berlin, Germany, 1995; pp. 123–144. [Google Scholar]
  75. Wu, H.-Y.; Zhao, Y.-F. Self-Worth of College Students with Economic Disadvantage. J. Southwest Univ. Soc. Sci. Ed. 2007, 33, 6–9. [Google Scholar]
  76. Huang, H.-T.; Feng, S.-H.; Wang, W.-H. The Establishment of a National Norm for Adolescent Students’ Sense of Self-Worth. J. Psychol. Sci. 2003, 26, 194–198. [Google Scholar]
  77. Kong, X.-W.; Wang, Q.-X.; Li, X.-M. The Influence of Family Gender Concept on the Positive Development of Female College Students-Mediating Role of Self-Worth. Psychologies 2020, 15, 78. [Google Scholar]
  78. Lee, D.; Moon, J.; Kim, Y.J.; Mun, Y.Y. Antecedents and Consequences of Mobile Phone Usability: Linking Simplicity and Interactivity to Satisfaction, Trust and Brand Loyalty. Inf. Manag. 2015, 52, 295–304. [Google Scholar] [CrossRef]
  79. Wu, M.-Y.; Lin, I.-C. A Study of Taiwan Universities’ Intention and Behavior to Use Library 2.0. J. Libr. Inf. Sci. Res. 2011, 6, 139–180. [Google Scholar]
  80. Chen, Y.-L.; Zheng, S.-H. Digital Learning and Virtual Community in Adult Education: A Study of Behavioral Intention in Blended Learning. J. Inf. Manag. 2010, 17, 177–196. [Google Scholar] [CrossRef]
  81. Hamidi, H.; Chavoshi, A. Analysis of the Essential Factors for the Adoption of Mobile Learning in Higher Education: A Case Study of Students of the University of Technology. Telemat. Inform. 2018, 35, 1053–1070. [Google Scholar] [CrossRef]
  82. Hung-Chou, L.; Te-Yung, C.; Su-Hui, K. Effects of Social Influence and System Characteristics on Traceable Agriculture Product Reuse Intention of Elderly People: Integrating Trust and Attitude using the Technology Acceptance Model. Jiaoyu Kexue Yanjiu Qikan 2018, 63, 291. [Google Scholar] [CrossRef]
  83. Chou, C.-Y.; Luo, L. Exploring the Attitude Differentiation on e-Learning Systems Based on TAM: The Strength of Growth Need as A Moderator. Inf. Manag. 2014, 21, 83–106. [Google Scholar]
  84. Liao, Y.-C.; Wang, J.-F. Factors Affecting Enterprises’ Attitudes on Mobile Commerce and Their Economic Implications. Taiwan J. Appl. Econ. 2016, 100, 183–216. [Google Scholar]
  85. Ajzen, I. From Intentions to Actions: A Theory of Planned Behavior; Springer: Berlin, Germany, 1985; pp. 11–39. [Google Scholar]
  86. Tsay, Y.-J.; Liang, C.-M. A Study of Using Information System Success Model and Technology Acceptance Model to Explore Health Information System for Elementary School. Kaohsiung Norm. Univ. J. Sci. Technol. 2009, 35–59. [Google Scholar] [CrossRef]
  87. Chu, P.-Y.; Huang, C.-W.; Weng, S.-P. Factors Influencing the Adoption of Real-Time Traffic Information Systems: Test of an Integrated Model. J. E-Bus. 2008, 10, 173–200. [Google Scholar] [CrossRef]
  88. Ajzen, I.; Fishbein, M. Attitudes and the Attitude-Behavior Relation: Reasoned and Automatic Processes. Eur. Rev. Soc. Psychol. 2000, 11, 1–33. [Google Scholar] [CrossRef]
  89. Guo, M.-H.; Liao, H.-T.; Hsiao, L.-L.; Wang, T.-Y. The Influence of Information Privacy Concern on Users’ Intentional Behavior in Social Networking Websites—An Example on Facebook. J. Inf. Manag. 2014, 21, 341–363. [Google Scholar]
  90. Venkatesh, V.; Davis, F.D. A Theoretical Extension of the Technology Acceptance Model: Four Longitudinal Field Studies. Manag. Sci. 2000, 46, 186–204. [Google Scholar] [CrossRef] [Green Version]
  91. Chang, C.-T.; Su, P.-C.; Ho, H.-P.; Su, P.-S. Extending the TAM for the Voice Message Board Interactive Function of Website. J. E-Bus. 2009, 11, 469–487. [Google Scholar] [CrossRef]
  92. Lee, C.-Y.; Ke, H.-R. A Study on the User Acceptance and Usage Behavior of Federated Search Systems. J. Educ. Media Libr. Sci. 2012, 49, 30–62. [Google Scholar] [CrossRef]
  93. Hsu, Y.-C.; Yu, T.-K. Constructing an Intentional Model of Visiting Internet Café: A Selected Group of College Students. Bull. Educ. Psychol. 2006, 37, 257–274. [Google Scholar] [CrossRef]
  94. Chang, C.-P.; Cheng, C.-F. The Study of High School Students’ Intentions to Participate in Sports Clubs. Phys. Educ. J. 2009, 42, 95–112. [Google Scholar] [CrossRef]
  95. Ajzen, I. The Theory of Planned Behavior. Organ. Behav. Hum. Decis. Process. 1991, 50, 179–211. [Google Scholar] [CrossRef]
  96. Ajzen, I.; Driver, B.L. Application of the Theory of Planned Behavior to Leisure Choice. J. Leis. Res. 1992, 24, 207–224. [Google Scholar] [CrossRef]
  97. Safa, N.S.; Von Solms, R. An Information Security Knowledge Sharing Model in Organizations. Comput. Hum. Behav. 2016, 57, 442–451. [Google Scholar] [CrossRef]
  98. Hsu, S.-T.; Chen, C.-H. A Correlational Study of Sexual Attitude, Self-Worth and Love Styles among Girls in Halfway School. NPUST Humanit. Soc. Sci. Res. Pedagog. 2016, 10, 32–51. [Google Scholar] [CrossRef]
  99. Zheng, H.-Y. The Relationship between Eighth Graders Teacher-Expectancy Perception, Self-Worth and Goal Orientation. J. South China Norm. Soc. Sci. Ed. 2010, 3, 32–36. [Google Scholar]
  100. Anderson, J.C.; Gerbing, D.W. Structural Equation Modeling in Practice: A Review and Recommended Two-Step Approach. Psychol. Bull. 1988, 103, 411. [Google Scholar] [CrossRef]
  101. Kline, R.B. Principles and Practice of Structural Equation Modeling; Guilford Publications: New York, NY, USA, 2015. [Google Scholar]
  102. Nunnally, J.C. The Assessment of Reliability; Tata McGraw-Hill Education: New York, NY, USA, 1994. [Google Scholar]
  103. Fornell, C.; Larcker, D.F. Evaluating Structural Equation Models with Unobservable Variables and Measurement Error. J. Mark. Res. 1981, 18, 39–50. [Google Scholar] [CrossRef]
  104. Schumacker, R.E.; Lomax, R.G. A Beginner’s Guide to Structural Equation Modeling; Routledge: London, UK, 2012. [Google Scholar]
  105. Jackson, D.L.; Gillaspy, J.A., Jr.; Purc-Stephenson, R. Reporting Practices in Confirmatory Factor Analysis: An Overview and Some Recommendations. Psychol. Methods 2009, 14, 6. [Google Scholar] [CrossRef] [PubMed]
  106. Hu, L.T.; Bentler, P.M. Cutoff Criteria for Fit Indexes in Covariance Structure Analysis: Conventional Criteria Versus New Alternatives. Struct. Equ. Model. A Multidiscip. J. 1999, 6, 1–55. [Google Scholar] [CrossRef]
Figure 1. The APS operation flow chart.
Sustainability 13 08394 g001
Figure 2. Homepage of the Academic Portfolio System website.
Sustainability 13 08394 g002
Figure 3. The Academic Portfolio System user interface hierarchy diagram.
Sustainability 13 08394 g003
Figure 4. The research model of APS’s intention of usage.
Sustainability 13 08394 g004
Figure 5. SEM statistic model.
Sustainability 13 08394 g005
Table 1. Data list of the APS database.
ItemContentRemark
1. Basic InformationStudent identificationThe school will log in and check within the specified time of each semester.
2. Course recordSubjects and academic
performance
3. Course learning resultsStudents’ practical works
and reports in class
Upload up to six pieces per semester.
Must be certified by the teacher.
4. Multiple performancesCadre experience, competition results, certification license, volunteer service, camp, workshops, personal creation or invention, etc.At most, ten items can be registered per academic year.
Note: Data source from this study.
Table 2. Frequency distribution table.
VariableValue LabelFrequencyPercentAccumulated Percent
GenderMale37152.1152.11
Female34147.89100
Total712100
SchoolPublic (national and county)46665.4565.45
Private24634.55100
Total712100
GroupOrdinary high school27839.0439.04
Comprehensive high school719.9749.02
Technical High School36350.98100
Total712100
Psychological Counselor Very helpful8511.9411.94
Helpful28640.1752.11
Slightly helpful23833.4385.53
Unhelpful10314.47100
Total712100
TutorVery helpful8311.6611.66
Helpful25836.2447.89
Slightly helpful26737.585.39
Unhelpful10414.61100
Total712100
Course CounselorVery helpful7710.8110.81
Helpful29040.7351.54
Slightly helpful27037.9289.47
Unhelpful7510.53100
Total712100
Note: Data source from this study.
Table 3. Mean and standard deviation of items.
ConstructItemMeanSD 1SkewnessKurtosis
Perceived Ease-of-Use,
PEU
I am very familiar with the relevant content of the Academic Portfolio.4.5621.1150.351−0.494
Using the Academic Portfolio system is very simple.4.1701.415−0.004−0.365
The Academic Portfolio System provides a very friendly operation interface.4.3341.359−0.146−0.067
It does not take much time to learn to use the Academic Portfolio System.3.5451.6890.226−0.771
Even if no one taught me to use the Academic Portfolio System, I can still operate it.3.8551.5430.144−0.526
Total 4.093
System
Interface Design,
SID
The function of the Academic Portfolio System layout configuration is clear.4.7581.219−0.170−0.146
The font style of the Academic Portfolio System is easy to read.5.0201.201−0.346−0.092
The layout color of the Academic Portfolio System is very comfortable.4.9161.209−0.255−0.005
The Upload Interface for Course Learning Outcomes is very easy to operate.4.4191.386−0.130−0.267
The Upload Interface for Multiple Performances Outcomes is very easy to operate.4.4101.343−0.085−0.180
The Check Interface for Course Learning Outcomes is very easy to operate.4.4421.366−0.120−0.188
The Check Interface for Multiple Performances Outcomes is very easy to operate.4.4301.355−0.091−0.201
The interface of the Academic Portfolio System is very user-friendly4.2951.327−0.0680.004
Overall, I am very satisfied with the interface design of the Academic Portfolio System.4.3781.240−0.0090.355
Total 4.563
Perceived Usefulness,
PUS
Using the Academic Portfolio System allows me to completely record the learning trajectory tasks during school.4.1991.415−0.010−0.398
Using the Academic Portfolio System allows me to more quickly record the performance of my learning trajectory during school.4.0661.4270.064−0.399
Using the Academic Portfolio System can increase the number of my [course learning results].4.1731.390−0.173−0.037
Using the Academic Portfolio System can increase the number of my [multiple performances].4.2391.378−0.1920.005
Using the Academic Portfolio System makes the presentation of my learning results easier to complete.4.0371.4590.024−0.335
On the whole, it is very useful to use the Academic Portfolio System to record my learning journey.3.9231.490−0.118−0.361
Total 4.106
Attitude Toward
Using, ATU
I think the Academic Portfolio System is helpful to me.4.1181.434−0.303−0.170
I think the Academic Portfolio System is easy to use for me.4.0651.407−0.057−0.318
I like to use the Academic Portfolio System.3.1991.5010.165−0.495
Using the Academic Portfolio System is an enjoyable experience.3.1841.5160.213−0.453
Total 3.642
Intention
of Usage,
IOU
I am willing to use the Academic Portfolio System.3.7681.588−0.064−0.581
In the future, I hope to continue to use the Academic Portfolio System.3.3711.5870.117−0.609
Overall, my willingness to use the Academic Portfolio System is quite high.3.2111.5230.240−0.444
I would recommend the Academic Portfolio System for others to use.3.2121.5910.310−0.483
Total 3.391
Subjective Norm,
SUN
The school encourages me to use the Academic Portfolio System.5.1631.367−0.558−0.039
My tutor actively encourages me to use the Academic Portfolio System.5.0561.460−0.544−0.097
My counselor actively encourages me to use the Academic Portfolio System.4.8641.431−0.4580.063
My course consultant actively encourages me to use the Academic Portfolio System.4.8671.413−0.4370.062
My other teachers also encourage me to use the Academic Portfolio System.4.8821.379−0.407−0.008
My classmates agree that I use the Academic Portfolio System.3.5881.5350.026−0.373
My parents also agree that I use the Academic Portfolio System.3.9091.379−0.1520.413
Total 4.618
Sense of Self-Worth, SSWFor the current study, I feel that my strengths can be used.4.2121.433−0.2440.064
Regardless of success or failure, I believe in the path I choose.5.0481.428−0.5200.073
I can value myself.5.0761.479−0.492−0.141
I think my life is full and happy.4.8231.533−0.379−0.295
I think I am very promising.4.6671.486−0.265−0.171
Total 4.765
Note: SD = Standard Deviation.
Table 4. Analysis of variance by tutor help.
ConstructTutor HelpNMeanStd. DeviationFpSig.Scheffe
System Interface Design,
SID
Very helpful835.211.2429.400.0001 > 2
1 > 3
1 > 4
2 > 3
2 > 4
helpful2584.811.01
Slightly helpful2674.320.93
Unhelpful1044.051.16
Total7124.561.09
Sense of Self-Worth, SSWVery helpful835.341.3212.040.0001 > 2
1 > 3
1 > 4
2 > 3
2 > 4
helpful2584.911.10
Slightly helpful2674.551.14
Unhelpful1044.501.46
Total7124.771.23
Note: N = Number; Std. = Standard; Sig. = Significant.
Table 5. Confirmatory factor analysis.
ConstructItemSignificance of Estimated ParametersItem ReliabilityConstruct
Reliability
Convergence Validity
Unstd. 1S.E.Unstd./S.E.p-ValueStd. 2SMC 3CR 4AVE 5
PEUPEU11.000 0.6960.4840.8850.609
PEU21.6070.07521.5020.0000.8810.776
PEU31.4350.07220.0260.0000.8190.671
PEU41.7230.08919.3580.0000.7910.626
PEU51.3900.07917.5000.0000.6990.489
SIDSID11.000 0.7170.5140.9470.667
SID20.9260.05118.0780.0000.6740.454
SID30.9550.05218.5060.0000.6910.477
SID41.4670.06024.5490.0000.9250.856
SID51.4330.05824.7110.0000.9330.870
SID61.4220.05924.0640.0000.9100.828
SID71.4040.05923.9630.0000.9060.821
SID81.1620.05720.4300.0000.7650.585
SID91.0950.05320.6440.0000.7720.596
PUSPUS11.000 0.8500.7220.9530.771
PUS21.0530.03232.4720.0000.8870.787
PUS31.0260.03331.4720.0000.8880.789
PUS41.0030.03330.6260.0000.8760.767
PUS51.0820.03432.1150.0000.8920.796
PUS61.0850.03531.0510.0000.8750.766
ATUATU11.000 0.7780.6050.9120.724
ATU20.9620.04322.1640.0000.7630.582
ATU31.2440.04527.6870.0000.9240.854
ATU41.2580.04627.5810.0000.9250.856
IOUIOU11.000 0.9060.8210.9480.821
IOU21.0240.02441.9450.0000.9290.863
IOU30.9910.02342.2220.0000.9370.878
IOU40.9380.02833.0070.0000.8490.721
SUNSUN11.000 0.8030.6450.9120.604
SUN21.1030.04325.7310.0000.8290.687
SUN31.1540.04128.0030.0000.8850.783
SUN41.1310.04227.2290.0000.8780.771
SUN51.0890.04027.0620.0000.8670.752
SUN60.7260.05114.1460.0000.5190.269
SUN70.7120.04515.6690.0000.5670.321
Note: 1 Unstd. = Unstandardized factor loading, 2 Std. = Standardized factor loading, 3 SMC = Squared Multiple Correlations, 4 CR = Composite reliability, 5 AVE = Average Variance Extracted.
Table 6. Discriminant validity for the measurement model.
AVEPEUSIDPUSATUIOUSUN
PEU 10.6090.78
SID 20.6670.7390.817
PUS 30.7710.5170.7000.878
ATU 40.7240.5710.5990.7020.851
IOU 50.8210.4380.4710.5440.7380.906
SUN 60.6040.3720.5040.5140.3910.3810.777
Note: 1 PEU = Perceived Ease-of-Use, 2 SID = System Interface Design, 3 PUS = Perceived Usefulness, 4 ATU = Attitude Toward Using, 5 IOU = Intention of Usage, 6 SUN = Subjective Norm. The items on the diagonal on bold represent the square roots of the AVE; off-diagonal elements are the correlation estimates.
Table 7. Model fit verification.
Fit IndicesCriteriaModel Fit of Research ModelPattern Fitting
Discrimination
Chi-square χ2 1The smaller the better807.331Pass
Degree of freedom DF 2The larger the better552Pass
Normed Chi-square χ2/df<31.463Pass
RMSEA 3<0.080.026Pass
TLI (NNFI) 4>0.90.989Pass
CFI 5>0.90.990Pass
GFI 6>0.90.969Pass
AGFI 7>0.80.964Pass
NFI 8>0.90.969Pass
Note: 1 χ2 = Chi-square, 2 DF = Degree of Freedom, 3 RMSEA = Root Mean Square Error of Approximation, 4 TLI (NNFI) = Tucker–Lewis Index (Non Normed Fit Index), 5 CFI = Comparative Fit Index, 6 GFI = Goodness of Fit Index, 7 AGFI = Adjusted Goodness of Fit Index, 8 NFI = Normed Fit Index.
Table 8. Regression coefficient.
DV 7IV 8Unstd. 9S.E. 10Unstd./S.E.p-ValueStd. 11R2 12
PEUSID 10.6540.04315.0860.0000.7390.546
ATUPEU 20.4040.0596.9110.0000.2840.553
PUS 30.5110.04012.6970.0000.556
IOU 6ATU 40.8970.04918.1760.0000.6960.555
SUN 50.1410.0413.4540.0010.109
Note: 1 SID = System Interface Design, 2 PEU = Perceived Ease-of-Use, 3 PUS = Perceived Usefulness, 4 ATU = Attitude Toward Using, 5 SUN = Subjective Norm, 6 IOU = Intention of Usage, 7 DV = Dependent Variable, 8 IV = Independent Variable, 9 Unstd. = Unstandardized regression coefficients, 10 S.E. = Standard Error, 11 Std. = Standardized regression coefficients, 12 R2 = Explainable variations.
Table 9. The analysis of indirect effects.
EffectPoint EstimateProduct of CoefficientsBootstrap 1000 Times
Bias-Corrected 95%
S.E.Z-Valuep-ValueLower BoundUpper Bound
Total effect
PEU → IOU0.3630.0734.9850.0000.2300.522
Total indirect effect
PEU → ATU → IOU H60.3630.0734.9850.0000.2300.522
Total effect
PUS → IOU0.4590.0736.2960.0000.3190.598
Total indirect effect
PUS → ATU → IOU H70.4590.0736.2960.0000.3190.598
Note: PEU = Perceived Ease-of-Use, IOU = Intention of Usage, ATU = Attitude Toward Using, PUS = Perceived Usefulness.4.3.4. The Analysis of Moderator Effects.
Table 10. Moderator effects.
DVIVEstimateS.E.Z-Valuep-Value
IOUATU0.9040.07711.7500.000
SUN0.1350.0642.1240.034
SSW0.0170.0810.2120.832
ATU*SSW0.0080.1020.0760.940
Note: IOU = Intention of Usage, ATU = Attitude Toward Using, SUN = Subjective Norm, SSW = Sense of Self-Worth.
Publisher’s Note: MDPI stays neutral with regard to jurisdictional claims in published maps and institutional affiliations.

