Article

Participatory Management to Improve Accessibility in Consolidated Urban Environments

by
Raquel Pérez-delHoyo
1,*,
María Dolores Andújar-Montoya
1,
Higinio Mora
2,
Virgilio Gilart-Iglesias
2 and
Rafael Alejandro Mollá-Sirvent
2
1
Department of Building Sciences and Urbanism, University of Alicante, 03690 Alicante, Spain
2
Department of Computer Science Technology and Computation, University of Alicante, 03690 Alicante, Spain
*
Author to whom correspondence should be addressed.
Sustainability 2021, 13(15), 8323; https://doi.org/10.3390/su13158323
Submission received: 28 May 2021 / Revised: 20 July 2021 / Accepted: 22 July 2021 / Published: 26 July 2021
(This article belongs to the Special Issue Complex System Modeling Methods Applied to Sustainable Development)

Abstract

:
There is a wide range of regulations on universal accessibility, but our cities are still inaccessible in many cases. Most accessibility problems in cities occur in consolidated areas that were developed prior to the development of current accessibility regulations. This leads to consider the importance of focusing more effort on managing the improvement of the accessibility of existing public urban environments. As such, the objective of this research is to design a conceptual model for accessibility management in consolidated urban environments. Unlike other research focusing on city users to collect information on accessibility problems or to provide services to improve wayfinding, this method has a focus on urban accessibility managers. The model is based on the assessment of the level of accessibility of urban environments together with the assessment of management processes in which city users are actively involved. It consists of a set of basic indicators for the identification of accessible pedestrian routes, and provides a dynamic accessibility index for the evaluation of their efficient management by the responsible governments. The inclusion of this assessment framework in the management process itself enables the necessary improvement actions to be identified and taken in time. ICT (Information and Communication Technologies) provide the communication channel between the responsible governments and city users, making this a more dynamic and efficient management model based on assessment possible.

1. Introduction

It is a fact that our cities are not accessible [1,2,3] despite the extensive normative development in the field of accessibility in recent decades since the United Nations International Convention on the Rights of Persons with Disabilities (ICRPD) [4], which was the first legally binding international instrument in the field of human rights. The signing and ratification of the ICRPD and its Optional Protocol by the different countries reinforced the coherence between actions in the field of accessibility at the international level and, in many of these countries, led to the implementation of several plans aimed at improving accessibility conditions. The ICRPD brought about a major change in the understanding and perception of disability and, as a relevant fact, highlighted the need to incorporate its dimension as an integral part of relevant sustainable development strategies [5].
The comparative analysis of international regulations carried out by the Canadian Human Rights Commission (CHRC) [6], which included a study of regulations in 14 countries around the world, is a good example of this paradigm shift. The study reflected the advances and debates that have taken place in the search for universal accessibility and the necessary unification and standardization of measures to be adopted in the different countries. As far as the European Union is concerned, the Council of Europe Resolution Achieving full participation through Universal Design [7] urged governments to achieve full participation of people with disabilities in the knowledge society through universal design or design for all.
Thus, the first decade of the 21st century confirms a shift and evolution in policies and actions towards universal accessibility. However, despite the fact that the European Disability Strategy 2010–2020: A Renewed Commitment to a Barrier-Free Europe [8] was developed to guarantee the effective implementation of the ICRPD, people with disabilities, temporarily or permanently, older people who are increasingly numerous in our cities, and all people at some point in their lives, continue to face today in many cases an inaccessible urban environment, full of barriers and, in some way, indifferent to their daily problems [9,10,11].
This leads us to consider that the development of regulations and their systematic application in our cities is not enough to achieve universal accessibility and that it is necessary to focus greater effort on accessibility management that allows a closer approximation to the social reality and the real urban accessibility problems that have yet to be solved. This requires the implementation of a participatory management process in which citizens themselves, as users of the city, are allowed to communicate the real problems they face.
It is clear that most accessibility problems in cities occur in consolidated areas that were developed prior to the development of current accessibility regulations. The application of accessibility regulations in newly developed areas is not a problem as appropriate measures are introduced from the conception of urbanization projects. However, the adaptation of existing public spaces developed prior to the application of these regulations does present a difficulty and affects most of the area covered by our cities. Research is therefore necessary, not so much to verify the strict application of accessibility regulations, which is not fully possible in many consolidated areas of our cities, but rather to monitor the “possible adaptation” of existing public spaces to conditions initially conceived for new urbanization areas—for which citizen participation is a key factor in identifying everyday accessibility problems.
Within this context, and with the aim of contributing to improve the planning and management of universal accessibility focused on consolidated urban environments, this paper proposes a method of urban accessibility management based on certain indicators, and which provides an accessibility index in cities for the identification and management of accessible pedestrian routes. The accessibility factors considered in the model are the following: the walkability of urban spaces (of pathways and approximation spaces, the availability of resting areas, adequate changes in level and pavements); the usability and handling of urban elements (adequate location and design); the facilities for wayfinding (presence of signage, illumination and detectable indicators); and the facilities for accessible communication. It is important to point out that the method is not proposed as an alternative to compliance with existing regulations, but as a tool to assess basic accessibility conditions in all existing urbanized public spaces where it is not possible to achieve the levels established for new urban development and the best possible adaptation to these conditions should be sought. The research presented is therefore approached from the perspective of accessibility management, understanding this as an opportunity to improve the accessibility conditions that existing spaces already have, through continuous monitoring and assessment of their efficient functioning. The main objective of this research is, therefore, the design of an accessibility management model based on the continuous assessment of the accessibility conditions of urban environments, in which the information provided by citizens on the real accessibility problems they face is of essential value. The inclusion of this continuous assessment framework in the management process itself enables the necessary and priority improvement actions for citizens to be identified and taken in time.
The proposed method is conceived and designed within the framework of the United Nations 2030 Agenda for Sustainable Development [12], specifically aligned with Sustainable Development Goal 11: Make cities and human settlements inclusive, safe, resilient and sustainable, and Target 11.3: By 2030, increase inclusive and sustainable urbanization and capacity for participatory, integrated and sustainable planning and management of human settlements in all countries. To achieve this goal, Information and Communication Technologies (ICT) have much to offer, enabling the design of people-centered technology models for improved planning and management that are more flexible and open to the participation of all citizens. The potential of ICT to encourage a sense of citizenship and citizen participation is increasingly recognized [13,14,15,16].
In this sense, the proposed method is presented as a dynamic tool for accessibility management that enables communication between the administrations responsible for improving accessibility in cities and the users of urban public spaces. It is therefore made available to public administrations for the assessment and management of accessibility problems and includes the participation of citizens in alerting them to compliance with the accessibility index that guarantees the existence of accessible routes. ICT provide the communication channel between the responsible governments and city users, making this more dynamic and efficient management model based on assessment possible.
The rest of the paper is structured as follows. Section 2 provides a brief overview of previous related research conducted and the concept of an accessible route. Section 3 describes the proposed model, including the materials and methodology used in the design of indicators, as well as an accessibility index oriented to the management, maintenance and improvement of accessibility in consolidated urban areas. Section 4 provides an example of how the proposed model works and its usefulness. Finally, Section 5 draws some conclusions.

2. Background

Inclusive design promotes the creation of accessible spaces that all citizens can use. An accessible route is “A continuous, unobstructed path connecting all accessible elements and spaces of a building or facility” [6]. Defining accessible routes in a city as opposed to non-accessible routes is contradictory to the concept of an inclusive city. An inclusive city is one that recognizes difference, which allows for the development of a sense of common belonging. Among the ideas that constitute the concept of an inclusive city are accessibility, multi-functionality, equity, partiality and universality [17].
However, consolidated urban areas in existing cities do not have a built environment that is based on an inclusive project. In consolidated cities, there may be roads that cannot be adapted to be considered accessible, but there are others. Although it is necessary for an inclusive city that all roads are accessible and that there are no differentiated routes to be followed by people according to their different abilities, in certain consolidated areas of the city this challenge is not achievable at the moment.
It is in these consolidated areas where the concept of accessible routes has a special significance because their identification and construction constitutes an important area for improving the accessibility of these consolidated urban environments [18,19,20].
The European Disability Strategy 2010–2020 [8] proposed to use regulatory and standardization tools to facilitate accessibility of the built environment for all people with a design for all approach. In particular, the International Organization for Standardization (ISO) worked on the standardization of accessibility in the built environment to ensure usability for the widest range of people [21]. To this end, ISO 21542: 2011 Accessibility and Usability of the Built Environment [22] has been developed and is revised every 5 years. While this standard focuses on the built environment and does not address elements of the outdoor environment, such as public open spaces, it provides only requirements for features of the outdoor environment directly connected to the access to buildings.
Currently, there is no clear definition of the EU in the design criteria for public open spaces and, consequently, there are no guidelines for assessing the basic concepts related to them. Some studies have proposed a research agenda [23], other research has aimed to provide methodologies for standardized assessment of inclusive design [24,25], but research in the field towards standardization of models is still incipient. In this sense the present research is proposed to contribute to take a step forward.
Many other studies, although not specifically focused on the standardization of urban accessibility assessment, have been developed to enable citizens to move around in an accessible way [26]. This is a requirement for all cities and a very active field of research today. Much of this research has focused on exploring the possibilities of ICT for building a pedestrian infrastructure network, with smart cities being a constantly developing field of research. A large number of social applications to support people with disabilities have been developed in recent years taking advantage of the popularity of smartphones. These applications can be easily used by people with different abilities to calculate accessible routes. Many of them take advantage of the Web 2.0 paradigm to collect information about the accessibility of urban roads [27,28,29,30,31,32,33,34,35]. This information is then used to determine an accessible route between any two locations and provide this information to users with a particular disability. For example, people on a wheelchair can ask the application for information on a path between any two destinations and will receive a response with information on the shortest accessible path available.
A large number of crowdmapping applications have also been developed based on mobile applications that allow users to photograph and rate places in the city that present obstacles for people with reduced mobility. In short, all these applications have in common the sharing of information about accessible and non-accessible routes on an interactive map [36,37]. Specific projects have also been conducted to build accessibility maps, by mapping accessible routes automatically based on data collected through the mobile devices that people take with them when they move around the city [38,39]. Many case studies in specific regions have been conducted with the aim of assessing the effectiveness of cities’ accessibility and access to services [40,41,42].
Mobile applications are designed as part of more complex models in much research in recent years. Information system architectures have been proposed to create accessibility data models that retrieve information from multiple heterogeneous and large-scale data sources (OpenStreetMap, LiDAR data, social network data, through sensors) [43,44]. Much of this research has focused on the field of transport to provide open data on accessible public transport systems and to manage information on accessible routes obtained through crowdsourcing techniques [45,46]. In particular, services are proposed and offered that provide personalized route information to users to improve orientation [47,48]. Algorithms have even been developed with the dual objective of not only identifying accessible routes but also personalizing the choice of one route or another according to the needs of each user [49,50]. For example, in the field of transport, applications have been developed that allow users to generate accessible routes for a particular special need. Users can start a route, and the application will periodically register the position during the journey. When users finish the journey, they can save and share the route with other users and include comments reporting possible incidents. This generates a repository of accessible routes using crowdsourcing techniques.
Most research has focused on whether there are accessible routes for wheelchair users [51]. Navigation models [52] or methods to classify accessible or inaccessible surfaces (built or natural) [53] have been developed. Computational methods have also been developed that compile datasets from different sources to provide users with personalized and accessible pedestrian routes and maps [54]. Some of these models analyze the user’s acceptance of the space design or focus on the identification of various obstacles. Other models generate an accessible route through the best possible surface depending on the user and wheelchair requirements [55]. Some other approaches use motion planning techniques to predict the performance or stability of a facility through the analysis of virtual simulations [56,57].
Less research focuses on other types of disabilities, such as the design of accessible guidance systems for visually impaired people [58]. There has also been research in specific fields such as emergency situations and modelling of accessible evacuation routes [59], and in the development of ontologies for this purpose [60].
In summary, it can be argued that research on improving mobility in cities for people with disabilities has been extensive over the last decades. Within the context of smart cities, both general and specific issues have been addressed. However, most research has focused on users, on the one hand, to collect information on accessibility problems directly from the citizens’ own experience and, on the other hand, also a large number of researches have been oriented towards the development of services to improve wayfinding for people with disabilities in cities. Research in the field of accessibility management is less extensive. Research has been conducted in specific fields such as beach management, green space management or accessible tourism management [61,62,63,64]. Much of this research has been oriented towards the definition of indicators, as well as indices of the relationship between different types of indicators [40,62,65,66,67,68,69,70,71].
However, research in the field of universal accessibility management for urban public spaces in general is often incipient or ignored. There is still insufficient research on models aimed at assessing the performance and response of responsible governments to solve existing accessibility problems. In this regard, this paper proposes a method oriented to urban accessibility managers that aims to evaluate the action and effectiveness of governments responsible for accessibility in cities.
Our research group has developed an Urban Accessibility Monitoring System consisting of a mobile application that allows citizens to register the accessibility issues they find in the urban environment and a web console for the management of these issues by local governments [72,73,74,75,76]. Compared to other accessibility applications, this application is not designed in isolation, i.e., it does not focus exclusively on city users to collect information on accessibility issues or to provide a service to improve wayfinding. It also provides an efficient communication channel with accessibility improvement managers enabling participatory management. Based on this previous research, this paper advances in the part related to accessibility management by the responsible governments. The proposed accessibility management model consists of a set of basic indicators for the assessment of the accessibility of urban roads and the identification of accessible pedestrian routes, and provides a dynamic index of accessibility in consolidated urban areas for the assessment of the efficient management of these routes by the responsible governments, in the calculation of which citizen participation is involved.
In the following Section 3, the proposed model is presented and its main features and functionalities are defined.

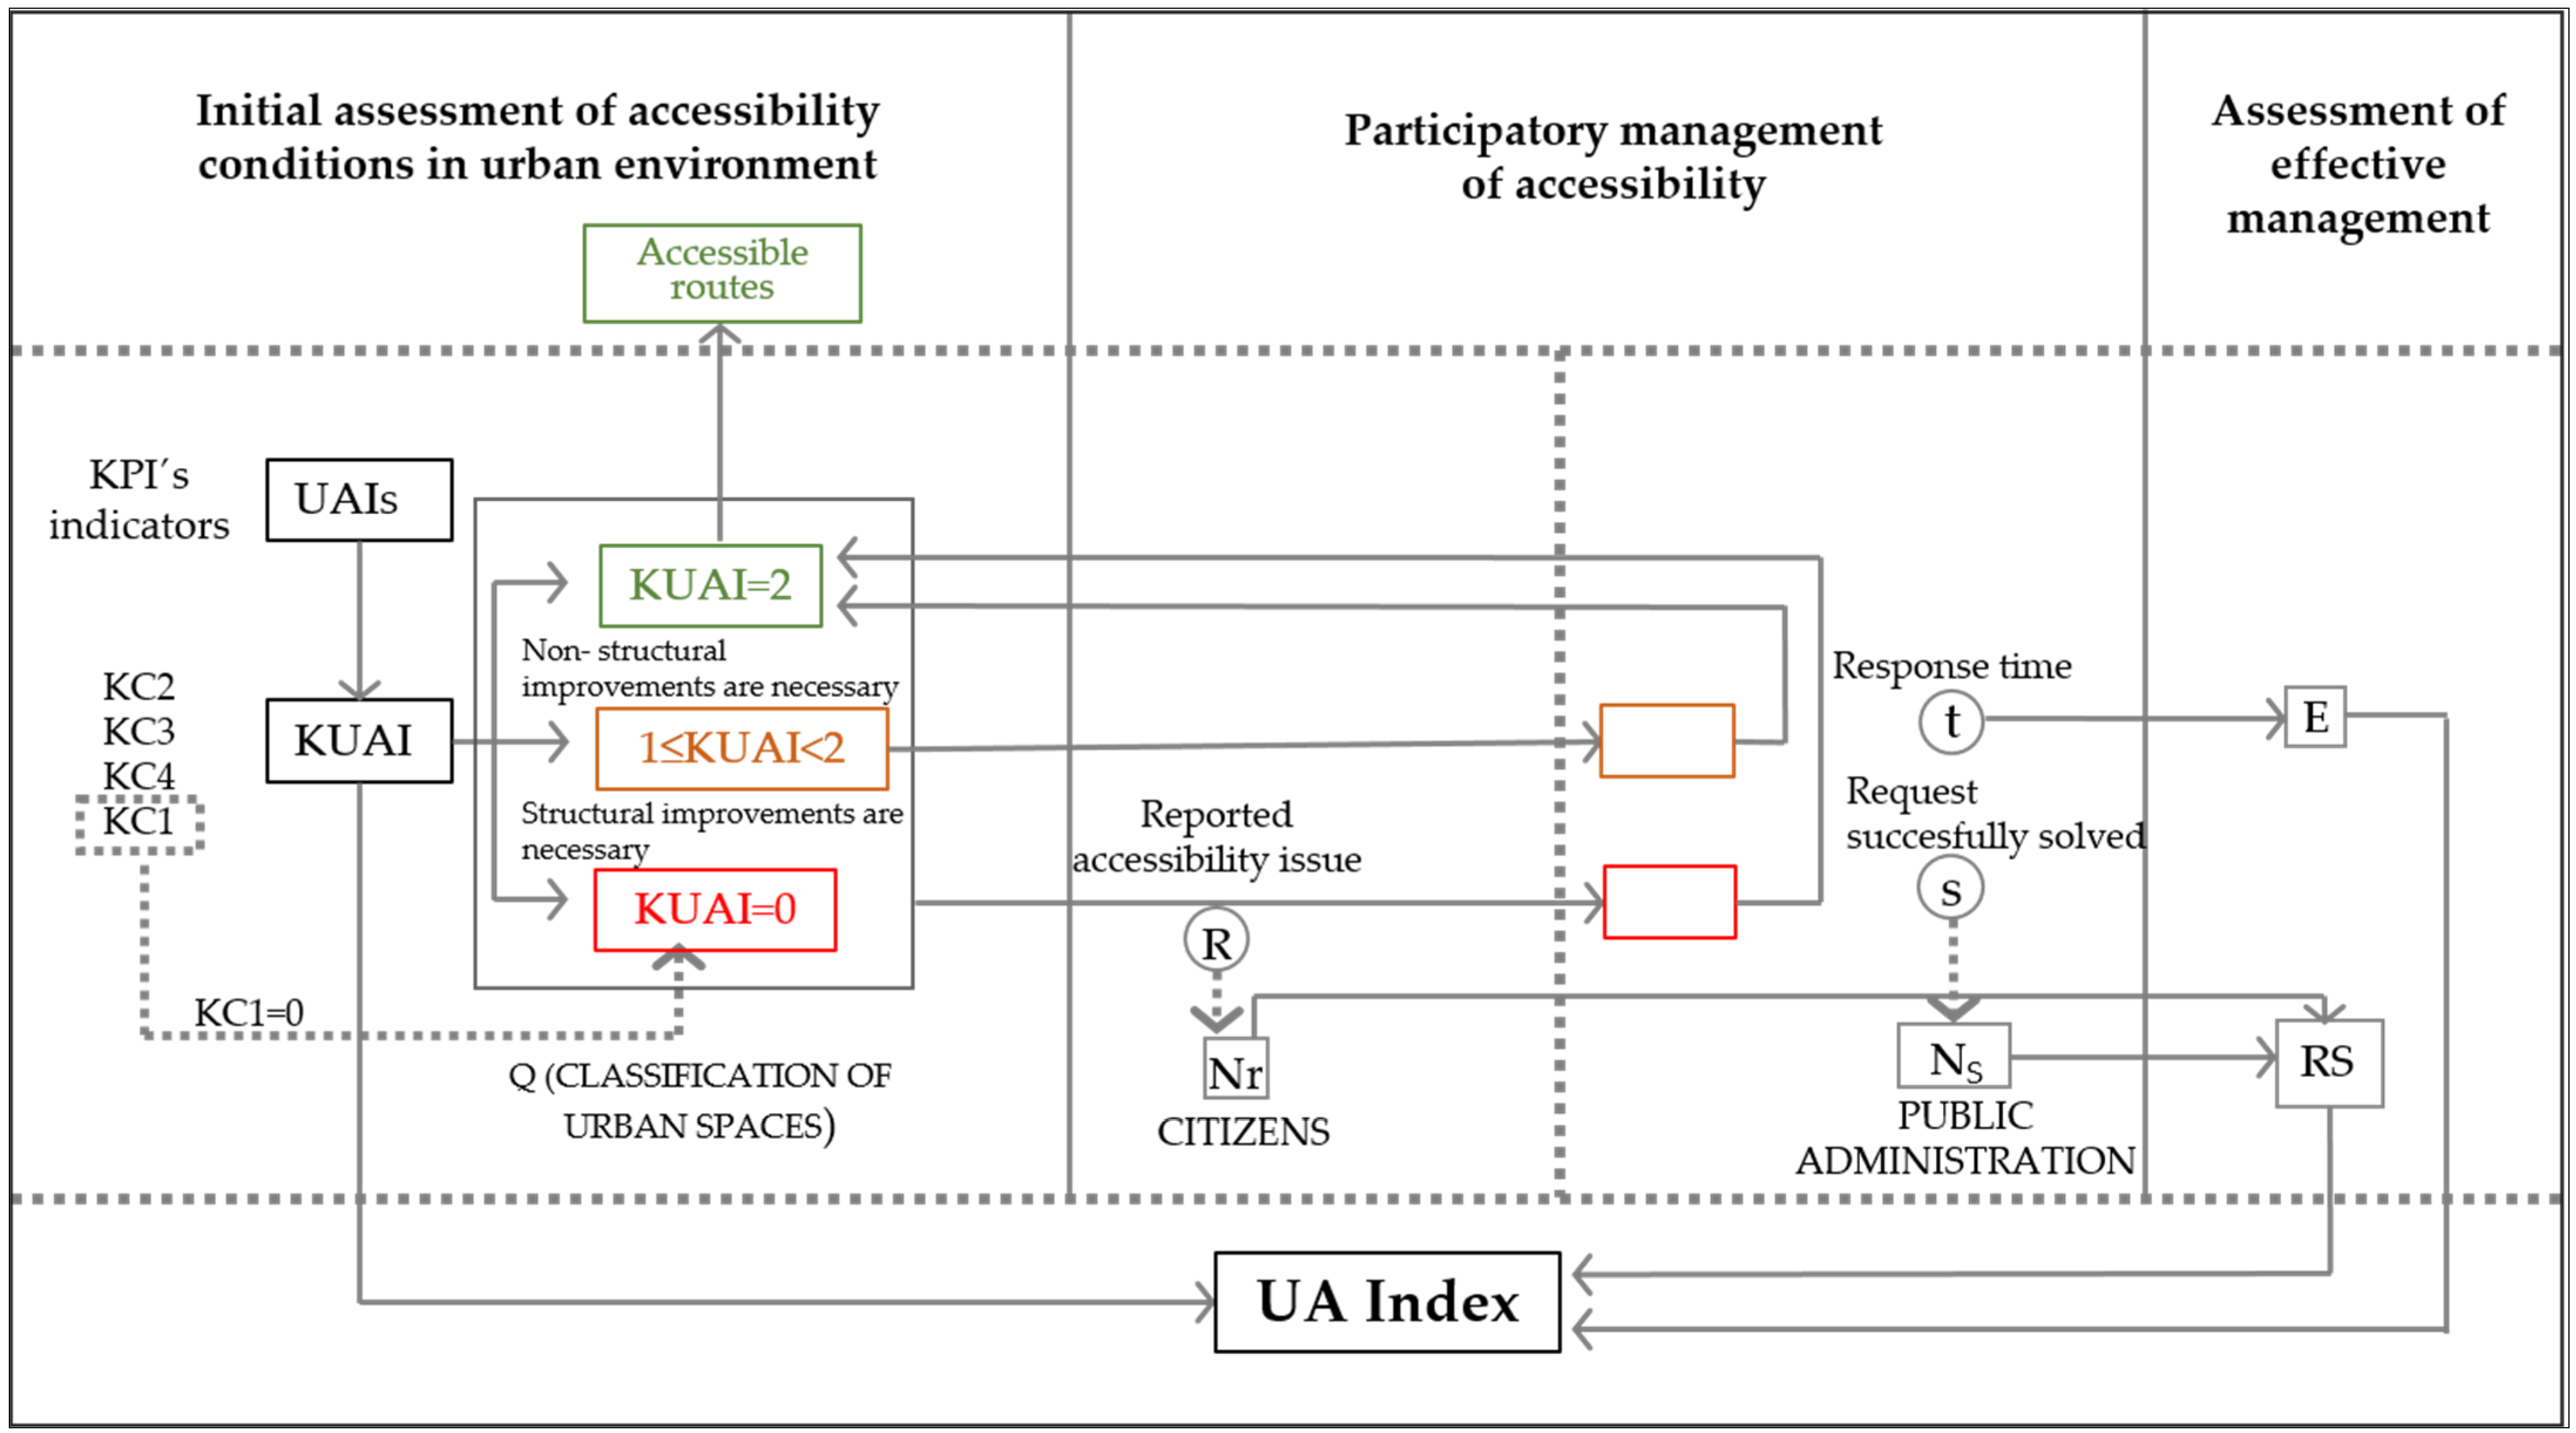
3. Management Model for Accessible Routes in Consolidated Urban Areas

This section describes the proposed Accessible Route Management System in Consolidated Urban Areas (ARMS-CUA).
The management system is defined as:
ARMS-CUA = (UA, RS, E, UAIndex),
where:
  • UA (Urban Accessibility) represents a measure of the accessibility of urban public spaces applied to each street segment;
  • RS (Requests Solved) represents the extent to which the set of requests reported by citizens on accessibility problems have been successfully solved by the governments responsible for accessibility management;
  • E (Efficiency) represents the effectiveness of the responsible government’s response or action to address the requests reported by citizens;
  • UAIndex (Urban Accessibility Index) is a dynamic index oriented to the management and maintenance of accessibility in consolidated urban areas.

3.1. Measuring the Accessibility of Urban Public Spaces (UA)

UA is defined as:
UA = (UAI, KUAI, Q),
where:
  • UAI (Urban Accessibility Indicators) represents the set of urban elements of accessibility, consisting of a set of key accessibility indicators that are considered basic for a street segment to be part of an accessible route in consolidated urban areas. From the set of UAI indicators, Key Performance Indicators (KPIs) are selected, which form a unique subset of high-level indicators related to the strategic objectives in the evaluation of the accessibility of urban environments [77];
    KUAI represents the measure of compliance with the set of accessibility indicators (UAI) in a street segment according to the different categories of indicators defined;
    Q is the set of rules that defines how the KUAI is classified according to the result obtained. It therefore represents the classification of urban spaces according to the value obtained (KUAI) of compliance with the categories of indicators.

3.1.1. Defining Urban Accessibility Indicators (UAI)

Apart from the fact that public spaces must comply with the different national regulations, this research proposes a method based on indicators for the identification and management of accessible pedestrian routes in consolidated areas that can be applied at an international level.
In order to define the organization of accessibility indicators in consolidated urban environments into categories and subcategories, the universal accessibility criteria of the Spanish Association for Standardization and Certification (AENOR): MGLC criteria to facilitate accessibility to the environment have been used. These criteria were determined in the UNE 170001-1 Universal Accessibility standard [78]. In this way, the application of local or national legislation has been avoided, starting from voluntary criteria in favor of design for all that have been adapted to the specific context of urban environments.
The MGLC criteria determine four essential actions to be taken into account in accessibility assessment, these being Movement, Grasping, Locating and Communication. For each of these actions to be possible, the UNE standard also defines a series of concepts to be considered. In this research, the four essential actions established in the MGLC criteria have been adopted as categories for the determination of accessibility indicators, adapting their definition to urban environments. From this adaptation, the following categories result: Walkability (in relation to Movement), Usability and Handling (in relation to Grasping), Wayfinding (in relation to Location) [79], and Accessible Communication (in relation to Communication). In turn, within each of these four categories, the concepts that define them and are applicable to urban environments have been established as subcategories. Although many of the concepts to be considered are related to several actions, in this research we have tried to simplify and not to associate the same concept to different actions, so each subcategory has been assigned to a single category.
  • Category 1 (C1): Movement ⇒ Walkability
    Walkability is understood as the action of moving from one place to another by walking to access the places and objects to be used. It must be easy for anyone to do, regardless of their abilities, whether they use aids (wheelchairs, walking aids, white canes), whether they walk alone or accompanied, at a fast or tiring pace, or any other circumstance such as carrying objects or prams. For the action of walkability to be possible, there must be accessible routes to enable it. Walkability in a city can be horizontal, i.e., moving along streets or corridors, and vertical, i.e., going up or down stairs or ramps, for example.
  • This category, Walkability, is considered of high level of importance in line with the strategic objective of improving accessibility in consolidated urban areas.
  • According to the MGLC criteria, the following basic concepts have to be considered in order to make walkability possible in urban environments: pedestrian pathways, approximation spaces, resting areas, changes in level and pavements. In this research, these five basic concepts have been adopted as subcategories for the determination of accessibility indicators.
  • Category 2 (C2): Grasping ⇒ Usability and Handling
    Usability and handling is understood as the action of using the different urban elements, as well as reaching, grasping and manipulating the different objects. For usability and handling to be possible in urban environments, the following two concepts are considered basic and have been adopted as subcategories of indicators: the location and design of the different elements and objects.
  • Category 3 (C3): Location ⇒ Wayfinding
    Wayfinding is understood as the action of locating and identifying places and objects. This requires orientation in space and its understanding and, where necessary, the planning of possible routes. This category of Wayfinding is closely related to the following category of Communication. In order to make wayfinding possible, the following three concepts are considered basic: signage, illumination and detectable indicators. These three basic concepts have been adopted as subcategories of indicators.
  • Category 4 (C4): Communication ⇒ Accessible Communication
    Accessible communication is understood as the exchange of information so that the environment can be used by all people in safe conditions and as autonomously as possible. For communication to be accessible it must be visual, acoustic or tactile, or a combination of these.
For each of the categories and subcategories described above, accessibility indicators have been defined for consolidated urban environments. The indicators proposed in this paper have been selected from among the concepts applicable to urban environments that were studied in the comparative analysis of international accessibility regulations carried out by the CHRC [6], which included a study of the regulations of 14 countries around the world. The aim is that the proposed method can be applied by the different countries for the assessment of accessible routes in consolidated areas as a complement to the regulations applicable in each of them.
From this document, which shows the adaptation of the different national accessibility regulations to the concepts of universal accessibility and design for all and which compiles the existing technical specifications at international level, the main accessibility codes and requirements for urbanized public spaces have been selected in order to establish a compendium of common basic parameters that can be used to assess accessibility in urban environments in different regional areas.
With this aim of defining basic accessibility conditions in consolidated urban environments that can be assessed at an international level, the reference values for measuring the proposed indicators have been established in accordance with the best practices recommended by the CHRC for each of the criteria analyzed. According to the CHRC, “Best practices in universal design is defined as building practices and procedures that comply with universal design principles and provide affordable design practices that meet the needs of the widest possible range of people who use of facility”. Thus, these values for measuring compliance with the accessibility indicators do not necessarily correspond to the most restrictive values obtained by simply comparing the regulations of the different countries, but were suggested by the committee of experts appointed by the CHRC on the basis of various other factors, such as the cost of construction, the feasibility of implementing the different solutions and their functioning.
As the Commission stated in its report, these best practices “are only a guide to be used in conjunction with local experience” and “are not intended as an international standard”. In the same way, these best practices are included in the proposed method as a resource and guidance tool for the assessment of basic accessibility parameters in existing urbanized public spaces where it is not possible to achieve the standards set for new urbanization. Not all accessibility standards may be applicable to all environments, which strengthens the case for specifying performance requirements or best practices rather than regulatory technical minimums for environmental accessibility [80]. Within the context of this research, achieving these best practice requirements always entails an improvement of the accessibility conditions that already exist in established spaces.
Below are the proposed indicators classified by categories and subcategories that make up the model (see Table 1, Table 2, Table 3 and Table 4). The indicators included in category C1. Walkability (Table 1), refer to structural concepts of the urbanization and configuration of the city and are therefore considered to be of high level of importance to achieve the objective of ensuring an adequate level of accessibility. The indicators included in this category have been selected for this reason as KPIs. In addition to the reference value proposed in the model for assessing compliance with the indicators (best practices), the tables show the regulatory requirements in four other countries (Canada, Australia, Sweden and Spain). These national regulatory requirements have been extracted from the comparative study of the CHRC and, although they may have been updated taking into account that accessibility regulations are constantly evolving [80], their mere comparison with best practices allows understanding how some aspects that are considered basic in the model are not addressed in some national regulations. It is also possible to compare whether there is a different requirement for each of the indicators in different countries, which allows contextualizing the application of the model in each geographical context. It is important to point out that the model is proposed for the assessment and improvement of accessibility in consolidated urban environments where it is not possible to reach the levels established in the regulations for new urbanization.

3.1.2. Measuring Compliance with the Set of Accessibility Indicators (KUAI)

KUAI in street segment is defined as:
KUAI = KC1 × (1 + (KC2 + KC3 + KC4)/3),
where KC1, KC2, KC3 and KC4 are the values representing the measure of compliance with the set of accessibility indicators (UAI) associated with each of the indicator categories C1, C2, C3 and C4 respectively, in a given street segment.
KUAI in an urban area is defined as the median of the KUAI values corresponding to the street segments that integrate it:
KUAIarea = {KUAI(N+1)/2, if N odd no.; 1/2 (KUAIN/2 + KUAI(N/2)+1), if N even no.},
where N is the number of street segments integrated in the urban area.
Next, the calculation equations are defined to obtain the KCi that take the xi,j values of compliance with the indicators included in each of the categories indicated. In this way, the KCi values are dependent variables (output) and the xi,j values are independent variables (inputs) adopted according to compliance or non-compliance with the corresponding indicators. It is only possible to calculate the KCi variables when the xi,j variables have been successfully identified. The compliance or non-compliance of each of the indicators according to the “best practice” criterion (see Table 1, Table 2, Table 3 and Table 4) corresponds to a value xi,j according to the following function:
f(xi,j) = {0, if UAI indicator is not meet; 1, if UAI indicator is meet},
  • KC1 corresponds to a value according to the following equation:
KC1 = x1,1 × x1,2 × x1,3 … × x1,m,
where x1,1, x1,2, x1,3 … x1,m, are the values corresponding to the different indicators included in category C1 according to whether or not these indicators are met.
Category C1 includes KPIs that refer to structural concepts of the urbanization and configuration of the city that must always be guaranteed in order to consider a segment or street as part of an accessible route. Therefore, in application of the above calculation formula, only two values of KC1 are possible: value 1 (if all indicators of the category are met) and value 0 (if any indicator of the category is not met).
  • KC2, KC3 and KC4 correspond to a value according to the following equations:
KC2 = Σj=1Yn x2,j /n,
KC3 = Σj=1Yp x3,j /p,
KC4 = Σj=1Yr x4,j /r,
where xi,j are the values corresponding to the different indicators included in categories C2, C3 and C4, respectively, depending on whether or not these indicators are met (value 1 if the indicator is met, value 0 if the indicator is not met).
KC2, KC3 and KC4 are therefore ratios that relate the magnitude representing the set of indicators that are met in a category to the total number of indicators in the same category (n, p, r) respectively.
Categories C2, C3 and C4 include indicators that refer to: C2, the location and design of urban elements; C3, elements (signage, illumination and indicators) for wayfinding in urban space; and C4, accessible communication systems. In these categories, street segments can reach different levels of accessibility as they are not, as in the case of category C1, structural categories. Therefore, in application of the above calculation formula, the values of KC2, KC3 and KC4 in the interval [0, 1] are possible.
Thus, KUAI can take values in the interval [0, 2] as shown below:
if KC1 = 0 ⇒ KUAI = 0
if KC1 = 1 ⇒ {KC2∧KC3∧KC4 = 0 ⇒ KUAI = 1; !(KC2∧KC3∧KC4 = 0) ⇒ 1 < KUAI ≤ 2}

3.1.3. Classifying Urban Spaces (Q)

The set of Q-rules defining the classification of urban spaces according to the value obtained (KUAI) of compliance with the indicator categories is defined as follows:
  • If KUAI = 0 ⇒ the street segment cannot be part of an accessible route unless structural improvements are made;
  • If 1 ≤ KUAI < 2 ⇒ the street segment can be part of an accessible route with the implementation of non-structural improvements;
  • If KUAI = 2 ⇒ the street segment is accessible and is considered to be part of an accessible route.

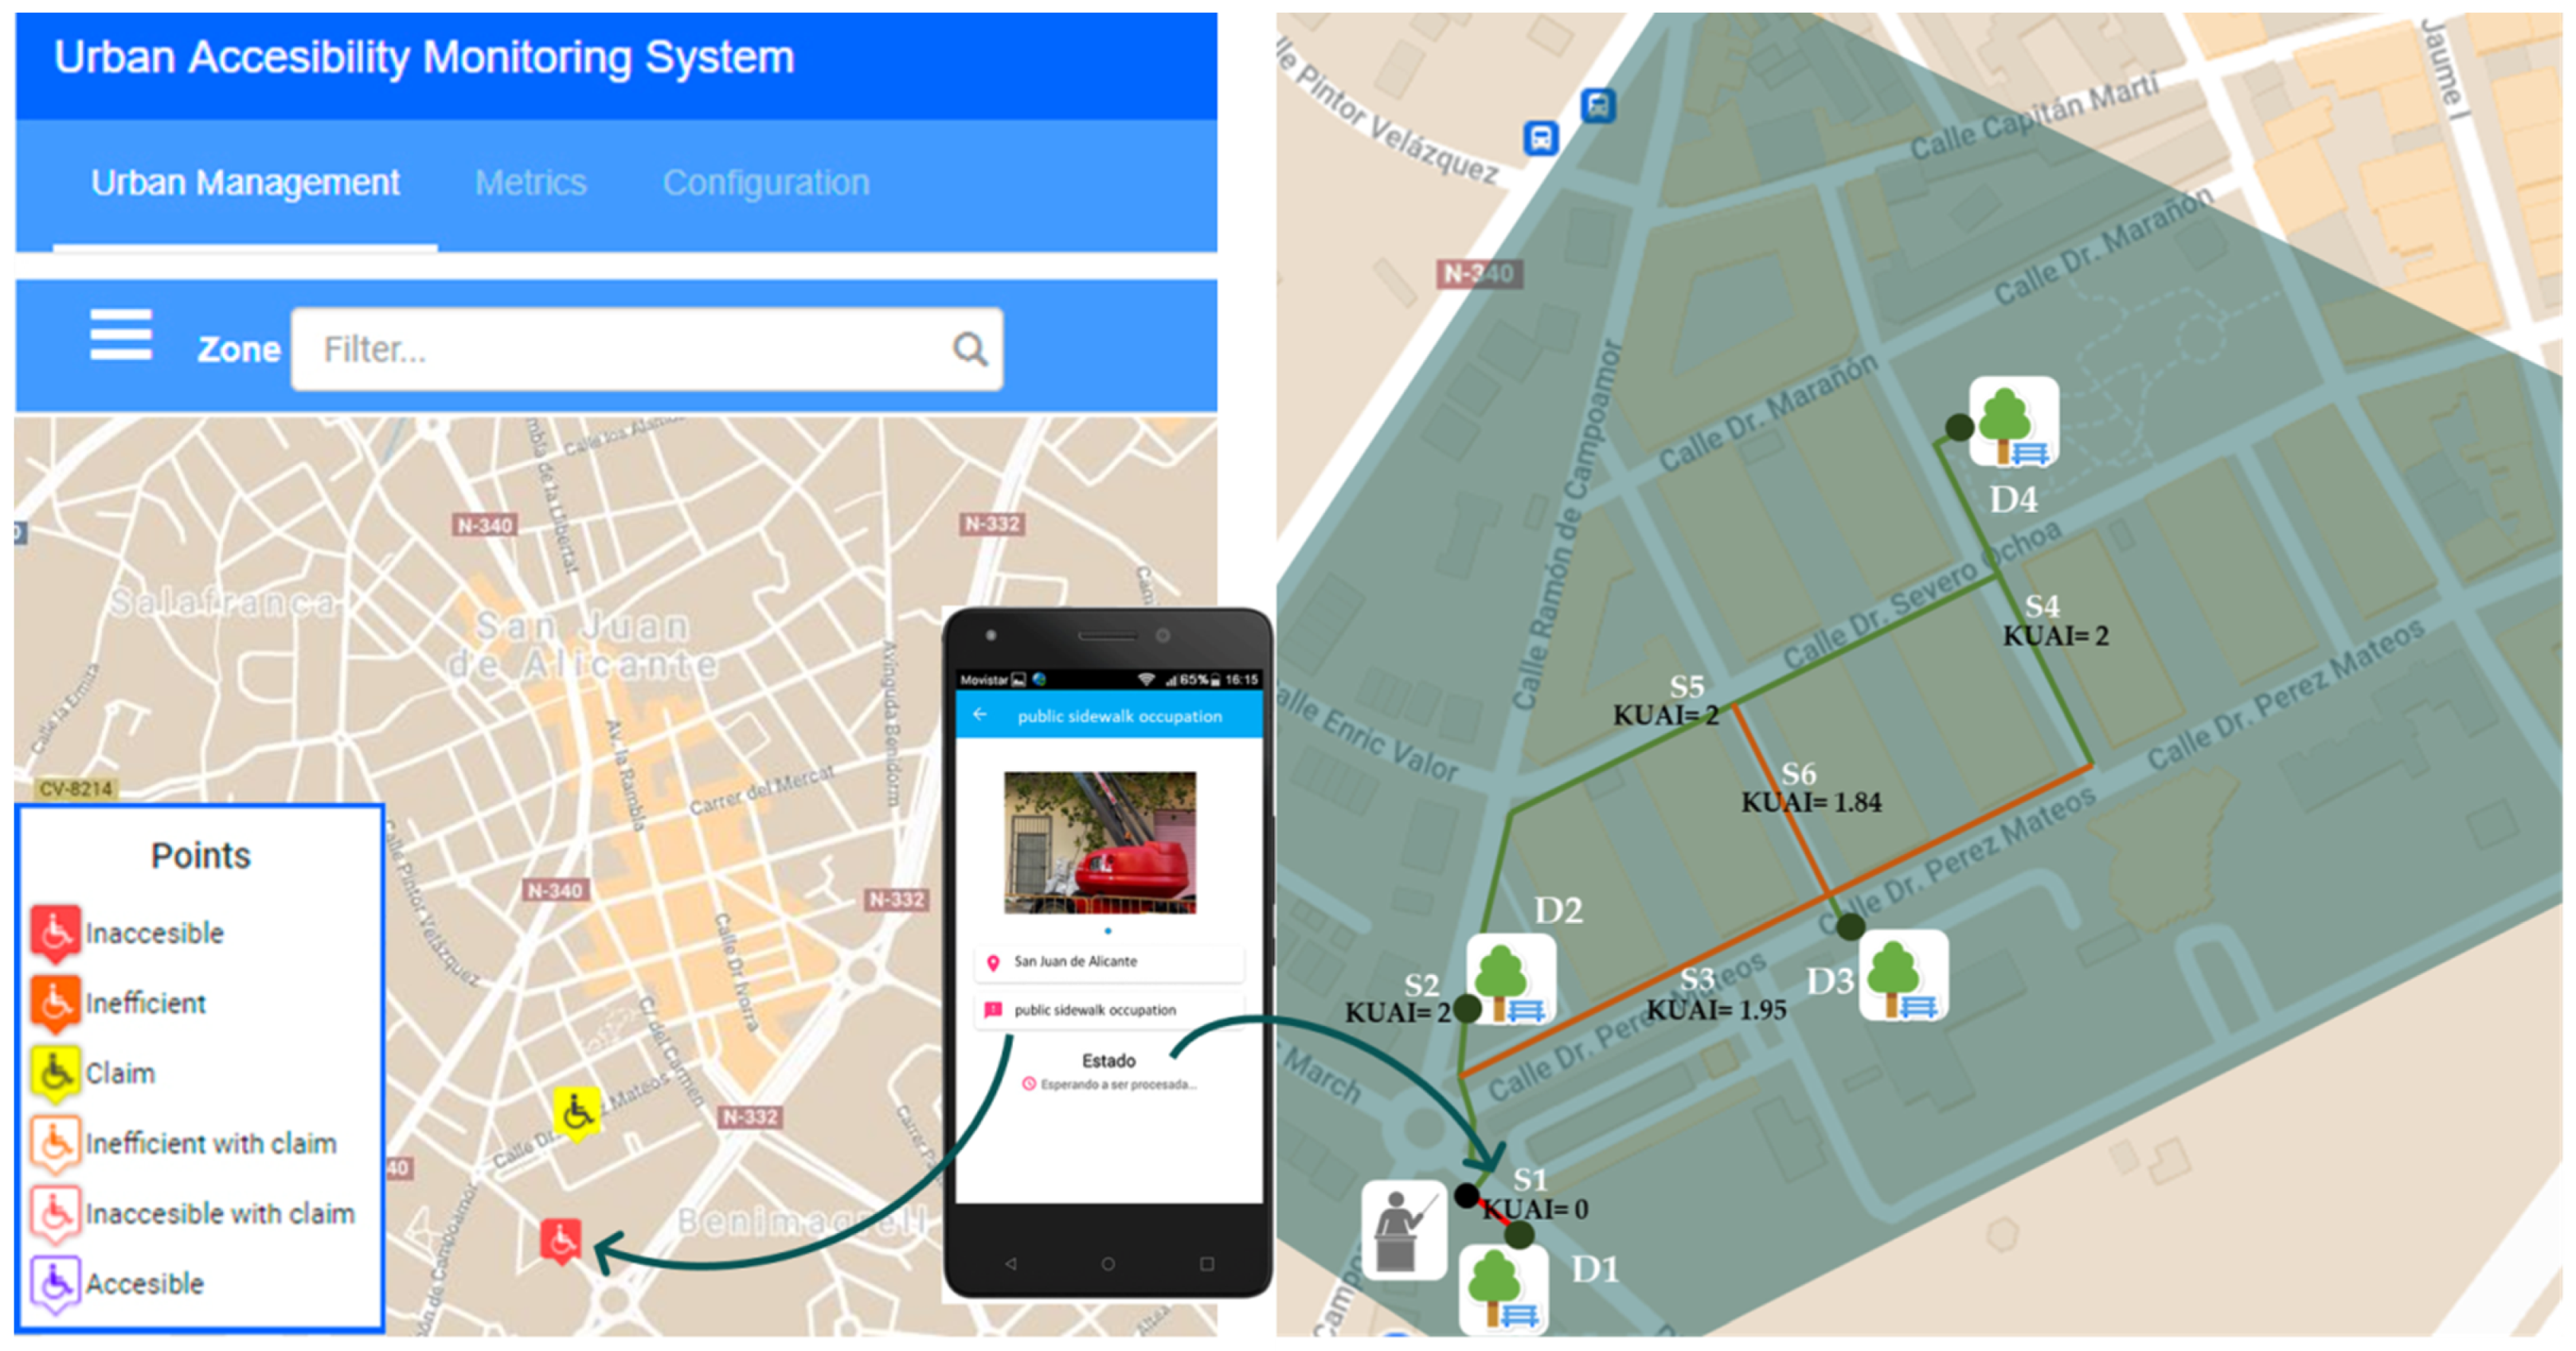
3.2. Citizen Participation in the Accessibility Management System (RS)

Following the process, RS is defined as:
RS = Ns/Nr,
where:
  • Nr is the number of requests about accessibility problems that are reported by citizens to the government responsible for accessibility management.
  • Ns is the number of requests received by the responsible government that have been successfully solved.
RS is therefore the ratio that relates the magnitude that represents the set of requests reported by citizens that have been dealt with by the responsible government with respect to the total number of reported requests. In application of the calculation formula above, RS values in the interval [0, 1] are possible.
As mentioned in Section 2, our research group developed an Urban Accessibility Monitoring System [72,73,74,75,76]. From the information collected through this system the data for the RS calculation will be retrieved.

3.3. Effectiveness in Managing Accessibility Issues (E)

In the following, E is defined as:
E = 2 − ((Σi=1→Ns ti/10)/Ns),
where:
  • Ns is the number of requests received by the responsible government that have been successfully solved.
  • ti is the response time or action taken by the responsible government to respond to alerts reported by citizens.
E represents the efficiency of the government’s action to provide a solution to the requests reported by citizens, considering 10 days as the maximum admissible response time. In this case, the value of E would be 1. Once this period of time has passed, the value of E decreases and can reach negative values if the response time is longer than 20 days. However, if the response time is less than 10 days, the value of E increases and exceeds the value of 1. The maximum value of E will be 2 if the requirement is solved on the same day it is reported.

3.4. Urban Accessibility Index (UAIndex)

UAIndex is conceived as a dynamic index that incorporates the evaluation of maintenance and management tasks on a regular basis (RS, E) in addition to the evaluation of the level of accessibility of urban environments (KUAI). It is an index oriented to the managers responsible for accessibility, in the calculation of which the users of the city are actively involved. Unlike other current static indices, it provides up-to-date information on the level of accessibility as it is calculated on the basis of continuously collected data.
UAIndex is defined as:
UAIndex = KUAI × RS × E,
where, as mentioned above:
  • KUAI is the value representing compliance with the set of basic accessibility indicators.
  • RS is the value representing the extent to which the requests reported by citizens are solved by the government.
  • E is the value that represents the effectiveness of the government’s action to solve these requests.
Thus, in the design of UAIndex, RS and E are multiplying factors of the KUAI that incorporate, to the assessment of compliance with basic accessibility conditions, the dimension of accessibility management and maintenance. RS and E must be calculated with a certain periodicity (at least monthly) to provide an updated UAIndex.
Figure 1 shows conceptually the general functioning of the proposed model. In the following Section 4, the functioning and usefulness of the model is explained through examples.

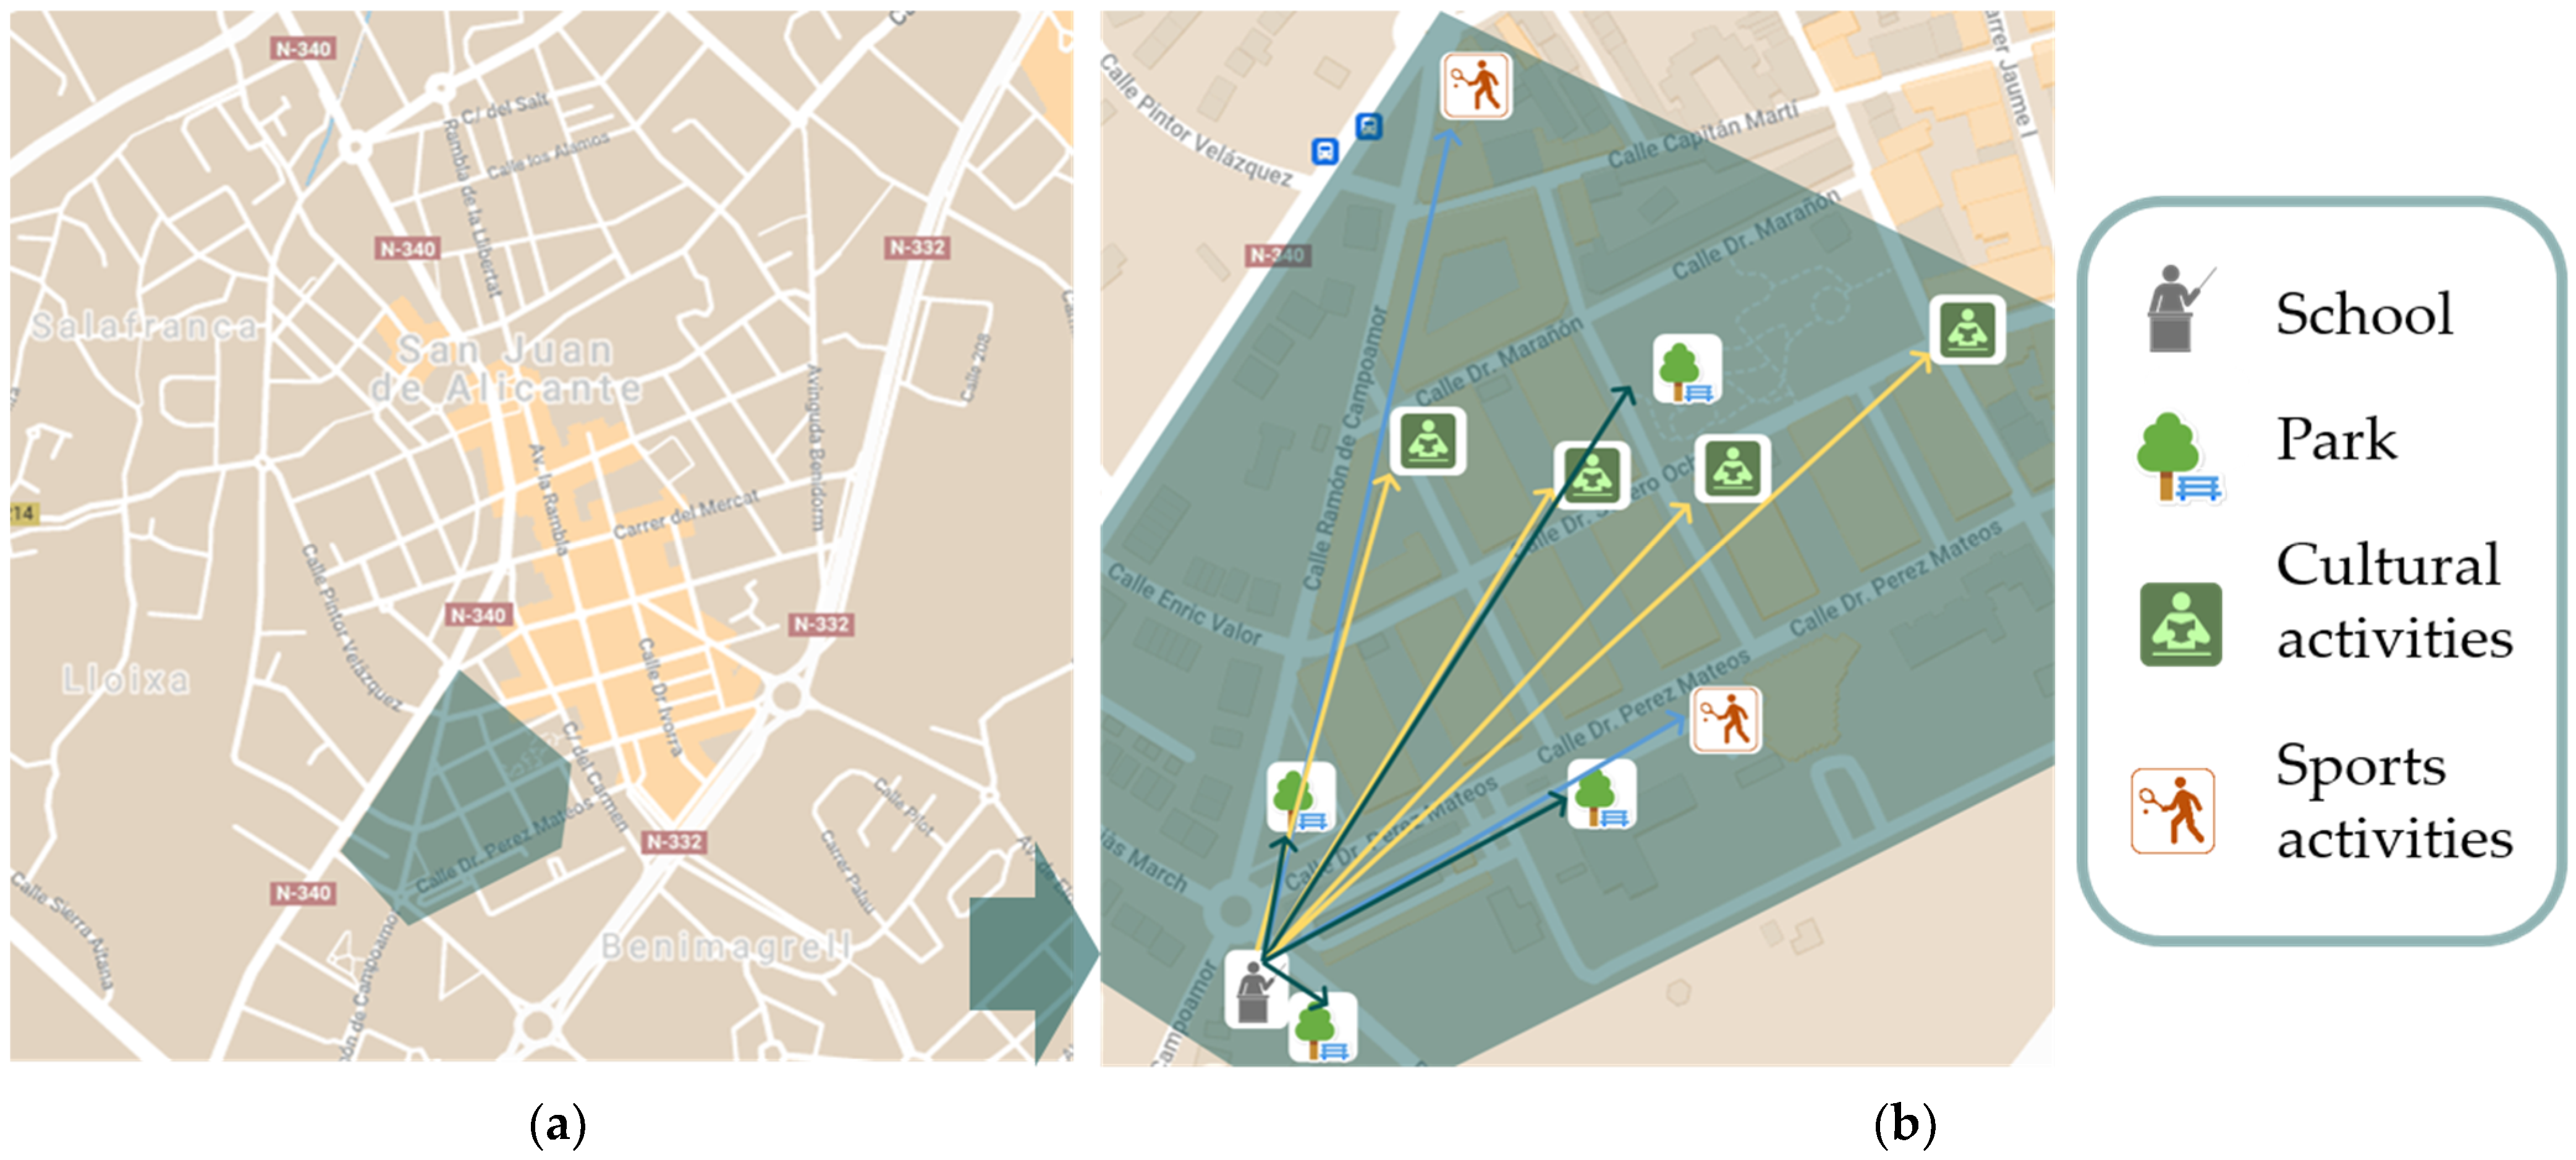
4. Experimentation and Discussion

As specified in the previous sections, the smart city concept requires both citizen participation and public administration to respond to citizen requirements in terms of accessibility. Beyond urban planning and compliance with regulations, public administration faces the great challenge of managing accessibility from a dynamic perspective that changes over time. The management of the smart city allows knowing, and therefore addressing, the real complaints of people with reduced mobility in an operational way, avoiding isolated actions. Given this, this section shows by way of example how the proposed management method, based on indicators, channels the citizens’ interaction with the public administration in a prolonged, constant and ubiquitous manner. Through the method it is possible to identify both accessible routes in the consolidated city and routes that have temporarily ceased to be accessible. These accessible routes are the result of the fulfilment of indicators in consecutive segments of the same street.
The following shows the experimentation carried out and how the conceptual model works. For better understanding, the routes studied in a real consolidated urban environment have been related in a specific example. In the example (Figure 2), various routes have been identified, which are typically associated with a particular service. In this case study, a school has been selected as a starting point, together with some of the routes commonly associated with this use, such as cultural activities (study academies, language schools or libraries and study halls) and sports activities for children that are usually carried out at the end of the school day. Likewise, the route to nearby parks has been included as it is a widespread habit after picking up children from school.
Figure 3 shows the routes from the school as a point of origin to destinations D, which correspond to the nearby parks D1, D2, D3 and D4. All the routes marked in green are made up of various accessible segments.
Firstly, it is verified that all street sections comply with the KPIs included in category C1 (Table 1) that refer to structural concepts of urbanization and city configuration. Compliance with the 29 KPIs included in this structural category must always be guaranteed in order to consider a segment or street as part of an accessible route. In this case, all x, i, j values of compliance of the indicators correspond to the value 1 according to function (5). Therefore, for all studied street segments, in application of the calculation Equation (6) results KC1 = 1.
The values KC2, KC3 and KC4, corresponding to categories C2 (Table 2), C3 (Table 3) and C4 (Table 4), are then calculated according to the calculation Equations (7)–(9) respectively. For these non-structural categories the values can range from 0 to 1. For these categories different values are obtained for the studied street segments. Five of the segments meet all the indicators, so the values of KC2, KC3 and KC4 correspond to value 1 (marked in green). However, in one of the segments studied (marked in orange) there are elements that obstruct signage and the use of a litter bin that is part of the street furniture. These problems affect categories C3 (UAI34) and C2 (UAI30) respectively, with values x, i, j = 0 for one of the indicators included in each of these categories. Therefore, the KUAI value of the different segments is as shown in Table 5 according to the calculation Equation (3).
Thus, segments S1, S2, S3, S4 and S5 reach maximum values of KUAI, while segment S6 reaches a lower value of 1 < 1.84 ≤ 2. The model considers that only segments S1, S2, S3, S4 and S5 can be part of accessible routes. However, the model also considers that segment S6 can be part of an accessible route with the implementation of non-structural improvements. Based on this information, managers responsible for accessibility management can identify the improvement actions that need to be addressed.
Based on this initial assessment of accessible routes, the proposed model allows the maintenance of this urban environment’s accessibility conditions in a real and truthful way through the incorporation of citizen dynamics and the response of the government responsible for managing accessibility. The management model is based on the continuous evaluation of both accessibility conditions and the response capacity of accessibility managers to address the problems identified.
The assessment of accessibility conditions is carried out on an ongoing basis by the citizens themselves who are users of the city. The capture of urban accessibility diagnoses in a specific segment is made from the claims reported by citizens through the mobile application that is part of the Urban Accessibility Monitoring System developed by our research group. A general overview of this system and the prototype of the application can be found in authors’ previous publications [72,74]. The system facilitates both monitor of real-time as well as the dynamic acquisition of information about accessibility. At the same time, it allows to monitor the efficiency of pre-planned accessibility actions. The core functionality of the application is the complaint management system. It includes an intuitive interface to collect in real time citizens’ claims and complaints about difficulties encountered while using it on their path (Figure 4). Thus, the application allows users to become active participants in the city’s management and governance processes. By sending a photograph of the place and entering a description of the problem via text or voice message, the system automatically indicates the location. In this way, through the application, citizens can create an interactive map of incidents that can be shared by the administration and other affected citizens. Citizens will have in real time the status of the incidents that are in process, resolved or rejected. In addition, once the request has been resolved, citizens can indicate their degree of satisfaction with the actions taken.
The participatory management model is designed so that claims reported by citizens on a specific street segment affect the complete route that integrates that street segment. Consequently, the routes that in a first assessment have been considered accessible (marked in green in Figure 2) would dynamically evolve to orange or red depending on the nature of the claims and their relation to compliance with the indicators for accessibility assessment included in each of the established categories.
Figure 5 shows an example of the temporal evolution of one of the studied routes to an inaccessible state. Due to various factors related to the construction of a new building (installation of scaffolding, construction site huts and containers), the public road has been occupied invading the sidewalks adjacent to park D1. This claim, whose nature is integrated into the structural category C1 in the classification of indicators, has been reported by several citizens. These claims lead to a recalculation of the KUAI for the segment (S1). As it does not comply with all the KPIs included in the C1 category, the new KC1 value corresponding to the segment is KC1 = 0 and therefore also the KUAI value = 0. This segment could not be part of an accessible route so it is shown in red, and would require the attention of the administration and its response capacity to be restored back to green. This would be seen by local governments, which would be able to take actions for an efficient and immediate management to restore the street segment to its initial accessible state.
Likewise, Figure 5 shows an example of an incident at a specific point. The illumination in part of one of the segments (S3) has stopped working properly and citizens have reported it through the application because they consider that it affects the accessibility conditions of the segment. The problem affects the indicator category C3 (UAI35). As this claim is not of a structural nature, when the corresponding KUAI value is recalculated, this value only decreases, resulting in 1 < KUAI ≤ 2, which temporarily regress the street segment to orange (S3). This section could be returned to an accessible route without too much difficulty, if the implementation of non-structural improvements is carried out. The automatic visualization by the public administration of the problem would enable strategic and effective decision making on the affected sections and connections to nearby services. Since the first evaluation of the different segments, the KUAI values have changed as shown in Table 6.
Following the process, it is possible to calculate the values of the RS and E factors for the urban area studied. RS is the ratio that relates the magnitude that represents the set of requests reported by citizens that have been dealt with by the responsible government with respect to the total number of reported requests. In the example, we estimate that citizens have reported a total of seven claims and that, of these, at the time of the calculation of the factors, only three have been dealt with by the administration. E represents the efficiency of the government’s action to provide a solution to the requests reported by citizens. All the claims have been solved by the administration in a period of less than 10 days. Table 7 shows the values obtained for the RS and E factors according to the calculation Equations (10) and (11). Finally, it is possible to calculate the value of UAIndex in the studied urban area from the obtained values (KUAI, RS, E) by applying the corresponding calculation Equation (12). In the urban area studied, the obtained value UAIndex = 1.1 is lower than the value KUAI = 1.975, which means that the management of accessibility problems carried out by the administration has been penalized with respect to the overall assessment of compliance with accessibility indicators. Although the response time of the administration can be considered efficient (less than 10 days), a high number of claims reported by citizens have not yet been dealt with. The proposed model, focusing on the assessment of accessibility management, has served to highlight this important issue.

5. Conclusions

Accessibility management in smart cities takes on a key role in the consolidated urban areas of existing cities, where accessibility management goes beyond urban planning and constitutes an important area for improvement in existing environments. However, there are currently no universal design criteria to assess basic accessibility conditions in consolidated urban environments at the international level.
As a consequence, this research focuses on the contribution to this issue in order to establish global criteria for accessibility management that takes into account the real problems of people with reduced mobility. Therefore, the present paper proposes a method of urban accessibility management based on indicators, which provides an index of accessibility in cities to ensure the improvement of accessibility conditions in existing spaces. The proposed model establishes four essential actions as categories that include several subcategories for the determination of accessibility indicators in urban environments: Walkability (in relation to movement), Usability and Handling (in relation to Grasping), Wayfinding (in relation to location), and Accessible communication (in relation to communication). For each of the categories and subcategories, various indicators of accessibility in consolidated urban environments have been defined and selected so that they can be applied globally for the evaluation of accessible routes in consolidated areas, as a complement to the application of specific regulations in each country.
Likewise, the model allows the identification and maintenance of accessible pedestrian routes through the continuous monitoring and evaluation of their efficient functioning by means of citizen participation. In addition to citizen dynamics through new technologies, the proposed method allows communication between citizens and the administrations responsible for improving accessibility in cities to ensure the creation and maintenance of accessible routes in compliance with the accessibility index. In short, the proposed model provides services to the local administration for efficient decision making and better use of resources, consolidating the concept of a smart and inclusive city in a participatory, dynamic and constant way over time.
As main limitations, in order for the application of the model to provide results and be a useful management tool for the administration, it is necessary to increase citizens’ awareness of the importance of their participation in the management of the city. Greater participation allows the management tool to operate more efficiently. In this sense, one of the main difficulties is regarding data security. This is why the application used for the accessibility claims report does not require users to provide any personal data, only if they voluntarily choose to do so, such as age or type of disability. The administration must also engage in this type of more transparent e-government. The operation of the model shows the effectiveness of the administration’s management, and city managers are not always willing to have the management carried out, assessed. On the other hand, the model presented can be enriched with the more efficient automation of some of the tasks, such as the systematic evaluation and verification of the compliance with some indicators. In this line, future research by the authors is proposed, as well as the development of specific cases of application of the model on a larger scale (in vulnerable neighborhoods in cities, primarily) in collaboration with other institutions and administrations responsible for accessibility management in these cities. Raising awareness among academics, urban planning professionals and city managers about the potential of these new ICT-based methodologies is essential for research to have a real impact on society.

Author Contributions

Conceptualization, R.P.-d., M.D.A.-M., H.M., V.G.-I. and R.A.M.-S.; methodology, R.P.-d., M.D.A.-M., H.M., V.G.-I. and R.A.M.-S.; investigation, R.P.-d., M.D.A.-M., H.M., V.G.-I. and R.A.M.-S.; writing—original draft preparation, R.P.-d., M.D.A.-M., H.M., V.G.-I. and R.A.M.-S.; writing—review and editing, R.P.-d., M.D.A.-M., H.M., V.G.-I. and R.A.M.-S.; visualization, R.P.-d., M.D.A.-M., H.M., V.G.-I. and R.A.M.-S. All authors have read and agreed to the published version of the manuscript.

Funding

This research was funded by the Conselleria of Innovation, Universities, Science and Digital Society, of the Community of Valencia, Spain, grant number AICO/2020/206, and by the University of Alicante, Spain, grant number GRE19-01.

Institutional Review Board Statement

Not applicable.

Informed Consent Statement

Not applicable.

Data Availability Statement

Not applicable.

Conflicts of Interest

The authors declare no conflict of interest.

References

  1. Joujje, I. Countering the Right to the Accessible City: The Perversity of a Consensual Demand. In Cities for All: Proposals and Experiences towards the Right to the City; Habitat International Coalition: Santiago, Chile, 2010; pp. 43–56. [Google Scholar]
  2. Clarke, P.; Ailshire, J.A.; Bader, M.; Morenoff, J.D.; House, J.S. Mobility disability and the urban built environment. Am. J. Epidemiol. 2008, 168, 506–513. [Google Scholar] [CrossRef] [PubMed]
  3. Manley, S. Creating an accessible public realm. In Universal Design Handbook, 2nd ed.; Preiser, McGraw-Hill: New York, NY, USA, 2011; pp. 17.5–17.12. [Google Scholar]
  4. General Assembly, United Nations. Convention on the Rights of Persons with Disabilities. 2006. Available online: http://www.un.org/en/ga/search/view_doc.asp?symbol=A/RES/61/106&Lang=EN (accessed on 12 March 2021).
  5. Noga, J.; Wolbring, G. An Analysis of the United Nations Conference on Sustainable Development (Rio+20) Discourse Using an Ability Expectation Lens. Sustainability 2013, 5, 3615–3639. [Google Scholar] [CrossRef] [Green Version]
  6. Canadian Human Rights Commission. International Best Practices in Universal Design: A Global Review. 2006. Available online: https://www.chrc-ccdp.gc.ca/sites/default/files/publication-pdfs/bestpractices_en.pdf (accessed on 12 March 2021).
  7. Council of Europe. Achieving Full Participation through Universal Design. 2007. Available online: https://search.coe.int/cm/Pages/result_details.aspx?ObjectID=09000016805d46ae (accessed on 12 March 2021).
  8. European Commission. European Disability Strategy 2010–2020: A Renewed Commitment to a Barrier-Free Europe. 2010. Available online: https://eur-lex.europa.eu/LexUriServ/LexUriServ.do?uri=COM%3A2010%3A0636%3AFIN%3Aen%3APDF (accessed on 12 March 2021).
  9. Park, J.; Chowdhury, S. Investigating the barriers in a typical journey by public transport users with disabilities. J. Transp. Health 2018, 10, 361–368. [Google Scholar] [CrossRef]
  10. Mahmood, A.; Labbé, D. ‘An accessible route is always the longest’: Older adults’ experience of their urban environment captured by user-led audits and photovoice. In Aging People, Aging Places: Experiences, Opportunities, and Challenges of Growing Older in Canada; Bristol University Press: Bristol, UK, 2021; pp. 27–44. [Google Scholar]
  11. Eisenberg, Y.; Heider, A.; Gould, R.; Jones, R. Are communities in the United States planning for pedestrians with disabilities? Findings from a systematic evaluation of local government barrier removal plans. Cities 2020, 102, 102720. [Google Scholar] [CrossRef]
  12. General Assembly, United Nations. Transforming Our World: The 2030 Agenda for Sustainable Development. 2015. Available online: https://www.un.org/ga/search/view_doc.asp?symbol=A/RES/70/1&Lang=E (accessed on 12 March 2021).
  13. Hanna, N.K. Transforming Government and Building the Information Society: Challenges and Opportunities for the Developing World; Springer: New York, NY, USA, 2010. [Google Scholar]
  14. Goldsmith, S.; Crawford, S. The Responsive City: Engaging Communities through Data-Smart Governance; John Wiley & Sons: New York, NY, USA, 2014. [Google Scholar]
  15. Visvizi, A.; Pérez-delHoyo, R. (Eds.) Smart Cities and the UN SDGs; Elsevier: Amsterdam, The Netherlands, 2021. [Google Scholar]
  16. Visvizi, A.; Lytras, M.D. (Eds.) Smart Cities: Issues and Challenges: Mapping Political, Social and Economic Risks and Threats; Elsevier: Amsterdam, The Netherlands, 2019. [Google Scholar]
  17. Prince, M.J. Inclusive city life: Persons with disabilities and the politics of difference. Disabil. Stud. Q. 2008, 28, 1. [Google Scholar] [CrossRef]
  18. United Nations, UN-Habitat III. New Urban Agenda. 2017. Available online: https://uploads.habitat3.org/hb3/NUA-English-With-Index-1.pdf (accessed on 12 March 2021).
  19. Espino, N.A. Building the Inclusive City: Theory and Practice for Confronting Urban Segregation; Routledge: Abingdon, UK, 2015. [Google Scholar]
  20. Liang, D.; De Jong, M.; Schraven, D.; Wang, L. Mapping key features and dimensions of the inclusive city: A systematic bibliometric analysis and literature study. Int. J. Sustain. Dev. World Ecol. 2021, 1–20. [Google Scholar] [CrossRef]
  21. Steffan, I.T.; Klenovec, M.A. EU Standardization. Mandate 420-Accessibility in the Built Environment Following a Design for All Approach. In Proceedings of the 20th Congress of the International Ergonomics Association, Florence, Italy, 26–30 August 2018; Springer: Berlin/Heidelberg, Germany, 2018; pp. 1506–1515. [Google Scholar]
  22. International Organization for Standardization (ISO). ISO 21542: 2011 Accessibility and Usability of the Built Environment; ISO: Geneva, Switzerland, 2011. [Google Scholar]
  23. Preiser, W.F. Universal design: From policy to assessment research and practice. Int. J. Archit. Res. 2008, 2, 78–93. [Google Scholar]
  24. Aghaabbasi, M.; Moeinaddini, M.; Asadi-Shekari, Z.; Shah, M.Z. The equitable use concept in sidewalk design. Cities 2019, 88, 181–190. [Google Scholar] [CrossRef]
  25. Kelly, C.M.; Wilson, J.S.; Baker, E.A.; Miller, D.K.; Schootman, M. Using Google Street View to audit the built environment: Inter-rater reliability results. Ann. Behav. Med. 2013, 45, S108–S112. [Google Scholar] [CrossRef] [Green Version]
  26. Mosca, E.I.; Capolongo, S. Towards a universal design evaluation for assessing the performance of the built environment. In Transforming Our World through Design, Diversity and Education; IOS Press: Amsterdam, The Netherlands, 2018; pp. 771–779. [Google Scholar]
  27. Palazzi, C.E.; Bujari, A. Fostering accessible urban mobility through smart mobile applications. In Proceedings of the 13th IEEE Annual Consumer Communications & Networking Conference (CCNC), Las Vegas, NV, USA, 9–12 January 2016; IEEE: New York, NY, USA, 2016; pp. 1141–1145. [Google Scholar]
  28. Palazzi, C.E.; Teodori, L.; Roccetti, M. Path 2.0: A participatory system for the generation of accessible routes. In Proceedings of the IEEE International Conference on Multimedia and Expo, Singapore, 19–23 July 2010; IEEE: New York, NY, USA, 2010; pp. 1707–1711. [Google Scholar]
  29. Salomoni, P.; Prandi, C.; Roccetti, M.; Nisi, V.; Nunes, N.J. Crowdsourcing urban accessibility: Some preliminary experiences with results. In Proceedings of the 11th Biannual Conference on Italian SIGCHI Chapter, Rome, Italy, 28–30 September 2015; ACM: New York, NY, USA, 2015; pp. 130–133. [Google Scholar]
  30. Prandi, C.; Mirri, S.; Ferretti, S.; Salomoni, P. On the need of trustworthy sensing and crowdsourcing for urban accessibility in smart city. ACM Trans. Internet Technol. 2017, 18, 1–21. [Google Scholar] [CrossRef]
  31. Prandi, C.; Mirri, S.; Salomoni, P. Trustworthiness assessment in mapping urban accessibility via sensing and crowdsourcing. In Proceedings of the First International Conference on IoT in Urban Space, Rome, Italy, 27–28 October 2014; ICST: Brussels, Belgium, 2014; pp. 108–110. [Google Scholar]
  32. Comai, S.; Kayange, D.; Mangiarotti, R.; Matteucci, M.; Yavuz, S.U.; Valentini, F. Mapping City Accessibility: Review and Analysis. In Proceedings of the AAATE Conference, Budapest, Hungary, 9–12 September 2015; IOS Press: Amsterdam, The Netherlands, 2015; pp. 325–331. [Google Scholar]
  33. Cáceres, P.; Cuesta, C.E.; Vela, B.; Cavero, J.M.; Sierra, A. Smart data at play: Improving accessibility in the urban transport system. Behav. Inf. Technol. 2020, 39, 681–694. [Google Scholar] [CrossRef]
  34. Mobasheri, A.; Deister, J.; Dieterich, H. Wheelmap: The wheelchair accessibility crowdsourcing platform. Open Geospat. Data Softw. Stand. 2017, 2, 27. [Google Scholar] [CrossRef]
  35. Sinkonde, D.; Mselle, L.; Shidende, N.; Comai, S.; Matteucci, M. Developing an intelligent PostGIS database to support accessibility tools for urban pedestrians. Urban Sci. 2018, 2, 52. [Google Scholar] [CrossRef] [Green Version]
  36. da Silva Lima, N.; Leite, J.P.C.; de Paiva, A.C.; Maia, I.M.O.; Silva, A.C.; Junior, G.B.; de Souza Baptista, C. Mobile Application for Crowdmapping Accessibility Places and Generation of Accessible Routes. In Proceedings of the International Conference on Applied Human Factors and Ergonomics, Orlando, FL, USA, 21–25 July 2015; Springer: Berlin/Heidelberg, Germany, 2018; pp. 934–942. [Google Scholar]
  37. Alepis, E.; Nita, S. Mobile application providing accessible routes for people with mobility impairments. In Proceedings of the 2017 8th International Conference on Information, Intelligence, Systems & Applications (IISA), Larnaca, Cyprus, 28–30 August 2017; IEEE: New York, NY, USA, 2017; pp. 1–5. [Google Scholar]
  38. Bardaro, G.; Vali, A.; Comai, S.; Matteucci, M. Accessible urban routes reconstruction by fusing mobile sensors data. In Proceedings of the 13th International Conference on Advances in Mobile Computing and Multimedia, Brussels, Belgium, 11–13 December 2015; ACM: Brussels, Belgium, 2015; pp. 84–92. [Google Scholar]
  39. Marques, V.L.; Graeml, A.R. Accessible maps and the current role of collective intelligence. GeoJournal 2019, 84, 611–622. [Google Scholar] [CrossRef]
  40. Orellana, D.; Bustos, M.E.; Marín-Palacios, M.; Cabrera-Jara, N.; Hermida, M.A. Walk’n’roll: Mapping street-level accessibility for different mobility conditions in Cuenca, Ecuador. J. Transp. Health 2020, 16, 100821. [Google Scholar] [CrossRef]
  41. Vale, D.S.; Ascens~ao, F.; Raposo, N.; Figueiredo, A.P. Comparing access for all: Disability-induced accessibility disparity in Lisbon. J. Geogr. Syst. 2017, 19, 43–64. [Google Scholar] [CrossRef]
  42. Neutens, T.; Schwanen, T.; Witlox, F.; De Maeyer, P. Equity of urban service delivery: A comparison of different accessibility measures. Environ. Plan. A 2010, 42, 1613–1635. [Google Scholar] [CrossRef]
  43. Luaces, M.R.; Fisteus, J.A.; Sánchez-Fernández, L.; Munoz-Organero, M.; Balado, J.; Díaz-Vilariño, L.; Lorenzo, H. Accessible Routes Integrating Data from Multiple Sources. ISPRS Int. J. Geo Inf. 2021, 10, 7. [Google Scholar] [CrossRef]
  44. Ding, C.; Wald, M.; Wills, G. Using open accessibility data for accessible travelling. In Proceedings of the 17th International Conference on Computers Helping People with Special Needs, Paris, France, 9–11 September 2014; Johannes Kepler University: Linz, Austria, 2014; pp. 1–4. [Google Scholar]
  45. Vela, B.; Cavero, J.M.; Cáceres, P.; Sierra-Alonso, A.; Cuesta, C.E. Using a NoSQL Graph Oriented Database to Store Accessible Transport Routes. In Proceedings of the EDBT/ICDT Workshops, Vienna, Austria, 26–29 March 2018; pp. 62–66. [Google Scholar]
  46. Biazzo, I.; Monechi, B.; Loreto, V. General scores for accessibility and inequalities in urban areas. R. Soc. Open Sci. 2019, 6, 190979. [Google Scholar] [CrossRef] [Green Version]
  47. Mirri, S.; Prandi, C.; Salomoni, P. Personalizing pedestrian accessible way-finding with mpass. In Proceedings of the 13th IEEE Annual Consumer Communications & Networking Conference (CCNC), Las Vegas, NV, USA, 9–12 January 2016; pp. 1119–1124. [Google Scholar]
  48. Melis, A.; Mirri, S.; Prandi, C.; Prandini, M.; Salomoni, P.; Callegati, F. Integrating personalized and accessible itineraries in MaaS ecosystems through microservices. Mob. Netw. Appl. 2018, 23, 167–176. [Google Scholar] [CrossRef]
  49. Rahaman, M.S.; Mei, Y.; Hamilton, M.; Salim, F.D. CAPRA: A contour-based accessible path routing algorithm. Inf. Sci. 2017, 385, 157–173. [Google Scholar] [CrossRef]
  50. Pan, X.; Han, C.S.; Law, K.H. Using motion planning to determine the existence of an accessible route in a CAD environment. Assist. Technol. 2010, 22, 32–45. [Google Scholar] [CrossRef] [PubMed] [Green Version]
  51. Beale, L.; Field, K.; Briggs, D.; Picton, P.; Matthews, H. Mapping for wheelchair users: Route navigation in urban spaces. Cartogr. J. 2006, 43, 68–81. [Google Scholar] [CrossRef]
  52. Mascetti, S.; Civitarese, G.; El Malak, O.; Bettini, C. SmartWheels: Detecting urban features for wheelchair users’ navigation. Pervasive Mob. Comput. 2020, 62, 101115. [Google Scholar] [CrossRef] [Green Version]
  53. Gani, M.O.; Raychoudhury, V.; Edinger, J.; Mokrenko, V.; Cao, Z.; Zhang, C. Smart surface classification for accessible routing through built environment: A crowd-sourced approach. In Proceedings of the 6th ACM International Conference on Systems for Energy-Efficient Buildings, Cities, and Transportation; ACM, New York, NY, USA, 13–14 November 2019; pp. 11–20. [Google Scholar]
  54. Mirri, S.; Prandi, C.; Salomoni, P.; Callegati, F.; Melis, A.; Prandini, M. A service-oriented approach to crowdsensing for accessible smart mobility scenarios. Mob. Inf. Syst. 2016, 2016, 2821680. [Google Scholar] [CrossRef] [Green Version]
  55. Edinger, J.; Hofmann, A.; Wachner, A.; Becker, C.; Raychoudhury, V.; Krupitzer, C. WheelShare: Crowd-sensed surface classification for accessible routing. In Proceedings of the IEEE International Conference on Pervasive Computing and Communications Workshops (PerCom Workshops), Kyoto, Japan, 11–15 March 2019; pp. 584–589. [Google Scholar]
  56. Han, C.S.; Law, K.H.; Latombe, J.C.; Kunz, J.C. A performance-based approach to wheelchair accessible route analysis. Adv. Eng. Inform. 2002, 16, 53–71. [Google Scholar] [CrossRef] [Green Version]
  57. Naveen, A.; Luo, H.; Chen, Z.; Li, B. Predicting Wheelchair Stability While Crossing a Curb Using RGB-Depth Vision. In Proceedings of the International Conference on Computers Helping People with Special Needs, Lecco, Italy, 9–11 September 2020; Springer: Cham, Germany, 2020; pp. 394–401. [Google Scholar]
  58. Zeng, L.; Weber, G. Accessible maps for the visually impaired. In Proceedings of the IFIP INTERACT 2011 Workshop on ADDW, CEUR, Karlsruhe, Germany, 21–22 February 2011; Springer: Berlin/Heidelberg, Germany, 2011; pp. 1–12. [Google Scholar]
  59. Hashemi, M. Dynamic, stream-balancing, turn-minimizing, accessible wayfinding for emergency evacuation of people who use a wheelchair. Fire Technol. 2018, 54, 1195–1217. [Google Scholar] [CrossRef]
  60. Onorati, T.; Malizia, A.; Diaz, P.; Aedo, I. Modeling an ontology on accessible evacuation routes for emergencies. Expert Syst. Appl. 2014, 41, 7124–7134. [Google Scholar] [CrossRef] [Green Version]
  61. Cutini, V. Managing Accessibility—The Configurational Approach to the Inclusive Design of Urban Spaces. J. Civ. Eng. Archit. 2012, 6, 444–456. [Google Scholar]
  62. Santana-Santana, S.B.; Peña-Alonso, C.; Espino, E.P.C. Assessing universal accessibility in Spanish beaches. Ocean Coast. Manag. 2021, 201, 105486. [Google Scholar] [CrossRef]
  63. Biernacka, M.; Kronenberg, J. Classification of institutional barriers affecting the availability, accessibility and attractiveness of urban green spaces. Urban For. Urban Green. 2018, 36, 22–33. [Google Scholar] [CrossRef]
  64. Rosa, M.; Landim, I.; Loureiro, N. Methodological proposal for the assessment of universal accessibility on footpaths: The case of the historical center of Faro. Rev. Tur. Desenvolv. 2017, 1, 385–397. [Google Scholar]
  65. Palazón, A.; López, I.; Gilart, V.; Aragonés, L.; Marcos-Jorquera, D.; Foti, D. New ICT-based index for beach quality management. Sci. Total Environ. 2019, 684, 221–228. [Google Scholar] [CrossRef] [PubMed] [Green Version]
  66. Foronda-Robles, C.; Galindo-Pérez-de-Azpillaga, L.; Fernández-Tabales, A. Progress and stakes in sustainable tourism: Indicators for smart coastal destinations. J. Sustain. Tour. 2020, 1–20. [Google Scholar] [CrossRef]
  67. Boisjoly, G.; El-Geneidy, A.M. How to get there? A critical assessment of accessibility objectives and indicators in metropolitan transportation plans. Transp. Policy 2017, 55, 38–50. [Google Scholar] [CrossRef]
  68. Páez, A.; Scott, D.M.; Morency, C. Measuring accessibility: Positive and normative implementations of various accessibility indicators. J. Transp. Geogr. 2012, 25, 141–153. [Google Scholar] [CrossRef]
  69. Ferreira, M.A.; da Penha Sanches, S. Proposal of a sidewalk accessibility index. J. Urban Environ. Eng. 2007, 1, 1–9. [Google Scholar] [CrossRef]
  70. da Silva, O.H.; Pitilin, T.R.; Gobbo, C.A.R.; Caxambu, M.G.; da Penha Sanches, S.; Neto, G.D.A. Accessibility index for urban walkable spaces. Acta Scientiarum. Technol. 2020, 42, e45181. [Google Scholar] [CrossRef]
  71. Jang, K.M.; Kim, J.; Lee, H.Y.; Cho, H.; Kim, Y. Urban Green Accessibility Index: A Measure of Pedestrian-Centered Accessibility to Every Green Point in an Urban Area. ISPRS Int. J. Geo Inf. 2020, 9, 586. [Google Scholar] [CrossRef]
  72. Mora, H.; Gilart-Iglesias, V.; Pérez-delHoyo, R.; Andújar-Montoya, M.D. A Comprehensive System for Monitoring Urban Accessibility in Smart Cities. Sensors 2017, 17, 1834. [Google Scholar] [CrossRef] [Green Version]
  73. Pérez-delHoyo, R.; García-Mayor, C.; Mora, H.; Gilart-Iglesias, V.; Andújar-Montoya, M.D. Improving urban accessibility: A methodology for urban dynamics analysis in smart, sustainable and inclusive cities. Int. J. Sustain. Dev. Plan. 2017, 12, 357–367. [Google Scholar] [CrossRef] [Green Version]
  74. Mora, H.; Gilart-Iglesias, V.; Pérez-del Hoyo, R.; Andújar-Montoya, M.D.; Compañ-Gabucio, H.J. Interactive cloud system for the analysis of accessibility in smart cities. Int. J. Des. Nat. Ecodyn. 2016, 11, 447–458. [Google Scholar] [CrossRef] [Green Version]
  75. Mollá-Sirvent, R.A.; Mora, H.; Gilart-Iglesias, V.; Pérez-delHoyo, R.; Andújar-Montoya, M.D. Accessibility index for smart cities. Procedings 2018, 2, 1219. [Google Scholar] [CrossRef] [Green Version]
  76. Gilart-Iglesias, V.; Mora, H.; Pérez-delHoyo, R.; García-Mayor, C. A computational method based on radio frequency technologies for the analysis of accessibility of disabled people in sustainable cities. Sustainability 2015, 7, 14935–14963. [Google Scholar] [CrossRef] [Green Version]
  77. Silvestri, B.; Rinaldi, A.; Roccotelli, M.; Fanti, M.P. Innovative baseline estimation methodology for key performance indicators in the electro-mobility sector. In Proceedings of the 6th International Conference on Control, Decision and Information Technologies (CoDIT), Paris, France, 23–26 April 2019; IEEE: New York, NY, USA, 2019; pp. 1367–1372. [Google Scholar]
  78. AENOR. Universal Accessibility. Part 1: MGLC Criteria to Facilitate Accessibility to the Environment; UNE 170001-1; AENOR: Madrid, Spain, 2007. [Google Scholar]
  79. Lynch, K. The Image of the City; Massachusetts Institute of Technology: Cambridge, MA, USA, 1960. [Google Scholar]
  80. Department of Economic and Social Affairs, United Nations. Accessibility and Development: Environmental Accessibility and Its Implications for Inclusive, Sustainable and Equitable Development for All. 2013. Available online: https://www.un.org/disabilities/documents/accessibility_and_development_june2013.pdf (accessed on 12 March 2021).
Figure 1. General functioning of the proposed model.
Sustainability 13 08323 g001
Figure 2. Exemplification of the operation of the conceptual model (a) study of a consolidated neighborhood area; (b) choice of a specific use and its associated services, as a sample application of the conceptual model.
Sustainability 13 08323 g002
Figure 3. Identification of accessible routes commonly associated with one of the specific services. Initial assessment.
Sustainability 13 08323 g003
Figure 4. Urban Accessibility Application. Screens for managing complaints.
Sustainability 13 08323 g004
Figure 5. Dynamic visualization of accessibility in street segments as a result of the relationship between citizen claims and the response of the governments in charge of managing accessibility.
Sustainability 13 08323 g005
Table 1. Key Performance Indicators (KPIs). Classification of Urban Accessibility Indicators (UAI) for accessible routes. Category C1: Walkability.
Key Performance Indicators (KPIs)
Urban Accessibility Indicators (UAI)
Category C1. Walkability
CanadaAustraliaSwedenSpainBest
Practice
C1.1. Pathways
UAI01. Minimum clear width required on accessible routes for two wheelchairs to pass; for a wheelchair and a person using a white cane to pass in opposite directions; and for allowing a wheelchair to turn 180/360° (minimum diameter for clear turning space 1500 mm).15001800180018001800
UAI02. Minimum clear headroom height pedestrian areas such as walkways or corridors.203020002200–200021002030
UAI03. Accessible routes adjacent to a vehicular route are separated by a curb with a curb ramp, a railing or barrier, or a detectable hazard indicator.yes yes yes
UAI04. Well-designed curb ramps are provided at all crossings (at both sides of the street/pedestrian street crossing), and have a level transition from the ramp to the adjacent surfaces.
Minimum width of curb ramp (not including flare).9201000900–1000 1000
Maximum running slope of the curb ramp.1:15–1:101:81:12 1:12–1:16
UAI05. Curb ramps lead people directly into the crossing area (pedestrian street crossing).yesyes yes
UAI06. For long paths of travel, well-designed technical aids are provided (railings, handrails, etc.). yes
UAI07. In case of space reservations (such as car parks or other) these spaces do not obstruct the pathways and have the required approximation spaces. yes
C1.2. Approximation spaces
UAI08. Approximation spaces are clear of obstacles as are the pathways. yes
UAI09. Adequate approximation spaces are provided for the use of all the elements and services available to users. yes
UAI10. Minimum level walking space back from the top of a curb ramp slope lower area, so a pedestrian can avoid it.9201330 1200
UAI11. Minimum required landing length on a ramp.15001200200015002000
UAI12. Minimum clear width at U-turns around an obstacle.1100 12001200
C1.3. Resting areas
UAI13. For long paths of travel, resting areas are provided off the path of travel at approximate intervals.30,000 Every 30,000
C1.4. Changes in level
UAI14. Maximum cross slope of an accessible route.1:501:401:50 1:50 (2%)
UAI15. Maximum running slope of an accessible route (if steeper, it is considered to be a ramp).1:201:201:12 int. 1:20 ext. 1:20 (5%)
UAI16. Maximum horizontal distance between landings on a ramp.90009000 if 1:14 15,000 if 1:206000 if 1:12 10,000 if 1:2090006000
UAI17. Running slope between landings on a ramp.1:12–1:201:14–1:201:12 int. 1:20 ext.1:10–1:161:16–1:20
UAI18. Maximum cross slope of a ramp. 1:501:401:50 1:50 (2%)
UAI19. Maximum vertical rise on accessible routes (except for elevators, elevating devices and curb ramps).6 should be evenbevel at 1:26
UAI20. For a vertical rise between 7–13 mm on accessible routes (except for elevators, elevating devices and curb ramps).bevelled at slope of up to 1:2 should be even bevelled at slope of up to 1:2
UAI21. For a vertical rise over 13 mm on accessible routes (except for elevators, elevating devices and curb ramps).not steeper than 1:12 should be eventreat as a ramptreat as a ramp, not steeper than 1:12
UAI22. Maximum rise of a flight of stairs between landings. 13 steps max.2500 max.
C1.5. Pavements
UAI23. The floor and ground surfaces are stable, firm and slip-resistant (all surfaces).yesyesyesyesyes
UAI24. The floor and ground surfaces produce minimal glare (all surfaces).yes yesyes
UAI25. The floor and ground surfaces have a regular pattern that is not heavily patterned (all surfaces).yes yes
UAI26. Curb ramps have detectable warning surface with color and texture contrast with adjacent surfaces.yesyesDifferent texture and luminance yes
UAI27. Detectable directional and hazard indicators have a color and texture that contrast with adjacent surfaces.yes yes
UAI28. Gratings in a pedestrian area are in one direction, and placed so that the long dimension is perpendicular to the primary direction of travel. Maximum spacing widths.131310 10
UAI29. Carpet or carpet tile are securely fastened, if any.yesyesnot be a trip risk yes
Table 2. Classification of Urban Accessibility Indicators (UAI) for accessible routes. Category C2: Usability and Handling.
Urban Accessibility Indicators (UAI)
Category C2. Usability and Handling
CanadaAustraliaSwedenSpainBest
Practice
C2.1. Location
UAI30. Location of the elements and services available to users allows for easy and safe use. yes
C2.2. Design
UAI31. Street furniture, interactive machines and equipment available to users have required universal design features. yes
UAI32. Ramps and stairs have the required design elements and well-designed handrails that are easily accessible.yesyesyesyesyes
Table 3. Classification of Urban Accessibility Indicators (UAI) for accessible routes. Category C3: Wayfinding.
Urban Accessibility Indicators (UAI)
Category C3. Wayfinding
CanadaAustraliaSwedenSpainBest
Practice
C3.1. Signage
UAI33. Signage has the required design characteristics (simplicity, uniform design, consistently located, colour contrasted with its background, no glare or reflections).yes yesyesyes
UAI34. There are no elements obstructing signage. yes
C3.2. Illumination
UAI35. Key areas (including signage) are well illuminated and have the required technical and design features.yesyesyesyesyes
C3.3. Detectable indicators
UAI36. Detectable directional indicators are provided to facilitate wayfinding in open areas and to signal a route to be taken, without creating a tripping hazard.yes yes
UAI37. Width of detectable directional indicators.600–800 600–800
UAI38. Detectable hazard indicators are provided to warn people of upcoming hazards, without creating a tripping hazard (stairs, ramps, vehicular routes).yes yes
UAI39. If elements for orientation are available, these elements are standardized and adapted, such as tactile-visual or sound plans. yes
Table 4. Classification of Urban Accessibility Indicators (UAI) for accessible routes. Category C4: Accessible Communication.
Urban Accessibility Indicators (UAI)
Category C4. Accessible communication
CanadaAustraliaSwedenSpainBest
Practice
UAI40. Communication is visual, acoustic or tactile, or their combination, to the extent appropriate.yesyesyesyesyes
UAI41. International symbols of accessibility have been used.yes yesyesyes
Table 5. KUAI value of the different segments in the urban study area. Initial assessment.
Street SegmentKC1KC2KC3KC4KUAI
S1, S2, S3, S4, S511112
S612/36/711.84
Urban area (median) 2
Table 6. KUAI value of the different segments in the urban study area. New assessment.
Street SegmentKC1KC2KC3KC4KUAI
S101110
S3116/711.95
S2, S4, S511112
S612/36/711.84
Urban area (median) 1.975
Table 7. Calculation of the KUAIndex value in the urban study area.
Street SegmentKUAINo. Claims (Nr)
Reported by
Citizens
No. Claims (Ns) Dealt with by the
Administration
No. Days (t)
Required to Attend to Claims
RSEUAIndex
S1020-
S31.9510-
S2, S4, S52227
S61.84217
Urban area1.97573 3/72-(7/10)1.1
Publisher’s Note: MDPI stays neutral with regard to jurisdictional claims in published maps and institutional affiliations.

