Article

A Fluorescence Method Based on N, S-Doped Carbon Dots for Detection of Ammonia in Aquaculture Water and Freshness of Fish

1
Beijing Agricultural Information Technology Research Center, Beijing 100097, China
2
National Engineering Laboratory for Agricultural Product Quality and Safety Traceability Technology and Application, Beijing 100097, China
*
Author to whom correspondence should be addressed.
Sustainability 2021, 13(15), 8255; https://doi.org/10.3390/su13158255
Submission received: 6 June 2021 / Revised: 15 July 2021 / Accepted: 18 July 2021 / Published: 23 July 2021

Abstract

:
Excessive ammonia can cause the death of fish and the eutrophication of the water environment, so ammonia detection is essential for environmental monitoring. In this study, a highly selective sensing strategy for ammonia detection based on N, S co-doped carbon dots (N, S-CDs) was developed. The as-prepared N, S-CDs exhibited excellent photoluminescence properties and fluorescent stability. N, S-CDs demonstrated fluorescence quenched in the presence of ammonia in the wide linear range of 2–80 mmol/L, and were highly selective towards ammonia over metal ions. Furthermore, a possible fluorescence quenching mechanism is proposed. N, S-CDs were further applied to detection of ammonia in aquaculture water samples and river water samples, showing good practicability with recoveries from 0.93 to 1.27 and relative standard deviations (RSDs) of 0.54% to 17.3%. N, S-CDs were also successfully used to determine the freshness of bighead carps.

1. Introduction

Ammonia (NH3) is one of the main forms of nitrogen in water and an essential source for protein synthesis in aquatic organisms. However, NH3 is extremely harmful to aquatic animals due to its toxicity [1]. The excessive ammonia content in the water can affect the growth and metabolism, the balance of osmotic pressure, the respiratory system and the immune system of aquatic animals, and even cause death [2,3]. As a nutrient, ammonia also provides conditions for the reproduction of phytoplankton in the water, causing eutrophication and deterioration of water quality [4,5,6]. In recent years, with the production and activities of human beings, the amount of ammonia emissions in the environment has increased sharply. Therefore, in view of the increasing trend of ammonia accumulation in the water environment and the serious harm caused by ammonia, the detection of ammonia in water is of great significance for preventing water deterioration and ensuring the safety of aquatic animals. Ammonia is also an indicator for the freshness of aquatic products as one of the main components of volatile basic nitrogen (TVB-N) [7]. Aquatic products are prone to deterioration and corruption which not only causes huge economic losses, but also exposes consumers to huge risks of food-borne diseases. Thus, ammonia detection is essential for the environmental monitoring and freshness determination.
Electrode methods are commonly used in ammonia detection, mainly based on the voltammetry detection technique. In recent years, nanomaterials-modified electrodes have been attracting increasing attention due to their low operation temperature, improved accuracy and sensitivity in the field of ammonia detection [8,9]. However, corrosion of electrodes caused by the strong alkaline environment can reduce the detection performance significantly, so the durability and reliability of the nanomaterials-modified electrodes need further research and verification. Fluorescence methods have successfully been used in ammonia detection due to their easy design strategies, excellent sensitivity and selectivity, and rapid response. Fluorescent reagents for ammonia detection include O-phthalaldehyde (OPA) [10], BF2-chelated tetraarylazadipyrromethene (aza-BODIPYs) [11] and oxazine perchlorate, etc. [12]. However, these organic fluorescent reagents are toxic and harmful to the environment. With the development of technology, researchers pay more and more attention to the safety and environmental friendliness of reagents. Compared with traditional organic dyes, carbon dots (CDs) have strong photobleaching resistance, broad absorption spectrum, excellent biocompatibility, low cytotoxicity and excellent dispersion in water. These unique optical properties render CDs as promising fluorescent indicators [13,14]. The applications of CDs in the field of water and food detection is mainly focused on heavy metal ions and pesticide residues [15,16,17]. A few papers have reported on ammonia fluorescence detection based on CDs. Ganiga et al. [18] proposed a CDs-sodium rhodizonate ammonia sensor based on Förster resonance energy transfer (FRET), however, the solution of sodium rhodizonate was unstable in the sunlight, which limited its application. Yu et al. [19] developed a smartphone-coalesced dual-channel nanoprobe based on biomass CDs combined with the HS-SDME technique in which the nanoprobe was sensitive to pH and ammonia in a wide range based on colorimetry and the fluorescent method. Many studies have shown that doping CDs with different elements can enhance their fluorescence and electronic performance. Travlou et al. [20] synthesized two kinds of sulfur-doped carbon dots (S-CDs), and built ammonia sensors using synthesized S-CDs based on the fluorescence quenched method, which showed high sensitivity and selectivity towards ammonia. However, the interference ability of CDs to metal ions was not discussed in this paper. To the best of our knowledge, although there are numerous studies on N and S-doped CDs [21,22,23,24], the applications of N, S-doped CDs for ammonia detection, especially in the field of water environment and food freshness, have not been reported.
In this paper, a highly selective sensing strategy for ammonia detection in water environment and freshness of fish based on N, S-CDs was developed. N, S-CDs were prepared using malic acid, ethylenediamine and L-cysteine as precursors by one-step hydrothermal. The fluorescence characteristics of prepared N, S-CDs were studied. It was found that the fluorescence of N, S-CDs can be quenched in the presence of ammonia, and the quenching of fluorescence was highly selective towards ammonia over the metal ions. On the basis of this phenomenon, N, S-CDs were further applied to detection of ammonia in aquaculture water samples, river water samples, and the freshness of fish, showing good practicability.

2. Materials and Methods

2.1. Instrumentation

Transmission electron microscopy (TEM) observations were carried out on a transmission electron microscope (JEOL JEM-2100F, Japan). Fourier transform infrared spectra (FTIR) were obtained on a FTIR spectrometer with the KBr pellet technique (TianjinGangdong Co. FTIR-650, China). X-ray diffraction of dried N, S-CDs powder was via an X-ray diffractometer (D/max RAPID, Japan), and X-ray photoelectron spectra (XPS) were acquired on a photoelectron spectrometer (Thermo-VG Scientific Escalab 250XI, USA). The UV–Vis absorption was tested on a spectrophotometer (Hach DR6000, USA). Fluorescence spectra measurements were carried out on a fluorescence spectrometer (Edinburgh instruments FS5, UK) with the instrument settings as follows: λex = 350 nm (slit 5 nm), λem = 300–700 nm (slit 5 nm). The quantum yield was obtained by fluorescence spectrometer (Horiba Jobin Yvon, Nanolog FL3-2iHR, Paris, France), and fluorescence lifetime was measured by spectrofluorometer (Horiba Jobin Yvon, 77–500 K, Paris, France). An acid-base automatic titrator (Mettler Toledo T9, Zurich, Switzerland) was used to adjust pH values. TVB-N was determined by Kjeldahl nitrogen analyzer (Alva KN580, Jinan, China).

2.2. Reagents

Ammonia (NH3 w.t. 25%), sodium hydroxide, boric acid, malic acid, 0.01 mol/L standard hydrochloric acid solution, L-tryptophan and L-lysine were purchased from Shanghai Yuanye Biological Technology Co., Ltd. Shanghai, China; magnesium oxide, methyl red, methine blue, L-cysteine and ethylenedia-mine were purchased from Shanghai Macleans Biochemical Technology Co., Ltd. Hydrazine standard solution (1000 μg/mL in 1.0 mol/L HCl solution) was purchased from Aladdin Reagent Company. All above reagents are all analytically pure. Ultrapure water (≥18.25 MΩ cm) from a Milli-Q water purification system (Millipore) was used in all experiments.

2.3. Preparation of N, S-CDs

N, S-CDs were synthesized through hydrothermal treatment using ethylenediamine, L-cysteine and malic acid as raw materials [25]. Briefly, we prepared 0.02 mol/L and 0.01 mol/L malic acid and L-cysteine aqueous solutions respectively, and mixed them ultrasonically at a volume ratio of 1:1 for 5 min, then ultra-sonicated for 30 min with added 2 mL of ethylenediamine. Then the solution was placed in an oil bath at 150 °C to react for 12 h. We filtered the reaction solution by using a filtration membrane of 0.22 mm after it cooled to room temperature, then washed the supernatant with dichloromethane to remove the unreacted organic moieties. Finally, the supernatant was placed in a vacuum drying oven at 60 °C for 24 h to obtain the yellow powder product, which was N, S-CDs.

2.4. Detection of Ammonia

In order to investigate the influence of pH on the fluorescence intensity of N, S-CDs, 100 μg/mL N, S-CDs solution was adjusted to different pH using an acid-base automatic titrator with the reagents of 0.1 mol/L HCl and 0.1 mol/L NaOH. The fluorescence spectra of N, S-CDs with different pH values were recorded by fluorescence spectrometer (λex = 350 nm).
Different concentrations of ammonia (100 μL) were added into the N, S-CDs solution (1000 μL) and the fluorescence spectra were recorded (λex = 350 nm) after incubating for 3 min at room temperature. The calibration curve was plotted between the values of the fluorescence intensity at the emission peak of 445 nm and the concentrations of ammonia.
In order to investigate the stability of N, S-CDs, the fluorescence intensity was recorded under ultraviolet light every hour for 7 h and under sunlight every day for 7 days at room temperature.
For investigating the selectivity of N, S-CDs, different metal ions including Ag+, Hg2+, Al3+, Co2+, Mn2+, Ba2+, K+, Na+ and several volatile organic compounds (VOC) including dimethylamine (DMA), trimethylamine (TMA), acetic acid, ethanol (20 mmol/L for each) and hydrazine (100 μg/mL) were added into the N, S-CDs solution, respectively. The fluorescence intensity was recorded respectively. In addition, the interference of L-tryptophan and L-lysine on the fluorescence of N, S-CDs was investigated.
Reversibility of N, S-CDs for ammonia detection was also investigated by adding ammonia (20 mmol/L, 10 μL) and HCl (0.1 mol/L, 2μL) into N, S-CDs solution with four cycles and the fluorescence intensity was recorded.
In addition, the real water samples and fish samples were measured in order to investigate the practicality of the method. The aquaculture water samples were obtained from the rainbow trout experimental pond of Beijing Agricultural Information Technology Research Center and the river water samples were obtained from Jingmi Diversion Canal (Haidian, Beijing).
Fresh bighead carps were purchased from the Hangtianqiao Market in Beijing, China. We cut the bighead carps at the dorsal fin and reserved the heads of samples, then evisceration and cleaned them. Each sample was about 0.8 kg. N, S-CDs solutions (100 μg/mL, pH = 3) were placed in a sealed box together with head samples and stored at room temperature of 25 °C. The fluorescence spectra of N, S-CDs were detected at 0 h, 8 h, 16 h and 24 h, respectively (λex = 350 nm). Correspondingly, TVB-N contents of head samples were measured by the Kjeldahl method [26] at 0 h, 8 h, 16 h and 24 h.

3. Results and Discussion

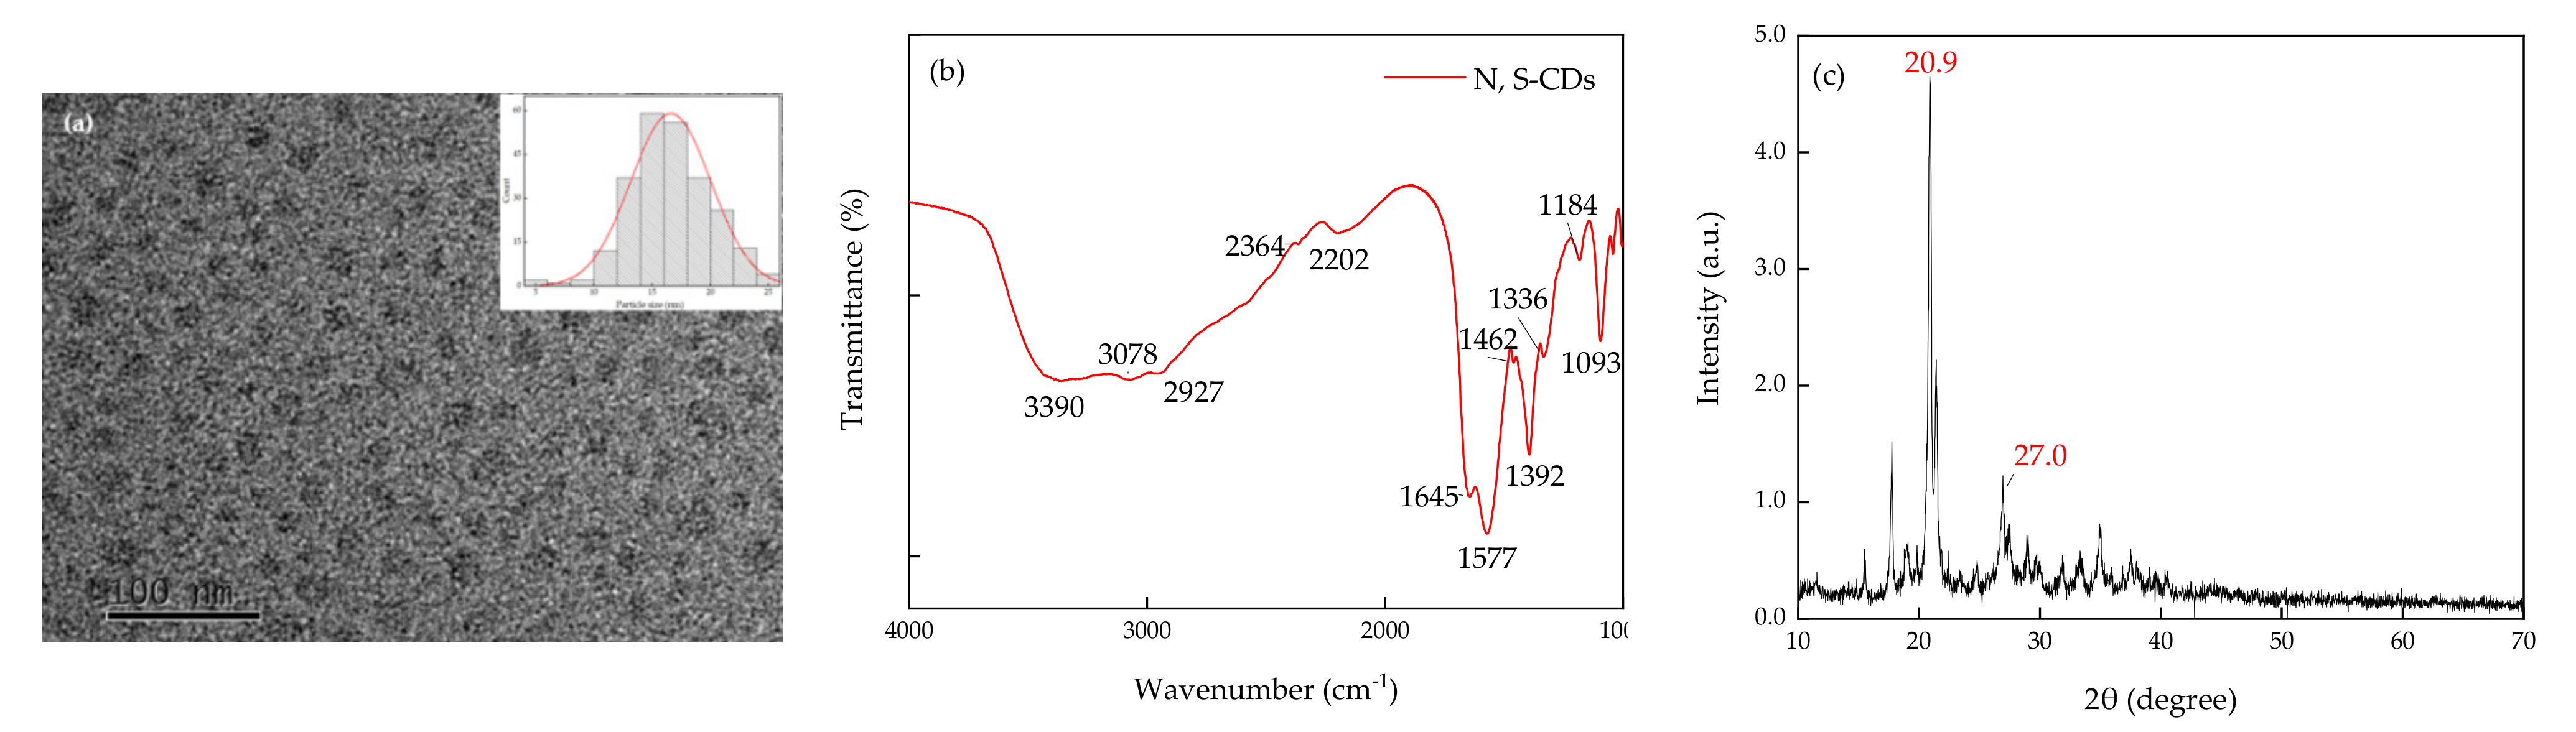
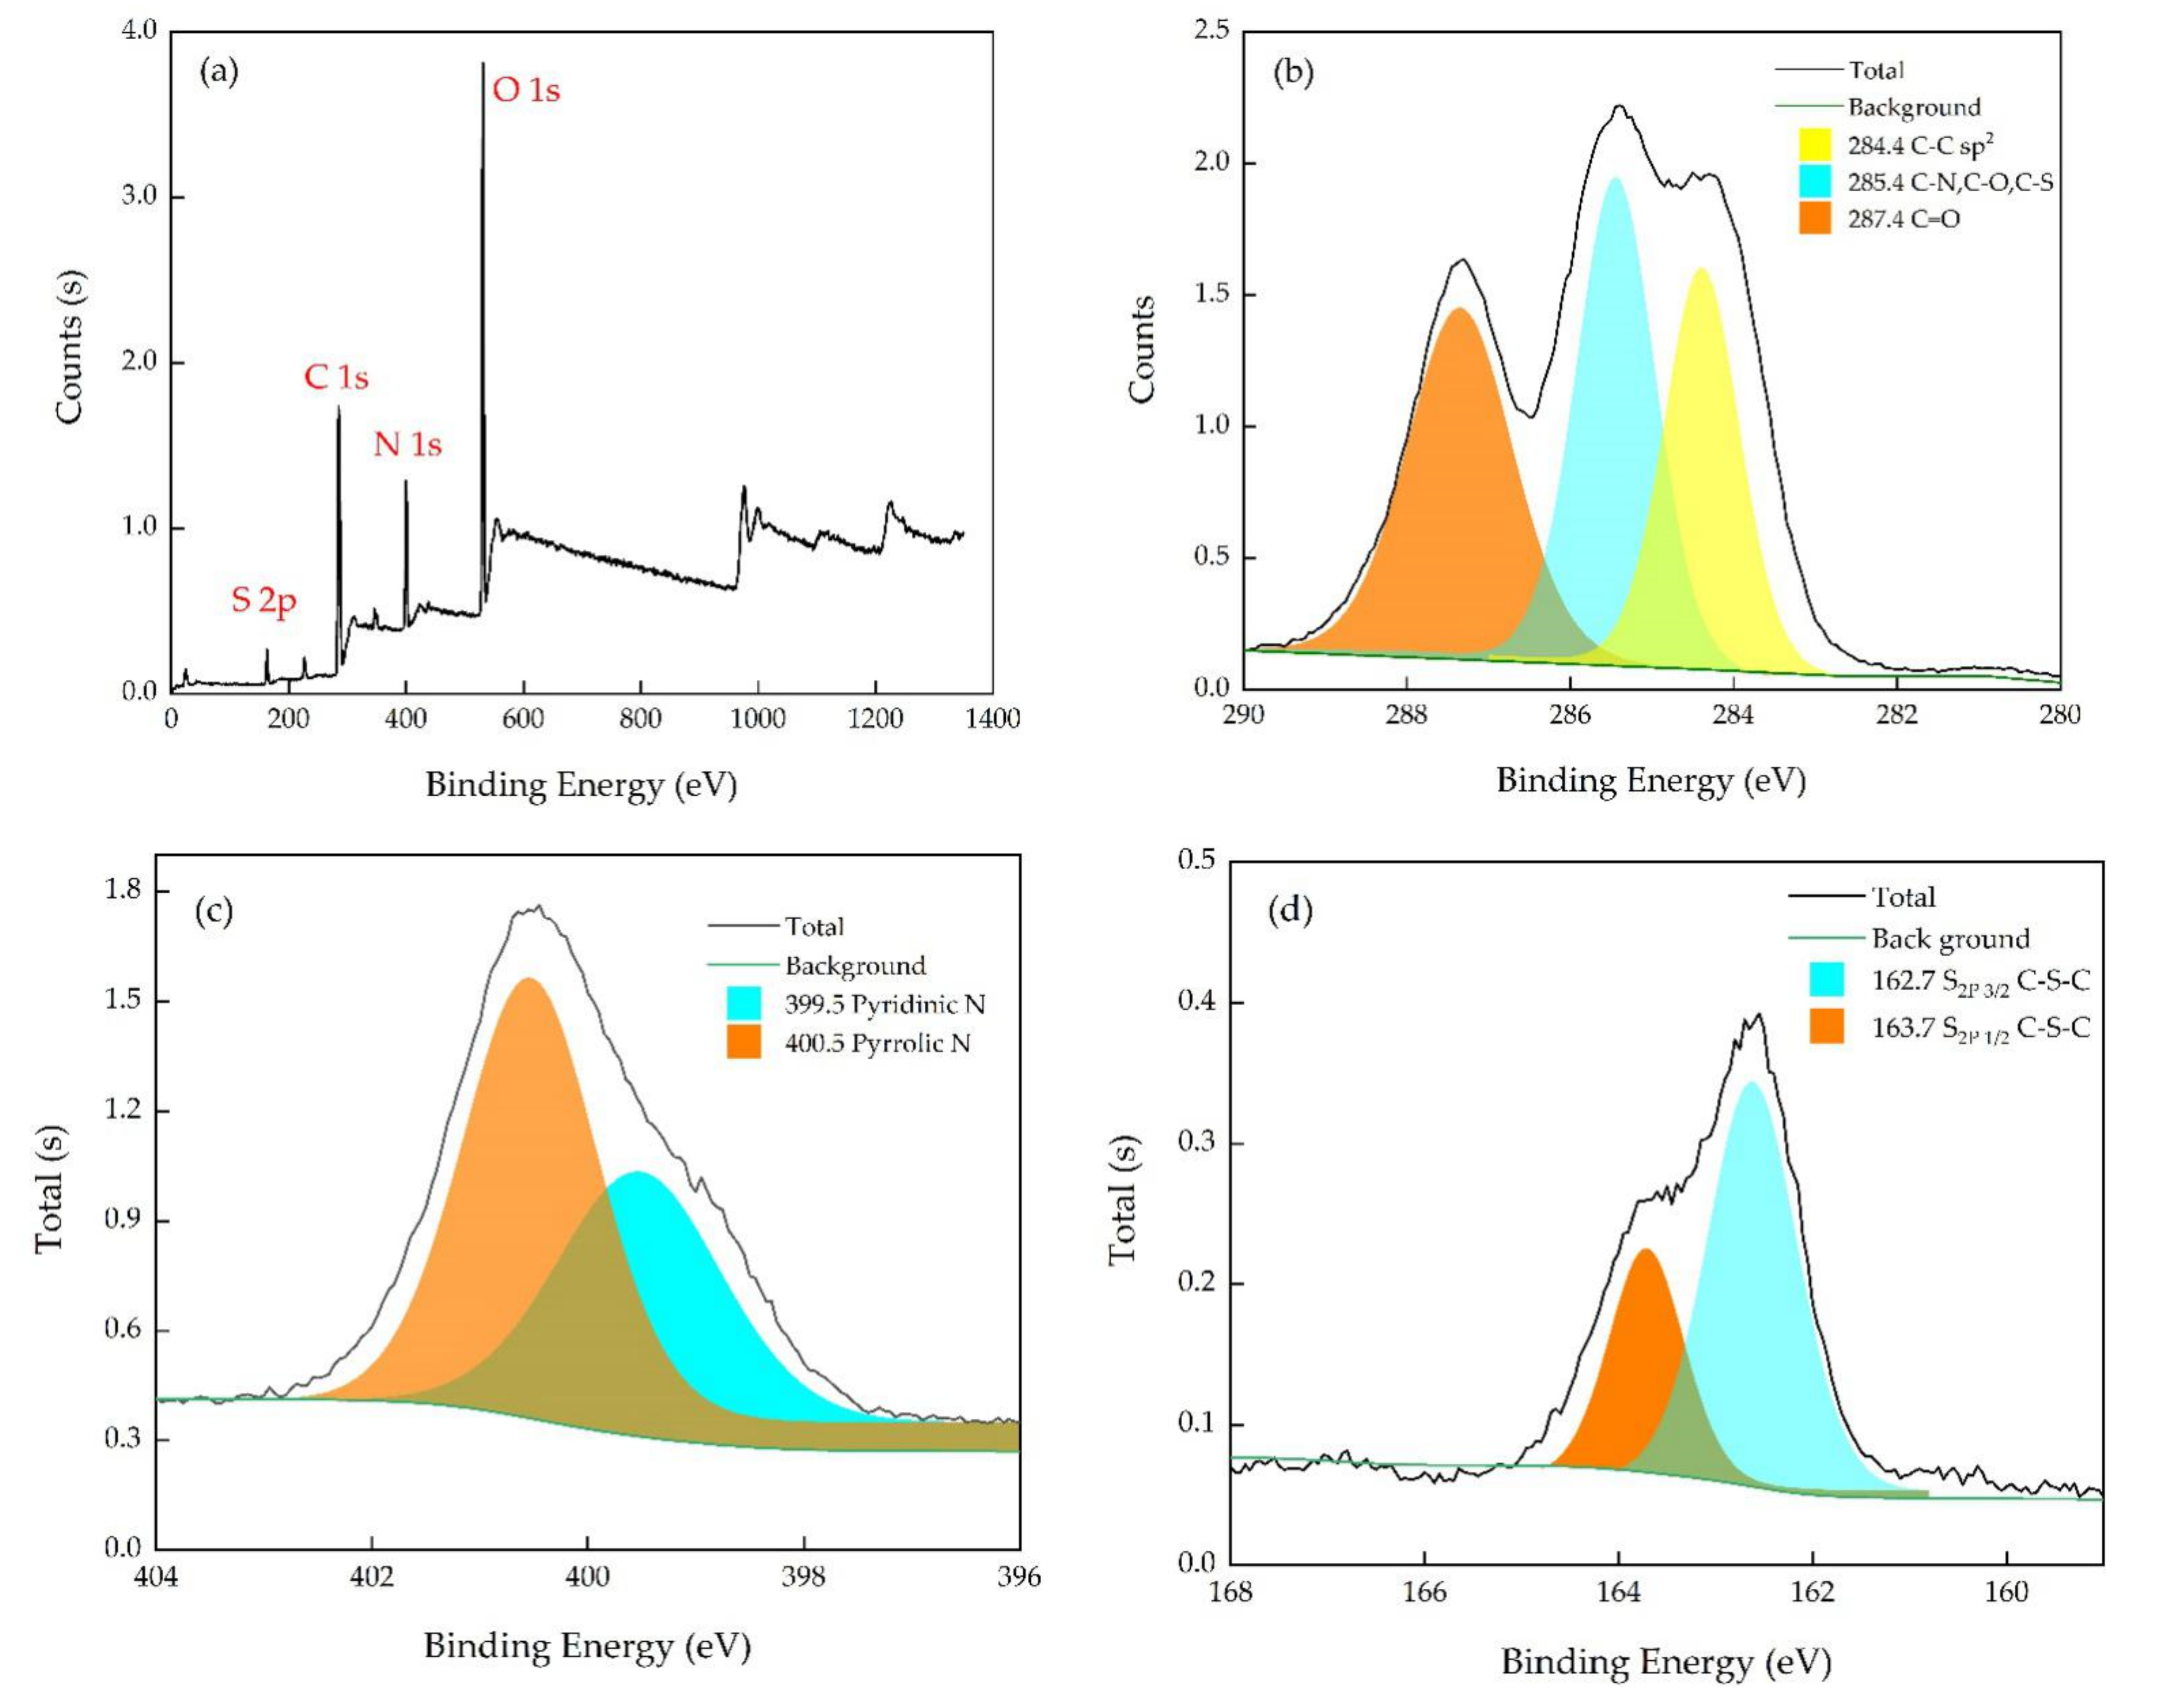
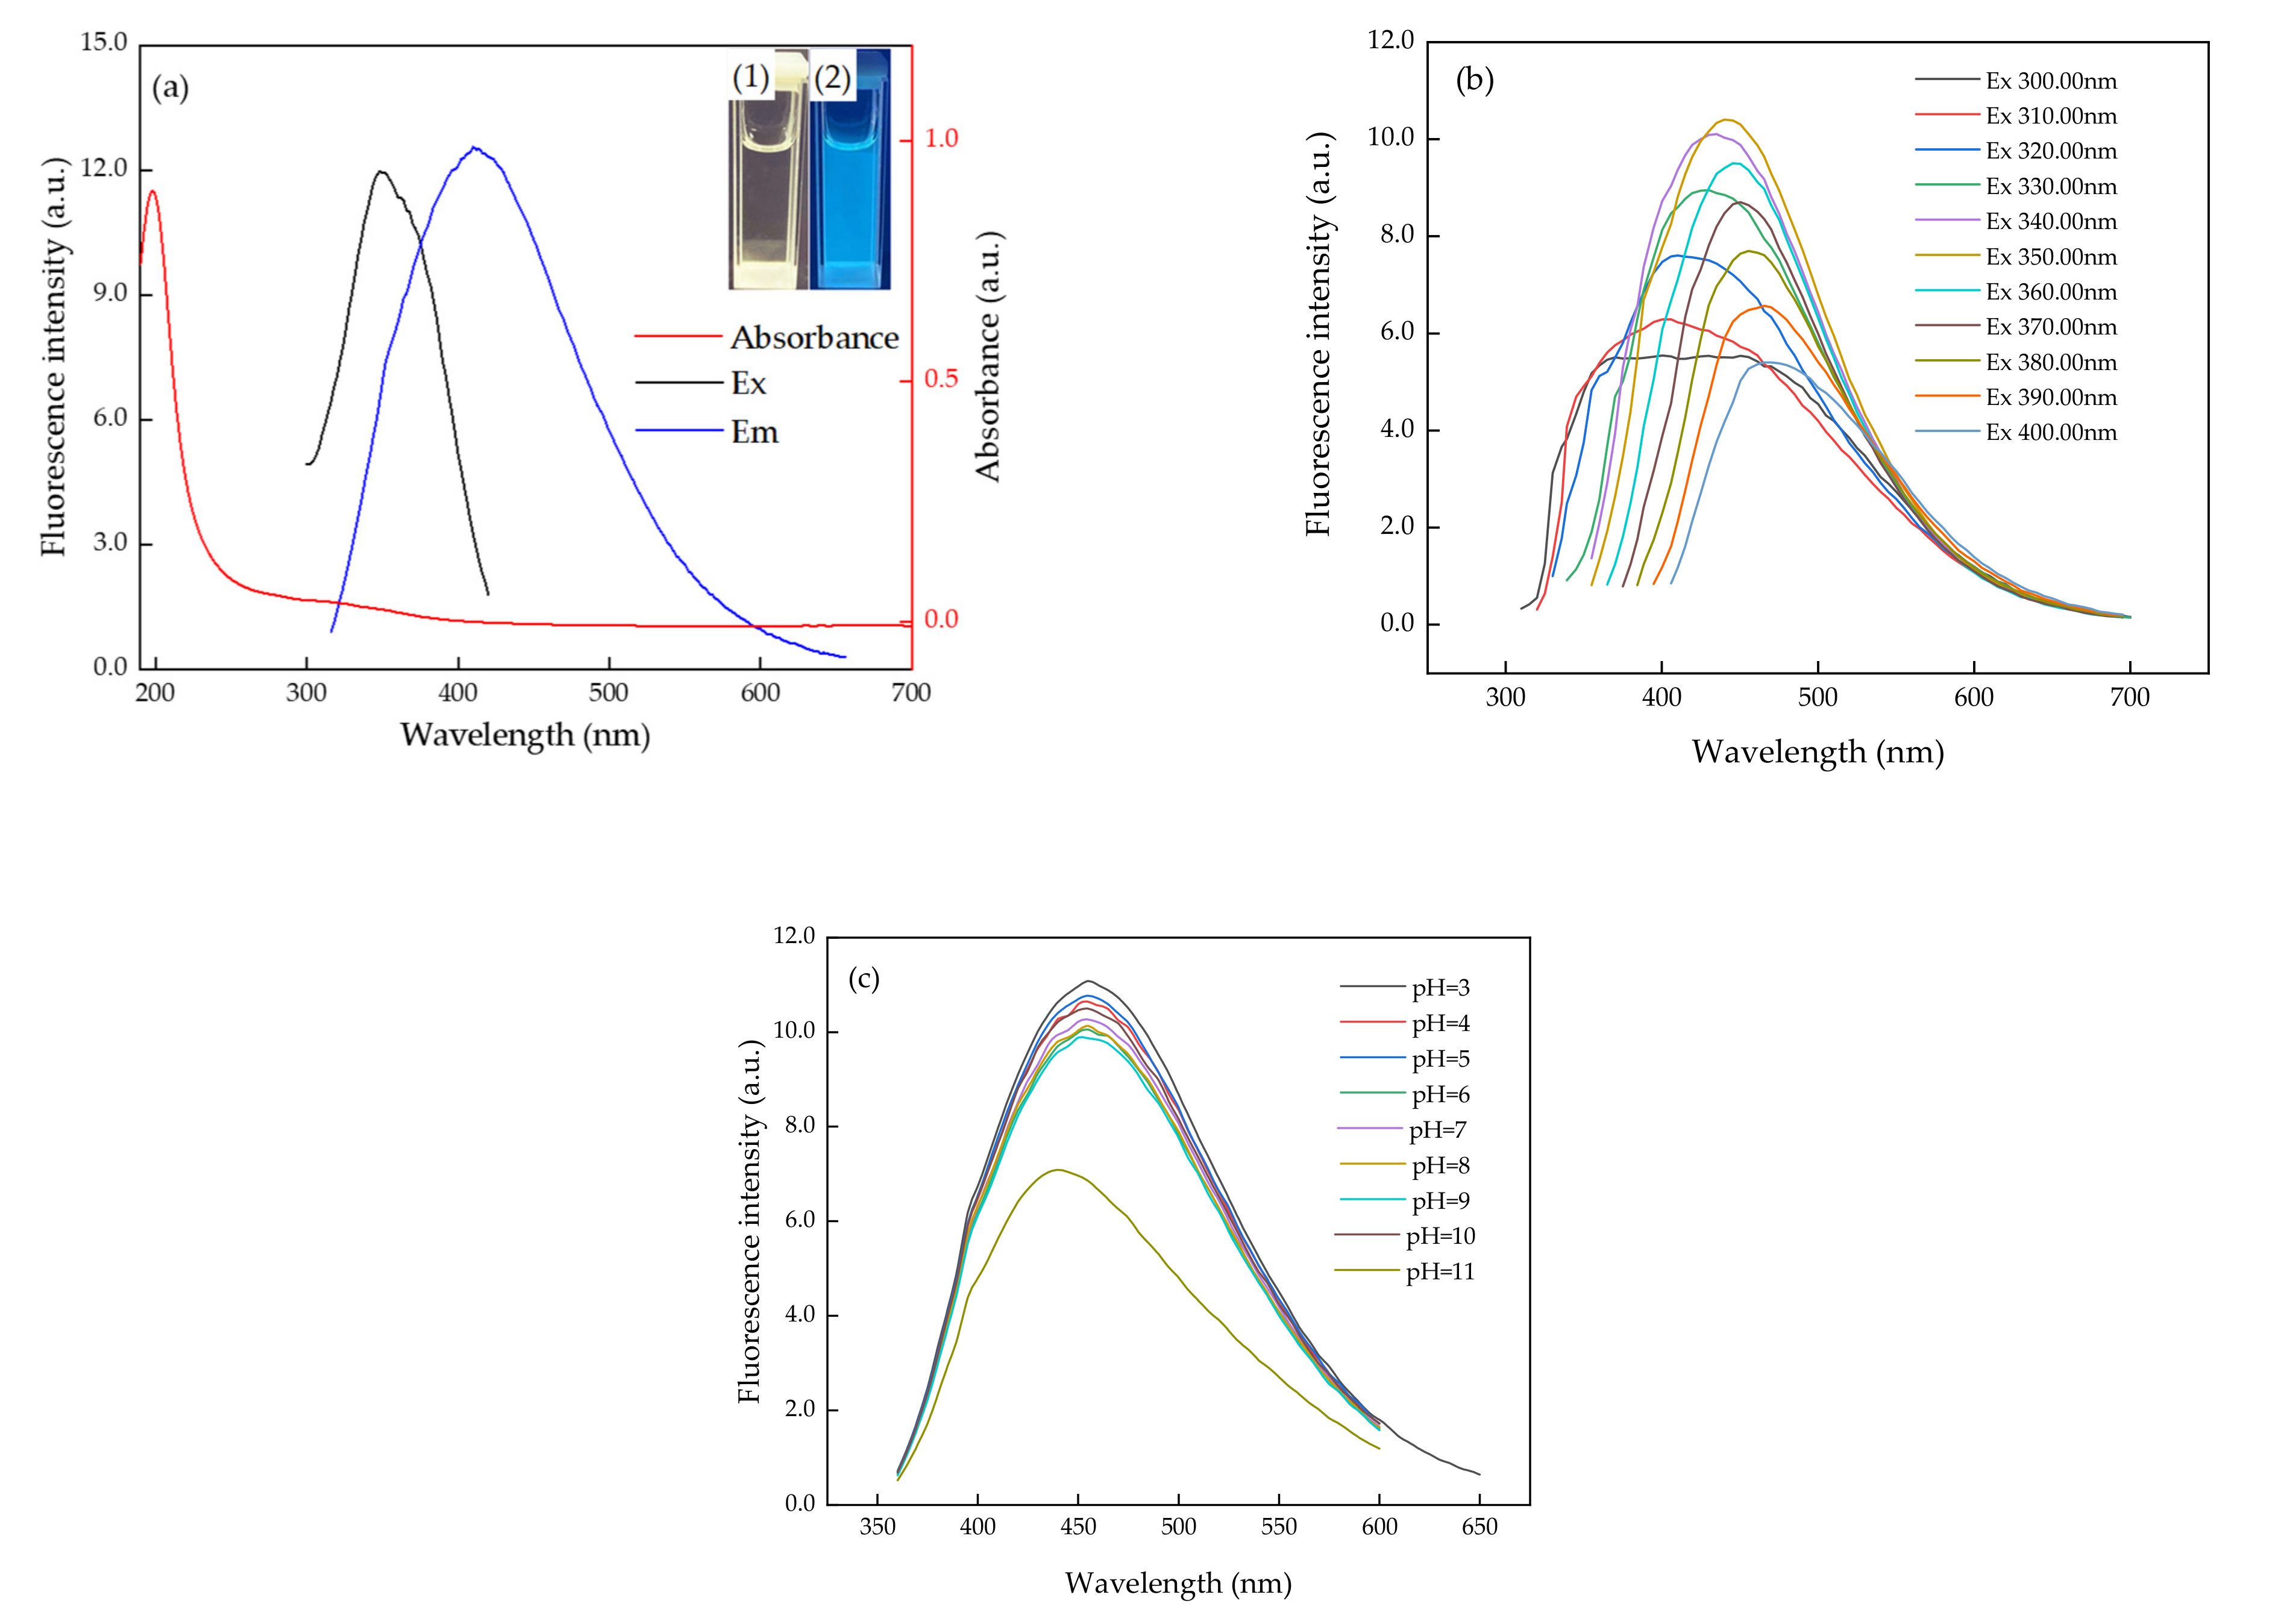
3.1. Characterization of Morphology and Optical Properties of N, S-CDs

The TEM image is shown in Figure 1a. N, S-CDs were uniformly dispersed in the aqueous solution, with a spherical shape and uniform particle size. As shown in Figure 1a, the average particle size was about 14.0 nm.
The FTIR spectrum in the wavenumber of 4000 to 1000 cm−1 was recorded in order to confirm the surface functional groups of the N, S-CDs. As shown in Figure 1b, there were several obvious characteristic absorption bands at 3390, 3077, 2927, 2202, 1645 and 1577 cm−1; they corresponded to O–H/N–H, N–H, C–H, C = N, C = O and C–H stretching vibrations, respectively [21]. The band in the range of 1462–1392 cm−1 was related to the stretching vibrations of C−N/S = O, while the characteristic bands at 1093, 1043 and 1001 cm−1 were related to O = S = O stretching vibration [20]. FTIR spectra indicated that N and S were successfully doped into carbon dots.
The XRD spectrum is shown in Figure 1c. Peaks appearing at 20.9 and 27° are characteristic of lattice spacing of 0.21 nm of the plane of graphitic carbon (100) and the plane of 0.26 nm of graphitic carbon (020), respectively [27], which proved that the synthesized N, S-CDs have good crystallinity.
In addition, the functional groups and atomic content were characterized by XPS. N, S-CDs were mainly composed of four elements, C, O, N and S, with contents of 54.45%, 29.48%, 13.34% and 2.73%, respectively. As shown in Figure 2a, there can be seen four peaks at 531, 400, 285 and 163 eV, corresponding to O1s, N1s, C1s and S2p, respectively. Specifically, C1s spectrum (Figure 2b) showed three peaks at 284.4, 285.4 and 287.4, which correspond to C—C, sp2 C—O/C—N/C—S, and C = O groups, respectively [28]. In Figure 2c, it can be seen that N1s had two main peaks at 399.5 and 400.5 eV, corresponding to pyridine nitrogen and pyrrole nitrogen [21,25], which demonstrated the nitrogen was doped successfully in CDs. In addition, S2p showed two peaks at 162.6 and 163.7 eV, corresponding to S2p 3/2 C-S-C and S2p 1/2 C-S-C, demonstrating that sulfur was doped successfully in CDs [28]. The results of XPS spectra indicated that various functional groups were modified on the surface of N, S-CDs, such as –COOH, –OH, –NH2 and S = O, which was consistent with the FTIR results.
For investigating the optical characteristics, the UV–Vis spectrum and fluorescence spectrum were recorded. As shown in inset (1) and (2) of Figure 3a, N, S-CDs are light yellow in daylight and show blue fluorescence under ultraviolet light (360 nm). The UV–Vis spectrum of N, S-CDs showed an obvious band at 200 nm and a small shoulder band at 350 nm, which may be attributed to π-π* transition of the conjugated C=C bond and the n-π* transition of C=O, respectively [19]. N, S-CDs showed the strongest emission peak at 445 nm at the optimal excitation wavelength of 350 nm as shown in Figure 3b.
In order to further investigate the effect of the excitation wavelength of N, S-CDs on the emission spectra, the emission spectra were recorded in the excitation wavelength range of 300–400 nm. It can be seen from Figure 3b that the fluorescence intensity increased firstly and then decreased, and the emission peaks exhibited a significant red shift with the increasing of excitation wavelength from 300 nm to 400 nm. The phenomenon may be related to the size effect of N, S-CDs or the influence of the optical selection of surface emission traps [20], which caused emission spectra to be excitation-dependent. The quantum yield of N, S-CDs solids was 6.81% measured by a fluorescence spectrometer equipped with an integrating sphere.
The influence of pH on the fluorescence intensity of synthesized N, S-CDs was also studied via measuring the fluorescence spectra of N, S-CDs solution at different pH values of 3–11. As shown in Figure 3c, the emission intensity of N, S-CDs was higher and decreased slowly as the pH value increased from 3 to 10, while the emission intensity decreased significantly at pH = 11. The significantly decreased fluorescence at pH 11.0 may be caused by aggregation-induced quenching. It can be seen from Figure S2 that when pH increased, CDs were aggregated. At pH 6.0, the aggregation was not obvious; the particle size of the CDs increased a little compared with at pH 3.0, while at pH 11.0, N, S-CDs were significantly agglomerated, as shown in the TEM picture in Figure S2c, and the particle size also significantly increased, which was consistent with the change in the fluorescence intensity of N, S-CDs at different pHs. Studies [19] have shown that aggregation can cause fluorescence quenching. Therefore, aggregation may be the main reason of fluorescence quenching at pH = 11.

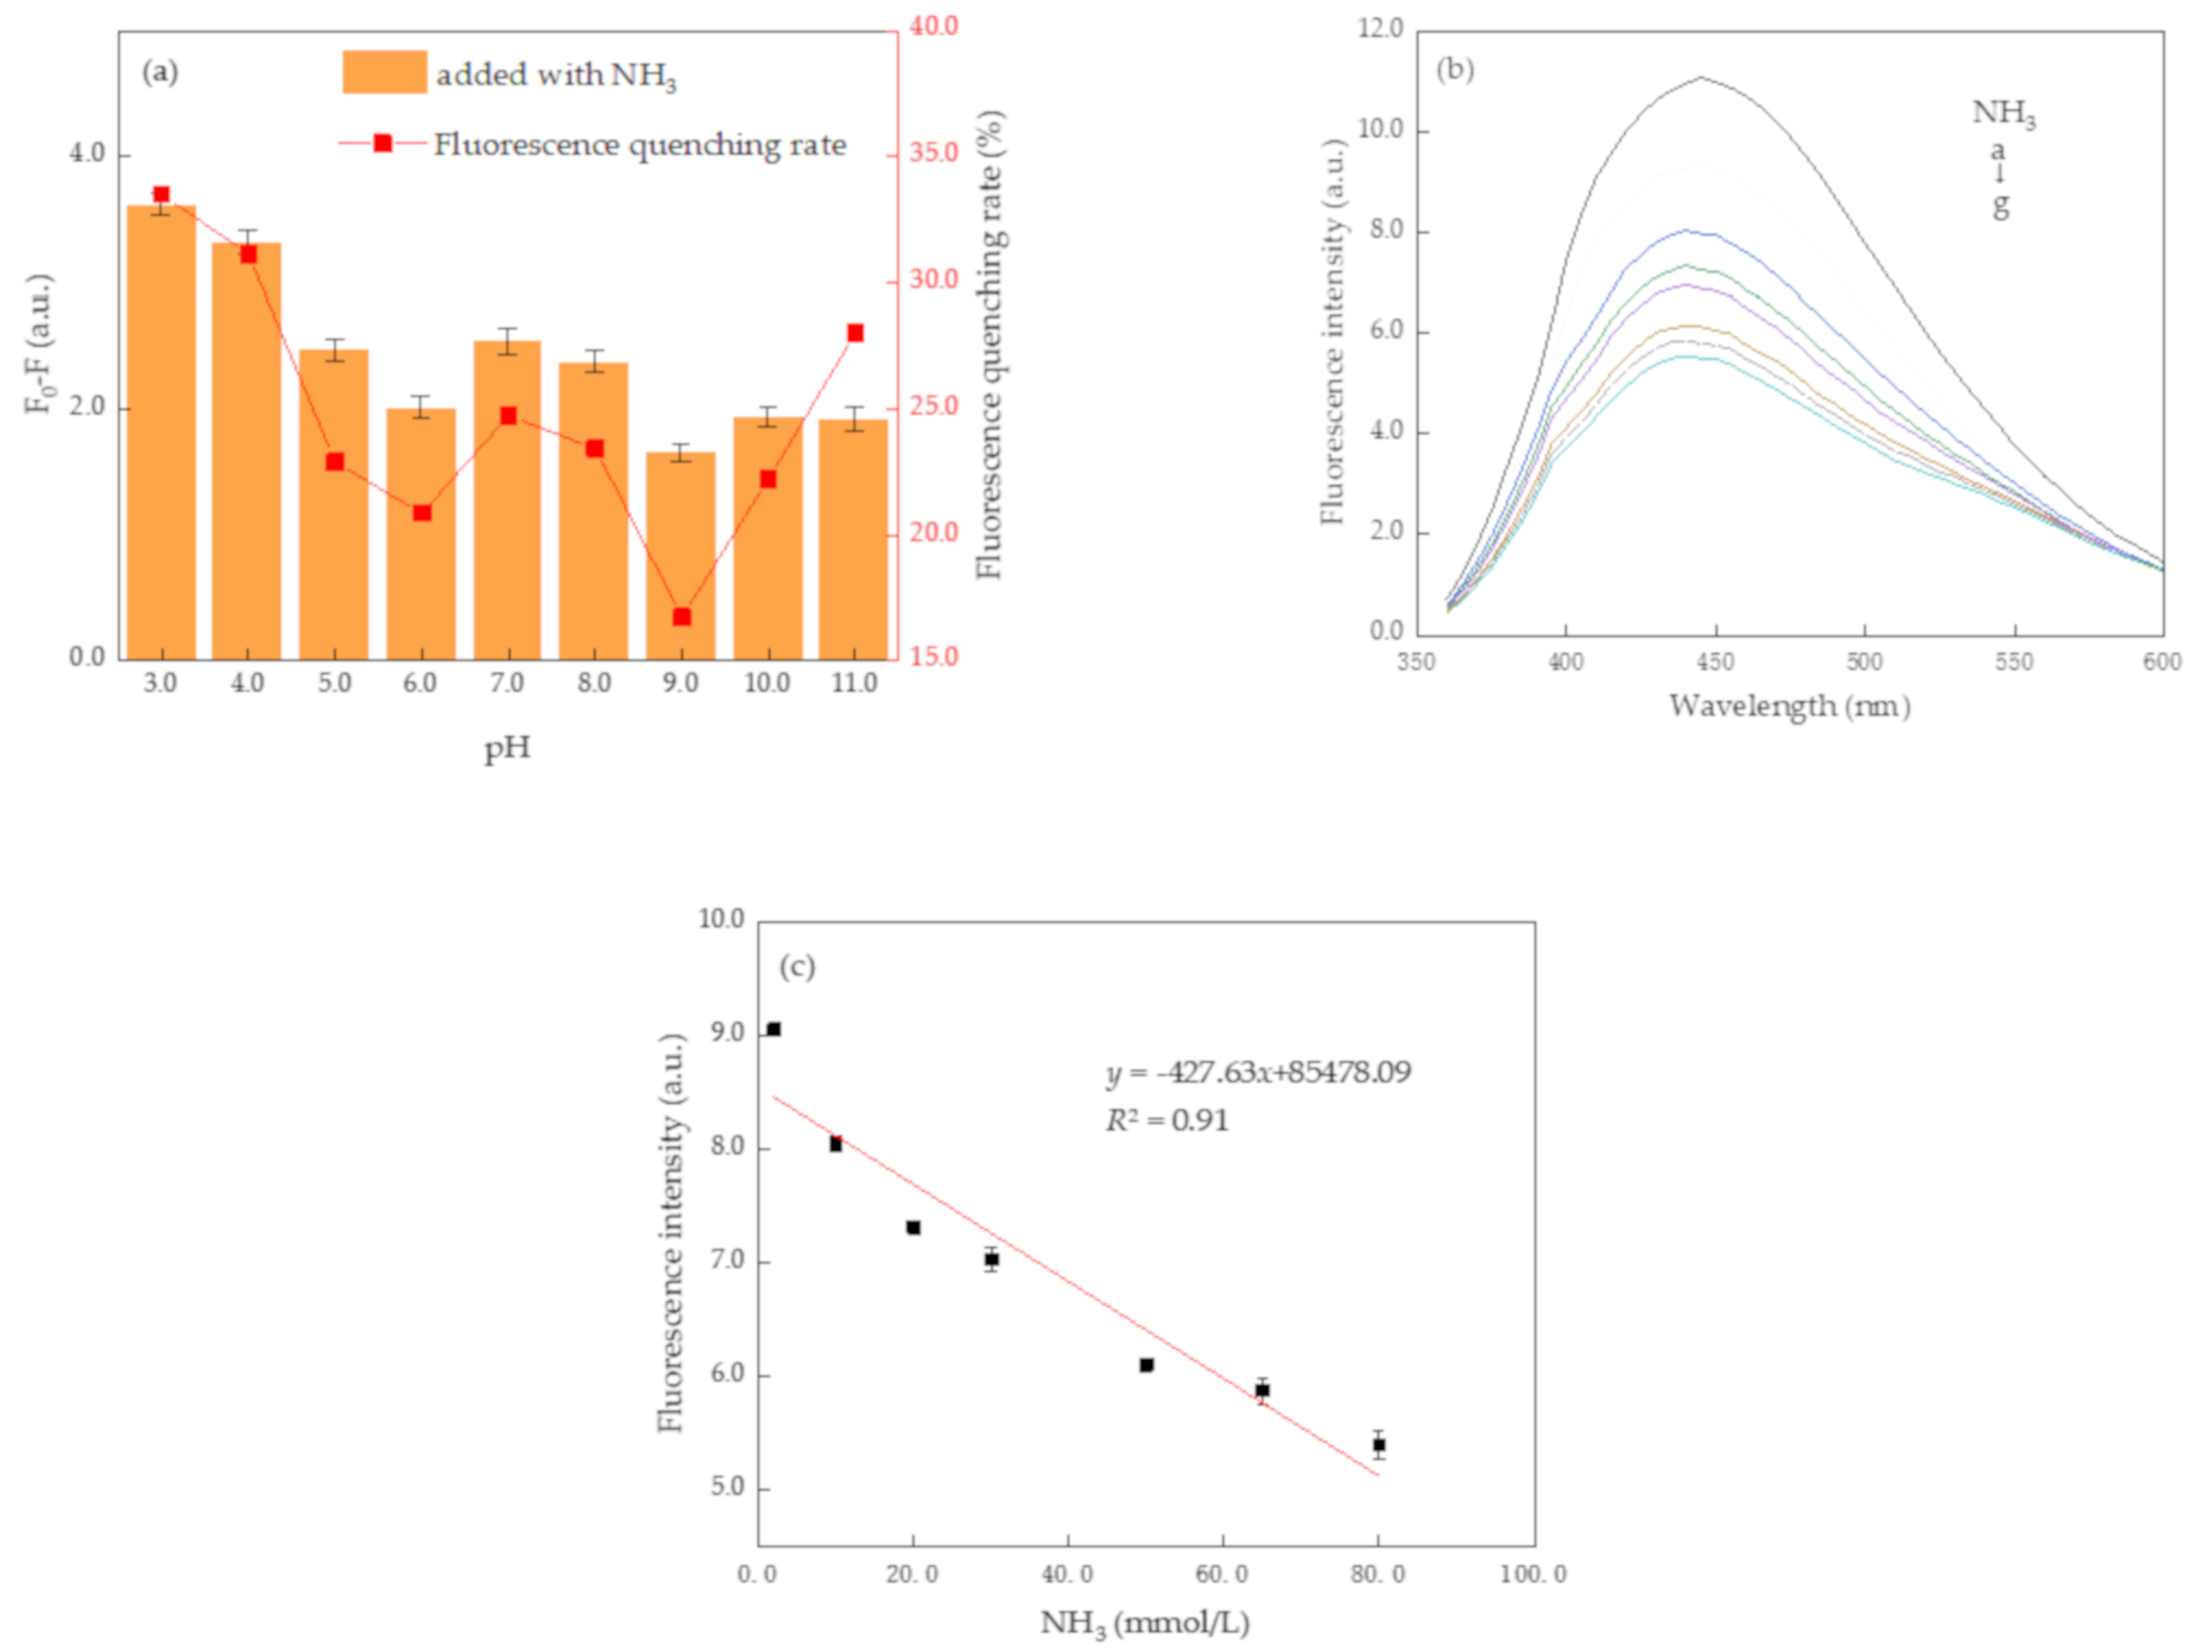
3.2. Detection of NH3 Based on N, S-CDs

The fluorescence changes of N, S-CDs added to ammonia at pH 3–11 were studied. N, S-CDs exhibited the highest emission intensity (Figure 3c) and the fluorescence quenching was the most obvious at pH = 3 (Figure 4a); therefore, the pH value of 3 was used as the optimal condition for detecting NH3.
The response performance to ammonia based on the N, S-CD solution was studied by investigating the dependence of the emission intensity on the concentration of the ammonia (incubating 3 min). It can be seen from Figure 4b that the emission intensity of N, S-CDs decreased with the increasing concentration of ammonia, which illustrated that N, S-CDs have a good response to ammonia. In the presence of ammonia at the concentration of 2 mmol/L, the emission intensity of N, S-CDs was quenched by about 15.7%, and the maximum fluorescence quenching was 50.3% at the concentration of 80 mmol/L. The calibration curve is shown in Figure 4c, and at the emission peak of 455 nm, the fluorescence intensity exhibited a good linearity with response to different concentrations of ammonia in the range of 2–80 mmol/L, and the correlation coefficient R2 was 0.91. The detection limit of ammonia was 0.005 mmol/L (0.034 mg/L) calculated by the 3σ rule [29], which is lower than the concentration of ammonia (0.05 mg/L for cyprinids, 3–4 mg/L for carps and tilapias) recommended for aquaculture water by the Food and Agriculture Organization (FAO) [30,31].
The experimental results showed that N, S-CDs synthesized in this research can realize rapid detection of ammonia. Compared with the methods that have been reported for ammonia detection based on CDs [18,19,20], the N, S-CDs fluorescent probes in this article have a larger detection range, which can be used not only for the detection of ammonia in aquaculture water, but also have potential application for ammonia detection in industry waste water.

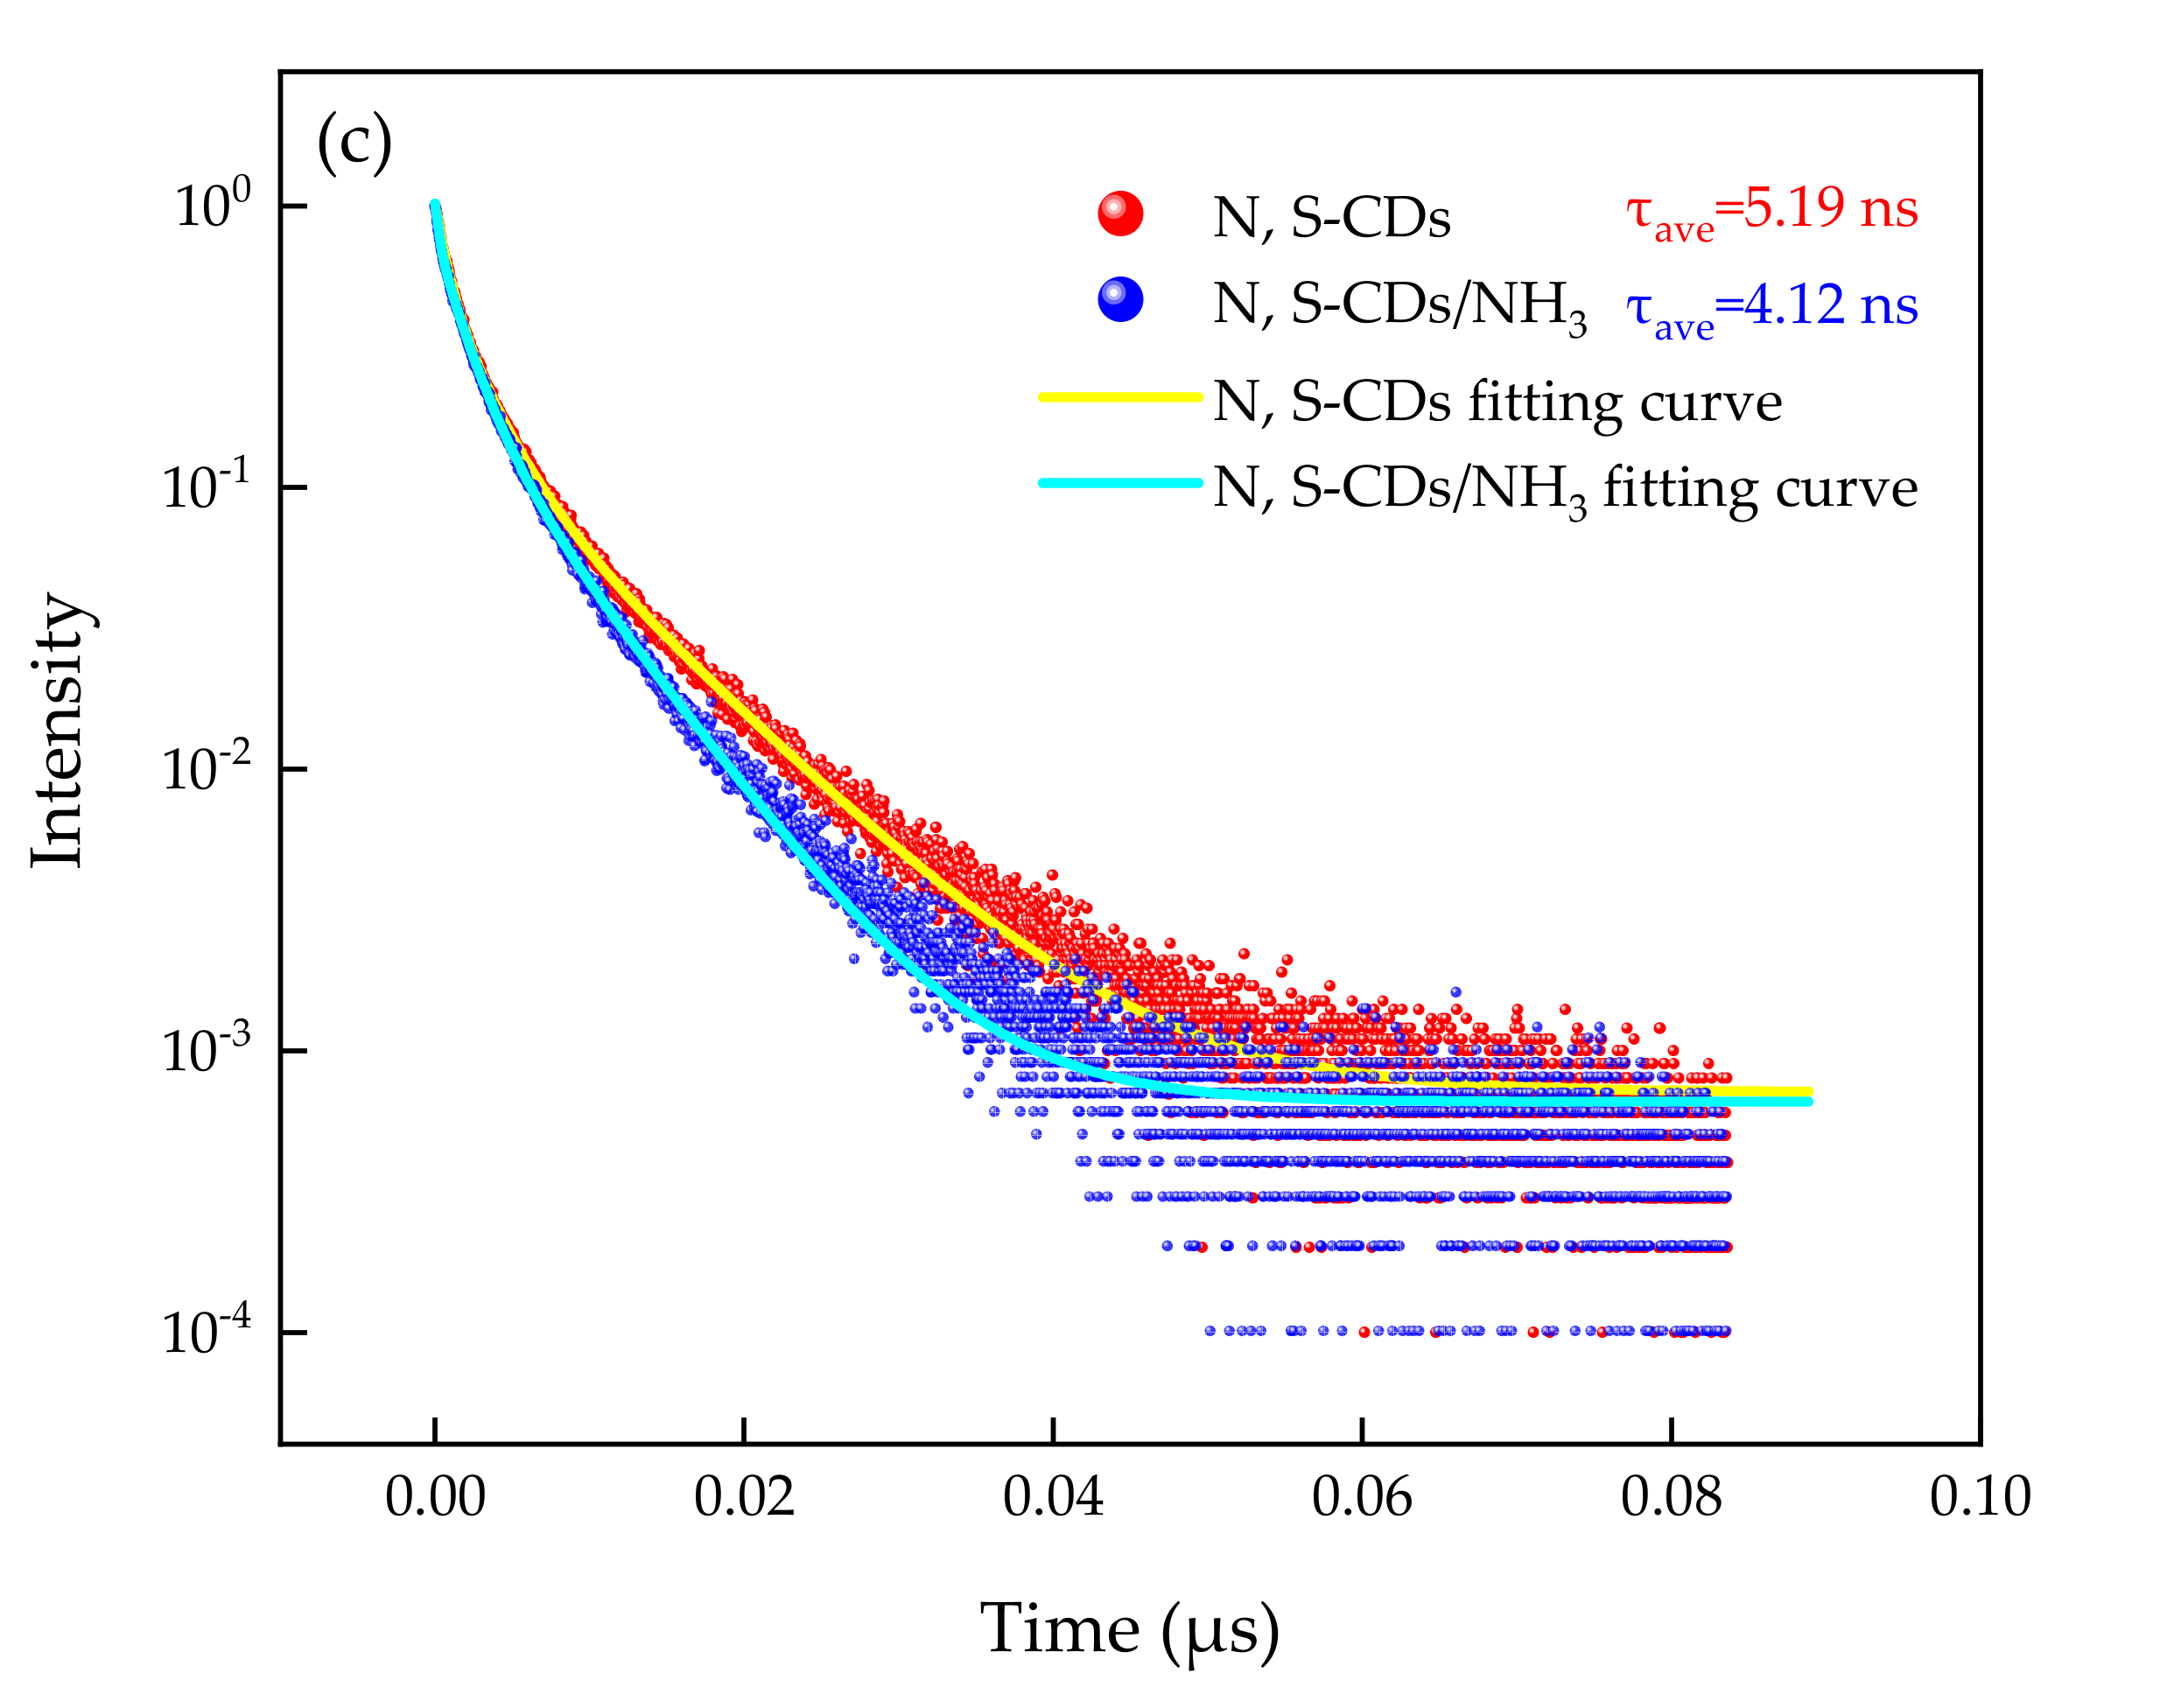
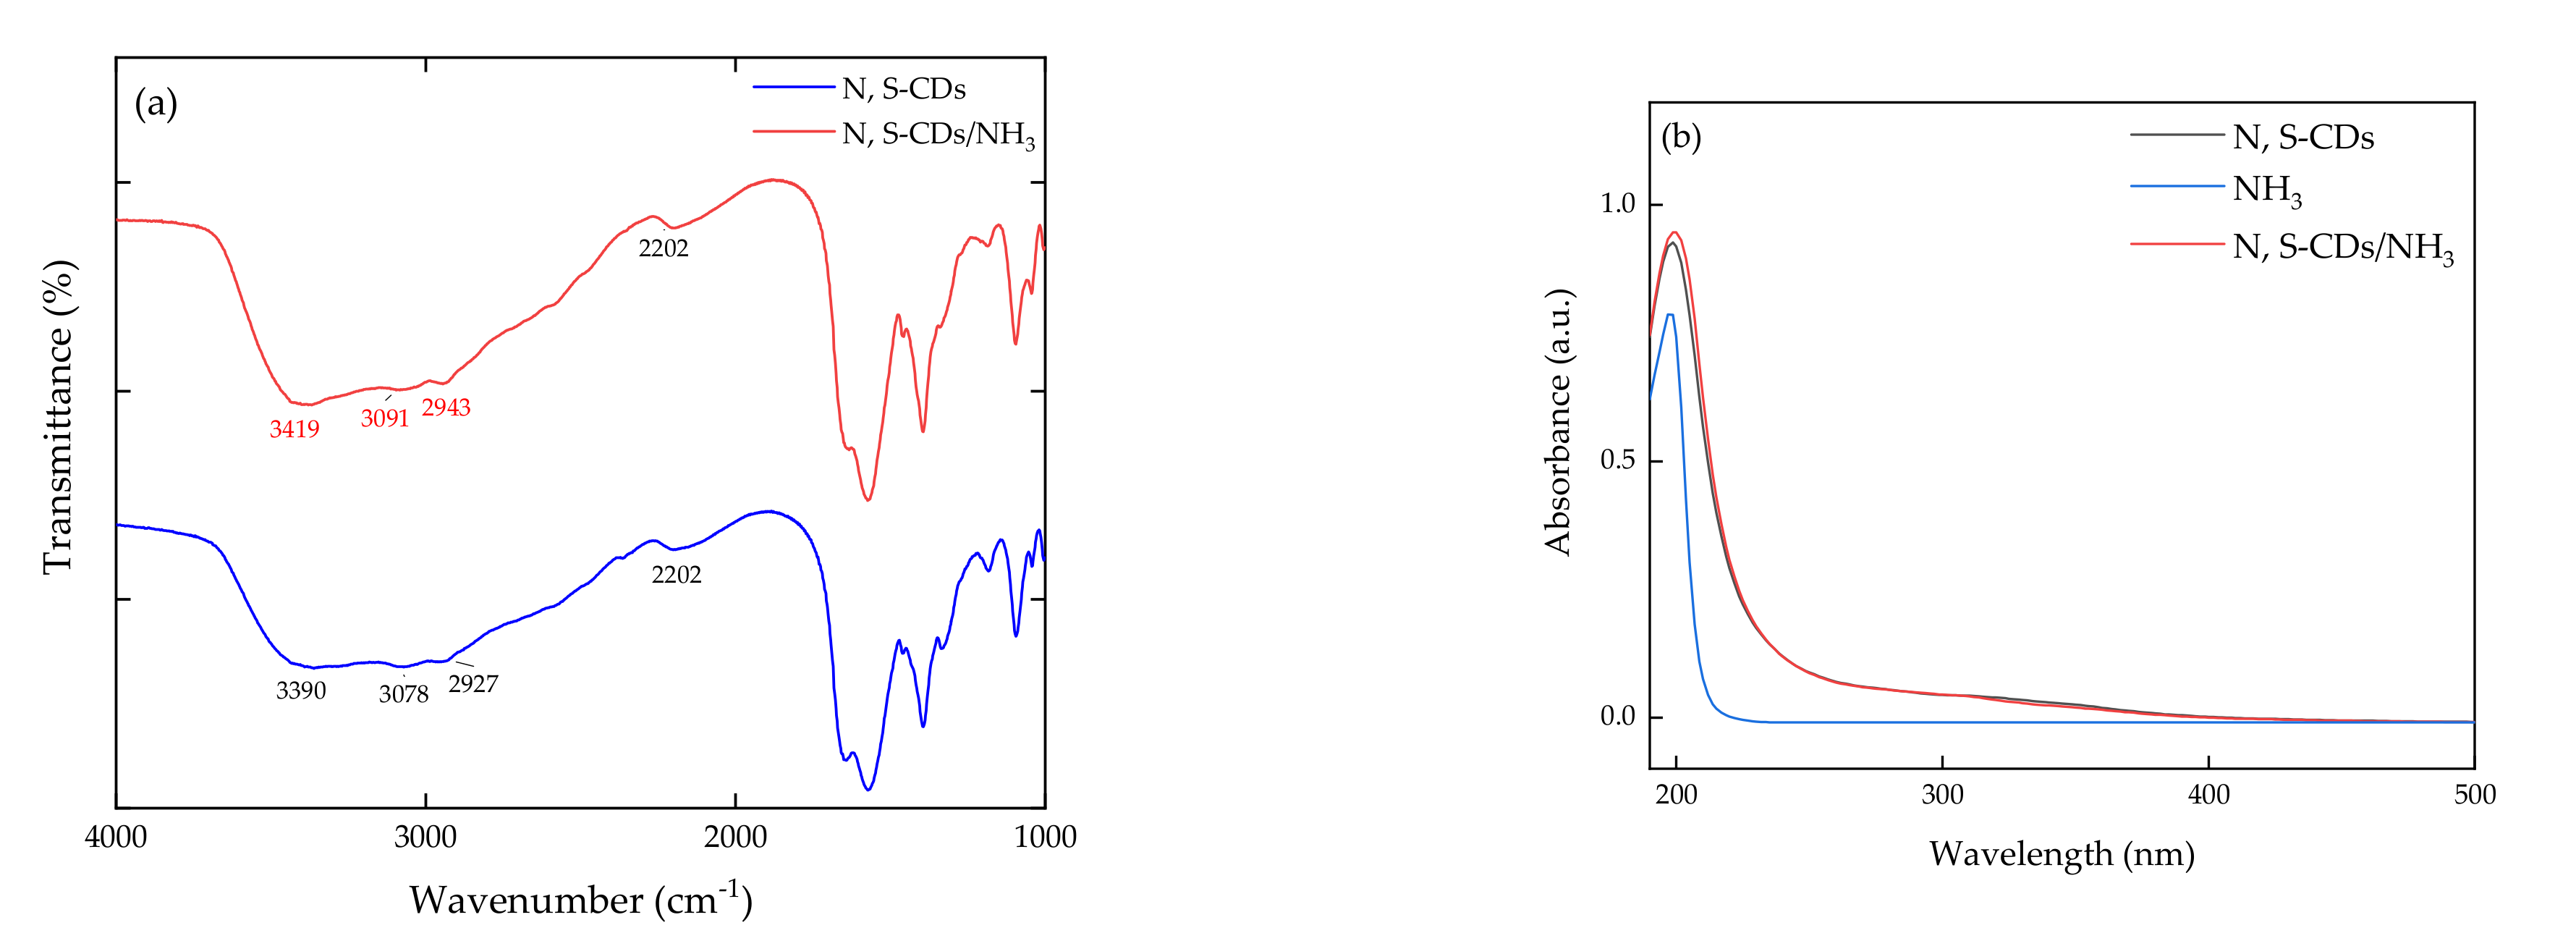
3.3. Sensing Mechanism

For studying the reactivity of N, S-CDs with ammonia, the FTIR spectra of N, S-CDs and N, S-CDs/NH3 powder were obtained. Because the N, S-CDs/NH3 solution may release NH3/NH4+ with drying, there were no obvious differences between the FTIR spectra of N, S-CDs and N, S-CDs/NH3. However, the FTIR spectra of N, S-CDs/NH3 had obvious blue shifts at 3390, 3077 and 2927 cm−1, which may be caused by the electronic induction effect as shown in Figure 5a. In order to gain further insight into the reaction mechanism, UV–Vis spectra of N-CDs, ammonia solution and N, S-CDs/NH3 were measured, respectively. As shown in Figure 5b, UV–Vis spectra of N-CDs and N, S-CDs/NH3 were nearly unchanged, which indicated that N, S -CDs did not react with ammonia [24]. It can be concluded that the sensing mechanism was not static quenching. Furthermore, the fluorescence decay lifetime of N, S-CDs and N, S-CDs/NH3 were measured, respectively. As shown in Figure 5c, lifetimes of the N, S-CDs solution and N, S-CDs/NH3 showed a triexponential fit with an average lifetime of 5.19 ns and 4.12 ns, respectively. The time-resolved fluorescence results are list in Table 1. The fluorescence decay lifetime of N, S-CDs decreased in the presence of ammonia, showing static quenching and internal filtering effects cannot change the fluorescence decay lifetime, so the quenching mechanism between N, S-CDs and NH3 is dynamic quenching, which was in agreement with UV–Vis results.
Ammonia has the character of electron donating, and the functional groups of carboxyl and sulfonic acids on the surface of N, S-CDs have an electron-accepting nature. Therefore, ammonia was adsorbed on the surface of N, S-CDs and caused fluorescence quenching [20]. In addition, with the increase of ammonia, the pH of N, S-CDs gradually changed from 3 to 10. The changes of pH induced the aggregation of N, S-CDs as shown in Figure S1, which also decreased the fluorescence intensity. In summary, these two reasons worked together to cause the quenching of N, S-CDs’ fluorescence.

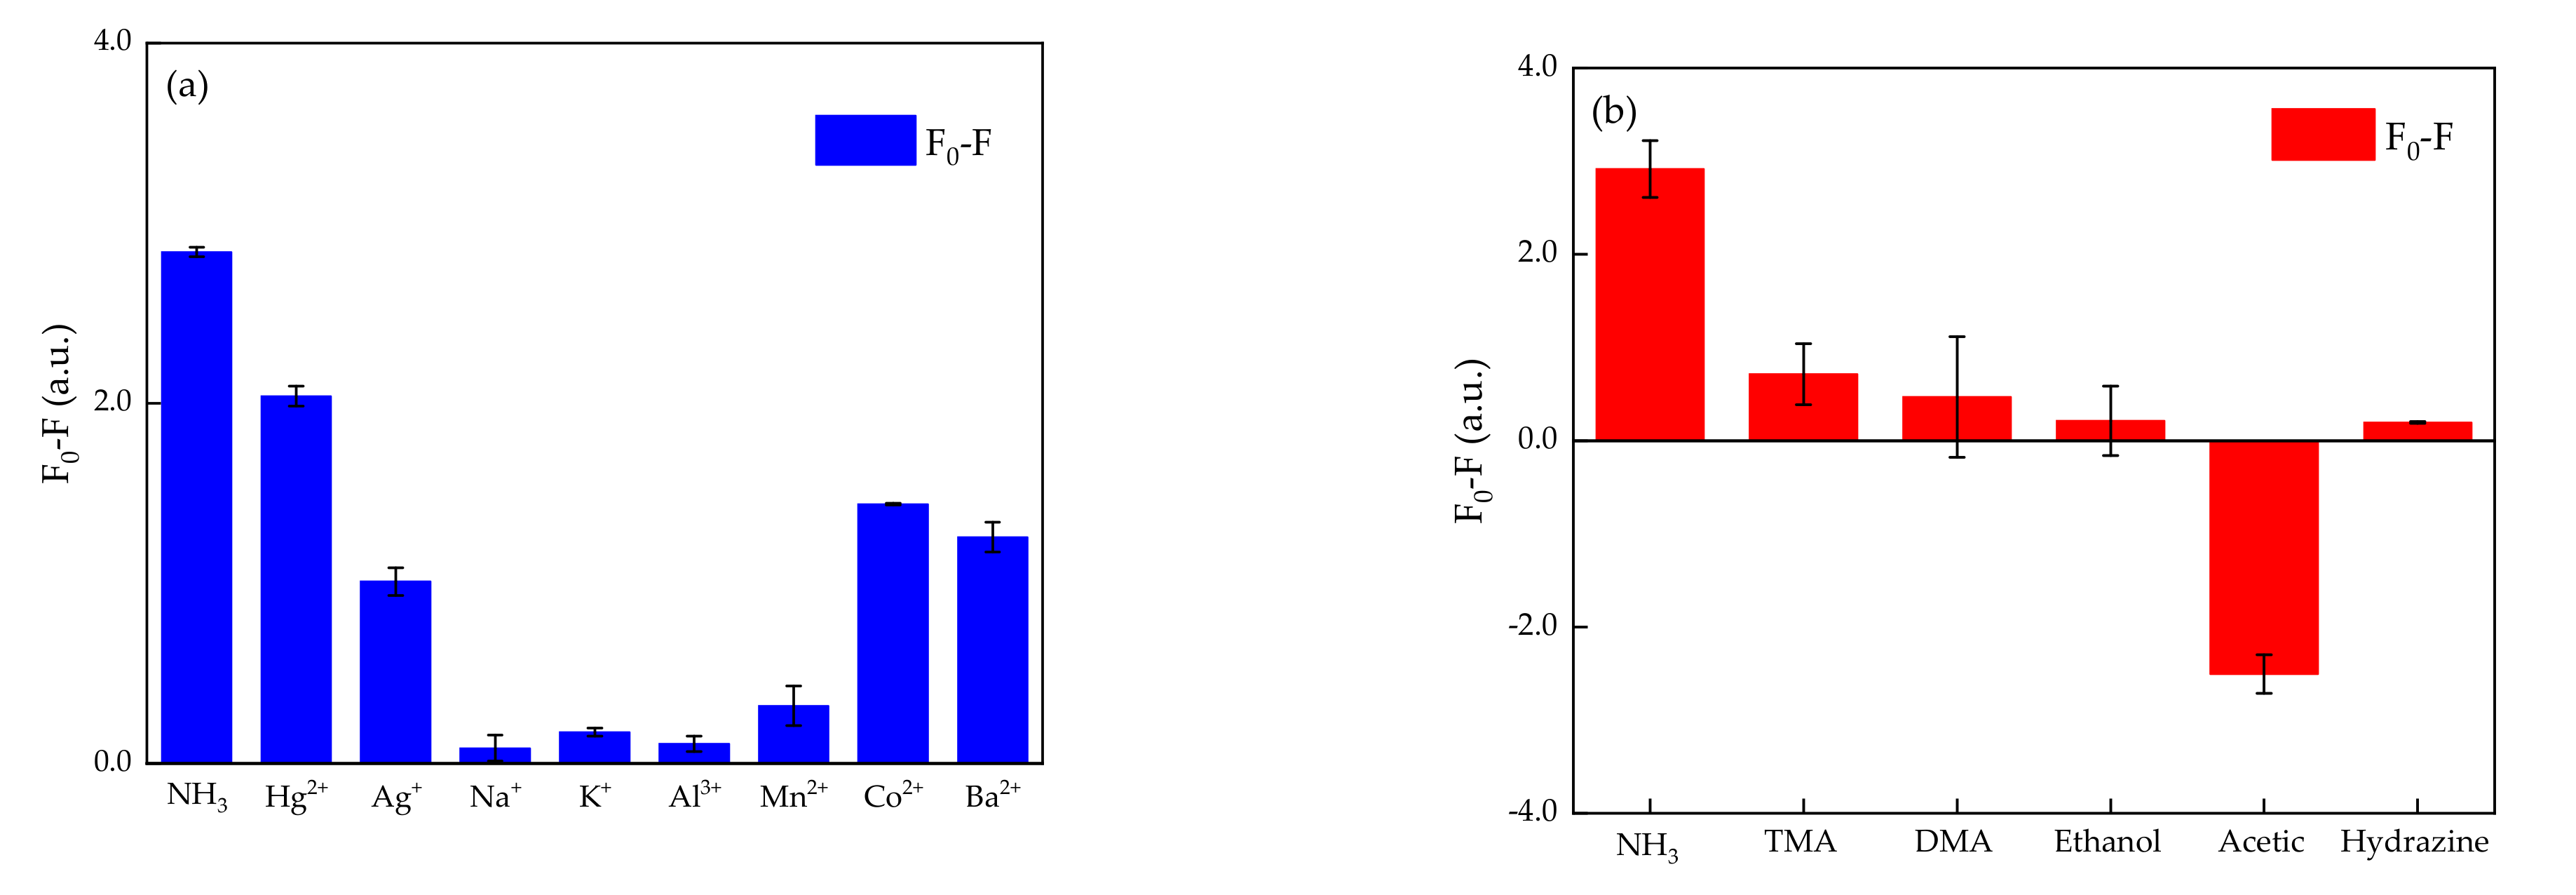
3.4. Selectivity of N, S-CDs

Considering sensors should be suitable for application in complex water environments, the interference of several common metal ions such as Ag+, Hg2+, K+, Na+, Al3+, Co2+, Mn2+, Ba2+ was studied. As shown in Figure 6a, the presence of Hg2+ can cause great interference in the detection of ammonia by using N, S-CDs. Hg2+ can quench the fluorescence by about 20% at a concentration of 20 mmol/L. In addition, the fluorescence intensity was also quenched by 12.3%, 11.3% and 9% by Co2+, Ba2+ and Ag+ at a concentration of 20 mmol/L, while it was quenched by 32.5% at a concentration of 20 mmol/L of ammonia. The fluorescence intensity remained nearly unchanged in the presence of the metal ions K+, Na+, Al3+ and Mn2+. The results demonstrated that N, S-CDs have a certain anti-interference ability against metal ions. Improving the anti-interference of N, S-CDs against metal ions such as Hg2+, Co2+, Ba2+ and Ag+ is one of the difficulties to be solved in the future.
TVB-N is an international general indicator that indicates the freshness of fish, and it is mainly composed of volatile amine gases such as NH3, TMA and DMA [32]. Therefore, the interference of several common volatile compounds in the spoilage of fish such as DMA, TMA, acetic acid and ethanol was studied. The results are shown in Figure 6b. There was almost no effect on the detection of ammonia by ethanol, while acetic acid can cause high measurement results; although volatile amine gases TMA and DMA quenched the fluorescence, this was very beneficial for the detection of fish freshness because they are the main ingredients that indicate freshness in the process of corruption of fish. In addition, the interference of hydrazine was studied.
The results of interference of metal ions and VOC indicated that our N, S-CDs are highly selective towards ammonia in gaseous and liquid form, which makes it possible to use N, S-CDs in ammonia detection of aquaculture water and fish freshness.

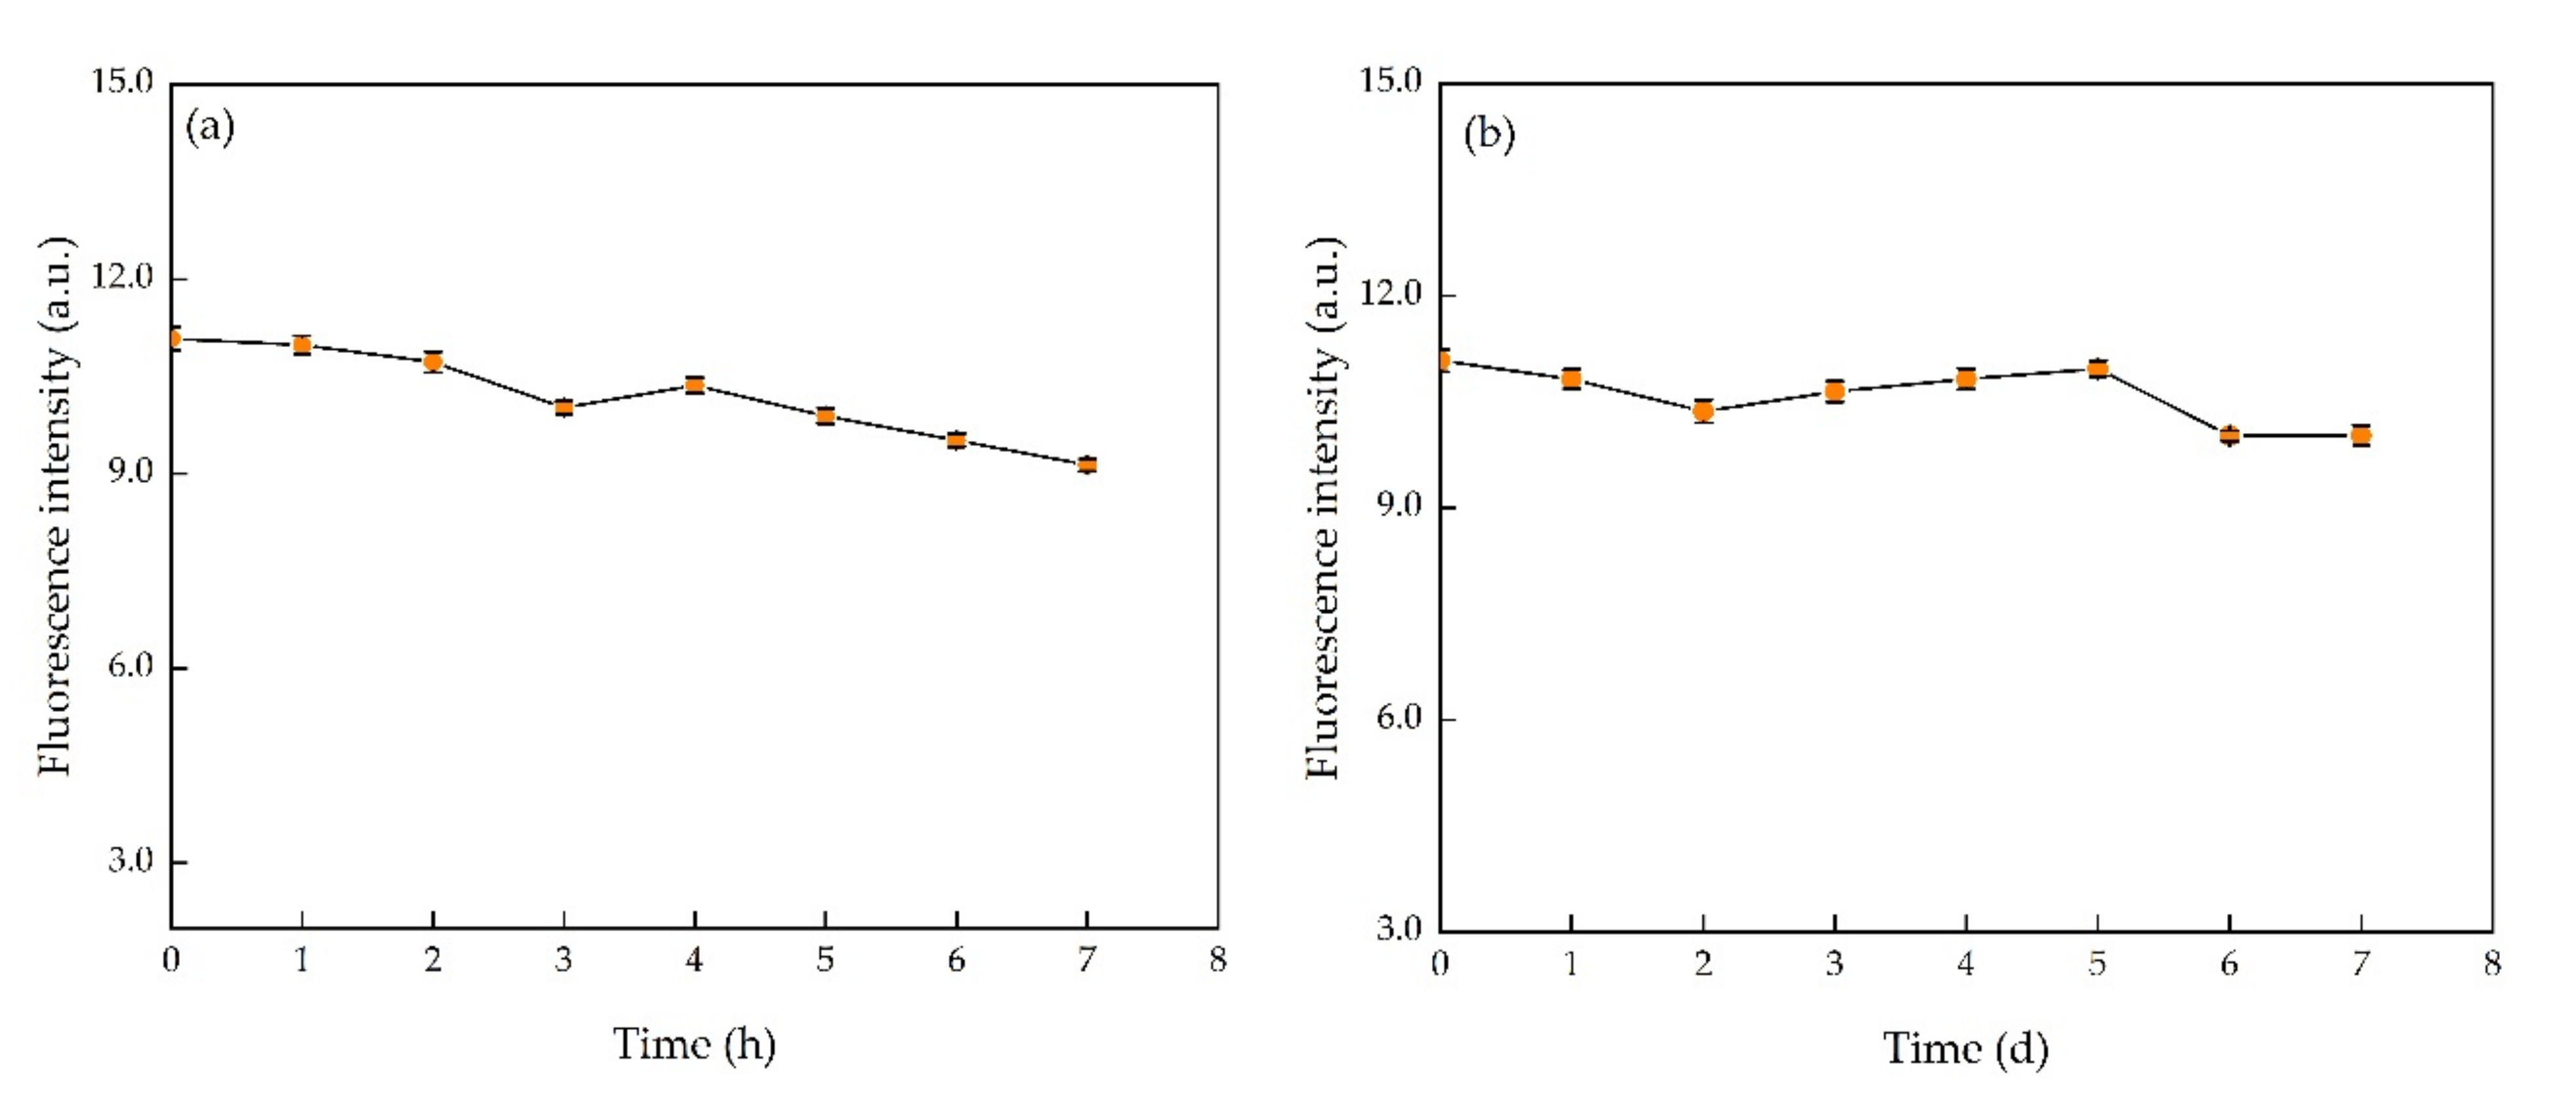
3.5. Stability of N, S-CDs

In practical applications, a sensor should also exhibit good stability. Thus, the photobleaching resistance and fluorescence stability of N, S-CDs were measured, and the results are shown in Figure 7. The fluorescence intensity of N, S-CDs at pH = 3 decreased by 17.57% in 7 h under a 360 nm UV lamp, and the fluorescence intensity of N, S-CDs decreased by 9.60% within 7 days at room temperature under sunlight. The results indicated that our N, S-CDs exhibited good photobleaching resistance and fluorescence stability.

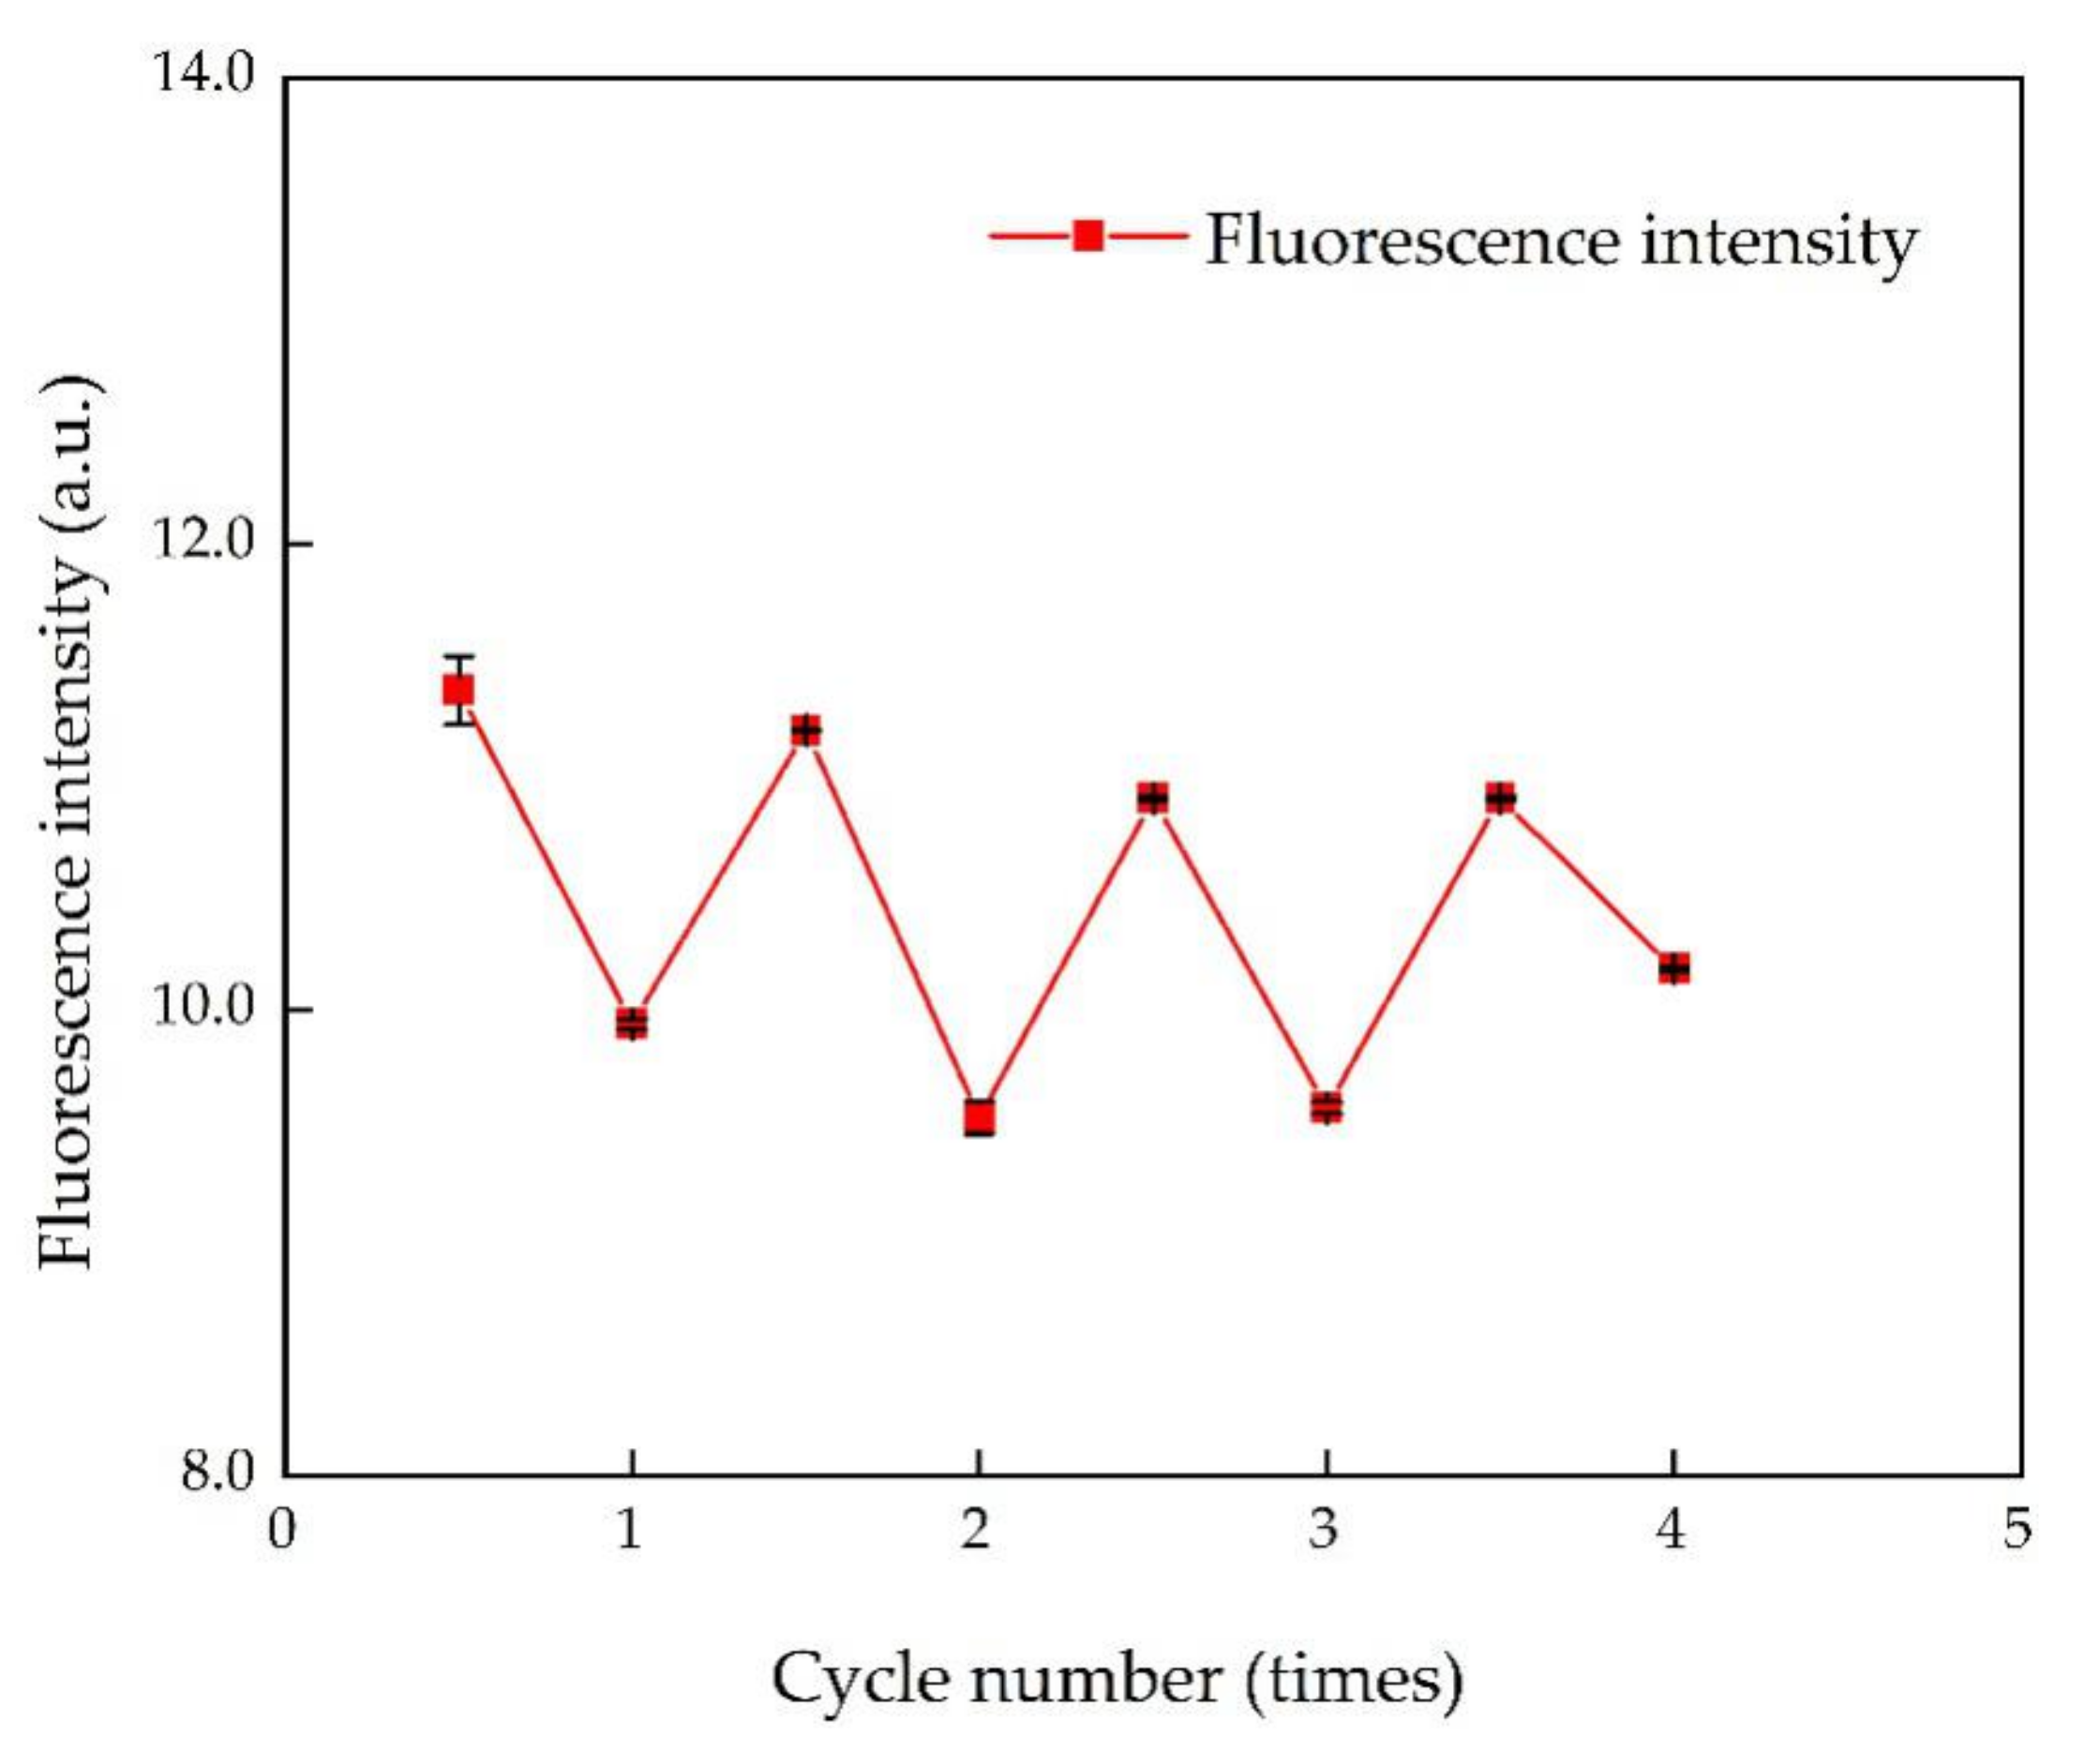
3.6. Reversibility of N, S-CDs

The difference between a fluorescence sensor and a fluorescence probe is the reversibility of fluorescence changes. We studied the reproducibility of N, S-CDs to detect ammonia by adding ammonia and HCl to the N, S-CDs solution alternately. As shown in Figure 8, over four cycles the CDs sensor had good recovery, which indicated that N, S-CDs have a good reversible performance in ammonia detection.

3.7. Applications in Real Water Samples and Fish Samples

The sensor’s capability of ammonia detection in real water samples and bighead carps samples was investigated in order to explore its feasibility and practicality, after the research on performances of linearity, selectivity, stability and reproducibility. The results of aquaculture water samples and river water samples are listed in Table 2, and it can be seen that the recovery of the spiked sample was in the range of 0.93 to 1.29, and the relative standard deviation (RSD) was in the range of 0.54% to 17.13%. The sensor showed better performance at higher concentrations of ammonia than in the lower, so the results indicated that our N, S-CDs sensor has promising potential to quantify and detect the content of ammonia in environmental water, especially in applications with high concentrations of ammonia.
In addition, the freshness of bighead carps was detected by the N, S-CDs sensor. As shown in Figure 9a, TVB-N content of bighead carps (red line) increased with the storage time; at the 24th hour of storage, TVB-N content was 21.6 mg/100 g, exceeding the recommended freshness standard of TVB-N in freshwater fish muscle (20 mg/100 g), which indicated that the bighead carps were spoiled [33]. The fluorescence intensity of N, S-CDs was almost unchanged in the first 16 h of storage, which may be because the concentration of volatile amine gases produced by the deterioration of the fish in the early storage period was lower than the detection limit of N, S-CDs; while in the 24th hour of storage, the fluorescence intensity decreased about 20%. The photographs of N, S-CDs solution stored with bighead carps were taken by smartphone under UV light (360 nm) over time, as shown in Figure 9b. It can also be seen that the fluorescence intensity of N, S-CDs was obviously decreased at the 24th hour, which agrees with the fluorescence measurement results. The results showed that although N, S-CDs could not indicate the freshness of the fish at the initial stage of storage, they could be used to determine whether the fish was spoiled. Therefore, the N, S-CDs synthesized in this paper could be used as a low-cost rapid detection sensor for fish spoilage.
Several ammonia and freshness detection methods reported are list in Table 3. Compared with other methods, the N, S-CDs proposed in this paper showed a wider range in ammonia detection, and what is more, the strategy proposed in this article can be used for environmental detection and freshness applications.

4. Conclusions

In summary, we have successfully built a fluorescence quenching strategy for ammonia determination based on N, S-CDs, which exhibited outstanding properties such as simple preparation, large detection range and high selectivity. The N, S-CDs exhibited sensitive ammonia sensing performances in a wide linear range of 2.0–80.0 mmol/L. Furthermore, the sensor was further applied to the detection of ammonia in aquaculture water samples, river water samples and freshness of bighead carps with satisfactory results. It is expected that the fluorescence sensor we proposed would have great potential in the field of environmental monitoring and freshness applications.

Supplementary Materials

The following are available online at https://www.mdpi.com/article/10.3390/su13158255/s1, Figure S1: Fluorescence intensity of different concentration of CDs (a) and the plots curve at 445nm (b), concentration of CDs: 20, 30, 40, 50, 80, 100, 130, 180, 200, unit: μg/mg, Figure S2: TEM images of N, S-CDs in pH of 3 (a), 6 (b) and 11 (c) and the distribution of particle size (d), Figure S3: The fluorescence responses of CDs to L-lysine and L-tryptophan in the concentration of 20 mmol/L.

Author Contributions

Conceptualization, J.Z. and C.S.; methodology, J.Z. and Z.X.; writing—original draft preparation, J.Z.; writing—review and editing, J.Z., C.S., X.Y. and Z.X.; visualization, X.Y.; supervision, X.Y.; project administration, X.Y.; funding acquisition, X.Y. All authors have read and agreed to the published version of the manuscript.

Funding

This research was funded by research and development projects in key areas of Guangdong Province, China, grant no.2019B020225001 and the Young Beijing Scholar fund, China.

Institutional Review Board Statement

Not applicable.

Informed Consent Statement

Not applicable.

Data Availability Statement

Data available from the corresponding author upon request.

Conflicts of Interest

The authors declare no conflict of interest.

References

  1. Timmer, B.; Olthuis, W.; Berg, A.V.D. Ammonia Sensors and Their Applications—A Review. Sens. Actuators B Chem. 2005. [Google Scholar] [CrossRef]
  2. Eddy, F.B. Ammonia in Estuaries and Effects on Fish. J. Fish Biol. 2005, 67, 1495–1513. [Google Scholar] [CrossRef]
  3. Ip, Y.K.; Chew, S.F. Ammonia Production, Excretion, Toxicity, and Defense in Fish: A Review. Front. Physiol. 2010, 1. [Google Scholar] [CrossRef] [PubMed] [Green Version]
  4. Huang, C.; Lu, H.; Chang, Y.; Hsu, T. Evaluation of the Water Quality and Farming Growth Benefits of an Intelligence Aquaponics System. Sustainability 2021, 13, 4210. [Google Scholar] [CrossRef]
  5. Ban, J.; Ling, B.; Huang, W.; Liu, X.; Peng, W.; Zhang, J. Spatiotemporal Variations in Water Flow and Quality in the Sanyang Wetland, China: Implications for Environmental Restoration. Sustainability 2021, 13, 4637. [Google Scholar] [CrossRef]
  6. Werkmeister, F.X.; Koide, T.; Nickel, B.A. Ammonia Sensing for Enzymatic Urea Detection Using Organic Field Effect Transistors and a Semipermeable Membrane. J. Mater. Chem. B 2015, 4. [Google Scholar] [CrossRef] [Green Version]
  7. Qiao, L.; Lu, B.; Dong, J.; Li, B.; Zhao, B.; Tang, X. Total Volatile Basic Nitrogen Content in Duck Meat of Different Varieties Based on Calibration Maintenance and Transfer by Use of a Near-Infrared Spectrometric Model. Spectrosc. Lett. 2020, 53, 44–54. [Google Scholar] [CrossRef]
  8. Wongrat, E.; Nuengnit, T.; Panyathip, R.; Chanlek, N.; Hongsith, N.; Choopun, S. Highly Selective Room Temperature Ammonia Sensors Based on ZnO Nanostructures Decorated with Graphene Quantum Dots (GQDs). Sens. Actuators B Chem. 2021, 326. [Google Scholar] [CrossRef]
  9. Lin, K.; Zhu, Y.; Zhang, Y.; Lin, H. Determination of Ammonia Nitrogen in Natural Waters: Recent Advances and Applications. Trends Environ. Anal. Chem. 2019, 24. [Google Scholar] [CrossRef]
  10. Zhang, M.; Zhang, T.; Liang, Y.; Pan, Y. Toward Sensitive Determination of Ammonium in Field: A Novel Fluorescent Probe, 4,5-Dimethoxyphthalaldehyde Along with a Hand-Held Portable Laser Diode Fluorometer. Sens. Actuators B Chem. 2018, 276, 356–361. [Google Scholar] [CrossRef]
  11. Strobl, M.; Walcher, A.; Mayr, T.; Klimant, I.; Borisov, S.M. Trace Ammonia Sensors Based on Fluorescent Near-Infrared-Emitting Aza-Bodipy Dyes. Anal. Chem. 2017, 89, 2859–2865. [Google Scholar] [CrossRef]
  12. Duong, H.D.; Rhee, J.I. A Ratiometric Fluorescence Sensor for the Detection of Ammonia in Water. Sens. Actuators B Chem. 2014, 190, 768–774. [Google Scholar] [CrossRef]
  13. Amjadi, M.; Jalili, R. A Molecularly Imprinted Dual-Emission Carbon Dot-Quantum Dot Mesoporous Hybrid for Ratiometric Determination of Anti-Inflammatory Drug Celecoxib. Spectrochim. Acta Part A Mol. Biomol. Spectrosc. 2018, 191, 345–351. [Google Scholar] [CrossRef] [PubMed]
  14. Jing, J.; Wenjing, L.; Lin, L.; Yuan, J.; Yifang, G.; Shaomin, S. Orange Luminescent Carbon Dots as Fluorescent Probe for Detection of Nitrite. Chin. J. Anal. Chem. 2019, 47, 560–566. [Google Scholar] [CrossRef]
  15. Hu, X.; Zhao, Y.; Dong, J.; Liu, C.; Qi, Y.; Fang, G.; Wang, S. A Strong Blue Fluorescent Nanoprobe Based on Mg/N Co-Doped Carbon Dots Coupled with Molecularly Imprinted Polymer for Ultrasensitive and Highly Selective Detection of Tetracycline in Animal-Derived Foods. Sens. Actuators B Chem. 2021, 338. [Google Scholar] [CrossRef]
  16. Liang, N.; Hu, X.; Li, W.; Mwakosya, A.W.; Guo, Z.; Xu, Y.; Huang, X.; Li, Z.; Zhang, X.; Zou, X.; et al. Fluorescence and Colorimetric Dual-Mode Sensor for Visual Detection of Malathion in Cabbage Based on Carbon Quantum Dots and Gold Nanoparticles. Food Chem. 2021, 343. [Google Scholar] [CrossRef] [PubMed]
  17. Li, L.; Ni, G.; Wang, J.; Li, J.; Li, W. Synthesis of Nitrogen-Doped Carbon Quantum Dots and Its Application as Fluorescent Sensor for Hg2+. Spectrosc. Spectr. Anal. 2016, 36, 2846–2851. [Google Scholar] [CrossRef]
  18. Ganiga, M.; Cyriac, J. Fret Based Ammonia Sensor Using Carbon Dots. Sens. Actuators B Chem. 2016, 225, 522–528. [Google Scholar] [CrossRef]
  19. Fan, Y.Z.; Dong, J.X.; Zhang, Y.; Li, N.; Liu, S.G.; Geng, S.; Ling, Y.; Luo, H.Q.; Li, N.B. A Smartphone-Coalesced Nanoprobe for High Selective Ammonia Sensing Based on the pH-Responsive Biomass Carbon Nanodots and Headspace Single Drop Microextraction. Spectrochim. Acta Part A Mol. Biomol. Spectrosc. 2019, 219, 382–390. [Google Scholar] [CrossRef] [PubMed]
  20. Travlou, N.A.; Secor, J.; Bandosz, T.J. Highly Luminescent S-Doped Carbon Dots for the Selective Detection of Ammonia. Carbon 2017, 114, 544–556. [Google Scholar] [CrossRef]
  21. Travlou, N.A.; Giannakoudakis, D.A.; Algarra, M.; Labella, A.M.; Rodriguez-Castellon, E.; Bandosz, T.J. S-and N-Doped Carbon Quantum Dots: Surface Chemistry Dependent Antibacterial Activity. Carbon 2018, 135, 104–111. [Google Scholar] [CrossRef]
  22. Wang, W.; Chen, J.; Wang, D.; Shen, Y.; Yang, L.; Zhang, T.; Ge, J. Facile Synthesis of Biomass Waste-Derived Fluorescent N, S, P Co-Doped Carbon Dots for Detection of Fe3+ Ions in Solutions and Living Cells. Anal. Methods 2021, 13, 789–795. [Google Scholar] [CrossRef] [PubMed]
  23. Sun, L.; Liu, Y.; Wang, Y.; Xu, J.; Xiong, Z.; Zhao, X.; Xia, Y. Nitrogen and Sulfur Co-Doped Carbon Dots as Selective and Visual Sensors for Monitoring Cobalt Ions. Opt. Mater. 2021, 112. [Google Scholar] [CrossRef]
  24. Deng, Y.; Qian, J.; Zhou, Y.; Niu, Y. Preparation of N/S Doped Carbon Dots and Their Application in Nitrite Detection. Rsc Adv. 2021, 11, 10922–10928. [Google Scholar] [CrossRef]
  25. Lu, Q.; Wang, L.; Liang, G. Synthesis and Characterization of N and S Co-Doped Carbon Dots. J. Jiangsu Univ. 2018, 39, 459–464. [Google Scholar] [CrossRef]
  26. Zhang, L.; Li, X.; Lu, W.; Shen, H.; Luo, Y. Quality Predictive Models of Grass Carp (Ctenopharyngodon Idellus) at Different Temperatures During Storage. Food Control 2011, 22, 1197–1202. [Google Scholar] [CrossRef]
  27. Liu, M.L.; Chen, B.B.; Li, C.M.; Huang, C.Z. Carbon Dots: Synthesis, Formation Mechanism, Fluorescence Origin and Sensing Applications. Green Chem. 2019, 21, 449–471. [Google Scholar] [CrossRef]
  28. Dong, Y.; Pang, H.; Yang, H.B.; Guo, C.; Shao, J.; Chi, Y.; Li, C.M.; Yu, T. Carbon-Based Dots Co-Doped with Nitrogen and Sulfur for High Quantum Yield and Excitation-Independent Emission. Angew. Chem. Int. Ed. Engl. 2013, 52, 7800–7804. [Google Scholar] [CrossRef]
  29. Wu, Y.; Liu, Y.; Yin, J.; Li, H.; Huang, J. Facile Ultrasonic Synthesized NH2-Carbon Quantum Dots for Ultrasensitive Co2+ Ion Detection and Cell Imaging. Talanta 2019, 205. [Google Scholar] [CrossRef]
  30. Kutty, M.N. Site Selection for Aquaculture: Chemical Features of Water. In Proceedings of the ARAC, African Regional Aquaculture Centre, Port Harcourt, Nigeria, March 1987. [Google Scholar]
  31. Svobodová, Z.; Lloyd, R.; Máchová, J.; Vykusová, B. Water Quality and Fish Health; Food and Agriculture Organization of the United Nations: Rome, Italy, 1993. [Google Scholar]
  32. Senapati, M.; Sahu, P.P. Onsite Fish Quality Monitoring Using Ultra-Sensitive Patch Electrode Capacitive Sensor at Room Temperature. Biosens. Bioelectron. 2020, 168. [Google Scholar] [CrossRef]
  33. Alcicek, Z. The Effects of Thyme (Thymus vulgaris L.) Oil Concentration on Liquid-Smoked Vacuum-Packed Rainbow Trout (Oncorhynchus Mykiss Walbaum, 1792) Fillets During Chilled Storage. Food Chem. 2011, 128, 683–688. [Google Scholar] [CrossRef]
  34. Singh, A.K.; Pandey, A.; Chakrabarti, P. Fabrication, Characterization, and Application of CuO Nano Wires as Electrode for Ammonia Sensing in Aqueous Environment Using Extended Gate-FET. IEEE Sens. J. 2021, 21, 5779–5786. [Google Scholar] [CrossRef]
  35. Zhang, L.; Wan, J.; Li, J.; Cui, Q.; He, D.; Zhao, C.; Suo, H. Fabricating a Self-Supported Electrode for Detecting Ammonia in Water Based on Electrodepositing Platinum-Polypyrrole on Ni Foam. J. Electrochem. Soc. 2020, 167, 027537. [Google Scholar] [CrossRef]
  36. Shi, Y.; Li, Z.; Shi, J.; Zhang, F.; Zhou, X.; Li, Y.; Holmes, M.; Zhang, W.; Zou, X. Titanium Dioxide-Polyaniline/Silk Fibroin Microfiber Sensor for Pork Freshness Evaluation. Sens. Actuators B Chem. 2018, 260, 465–474. [Google Scholar] [CrossRef]
  37. Fu, Y.; Wu, S.; Zhou, H.; Zhao, S.; Lan, M.; Huang, J.; Song, X. Carbon Dots and a Cdte Quantum Dot Hybrid-Based Fluorometric Probe for Spermine Detection. Ind. Eng. Chem. Res. 2020, 59, 1723–1729. [Google Scholar] [CrossRef]
Figure 1. TEM images and particle size distribution (a), FTIR spectrum (b), and XRD spectrum (c) of N, S-CDs.
Sustainability 13 08255 g001
Figure 2. XPS spectra of survey (a), high-resolution C1s (b), N1s (c) and S2p (d) of N, S-CDs.
Sustainability 13 08255 g002
Figure 3. UV–Vis absorption spectrum and fluorescence spectra (a), fluorescence spectroscopy with different excitation wavelengths (b), and with different pH (c) of N, S-CDs.
Sustainability 13 08255 g003
Figure 4. The fluorescence changes of CDs add with ammonia at pH 3–11 (a), fluorescence intensity of N, S-CDs with different ammonia concentrations (b), dependence of the fluorescence intensity on various concentration of ammonia at 445 nm (c), and concentration of ammonia: a. 0; b. 2; c. 10; d. 20; e. 30; f. 50; g. 65.0; h. 80, unit: mmol/L.
Sustainability 13 08255 g004
Figure 5. FTIR spectra of N, S-CDs and N, S-CDs/NH3 (a), UV–Vis absorption spectra of N, S-CDs, NH3 and N, S-CDs/NH3, (b) and the fluorescence lifetime decay curves of N, S-CDs and N, S-CDs/NH3 complex (c).
Sustainability 13 08255 g005aSustainability 13 08255 g005b
Figure 6. Selectivity of N, S-CDs: changes of fluorescence intensity in the presence of ammonia and other metal ions (a) and VOC (b).
Sustainability 13 08255 g006
Figure 7. Stability of N, S-CDs under a 360 nm UV lamp (a) and at room temperature under sunlight (b).
Sustainability 13 08255 g007
Figure 8. Reversibility of N, S-CDs in ammonia detection.
Sustainability 13 08255 g008
Figure 9. The response of the fluorescence intensity of N, S-CDs to fish and the TVB-N content of the corresponding samples (a), and the corresponding pictures of N, S-CDs solution taken by smartphone (b).
Sustainability 13 08255 g009
Table 1. Time-resolved fluorescence data of N, S-CDs and N, S-CDs/NH3 systems.
Systemτ1 (ns) a1τ2 (ns) a2τ3 (ns) a3 τ = a 1 τ 1 2 + a 2 τ 2 2 + a 3 τ 3 2 a 1 τ 1 + a 2 τ 2 + a 3 τ 3
N, S-CDs0.75406.442.45434.748.22171.875.19
N, S-CDs/NH30.32257.201.84534.975.98229.064.12
Table 2. Determination of ammonia in real water samples based on N, S-CDs. (n = 3).
Added (mM)Real Water Samples
Aquaculture WaterRSD (%)RecoveryRiver WaterRSD (%)Recovery
0Not found--Not found--
20.0025.2017.13%1.1826.9413.23%1.27
30.0037.628.12%1.2040.163.98%1.29
50.0050.747.29%0.9849.391.64%0.96
65.0063.0010.20%0.9561.925.00%0.93
80.0078.874.46%0.9777.840.54%0.95
Table 3. Comparison of ammonia-sensing performances based on different methods.
MethodsMaterialsLinear RangeApplicationsReferences
ElectrodeCuO nanowireNH3: 1.5–7.5 ppmAqueous Environment[34]
Pt nanoparticles-polypyrrole/Ni foamNH3: 0.5 μM to 400 μMWater[35]
TiO2-PANINH3: 0–600 μg/LPork[36]
Ag–SnO2 sol-gelMixed gas of DMA, TMA, H2S, NH3: 0–2000 ppbTilapia/Ruohu[32]
FluorescenceCDsNH3: 0.5–50 mMTap water and river water[19]
S-CDsNH3: 0–800 ppm--[20]
CDs- RhodizonateNH3: 0–200 ppmIndustries gaseous phase[18]
CDs + CdTe QDsSpermine: 0–1.0 μMPork[37]
N, S-CDsNH3: 2–80 mmol/LAquaculture water, river water and bighead carpsThis study
Publisher’s Note: MDPI stays neutral with regard to jurisdictional claims in published maps and institutional affiliations.

