Abstract
Strengthening or retrofitting of existing structures is a more sustainable and resource-efficient solution than replacing them with new constructions. To enhance the performance and effectiveness of strengthening works the use of high-performance materials is a promising method. Using ultra-high performance fibre reinforced concrete (UHPFRC) as supplementary concrete is one of such solutions leading to high structural resistance and better durability. For such UHPFRC overlays the shear bond resistance of the interface between the existing substrate, usually normal strength concrete (NSC), and the UHPFRC is a significant design aspect. This paper presents the results of push-off tests conducted on NSC-UHPFRC specimens, which were produced with different substrate treatment methods. Using different surface measurement techniques including the sand patch method and digital microscopy, the effects of substrate roughness and treatment method on shear bond behaviour and failure mechanisms are investigated, and the results are analysed with design approaches and further calculation models in the technical literature. Based on the results, the significance of considering roughness parameters and failure mode for the design of high-performance overlays is highlighted. Furthermore, the effectiveness of different substrate treatment methods is discussed and an effective treatment method is suggested.
1. Introduction
With the growing demand for rehabilitation and strengthening works, the necessity for more efficient and sustainable strengthening strategies expands. One very promising option is the use of overlays made of high-performance materials. For concrete floors and decks of, e.g., bridges with deficient bending and shear resistance, the application of a thin, and thus weight-reduced, layer of ultra-high performance fibre reinforced concrete (UHPFRC), instead of ordinary overlays with the same load-bearing capacity, decreases the dead load of the strengthened structure significantly [1,2,3,4,5,6]. At the same time, due to the very compact microstructure of ultra-high performance concrete (UHPC), the toppings or overlays made of UHPFRC slow down the diffusion of corrosive substances plus water absorption and enhance the freeze-thawing resistance and abrasion resistance of structures, so that the overall durability of the structure is enhanced significantly [7,8,9]. By adding fibres, further advantageous properties such as reduced crack widths and improved shrinkage control can be used [10,11,12,13,14].
To achieve the best structural and economic benefits, the strengthened concrete members should show a nearly monolithic behaviour, which has to be assured by the shear bond strength of the interface [15]. The basic load-bearing mechanisms contributing to shear bond strength between concrete cast at different times (concrete-concrete bond) are defined in the shear-friction theory [16] and have been investigated experimentally and modelled in several theoretical approaches [17,18,19,20,21,22,23,24,25,26,27,28]. According to the shear friction theory, the following load-bearing mechanisms contribute to the shear bond strength of interfaces without the application of shear connectors:
- adhesion
- cohesion (mechanical interlocking)
- friction due to external compressive and clamping forces
Adhesion is caused by various chemical and physical mechanisms in microscale (e.g., covalent or ionic bonds, Van der Waals forces) and is dependent on the properties of the new and old concrete, and the quality of substrate, as well as wettability, permeability and moisture content of old concrete substrate [20,25]. The cohesion is activated after the decay of adhesion with a relative horizontal and vertical displacement of the interface and is mainly affected by the mechanical interlocking caused by micro- as well as macro-roughness (compare Figure 1) [26]. The friction in the contact area is activated in a macroscopic scale only in the presence of lateral compression, which is of secondary importance for flexural members with concrete overlays.
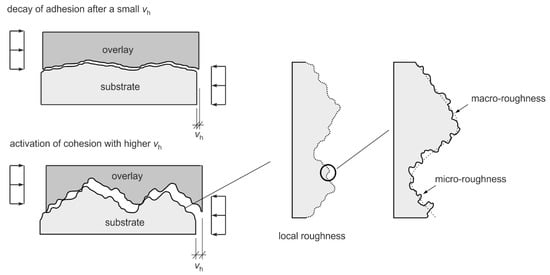
Figure 1.
Adhesion and cohesion activation in different loading stages in a simplified grain model (left) by various horizontal displacements; micro- and macro-roughness of the real interface (right).
Existing research works explain the general shear bond mechanisms between normal strength concrete mixtures cast at different times (e.g., precast elements with cast-in-place concrete). Despite several research works, there is still no consensus on the effects of interface roughness on the adhesive and cohesive bond in both shear and tension. Regarding the shear bond between NSC and UHPFRC, a few experimental investigations are also available [22,23,24,25]. However, the possible interaction between adhesion and cohesion as well as their effects on the failure modes of NSC-UHPFRC interfaces are still unknown. Based on existing models and experiments, some calculation approaches exist, which are limited to NSC-NSC interfaces and suppose higher shear and adhesion bond with increasing interface roughness. The interface roughness has been classified in early works merely based on qualitative assessment. Currently, measured roughness parameters are used for this classification. However, higher-level quantitative approaches are required for a realistic and economic calculation of NSC-UHPFRC shear bond strength.
This paper tends to investigate the aforementioned points. First, a short overview of existing quantitative approaches for the calculation of shear bond strength is given. Afterwards, the experiments conducted by the authors on the shear bond between NSC and UHPFRC are presented that include different interface treatment methods and roughnesses. The obtained experimental results are then compared with the calculative approaches and the resulted failure modes are discussed in terms of adhesion and cohesion. Finally, the possible advantages of UHPRFC overlays in combination with treatment methods and required interface roughness are analysed.
2. Calculation of Shear Bond Strength
2.1. Interface Roughness Parameters
Concrete interfaces are classified in EN 1992-1-1 (EC2) [29] and Model Code 2010 (MC2010) [30] based on roughness as “very smooth”, “smooth”, “rough” and “very rough”. For the classification of interface roughness, the “peak to mean” roughness value , determined using the sand patch method [31] is used in the mentioned standards and design code provisions (compare Table 1). With this method, a sand volume of 25 cm3 is distributed in a cylindrical form over the macro-texture surface. Using the measured diameter (compare Figure 2), the “peak to mean” roughness value is determined using Equation (1):

Table 1.
Defined surface roughness categories according to EC2 and MC2010.
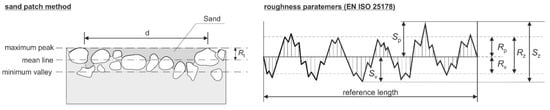
Figure 2.
Defined roughness parameter using sand patch method (left) and roughness parameters according to EN ISO 25178 (right).
An alternative, and more exact, method is using digital microscopy. The 3D-measured topology of the interface provides valuable data on the micro-texture of the interface and can be quantified afterwards using different depth and surface roughness parameters, e.g., following the definitions in EN ISO 25178 [32]. In this context, the maximum height , the maximum peak height and the maximum valley depth (from the mean line) as well as mean peak to mean valley depth are useful parameters (compare Figure 2).
Beside the height parameters, EN ISO 25178 defines also hybrid parameters such as the developed interfacial area ratio , which quantifies the increased contact area in the interface between overlay and substrate in comparison to the shear plane area according to Equation (2).
The height parameters of roughness are reasonable parameters for the definition of cohesion in a rough interface, whereas the area parameters, such as , help by the quantification of roughness effects on interface adhesive bond.
2.2. Design Approaches Based on Roughness Categories
For design of shear interface between the existing concrete substrate (NSC) and the ultra-high-performance concrete overlay (UHPFRC), the acting shear stress should be limited to the calculated ultimate shear resistance . Several design codes provide equations based on shear friction theory, according to which the ultimate shear resistance consists of adhesive bond and the mechanical interlocking for interfaces without lateral compression and without shear connectors. These two load-bearing mechanisms are expressed, e.g., in EC2 [29] and MC2010 [30] in Equation (3)
where:
| coefficient depending on interface roughness | |
| design value of concrete tensile strength | |
| effectiveness factor of concrete | |
| design value of concrete compressive strength |
In EC2 and MC2010, the design value of concrete tensile strength is determined for normal strength concrete as ( is a factor considering sustained load effects, corresponds to 5 % concrete tensile strength and is the partial safety factor). In the current draft of the new Eurocode 2 prEN 1992-1-1 [33] (prEC2), is used in Equation (3) instead of . The suggested values for the coefficient and the effectiveness factor are summarized in Table 2.
Table 2.
Coefficients for different surface roughness categories according to EC2, MC2010 and prEC2.
As shown in Table 2, the methods consider a stepwise increase of the shear bond strength values for different roughness categories and do not consider the quantified roughness explicitly. The changes in the considered value of tensile strength in the new Eurocode draft also show the missing consensus on the correlation between the shear bond strength and tensile strength of concrete. It is also worth noting that in all approaches, the lowest concrete strength should be considered for the calculation of , if substrate and overlay are made of two different strength classes. Moreover, all approaches are only valid for concrete strength classes up to C100/115. Thus, the use of bond coefficients according to a higher specific adhesion of UHPFRC is not possible with the referred design approaches.
2.3. Calculation Approaches Using Roughness Parameters
2.3.1. Approach Proposed by Gohnert
Gohnert [34] was the first to propose a method which considers explicitly the difference between the mean peak height and the mean valley depth (in mm) as a roughness parameter to determine the concrete-concrete bond strength according to Equation (4):
The proposed equation is based on precast elements made of normal strength concrete (compressive strength between 22.8 MPa and 56.2 MPa) with a ribbed interface produced by different methods at various production sites.
2.3.2. Approach Proposed by Santos and Júlio
A further calculation approach proposed by Santos and Júlio [35] considers the mean valley depth (in mm) as a roughness parameter to define the coefficient accordingly:
This empirical power function in Equation (5) correlates the roughness parameter determined based on 2D profiles of interfaces prepared with different treatment methods in combination with a partial safety factor that is suggested to be 2.6.
2.4. Overview of Existing Calculation Approaches for NSC-UHPFRC Shear Bond
As shown in the previous sections, the design approaches consider surface categories using a very simple method for the determination of macro-roughness. There are only a few approaches in the literature which include roughness parameters in the calculation of shear bond strength of the interface explicitly. Overall, the existing approaches are mostly validated on normal strength concrete overlays. The different contribution of adhesion and cohesion as well as their possible effects on the failure plane have not been investigated entirely until now. For UHP(FR)C overlay, there are some specifications in AFGC/Setra [36] as well as in SIA 2052 [37] prescribing interface design requirements that are not considered in the present paper.
In conclusion, for the design of UHPFRC overlays enhanced calculation approaches using interface roughness parameters are necessary, making the avoidance of shear connectors possible and also minimizing the interface treatment effort leading to a more rapid and resource-efficient strengthening. The following experimental investigations and evaluations of test results in this paper aim to investigate the above-mentioned points.
3. Experimental Investigation of NSC-UHPFRC Bond Strength
3.1. Test Specimens and Testing Programme
Within the experimental investigations in a research project [38] a total number of 31 tests on 3 monolithic reference specimens and 28 NSC-UHPFRC specimens were conducted. The reference push-off tests were made of normal strength concrete (NSC) with a concrete strength grade C30/37. The push-off tests for the investigation of NSC-UHPFRC bond were made of an NSC (C30/37) substrate, which was cast first. The NSC substrate was cured for one day under a plastic sheet in the mould and stored after demoulding in a controlled atmosphere for about 35 days. The testing programme included differently treated interfaces, which were: left-as-cast and brushed (B), sandblasted (S), water-blasted (J) and grooved (G). Figure 3 shows the observed surface topologies of (B), (S), (J) and (G) test series.
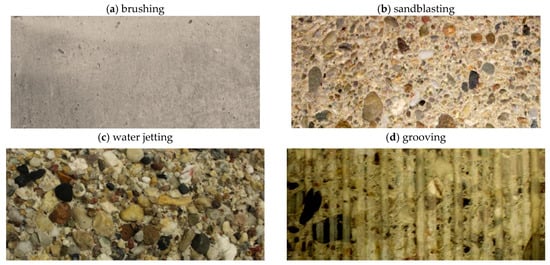
Figure 3.
Comparison between the surface topology of the brushed (a), sandblasted (b), water-jetted (c) and grooved (d) substrates.
The specimens labelled with (B) were wire-brushed. For specimens labelled as (BD) the UHPFRC was cast against a dry wire-brushed substrate, whereas the substrates of all further test series are pre-wetted before casting. Through the sandblasting with a 0.4 mm sand the fine grain was exposed. In the water-jetting treatment, a water pressure of 2.500 bars was jetted on the interface from a distance of 25 cm. With the grooving treatment technique, a well-defined interface texture was produced (compare Figure 4).
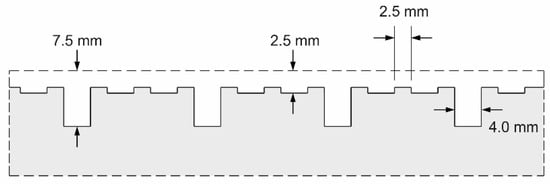
Figure 4.
Interface geometry of grooved interface.
After substrate treatment and preparation, an overlay made of an UHPFRC (MQ4) with 1.25 Vol. % fibre content (Weidacon FM 0.19/13 with lf/df = 13.0/0.19 mm ≈ 68) was added to the NSC substrate after 28 days (see Figure 5, left). Table 3 provides the mixture properties of substrate and overlay concrete. The flowability of the fresh NSC and UHPFRC was measured using slump test according to EN 12350-5 38, which was 56 cm for the NSC and 66.5 cm for the UHPFRC. The dimensions and reinforcement configuration of the test specimens are shown also in Figure 5.
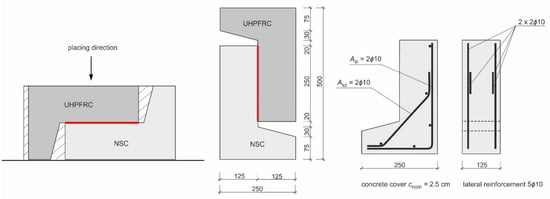
Figure 5.
Casting and placing of UHPFRC, specimen dimensions in [mm] and reinforcement configuration of push-off test specimens.
Table 3.
Concrete mixture of NSC and UHPFRC.
In addition to the test specimens, reference cylindrical specimens (Ø/h = 150/300 mm) were produced from the same batch for the investigation of material properties of hardened NSC and UHPFRC. The reference tests were conducted at the age of testing, which was 35 days for NSC and 7 days for UHPFRC [39]. The mean values of material properties are provided in Table 4 at the testing age of the push-off specimens.
Table 4.
Material properties of hardened NSC and UHPFRC.
It should be noted that the properties of the hardened UHPFRC in Table 4 were determined at the testing age of push-off experiments. For the strength classification of the used UHPFRC mixture, further compression tests were conducted at an age of 28 days.
Besides, tensile bond strength values of the NSC-UHPFRC interface were determined at the age of testing (35 days) using pull-off tests, which are listed in Table 4 for different substrate treatment methods. The plate samples of pull-off tests are illustrated in Figure 6. On each plate, 5 ring notches were drilled, the stamp was glued on each ring and a tensile load was applied with a pull-off tester. During the drilling of notches, the samples with brushed surfaces (B and BD test series) were damaged, unfortunately, so that no pull-off test results are available for these samples.
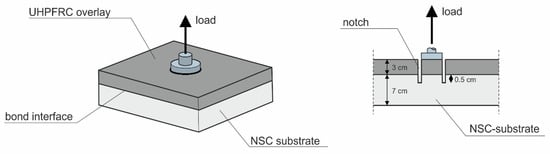
Figure 6.
Dimensions and reinforcement configuration of pull-off test specimens.
3.2. Interface Quality and Quantification of Roughness
After interface treatment, each surface was inspected visually to detect possible damages or specimen features of each method (compare Figure 7). The inspections showed in some water-jetted specimens similar damages of aggregate and aggregate-cement paste bond in form of microcracks or aggregate splitting as depicted in Figure 7b.
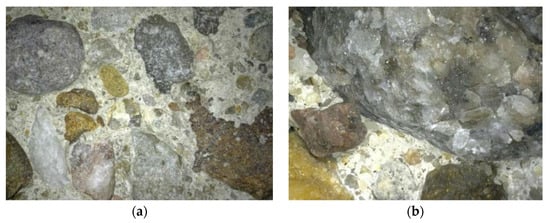
Figure 7.
Detailed imaging of a sandblasted interface (a) and a water-jetted interface (b).
For a quantified evaluation of interface roughness for different treatment methods the “peak to mean” roughness values were determined using the sand patch method. Furthermore, the surface micro-texture was measured using a digital microscope and height as well as surface parameters, i.e., and , were determined in accordance to EN ISO 25178 29 using the software MountainsLab® [43]. Each interface was measured in six measurement sections with a reference area of 6 × 5 mm. The mean value of surface roughness parameters for each surface treatment method is documented in Table 5.
Table 5.
Roughness parameters of interfaces with different preparation methods.
Figure 8 shows exemplarily the results of surface measurements using digital microscopy for different interface preparation methods.
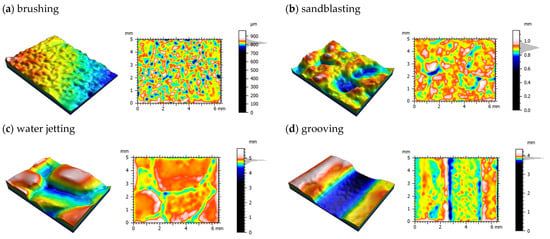
Figure 8.
Representative measured surface topology with digital microscopy for the brushed (a), sandblasted (b), water-jetted (c) and grooved (d) substrates.
It should be noted that, because of the described measurement procedure (several measurements of one surface), the maximum values of peak and height correspond to the mean values despite using the definitions and notation of EN ISO 25178 in Table 5 (). Moreover, most roughness parameters are shown to be correlated with each other, which is affected, e.g., by the microstructure of the substrate (especially the aggregate size). For the NSC substrate of the tested specimens, a correlation between the peak to mean roughness determined using the sand patch method and the maximum peak height is shown in Figure 9.
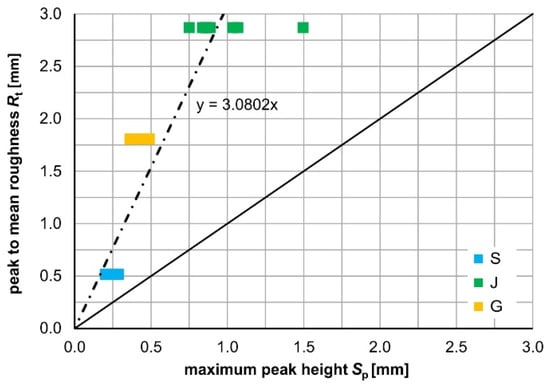
Figure 9.
Correlation between peak to mean roughness value and maximum peak height (average value).
3.3. Testing Procedure
The load was applied displacement-controlled with a loading rate of 0.001 mm/s over steel load plates (w/t = 250 mm/20 mm). To avoid eccentric loading, the machine load was introduced over a spherical cap into the upper load plate. During the tests, the vertical and horizontal displacement of the joint as well as the strain of the NSC substrate and the UHPFRC overlay were monitored by LVDTs and strain gauges (compare Figure 10). The strain gauges were placed following the principal compressive stress trajectories in the NSC and UHPFRC.
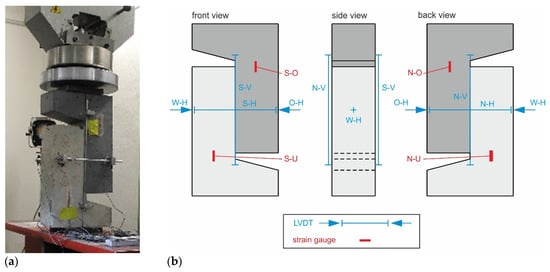
Figure 10.
Setup of push-off tests (a), applied strain gauges and LVDTs to the test specimens (b).
4. Test Results
4.1. Tensile Bond Strength
Based on the discussion in Section 2.1, the increased roughness affects the effective bond surface, which can be considered with the surface parameter . In this context, a modified tensile bond strength is defined as:
The tensile bond strength values are compared in Table 6 with the uniaxial tensile strength () of the substrate. It should be noted that the uniaxial tensile strength is determined as according to the recommendation in [31]. The comparison shows that the bond strength is lower than the uniaxial tensile strength for all specimens and lower in the case of water-jetting compared to sand-blasted and grooved interfaces, which can be reasoned by the observed pre-damaged substrates of water-jetted interfaces (compare Figure 7). A further observation was the changing failure mode of pull-off tests with increasing surface roughness. Some grooved (G) and sandblasted interfaces (S) showed a mixed failure mode with the failure plane locating in both NSC and UHPC. This might be also an additional reason for the higher tensile bond strength of these specimens in comparison to water-jetted specimens (J) with the failure plane in NSC.
Table 6.
Tensile bond strength of specimens determined in pull-off tests.
4.2. Load-Slip Behaviour and Failure Mode
The monolithic push-off tests are considered as reference test specimens with the failure according to Figure 11 and the load-displacement behaviour shown in Figure 12.
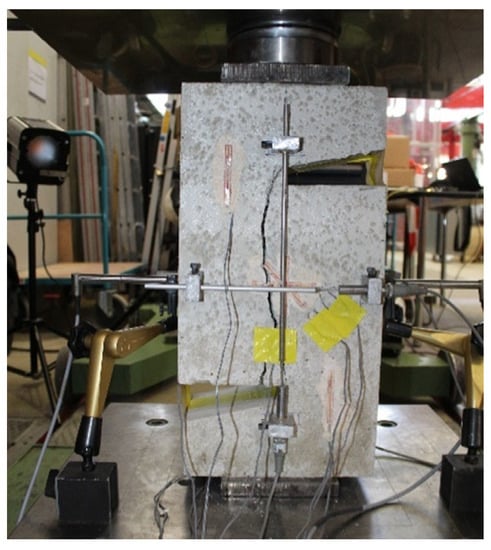
Figure 11.
Typical failure of the monolithic specimen.
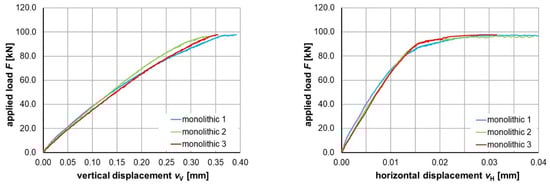
Figure 12.
Load-vertical displacement (left) and load-horizontal displacement (right) of shear failure plane of monolithic specimens.
Considering the shear bond strength to be
the mean shear bond strength of monolithic specimens corresponds to
that nearly equals .
Similar to tests on monolithic specimens, the push-off tests on NSC-UHPFRC specimens also show an almost rigid bond-slip behaviour up to a load threshold depending on joint treatment and preparation method. In this state, the interfacial horizontal displacement (measured difference between the measured values with LVDTs W-H and O-H) is very small and the compressive strain measured in NSC and UHPFRC (strain gauge SO and SU as well as NO and NU) have almost similar values. After a certain load threshold, the lower compressive strain (SU and NU) increases and a higher increase rate of relative horizontal displacement of the interface is distinguished hereafter. Figure 13 and Figure 14 show the vertical and horizontal load-displacement curves.
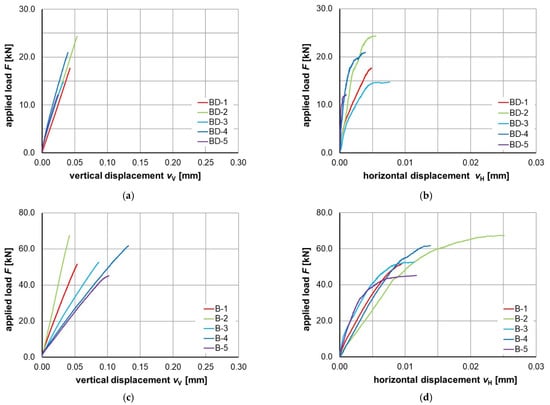
Figure 13.
Load-displacement of the shear interface with brushed dry (a,b) and brushed wet (c,d) interface treatment.
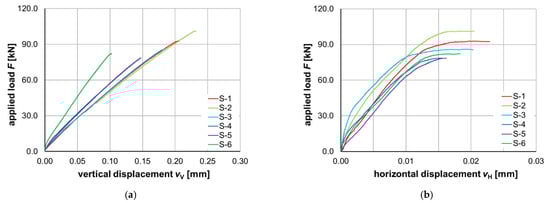
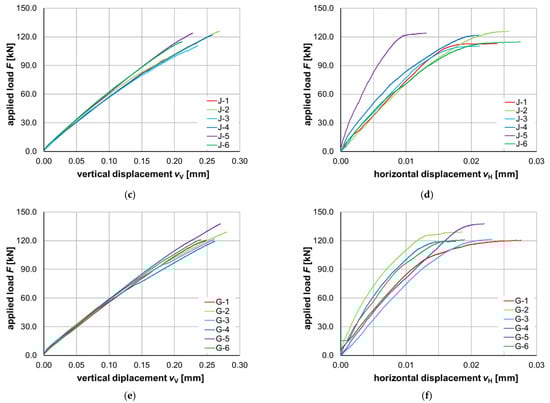
Figure 14.
Load-displacement of the shear interface of sandblasted (a,b), water-jetted (c,d) and grooved (e,f) interface treatment.
The vertical displacement-force diagrams show an almost linear behaviour of interface up to failure irrespective of joint treatment method or roughness. In general, the vertical displacement at failure state is around 10 times of the horizontal displacement. Based on the horizontal displacement-force diagrams, it can be concluded that the failure of specimens with higher interface roughness is accompanied by a higher relative horizontal displacement of the interface prior to failure, which correlates with the relative displacement in the interface, but also includes the difference between lateral deformation of NSC and UHPFRC parts of the specimen. As predicted, with increasing roughness of the interface the ultimate load increases. However, the failure plane of specimens varies based on the interface roughness. For (BD) and (B) tests a pure adhesive failure was observed, whereas (S) and (G) specimens showed a mixed failure mode with failure plane approaching through NSC specimens in some regions and also an adhesive failure of some other regions (compare Figure 15). From a maximum peak height of about 4.5 mm, the failure plane is predominantly located in the NSC substrate (cohesive failure).
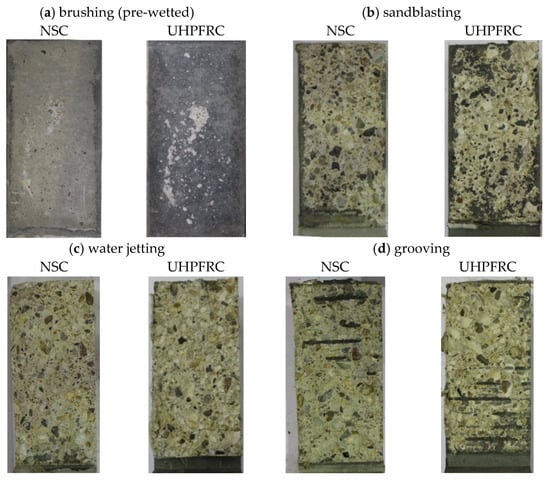
Figure 15.
Representative failure planes of the brushed (a), sandblasted (b), water-jetted (c) and grooved (d) substrates.
5. Evaluation of Test Results and Discussion
To investigate the suitability of current calculation approaches for the determination of NSC-UHPFRC shear bond strength, the experimental shear bond strength values are first evaluated using the design code approaches in Section 2.2 (compare Figure 15). The design approaches of EC2/MC2010 and prEC2 are used to determine the calculated shear bond strength with mean tensile strength values and without safety factors. Using the design approaches, no investigation was possible for the tests with very smooth substrates (B and BD).
As shown in Figure 16 and based on the statistical quantities mean value , variation of coefficient and standard deviation of the model prediction accuracy (a normal distribution is assumed), the existing design methods of EC2/MC2010 as well as of prEC2 are too conservative for the obtained test results by the authors, in which the results of newly proposed prEC2 are slightly more conservative.
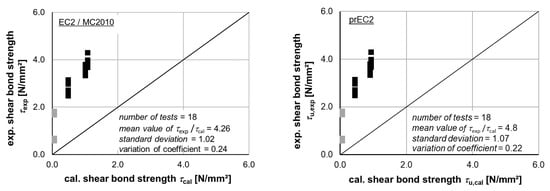
Figure 16.
Experimental shear bond strength vs. predicted shear bond strength with the design approach of EC / MC2010 (left) and predicted shear bond strength with the design approachof prEN (right).
Noting that the design approaches are not validated for NSC-UHPFRC shear bond, a further reason for the underestimated shear bond strength are the uncertainties regarding the correlation between roughness parameters and shear bond strength. In this background the stepwise increase of the shear bond strength assumed in design codes and associated to a joint category (compare Table 2) is shown in Figure 17 (dotted lines). The shear bond strength values obtained in the current tests show a certain correlation with the categories, but are not feasible, especially for the categories “very smooth” and “smooth”.
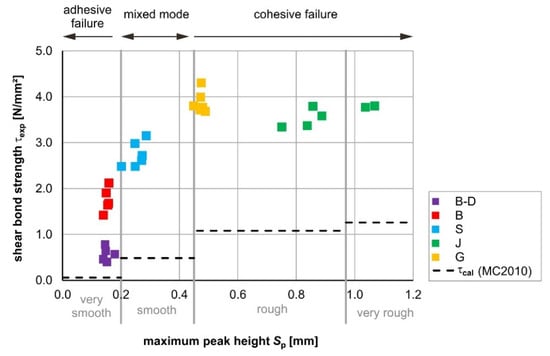
Figure 17.
Correlation between roughness value maximum peak height and the shear bond strength of tests in comparison to roughness categories and prediction of design approach in MC2010.
In this context, it should be noted, that the test results show that the minimum shear bond strength was reached by specimens with an adhesive failure and the maximum value was reached in case of cohesive failure, indicated in Figure 16, and allocated principally to the joint category of the design codes. In addition, the effect of fibres in tests with a mixed-mode failure could not be specified directly and requires further investigations.
Based on Figure 17, it can be further observed that a linear or power correlation between maximum peak height and the shear bond strength is more representative, which reaches a certain plateau (at a shear bond strength value ) observed as a cohesive failure mode with the failure plane locating in NSC substrate. In fact, the results make apparent that for rough and very rough interfaces the cohesive failure is the dominant failure mode and should be considered as an upper bound of shear bond strength for NSC-UHPFRC interfaces. That means that above a certain roughness no further increase in the load-bearing capacity is obtained. Therefore, using efficient treatment methods that produce a well-defined interface texture, such as the grooving method is suggested for NSC-UHPFRC interfaces.
Furthermore, the results show that the interface topology and substrate properties cannot be merely defined based on the roughness parameters. The interfaces treated with water jetting reach a higher roughness, although the NSC-UHPFRC bond strength of such interfaces is slightly lower than the grooved interfaces. This is assumedly caused by the treatment-induced microcracks and aggregate splitting in the substrate (compare Figure 7) and gives further evidence for the advantageousness of grooving as a treatment method.
In order to establish a more convincing calculation approach, the interface texture has to be considered more in detail. Therefore, the linear approach of Gohnert and the power function of Santos & Julio (without safety factors) are implemented in Figure 18. The comparison shows that the approaches of Gohnert and Santos & Julio have a better prediction accuracy than the design approaches in Figure 15 (mean values of the prediction accuracy factors of the model with the mean values and , respectively, instead of and , respectively), with the linear correlation proposed by Gohnert as the best fit. Nevertheless, since the enhanced approaches are validated for the NSC-NSC bond, they are still too conservative for the evaluation of the NSC-UHPFRC shear bond strength. Nevertheless, the comparison clearly confirms that better results can be reached by an explicit consideration of interface roughness in the determination of the NSC-UHPFRC shear bond strength.
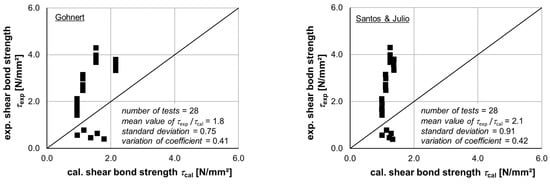
Figure 18.
Experimental shear bond strength vs. predicted shear bond strength with the calculative approach of Gohnert (left) and predicted shear bond strength with the calculative approach of Santos & Julio (right).
It is worth noting that the comparison of the design approaches (Figure 16) with the further calculation approaches (Figure 18) merely intends to show the difference between an implicit and explicit consideration of roughness parameters, respectively. Although the approaches are used with mean concrete tensile strength values and without safety factors, the safety factors cannot be verified in this study. For safe shear bond approaches, further studies are needed, which have to cover various influencing factors such as general concrete mixture parameters, interface treatment and preparation as well as shrinkage and time-dependent behaviour of concrete in a separate study.
6. Conclusions and Outlook
This paper presented the results of a research study on NSC-UHPFRC interfacial bond strength. Within the conducted push-off tests, the shear bond strength between NSC interfaces with different treatment methods and surface roughness have been determined. Additionally, the observed failure modes were used to signify the main load-bearing mechanism. Based on the results of the experimental investigations and the discussion with design approaches and calculation models from the technical literature, the following general statements can be made:
- -
- The failure type in the shown experiments varied based on the treatment method of the interface between adhesive failure, cohesive failure (cohesive) and a mixed failure mode (adhesive/cohesive). The minimum shear bond strength was reached by specimens with an adhesive failure and the maximum value was reached in case of a cohesive failure.
- -
- If the joint surface is prepared by water jetting, very rough joint surfaces can be achieved. However, the increase in maximum bond strength was disproportionate to the roughness increase. The specimens failed with a cohesive failure mode in the NSC substrate.
- -
- The joint preparation using grooving showed the best results concerning the load-bearing capacity of the joint. Therefore, grooving seems to be an effective and gentle preparation method for the preparation of the joint surface before the application of UHPC-overlays. It appeared that the high energy applied to the surface during water jetting led to microcracking and damaging of the substrate.
- -
- The investigations showed that for NSC-UHPFRC interfaces the cohesive failure mode in NSC substrate has to be considered as an upper bound for the design of UHPFRC overlays.
- -
- The calculation of shear bond strength based on roughness categories in design codes appears too crude for a UHPFRC overlay concrete to exploit the potential of the UHPFRC and should be reconsidered.
- -
- By evaluation of tests results, the approaches with a linear or power function between interface roughness parameter and shear bond strength of the interface showed better results in comparison to design approaches. However, as all calculation methods are derived empirically for NSC-NSC interfaces, the shear bond strength was underestimated in all cases.
- -
- Based on the observed failure modes, the effect of the fibres was not fully understood. It appeared that in the case of cohesive failure modes there is no significant influence on the shear bond strength, however, in the case of mixed failure mode and the post-peak behaviour there is a certain influence.
Furthermore, the investigations show the advantageousness of using novel and more detailed methods such as digital microscopy or laser scanning, which reveal important information on the texture of the interface. The determined interface roughness parameters (height and area parameters) were used for a better interpretation of the test results. Such parameters can be used to enhance the calculation approaches by considering the interface explicitly. However, for suitable refined approaches, further investigations on the correlation between failure mode, adhesive bond strength and interface roughness are compulsory. Also, the effects of steel fibres in tests with a mixed failure mode should be further studied.
Overall, the research study shows that strengthening of the existing structures with UHPFRC overlays is a very promising method for several reasons. Using more profound calculation approaches for UHPFRC overlays, strengthenings can reach high load-bearing capacities and a nearly monolithic structural behaviour with very little treatment of the joint surfaces. Furthermore, the strengthening process is more sustainable as well as time- and resource-efficient, as the joint treatment and installation effort of shear connectors can be reduced.
Author Contributions
Conceptualization, M.E. and S.J.; methodology, M.E.; validation, S.J. and M.E.; formal analysis, S.J.; investigation, S.J. and M.E.; resources, M.E.; data curation, S.J.; writing—original draft preparation, S.J.; writing—review and editing, M.E.; visualization, S.J.; supervision, M.E.; project administration, M.E.; funding acquisition, M.E. All authors have read and agreed to the published version of the manuscript.
Funding
The investigations presented in this paper are parts of a research project conducted at the iBMB, Division of Concrete Construction of the TU Braunschweig within the research project “Shear load transfer in UHPFRC-NSC joints”, funded by the Deutscher Ausschuss für Stahlbeton (DAfStb, German Committee of Reinforced Concrete)–project number V 504. The Open Access Publication Funds of Technische Universität Braunschweig funded the publication of the paper.
Institutional Review Board Statement
No application.
Informed Consent Statement
No application.
Data Availability Statement
No application.
Acknowledgments
The authors appreciate the financial and advisory support of the Deutscher Ausschuss für Stahlbeton (DAfStb, German Committee of Reinforced Concrete. We acknowledge also the support by the Open Access Publication Funds of Technische Universität Braunschweig.
Conflicts of Interest
The authors declare no conflict of interest. The funders had no role in the design of the study, in the collection of analyses and in the interpretation of data; in writing of the manuscript, and in decision to publish the results.
References
- Brühwiler, E.; Bastien Masse, M. Strengthening the Chillon viaducts deck slabs with reinforced UHPFRC. In Proceedings of the IABSE Conference—Structural Engineering: Providing Solutions to Global Challenges, Geneva, Switzerland, 23–25 September 2015; pp. 1171–1178. [Google Scholar]
- Pelke, E.; Jaborek, A.; Berger, D.; Brühwiler, E. Überführungsbauwerk der L3378 bei Fulda-Lehnerz—Erster Einsatz von UHPC in Deutschland im Straßenbrückenbau, Teil 1: Projektentwicklung und Baudurchführung. Beton-und Stahlbetonbau 2018, 113, 831–841. [Google Scholar] [CrossRef]
- Hadl, P.; delle Pietra, R.; Hoang, K.H.; Pilch, E.; Tue, N.V. Application of UHPC as road bridge topping within the adaptation of an existing conventional bridge to an integral abutment bridge in Austria. Beton-und Stahlbetonbau 2015, 110, 162–170. [Google Scholar] [CrossRef]
- Methner, R.; Müller, R. Bridge repair, strengthening and sealing with Ultra High Performance Concrete (UHPC)—Experience from three Swiss major bridges. Beton-und Stahlbetonbau 2019, 114, 126–133. [Google Scholar] [CrossRef]
- Orgass, M.; Klitsch, B.; Wißler, M.; Tauscher, F.; Dehn, F. Overpass bridge of the L 3378 road near Fulda-Lehnerz. First application of UHPC in road bridge construction in Germany. Part 2. Beton-und Stahlbetonbau 2018, 113, 821–830. [Google Scholar] [CrossRef]
- Adam, V.; Bielak, J.; Will, N.; Hegger, J. Experimental investigations regarding strengthening of bridge deck slabs with textile reinforced concrete. Beton-und Stahlbetonbau 2020, 115, 952–961. [Google Scholar] [CrossRef]
- Vande Voort, T.L.; Suleiman, M.T.; Sritharan, S. Design and Performance Verification of UHPC Piles for Deep Foundations; Center for Transportation Research and Education, Iowa State University: Ames, IA, USA, 2008. [Google Scholar]
- Tayeh, B.A.; Abu Bakar, B.H.; Mergat Johari, M.A.; Voo, J.L. Mechanical and permeability properties of the interface between normal concrete substrate and ultra-high performance fibre concrete overlay. Constr. Build. Mater. 2012, 36, 538–548. [Google Scholar] [CrossRef]
- Zanotti, C.; Talukdar, S.; Banthia, N. Astate-of-the-art on concrete repairs and some thoughts on ways to achieve durability in repairs. In Infrastructure Corrosion and Durability—A Sustainability Study; OMICS Group eBooks: Constanta, Romania, 2014. [Google Scholar]
- Empelmann, M.; Oettel, V.; Cramer, J. Calculation of crack width of concrete components reinforced with steel fibres and reinforcing bars. Beton-und Stahlbetonbau 2020, 115, 136–145. [Google Scholar] [CrossRef]
- Minelli, F.; Plizzari, G. Derivation of a simplified stress-crack width law for Fibre Reinforced Concrete through a revised round panel test. Cem. Concr. Compos. 2015, 58, 95–104. [Google Scholar] [CrossRef]
- Cuenca, E.; Conforti, A.; Monfardini, L.; Minelli, F. Shear transfer across a crack in ordinary and alkali activated concrete reinforced by different fibre types. Mater. Struct. 2020, 53, 24. [Google Scholar] [CrossRef]
- Banthia, N.; Chokri, K.; Ohama, Y.; Mindess, S. Fibre-reinforced cement based composites under tensile impact. Adv. Cem. Based Compos. 1994, 1, 131–141. [Google Scholar] [CrossRef]
- Banthia, N.; Bindiganavile, V.; Azhari, F.; Zanotti, C. Curling control in concrete slabs using fibre reinforcement. J. Test. Eval. 2014, 42, 390–397. [Google Scholar] [CrossRef]
- Empelmann, M.; Henke, V.; Sender, C. Strengthening of Flexural Members with a Post-Installed Concrete Overlay (in German). Final Report; Fraunhofer IRB Verlag: Stuttgart, Germany, 2009. [Google Scholar]
- Randl, N. Investigations on the load transmission between old and new concrete with different joint roughnesses (in German: Untersuchungen zur Kraftübertragung zwischen Alt- und Neubeton bei Unterschiedlichen Fugenrauigkeiten). Ph.D. Thesis, Universität Innsbruck, Innsbruck, Austria, 1997. [Google Scholar]
- Lenz, P. Concrete-Concrete bond potentials for shear joints (in German: Beton-Beton-Verbund Potenziale für Schubfugen). Ph.D. Thesis, Technische Universität München, München, Germany, 2012. [Google Scholar]
- Zilch, K.; Müller, A. Experimentelle Untersuchung zum Ermüdungstragverhalten von unbewehrten Schubfugen an nachträglich ergänzten Betonbauteilen. DAfStb Research Report; Technische Universität München: München, Germany, 2004. [Google Scholar]
- Santos, P.M.D.; Julio, E.N.B.S. Interface shear transfer on concrete composite members. ACI Struct. J. 2014, 111, 1–10. [Google Scholar]
- Erhard, D.; Chorinsky, G. Repair of Concrete Floors with Polymer Modified Cement Mortars. Adhesion between Polymers and Concrete; Springer US: Boston, MA, USA, 1986; pp. 230–234. [Google Scholar]
- Gowripalan, N.; Gilbert, R.I. Design Guidelines for Ductal Prestressed Concrete Beams-Design Guide; School of Civil and Environmental Engineering, The University of New South Wales: Sydney, NSW, Australia, 2000. [Google Scholar]
- Jang, H.-O.; Lee, H.-S.; Cho, K.; Kim, J. Experimental study on shear performance of plain construction joints integrated with ultra-high performance concrete (UHPC). Constr. Build. Mater. 2017, 152, 16–23. [Google Scholar] [CrossRef]
- Farzad, M.; Shafieifar, M.; Azizinamini, A. Experimental and numerical study on bond strength between conventional concrete and Ultra High-Performance Concrete (UHPC). Eng. Struct. 2019, 186, 297–305. [Google Scholar] [CrossRef]
- Zhang, Y.; Zhang, C.; Zhu, Y.; Cao, J.; Schao, X. An experimental study: Various influence factors affecting interfacial shear performance of UHPC-NSC. Constr. Build. Mater. 2020, 236, 117480. [Google Scholar] [CrossRef]
- Valikhani, A.; Jaberi Jahromi, A.; Mantawy, I.M.; Aziziamini, A. Experimental evaluation of concrete-to-UHPC bond strength with correlation to surface roughness for repair application. Constr. Build. Mater. 2020, 238, 117753. [Google Scholar] [CrossRef]
- Randl, N.; Steiner, M.; Peyerl, M. Hochfester Aufbeton zur Tragwerksverstärkung. Teil 1: Kleinkörperversuche. Beton-und Stahlbetonbau 2020, 115, 106–116. [Google Scholar] [CrossRef]
- Walraven, J.C. Fundamental analysis of aggregate interlock. ASCE J. Struct. Div. 1981, 107, 2245–2270. [Google Scholar] [CrossRef]
- Santos, P.M.D.; Julio, E.N.B.S. A state-of-the-art review on shear-friction. Eng. Struct. 2012, 45, 435–448. [Google Scholar] [CrossRef]
- EN 1992-1-1: Eurocode 2: Eurocode 2. Design of Concrete Structures-Part 1-1: General Rules and Rules for Buildings; European Committee for Standardization CEN. 2004. Available online: https://www.phd.eng.br/wp-content/uploads/2015/12/en.1992.1.1.2004.pdf (accessed on 15 July 2021).
- Fib—International Federation for Structural Concrete (2013): Fib Model Code for Structures; Ernst & Sohn: Berlin, Germany, 2010.
- Kaufmann, N. Das Sandflächenverfahren. Straßenbautechnik 1971, 24, 131–135. [Google Scholar]
- ISO 25178-2. Geometrical Product Specifications (GPS)—Surface Texture: Areal—Part 2: Terms, Definitions and Surface Texture Parameters; ISO: Geneva, Switzerland, 2012. [Google Scholar]
- prEN 1992-1-1 Eurocode 2: Design of concrete structures—Part 1-1: General rules—Rules for buildings. Bridges Civ. Eng. Struct. Rev. 2020, 11, 16.
- Gohnert, M. Horizontal shear transfer across a roughened surface. Cem. Concr. Compos. 2003, 25, 379–385. [Google Scholar] [CrossRef]
- Santos, P.M.D. Júlio ENBS. Factors affecting bond between new and old concrete. ACI Mater. J. 2011, 108, 449–456. [Google Scholar]
- AFGC. Ultra High Performance Fibre-Reinforced Concretes—Recommendations; Association Française de Génie Civil: Paris, France, 2013. [Google Scholar]
- SIA 2052: Ultra-Hochleistungs-Faserbeton (UHFB)—Baustoffe, Bemessung und Ausführung; Schweizerischer Ingenieur und Architektenverein: Zürich, Switzerland, March 2016; Available online: http://shop.sia.ch/normenwerk/ingenieur/sia%202052/d/D/Product (accessed on 15 July 2021).
- Empelmann, M.; Javidmehr, S.; Zühlsdorf, M.-R.; Wilkening, M.; Oettel, V. Shear Load Transfer in UHPFRC-NSC Joints. Final Report of DAfStb-Project No. V 504. 21. 20 March. (in press)
- EN 12350-5: Testing Fresh Concrete. Part 5: Flow Table Test. CEN/TC 104; Deutsches Institut für Normung e.V.: Berlin, Germany, 2009.
- EN 12390-6 Testing harDened Concrete. Tensile Splitting Strength of Test Specimens, CEN/TC 104/DIN; Deutsches Institut für Normung e.V.: Berlin, Germany, 2009.
- EN 12390-3: Testing Hardened Concrete. Compressive Strength of Test Specimens, CEN/TC 104/DIN; Deutsches Institut für Normung e.V.: Berlin, Germany, 2009.
- EN 12390-13: Testing Hardened Concrete. Determination of Secant Modulus of Elasticity in Compression, CEN/TC 104/DIN; Deutsches Institut für Normung e.V.: Berlin, Germany, 2009.
- MountainsLab® Premium: Surface Imaging, Analysis and Metrology Software. Digital Surf, License Number DS-0D475CF1. Available online: www.digitalsurf.com (accessed on 15 July 2021).
Publisher’s Note: MDPI stays neutral with regard to jurisdictional claims in published maps and institutional affiliations. |
© 2021 by the authors. Licensee MDPI, Basel, Switzerland. This article is an open access article distributed under the terms and conditions of the Creative Commons Attribution (CC BY) license (https://creativecommons.org/licenses/by/4.0/).