Article

Research on the Sustainable Operation of Low-Carbon Tourism Supply Chain under Sudden Crisis Prediction

School of Business, Qingdao University, Qingdao 266071, China
*
Author to whom correspondence should be addressed.
Sustainability 2021, 13(15), 8228; https://doi.org/10.3390/su13158228
Submission received: 17 June 2021 / Revised: 18 July 2021 / Accepted: 20 July 2021 / Published: 23 July 2021

Abstract

:
This paper integrates a low-carbon tourism supply chain consisting of a low-carbon tourist attraction (LTA) providing a low-carbon service and an online travel agency (OTA) responsible for big data marketing. Consumers may also encounter sudden crisis events that occur in the tourist attraction during their visit, and the occurrence of crisis events can damage the low-carbon goodwill of the tourist attraction to the detriment of the sustainable development of the supply chain. Therefore, this paper aims to investigate how tourism firms can develop dynamic strategies in the pre-crisis environment if they envision the occurrence of a crisis event and how crisis events affect interfirm cooperation. This paper uses stochastic jump processes to portray the dynamic evolution of low-carbon goodwill in the context of crisis events and introduces the methods of the differential game and Bellman’s continuous dynamic programming theory to study the sustainable operations of low-carbon tourism supply chains. Our findings provide important managerial insights for enterprises in the tourism supply chain and suggest that they need to not only become aware of the tourist attraction crisis events, but also, more importantly, they need to adjust their appropriate input strategies based on the degree of anticipation of the crisis.

1. Introduction

Data released by the United Nations World Tourism Organization (UNWTO) in January 2019 showed that the number of world tourism has reached 1.4 billion in 2018. However, in 2010, the UNWTO predicted that the number of world tourism would reach 1.4 billion in 2020. In addition, the “Report Release on World Tourism Economy Trends” (2020) shows that the total number of world travelers in 2019 reached 12.3 billion, an increase of 4.6% over 2018. Although the occurrence of COVID-19 has brought a huge impact on the tourism industry, it has stimulated tourist attractions to accelerate their collaboration with online travel agencies (https://report.iimedia.cn/repo1-0/39068.html (accessed on 20 May 2021)) because online travel agencies recover faster and are less affected by COVID-19 than scenic destinations, hotels and other tourism businesses (https://www.iresearch.com.cn/Detail/report?id=3535&isfree=0 (accessed on 20 May 2021)). However, the rapid development of tourism has also led to excessive greenhouse gas emissions, which in turn has led to the destruction of the natural environment in tourist attractions [1,2,3]. It makes the implementation of energy saving and emission reduction of low-carbon tourism concept the consensus among tourism enterprises, consumers and the government to reduce carbon emissions in tourism activities and improve the sustainable development of tourism enterprises [4,5,6]. It is under the dual drive of environmental legislation and profit that tourism enterprises have widely implemented low-carbon tourism supply chain management strategies, effectively promoting ecological environmental protection and the sustainable development of the tourism industry [7,8]. It is conducive to achieving a win-win situation for both the tourism economy and the ecological environment, and the theory and practice of low-carbon tourism supply chain management will also become an important direction for operational managers to study [9,10]. However, consumers can also encounter sudden crisis events that occur in the tourist attraction during their visit, such as natural accidents (landslides in mountainous areas, earthquakes, etc.), accidents caused by vehicles or recreational equipment and overcrowding or stampede events caused by exceeding the maximum capacity of the scenic spot.
The consequences of sudden crisis events with random and destructive characteristics are usually very catastrophic. They not only affect the safety of consumers’ lives and property, but also damage the good reputation of the company, which in turn reduces its profits and affects its sustainable development in the tourism industry [11]. In 2018, 47 Chinese tourists died in a shipwreck in Phuket, Thailand, which directly led to the cancellation of 10–15% of room orders in Phuket hotels that day and a serious decline in Phuket’s reputation and tourist traffic, which also led to a decline in hotel profits. During the Qingdao prawn incident on National Day in 2015, the relevant departments failed to deal with the issue in a timely manner, which not only let Qingdao image being damaged, but also the reputation of “Hospitable Shandong” established by Shandong Province in China was affected. In the second half of 2019, the “Devil’s Tear” attraction in The Republic of Indonesia was plagued by accidents, directly causing a decrease in Chinese tourists to the attraction and causing travel agencies to stop arranging tours for Chinese tourists to visit the attraction. It can be seen that the occurrence of random crisis events not only damages the reputation of tourism companies but also the profits of companies in the tourism supply chain are affected. However, if the occurrence of a crisis can be predicted by tourism business managers, how should they adjust their strategies to avoid certain losses and achieve the sustainable development of the tourism economy? It marks an important direction for the industry and academia to study the impact of scenic crisis events on tourism enterprises [12] and the strategic adjustment of enterprises before the crisis.
Inspired by the above analysis of scenic crisis events, this paper considers a low-carbon tourism supply chain consisting of a low-carbon tourist attraction providing low-carbon services and an online travel agency responsible for big data marketing. In such a context, the question of how a tourism company adjusts a strategy when tourist attraction crisis events are predicted to occur is considered. However, this paper focuses on how tourism companies develop dynamic strategies when they envision crisis events in tourist attractions and how crisis events affect interfirm cooperation to ensure the sustainable development of the supply chain. Specifically, the main research questions of this paper are expressed as follows:
(1)
What are the supply chain member decisions, low-carbon goodwill, member and system profits before and after the scenic crisis, for the entire planning period and after the crisis, under different decision models?
(2)
What is the impact of a scenic crisis event on member decision-making, low-carbon goodwill and member and system profits, respectively?
(3)
Does the occurrence of a scenic crisis event affect the effectiveness of cost-sharing mechanisms? Does it have an impact on the Pareto improvement effect on the profitability of the supply chain members and the system?
To address the above questions, this paper constructs a low-carbon tourism supply chain consisting of a low-carbon tourist attraction that provides low-carbon services and an online travel agency that is responsible for big data marketing. Compared with the one-time static game approach that only considers current interests, we explore the optimal operation strategy of tourism enterprises with the help of the theoretical approach of a differential game and Bellman’s continuous dynamic programming. This approach takes the long-term profit maximization of the enterprise as the goal and considers the comprehensive impact of the enterprise’s current decisions on the current benefits and future earnings, which is more conducive to the sustainability of the enterprise’s decisions on the supply chain. In addition, by portraying the random nature of sudden crisis events (it is uncertain that a crisis event will occur at some point in the future), we extend the dynamic differential game model to a two-stage game process. This change facilitates tourism companies to develop appropriate strategies when they can envision the occurrence of crisis events. Finally, the article explores the impact of the occurrence of scenic crisis events on the effectiveness of cost-sharing cooperation and Pareto improvement effects among tourism enterprises.
The rest of this paper is structured in the following framework. Section 2 is a literature review. Section 3 describes the problem and some relevant hypotheses. Section 4 constructs a differential game model under three decision-making models and performs a sensitivity analysis on the key parameters. Section 5 provides a comparative analysis of the different decision-making models. In Section 6, numerical examples are used to verify the analysis results and extend the analysis. Eventually, we present the discussion and conclusions of this paper in Section 7.

2. Literature Review

Three main streams of literature closely related to this paper are: (1) Low-carbon tourism; (2) Sudden crisis events; (3) Cost-sharing contracts.

2.1. Low-Carbon Tourism

Some scholars have conducted extensive research on the construction and evaluation index system of tourist attractions, government incentives, consumer perceptions and choices of low-carbon tourism. Huang [13] draws on the successful construction of low-carbon tourist attractions in Pinglin, Taiwan, and explains the significance of building low-carbon tourist attractions. Wang et al. [14] constructed a low-carbon behavior performance evaluation index system using the Delphi method and used analytic hierarchy process to systematically measure the low-carbon performance of 32 scenic spots in Zhangjiajie (World Heritage Scenic Area). The article extracted the key drivers that can significantly influence the performance of low-carbon behavior in tourist attractions and found that Zhangjiajie scenic spots performed relatively well in implementing low-carbon behavior, but there is still much room for improvement and enhancement. Zhao et al. [15] constructed an evolutionary game model of government and enterprises based on tourism development in a low-carbon context and studied the evolutionary strategies of both from a dynamic perspective, finding that the government and enterprises can only make decisions from a long-term perspective to better promote the low-carbon development of enterprises. He et al. [16] constructed an evolutionary game model between the government, tourism enterprises and tourists based on the context of sustainable development to explore effective green incentives for governments to develop traditional tourism into green tourism. Saarinen [17] found that government regulation is an effective way to encourage private enterprises to transform traditional tourism into sustainable tourism to a large extent. Xu and Fox [18] found that anthropocentric or ecocentric values significantly influenced people’s attitudes towards tourism and sustainable development. Jinsoo et al. [19] investigate how guests visit green hotels and conclude that a range of impressions of green hotels may lead to more beneficial behavioral intentions. Chen et al. [20] found through empirical results of structural equation modeling (SEM) that consumers’ environmental concerns did positively influence their attitudes toward green hotels, their perceived behavioral control and their perceived moral obligations. Therefore, the research on low-carbon tourism is increasingly becoming an important direction for business and academia, but there are fewer studies that introduce the idea of supply chain management into low-carbon tourism and consider the differential game of interests among low-carbon tourism enterprises [7,21].

2.2. Sudden Crisis Events

The occurrence of sudden crisis events often has a great impact on the sustainable development of enterprises [12]. Therefore, many scholars have conducted a lot of research on the impact of such crisis events on enterprises and their coping strategies [22,23]. Jang et al. [24] examined changes in the competitive response of two companies to a defamatory product injury crisis event and its impact on the relationship between advertising and consumer online search behavior. Wang et al. [25] compared the differences between traditional and emergency decision problems and proposed an emergency response strategy for emergencies with complex system characteristics through the special constraints of emergency decision. Using a state-space model, Liu et al. [26] found that when a product suffers an unexpected crisis event, a company’s product recall behavior brings negative product information, which adversely affects brand preference and advertising effectiveness. Based on a third-party recycling model, Wang et al. [27] confirmed that a coordinated strategy of a closed-loop supply chain is an effective way to deal with emergencies. So, if there is a sudden crisis event in a tourist attraction, what kind of impact will it have on tourism enterprises and consumers? In addition, if tourism companies can predict the occurrence of future scenic crisis events, how can they develop their own optimal strategies? Unfortunately, few studies are involved in this topic, and most of the literature selects specific scenic spots or single types of scenic spots to study the impact of emergencies and the coping strategies of scenic spots [28,29,30]. Therefore, the idea of supply chain management is introduced into the sudden crisis events of tourist attractions more in line with the realistic requirements. In addition, the repu tation of tourist attractions is dynamic and subject to the influence of tourism enterprises’ decisions; therefore, it is necessary to consider the dynamic nature of the reputation of tourist attractions and the long-term impact of this dynamic on the economic, environmental and social benefits of the supply chain.

2.3. Cost-Sharing Contracts

Numerous scholars have found that one of the most effective means of improving the performance of supply chain members is cooperation among members and that cooperation among members manifests itself in different contract designs: Quantity flexibility, two-part tariff and cost-sharing contracts, etc. [31,32,33,34]. However, this paper considers cost-sharing contracts among supply chain members. Bai et al. [35] proposed a revenue and promotion cost-sharing contract and a two-part tariff contract to perfectly coordinate a sustainable supply chain system consisting of a manufacturer and a retailer. In the presence of consumers’ environmental awareness or carbon taxes, Yang and Chen [36] investigated the effects of revenue sharing and cost-sharing contracts offered by retailers on a manufacturers’ carbon emission reduction efforts and the profitability of both members. They found that both contracts stimulated the manufacturers’ incentives to reduce emissions, increased manufacturers’ emission reduction levels and promoted the profitability of both members. Li et al. [37] studied the impact of revenue sharing and cost-sharing contracts offered by retailers on the low carbon strategies of members with and without bargaining channels in low carbon supply chains and found that both contracts coordinate the entire supply chain, but neither contract coordinates the supply chain if the supply chain members bargain over the sharing rate, regardless of the symmetry of bargaining power. Xiao et al. [38] constructed a sustainable supply chain consisting of a manufacturer and a supplier and investigated the effect of cost-sharing contracts on the sustainable investment level of the supplier and the profit of the supply chain members. They found that cost-sharing facilitated the improvement of the investment level of the supplier and achieved the Pareto improvement of the profit of the supply chain members. All of the above studies have investigated the impact of cost-sharing contracts on supply chain members’ decision making and performance. However, since most studies consider member decision making and cost-sharing contracts from a static perspective, it is necessary to consider the long-term effects of the dynamics of supply chain member decision making on the economic, environmental and social benefits of the supply chain.
In summary, most of the existing studies on low-carbon tourism mainly focus on the sustainability issues of individual tourism enterprises and the development of corporate strategies for supply chains composed of multiple tourism enterprises. They neglected the issue of corporate cooperation among tourism enterprises when they form a supply chain. In addition, tourists may also encounter sudden crisis events that occur in the tourist attraction during their visit, and whether crisis events will affect interfirm cooperation is a question that is bound to arise and that is worth exploring. Therefore, our study extends this part of the literature. In addition, research on sudden crisis events has mostly focused on the issue of corporate response strategies after the crisis, neglecting the issue of strategy formulation before the crisis. Finally, studies on the effects of cost-sharing contracts on interfirm cooperation in supply chains have mostly studied the impact of cost-sharing contracts on supply chain performance from a static perspective. They ignore the dynamic change characteristics of the environment in which firms are located and the impact of firms’ current decisions on future supply chain sustainability.
Therefore, this paper draws on the theoretical basis of differential game and the characteristics of supply chain dynamics in the context of low-carbon tourism enterprises anticipating the occurrence of crisis events, aiming to explore the problem of how enterprises formulate their strategies before the crisis and how crisis events affect the cost-sharing cooperation among enterprises. This paper provides relevant management insights and supply chain sustainability recommendations for tourism enterprises by the above analysis.

3. Model Description and Assumptions

This paper considers a low-carbon tourism supply chain consisting of a low-carbon tourist attraction (LTA) and an online travel agency (OTA), in which the LTA is responsible for the low-carbon service level and the OTA is in charge of big data marketing. We study the impact of the likelihood of a crisis event and the damage rate of a crisis event on members’ decisions, low-carbon goodwill and the members’ and system’s profits when tourism companies predict the occurrence of a crisis event in the tourist attraction. As the leader of the channel, the LTA actively explores the low-carbon development path and decides its own low-carbon service strategy S ( t ) , including ecological protection, green energy use, waste treatment and other low-carbon reduction inputs [7]. The OTA, as channel followers, determines their own big data marketing inputs based on the low-carbon service input in LTA. The big data marketing input implemented by the OTA uses big data technology to generate portraits of consumers’ online search and shopping records and to analyze consumers’ travel preferences in order to accurately push interested tourist attractions and low-carbon tourism products to the consumers for the purpose of promoting the tourist attractions [21]. Based on this, the low-carbon service level of the LTA and the big data marketing level of the OTA both contribute to the improvement of the low-carbon goodwill of the tourist attraction. Then, consumers will be stimulated to choose low-carbon tourist attractions by their high low-carbon goodwill. Conversely, tourist attractions can be subject to unexpected crises that can damage their low-carbon goodwill and lead to a decline in consumers. In addition, for clarity of representation, the basic parameters and variables are summarized in Table 1 in this paper.
Specifically, low-carbon tourist attractions actively practice low-carbon development. At the same time, it is inevitable that some sudden crisis events will occur in tourist attractions [12]. For example, in July 2018, there was a rolling stone falling accident in Zhangjiajie in China, a low-carbon scenic spot. In 2018, there was a cliff jumping accident in Mountain Emei, which is known as an old “low-carbon scenic spot”. Because the moment of occurrence of these crisis events is unknown, crisis events take place at discrete, random moments. If we assume that Γ ( t ) : t 0 denotes the stochastic process of a crisis event in the tourist attraction, then the probability of the crisis occurring at any moment t is χ ( 0 , 1 ) . In addition, assuming that the actual moment of the crisis is T [22], therefore, the regime in which tourism enterprises are located is divided into a pre-crisis regime ( j = 1 ), where t ( 0 , T ) and a post-crisis regime ( j = 2 ), where t ( T , ) . Furthermore, Γ ( t ) : t 0 represents a jump process and the jump rate [22] is as follows:
lim d t 0 P [ Γ ( t + d t ) = 2 | Γ ( t ) = 1 ] d t = χ lim d t 0 P [ Γ ( t + d t ) = 1 | Γ ( t ) = 2 ] d t = 0
The common setting of such regime switching and piecewise deterministic games is similar to the literature [22,23,39].
Low-carbon goodwill cannot be improved without the joint efforts of the level of low-carbon service and the level of big data marketing [21]. Because the development of low-carbon services and big data marketing is an evolving process, low-carbon goodwill is also a dynamic process. Drawing on the work of [22,23], we consider that sudden crisis events in tourist attractions can damage low-carbon goodwill. Namely, we assume that the instantaneous decline in low-carbon goodwill at the moment of the crisis is such that it leads to a discontinuity of low-carbon goodwill before and after the crisis. Moreover, referring to the goodwill dynamics equation of Nerlove-Arrow [40], the differential equation for the change in low-carbon goodwill G ( t ) is assumed to be a state variable and can be expressed as follows:
G ˙ ( t ) = α 1 S 1 ( t ) + β 1 B 1 ( t ) δ 1 G 1 ( t )   , G ( 0 ) = G 10 , ( t < T ) α 2 S 2 ( t ) + β 2 B 2 ( t ) δ 2 G 2 ( t ) , G 2 ( T ) = ( 1 ϕ ) G 1 ( T ) ,   ( t T )
where α j , β j > 0 ( α 1 > α 2 , β 1 > β 2 ) denote the impact factors of the service level of LTA and the level of big data marketing of the OTA on the low-carbon goodwill in regime is j , respectively. Moreover, the magnitude of the impact factors is impaired by unexpected events [41]. Parameter δ j > 0 ( δ 2 > δ 1 ) indicates the decay rate of low-carbon goodwill. If the decay rate is greater, the low-carbon goodwill decays more rapidly in the post-crisis regime [22]. Low-carbon goodwill will improve with the low-carbon service and big data marketing but will also decay with consumer forgetfulness and competition from other brands [21]. Parameter G ( 0 ) = G 10 denotes the initial low-carbon goodwill. ϕ denotes the loss rate of low-carbon goodwill (crisis damage rate): the larger the loss rate, the greater the decrease in the underlying goodwill [23]. In addition, the low-carbon service input cost of LTA is positively related to its service level, and the higher the low-carbon service level pursued by the tourist attraction, the greater the service input cost; similarly, the big data marketing cost of the OTA is positively related to its marketing level and increases with the increase of marketing level. As a result, drawing on the convexity assumption of the general costs [25], the low-carbon service input cost of the LTA and the big data marketing cost of the OTA are μ S S 2 ( t ) / 2 ;   μ B B 2 ( t ) / 2 at moment t , respectively. Parameters S ( t ) , B ( t ) 0 denote the low-carbon service level and the big data marketing level, respectively, and they are both decision variables in this paper. Furthermore, the coefficients μ S ,   μ B > 0 represent the constant cost factors of the low-carbon service level and the big-data marketing level, respectively [42].
The low-carbon service and the reputation of the tourist attraction are the important factors for consumers when choosing low-carbon tourist attractions [21]. Low-carbon goodwill is the key to shaping the good reputation of a tourist attraction, as well as an important factor in enhancing its competitiveness [43]. In addition, the prices of the tourist attraction have remained basically unchanged due to the long-term market equilibrium [44]. Therefore, consumers are no longer sensitive to the price of products, but the service level of the LTA, the marketing level of the OTA and the low-carbon goodwill will be more important for consumers when choosing a tourist attraction [45], assuming that the consumers’ choice of low-carbon attractions is influenced by a combination of big data marketing and low-carbon goodwill. Furthermore, the long-term nature of marketing decisions for the OTA and the dynamic nature of low-carbon goodwill also leads to the inherently dynamic nature of consumer demand. We also consider the impact of tourist attraction crisis events on consumers’ choice of LTA. Therefore, drawing on the literature ([7,23]), the consumer demand function at moment t is assumed to be:
D j ( t ) = D j 0 + γ B j ( t ) + θ G j ( t )
where parameter D j 0 > 0 is the initial consumer demand for low-carbon tourist attraction in regime j . Parameters γ , θ > 0 denote the impact factors of big data marketing and low-carbon goodwill on consumer demand, respectively. Parameters B j ( t ) , G j ( t ) denote the big data marketing and low-carbon goodwill in regime j , respectively.
The LTA provides tourist attraction information for the OTA, and then big data technology will be used by the OTA to pinpoint consumers and provide them with tourist attractions of interest [21]. Then, it can be assumed that both the LTA and the OTA can obtain certain marginal benefits after consumers choose tourist attractions. Therefore, the gains obtained by the LTA and the OTA are described as π A D ( t ) ;   π O D ( t ) , respectively, where parameters π A , π O > 0 denote the marginal revenue of the LTA and the OTA, respectively. Accordingly, the profit functions of the LTA and the OTA are expressed as the difference between the revenue and service input of LTA, and the difference between the revenue and marketing input of OTA, respectively:
A ( t ) = π A D ( t ) μ S 2 S 2 ( t ) ;   O ( t ) = π O D ( t ) μ B 2 B 2 ( t )
Furthermore, since LTA may be subject to sudden crisis events that reduce the low-carbon goodwill of a tourist attraction, it leads to a reduction in consumer choice for low-carbon tourist attractions. It also results in different decision making between the LTAs and OTAs in the pre- and post-crisis regimes, which in turn leads to different long-term profits for members in the pre- and post-crisis regimes. Drawing on the literature [22,23,39], the long-term profit function of low-carbon tourism supply chain members in the post-crisis regime can be expressed as follows:
W A G 2 ( T ) = max S 2 J A 2 S 2 ( t ) = max S 2 0 e ρ t { A 2 [ S 2 ] } d t W O G 2 ( T ) = max B 2 J O 2 B 2 ( t ) = max B 2 0 e ρ t { O 2 [ B 2 ] } d t
where W i ( i = A , O ) denotes the optimal value function for member i in the post-crisis regime and ρ > 0 denotes the discount rate. The reverse induction method can be used to first calculate the member’s profit J i 2 ( ) in the post-crisis regime and then determine the total long-term profit J i 1 ( ) of the member. Therefore, the total long-term profit of the members of the low-carbon tourism supply chain can be expressed as follows:
V A G 10 , G 1 ( T ) = max S 1 , S 2 J A 1 S 1 ( t ) , S 2 ( t ) , χ = max S 1 , S 2 0 e ( ρ + χ ) t { A 1 [ S 1 ] + χ J A 2 [ S 2 ] } d t V O G 10 , G 1 ( T ) = max B 1 , B 2 J O 1 B 1 ( t ) , B 2 ( t ) , χ = max B 1 , B 2 0 e ( ρ + χ ) t { O 1 [ B 1 ] + χ J O 2 [ B 2 ] } d t
where V i ( i = A , O ) denotes the optimal value function for supply chain member i in the entire planning period, parameter χ denotes the probability of a crisis and the discount rate at this point changes from ρ to ρ + χ . In other words, the probability of a crisis increases the impatience of supply chain members [26].

4. Model Analysis

Based on the problem description and various assumptions in the previous section, this section analyzes the member decision, low-carbon goodwill under the three models of the Nash non-cooperative decision ( N ), the cost-sharing decision ( D ) and the centralized decision ( C ) in the pre- and post-crisis reigmes and analyzes the members’ and system’s profits after the crisis and throughout the planning period. Furthermore, the key parameters under the different decision-making models are compared and statically analyzed to give different decision management insights of the models in order to provide a basis for decision making for the relevant companies in the low-carbon tourism supply chain. For the model to be easily distinguished, this paper will use the superscripts N , D and C to represent the three different decision-making modes and the subscripts A and O to represent the supply chain decision subjects, LTA and OTA, respectively.

4.1. Nash Non-Cooperative Decision-Making Model (Model-N)

When the Nash non-cooperative decision-making model (Model-N) is taken between the LTA and the OTA in the low-carbon tourism supply chain, both supply chain members, as autonomous business decision makers, behave as fully rational decision makers, and each decision maker makes decisions separately to pursue the maximization of their own profits. The LTA first determines its own low-carbon service level, and the OTA determines its optimal big data marketing level on this basis. Furthermore, the study finds that the optimal strategies under Nash’s non-cooperative decision and Stackelberg’s non-cooperative decision are consistent [46].
Proposition 1.
The optimal low-carbon service of LTA in the pre- and post-crisis regimes are:
S 1 N = α 1 θ [ π A 1 ( ρ + δ 2 ) + χ ( 1 ϕ ) π A 2 ] μ s ( ρ + χ + δ 1 ) ( ρ + δ 2 ) , S 2 N = α 2 θ π A 2 μ s ( ρ + δ 2 ) .
The optimal big data marketing of OTA in the pre- and post-crisis regimes are:
B 1 N = π O 1 ( ρ + δ 2 ) [ γ ( ρ + χ + δ 1 ) + β 1 θ ] + π P 2 β 1 θ χ ( 1 ϕ ) μ B ( ρ + χ + δ 1 ) ( ρ + δ 2 ) , B 2 N = [ γ ( ρ + δ 2 ) + β 2 η ] π P 2 μ B ( ρ + δ 2 ) .
The optimal evolutionary path of low-carbon goodwill in the pre- and post-crisis regimes are:
G 1 N ( t ) = G 10 G 1 e δ 1 t + G 1 N , G 2 N ( t ) = e δ 2 T + ( 1 ϕ ) G 1 ( T ) G 2 e δ 2 t + G 2 N .
where
G 1 N = 1 δ 1 α 1 α 1 θ [ π A 1 ( ρ + δ 2 ) + χ ( 1 ϕ ) π A 2 ] μ s ( ρ + χ + δ 1 ) ( ρ + δ 2 ) + β 1 π O 1 ( ρ + δ 2 ) [ γ ( ρ + χ + δ 1 ) + β 1 θ ] + π O 2 β 1 θ χ ( 1 ϕ ) μ B ( ρ + χ + δ 1 ) ( ρ + δ 2 )
denotes the steady state value of low-carbon goodwill in the pre-crisis regime and G 2 N = 1 δ 2 α 2 2 θ π A 2 μ s ( ρ + δ 2 ) + β 2 [ γ ( ρ + δ 2 ) + β 2 θ ] π O 2 μ B ( ρ + δ 2 ) denotes the steady state value of low-carbon goodwill in the post-crisis regime. The members’ optimal profits for the entire plan period are V A N = l 3 G 1 N + l 03 ; V O N = l 4 G 1 N + l 04 . In addition, the member’s optimal profits in the post-crisis regime are W A N = l 1 G 2 N + l 01 ; W O N = l 2 G 2 N + l 02
where
l 1 = θ π A 2 ρ + δ 2 , l 01 = π A 2 D 20 ρ + 2 μ s π A 2 π O 2 [ γ ( ρ + δ 2 ) + θ β 2 ] 2 + μ B α 2 2 θ 2 π A 2 2 2 ρ μ s μ B ( ρ + δ 2 ) 2 , l 2 = θ π O 2 ρ + δ 2 , l 02 = π O 2 D 20 ρ + μ s π O 2 2 [ γ ( ρ + δ 2 ) + β 2 θ ] 2 + 2 μ B α 2 2 θ 2 π A 2 π O 2 2 ρ μ s μ B ( ρ + δ 2 ) 2 l 3 = π A 1 η ( ρ + δ 2 ) + χ ( 1 ϕ ) θ π A 2 ( ρ + χ + δ 1 ) ( ρ + δ 2 ) , l 03 = 1 ρ + χ π A 1 D 10 + γ π A 1 + β 1 l 3 γ π p 1 + β 1 l 4 μ B + α 1 2 ( l 3 ) 2 2 μ s + χ l 01 l 4 = π O 1 η ( ρ + δ 2 ) + χ ( 1 ϕ ) θ π O 2 ( ρ + χ + δ 1 ) ( ρ + δ 2 ) , l 04 = 1 ρ + χ π O 1 D 10 + γ π O 1 + β 1 l 4 2 2 μ B + α 1 2 l 3 l 4 μ s + χ l 02 .
Proof. 
See the Appendix A. □
Corollary 1.
The sensitivity analysis of the key exogenous parameters subject to optimal big data marketing and low-carbon service for the supply chain under the Nash non-cooperative decision-making model in the pre- and post-crisis regimes is represented in Table 2.
Corollary 1 indicates that the establishment of low-carbon goodwill is an important marketing tool for the OTA to carry out big data promotions, and the advertising effect it brings can stimulate consumers to visit these tourist attractions. In this way, the LTA and the OTA can gain more profits, but the positive impact of low-carbon goodwill on supply chain members’ profitability is not affected by the tourist attraction crisis event. It increases in low-carbon goodwill and requires a joint effort between the level of low-carbon service and the level of big data marketing, which in turn are positively influenced by the respective marginal returns of the LTA and the OTA and are negatively influenced by their respective input costs. Therefore, improving input efficiency is a key way for the LTA and the OTA to be profitable. In addition, when making pre-crisis decisions, supply chain members need to consider not only the positive impact of their own marginal returns before the crisis, but also the positive impact of their own marginal returns after the crisis. In contrast, post-crisis, members’ decision making is only positively correlated with their own marginal gains after the crisis. This suggests that the determination of pre-crisis members’ decisions requires a combination of pre- and post-crisis members’ own marginal returns. The LTA’s low-carbon service and the OTA’s big data marketing are only positively correlated with their own impact factors on the low-carbon goodwill in their own regimes. Namely, the low-carbon service is positively correlated with the impact factor α 1 of low-carbon service on low-carbon goodwill in the pre-crisis regime. In addition, big data marketing is also positively correlated with the impact factor β 1 of big data marketing on low-carbon goodwill in the pre-crisis regime. The situation in the post-crisis regime is similar. This suggests that crisis events in tourist attractions do not affect the change in correlation between the decisions of members in the supply chain and low-carbon goodwill. The level of big data marketing in the pre- and post-crisis regimes only varies positively with the coefficient of its own influence on demand in the regime in which it is located. Therefore, the occurrence of a crisis event does not affect the change in the correlation between the level of big data marketing and demand. The decisions of the tourism supply chain members in the pre-crisis regime are negatively associated with the likelihood χ of a crisis and the decay rate ϕ of a crisis on the low-carbon goodwill. In other words, the greater the likelihood of a crisis and the greater the rate of decay of the low-carbon goodwill, the greater the reduction in members’ decision making. Therefore, when supply chain members anticipate that a crisis will occur, they gradually reduce their own decision-making level to prevent excessive input costs in order to prevent an excessive waste of resources. Moreover, supply chain members’ decisions in the pre-crisis regime are negatively related to the decay rate of low-carbon goodwill, which is not only in the pre-crisis regime, but also in the post-crisis regime. However, members’ decisions in the post-crisis regime are only negatively related to the decay rate of the low-carbon goodwill in the post-crisis regime. This suggests that the pre-crisis members’ decisions should take into account the decay rate of the low-carbon goodwill before and after the crisis to determine the optimal decision level.

4.2. Cost-Sharing Decision-Making Model (Model-D)

Under the cost-sharing decision-making model (Model-D), the part of the cost of the OTA’s big data marketing investment will be borne by the LTA to incentivize the OTA to actively promote tourist attraction and develop potential tourism markets [7]. Therefore, to build a low-carbon tourism supply chain differentital game model led by the LTA, the LTA firstly decides its own low-carbon service and the sharing coefficient of the big data marketing of the OTA, and then the OTA decides its own big data marketing level on this basis.
Proposition 2.
The optimal low-carbon services in the pre- and post-crisis regimes are
S 1 D = α 1 θ π A 1 ( ρ + δ 2 ) + χ ( 1 ϕ ) π A 2 μ s ( ρ + χ + δ 1 ) ( ρ + δ 2 ) , S 2 D = α 2 θ π A 2 μ s ( ρ + δ 2 )   ,
respectively.
The LTA’s share coefficients for the OTA’s big data marketing in the pre- and post-crisis regimes are
ψ 1 = ( 2 π A 1 π O 1 ) γ ( ρ + χ + δ 1 ) ( ρ + δ 2 ) + β 1 θ ( ρ + δ 2 ) + β 1 θ χ ( 1 ϕ ) ( 2 π A 2 π O 2 ) ( 2 π A 1 + π O 1 ) γ ( ρ + χ + δ 1 ) ( ρ + δ 2 ) + β 1 θ ( ρ + δ 2 ) + β 1 θ χ ( 1 ϕ ) ( 2 π A 2 + π O 2 ) ; ψ 2 = 2 π A 2 π O 2 2 π A 2 + π O 2 ,
respectively.
The optimal big data marketing in the pre- and post-crisis regimes are
B 1 D = ( 2 π A 1 + π O 1 ) ( ρ + δ 2 ) [ γ ( ρ + χ + δ 1 ) + β 1 θ ] + ( 2 π A 2 + π O 2 ) β 1 θ χ ( 1 ϕ ) 2 μ B ( ρ + χ + δ 1 ) ( ρ + δ 2 ) ; B 2 D = ( 2 π A 2 + π O 2 ) [ γ ( ρ + δ 2 ) + β 2 θ ] 2 μ B ( ρ + δ 2 )
The optimal evolutionary path of low-carbon goodwill in the pre- and post-crisis regimes are
G 1 D ( t ) = G 10 G 1 D e δ 1 t + G 1 D , G 2 D ( t ) = e δ 2 T + ( 1 ϕ ) G 1 D ( T ) G 2 D e δ 2 t + G 2 D .
where
G 1 N = 1 δ 1 α 1 α 1 θ [ π A 1 ( ρ + δ 2 ) + χ ( 1 ϕ ) π A 2 ] μ s ( ρ + χ + δ 1 ) ( ρ + δ 2 ) + β 1 π O 1 ( ρ + δ 2 ) [ γ ( ρ + χ + δ 1 ) + β 1 θ ] + π O 2 β 1 θ χ ( 1 ϕ ) μ B ( ρ + χ + δ 1 ) ( ρ + δ 2 )
denotes the steady state value of the low-carbon goodwill in the pre-crisis regime and
G 2 D = 1 δ 2 α 2 α 2 θ π A 2 μ s ( ρ + δ 2 ) + β 2 ( 2 π A 2 + π O 2 ) [ γ ( ρ + δ 2 ) + β 2 θ ] 2 μ B ( ρ + δ 2 )  
denotes the steady state value of the low-carbon goodwill in the post-crisis regime. The members’ optimal profits for the entire plan period are V A D = l 7 G 1 D + l 07 , V O D = l 8 G 1 D + l 08 . In addition, the member’s optimal profits in the post-crisis regime are W A D = l 5 G 2 D + l 05 , W O D = l 6 G 2 D + l 06 ,
where
l 5 = θ π A 2 ρ + δ 2 , l 05 = π A 2 D 20 ρ + 4 μ B α 2 2 θ 2 ( π A 2 ) 2 + μ S [ γ ( ρ + δ 2 ) + β 2 θ ] 2 ( 2 π A 2 + π O 2 ) 2 8 ρ μ S μ B ( ρ + δ 2 ) 2 , l 6 = θ π O 2 ρ + δ 2 , l 06 = π O 2 D 20 ρ + 4 μ B α 2 2 θ 2 π A 2 π O 2 + μ S π O 2 ( 2 π A 2 + π O 2 ) [ γ ( ρ + δ 2 ) + β 2 θ ] 2 4 ρ μ S μ B ( ρ + δ 2 ) 2 , l 7 = θ π A 1 ( ρ + δ 2 ) + χ ( 1 ϕ ) θ π O 2 ( ρ + χ + δ 1 ) ( ρ + δ 2 ) , l 07 = 1 ρ + χ π A 1 D 10 + χ l 05 + α 1 2 ( l 7 ) 2 2 μ s + [ γ ( 2 π A 1 + π O 1 ) + 2 β 1 l 7 + β 1 l 8 ] 2 8 μ B , l 8 = η π O 1 ( ρ + δ 2 ) + χ ( 1 ϕ ) θ π O 2 ( ρ + χ + δ 1 ) ( ρ + δ 2 ) , l 08 = 1 ρ + χ π O 1 D 10 + χ l 06 + α 1 2 l 7 l 8 μ s + ( γ π O 1 + β 1 l 8 ) [ γ ( 2 π A 1 + π O 1 ) + 2 β 1 l 7 + β 1 l 8 ] 4 μ B .
Proof. 
Similar to the proof of Proposition 1, thus it will not be repeated here. □
Corollary 2.
The sensitivity analysis of the key exogenous parameters subject to the optimal big data marketing, low-carbon service and the LTA’s share coefficients for the OTA’s big data marketing for the supply chain under the cost-sharing decision model in the pre- and post-crisis regimes are represented in Table 3.
Here, the specific case indicated by * is when π O 1 / π A 1 > π O 2 / π A 2 , we can get ψ 1 / β 1 > 0 , ψ 1 / χ > 0 , ψ 1 / γ < 0 , ψ 1 / ϕ < 0 , ψ 1 / δ 1 < 0 , ψ 1 / δ 2 < 0 .
Corollary 2 indicates that in model D, the supply chain members’ decisions in the pre-crisis regime are affected by the marginal returns of the members differently than the decisions in the post-crisis regime. To be more specific, the low-carbon service level in the pre-crisis regime is positively related to the change in the LTA’s marginal returns in the pre- and post-crisis regimes. However, the level of big data marketing in the pre-crisis regime varies positively with both the OTA’s marginal returns π O j in the pre- and post-crisis regimes and the LTA’s marginal returns π A j in the pre- and post-crisis regimes. Moreover, the marginal benefit of the LTA has a greater impact on the level of big data marketing B 1 D . Next, we consider the decisions of the members in the post-crisis regime. The low-carbon service is only positively correlated with the LTA’s own marginal return after the crisis, while the level of big data marketing is positively correlated with the marginal returns of both the OTA and the LTA after the crisis and is doubly boosted by the marginal returns of the LTA. We consider that the reason for the above changes may be due to the LTA bearing part of the marketing costs for the OTA, indicating that the OTA will consider their own benefits and those of the LTA when making decisions under this cost-sharing mechanism. In other words, the occurrence of tourist attraction crisis events does not affect the OTA’s ability to consider the benefits of both members when making decisions. Moreover, in model- D , the members’ decisions are subject to the same variation in other factors as in model- N . It follows that, pre-crisis, the members’ decisions need to take into account the marginal benefits of the members and the decay rate of the low-carbon goodwill in the pre- and post-crisis regimes as well as the direct and indirect effects of the market demand. Last but not least, the occurrence of a tourist attraction crisis event makes a difference in the cost-sharing ratio in the pre- and post-crisis regimes. That is to say, the post-crisis sharing ratio is only related to post-crisis members’ benefits, positively related to the LTA’s benefit but negatively related to the OTA’s benefit. Conversely, the pre-crisis sharing ratio needs to consider a combination of pre- and post-crisis members’ gains along with the impact of other factors. Furthermore, π O 1 / π A 1 > π O 2 / π A 2 implies that the decay rate of the low-carbon goodwill is higher when the gains made by the OTA compared to the LTA before the crisis are greater than the gains made after the crisis, boosting the sharing ratio. The cost-sharing ratio increases as the likelihood of a crisis event increases. Furthermore, the greater the rate of loss of low-carbon goodwill, the lower the sharing ratio is set. It further suggests that under certain conditions, an increase in the likelihood of crisis events will facilitate the implementation of cost-sharing cooperation among supply chain members, while an increase in the rate of scenic losses will be detrimental to the cooperation among members.

4.3. Centralized Decision-Making Model (Model-C)

The centralized decision-making model (Model- C ) of LTA and OTA is the most ideal state in the low-carbon tourism supply chain, where both members constitute a unified decision maker and jointly determine the service inputs and big data marketing inputs in the supply chain to enhance the low-carbon goodwill, which in turn stimulates the consumers’ choice of low-carbon tourist attractions and improves the overall profit of the supply chain system. In this model, the LTA and the OTA seek to maximize system profits and jointly determine the service and marketing strategies, with the letter SC denoting the supply chain as a whole.
Proposition 3.
The optimal low-carbon service inputs of the supply chain in the pre- and post-crisis regimes are
S 1 C = θ α 1 [ ( π A 1 + π O 1 ) ( ρ + δ 2 ) + ( π A 2 + π O 2 ) χ ( 1 ϕ ) ] μ S ( ρ + χ + δ 1 ) ( ρ + δ 2 ) ,   S 2 C = α 2 θ ( π A 2 + π O 2 ) μ S ( ρ + δ 2 ) ,
respectively.
The optimal big data marketing inputs for the supply chain in the pre- and post-crisis regimes are
B 1 C = ( π A 1 + π O 1 ) ( ρ + δ 2 ) [ γ ( ρ + χ + δ 1 ) + θ β 1 ] + θ β 1 ( π A 2 + π O 2 ) χ ( 1 ϕ ) μ B ( ρ + χ + δ 1 ) ( ρ + δ 2 ) ; B 2 C = ( π A 2 + π O 2 ) [ γ ( ρ + δ 2 ) + β 2 θ ] μ B ( ρ + δ 2 ) .
The optimal evolutionary path of low-carbon goodwill in the pre- and post-crisis regimes are
G 1 C ( t ) = G 10 G 1 C e δ 1 t + G 1 C , G 2 C ( t ) = e δ 2 T + ( 1 ϕ ) G 1 C ( T ) G 2 C e δ 2 t + G 2 C .
where
G 1 C = 1 δ 1 θ α 1 2 [ ( π A 1 + π O 1 ) ( ρ + δ 2 ) + ( π A 2 + π O 2 ) χ ( 1 ϕ ) ] μ S ( ρ + χ + δ 1 ) ( ρ + δ 2 ) + β 1 ( π A 1 + π O 1 ) ( ρ + δ 2 ) [ γ ( ρ + χ + δ 1 ) + θ β 1 ] + θ β 1 2 ( π A 2 + π O 2 ) χ ( 1 ϕ ) μ B ( ρ + χ + δ 1 ) ( ρ + δ 2 )
denotes the steady state value of the low-carbon goodwill in the pre-crisis regime and
G 2 C = 1 δ 2 α 2 2 θ ( π A 2 + π O 2 ) μ S ( ρ + δ 2 ) + β 2 ( π A 2 + π O 2 ) [ γ ( ρ + δ 2 ) + β 2 θ ] μ B ( ρ + δ 2 )  
denotes the steady state value of the low-carbon goodwill in the post-crisis regime. The overall optimal profit of the supply chain for the entire planning period is V S C C = l 10 G 1 C + l 010 , and the optimal profit for the supply chain as a whole in the post-crisis regime is W S C C = l 9 G 2 C + l 09 ,
where
l 9 = θ ( π A 2 + π O 2 ) ρ + δ 2 , l 09 = ( π A 2 + π O 2 ) D 20 ρ + ( π A 2 + π O 2 ) 2 μ S [ γ ( ρ + δ 2 ) + θ β 2 ] 2 + μ O α 2 2 θ 2 2 ρ μ S μ B ( ρ + δ 2 ) 2 , l 10 = θ ( π A 1 + π O 1 ) ( ρ + δ 2 ) + θ ( π A 2 + π O 2 ) χ ( 1 ϕ ) ( ρ + χ + δ 1 ) ( ρ + δ 2 ) , l 010 = ( π A 1 + π O 1 ) D 10 + [ γ ( π A 1 + π O 1 ) + l 10 β 1 ] 2 2 μ B + ( l 10 α 1 ) 2 2 μ S + χ l 09 / ( ρ + χ )
Proof. 
Similar to the proof of Proposition 1, thus it will not be repeated here. □
Corollary 3.
The sensitivity analysis of the key exogenous parameters subject to optimal big data marketing and low-carbon service for the supply chain under the Model- C in the pre-and post-crisis regimes are represented in Table 4.
Corollary 3 indicates that the optimal decision for the LTA and the optimal decision for the OTA in the post-crisis regime are both proportional to the sum of the marginal benefits ( π A 2 + π O 2 ) of both members of the post-crisis regime. However, the optimal decision for the LTA and the optimal decision for the OTA in the pre-crisis regime are not only both proportional to the sum of the marginal benefits ( π A 1 + π O 1 ) of both members of the pre-crisis regime, but also to the sum of the marginal benefits ( π A 2 + π O 2 ) of both members of the post-crisis regime. To put it differently, under the condition that the supply chain members are unified into one decision subject, the equilibrium strategy of members is no longer based on the marginal revenue of one member alone but needs to consider the marginal revenue of both members comprehensively. The occurrence of the tourist attraction crisis event does not change the need for the supply chain to consider the benefits of the supply chain as a whole when making decisions. In addition, the correlation between the optimal decision level before and after the crisis and other parameters for LTA and OTA is similar to that of the relationship in the non-cooperative decision-making model and is not repeated here.

5. Comparative Analysis

This section builds on the previous analysis and uses symbolic reasoning to further compare the effects of the three decision-making models on low-carbon service, big data marketing, steady state low-carbon goodwill and member and system profits in the pre- and post-crisis regimes.
Proposition 4.
The effects of different decision-making models on the optimal level of low-carbon service in pre- and post-crisis regimes are S 1 C > S 1 N = S 1 D and S 2 C > S 2 N = S 2 D , respectively.
Proof. 
See the Appendix B. □
Proposition 4 demonstrates that regardless of the pre-crisis or post-crisis regime of the low-carbon tourism supply chain, the low-carbon service is the highest in the centralized decision-making model, which indicates that the Model- C that unifies supply chain members into a single decision maker is the one that can optimize the entire low-carbon supply chain and can be more conducive to the growth of low-carbon service in the tourist attraction. The low-carbon service under the Model- D is the same as that under the Model- N , which shows that whether LTA shares marketing costs for OTA has no effect on their own low-carbon service. In addition, the occurrence of tourist attraction crisis events does not affect the relationship of low-carbon service under the three decision-making models.
Proposition 5.
The relationship between different decision-making models on the level of big data marketing, steady state low-carbon goodwill, members and the steady state profit of the supply chain system are as follows:
(1)
In the pre-crisis regime, when the marginal returns of the LTA and the OTA satisfy π A 1 > π O 1 / 2 , π A 2 > π O 2 / 2 , we can obtain B 1 C > B 1 D > B 1 N ;   G 1 C > G 1 D > G 1 N ;   V A D > V A N ;   V O D > V O N and V S C C > V A D + V O D > V A N + V O N .
(2)
In the post-crisis regime, when the marginal returns of the LTA and the OTA satisfy π A 2 > π O 2 / 2 , we can obtain B 2 C > B 2 D > B 2 N ;   G 2 C > G 2 D > G 2 N ;   W A D > W A N ; W O D > W O N and W S C C > W A D + W O D > W A N + W O N .
Proposition 5 indicates that the big data marketing decision, the steady state low-carbon goodwill and the steady state profit of the supply chain system are all highest in Model- C , which shows that the Model- C with supply chain members unified as one decision-making subject is the best solution for the cooperation of the LTA and the OTA. In this way, the total profit of the system can be effectively increased, which helps to achieve the overall profit Pareto optimality of the supply chain. However, the Model- C is difficult to realize in reality because the power of the two members in the supply chain is somewhat different. Furthermore, when the marginal benefits of the LTA and the OTA meet certain conditions ( π A j > π O j / 2 ), the level of big data marketing, steady state low-carbon goodwill and the steady state profits of members and the supply chain as a whole under the Model- D are greater than the Model- N , thus showing that the cost-sharing contract among members of the low-carbon tourism supply chain motivates the OTA to actively carry out marketing efforts, which can promote the sustainable development of the supply chain and help increase low-carbon goodwill. In this way consumers are more willing to choose low-carbon tourist attractions. In addition, compared with the Model- N , the Model- D promotes the increase of profits of both members and the Pareto improvement of profits of both members. Therefore, both members of the low-carbon tourism supply chain are more willing to engage in the cost-sharing cooperation model (i.e., Model- D ). The reason for this is that the Model- D is easier to implement than the Model- C , and the Model- D is also an effective way to promote the sustainable development of low-carbon tourism.

6. Numerical Analysis

This section takes the form of numerical analysis to further validate the previous findings by analyzing the results related to the three decision-making models of Nash non-cooperative (Model- N ), cost-sharing (Model- D ) and centralized (Model- C ), specifically: (1) the time evolution paths of the low-carbon goodwill and the total system profit and (2) the effects of the likelihood of crisis occurrence and the crisis damage rate on member decisions, low-carbon goodwill, total system profit and the effectiveness of the cost-sharing contract, respectively. Therefore, in order to obtain relevant results, we draw on the relevant parameter settings in the literature [21,22,23,47] and set the basic parameters in the context of this paper as follows:
θ = 1 , α 1 = 2 , α 2 = 1 , β 1 = 2 , β 2 = 1 , π A 1 = 2 , π A 2 = 1 , π O 1 = 3 , π O 2 = 1 , γ = 1 , δ 1 = 0.2 , δ 2 = 0.4 , μ S = 2 , μ B = 2 , ρ = 0.2 , G 10 = 0 , D 10 = 10 , D 20 = 5 .

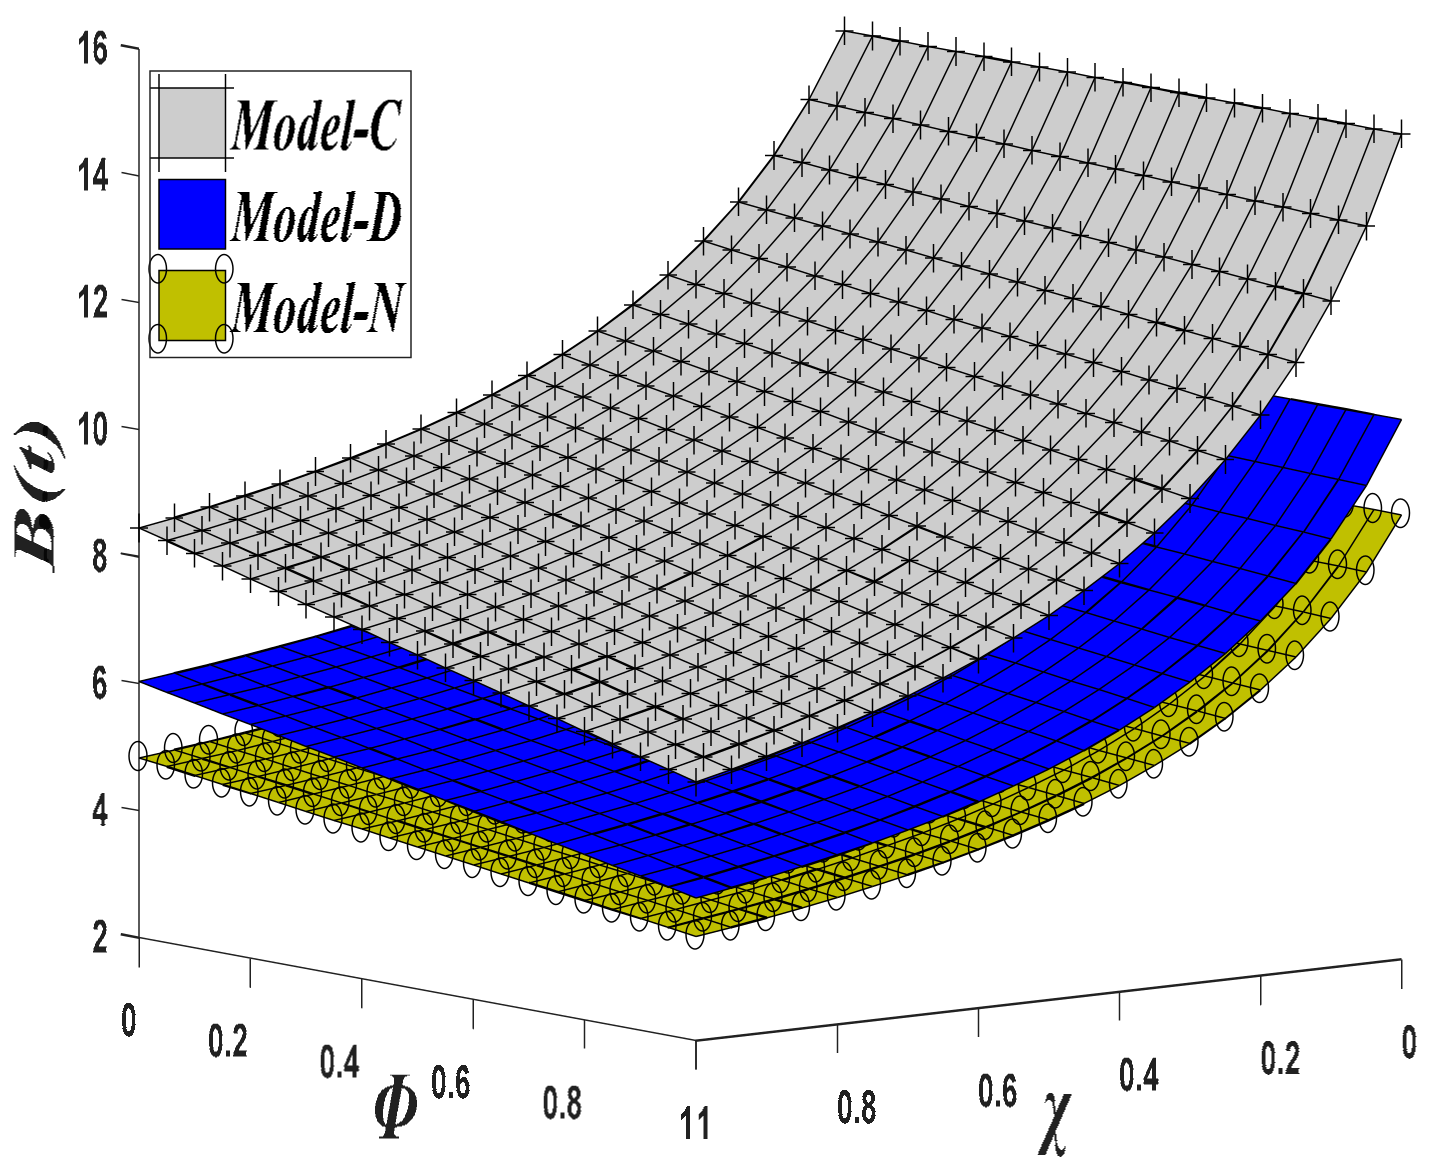
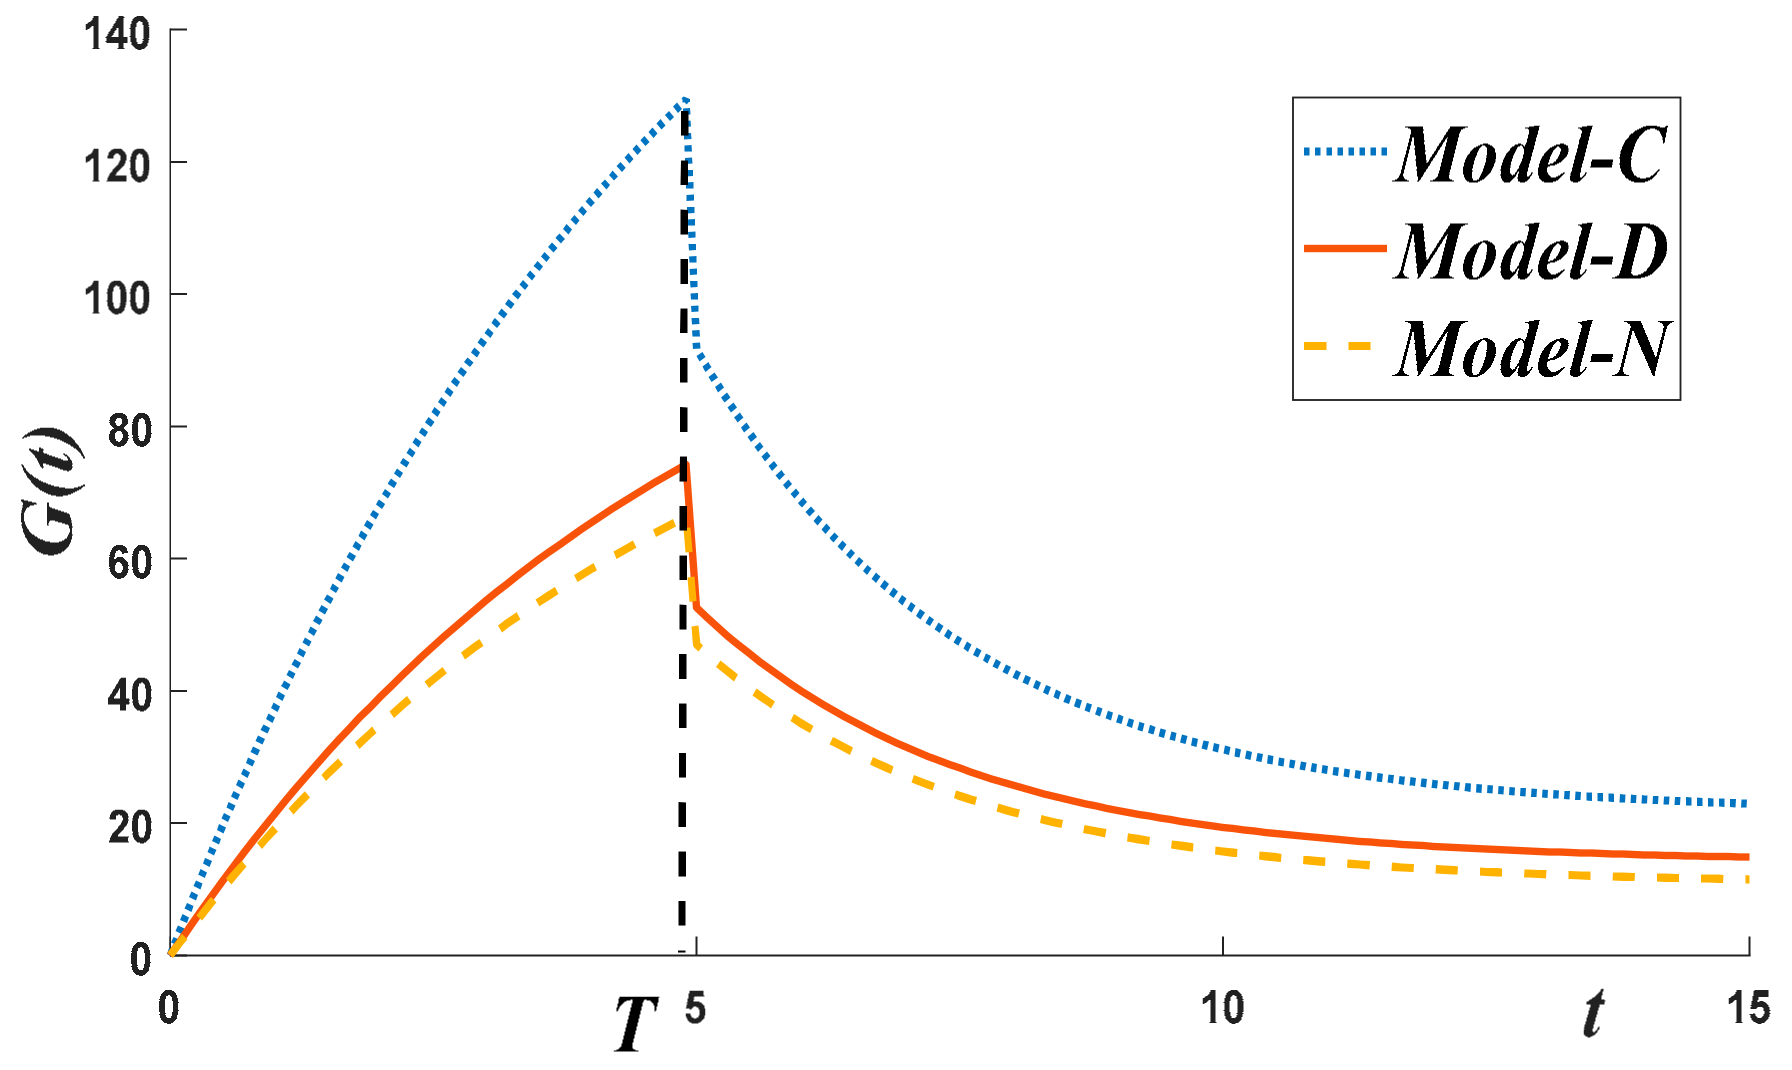
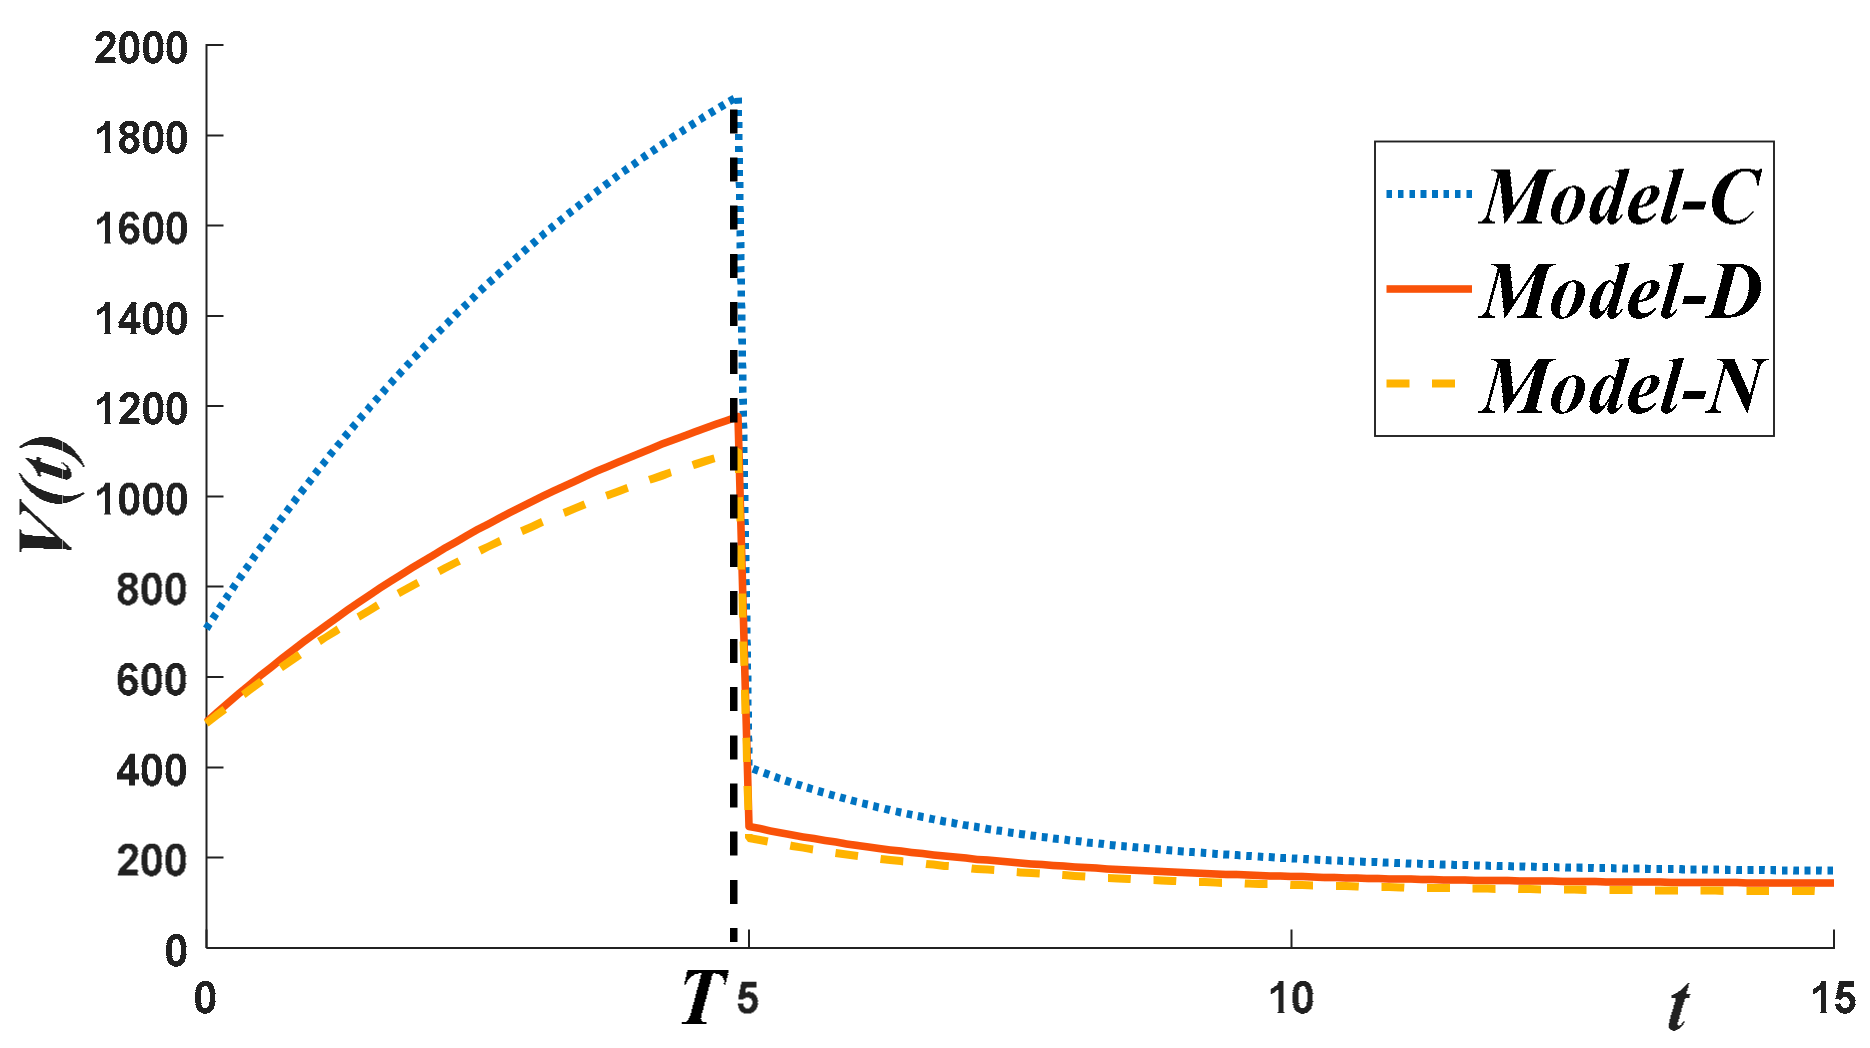
6.1. Analysis of the Impact of Different Decision Models and Time

Let χ = 0.2 denote the probability of a crisis and ϕ = 0.3 denote the damage rate of a crisis.
Figure 1 and Figure 2 represent the time trajectory of the low-carbon goodwill and the supply chain profits under the different decision-making models, respectively. In Figure 1, the relationship between the size of the steady-state low-carbon goodwill under different decision-making models is: Model- C > Model- D > Model- N . In addition, the occurrence of a crisis event reduces low-carbon goodwill but does not change the relationship between the size of the low-carbon goodwill under different models. Compared to the Model- N , the Model- D implemented by the LTA and the OTA promotes low-carbon goodwill, indicating that the Model- D can promote the Pareto improvement of low-carbon goodwill and is a feasible model for sustainable supply chain development. In Figure 2, the relationship between the size of supply chain profit under different decision-making models is: Model- C > Model- D > Model- N . The occurrence of crisis events reduces the total system profit but does not affect the relationship between the magnitude of the total system profit under different models. Compared with the Model- N , the Model- D improves the total system profit and contributes to the overall sustainable development of the supply chain. In the pre-crisis regime, the low-carbon goodwill increases over time because the optimal strategies of both supply chain members promote low-carbon goodwill to a greater extent than the natural decay of low-carbon goodwill. However, at a certain point in the crisis, the low-carbon goodwill declines instantaneously and decreases with time. The reason for this may be that the low-carbon goodwill after being damaged by the tourist attraction crisis event is greater than the steady state value of low-carbon goodwill in the post-crisis regime. In addition, the extent to which member decisions enhance the low-carbon goodwill is less than the extent to which the low-carbon goodwill naturally decays in the post-crisis regime. Therefore, the enhancement of the low-carbon goodwill after a crisis event in a tourist attraction requires greater investment in decision-making by both members in order to regain departed consumers and attract new ones.

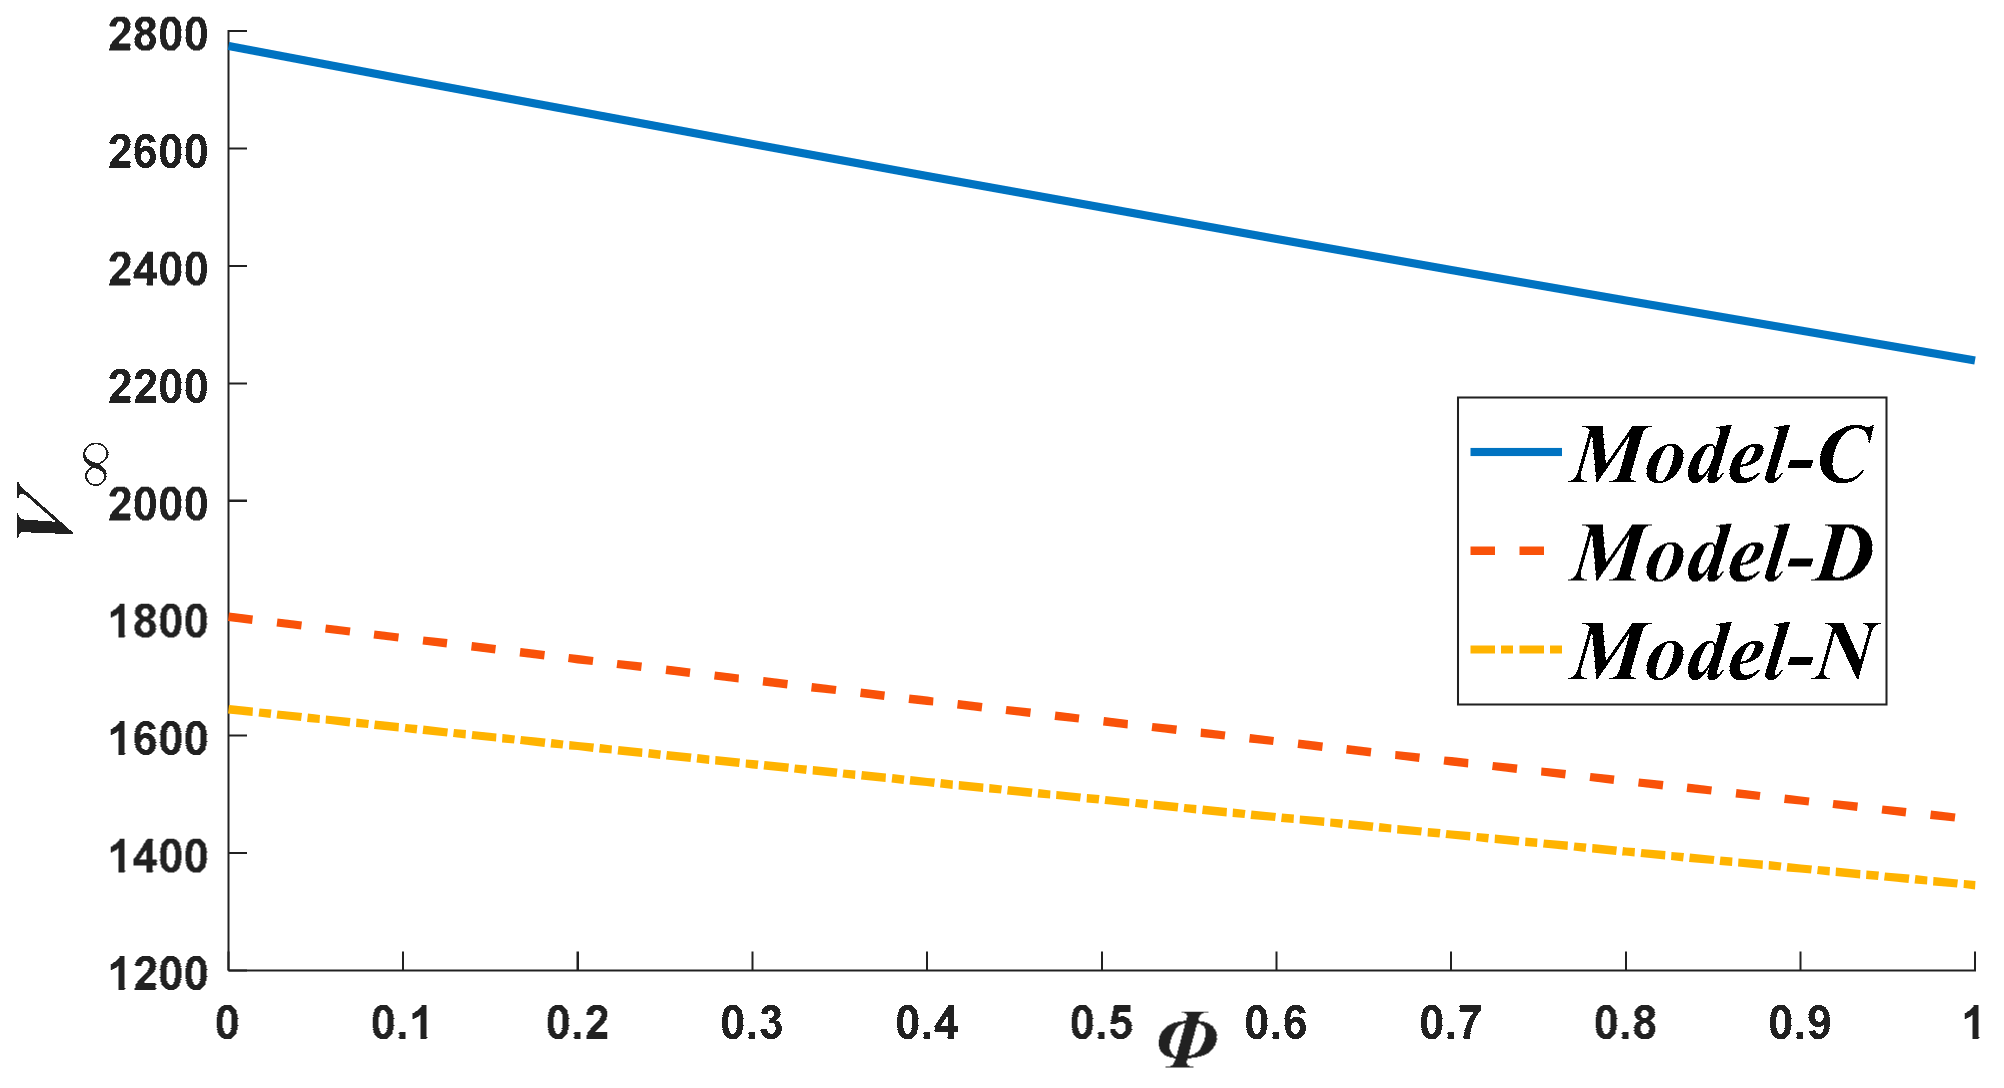
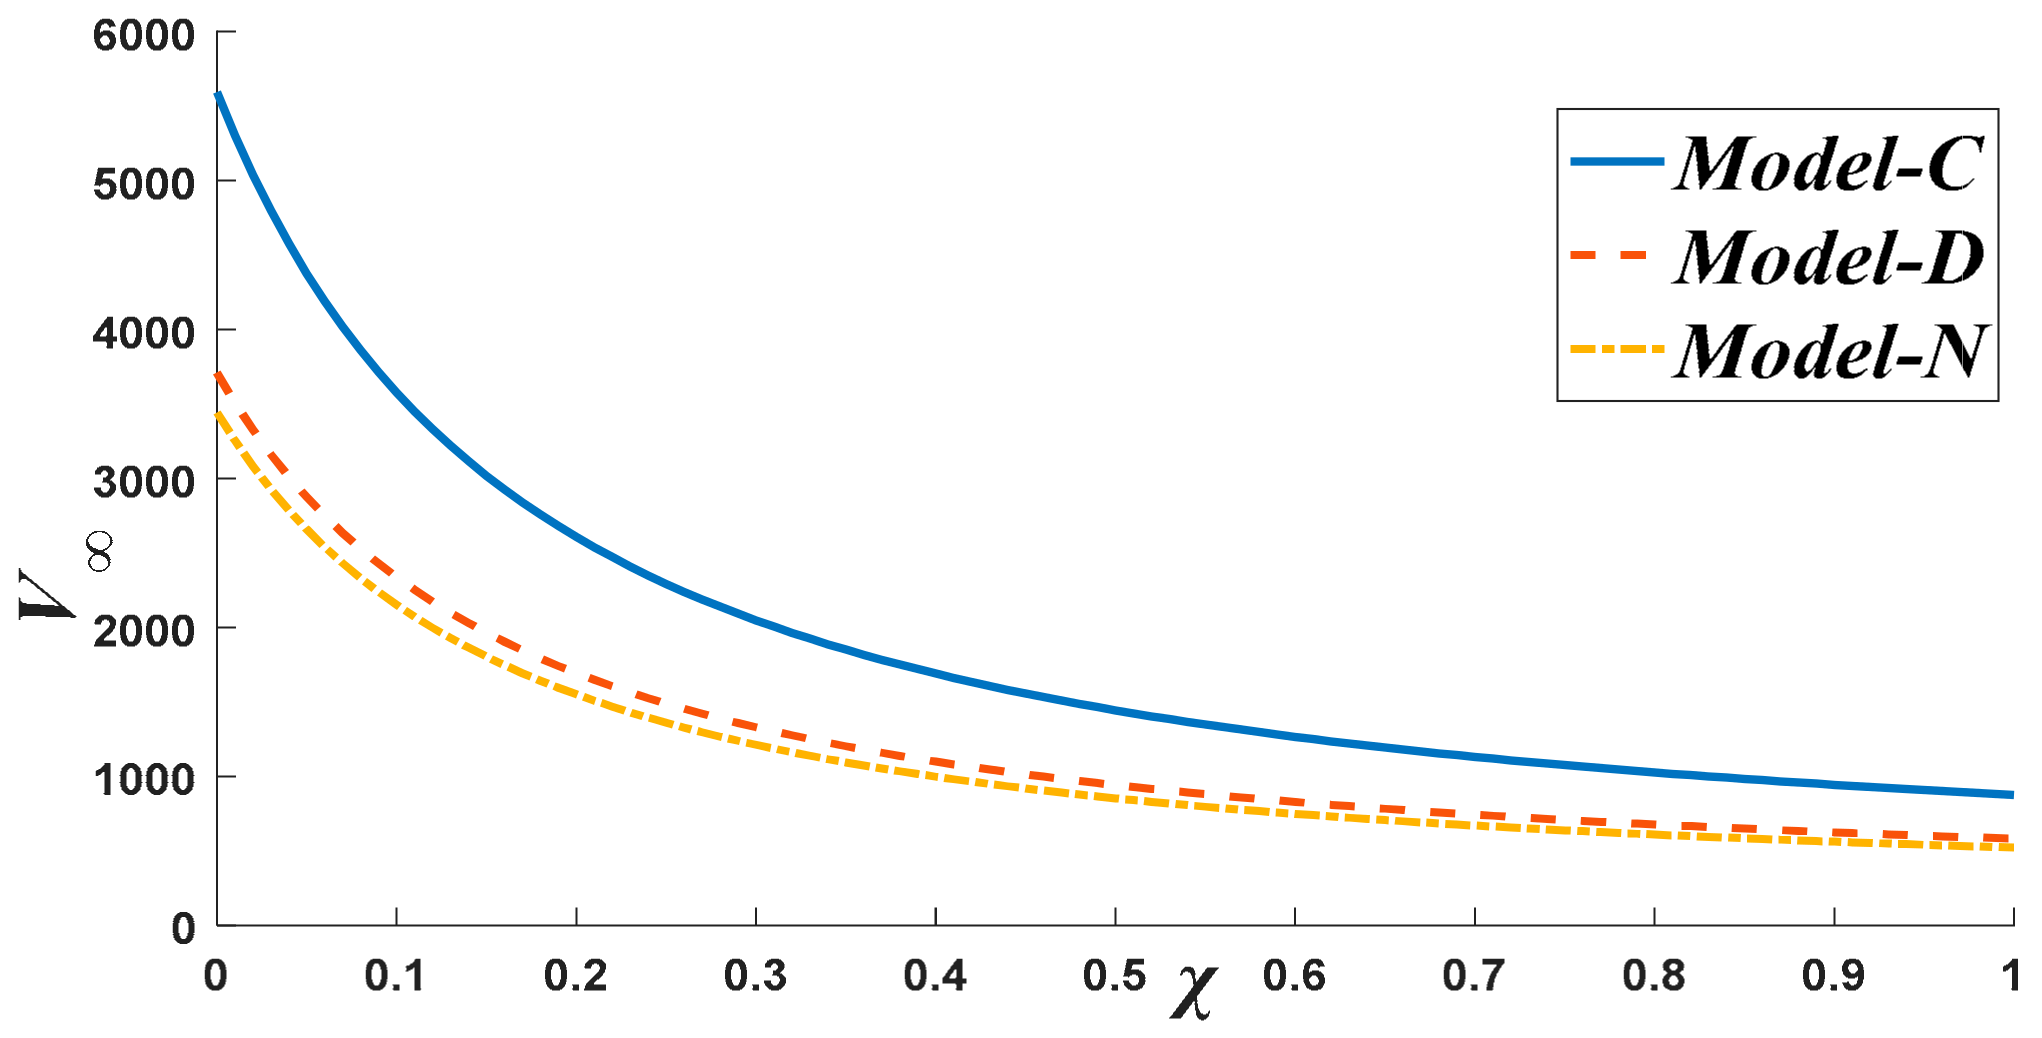
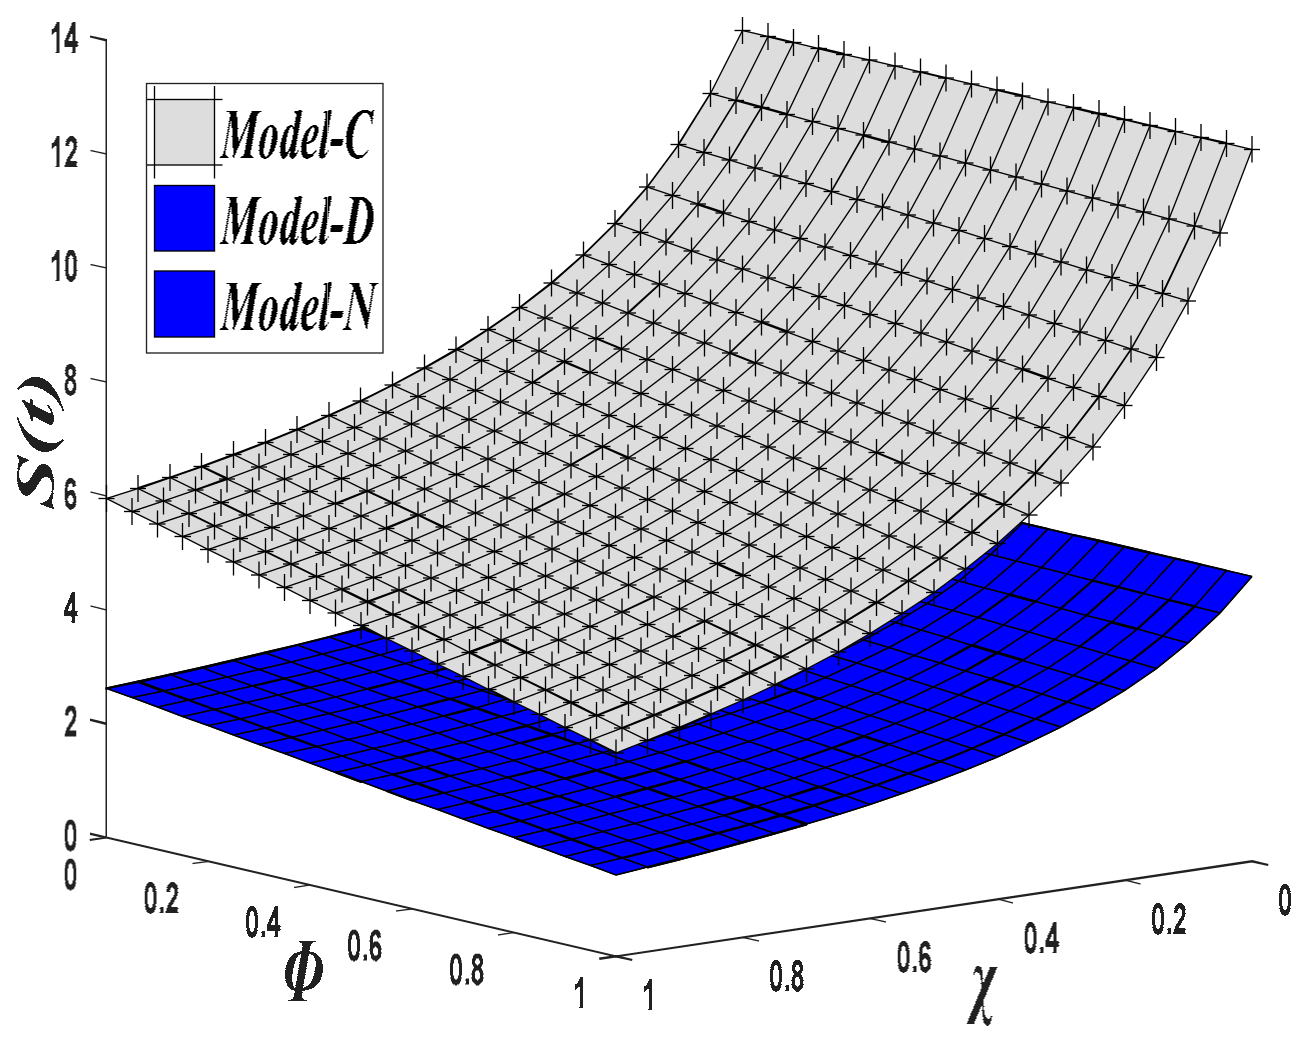
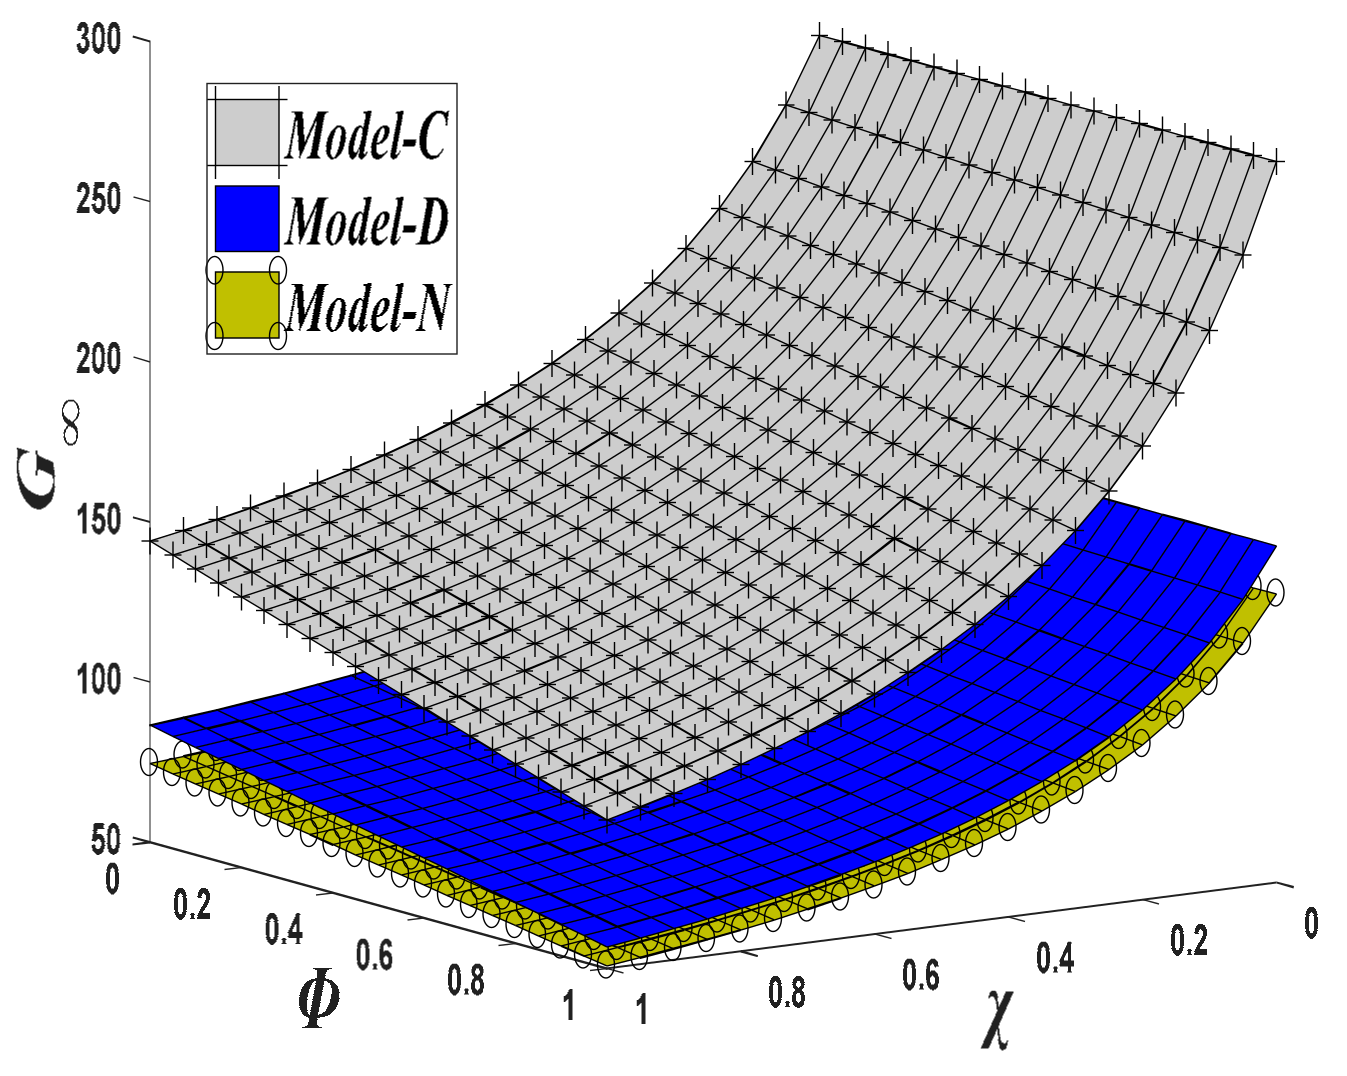
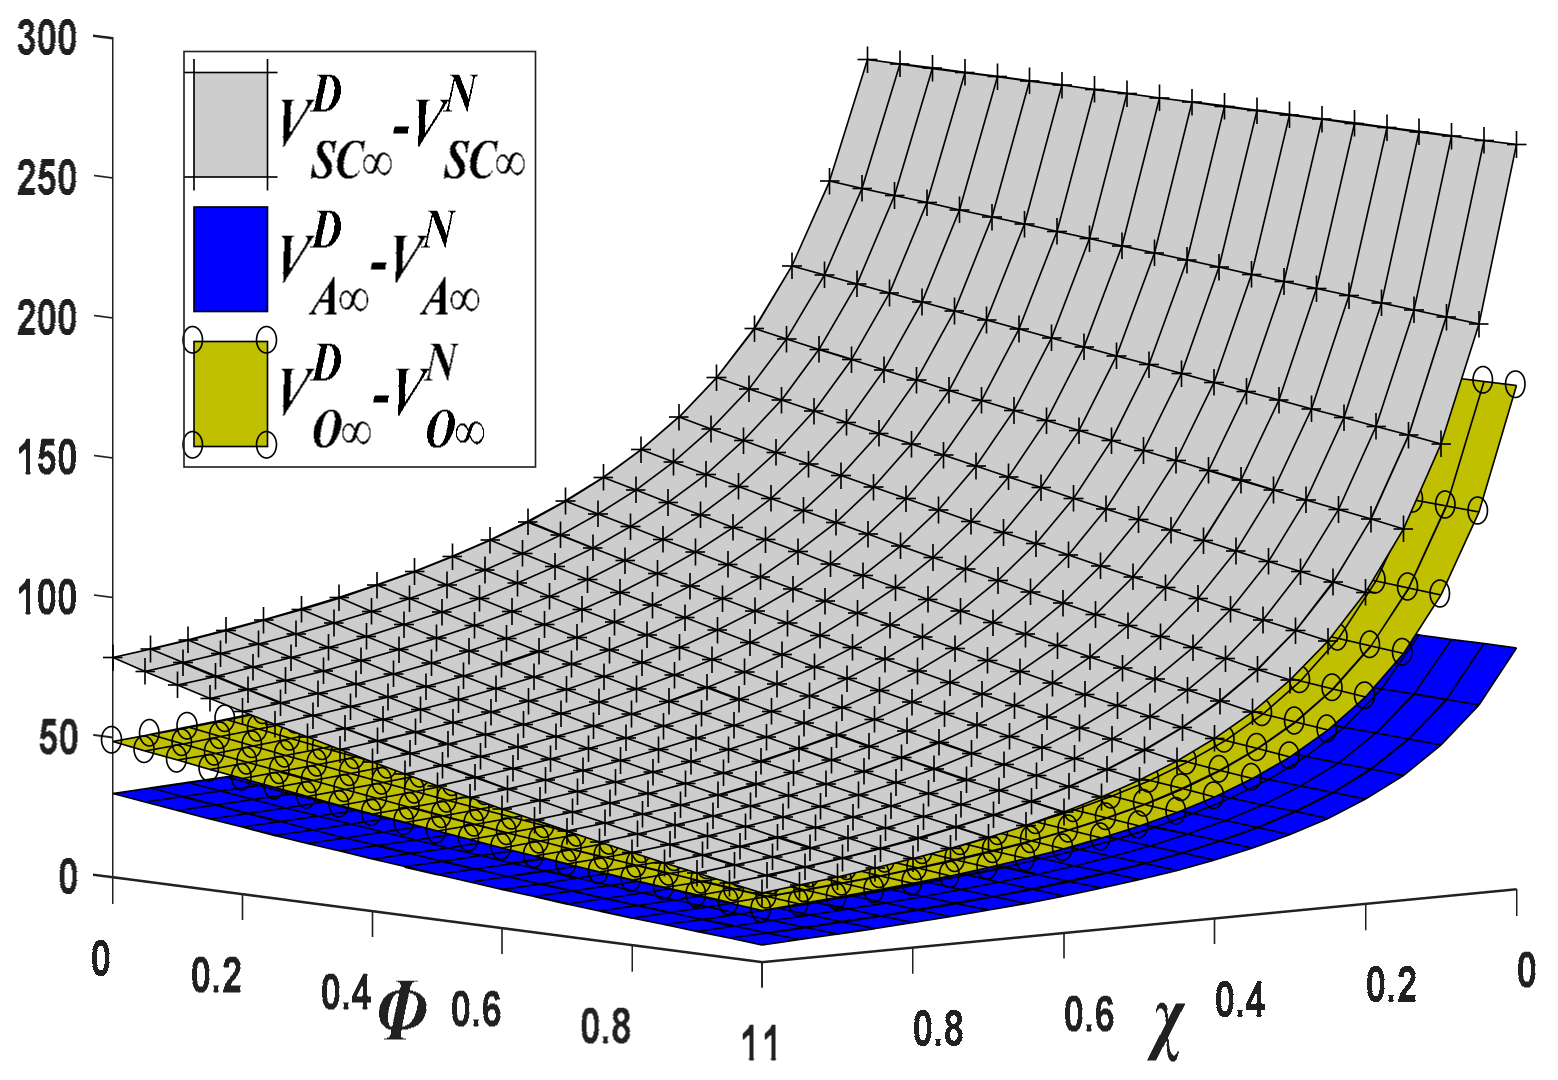
6.2. Effect Analysis of Crisis Event

Figure 3, Figure 4 and Figure 5 represent the impact of tourist attraction crisis events on low-carbon service, big data marketing and low-carbon goodwill, respectively. It can be seen that low-carbon service, big data marketing and the steady state low-carbon goodwill in all three decision-making models are negatively related to the likelihood of crisis occurrence and the crisis damage rate. In other words, both the level of members’ decision-making and the low-carbon goodwill decrease as the probability of a crisis and the rate of crisis damage increase, respectively. Moreover, the increase in the probability of a crisis event lessens the impact they suffer. That is, they are more affected by a crisis event when the probability of the crisis event is low, while they are decreasing but not changing much as the probability of the crisis increases. Therefore, the LTA and the OTA should consider the magnitude of the likelihood of future crisis events and the magnitude of the crisis damage rate when making decisions. In addition, crisis events cause a reduction in the steady state low-carbon goodwill, and the level of decision-making by members increases the steady state low-carbon goodwill. Therefore, if supply chain members can predict that a crisis event may occur in the tourist attraction in the future, they may first significantly reduce their own decision-making level before the crisis, and then gradually reduce their own decision-making level in order to prevent excessive input costs. In order to save the loss to the supply chain members caused by the reduction of low-carbon goodwill after the crisis, the low-carbon goodwill should be enhanced by increasing the decision-making input of members in the post-crisis regime, which will help to recover the lost consumers of tourist attraction, expand the tourism market demand and increase the profit of supply chain members.
Figure 6 and Figure 7 represent the impact of the crisis damage rate ϕ and the crisis probability χ on the total profit of the low-carbon tourism supply chain system, respectively. Figure 6 shows that in the low probability ( χ = 0.2 ) of a tourist attraction crisis event, the total system’s profits under all three decision-making models decrease with the increase of the crisis damage rate ϕ . The Model- D implemented by the LTA and the OTP is more affected by the crisis damage rate than the total system’s profit under the Model- N , but the Model- D is still conducive to the Pareto improvement of the supply chain system’s profits. Figure 7 shows that the total profits of the supply chain under all three decision-making models decrease as the probability of crisis increases at a low damage rate ( ϕ = 0.3 ) of tourist attraction crisis events. However, as the likelihood of a crisis increases, the impact on the system’s profits slowly decreases. In addition, the total system profit under the Model- D is subject to faster changes in crisis probability than the total system profit under the Model- N . Namely, the Pareto improvement in the total system’s profits under the Model- D is no longer significant as the crisis probability increases. Therefore, if the supply chain members can predict that a sudden crisis event will occur in a tourist attraction, they can consider the probability of crisis occurrence and the crisis damage rate to set the corresponding decision level. In this way, the corresponding low-carbon goodwill can be obtained to retain existing tourists and attract new consumers to visit low-carbon tourist attractions, which can help reduce the loss of profits of supply chain members.
Figure 8 represents the impact of crisis likelihood and crisis damage rate on the supply chain members and the system’s profitability. The Model- D promotes Pareto improvements in profits for both members compared to the Model-N. In this way, the LTA and the OTA are more willing to adopt a cost-sharing contract mechanism. However, if the OTA receives more profit from the cost-sharing cooperation compared to the LTA, then the OTA is more willing to take on this cost-sharing cooperation compared to the LTA. This cost-sharing cooperation mechanism among supply chain members is more adapted to the modern path of sustainable tourism development. Moreover, the Pareto improvement effects of low-carbon tourism supply chain members all decrease with the increase of crisis possibility and crisis damage rates. To put it differently, the sudden crisis event in the tourist attraction will reduce the benefits brought on by the cost-sharing cooperation among members, which reduces the Pareto improvement effect of the supply chain members’ and the system’s profits. However, this cost-sharing model among supply chain members is still a feasible solution for low-carbon tourism to achieve sustainable development.

7. Discussion and Conclusions

These final discussions and conclusions highlight the theoretical and methodological contributions relevant to the findings. The research is important for the sustainability of low-carbon tourism supply chains, especially for tourism companies to better develop pre-crisis strategies in anticipation of crisis events and for the long-term sustainability of cooperation among supply chain companies.

7.1. Discussion

The main purposes of this paper were to explore the issue of how low-carbon tourism firms develop strategies when they envision a crisis event and to consider the impact of the occurrence of a crisis event on interfirm cost-sharing cooperation. Therefore, we consider a low-carbon tourism supply chain consisting of a low-carbon tourist attraction and an online travel agency in the context of a possible crisis event in a tourist attraction. Unlike some of the previous studies that explored the impact of crisis events on specific tourist attractions, single types of tourist attractions or the coping strategies of tourist attractions, we introduced interesting studies on how the idea of supply chain management [48,49,50] into the study of low-carbon tourism is conducive to the sustainability of low-carbon tourism to explore the issue of intercompany cooperation.
Furthermore, the article uses differential games and Bellman’s continuous dynamic programming approach to take into account the current and future benefits of the decisions made by the enterprise at present. Compared with the one-time static game approach that only considers the current benefits [36,37,51], this approach takes the long-term profit maximization of the enterprise as the goal and considers the comprehensive impact of the current decisions of the enterprise on the current benefits and future returns, which is more conducive to the sustainability of the enterprise’s decisions on the supply chain. We also extend this approach to a two-stage game process (pre-crisis and post-crisis environments). We portray the effect of scenic crisis events on low-carbon goodwill using a jump process, i.e., portraying the continuous-type change pattern of low-carbon goodwill as no longer continuous. In addition, we extend the study of product sales volume [39] to the study of the low-carbon goodwill valued by consumers.
For the study of sudden crisis events, most address the issue of corporate response strategies after the crisis event [22,23,24,25,26,27]. However, there are also some studies that have taken this crisis faced by companies to avoid some crisis events by optimizing the supply chain under the condition that companies understand the existence of a specific crisis [52,53]. This approach to post-crisis strategy development and optimization of supply chain operations gives us new insights how companies should develop their own strategies to maximize their profits in the pre-crisis environment under the premise that if they envision a crisis event may occur.
In summary, this paper constructs a mathematical theoretical model of a possible crisis event in a low-carbon tourist attraction. We characterize the impact of the occurrence of a crisis event in a tourist attraction on the tourism supply chain by differential game and Bellman’s continuous dynamic planning theory. Our aim is to investigate the study of how tourism firms develop dynamic strategies if they envision the occurrence of crisis events and how crisis events affect interfirm cooperation. This is beneficial to help the sustainability of low carbon tourism supply chain.
Although our study has partial research implications on the issue of low-carbon development in the tourism supply chain and the response of related firms in anticipation of a scenic crisis, there are still some limitations that need to be addressed by future research. Firstly, the relationship between the interests of the supply chain members is not carefully portrayed in the article, and the marginal revenue is simply used to express this, which can be extended in future studies. Furthermore, the article only studied the online sales channel of low-carbon tourist attractions, but did not describe the offline channel, so future research can portray the sales method of tourist attractions more comprehensively. Finally, although the mathematical modeling approach utilized in the article is an advanced dynamic idea, more predictive methods can be utilized in the future to explore the impact of crisis events, such as the studies of [54,55].

7.2. Conclusions

This paper considers a low-carbon tourism supply chain consisting of a low-carbon tourist attraction and an online travel agency, considers the impact of the LTA’s low-carbon service and the OTA’s big data marketing on the low-carbon reputation of the scenic spot, in addition to the potential impact of the level of travel agency marketing and tourist attraction goodwill on the tourism market based on the initial demand of the tourism market. Consumers may also encounter sudden crisis events that occur in the tourist attraction during their visit, and the occurrence of crisis events can damage the low-carbon goodwill of the tourist attraction to the detriment of the sustainable development of the supply chain. Therefore, this paper aims to investigate how tourism firms can develop dynamic strategies in the pre-crisis environment if they envision the occurrence of a crisis event and how crisis events affect interfirm cooperation. This paper uses stochastic jump processes to portray the dynamic evolution of low-carbon goodwill in the context of crisis events and introduces the methods of a differential game and Bellman’s continuous dynamic programming theory to study the sustainable operations of a low-carbon tourism supply chain. The problem of developing low-carbon service strategies for the LTA and the big data marketing strategies for the OTA under a centralized decision-making model (Model- C ), a Nash non-cooperative decision-making model (Model- N ) and a cost-sharing decision-making model (Model- D ) is investigated. Using the method of comparative static analysis, we analyze the impact of key parameters on members’ decision making before and after the crisis in different models and compare the optimal member strategies, low-carbon goodwill and members’ and system profits in different models. Finally, we verify the previous results by numerical analysis, and analyze the impact of crisis events on members’ decision making, low-carbon goodwill and total system profits. Therefore, this paper explores the sustainability of low-carbon tourism supply chain in anticipation of scenic crisis from a dynamic perspective and summarizes the main conclusions and contributions as follows:
(1)
The occurrence of a sudden crisis event in a tourist attraction damages the optimal decision making of both members of the tourism supply chain, low-carbon goodwill, and the total profit of the members and the system. Members’ optimal strategy, low-carbon goodwill and members’ and system profits all decrease with increasing crisis likelihood and crisis damage rate. They are more influenced by the likelihood of a crisis than by the crisis damage rate. In addition, they become progressively less influential as the likelihood of a crisis increases. Therefore, if the supply chain members predict the occurrence of a crisis, they first significantly reduce their own decisions pre-crisis and gradually reduce the level of decisions as the possibility of the predicted crisis increases to reduce the loss of profits due to the waste of resources. In the post-crisis regime, tourism enterprises may enhance the lost low-carbon goodwill to recover lost consumers, which can help develop new tourism markets by improving decision making.
(2)
Big data marketing strategies, low-carbon goodwill and total system profit are the largest under the centralized decision-making model. Compared with the Nash non-cooperative decision-making model, the cost-sharing cooperation mechanism among supply chain members promotes the Pareto improvement of big data marketing strategies low-carbon goodwill and members’ and total system profits, but the low-carbon service level of the LTA remains unchanged. In addition, the relationship between their magnitudes under different models does not change in the regime before and after the occurrence of sudden crisis events, indicating that the cost-sharing model is still effective under the conditions of the existence of tourist attraction crisis. However, the occurrence of tourist attraction crisis events reduces the profit Pareto improvement effect of supply chain members.
(3)
The occurrence of sudden crisis events in a tourist attraction affects the formulation of the cost-sharing ratio among supply chain members. That is, when there is a crisis event in a tourist attraction, the formulation of the cost-sharing ratio no longer considers the size of individual member’s revenue alone but needs to consider the size of the impact factor of members’ decisions on the low-carbon goodwill and demand and also consider the possibility of crisis events and the size of the loss rate of goodwill. In addition, only under the condition ( π O 1 / π A 1 > π O 2 / π A 2 ) are the benefits gained by the OTA compared to the LTA before the crisis greater than the benefits gained after the crisis. The increased likelihood of a crisis event will facilitate the development of the sharing ratio. To put it another way, it will facilitate the cost-sharing cooperation among supply chain members to jointly respond to the crisis, which promotes the sustainable development of the low-carbon tourism supply chain. On the contrary, the increased loss rate of low-carbon goodwill will be detrimental to the cost-sharing cooperation among members.
In short, the LTA and the OTA should fully leverage big data technology for the accurate positioning of consumers to achieve accurate marketing and provide the services that consumers need to achieve sustainable economic development. In addition, although the tourist attraction crisis event will bring some negative impact to the low-carbon goodwill of the tourist attraction, it also brings some opportunities to tourism enterprises. The relevant enterprises in the low-carbon tourism supply chain should appropriately adjust their strategies to cope with the crisis when they anticipate a scenic crisis event, so as to minimize their own losses, protect the low-carbon image of the scenic area, retain consumers and achieve sustainable social and environmental development.

Author Contributions

Formal analysis, L.Z.; methodology, L.Z., D.M. and J.H.; supervision, D.M. and J.H.; writing—original draft, L.Z.; writing—review and editing, D.M. and J.H. All authors have read and agreed to the published version of the manuscript.

Funding

This research was funded by the National Natural Science Foundation of China with Grants Nos. 71771129.

Institutional Review Board Statement

Not applicable.

Informed Consent Statement

Not applicable.

Data Availability Statement

Not applicable.

Conflicts of Interest

The authors declare no conflict of interest.

Appendix A

Proof of Proposition 1.
Using the inverse induction method, we first calculate member decisions, low-carbon goodwill and member profits in the post-crisis regime, and then decide the optimal control problem for the entire planning period. □
Firstly, the game model for maximizing the profit of LTA and OTA in the post-crisis regime can be expressed as
max S 2 N J A 2 ( t ) = 0 e ρ t π A 2 D 20 + γ S 2 N ( t ) + θ G 2 ( t ) μ s 2 S 2 N ( t ) 2 dt max B 2 N J O 2 ( t ) = 0 e ρ t π O 2 D 20 + γ B 2 N ( t ) + θ G 2 ( t ) μ B 2 B 2 N ( t ) 2 dt s . t .   G ˙ 2 N ( t ) = α 2 S 2 N ( t ) + β 2 B 2 N ( t ) δ 2 G 2 N ( t ) , G 2 N ( T ) = ( 1 ϕ ) G 1 N ( T )
To obtain the feedback equilibrium solution of the Nash non-cooperative game, and the optimal decision is based on the current state and moment. Suppose there exists a continuous bounded differential functions W i N for LTA and OTA, and W i N = W i N / G 2 N denotes the first order derivative of the value function W i N of A and O with respect to the state variable G 2 N . For the sake of brevity, the independent variables t will be omitted from the solution process in the subsequent section. Thus, with the help of Bellman’s continuous dynamic programming theory [21], A and O satisfy the following Hamilton-Jacobi-Bellman (HJB) equation
ρ W A N = max S 2 N π A 2 D 20 + γ S 2 N + θ G 2 μ s 2 ( S 2 N ) 2 + W A N ( α 2 S 2 N + β 2 B 2 N δ 2 G 2 ) ρ W O N = max B 2 N π O 2 D 20 + γ B 2 N + θ G 2 μ B 2 ( B 2 N ) 2 + W O N ( α 2 S 2 N + β 2 B 2 N δ 2 G 2 )
For the right-hand side of Equation (A2), the optimal service level of LTA and the optimal big-data marketing level of OTA can be obtained from the first-order optimality condition, respectively
S 2 N = α 2 W A N μ s , B 2 N = γ π O 2 + β 2 W O N μ B
Next, substituting Equation (A3) into (A2) to construct their HJB equation
ρ W A N = ( θ π A 2 δ 2 W A N ) G 2 N + π A 2 D 20 + ( γ π A 2 + β 2 W A N ) ( γ π O 2 + β 2 W O N ) μ B + ( α 2 ) 2 ( W S N ) 2 2 μ s ρ W O N = ( θ π O 2 δ 2 W O N ) G 2 N + π O 2 D 20 + ( γ π O 2 + β 2 W O N ) 2 2 μ B + ( α 2 ) 2 W A N W O N μ s
According to the structure of Equation (A4), the optimal value functions of the two are respectively W A N = l 1 G 2 N + l 01 ; W O N = l 2 G 2 N + l 02 . Among them l 1 , l 01 , l 2 , l 02 are the constant coeffients of the value function. Substituting the value function and its first-order derivative into the above Equation (A4) and using the constant relationship to determine the constant coefficients to be determined.
l 1 = θ π A 2 ρ + δ 2 , l 01 = π A 2 D 20 ρ + 2 μ s π A 2 π O 2 [ γ ( ρ + δ 2 ) + θ β 2 ] 2 + μ O α 2 2 θ 2 π A 2 2 2 ρ μ s μ B ( ρ + δ 2 ) 2 l 2 = θ π O 2 ρ + δ 2 , l 02 = π O 2 D 20 ρ + μ s π O 2 2 [ γ ( ρ + δ 2 ) + β 2 θ ] 2 + 2 μ O α 2 2 θ 2 π A 2 π O 2 2 ρ μ s μ B ( ρ + δ 2 ) 2
Substituting Equation (5) into Equation (A3), the optimal strategy of members can be obtained, and combined with the differential equation of low-carbon goodwill, the optimal evolution path of low-carbon goodwill can be obtained, and then the optimal profits of members can be obtained.
Next, the optimal profits of supply chain members considering the entire planning period regime should be incorporated into the optimal profit of the post-crisis regime. Therefore, let V i denote the value function of supply chain member i under the whole planning period, then the differential game model of LTA and OTA over the whole planning period can be described as
max S 1 N J A 1 ( t ) = 0 e ( ρ + χ ) t π A 1 D 10 + γ B 1 N ( t ) + θ G 1 N ( t ) μ s 2 S 1 N ( t ) 2 + χ W A N ( 1 ϕ ) G 1 N ( t ) dt max B 1 N J O 1 ( t ) = 0 e ( ρ + χ ) t π O 1 D 10 + γ B 1 N ( t ) + θ G 1 N ( t ) μ O 2 B 1 N ( t ) 2 + χ W O N ( 1 ϕ ) G 1 N ( t ) dt s . t . G ˙ 1 N ( t ) = α 1 S 1 N ( t ) + β 1 B 1 N ( t ) δ 1 G 1 N ( t ) , G 1 N ( 0 ) = G 10
Therefore, the value function V i satisfies the following HJB equation
( ρ + χ ) V A N = max S 1 N π A 1 D 10 + γ S 1 N + θ G 1 N μ s 2 ( S 1 N ) 2 + χ W A N ( 1 ϕ ) G 1 N + V A N ( α 1 S 1 N + β 1 B 1 N δ 1 G 1 N ) ( ρ + χ ) V O N = max B 1 N π O 1 D 10 + γ B 1 N + θ G 1 N μ B 2 ( B 1 N ) 2 + χ W O N ( 1 ϕ ) G 1 N + V O N ( α 1 S 1 N + β 1 B 1 N δ 1 G 1 N )
For the right-hand side of Equation (A7), from the condition of first-order optimality, we get
S 1 N = α 1 V A N μ s , B 1 N = γ π O 1 + β 1 V O N μ O
Next, substituting Equation (A8) into (A7) to construct their HJB equation
( ρ + χ ) V A N = [ π A 1 θ + χ l 1 ( 1 ϕ ) V A N δ 1 ] G 1 N + π A 1 D 10 + ( γ π A 1 + β 1 V A N ) ( γ π O 1 + β 1 V O N ) μ B + α 1 2 ( V A N ) 2 2 μ s + χ l 01 ( ρ + χ ) V O N = [ π O 1 θ + χ l 2 ( 1 ϕ ) V O N δ 1 ] G 1 N + π O 1 D 10 + ( γ π O 1 + β 1 V O N ) 2 2 μ B + α 1 2 V A N V O N μ s + χ l 02
According to the structure of Equation (A9), the optimal value functions of the two are respectively V A N = l 3 G 1 N + l 03 ; V O N = l 4 G 1 N + l 04 . Among them l 3 , l 03 , l 4 , l 04 are the constant coeffients of the value function. Substituting the value function V A N , V O N and its first-order derivative into the above Equation (A9) and using the constant relationship to determine the constant coefficients to be determined.
l 3 = π A 1 θ ( ρ + δ 2 ) + χ ( 1 ϕ ) θ π A 2 ( ρ + χ + δ 1 ) ( ρ + δ 2 ) , l 03 = 1 ρ + χ π A 1 D 10 + γ π A 1 + β 1 l 3 γ π O 1 + β 1 l 4 μ P + α 1 2 ( l 3 ) 2 2 μ B + χ l 01 l 4 = π O 1 θ ( ρ + δ 2 ) + χ ( 1 ϕ ) θ π O 2 ( ρ + χ + δ 1 ) ( ρ + δ 2 ) , l 04 = 1 ρ + χ π O 1 D 10 + γ π O 1 + β 1 l 4 2 2 μ B + α 1 2 l 3 l 4 μ s + χ l 02
Finally, Substituting Equation (A10) into Equation (A8), the optimal decision of members can be obtained, and combined with the differential equation of low-carbon goodwill, the optimal evolution path of low-carbon goodwill can be obtained, and then the optimal profit of members can be obtained.

Appendix B

Proof of proposition 4.
According to the optimal service level of low-carbon tourist attraction in Propositions 1–3, we can obtain the size of the low-carbon service level in the pre-crisis regime is
S 1 C S 1 N = θ α 1 π O 1 ( ρ + δ 2 ) + θ α 1 π O 2 χ ( 1 ϕ ) μ S ( ρ + χ + δ 1 ) ( ρ + δ 2 ) > 0 .
Then, the low-carbon service industry in the post-crisis regime can also be obtained comparatively, and then the proof of this proposition can be obtained in this way. □
Proof of proposition 5.
Also available from propositions 1–3, a comparison of big-data marketing strategies in the pre-crisis regime are
B 1 C B 1 D = π O 1 ( ρ + δ 2 ) [ γ ( ρ + χ + δ 1 ) + θ β 1 ] + π O 2 θ β 1 χ ( 1 ϕ ) 2 μ B ( ρ + χ + δ 1 ) ( ρ + δ 2 ) > 0 ,
and
B 1 D B 1 N = ( 2 π A 1 π O 1 ) ( ρ + δ 2 ) [ γ ( ρ + χ + δ 1 ) + β 1 θ ] + ( 2 π A 2 π O 2 ) β 1 θ χ ( 1 ϕ ) 2 μ B ( ρ + χ + δ 1 ) ( ρ + δ 2 )
Therefore, the relationship between the level of big-data marketing for the cost-sharing decision-making model and the decentralized decision-making model depends on the size of ( 2 π A 1 π O 1 ) ( ρ + δ 2 ) [ γ ( ρ + χ + δ 1 ) + β 1 θ ] + ( 2 π A 2 π O 2 ) β 1 θ χ ( 1 ϕ ) . It can be seen that at π A 1 > π O 1 / 2 , π A 2 > π O 2 / 2 , it is possible to obtain B 1 D > B 1 N . Similarly, the relationship between the magnitude of big-data marketing levels, steady-state low-carbon goodwill, members and system profits in different decision-making models in the pre- and post-crisis regimes can be obtained separately and omitted here. □

References

  1. Zhang, J.; Zhang, Y. Assessing the low-carbon tourism in the tourism-based urban destinations. J. Clean. Prod. 2020, 276, 124303. [Google Scholar] [CrossRef]
  2. Seetaram, N.; Song, H.; Ye, S.; Page, S. Estimating willingness to pay air passenger duty. Ann. Tour. Res. 2018, 72, 85–97. [Google Scholar] [CrossRef]
  3. Chang, S.H.; Hernández-Díaz, R.J.; Lo, W.S. The impact of low-carbon service operations on responsible tourist behavior: The psychological processes of sustainable cultural tourism. Sustainablity 2020, 12, 4943. [Google Scholar] [CrossRef]
  4. Zhao, L.; Zha, Y.; Wei, K.; Liang, L. A target-based method for energy saving and carbon emissions reduction in China based on environmental data envelopment analysis. Ann. Oper. Res. 2017, 255, 1–24. [Google Scholar] [CrossRef]
  5. Wu, P.; Han, Y.; Tian, M. The measurement and comparative study of carbon dioxide emissions from tourism in typical provinces in china. Acta. Ecol. Sin. 2015, 35, 184–190. [Google Scholar] [CrossRef]
  6. Zha, J.; He, L.; Liu, Y.; Shao, Y. Evaluation on development efficiency of low-carbon tourism economy: A case study of hubei province, china. Soc. Econ. Plan. Sci. 2019, 66, 47–57. [Google Scholar] [CrossRef]
  7. Chen, Z.; Zhao, L.; Xu, J. Cooperative Strategies of Low-carbon Differential Game in Tourism Supply Chain in China. Tour. Trib. 2016, 31, 38–49. [Google Scholar]
  8. Cao, K.; Xu, X.; Wu, Q.; Zhang, Q. Optimal production and carbon emission reduction level under cap-and-trade and low carbon subsidy policies. J. Clean. Prod. 2017, 167, 505–513. [Google Scholar] [CrossRef]
  9. Lei, Y.; Ji, J.; Wang, M.; Wang, Z. The manufacturer’s joint decisions of channel selections and carbon emission reductions under the cap-and-trade regulation. J. Clean. Prod. 2018, 193, 506–523. [Google Scholar]
  10. Zhang, S.; Wang, C.; Yu, C.; Ren, Y. Governmental cap regulation and manufacturer’s low carbon strategy in a supply chain with different power structures. Comput. Ind. Eng. 2019, 134, 27–36. [Google Scholar] [CrossRef]
  11. Shi, Y.; Wu, B.; Chen, N.; Chen, A.; Li, H. Determination of effective management strategies for scenic area emergencies using association rule mining. Int. J. Disaster Risk Reduct. 2019, 39, 101208. [Google Scholar] [CrossRef]
  12. Fung, W.; Fung, R. The development of a supply chain model for tourism crisis management. In Proceedings of the 2014 IEEE International Conference on Management of Innovation and Technology (ICMIT), Singapore, 23–25 September 2014. [Google Scholar]
  13. Huang, W. On Low Carbon Tourism and Low Carbon Establishment of tourist attractions. Ecol. Econ. 2009, 11, 100–102. [Google Scholar]
  14. Wang, K.; Gan, C.; Ou, Y.; Liu, H. Low-carbon behaviour performance of scenic spots in a world heritage site. Sustainability 2019, 11, 3673. [Google Scholar] [CrossRef] [Green Version]
  15. Zhao, L.; Chen, Z.; Liu, J. Evolutionary Game Theory between Local Government and Tourism Enterprises in the Context of a Low-carbon Economy. Tour. Trib. 2015, 30, 72–82. [Google Scholar]
  16. He, P.; He, Y.; Xu, F. Evolutionary analysis of sustainable tourism. Ann. Tour. Res. 2018, 69, 76–89. [Google Scholar] [CrossRef]
  17. Saarinen, J. Understanding and governing sustainable tourism mobility: Psychological and behavioural approaches. Anatolia 2015, 26, 119–121. [Google Scholar] [CrossRef]
  18. Xu, F.; Fox, D. Modelling attitudes to nature, tourism and sustainable development in national parks: A survey of visitors in china and the UK. Tour. Manag. 2014, 45, 142–158. [Google Scholar] [CrossRef] [Green Version]
  19. Jinsoo, L.; Hsu, L.; Han, H.; Yunhi, K. Understanding how consumers view green hotels: How a hotel’s green image can influence behavioural intentions. J. Sustain. Tour. 2010, 18, 901–914. [Google Scholar]
  20. Chen, M.F.; Tung, P.J. Developing an extended theory of planned behavior model to predict consumers’ intention to visit green hotels. Int. J. Hosp. Manag. 2014, 36, 221–230. [Google Scholar] [CrossRef]
  21. Ma, D.; Hu, J.; Yao, F. Big data empowering low-carbon smart tourism study on low-carbon tourism o2o supply chain considering consumer behaviors and corporate altruistic preferences. Comput. Ind. Eng. 2021, 153, 107061. [Google Scholar] [CrossRef]
  22. Lu, L.; Navas, J. Advertising and quality improving strategies in a supply chain when facing potential crises. Eur. J. Oper Res. 2021, 288, 839–851. [Google Scholar] [CrossRef]
  23. Mukherjee, A.; Chauhan, S.S. The impact of product recall on advertising decisions and firm profit while envisioning crisis or being hazard myopic. Eur. J. Oper. Res. 2021, 288, 953–970. [Google Scholar] [CrossRef]
  24. Jang, S.; Kim, J.; Song, R. Advertising strategy and its effectiveness on consumer online search in a defaming product-harm crisis. Asia Pac. J. Mark. Logist. 2018, 30, 705–724. [Google Scholar] [CrossRef]
  25. Wang, G.; Liu, Y.; Yang, P.; Yang, R.; Zhang, H. Study on decision-making method for complex crisis. Syst. Eng. Pract. 2015, 35, 2449–2458. [Google Scholar]
  26. Liu, Y.; Shankar, V. The dynamic impact of product-harm crises on brand equity and advertising effectiveness: An empirical analysis of the automobile industry. Manag. Sci. 2015, 61, 2514–2535. [Google Scholar] [CrossRef] [Green Version]
  27. Wang, Y.; Song, L. Emergency management strategy and simulation analysis of supply chain emergencies. Stat. Dec. 2019, 35, 51–55. [Google Scholar]
  28. Shanfeng, H.U.; Wang, J.; Zhou, C.; Zhang, J. Research on the risk assessment and prevent to collapse disaster in huangshan scenic area. Geogr. Res. 2013, 32, 1814–1823. [Google Scholar]
  29. Li, J.; Liu, X.; Yao, X.; Liu, K.; Gong, G. The Situation, Challenges and Countermeasures of the Security Event Monitoring and Early Warning in the National Park—Based on the Research of Multi-source Information Integration Sharing. Sci. Tech. Devel. 2018, 14, 849–856. [Google Scholar]
  30. Zhao, C.; Wang, X.; Huang, X. Assessment of tourists’ rainstorm disaster risk perception under perspective of bounded rationality: A case study of nangongshan scenic. Ar. Res. Devel. 2018, 37, 120–124+137. [Google Scholar]
  31. Chutani, A.; Sethi, S. Dynamic cooperative advertising under manufacturer and retailer level competition. Eur. J. Oper. Res. 2018, 268, 635–652. [Google Scholar] [CrossRef] [Green Version]
  32. Li, X.; Lian, Z.; Choong, K.K.; Liu, X. A quantity-flexibility contract with coordination. Inter. J. Prod. Econ. 2016, 179, 273–284. [Google Scholar] [CrossRef]
  33. Modak, N.M.; Kazemi, N.; Cárdenas-Barrón, L.E. Investigating structure of a two-echelon closed-loop supply chain using social work donation as a corporate social responsibility practice. Inter. J. Prod. Econ. 2018, 207, 19–33. [Google Scholar] [CrossRef]
  34. Zhou, Y.J.; Bao, M.J.; Chen, X.H.; Xu, X.H. Co-op advertising and emission reduction cost sharing contract and coordination in low-carbon supply chain based on fairness concerns. J. Clean. Prod. 2016, 133, 402–413. [Google Scholar] [CrossRef]
  35. Bai, Q.; Chen, M.; Xu, L. Revenue and promotional cost-sharing contract versus two-part tariff contract in coordinating sustainable supply chain systems with deteriorating items. Inter. J. Prod. Econ. 2017, 187, 85–101. [Google Scholar] [CrossRef]
  36. Yang, H.; Chen, W. Retailer-driven carbon emission abatement with consumer environmental awareness and carbon tax: Revenue-sharing versus cost-sharing. Omega 2018, 78, 179–191. [Google Scholar] [CrossRef]
  37. Li, T.; Zhang, R.; Zhao, S.; Liu, B. Low carbon strategy analysis under revenue-sharing and cost-sharing contracts. J. Clean. Prod. 2019, 212, 1462–1477. [Google Scholar] [CrossRef]
  38. Di, X.; Jw, A.; Qla, B. Stimulating sustainability investment level of suppliers with strategic commitment to price and cost sharing in supply chain—Sciencedirect. J. Clean. Prod. 2020, 252, 119732. [Google Scholar]
  39. Rubel, O.; Naik, P.A.; Srinivasan, S. Optimal advertising when envisioning a product-harm crisis. Mark. Sci. 2011, 30, 1048–1065. [Google Scholar] [CrossRef]
  40. Nerlove, M.; Arrow, K. Optimal Advertising Policy Under Dynamic Conditions. Economica 1962, 29, 129–142. [Google Scholar] [CrossRef]
  41. Heerde, H.V.; De Kimpe, H.M.G. The impact of a product-harm crisis on marketing effectiveness. Manag. Sci. 2007, 26, 230–245. [Google Scholar] [CrossRef] [Green Version]
  42. Ma, D.; Hu, J. Research on collaborative management strategies of closed-loop supply chain under the influence of big-data marketing and reference price effect. Sustainablity 2020, 12, 1685. [Google Scholar] [CrossRef] [Green Version]
  43. Jia, Y.; Lin, D. The Impacts of Destination Quality on Tourist Satisfaction and Tourist Loyalty with Place Attachment as the Mediator and Gender as the Moderator. Tour. Sci. 2017, 31, 65–78. [Google Scholar]
  44. He, P.; He, Y.; Shi, C.; Xu, H.; Zhou, L. Cost-sharing contract design in a low-carbon service supply chain. Comput. Ind. Eng. 2020, 139, 106160. [Google Scholar] [CrossRef]
  45. Nair, A.; Narasimhan, R. Dynamics of competing with quality- and advertising-based goodwill. Eur. J. Oper. Res. 2006, 175, 462–474. [Google Scholar] [CrossRef]
  46. Zhao, L.; Li, C.; Guo, X. Research of cooperative relief strategy between government and enterprise based on differential game. Syst. Eng. Pract. 2018, 38, 885–898. [Google Scholar]
  47. Zu, Y.; Chen, L.; Yi, F. Research on low-carbon strategies in supply chain with environmental regulations based on differential game. J. Clean. Prod. 2018, 177, 527–546. [Google Scholar] [CrossRef]
  48. Kechagias, E.P.; Gayialis, S.P.; Konstantakopoulos, G.D.; Papadopoulos, G.A. An application of a multi-criteria approach for the development of a process reference model for supply chain operations. Sustainablity 2020, 12, 5791. [Google Scholar] [CrossRef]
  49. Yang, Y.; Wang, Y. Supplier selection for the adoption of green innovation in sustainable supply chain management practices: A case of the chinese textile manufacturing industry. Processes 2020, 8, 717. [Google Scholar] [CrossRef]
  50. Touboulic, A.; Mccarthy, L.; Matthews, L.; Ellram, L.; Carter, C.; Autry, C. Re-imagining supply chain challenges through critical engaged research. J. Supply Chain Manag. 2020, 56, 36–51. [Google Scholar] [CrossRef]
  51. Mu, Z.; Zheng, Y.; Sun, H. Cooperative Green Technology Innovation of an E-Commerce Sales Channel in a Two-Stage Supply Chain. Sustainablity 2021, 13, 7499. [Google Scholar] [CrossRef]
  52. Kechagias, E.P.; Gayialis, S.P.; Konstantakopoulos, G.D.; Papadopoulos, G.A. An application of an urban freight transportation system for reduced environmental emissions. Systems 2020, 8, 49. [Google Scholar] [CrossRef]
  53. Bullón Pérez, J.J.; Queiruga-Dios, A.; Gayoso Martínez, V.; Martín del Rey, Á. Traceability of Ready-to-Wear Clothing through Blockchain Technology. Sustainablity 2020, 12, 7491. [Google Scholar] [CrossRef]
  54. Paul, A.; Shukla, N.; Paul, S.K.; Trianni, A. Sustainable supply chain management and multi-criteria decision-making methods: A systematic review. Sustainablity 2021, 13, 7104. [Google Scholar] [CrossRef]
  55. Konstantakopoulos, G.D.; Papadopoulos, G.A.; Kechagias, E.P.; Gayialis, S.P. Traffic flow forecasting for city logistics: A literature review and evaluation. Int. J. Decis. Support. Syst. 2019, 4, 159. [Google Scholar] [CrossRef]
Figure 1. Time trajectory of low-carbon goodwill under different decision-making models.
Sustainability 13 08228 g001
Figure 2. Time trajectory of supply chain profits under different decision-making models.
Sustainability 13 08228 g002
Figure 3. Low-carbon service.
Sustainability 13 08228 g003
Figure 4. Big data marketing.
Sustainability 13 08228 g004
Figure 5. Low-carbon goodwill.
Sustainability 13 08228 g005
Figure 6. System steady state profits with crisis damage rate, ϕ .
Sustainability 13 08228 g006
Figure 7. System steady state profits with crisis probability, χ .
Sustainability 13 08228 g007
Figure 8. Impact of crisis event on Pareto improvement.
Sustainability 13 08228 g008
Table 1. Notation and definitions.
NotationDefinitions
χ The probability of crisis events in a tourist attraction
j The regime before or after a crisis event in tourist attraction ( j = 1 denotes the regime before the crisis, j = 2 denotes the regime after the crisis)
α j Impact factor of low-carbon service level on low-carbon goodwill in regime j , α j > 0
β j Impact factor of big-data marketing level on low-carbon goodwill in regime j , β j > 0
δ j Decay factor of product goodwill, δ j > 0
G 1 ( T ) Low-carbon goodwill just before the crisis event
G 2 ( T ) Low-carbon goodwill just after the crisis event
T The moment of crisis events
ϕ Loss rate of low-carbon goodwill (crisis damage rate), ϕ ( 0 , 1 )
μ s Cost factor of low-carbon service level, μ S > 0
μ B Cost factor of big data marketing level, μ B > 0
D j 0 Initial consumer demand for low-carbon tourist attractions in regime j , D j 0 > 0
γ Impact factor of big data marketing on consumer demand, γ > 0
θ Impact factor of low-carbon good will on consumer demand, θ > 0
π A The marginal benefits of LTA, π A > 0
π O The marginal benefits of OTA, π O > 0
ρ Discount rate, ρ > 0
Decision variables:
S ( t ) The level of low-carbon service of LTA at time t , the control variable of LTA
B ( t ) The level of big data marketing of OTA at time t , the control variable of OTA
State variable:
G ( t ) Low-carbon goodwill at time t
Table 2. Sensitivity analysis of key parameters in Model-N.
α 1 α 2 β 1 β 2 π A 1 π A 2 π O 1 π O 2 γ χ ϕ δ 1 δ 2
S 1 N
B 1 N
S 2 N
B 2 N
Note: ↗ indicates positive correlation, ↘ indicates negative correlation, — indicates irrelevant.
Table 3. Sensitivity analysis of key parameters in Model-D.
α 1 α 2 β 1 β 2 π A 1 π A 2 π O 1 π O 2 γ χ ϕ δ 1 δ 2
S 1 D
B 1 D
S 2 D
B 2 D
ψ 1 ******
ψ 2
Note: ↗ indicates positive correlation, ↘ indicates negative correlation, — indicates irrelevant, * indicates that it is determined on specific case.
Table 4. Sensitivity analysis of key parameters in Model- C .
α 1
α 2
β 1
β 2
π A 1
π A 2
π O 1
π O 2
γ
χ
ϕ
δ 1
δ 2
S 1 C
B 1 C
S 2 C
B 2 C
Note: ↗ indicates positive correlation, ↘ indicates negative correlation, — indicates irrelevant.
Publisher’s Note: MDPI stays neutral with regard to jurisdictional claims in published maps and institutional affiliations.

