1. Introduction
The climate change scenario requires the application of a set of actions capable of tackling ecological, social, and economic problems. Harmonizing the economic, social, and environmental dimensions is at the core of the 2030 Agenda and the Sustainable Development Goals (SDGs).
The perspective that will allow the development of a sustainable technological model is mainly connected with two SDGs. The first, SDG 7 (affordable and clean energy), aims to ensure universal access to affordable, reliable, and modern energy services. Therefore, its purposes include: substantially increasing the share of renewable energy in the global energy mix; improving international cooperation to facilitate access to clean energy research and technology; and widening infrastructure and upgrading technology for supplying modern and sustainable energy services for all nations, especially in developing countries. The second, SDG 9 (industry, innovation, and infrastructure), aims to build resilient infrastructures, to promote inclusive and sustainable industrialization and to encourage innovations. Its included targets aim to: modernize infrastructures and to retrofit industries for strengthening sustainability, with increased resource-use efficiency and greater adoption of clean and environmentally sound technologies and industrial process; intensify scientific research, for improving the technological capabilities of industrial sectors; and encouraging innovation and increasing the number of workers and R&D resources (public and private), particularly in developing countries [
1].
The preview targets in two SDGs are interconnected to the purposes of eco-innovations (EIs). The EIs follow practically the same features as general innovations—products, processes, and organizational techniques, which can be new to a market or company—but with the differential of reducing the environmental risks throughout its life cycle [
2,
3,
4].
In discussions about technological changes, there are high expectations regarding the potential of green technologies [
5,
6,
7] and the competitive advantages of EIs [
8]. Investment targeting renewable energies, biotechnologies, and more technically and ecologically efficient products and processes is key to a new technological model [
9,
10,
11]. In this respect, it is worthwhile to note that the principal economic policies today are closely tied to sustainable development, such as the European Green Deal in the European Union or the Green New Deal in the United States. In line with this paradigm shift in technology, development opportunities also arise for developing countries, specifically, in Latin America [
12,
13].
At the same time, there are challenges, especially for developing countries [
14]. In the case of Brazil, the transition to a green economy and the encouragement of EIs has outlines that are well delineated to that of a developing country, requiring, above all, technological, financial, and institutional efforts. The ideal path presupposes that the country can promote structural change that increases productivity in a socially inclusive [
15] and environmentally sustainable manner. However, in fact, this nation has provided a dual response to this situation in terms of government and public policy in innovation [
16]. On the one hand, Brazilian innovation systems have some strengths built on the existence of all the components of a significant innovation system, for example, educational, research and regulation subsystems are important for our purposes here, the strategic natural resources, such as land, mineral and water supplies as well as biodiversity from land and maritime biomes. On the other hand, there are key system weaknesses, such as the frequent negative macroeconomic interventions in innovative productive activities and, perhaps the most critical, the absence of a consistent long-term vision or agenda, i.e., fragmentation and discontinuity in public policies and institutional configurations, that give direction and coherence to scientific research and public and private innovation efforts.
In this context, an important question is how developing countries, such as Brazil, have responded to the transition to a more sustainable development model. To illuminate this issue, the analysis combined elements of innovation, production and environmental protection from a sectorial perspective. The study examined specific EI data—drivers and effects—in Brazilian companies, considering two delimitations. The first concerns the identification of the group of eco-innovative companies, through the application of a specific selection criterion, directing the analysis to innovative companies that observed an environmental benefit from their generated innovation. The second delimitation relates to the sectorial profile, namely, the extractive and manufacturing sectors. The database is from the latest edition of Pintec (Pesquisa de Inovação), 2015–2017, which included specific issues about EIs for the first time.
Thus, the objective of this paper was to provide an overview of eco-innovations in Brazilian industry. Therefore, a comparative profile of two groups of companies (eco-innovators and innovators) was elaborated and, in the case of eco-innovators, the drivers and impacts of eco-innovations were analyzed. We believe that analyzing eco-innovative companies, especially in developing countries, is extremely relevant for challenges of the 2030 Agenda. The panorama of EIs in Brazilian extractive and manufacturing sectors indicated that the eco-innovative companies represent just over a third of the innovators. In general, these companies show a greater effort to innovate when compared to other innovators [
17,
18]. Associated with this greater commitment, eco-innovators demonstrate a greater perception of the benefits generated by innovation. Likewise, they also exhibit greater sensitivity to its obstacles. The analysis of drivers and impacts allowed us to enrich this profile, highlighting some central elements of environmental innovations, such as the fact that EIs in the Brazilian extractive and manufacturing activities are mainly induced by market factors, and that environmental regulations are not part of the most relevant determinants. Moreover, the most recurrent effects are related to the use of more widespread and less complex technologies, such as the recycling of materials, waste, and wastewater [
19].
The article is structured as follows:
Section 2 is dedicated to the theme of EI, with an emphasis on drivers and the effects that environmental innovation potentially generates.
Section 3 describes the methodology, in particular, the selection criteria, of the companies and the elaboration of the graphic elements of analysis.
Section 4 focuses on results, with special attention to information from Pintec sustainability and the EI set.
Section 5 discusses the main findings. Finally,
Section 6 concludes by indicating possibilities to guide innovation policy, especially regarding eco-innovations in semi-peripheral countries.
2. Literature Review
For a long time, environmental protection actions were seen as an impediment to the economy, reinforcing the existence of a permanent trade-off between these two dimensions. Although the attachment to this idea is still manifested, technological advances and institutional conduct strategies (government, companies, civil society, NGOs, etc.) already allow us to make viable alternative and sustainable models of production and consumption for which EIs and green technologies are crucial.
In this direction, the proposition of Porter and Line [
20] was a precursor in demonstrating that pollution was equivalent to inefficiency. When analyzing some sectors that were strongly influenced by environmental regulations, they found that the adoption of innovations and other factors that promote competitiveness allowed companies to reduce costs with environmental actions. Among other aspects, environmental standards were able to indicate inefficiencies, encouraging new solutions; sensitize companies about their production processes; reduce uncertainty about investments for environmental improvement; and pressure companies to eco-innovate [
20].
Technological innovation policies play a primary role for the purposes of sustainable development. Therefore, the substitution of unsustainable production methods and consumption patterns by innovations capable of mitigating impacts on the environment is part of a broader context of technological evolution [
21]. Thus, it is especially important that innovation and sustainability are developed together, as the needs foreseen in the meaning of sustainable development are dynamic and, consequently, susceptible to changes in the current context [
22].
The concept of EI adopted in this analysis is from the report
Measuring ECO-innovation: “[…] the production, assimilation or exploitation of a product, production process, service or management or business method that is novel to the organization (developing or adopting it) and which results, throughout its life cycle, in a reduction of environmental risk, pollution and other negative impacts of resources use (including energy use) compared to relevant alternatives.” [
2] (p. 7).
Thus, a company can become an eco-innovator when it applies environmental technology, e.g., by developing equipment or processes that use inputs in a sustainable and efficient manner and/or reduces the effects of production on the most varied natural ecosystems. The manufacture of “green” products, the shared use of goods and the creation of environmental innovation systems, combining production and consumption to reduce impacts on the environment—such as organic products and renewable energies—are other examples. Another strategy is to adopt managerial or organizational methods, such as environmental management and certification systems, and prevention and cooperation programs, with other entities aimed at reducing the environmental impact [
2,
4].
A particular characteristic of EIs is the presence of the problem of double externality. As with in innovations in general, there are market failures due to knowledge externalities; in EIs, there are also failures attributed to the environmental benefits generated, which increases the risk, discouraging the development of EIs [
23,
24]. Therefore, the application of environmental standards is essential to encourage EIs and to reduce the double externality for companies that develop innovations.
As highlighted, our focus in this study was the impacts and drivers of EIs. In relation to the effects, or impacts, of EIs, these are commonly associated with the notion of performance. Studies that analyze impacts emphasize both the results directly perceived in the environment—for instance, the replacement or more efficient use of energy and inputs, and the reduction in contamination in soil, water, and air—and others of economic character, such as financial performance, competitiveness, and market value [
25,
26,
27,
28].
In addition, there is a classification that links the impacts of EIs to a kind of innovation. The effects of product EIs refer to improving the recycling of products after use; reducing energy consumption; and reducing emissions in water, soil, and noise. The impact of process EIs corresponds, in addition to the last two products’ effects, to the reduction in materials per product unit; the decrease in energy use per product unit; the decrease in CO
2 and other pollutants in the air; recycling waste, water or materials; and replacing hazardous substances [
8].
The factors that induce companies to seek solutions to reduce their environmental impact, either reactively or proactively [
25,
27], are among the most analyzed aspects in the literature [
26,
29].
To analyze the drivers of EIs, we adopted the theory of environmental innovation [
17], which includes both general aspects of innovations and particular aspects of EIs. Just as Horbach [
8,
17] and Triguero et al. [
30], we categorized the determinants into three main groups: supply-side factors, demand-side factors, and institutional and political influences of an environmental characteristic. While the first two groups are widely known in innovation studies, the third—environmental and policy influences—is specific to EIs [
31,
32].
Hence, based on the factors listed by the theory of environmental innovation [
17], it was possible to associate in each group of determinants the drivers present in the special survey by Pintec (
Table 1). Pintec listed nine specific factors that contributed to the company’s eco-innovation decision.
The supply side factors are those related to the technological capabilities available for the company to innovate [
33]. As with innovations in general, the factors correspond to the company’s technological and organizational capabilities [
17,
34]; the cooperative relations with suppliers, research institutes, agencies and universities [
8,
30,
32,
35,
36]; the access to external information and knowledge [
35,
36]; and the access to subsidies and fiscal incentives [
31]. Other factors related to the supply-side are energy and material cost-saving strategies [
8,
34,
37].
In turn, demand-side elements highlight market forces as the main determinants of technical change and, therefore, of stimulating (eco)innovations [
33]. Among the main factors, the market pull is the possibility of expanding market share [
8,
17,
38]; the increased market demand for green products and eco-label adoption strategies [
15,
39,
40]; and the social awareness actions of the need for clean production [
26,
38], such as voluntary actions or codes of good practice, mainly resulting from pressure from stakeholders and consumers [
22,
31,
34]. In particular, the institutional pressure can trigger a technological change within the company and therefore redirect R&D efforts for projects related to the environment [
41].
A specificity of the determinants related to environmental regulation is the notion of regulatory pull/push. The empirical verification shows that the regulatory structure and environmental policy generates significant effects on EIs. This is due to the fact that these, unlike those in the fields of microelectronics or telecommunications, are not self-applicable; that is, the factors of market pull and technology push are not strong enough to develop them. Therefore, EIs need specific regulatory support, capable of inducing (pull) and boosting them (push) [
23]. In this group of drivers, there are environmental standards and regulations, including the expectation of stricter future standards; environmental taxes and duties; and indirect instruments, such as the imposition of requirements for public procurement. It is worth mentioning that the effects of environmental regulation of the development of EIs is among the main topics in the analysis of environmental innovation drivers [
8,
18,
20,
22,
31,
37,
42].
3. Material and Methods
The research was structured in two stages (
Figure 1). The first focused on the selection criteria for eco-innovative companies. A significant part of quantitative studies on innovation uses surveys, such as the Community Innovation Survey (European Union) or Business R&D and Innovation Survey (United States). In particular, the surveys are a relevant base of information about drivers of EIs [
8,
15,
43]. In the case of Brazil, the most well-known base of innovation statistics is Pintec, from the Instituto Brasileiro de Geografia e Estatística (IBGE). Pintec is a sample survey, conducted over a three-year period, and applied to companies with more than 10 employees belonging to the sectors of industry, electricity and gas, and selected services [
44]. In addition to contemplating the unprecedented information from the last Pintec about the drivers and impacts of EIs, the objective of this study was to specifically analyze eco-innovative companies. To this end, questions related to the theme of innovation and the environment were identified in the general questions block. The question chosen to differentiate companies between innovators and eco-innovators was Nº 105, which asks about the effects of product and process innovations in reducing the impacts on the environment [
44,
45]. In this question, companies must manifest this effect, indicating one of four levels of importance: high, medium, low, and not relevant. The issue, as proposed in some studies [
8,
17,
18,
46,
47], is a measure of environmental performance and, therefore, a proxy to differentiate eco-innovative companies from others.
Nevertheless, it is pertinent to make two brief considerations about the data. However, the survey also probes about the reduction in the consumption of other inputs (energy, water, and materials); this effect results much more often from cost saving, rather than from an initial guideline of environmental conduct [
2,
47]. Another point is the bias present in approaches on the environmental impact. The responses of companies may be subject to corporate rhetoric and, consequently, may be overestimated [
48].
Based on the definition of the criteria for identifying eco-innovative companies, two databases were requested: one formed by innovative companies that declared “high” or “medium” importance in reducing the impact on the environment, hereinafter identified as ECO, and another composed of companies that answered “low” or “not relevant” relevance, identified as INO. The objective here was to draw a comparative profile between ECO and INO, based on a selection of variables from Pintec’s general block, which were considered relevant for the purpose of the investigation. Data were derived from the extractive and manufacturing sectors, for the period 2015–2017.
The second stage involved the development of cluster heatmaps to examine information from the special EI set. The cluster heatmap statistical tool was developed computationally by Galili et al. [
49], using the R language [
50]. In simple terms, the method is applied to large data matrices, for viewing patterns and creating dendrograms for the definition of clusters.
The heatmap cluster method is based on the application of an algorithm, which provides a structure in a series of clusters, and clusters of clusters, of data examination. In other words, unlike other clustering methods, here the algorithm determines the number of clusters. These algorithms can follow different logics, the most common is hierarchical cluster analysis (HCA). This logic combines objects that are closest to each other until all objects are joined in one single cluster, which will be separated from other furthest objects. To analyze which drivers and impacts were more (or less) important for eco-innovative companies of different sectors, we applied the “complete linkage” method (for HCA) to calculate distances between aggregates (or dissimilarity between clusters). This method determines the distance (or dissimilarity) between two clusters as the distance between the furthest two objects from each cluster. Thus, the ordering method allows similar rows (or columns) to be placed together in the graph. The “complete linkage” method results in compact and homogeneous clusters [
51], which we consider adequate for our study.
For the construction of these clusters, two questions from Pintec were selected: Nº196, which asked companies to highlight the factors that contributed to their decision to introduce innovations that would generate environmental benefits, and Nº105 (sub-items 1 to 5), which requested companies to indicate the relevance of the impact on the environment of the innovations implemented. For these sub-items, only “high” or “medium” graduations were considered.
The heatmap method is performed in three phases [
49,
51]: treatment of the data matrix; definition of similarity; and determination of the serialization of rows and columns matrix (dendrogram). The first concerns the organization of data. In this phase, two matrices of standardized data in “z” scores were composed by economic activity (two sections and 24 NACE divisions). As the number of companies in the sample is highly varied between activities, it was necessary that the data be standardized. Thus, the matrices were as follows: EI drivers, composed of 10 EI inducers and 26 economic activities, and EI impacts, formed by 5 observed effects and 26 economic activities (
Figure 2). In the second, the type of similarity between the observations in each cell (row and column) was defined. In the third and last phases, the ranking of the data in the rows and columns was determined. Furthermore, the ordering of the data (scale) was carried out according to its distribution in the columns. Therefore, the colors and the order of the observations were distributed to highlight the sectors that had the highest values in each variable.
4. Results
As highlighted in the concept of EI, environmental innovation occurs within the company and follows the characteristics of innovations in general, except for the positive effect it has on the environment. In this sense, according to the guidelines of the Oslo Manual [
52] applied at Pintec [
44], (eco)innovation corresponds to any product, process, or organizational form that is new to the company, even if it is known in the market. This section has two objectives: to draw a comparative profile between the ECO and INO companies, and to examine the drivers and impacts of EIs on ECOs.
4.1. Comparative Profile of ECO and INO Companies
The last edition of Pintec surveyed 39,329 innovative companies (all economic sectors covered by the survey); out of these, 13,365 (34.0%) said that innovation allowed them to reduce the environmental impact with “high” and “medium” importance. In extractive activity, there were 143 eco-innovative companies, while in manufacturing, there were 12,334 [
45].
As shown in
Table 2, the rates of innovation—total and sectorial—for ECOs were lower, as expected, since they represent a little more than a third of innovative companies. However, when analyzing the rate of innovative intensity (the ratio between the amount spent on innovation activities and the company’s current net revenue), a slightly higher effort is observed in the ECOs, mainly in-house R&D activities [
18,
42,
53]. As EIs represent a very dynamic field in which knowledge is rapidly changing, it is observed that R&D activities, as well as cooperation with research centers and universities, are more important compared to other innovations without environmental benefits [
35,
37,
53,
54,
55]. Furthermore, as EIs, particularly products and processes, are characterized by a high degree of innovation, the cost of new equipment, software, and marketing activities is more relevant when compared to other innovations [
8,
54].
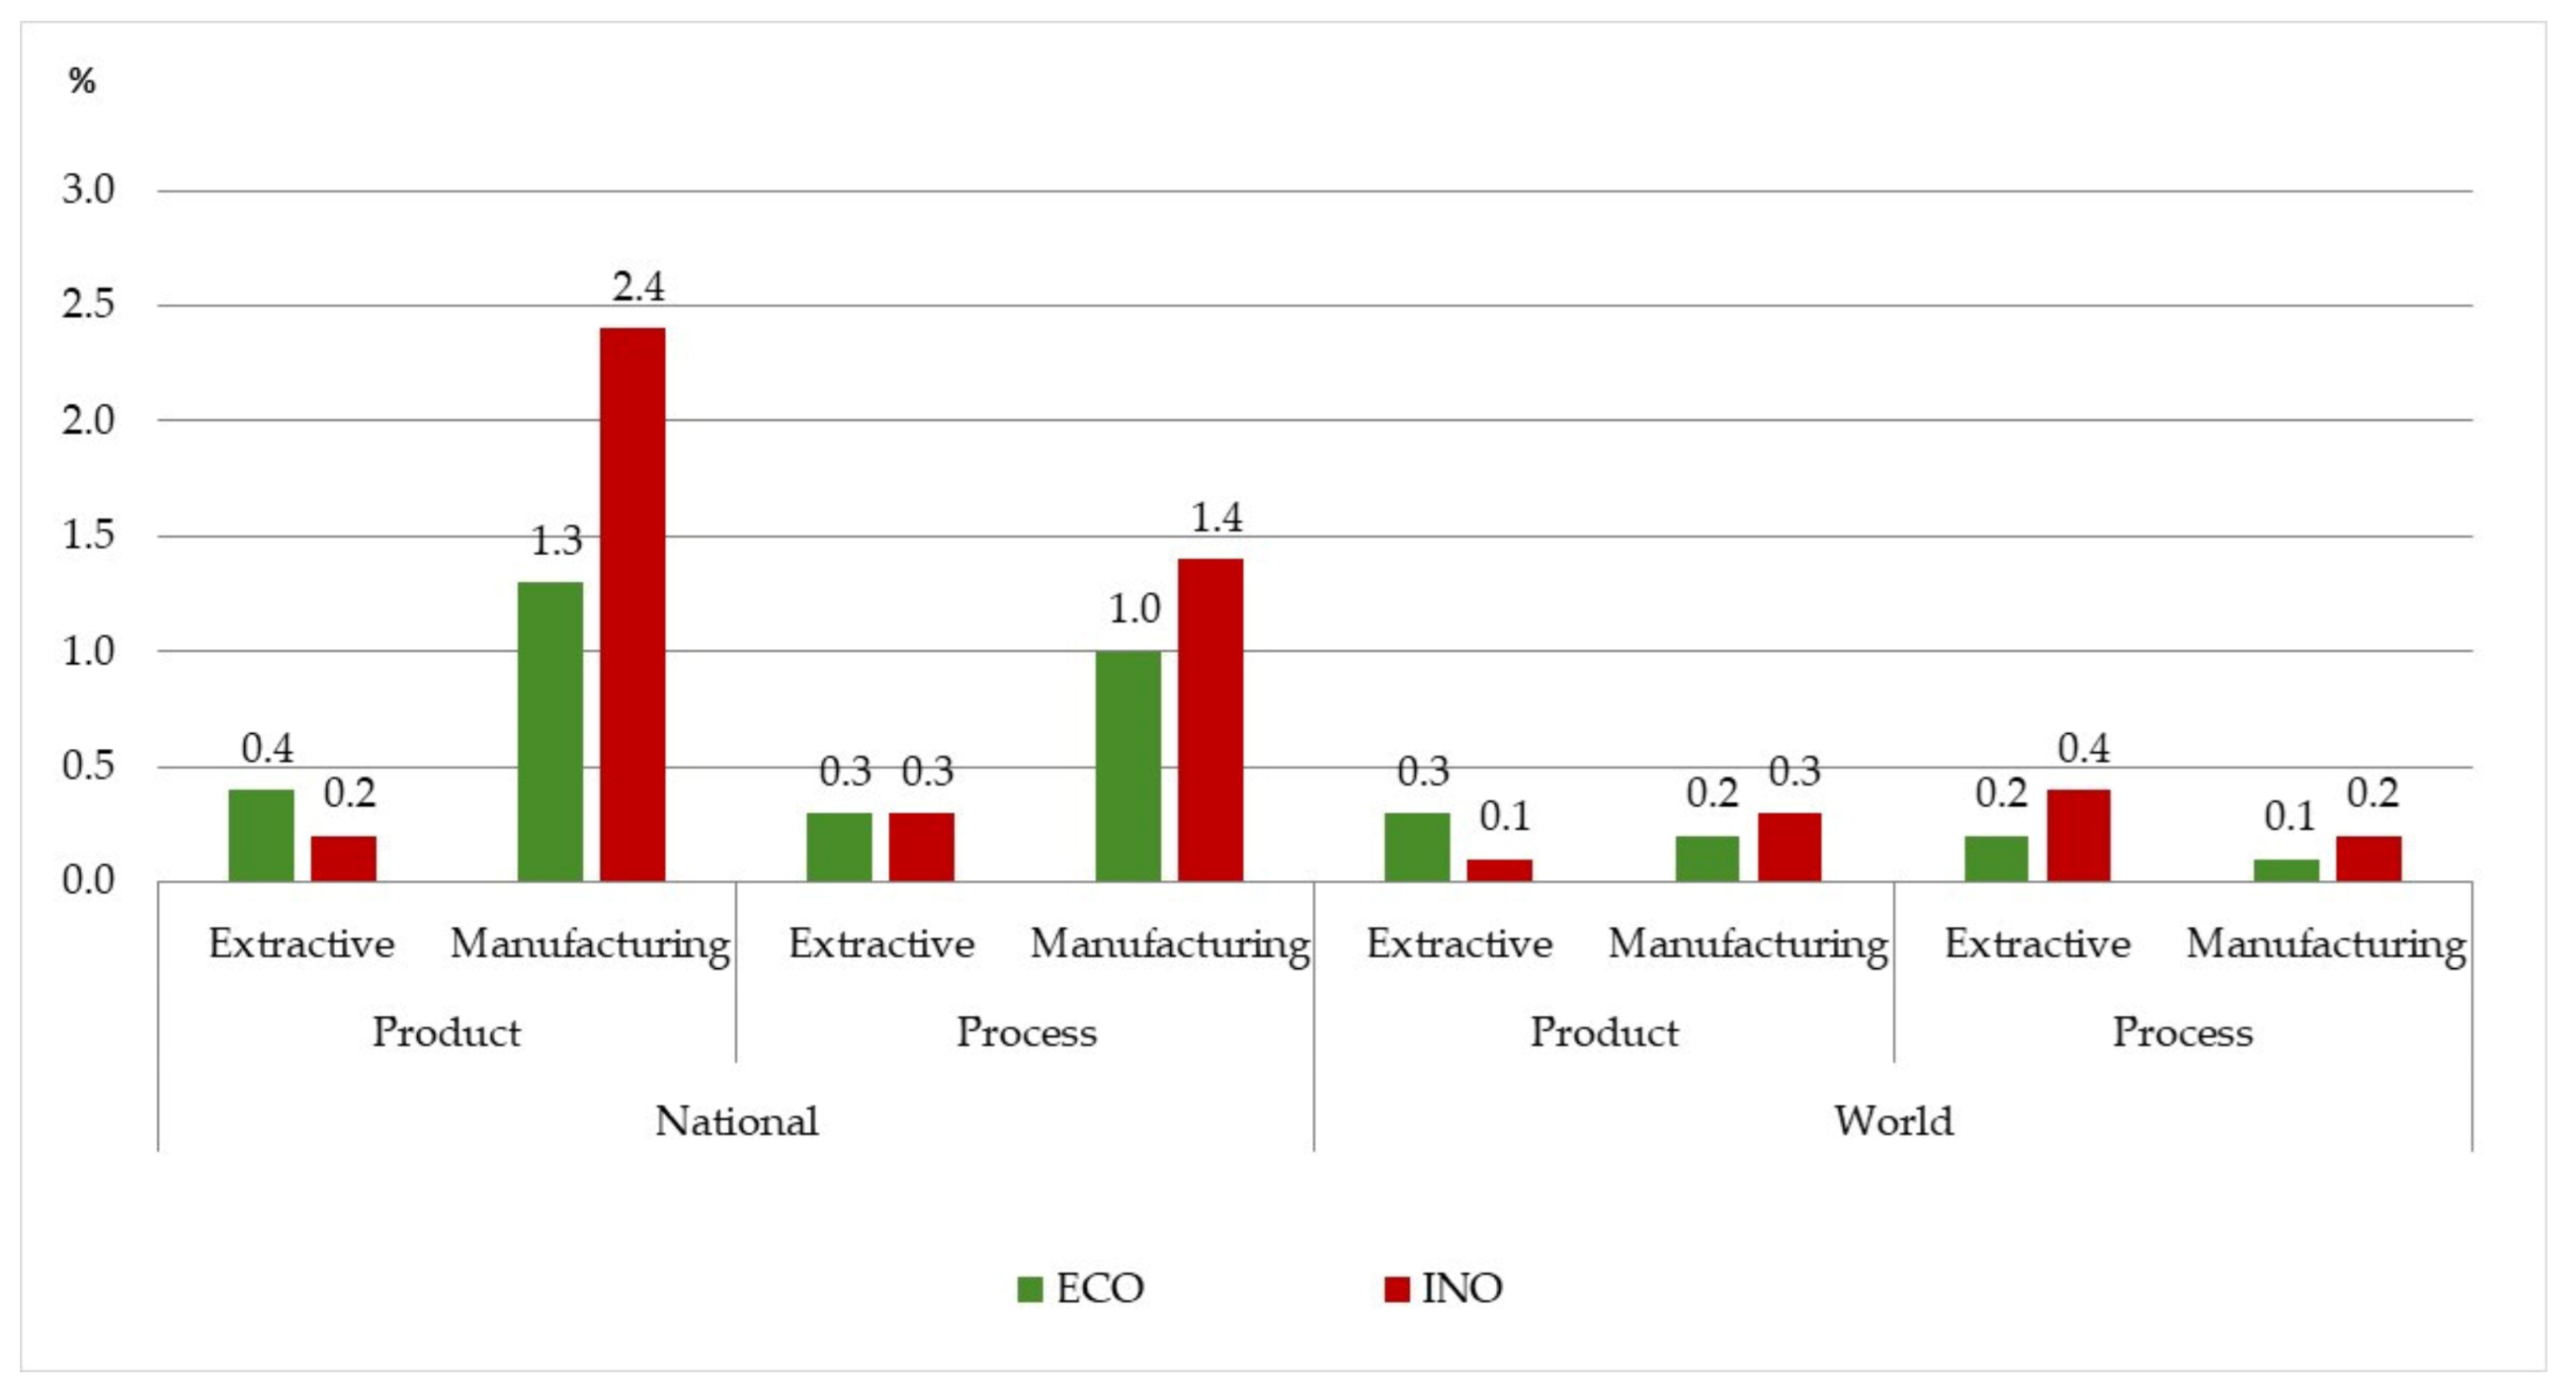
The degree of novelty of product and process innovation is an important measure, as it reflects the radical nature of innovation. While national rates refer to innovations for the domestic market already developed in the world market, world rates refer to the most substantial innovations, which are also new abroad (
Figure 3).
When comparing these rates in groups of companies, there are interesting elements. In turn, in the world segment, although they present a higher index only in product innovation in the extractive sector, the difference between the two groups is smaller when compared to the national segment, indicating that the ECO and INO are practically at the same level of novelty. On the other hand, in manufacturing, the superiority of the INO in both markets is undeniable. In summary, the 2015–2017 portrait shows that Brazilian EIs generated a higher impact on extractive activities. This is positive, given that this sector is notoriously known for its high polluting potential and its ability to deplete non-renewable resources. Furthermore, incremental technologies predominate in Brazilian EIs, which has been observed in studies of environmental innovation in other countries [
8].
The benefits observed with the innovations are relevant aspects for the discussion about the drivers and impacts of EIs, as they highlight a double stimulus effect: the inducing element reflects on good results that corroborate with the induction and encourage it. To address this issue, only companies that expressed “high” or “medium” importance were considered. In addition, these gains were grouped into three categories: competition (related to better market positioning), production (related to greater efficiency in the production process) and protection (linked to compliance with norms and standards). The point that draws attention is the greater perception of ECO about the benefits generated by innovation (
Figure 4). The only benefit in which INO had greater relevance was the opening of new markets in the extractive activities.
The main differences in favor of ECO were found in the categories of production and protection. In manufacturing (
Figure 4b), the gains from the reduction in the consumption of inputs, energy, water and raw materials were the most relevant, and, in the protection category, both benefits from compliance with norms and standards were accentuated. In extractive sector (
Figure 4a), the advantages of competition stood out, particularly the gains from the expansion and maintenance of the market share. In the case of the INOs, it is worth emphasizing that, despite manifesting benefits of reducing the consumption of water, energy, and materials, they declared that the innovation had a low or non-relevant impact on the environment. Here, the hypothesis is that the benefits of the reductions were, above all, the result of a cost saving strategy. Therefore, ECOs expressed the benefits of innovation more intensely—not only those that positively interfere in the environment (such as the decrease in the quantity of inputs), but also others capable of promoting them to more competitive environments. Although it may seem contradictory, eco-innovative companies appear to be less dependent on stricter regulation than more passive companies. Therefore, the adoption of more subtle measures—voluntary actions, eco-audits, eco-labels, and codes of good practice—may be sufficient for pioneering EI companies [
23]. However, EIs depend more on environmental rules than other innovations [
37,
54,
56].
Finally, other pertinent information concerns the obstacles highlighted by companies. These data are particularly useful to develop, apply, and monitor policies to foster innovation. To assess them, the problems were grouped into three types of barriers: economic (emphasizing the availability and sources of monetary resources), technique (focusing on the direct factors of production and innovation) and institutional (bringing together a variety of actors and forms of interaction) (
Figure 5).
The results of barriers to innovation were quite different among industrial activities. In extractive sector, ECOs were shown to be less susceptible to problems, unlike INO (
Figure 5a). The exception was in the excessive economic risks item, in the economic barrier. Despite being the most recurrent problem among ECOs, the other two obstacles to the same barrier—high costs of innovation and scarcity of appropriate sources of financing—were not perceived with the same intensity. One speculation is that this phenomenon may be associated with the application of measures to support EIs in extractive activities, such as cheaper access to credit or other financing options, which provide, in return, better environmental performance, which is unknown or even devalued by the sector’s INO. In general, financial barriers (imperfect financial markets, absence of financial assets, scalability, and even weak environmental rules) hinder the development and the diffusion of EIs [
28].
When examining the manufacturing industry, ECOs indicated the greatest sensitivity to barriers to innovate (
Figure 5b). The economic barrier was the most accentuated and the high costs of innovation stood out. In the technical barrier, the most prominent problems were the lack of qualified personnel (also shared by the INO) and the lack of information about technology. This last problem, added to the lack of information on markets and the lack of adequate external technical services, expressed the greatest differences between the two groups of companies. Here, the hypothesis was that ECOs constitute a more specific group of companies, which demand more advanced knowledge and technologies, aimed at a green vanguard [
35]. Regarding institutional barriers, the intensity was practically the same in ECO and INO, with a greater signal for the scarce possibilities of cooperation with other companies or institutions in the case of eco-innovators. However, as reported in the literature, in general, the EIs depend more on external sources of knowledge and information than other innovations [
54,
57].
4.2. Analysis of ECO-Innovation Drivers
Although the literature review exposed a broader set of EI drivers, the investigation analyzed the factors defined by Pintec [
45] as follows: voluntary actions (VACT); government support (GOVS); codes of good environmental practices (COGP); market demand (MKTD); high costs of energy, water or raw materials (HCTS); existing environmental standards or taxes on contamination (EEST); environmental standards or future taxes (FEST); company reputation (REPT); public contract requirements (RQPC); and others (OTRS) (
Table 1 and
Figure 2). The data refer to the extractive and manufacturing industries, as well as the 24 sectors of the latter.
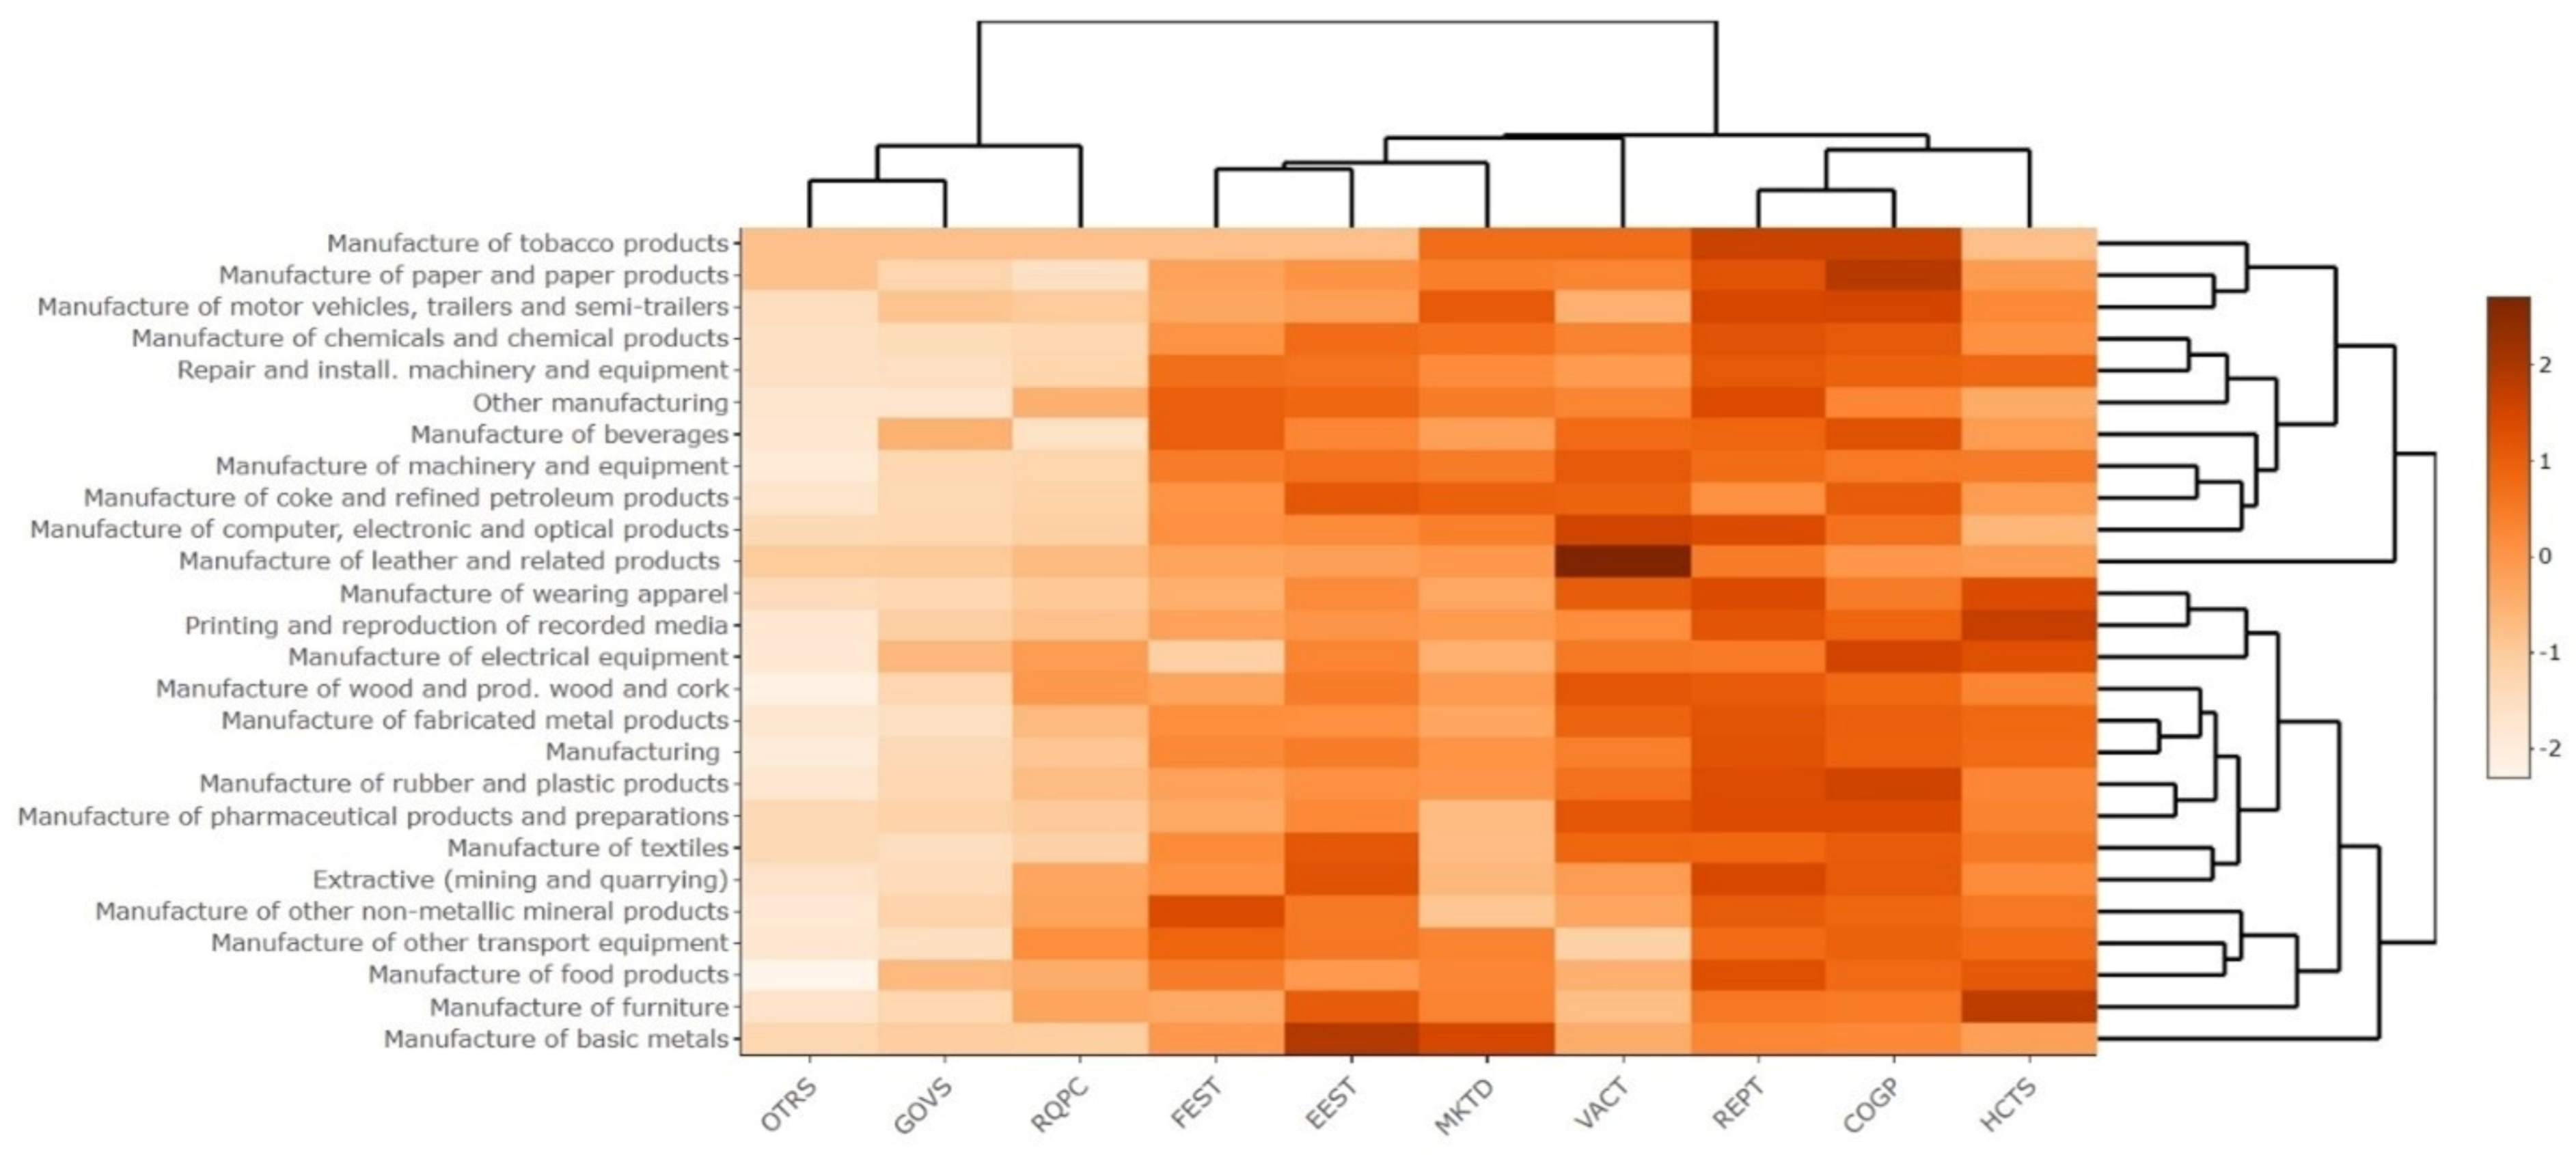
Figure 6 (see interactive heatmap in
Figure S1) exposes two clusters: the first, indicated by the column dendrogram (horizontal-axis), groups the EI drivers according to their frequency in the industrial sectors, while the second, line dendrogram (vertical-axis), brings together industrial sectors with a similar distribution of drivers. In both cases, the intensity of the orange color indicates the greater influence of the drive, with the scale in number of standard deviations.
The analysis of the driver cluster shows distinct scales of value among the drivers of EI. The first group, to the left of the heatmap, places the drivers that contributed least in the decision to develop innovations with environmental gains. Both the OTRS (for which no additional information is given) and the GOVSs had close weights; in turn, the RQPCs were mentioned a slightly more. Government support, subsidies, and other incentives for EIs (technology push) seek to boost the development and application of technologies, processes, products, and organizational procedures that are less aggressive to the environment. Regulatory pull requirements are an environmental policy measure that conditions aspects of the company’s ecological conduct to the conclusion of business with the government.
The second group, on the right, was divided into two branches. The first branch grouped EEST and FEST (regulatory pull/push), which presented motivations such as the MKTD driver (market pull). These, in turn, were like those of VACT (market pull), which represent a set of company actions, with the purpose of creating internal practices of good environmental conduct (such as the proper disposal of electronic waste). Here, there is a point to be highlighted regarding the importance given to environmental standards, whether existing or to come. Studies have indicated that EIs are more dependent on regulations than other innovations [
37,
56,
57,
58,
59]. However, in the case of Brazil, this was not verified, either by the environmental norms or by the requirements for public contracts, which are both instruments of environmental policy. The second branch reflects the combination of the three main drivers: REPT and COGP (market pull), and HCTS (cost-savings). The reputation is related to the adoption of a green communication strategy, such as the creation of an eco-friendly image, which is also very conducive to stimulate marketing innovations. The codes of good practice comprise tacit measures and agreements that, although not mandatory, act as a type of rule of behavior for companies in each sector, or that are part of a production chain. These drivers showed the highest values. The REPT and COGP are drivers influenced by institutional pressures, which help guide R&D efforts for environmental protection strategies [
34]. In turn, the HCTS is a very prominent driver in the literature, indicating that EIs apply far more cost-saving or energy-saving strategies than other innovations [
23,
30,
37,
54]. Furthermore, if, on the one hand, firms tend to initiate EI projects in response to market pressures, on the other hand, greater investments in EIs are encouraged by other determinants, such as HCTS [
38].
The analysis of the cluster of EI drivers, according to the sector (line dendrogram), allows us to raise, albeit with caution, some hypotheses. It is important to note that the sectorial composition involves differentiated activities included within the same economic division; that is, there are different characteristics regarding the intensity of technology/labor, international market orientation [
18,
60,
61], degree of transformation, position in the production chain [
39,
62], and the size and share capital of the company [
18], among other aspects.
The distribution of industrial activities was segmented into two sub-clusters, each formed by two secondary groups, which branched into small groups. In the first sub-cluster—formed by the first 11 activities arranged in the upper part of the heatmap—particularities were identified that may elucidate the weight of certain EI drivers. An example was the first three sectors: tobacco; paper; and motor vehicles, trailers and bodies. In these activities, EIs were motivated mainly by market pull, REPT, and COGP drivers. Similarly, they are exporting sectors, subject to different types of pressures, such as customers, stakeholders and other actors that relate the activity to others downstream in the production chain (for example, tobacco and forest monocultures). The company’s position in the production chain can influence the willingness to eco-innovate, as well as its orientation towards the foreign market [
17,
18,
39]. Another divergent sector was the preparation of leathers and the manufacture of leather goods, travel goods, and footwear, with a strong weight of the driver of voluntary actions. One hypothesis is that, although Pintec does not provide data on the type of product, EIs were potentially of an organizational type, given the relevance of internal environmental protection practices. Based on studies focused on sectors with high polluting potential, it is possible to highlight some points. This is the case for the manufacture of chemicals and energy-intensive industries, which often carry out more EIs due to regulatory pressure or high energy consumption [
26,
37,
42]. Two other activities more sensitive to the regulatory pull/push determinants was the manufacturing of machinery and equipment and the manufacturing of coke, petroleum products, and biofuels.
The second sub-cluster connected 13 activities, plus the extractive and processing industries. In the case of extractive activities, there was a prevalence of existing environmental standards (EEST), (regulatory push/pull), reputation (REPT) and codes of good practice (COGP) (market pull), while in manufacturing, the main drivers were reputation and codes of good practice (both market pull), and the high costs of energy, water, and raw materials (HCTS) (cost-saving). The sector that came closest to the average for manufacturing was metal products. In turn, the activities most influenced by the cost-saving driver were furniture, wearing apparel, printing and reproduction of recordings, and electrical equipment. Strategies to reduce costs and use resources more efficiently are highly significant for eco-innovative companies, even more than for other innovators [
29]. The codes of good practice mainly guided EIs in the sectors of rubber and plastics, pharmaceutical products and preparations, and textiles. Finally, basic metals were the most induced to eco-innovate by existing environmental rules.
4.3. Analysis of ECO-Innovation Impacts
Like the analysis of drivers, the examination of the impacts was based on the list of effects on companies (
Table 1 and
Figure 2), as follows: substitution of materials with others that are less contaminating (SBSM); replacement of energy from renewable fossil fuels (RENG); reduction in the contamination of soil, water, waste, or air (RCON); recycling of waste, wastewater, or materials, for sale or reuse (RECY); and reducing the CO
2 footprint (RCO
2). For each effect, the company indicated the degree of company, being that they were computed only as “high” or “medium” manifestations on impact.
Figure 7 (see interactive heatmap in
Figure S2) associates two clusters: one, referred to by the column dendrogram (horizontal-axis), which groups the impacts of EIs according to their occurrence in the industrial sectors, while the other, line dendrogram (vertical-axis), approximates industrial activities with a similar arrangement of impacts. In both clusters, the stronger green color corresponds to the greater relevance of the impact, with the scale being the number of standard deviations.
The scale of relevance of environmental impacts perceived by eco-innovative companies was segmented into two sub-clusters. The grouping to the right of the heatmap highlights the most observed impacts. The industrial companies realize that their environmental innovations have made it possible, above all, to recycle waste, including wastewater and materials for reuse (RECY). The reduction in the contamination of soil, water, noise, or air (RCON) was the second most relevant. A common element in the two effects was the similar level of importance across sectors. This is the characteristic that links the two effects on the same branch. At another level was the substitution of raw materials for others that are less harmful to the environment (SBSM). The second sub-cluster brought together the two less relevant effects: the reduction in total CO
2 production (carbon footprint), RCO
2, and the replacement of fossil energies with renewable sources (RENG). Although both impacts are important to mitigate damage to the environment, this drew attention to the low level of energy change, by green technologies for energy generation. Furthermore, it is pertinent to mention that EIs that reduce CO
2 emissions are highly dependent on subsidies, basic research, and public technology programs [
8].
The examination of the impacts by sector of activity indicated a very distinct cut, formed by a large group with three branches and a group of only one activity—in this case, that of wood products. This isolated position of the sector is due to the high frequency of impact in four of the five predicted. In addition, this activity showed the greatest manifestation regarding energy transformation, using cleaner sources of energy generation (RENG). In general, the other sectors had between two or three more important impacts. Regardless of this provision, it is important to reinforce the reservations regarding the characteristics of each sector, which make it possible to establish only a few deductions. One of them was the lesser relevance of the effect of substituting materials for others that are less harmful to the environment (SBSM) in some sectors, such as wood products; coke and refined petroleum products; food and beverage products; basic metals; and extractive activities. All these activities depend heavily on specific materials for which there are no direct substitutes. This is the case for water for the beverage and food industry; wood for products of this nature; coke, oil, and sugar cane (or other materials used for this purpose, such as soy, corn, and biomass) for fuels; and minerals for extraction activities.
4.4. Drivers, Impacts and Innovation Variables: Correlated Effects
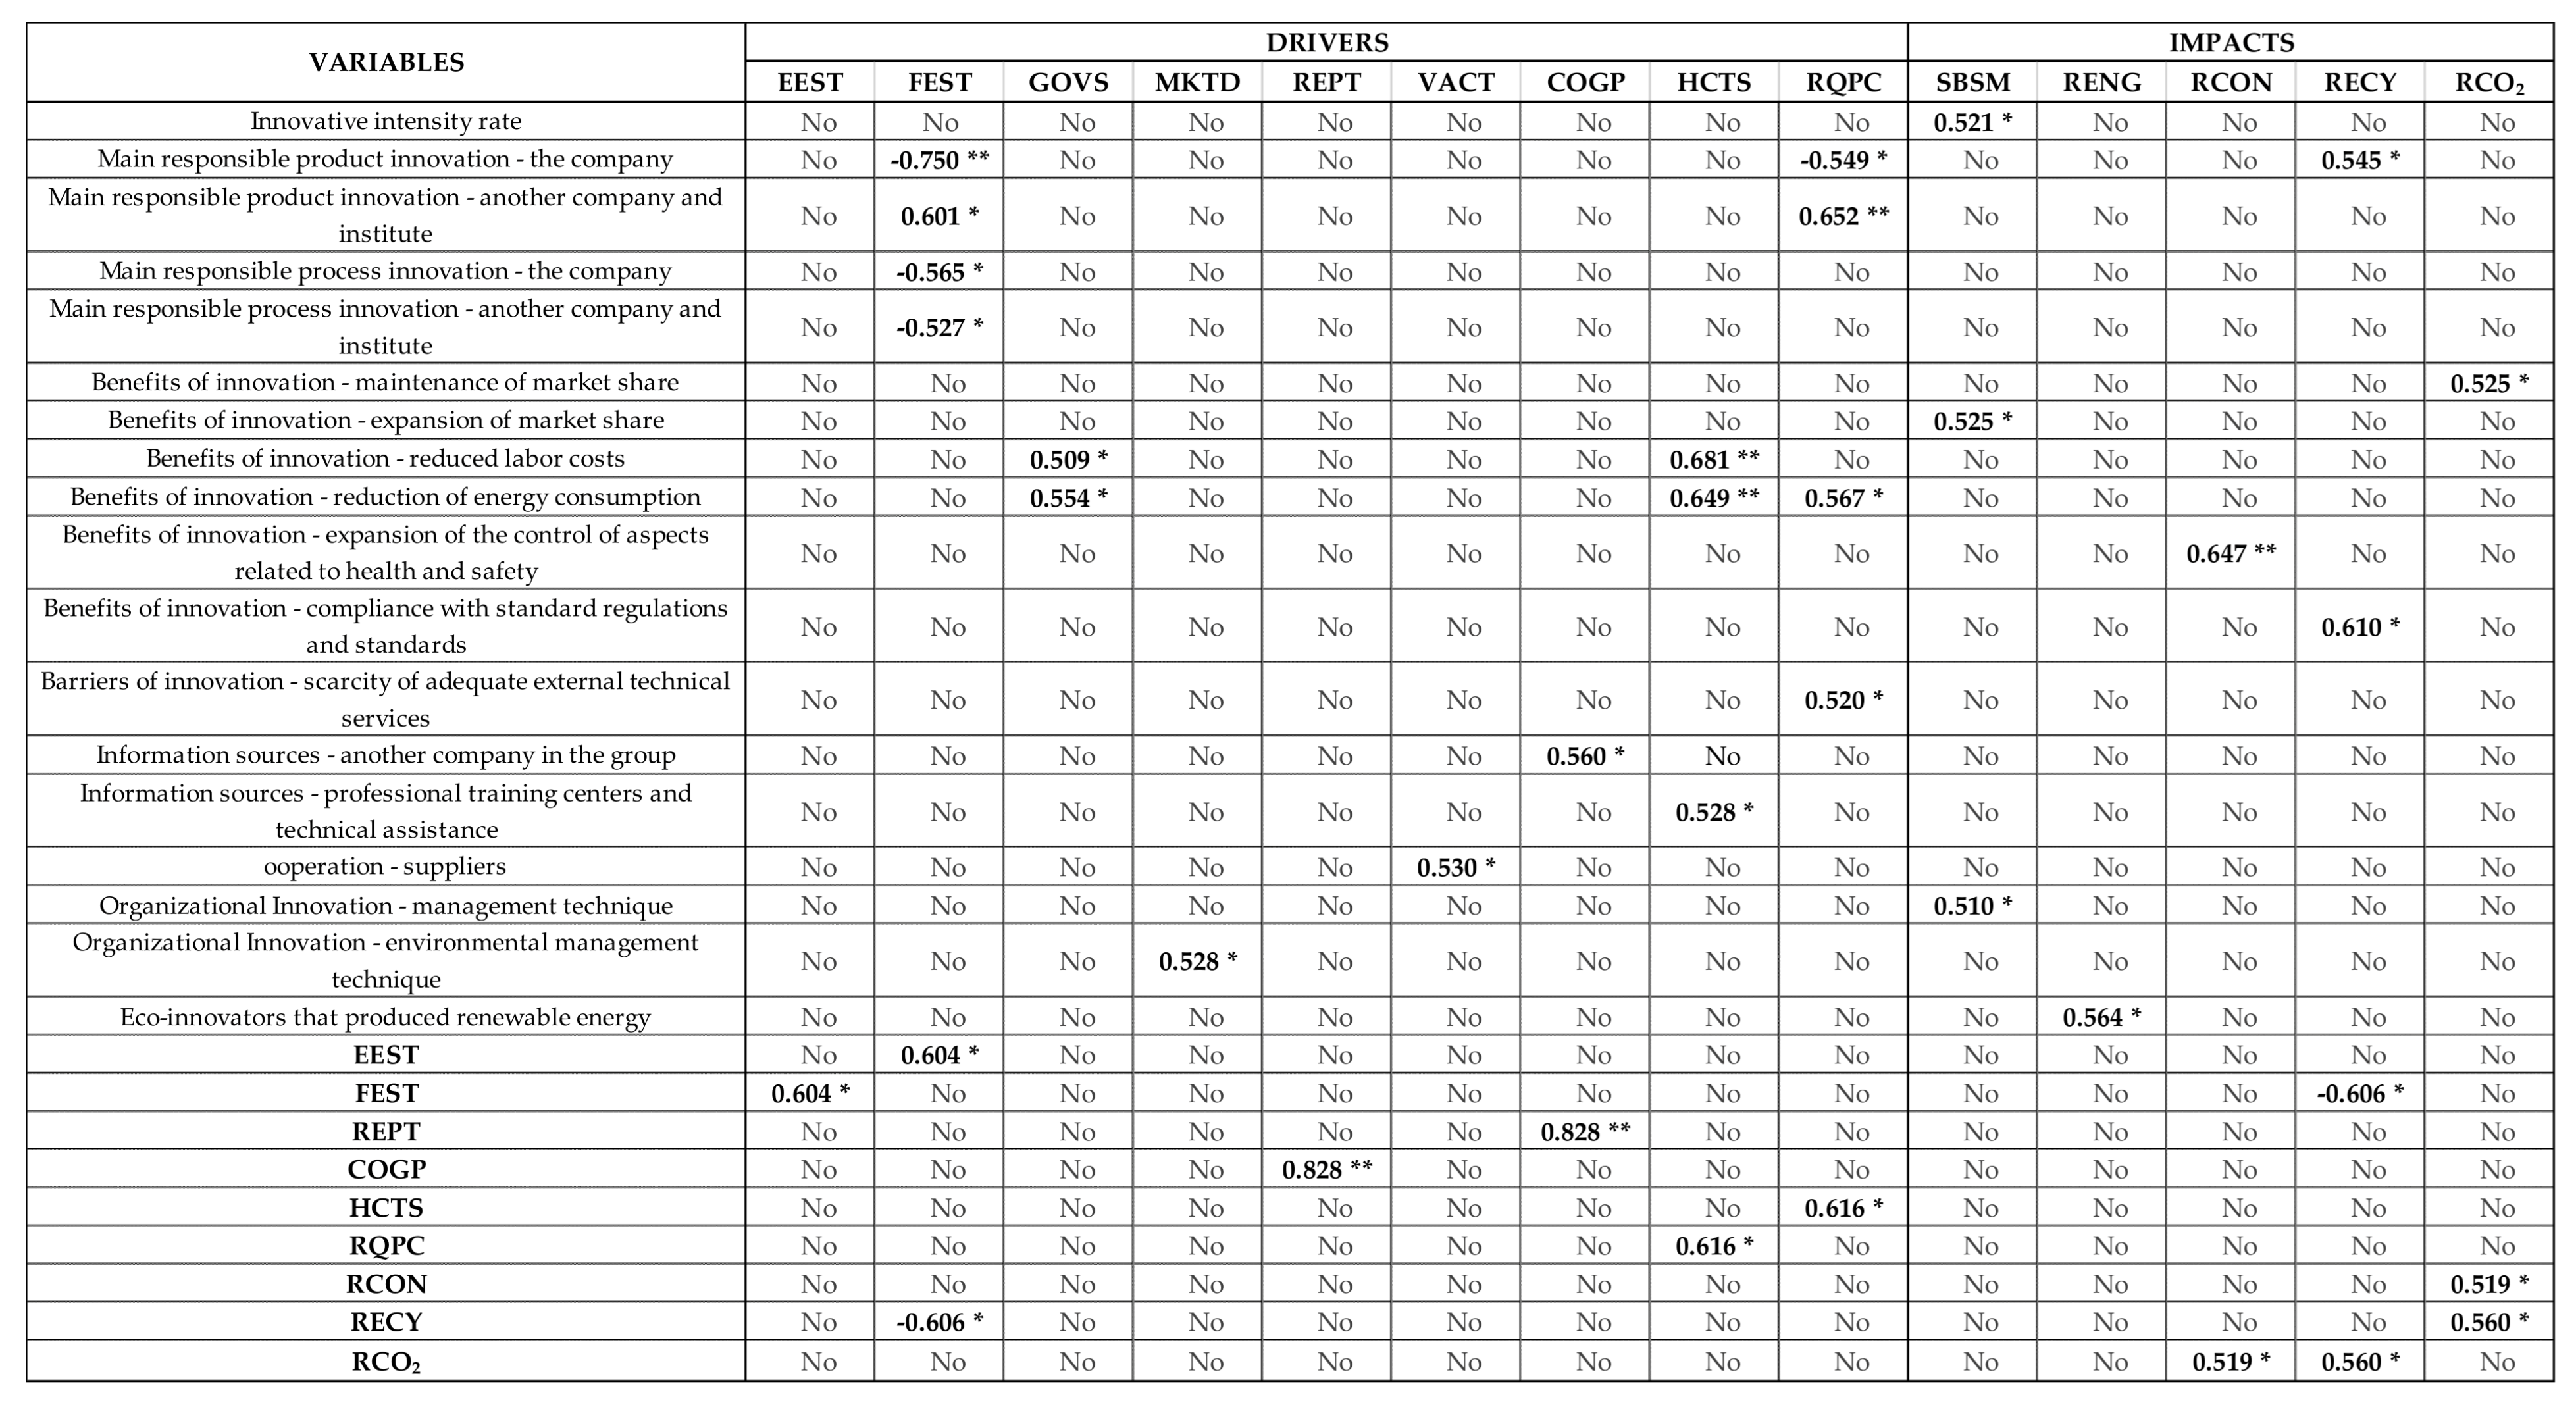
To complete the heatmap analysis, we calculated the correlations among the drivers (10), impacts (5), and other selected innovation variables (91) captured by Pintec (
Appendix A). The purpose of this exercise was to establish a profile of eco-innovators, which could guide actions to encourage EI. The results of this exercise are shown in
Figure 8.
Among the aspects observed, one was that eco-innovators motivated by REPT were also influenced by COBP, both drivers of market pull. In EEST and FEST, and in the HCTS (of energy, water, or raw materials) and RQPC, the same happened. In the latter—drivers of a different nature—it is likely that when the company eco-innovates looking for cost-saving, it is also more attentive to other market opportunities, such as meeting environmental conditions to supply products or services to the public sector.
In terms of impacts, the reduction in CO2 emissions (RCO2) was linked to two other effects: the RCON (grouping soil, water, waste, or air) and the RECY (contemplating waste, wastewater, or materials). ECO-innovators, who showed a decrease in their carbon footprint, also exhibited a reduction in contamination, in addition to the effects of recycling.
In RECY, there was an inverse correlation with FEST. This result was interesting and corroborates with previous studies. As already noted, recycling is generally associated with the use of more widespread and less complex technologies [
37,
63]. In this sense, when an eco-innovative company is guided by environmental standards or future taxes, it expects regulations to become more restrictive, and will probably prefer to develop innovations with greater effect in reducing contamination, which recycling practices are more limited in achieving.
The correlations with other innovation variables highlighted pertinent elements. In drivers, eco-innovators induced by FEST normally have another company and institute as the main responsible for product innovation. This relationship reinforces the fact that eco-innovators are more dependent on external agents, especially when there is an expectation of greater rigidity of environmental standards [
37,
42,
57]. In contrast, these standards or taxes were inversely related when the main actor responsible for product innovation is the company. In process EIs, regardless of the main innovation agent, the relationship with FEST remains the opposite. In other words, companies guided by these standards tend not to eco-innovate in the process.
Government encouragement (GOVS) was associated with reduced labor and energy costs. Moreover, those motivated by market demand (MKTD) tended to adopt environmental management techniques. Recalling that these techniques involve, among other aspects, an environmental communication policy aimed mainly at answering questions from consumers and stakeholders about the company’s environmental behavior, this result reinforces the importance of environmental management systems for EIs [
34]. In turn, companies that were guided by voluntary efforts (VACT) tended to cooperate with suppliers. A similar observation was made between the COGP and the relevance of another company in the group in the sources of information. In these two situations, there was a greater willingness to establish links downstream of the production chain or with companies in the same sector. It was interesting to note that the high cost driver (HCTS) was related to the benefits of reducing labor and energy costs, and to sources of information with professional training and technical assistance centers. Regarding RQPC, these are linked to the condition that the main executor of the product EI is another company and institute, the benefits of decreased energy consumption, the absence of adequate external technical services, and conversely, when the main executor of product innovation is the company.
In respect of impacts, the replacement of materials (SBSM) was associated with the rate of innovative intensity of the companies, their expansion in the market and the application of management techniques. The substitution of energy (RENG) was related to the production of renewable energy. The RCON tended to increase the control of aspects related to health and safety. The recycling effect was mainly observed when it led to the framing of regulations and standards, and when the main developer of the product innovation was another company and institute. Finally, eco-innovators who saw a reduction in their CO2 footprint more directly perceived the company’s maintenance gains in the market.
5. Discussion
To promote the development of EIs, some aspects must be considered. The first is the fact that they need much more stimulation than other innovations, mainly regarding access to external sources of knowledge and information, the granting of subsidies and the support of public technology programs [
8,
54]. In the case of Brazilian eco-innovative companies, the scarce possibilities for cooperation with other companies or institutions, the lack of information about technology and the market, the scarcity of external technical services and the high costs of innovation were recurrent impediments in manufacturing.
Although this relevance has not been observed in extractive activities, an addressing investment to promote EIs would be very auspicious. In developing countries such as Brazil, the support of universities and research centers, especially in the environmental and technological areas, can simultaneously help to overcome economic and environmental problems, and can provide opportunities for EIs [
37]. As the study indicated, the proximity to other external agents proved to be relevant for eco-innovators motivated by the reduction in high costs. A similar observation was made in the relationship between voluntary actions and cooperation with suppliers.
However, the effectiveness of actions such as this depends greatly on the degree of articulation and commitment between the actors involved. The government has a key role in this process, mainly the public institutions responsible for industrial, innovation and environmental policies [
15]. As highlighted in the study, even with the encouragement of some actions, there are important corrections to be made. A good example is the eco-innovators who, even induced by the requirements of public contracts, face the lack of adequate external technical services.
The synergy between the instruments of these policies can increase environmental engagement in the economy, involving companies and consumers, the public and private sectors, universities and research centers, institutional and civil society representatives. The goals set out in SDG 9 are linked to this environmental commitment. The modernization of infrastructures and the improvement of the industry to make them sustainable, the increase in scientific research and technological capabilities of the industrial sectors, and the encouragement of innovation are goals that are part of the same transformation circuit.
From the perspective of companies, they need to develop skills in the scope of sustainability, improving products, processes, and organizational and management forms. For example, initiatives related to organizational innovations have indicated interesting links with the drivers of market demand and the exchange of materials for others polluting less.
Despite being an internal task that must be undertaken in the long term [
22], the benefits achieved by EIs are an incentive both for eco-innovators to advance in new projects and for other companies to realize the advantages of eco-innovating, valuing in its innovation strategy the reduction in environmental impacts. As the study revealed, although EI requires greater effort on the part of eco-innovators—as indicated in the index of in-house R&D activities—they perceived with greater emphasis the gains in the three categories analyzed, competition, production, and protection.
The analysis of drivers and the impacts of EIs provided interesting insights. Examining the drivers, the conclusion was that EIs in Brazil still receive scarce attention from the public sphere. This was evident in the results of government support drivers (technology push), requirements for public contracts (regulatory pull), and environmental standards, existing or expected (regulatory pull/push), which were less relevant than the other inducers. This result is in line with other studies, such as Mazzucato and Penna [
16], who pointed out a lack of cohesiveness in the Brazilian innovation system, as we have seen at the beginning of this article, namely through aspects that show the difficulties in creating innovation policy instruments aimed at environmental innovation, in dialogue with industrial and environmental policies. Here, public financial support is essential to encourage EIs. On the other hand, the greater representativeness of the company’s reputation drivers and codes of good practice (both market pull), and high cost of materials (cost-saving), signals that the development of EIs is highly associated with a market response. The analysis allowed us to make some hypotheses based on the formation of sub-clusters, such as the connection of certain drivers with the sector’s level of exposure in the foreign market, or the position sector in a broader production chain.
The examination of the impacts resulting from EIs was equally interesting, either by complementing the analysis of the inductors, or by indicating the types of EI results most observed in the country. The most relevant effects were the recycling of waste, the reduction in contamination, and the replacement of materials with others that are less harmful to the environment. In contrast, the least verified were the reduction in carbon footprint and the replacement of non-renewable sources of energy with cleaner sources.
Although Pintec does not inform the purpose of the EI, it is desirable to establish some considerations. Among them is the small relevance of adopting clean energy. The transition to a more sustainable model is strongly linked to this substitution, as stated in SDG 7, which aims to increase the share of renewable energy by 2030. Efforts to reduce energy consumption require more advanced technologies and higher R&D expenditures. In Brazil, an interesting initiative is the adoption of a solar energy system for public lighting, an EI implemented by the public sector [
63]. For this reason, the development and use of clean energy occurs mainly in central countries, while less technologically demanding options, such as recycling, predominate among semi-peripheral and peripheral countries [
19]. This last situation was verified in Brazil. In EIs, the effects associated with more widespread and less complex technologies, such as the recycling of waste, wastewater, or materials, prevailed. This consideration can be extended to the effects of reducing the contamination of soil, water, air and noise, which tend to represent a first stage of EI [
39], associated with the use of end-of-pipe, which seeks to improve the quality levels of these elements, through the application of filters or other devices for this purpose. It is important to note that EIs are most often associated with cleaner production measures, unlike end-of-pipe technologies, that reduce environmental damage without changing the production process [
64].
Focusing on the sector, a feature of semi-peripheral countries such as Brazil is the high representativeness of sectors of medium or low technological intensity, many of which also have high levels of polluting potential. Despite sharing these characteristics, this does not mean that they are homogeneous; quite the contrary, there is a variety of aspects that differentiate them—market orientation, technological intensity, labor intensity and qualification, and production chain, among others. Hence, the technological options and EI opportunities will differ from sector to sector. Thus, it is presumed that an available part of the stock of clean technologies belongs to a given sector. Therefore, the characteristics of each production activity guides both existing technological opportunities and influences their degree of innovativeness and, likewise, affect the chances that EIs are developed and adopted [
39]. This is a key point to be considered in the measures and actions to promote EIs.
Here, it is interesting to note the relationship, or lack thereof, between the sectors with the same profile in drivers and EI impacts. In groups of companies with the same profile of drivers and impacts, it was not possible to detect similarities in technological terms. Particularly in the drivers, it was expected that the sectors of the same group had the condition of related variety [
65], i.e., the firms of different sectors had some cognitive proximity and, consequently, intersectoral complementarity that could explain the similar innovative profile. However, the possibility must be raised that this diversity is simply random and, therefore, there is no justification for this. ECO-innovative companies follow an “ecological” technological trajectory for specific reasons, shared in their sector, and which are not present in units from other sectors of the same profile defined by heatmaps.
6. Conclusions
It is increasingly urgent to establish a new model of production and consumption that is sustainable. An alternative to achieve this objective and advance in the development of a sustainable technological model is to encourage EIs. However, semi-peripheral countries such as Brazil will have to deal with their technological limits to access this new green model. Given this scenario, the study set out to establish an overview of EI in the country, with the aim of bringing elements to expand the dialogue among innovation, industry and environment. The study indicated that eco-innovators represent a third of all innovators. As highlighted, these companies have shown greater effort to innovate and greater susceptibility to the benefits and obstacles of innovation; their eco-innovation strategy are mainly driven by market factors; and the impacts are mainly associated with the use of more widespread and less complex technologies.
At the global level, numerous ways to encourage more sustainable production and consumption are discussed. One way is to rethink the economic incentives for EI. An interesting measure is the implementation of industrial certifications and credits that guarantee that the production processes comply with environmental requirements [
15].
Semi-peripheral countries such as Brazil can overcome the technological gap by relying on emulation from mission-oriented innovation policies [
66] that, for example, can promote an assignment, such as diminishing carbon emissions in a specific period, or a transformative innovation policy [
67] that highlights an integrated and systemic approach, considering the negative social and environmental effects of innovation in its framework. Both cases highlight the promotion of investments in innovation (especially in EIs) with the leading role in this process [
68].
These types of policy can be carried out through various instruments, which can be on the supply side, such as tax incentives for R&D, or on the demand side, such as public procurement policies, or even by both orientations (supply and demand), such as technical standards [
69].
However, the analysis undertaken here may highlight some interesting preferential paths. Returning to the results of EI drivers, among the most valued inductors were reputation and codes of good practice. Both inductors—with a strong correlation as indicated by the study—are tacit and, therefore, not mandatory. Thus, two policy instruments seem ideal for raising awareness and impelling (or compelling) more companies to innovate in environmental terms. Exercising influence on both the supply and demand sides, these instruments can be used for technological forecasting and regulation.
Technological forecasting aims to sensitize and alert public and private managers about trends in technological trajectories at national and global levels and, at the same time, about the benefits of considering these trends. As previously mentioned, the theme of EIs or sustainable technological development is in the list of global megatrends, highlighting the strong link between technological changes and the environmental dimension [
5,
7,
10,
11,
70]. It is important to emphasize that this instrument also intends to provoke improvements in the discourse in general, which is fundamental for changing an outdated technological trajectory. On the other hand, the regulation instrument—also correlated—has an important role in the same direction as technological forecasting, but on a compulsory basis. In short, regulations seek to increase the demand for (environmental) innovations and improve the overall technological structure.
In addition to this pair of policy instruments, many others would apply. Among those that should be highlighted are those linked to the promotion of interaction and learning at regional and national scales [
69]. Directed to the offer, three instruments are highlighted here: agglomeration policies, support for collaboration, and innovation networks. All of these emphasize the importance of the agents’ interdependence to innovate in new and disruptive themes to reach more advanced levels of general technological development. For example, it is worth mentioning the case of eco-industrial clusters, which can be fostered by policies, where the waste from one plant is used as input by another plant, etc. [
71], forming clusters of sustainable industries, whose production is associated with the circular economy. The EIs represent a type of transformation process, capable of creating a socioeconomic system based on the idea of the circular economy [
72]. In this sense, it is very pertinent to examine whether innovative institutional contexts—regional and national—encourage environmental technological change and, therefore, the EIs [
73].
Another interesting perspective is to analyze the phenomenon of the development and diffusion of EIs from the territory [
74,
75]. Although (eco)innovation requires an analytical knowledge base [
76], which results in closer links with universities and the formation of complex international knowledge exchange networks [
77], it also requires a synthetic knowledge base [
76], which is linked to knowledge and skills based on local, regional and national experience [
77].
As a research agenda, we consider that this study can stimulate further analysis. The expectation is that the presented sectorial portrait will serve as an initial stage to investigate groups of sectors that share similarities, such as high polluting potential or belonging to certain production chains. Here, case studies can provide valuable information, particularly to guide eco-innovation policies. Another further research agenda is the analysis of related variety, or systems of related firms in eco-innovation issues from a regional development perspective [
65], for example: occupational structures as information networks and also through the flow of labor among industries; the technological relatedness among industries, a fundamental issue for developing countries [
78]; or research relationship among individuals or scientific institutions. In all these cases, the relatedness analysis typically looks for the probability that a region establishes an economic activity within the scope of eco-innovation as a function of related activities in that place.
Finally, we believe that EIs have the intrinsic characteristic of avoiding one of the main negative effects of innovations in general, one of the components of the “dark side of innovation” [
79], namely, that of environmental degradation. Indeed, from the Industrial Revolution to the present day, many innovations have contributed to the environmental changes that are currently threatening the planet through pollution, loss of biodiversity, climate change, etc. Therefore, in view of a necessary and urgent sustainable global development, EIs are essential in all productive activities.


