Article

Predictive Role of Ex Ante Strategic Firm Characteristics for Sustainable Initial Public Offering (IPO) Survival

by
Iftikhar Ahmad
,
Izlin Ismail
* and
Shahrin Saaid Shaharuddin
Department of Finance and Banking, Faculty of Business and Accountancy, University of Malaya, Kuala Lumpur 50603, Malaysia
*
Author to whom correspondence should be addressed.
Sustainability 2021, 13(14), 8063; https://doi.org/10.3390/su13148063
Submission received: 9 June 2021 / Revised: 14 July 2021 / Accepted: 16 July 2021 / Published: 19 July 2021

Abstract

:
This study attempts to predict how long a newly listed corporation, usually termed initial public offering (IPO), will survive on the equity listing market. The three-fold contribution of this study comprises a hand-collected and substantially expanded dataset for listed IPOs (1990–2017) over a maximum tracking period of 31 years (1990–2020) to predict the IPO survival on emerging Malaysian capital market, the rationale and consequences for unifying the two listing boards (Main Board and Second Board) in 2009, and an investigation of the predictive role of ex ante strategic prospectus information as early warning signals for sustainable survival of Malaysian IPOs. We also make comparisons for the survival profile of IPOs listed on different listing equity boards. We use Cox proportional hazard (PH) model to estimate the empirical results because of the cohort research design of the study. Overall empirical results show that survival curves for IPOs listed on Main Board and Second Board were not statistically different. However, Second Board IPOs remained more vulnerable to hazard. The survival curves for IPOs listed on Main Market and ACE Market are statistically different. Empirical results reveal that high share premium, high listed capital, and longer firm age at listing date significantly increase the survival (reduce hazard) of IPOs listed on the Main Market and the Second Board. However, bigger firm size and elevated risk factors significantly reduce the survival (increase hazard) of the listed IPOs mentioned above. However, share premium is the only variable that has a negative and significant correlation with IPO survival on ACE Market. These results have implications for the regulators, prospective investors, and policymakers of emerging markets, where the IPO prospectus disclosures bridge the information asymmetry gap prevailing due to the nonexistence of public information prior to the IPO. Empirical findings of this study can be generalized to other developing and emerging markets where IPO prospectus substantially mitigates information asymmetry and ex ante strategic firm characteristics act as early warning signals in predicting IPO survival.

1. Introduction

Initial public offering (IPO) survival refers to the extent of time a public corporation remains listed on the stock market [1,2]. The IPO survival comes to an end as it delists from the respective stock market, irrespective of whether delisting occurs voluntarily (e.g., conversion to a private firm, merger and acquisition) [3,4] or involuntary (e.g., forced delisting by court or exchange, financial distress leading to liquidation, hostile merger and acquisition) grounds [5]. Over the last three decades, this question has raised concerns about the sustainable survival of newly listed IPOs in capital markets across the globe [6]. It has been observed that newly launched IPOs face survival challenges initially, and their sustainable viability has remained a debatable issue [7,8]. The newly listed firms face the risk of long-term survival due to takeover threats, financial distress, and forced delisting by the regulatory authority [4,9]. Existing literature reveals that several conceptual and empirical issues are still unresolved as to why some IPOs survive longer than others and vice versa. The application of different theoretical lenses and logic to various samples with varying periods has also added to the disjointed nature of survival literature [6,9,10,11].
IPO survival studies should not be confused with IPO performance, though IPO survival seems consistent with an alternative to IPO performance [12]. Performance refers to either post-IPO operating or stock performance [13,14]. Moreover, performance may be either short-term or long-term. In the corporate finance literature, the dependent variables measuring performance (e.g., return on assets, Tobin’s Q, return on equity, debt–equity, financial leverage) usually come from financial statements except for stock returns performance, captured from the capital market. Moreover, firm performance does not necessarily involve the occurrence of any specific event of interest. In contrast, survival studies focus on predicting an entity’s sustainability (long-term survival) in relation to the occurrence of an event (e.g., delisting of IPO in our study) [15].
Sustainable IPO survival refers to the long-term existence of a firm listed on the respective security listing market. Sustainable IPO survival has implications for various stakeholders, including regulators, potential investors, and the listing firm’s substantial shareholders and promoters [16,17]. Regulatory authorities are responsible for sound and effective regulations to attract more listings and ensure sustainable IPO survival [6]. Regulatory authorities also desire long-term IPO survival to maintain global investors’ competitive advantage and enhance market efficiency, liquidity, and sustainable development. The continuous increase in listings increases the revenue stream for the stock exchange and ensures the private firms’ confidence in prevailing regulatory regimes. The strength of a stock exchange is determined by the number of securities listed on it, the securities’ liquidity, the movement in the index, and the survival of securities on the stock exchange [11,18]. The delisting of securities adversely affects the market capitalization, which ultimately hits the market index. Likewise, potential shareholders want liquidity and the continued survival of firms. The alarming delisting of IPOs influences their buy-and-hold strategy and changing portfolio composition behavior. However, the potential consequences of delisting firms for existing shareholders depend on the classification of delisting. For example, involuntary delisting (e.g., forced winding up) of firms has a more negative impact on existing shareholders’ wealth than voluntary delisting (e.g., conversion to a private company, mergers and acquisitions) [1,11]. Involuntary delisting of IPOs also leads to adverse economic and social welfare consequences resulting in low investor confidence due to adverse fluctuations in the equity market index [19].
Lewellyn and Bao [20] highlight that the variation in IPO activity prevails due to varying institutional and cultural differences. Fertala [21] articulates that IPO survival has remained debatable and inconclusive due to less attention paid across regional differences and the lack of suitable longitudinal data. Extensive literature prevails in developed countries on IPO survival, where capital markets are comparatively efficient with less asymmetry [22,23]. Empirical research on IPO survival has received little attention despite numerous delistings in specific emerging markets. Most previous studies [1,10,24,25] do not differentiate IPO survival from the firm’s or shareholders’ perspectives. Moreover, existing studies do not discern IPO characteristics into operational, strategic, financial, and nonfinancial signals. Unlike previous short-period studies [25,26,27,28,29] ranging from 4 to 10 years and considering mixed determinants of IPO survival, this study investigates the impact of ex ante firm strategic IPO characteristics with a substantially long survival time comprising 31 years to estimate the considerable role of survivable probabilities.
In this study, we specifically define ex ante strategic characteristics as strategic material financial and nonfinancial information aligned with strategic goals of IPO-issuing firms. This information has a long-term impact on the firm and does not frequently change like sales, working capital, and profitability. For instance, the share offer price is an essential financial constituent for fundraising at the IPO launching time. The company will obtain initial long-term equity financing based on this price. Likewise, net tangible assets reflect the potential shareholders’ residual claim at the IPO. Elements of nonfinancial information, such as the risk factors (both systematic and unsystematic) and listed capital percentage, are crucial predictive determinants for viable IPO sustainability. These strategic financial and nonfinancial IPO characteristics instigate a plausible role in predicting the survival profile of private firms while going public.
Examining the predictive role of firm strategic characteristics on IPO survival in Malaysia is requisite for several reasons. The first underlying motivation for this study is the continuous and alarming delisting of firms from Bursa Malaysia (previously known as Kuala Lumpur Stock exchange). Bursa Malaysia has witnessed about 30% delisting (this excludes IPO listed before 1990 and delisted after 1990) of IPOs listed from 1990 to 2017 and followed up to December 2020. Figure 1 shows the total IPOs listed in a particular year by segregating them into delisted IPOs (from the listing date until the cutoff date of 2017 and follow-up period until December 2020) and the percentage of delisted IPOs relative to the year of listing. For instance, the statistics obtained from the Historical Data Package of Bursa Malaysia and Investor Digest indicate that out of 31 IPOs listed in 1990, 16 IPOs (representing 51.61% of corresponding listed IPOs) have been delisted over the tracking period from 1990 to 2020, while 15 IPOs are still listed as of December 2020. Likewise, from 39 IPOs listed in 1991, 19 IPOs (representing 48.72%) have been delisted between 1991 and 2020, while 20 are still listed as of 2020. Further, the descriptive survival statistics indicate that the minimum 25th percentile of survival time is 11.70. That is why Figure 1 depicts the lower relative delisting in recent years from 2007 to 2017.
Second, IPO characteristics of firms listed on Bursa Malaysia are somewhat a mix of emerging and developed countries’ IPO characteristics in terms of market segregation, lock up expiry, share moratoriums (from mandatory and fixed to staggered), listing requirements, and delisting regulations. This study compares consistency in empirical results with the studies of both developed and emerging markets. The third rationale is that existing studies focus upon trading volume changes, short-run performance around lock-up expiry, long-run post-IPO performance, IPO prestige signals, and oversubscription [30,31,32,33,34,35,36,37,38]. Studies on long-term corporate perspectives in a public corporation’s perpetual and sustainable survivorship are limited to only descriptive statistics in Malaysia. For instance, we find only one study [24] on IPO survival, which is limited to only descriptive statistics with IPO data from 2002 to 2010.
The fourth rationale for this study is that the Malaysian stock market has gone through significant changes over the years. Since the separation of the stock market of Malaysia and Singapore in 1973, the Malaysian stock exchange had a single board for IPO listing, the Main Board. In 1988, Second Board was introduced to encourage small and medium enterprises and subsequently support Main Board. In 2009, the two listing boards were merged and named Main Market. It is pertinent to note that according to the provisions of Malaysia’s securities law, any transition of a firm listed on Second Board to Main Board, upon meeting Main Board’s listing requirements from 1990 to 2009, is neither delisting from Second Board nor a new listing on Main Board. A new listing board named Malaysian Exchange of Securities Dealing and Automated Quotation (MESDAQ) was introduced in 2002 to list high-growth and technology-sensitive IPOs. In 2009, MESDAQ was renamed Access, Certainty, Efficiency (ACE) with certain amendments (the amended provisions include share moratoriums, prelisting operational history, track records, size) in MESDAQ listing regulations. Accordingly, this study also compares the survival of IPOs in Main Market and ACE Market to examine whether IPOs listed on both the listing markets are statistically different.
This study contributes to the sustainable IPO survival literature in three ways. First, it employs a comprehensive hand-collected and substantially expanded dataset for IPOs listed on Main Market (previously Main Board) of Bursa Malaysia over a maximum tracking period of 31 years (IPO listing period: 1990–2017; follow-up: 2018–2020), predicting the IPO survival. Second, we analyze the rationale for unifying the two listing boards (Main Board and Second Board) in 2009 with a tracking period of 26 years (IPO listing period: 1990–2009; follow-up: 2010–2015). We also compare Main Board and ACE Market IPO survival profiles with a tracking period of 19 years (IPO listing period: 2002–2017; follow-up: 2018–2020). Third, this study investigates the predictive role of ex ante strategic prospectus information for IPO survival in Bursa Malaysia. The empirical findings of this study can be generalized to other developing and emerging countries (e.g., India, Indonesia, Thailand, Pakistan, Philippines, Sri Lanka) in the Asia Pacific region that exhibit more or less the same IPO characteristics as the Malaysian capital market, such as the regulatory climate of these countries being flexible for IPO listing [2]. Being emerging countries, they face prevailing low institutional quality [29]. Most IPOs are subject to high underpricing, and the price mechanism comprises fixed price method [39] in these countries. The survival profile of IPOs has remained more vulnerable in emerging markets than developed markets.
This study tests the following hypotheses for the impact of ex ante strategic financial and nonfinancial IPO issuer’s disclosed information on the survival profile of Malaysian IPOs. It is pertinent to note that the notion of ‘hazard’ is just the opposite of survival. Since this study uses the Cox proportional hazard (PH) Model, we use the narration of failure risk or hazard as an opposite of survival. This study tests the following ex ante firm strategic characteristic hypotheses.
Hypothesis 1 (H1).
Share premium has a positive (negative) correlation with IPO survival (IPO hazard).
Hypothesis 2 (H2).
Firm size has a positive (negative) correlation with IPO survival (IPO hazard).
Hypothesis 3 (H3).
Listed capital has a positive (negative) correlation with IPO survival (IPO hazard).
Hypothesis 4 (H4).
Offer size has a negative (positive) correlation with IPO survival (IPO hazard).
Hypothesis 5 (H5).
Risk factors have a negative (positive) correlation with IPO survival (IPO hazard).
The rest of the article has been organized as follows: Section 2 elucidates the relevant literature and development of hypotheses. Section 3 explains the research methodology. Section 4 describes the empirical analysis. Section 5 comprises a detailed discussion, implications, and generalizability of empirical findings, and Section 6 concludes the study.

2. Literature Review and Hypotheses

Theoretically, the predictive role of ex ante strategic firm characteristics on IPO sustainable survival is primarily traced back to the market signaling hypothesis, initially proposed by Spence [40] for the investors facing uncertainty for making an investment decision. The characteristics of IPO-issuing firms induce signals about firms’ information asymmetry [41]. In the light of signaling theory, we believe that an IPO activity, being a recurrent and repeated phenomenon, conveys signals about listing market repute and newly listing firms’ sustainable survival. These signals, in turn, attract prospective investors to subscribe to IPOs. However, the subsequent delisting propensity of IPOs also sends signals to the prospective investors, informing their rational judgment concerning subscribing to IPOs and formulating their long-term buy-and-hold strategy.
Besides, the theoretical supposition of ‘lemons’ described by Akerlof [42] highlights the investing complexities and uncertainties when delisting is a continuous phenomenon and competing risk issues are diverse. This diverse delisting may lead to adverse selection by avoiding sustainable IPOs and opting for the opposite. It is, in fact, hard for investors to judge the future viability of IPOs and the intentions of issuers. The information asymmetry, another IPO issue, is severe when launching IPOs because both investors and IPO firms are not fully aware of each other. Investors, for instance, are not aware of newly listed prospects such as operational growth, financial performance, retention of long-term ownership, and divestiture plans. Likewise, new firms are not aware of the investing behavior and confidence in their IPO. Leland and Pyle [43] postulate that firms may overstate positive facets of financial and nonfinancial information, implausible for investors to obtain, about firm prospects to gain financing opportunities. Markets perform poorly where information transfer is limited.
Empirical literature shows that IPO prospectus information acts as a signaling device for potential investors [44]. IPO prospectus bridges the gap prevailing due to the short reporting history of IPO firms [45]. The prospective investors of newly launched IPOs cannot directly observe the expected sustainable survival of the firm. They have to rely on the plethora of statutory information available in the primary legal document, the firm’s prospectus. The prospectus also reduces, to some extent, information asymmetry for unacquainted buyers. Investors build up their expectations for IPO subscriptions on financial and nonfinancial information in the prospectus [46]. The information contained in the prospectus document may be the initial signaling as to predicting the sustainable survival of a newly listed IPO.
Extent literature predicts IPO survival using IPO prospectus information. However, most studies have been conducted in developed economies where the capital market is comparatively efficient and governing IPO regulations are stable and wide-ranging. Moreover, these studies have been conducted in the different contexts of corporate finance and accounting with mixed determinants. For instance, Carpentier and Suret [47] have analyzed the survival of penny stock (small) IPOs in Canada using diverse financial and nonfinancial determinants from IPO prospectus information. Goot et al. [48] have examined the survival of the US internet IPOs on the NASDAQ stock exchange using IPO management prospectus disclosures. Espenlaub et al. [10] have investigated the survival of younger and riskier companies in the United Kingdom using IPO prospectus and London stock exchange information. Ahmad and Jelic [16] have investigated the impact of lock-up provisions on the IPO survival of the firms listed on the London stock exchange. Mousa et al. [49] have studied the impact of risk factors and investor valuation on the survival of US high-tech firms. Ayadi et al. [1] have examined the survival of reorganized French firms using conventional determinants of IPO survival. Ding [45] has elaborated on the survival of Australian IPOs concerning risk factors.
There are few studies on IPO survival in emerging economies. For instance, Iwasaki and Kocenda [25] have examined the survival of service firms in emerging European economies using mixed determinants, which comprise ownership, financial indicators, operating performance, and democracy index. On the other hand, Shari [24] has examined the survival of Malaysian IPOs from 2002 to 2010, which is limited to descriptive statistics of the Kaplan–Meier test. Further, this study does not consider the ex ante determinants of IPO survival. It is, therefore, inevitable to investigate the predictive role of ex ante strategic financial and nonfinancial for IPO survival in the emerging Malaysian capital market where IPO delisting is a continuous phenomenon. The following sections develop the hypotheses of the impact of strategic IPO financial and nonfinancial information, from the issue perspective, on predicting sustainable IPO survival.

2.1. Share Premium and IPO Survival

The pricing (offered price) of an IPO has been subject to an extensive debate in accounting and finance literature in the context of underpricing. The offer price that becomes the base for underpricing is the combination of par value plus share premium. Underpricing phenomena appear when the share opens in the market for trading. The underpricing level reflects how much money is left on the table for prospective investors by the IPO launching firm. Our concern is not with underpricing but the share premium generated by the firm. Instead, we focus on the share premium charged by the issuing firm. Gao et al. [50] interpret IPO pricing strategy as investors’ myopia of short-term earnings.
The issuing firm must consider the investors’ perspective of peer firms’ short-run overall earnings and information asymmetry for setting the IPO price that may be subject to high underpricing (low offer price). Loughran and Ritter [51] postulate that the baseline for setting an IPO’s offer price comes from underlying managerial objectives and the firm’s risk profile. Firms with ex ante high growth, stable financial history and high capital intensity are more likely to go public with high valuation premiums [52]. Issuers sometimes exaggerate the firm fundamentals to induce the potential investor to purchase shares at a high price, allowing firms to set a high offer price [53]. The issuers also take advantage of prospective investors’ optimism based on their companies’ ex ante high growth performance and charge high premiums accordingly [54]. We postulate that firms charge a high share premium while setting the IPO offer price to signal the acquiescence with prospective investors’ optimism for sustainable growth and the long-term future viability of the business. Therefore, we expect a positive correlation between share premium and IPO survival.

2.2. Firm Size

Firm size reflects a firm’s potential to influence prospect earnings, growth opportunities, and sustainable corporate survival [55]. However, literature on the impact of firm size and IPO survival is somewhat mixed. The too big to fail notion postulates that big firms face survival challenges due to complexities in managing large-scale operations, where available resources remain underutilized [25]. Big firms facing high systematic risks may be subject to high business failure risk [56]. On the other hand, the survival profile of larger firms remains high because of their advantageous position to benefit from economies of scale and technological innovation and swiftly recover from investment mistakes [57]. In addition, larger firms are better equipped with resources to absorb and withstand potentially rough market conditions and exogenous shocks than smaller IPOs [58]. Helbing et al. [59] report that bigger firms exhibit a higher probability of survival because of their capacity to manage uncertain events. We hypothesize a positive correlation between ex ante firm size and IPO survival.

2.3. Listed Capital

Listed capital comprises the number of shares retained by offerors, offer for sale shares, and proposed public issue. Though authorized capital can be altered, it is a complex and costly legal process that needs special resolution. Listed capital, which represents the percentage of authorized capital, is affected by IPO volume. Listed capital percentage signals the firm’s future viability for expansion and growth and rationality for equity fundraising. We believe a high percentage of listed capital at the IPO stage restricts the firm’s equity issuance in the future to meet those growth opportunities requiring extensive capital expenditure. An issuing firm also takes advantage of issuing more equity when the market value is high than past (hot issues) and equity financing is cheaper [60]. Moreover, the high percentage of listed capital to authorized capital also acts as a catalyst for maintaining a reasonable and competitive debt–equity ratio. The ex ante high listed capital percentage also signals the availability of immediate growth opportunities, which ensure the firm’s future viability. We, therefore, hypothesize a positive correlation between firm survival and listed capital percentage.

2.4. Offer Size

Offer size portrays ex ante uncertainty firm value [61]. Riskier firms have a higher relative offer size relative to total assets. They are more likely to underperform in the long run, which decreases the probability of long-term survival [46]. Helbing et al. [59] report a negative relationship between offer size and IPO survival because firms are likely to utilize those proceeds to pay the debt, adversely affecting the firm’s future viability. We hypothesize that offer size has a negative relationship with IPO survival.

2.5. Risk Factors

Risk factors (both systematic and unsystematic) disclosed in the IPO prospectus reflect the potential prevailing uncertainties. Disclosure of material risk factors enables potential investors to assess their extent of emphasis on IPO subscription [62]. Prospective investors primarily assess the risk profile of the IPO issuers via ex ante disclosed risk factors in the IPO prospectus [45,48]. Regulatory authorities require the disclosure of all material financial and nonfinancial information in the IPO prospectus. However, managers are reluctant to disclose unfavorable information to avoid adverse undersubscription and underpricing [45]. Hensler et al. [58] document the negative (positive) relationship between risk factors and firm survival (hazard rate). They find riskier firms more prone to a high probability of default (hazard) resulting from adverse operating outcomes. Derouiche et al. [23] find a negative relationship between disclosed risk factors and the survival of French IPOs. Accordingly, ‘the higher the risk, the higher the return’ notion leads to a higher probability of default in the long term if corporations fail to devise effective risk diversification strategies. Therefore, we hypothesize a negative correlation between IPO survival and disclosed risk factors.

3. Methods

3.1. Research Design and Data Description

The present study is quantitative and explanatory as it tests a priori hypotheses. It comprises the cohort research design because explanatory variables are not randomized. Further, the dates of entry and exit from the study are individually defined. Therefore, the size of the study population is not constant. IPO data from 1990 to 1999 were captured from the printed prospectuses and Investor Digest available from Bursa Malaysia. Data from 2000 to 2020 were captured from the available online prospectuses on the Bursa Malaysia website. Data on delisted firms were obtained via Historical Data Packages available from Bursa Malaysia. Some data about the age of the firm were also captured from Eikon DataStream and S&P 500. We used STATA software to derive the descriptive statistics and statistical inference.
Keeping in view the complexity of the Malaysian equity capital market, we first shed light on the equity market structural information over the study period from 1990 to 2017, as shown below in Table 1. It is pertinent to note that Second Board was introduced in 1988 to facilitate and encourage medium enterprises to list their securities on the capital market to avail funding and growth opportunities. The regulatory regime had a provision for the IPOs listed on Second Board to transition to Main Board upon compliance with the regulatory listing requirements of Main Board. Any such transition was neither delisting from Second Board nor the new listing on Main Board. In other words, the other objective of establishing Second Board was to boost Main Board listings indirectly. That is why Second Board was merged with Main Board in 2009 on some rational grounds. The MESDAQ Market (launched on 6 October 1997) became part of Bursa Malaysia in 2002 for emerging high-growth and technology-based firms. This market was renamed ACE Market in 2009.
Table 2 describes the population, sample size justification, and tracking period details based upon the above discussion. This table lays the foundation for inferential statistics. The study population (captured from Bursa Malaysia IPO listing statistics) consists of 1069 IPOs listed from 1990 to 2017. Firms listed as trusts, special purpose acquisition companies (SPACs), and those with incomplete data were excluded. Thirteen firms considered as outliers were also omitted. The final sample size comprised 943 IPOs, representing 88.21% of the population. The maximum covered study period for IPO listing was 28 years (1990–2017). The sample was divided according to the regulatory regimes from 1990 to 2017. Since Main Board and Second Board remained separate up to 2009, we first examine them independently. Then, we examine the IPOs that were solely listed on Main Market (previously Main Board up to 2009) separately without incorporating any transition from Second Board to Main Board. Then, we investigate the combined listings of Main Market and Second Board on the premise that Second Board was formed to support Main Board/Market. Finally, we examine ACE Market and compare it with Main Market.
Survival studies advocate incorporating some follow-up, as suggested by Espenlaub et al. [10] and Ahmad and Jelic [16]. The follow-up period facilitates tracking the IPO even after the cutoff date of data. Accordingly, the enhanced survival time enables capturing the survival of IPOs listed in the most recent years of the cutoff date. In other words, the follow-up period enhances the survival-specific descriptive statistics and survival probabilities of IPO life tables. Hence, this study’s follow-up period was 3 years (2018–2020) where the data analysis ranges from 1990 to 2017 data, and the follow-up period was 6 years (2010–2015) where the data analysis ranges from 1990 to 2009.
Moreover, the present study encompasses right censoring indicating that observed survival time is less than true survival time [63], as shown below. The observed survival time and listing period vary according to the nature of the data and relevant analysis. For instance, Figure 2 demonstrates the prediction of survival of IPOs listed on Main Market from 1990 to 2017, with 3 years of follow-up (2018–2020). The tracking period (IPO listing cutoff plus follow-up period) consists of 31 years. Likewise, for Second Board IPOs and Main Board IPOs survival analysis, the tracking period would be 26 years (listing period: 1990–2009; follow-up period: 2010–2015). For the survival analysis of ACE Market IPOs, the tracking period would be 19 years (listing period: 2002–2017; follow-up period: 2018–2020). Following Iwasaki and Kočenda [25], we used the Breslow approximation technique to handle the right censoring.

3.2. Model and Variable Description

To estimate the survival function, let T be the non-negative random variable representing survival time of the listed IPOs, t denote any specific value of T, and δ denote censoring (right censoring: because we do not know the true survival time); then survivor function S(t) is defined as
S ( t ) = P   ( T > t ) = 1 f ( t ) = t f ( x ) d x
where S(t) is the probability ranging from 0 to 1 and t ranges from 0 to .
With reference to Figure 3, when we evaluate whether the IPOs listed on the Main Market survive more than 31 years (right censoring δ , where δ 1 = D e l i s t i n g   a n d   δ 0 = c e n s o r e d ) , then for t = 31, the T exceeds t (T > 31). In other words, for every value of t = 1, 2, 3, 4, …, 31, the random variable T > 1, T > 2, T > 3, T > 4, …, T > 31. Likewise, the values of survival random variable T and specific value of survival time t of IPOs for Second Board, Main Board, and ACE Market are determined. In a nutshell, the survival function S(t) enables survival probabilities to be obtained for varying values of t.
The hazard function h(t) estimates the instantaneous potential per unit time for the delisting to occur, given that the IPO has survived up to time t. The hazard function, unlike the survivor function, focuses on delisting and gives a conditional failure rate. Unlike the survival function (which provides the survival with probability from 0 to 1), the hazard rate ranges from 0 to infinity. This rate is used in describing the specific model form (e.g., Weibull, lognormal, or exponential curve) that fits the survival data. The conditional property in the hazard function depicts that survival time T of an IPO will lie in the interval between its relevant specific time t and t + ∆t, given that the survival time is equal to or greater than the specific time t. We use this model for robustness in Section 4.6.
h ( t ) = lim t 0 P ( t T < t + t \ T t ) / t
To compare two or more listing boards/markets at different points in the time of follow-up, we estimate Kaplan–Meier (KM) survival curves. The KM survival curves indicate the extent to which survival probabilities remain very close over the tracking period. This study employs the long-rank test for comparing the survival curves using exposure variables. The exposure variables are the listing board/markets (Second Board, Main Board/Market, and ACE Market). Log-rank test is like a large-sample chi-square test, with G-1 degrees of freedom based on the difference of the summed observed score and expected score for the given exposure variables and their variance estimates. The following product limit formula, initially proposed by Kaplan and Meier [64], is used to obtain the probability of surviving the previous delisting time multiplied by the conditional probability of surviving past the current delisting time:
S ^ ( t j ) = i = 1   j P r [ T > t i   \ T t i   ] = S ^ ( t ( j 1 ) )   P r [ T > t i   \ T t i   ]  
We use Cox proportional hazard (PH) Model [65] to draw inferential statistics. The Cox PH model is semiparametric because the function h ˳ (t), unlike parametric models, is unspecified. The exponential part of this model always provides non-negative hazard estimates because the hazard (failure) ranges from 0 to infinity. The Cox model is robust as its estimation approximates the inference from the correct parametric model, regardless of the distribution of survival time T [29]. Unlike the logit model with the dichotomous outcome, the Cox PH model considers duration to delisting for each delisted IPO [66]. Equation (4) indicates that delisting (hazard) at time t is the product of the baseline hazard function ( h ˳ ) and exponential function to the linear sum of βiXi, where the sum is over the n explanatory X variables. Equation (4) shows the expanded explanatory variables:
h ( t , X ) = h ˳ e i = 1 n β 1 L _ m k t + β 2 S _ p r + β 3 F _ size + β 4 L _ c a p + β 5 O _ s i z e + β 6 R _ f a c + β 7 F _ l e v + β 8 F _ a g e + β 9 E P S
Depicts the names, notations, definitions, measurement criteria, and data sources of dependent and independent variables as in Table 3. Previously used in biological and engineering studies, survival models have also gained recognition in predicting corporate failures [66]. Unlike linear and logistic regression, where the respective outcome variable is continuous and dichotomous, the survival analysis is based on ‘the time to event’ outcome variable [67]. By event, we mean IPO delisting. Within this study’s context, the response variable ‘time’ was measured in terms of the number of years from the date of incorporating a public firm until the event called ‘delisting’ occurs.
It is pertinent to note that the exposure variable becomes the primary study variable when we compare two or more listing markets, and the remaining variables of interest would be classified as effect modifiers. Accordingly, when we predict the IPO survival of a one listing market, then there will be no involvement of the exposure variable. Besides, this study incorporates control variables used by previous studies such as firm age at the listing date [10,16,68], financial leverage to control financial risk [1,16], and trailing earnings per share (EPS) to control profitability. Unlike previous studies [17,23,29] that use return on assets (ROA) as a proxy for profitability, we use earnings per share (EPS) because the prospective investors focus on trailing EPS for valuing the stock price. Further, the trailing EPS becomes the base for the price–earnings ratio (PE multiple), one of the determinants of stock price by investors and underwriters. The prospectus information of most of the Malaysian firms reveals that PE multiple, among other determinants such as net tangible assets, becomes the basis for arriving at the stock offer price.

4. Results

This section describes the overall descriptive statistics, variance inflation factor, survival-specific descriptive statistics, and inferential statistics for Main Market, Second Board, ACE Market, and respective comparisons.

4.1. Overall Descriptive Statistics

Table 4 describes conventional descriptive statistics for the Main Market (including Main Board), Second Board, and ACE Market. These conventional measures are different from survival-specific descriptive statistics (that take into account the ‘times at risk’ measure for central tendency). We only explain the dependent variable, survival time (S_t), for clarity between the listing and follow-up period.
The descriptive statistics for Main Market for 350 listed IPOs from 1990 to 2017 with 3 years of follow-up (2018–2020) show a minimum observed survival time (S_t) of 2.71 years and a maximum survival time of 30.97 years with a median survival time of 16.03 years. A high standard deviation of 7.64 years demonstrates the high vulnerability of survival time for Main Market IPOs. The descriptive statistics for Second Board comprise 432 listed IPOs listed from 1990 to 2009 with 6 years of follow-up (unreported) ranging from 2010 to 2015). The survival time for Second Board ranges from 3.35 to 25.65 years (unreported) when we only consider Second Board. However, after the merger with Main Board in 2009, the survival time for Second Board IPOs (from 1990 to 2017 with 3 years (2018–2020) follow-up) ranges from 3.35 to 30.88 years. The summary statistics for the explanatory variables of Second Board will remain the same whether the total tracking period for Second Board IPOs is 1990–2015 or 1990–2020 because no new IPO was listed on Second Board after 2009 due to its merger with Main Board.
The descriptive statistics for ACE Market for 161 listed IPOs from 2002 to 2017 with 3 years of follow-up (2018–2020) show that the minimum survival time is 3.17 years, the maximum survival time is 18.71 years, and the median survival time is 15.03 years. A low standard deviation of 4.64 years demonstrates the comparatively low failure vulnerability for ACE Market IPOs compared to Main Board and Second Board IPOs. The descriptive statistics for the overall three listing markets for 943 listed IPOs from 1990 to 2017 with a minimum of 3 years of follow-up (2018–2020) show that the minimum survival time is 2.71 years, the maximum survival time is 30.97 years, and the median survival time is 16.80 years. A high standard deviation of 6.93 years demonstrates a high vulnerability of survival for overall market IPOs.

4.2. Variance Inflation Factor

Table 5 portrays the variance inflation factors (VIFs) addressing the multicollinearity issue. The values of VIF ranges are within a moderately correlated range of 1 to 5. Hence, there exists no grave multicollinearity issue for predictors.

4.3. Survival Specific Descriptive Statistics

Table 6 describes total, delisted, and censored IPOs. Times at risk depicts the collection of individual IPOs that survived at least to time tj irrespective of delisting or censoring. This hazard rate shows that the hazard rate of the IPOs listed on Second Board remained higher than that of those on Main Board from 1990 to 2009. The hazard rate of the IPOs listed on Main Market (including Main Board) from 1990 to 2017 remained marginally lower. However, after the merger of Main Board and Second Board in 2009, the combined hazard rate was marginally higher than premerger hazard rates. The hazard rate of the IPOs listed on ACE Market is substantially low, representing 10.53%.

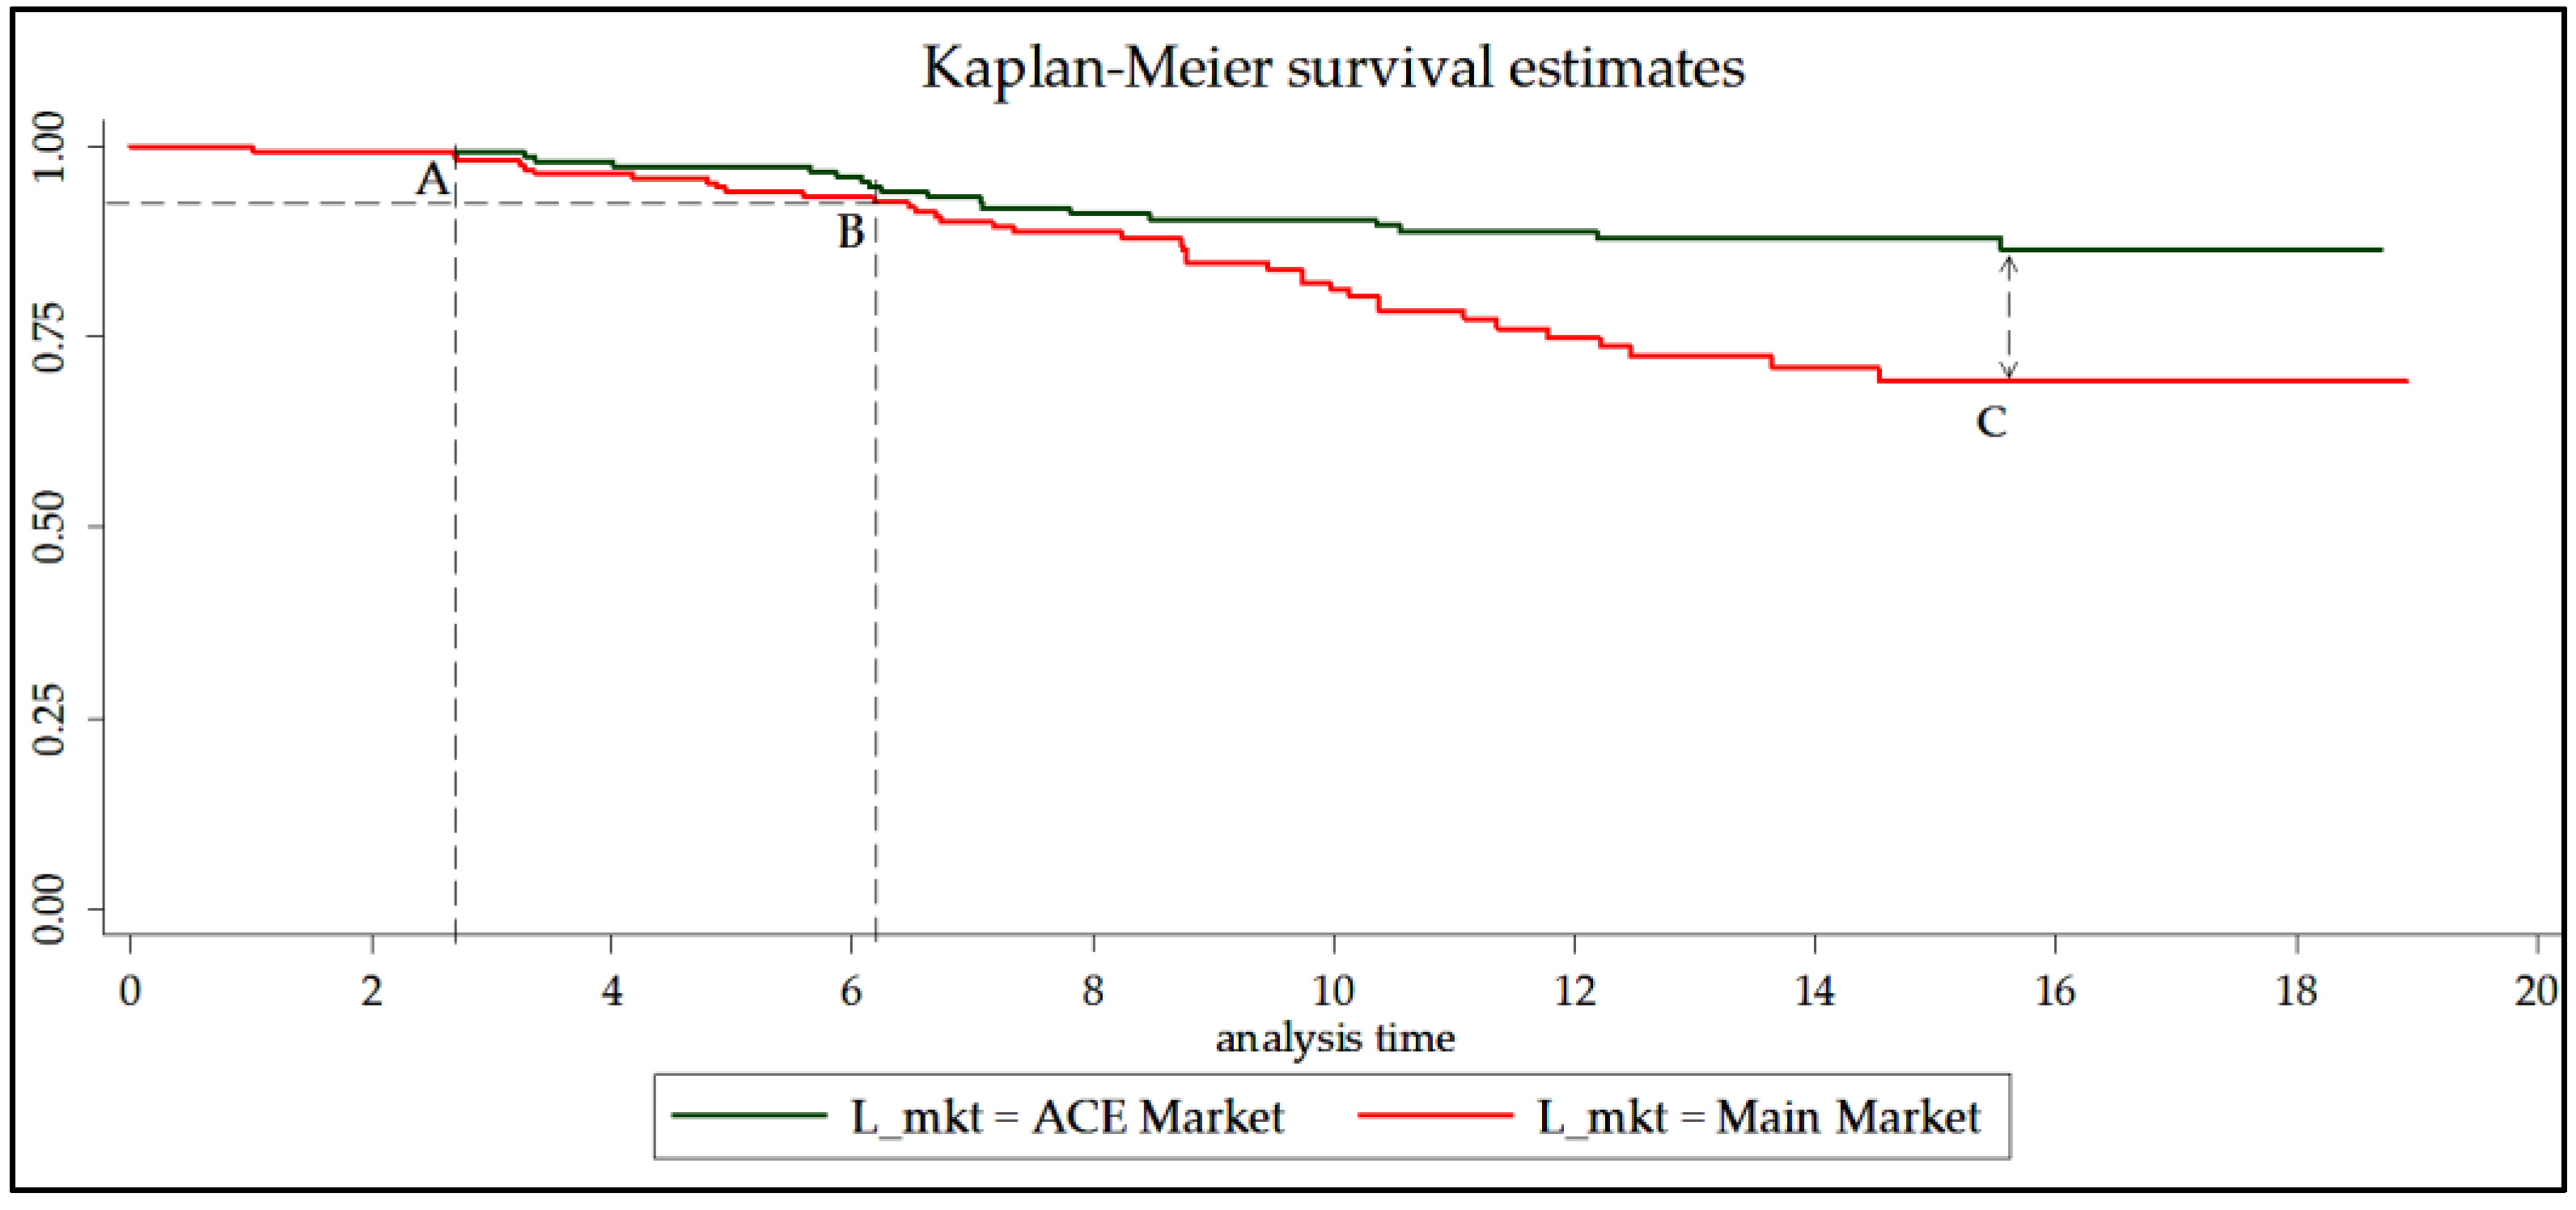
4.4. Kaplan–Meier (KM) Survival Estimates

Using Equation (3), we plot Kaplan–Meier (KM) survival curves to compare Second Board and Main Board IPO survival time at different points in time of the tracking period (listing period: 1990–2009; follow-up: 2010–2015). The KM curves indicate that survival probabilities remained close over the tracking period from 1990 to 2015. The initial survival probability for all listed firms is equal to 1.00, which declines as time passes.
Figure 3 illustrates that the IPOs listed on Main Board survive a minimum period of up to 3.35 years (survival probability is 1.00 up to point S). After 3.35 years, the stepwise gradual delisting of listed IPOs starts. From point S to point A, the survival of Second Board IPOs is better than that of Main Market IPOs. Point A depicts the probability of 0.78 that a listed IPO will survive at least 14.89 years. From point A to point B, the survival probability falls, and the delisting tendency is very close. The decline in survival probability is also sharp. From point B to point C, the survival probability of IPOs listed on Main Board is better than that of Second Board IPOs. From point C to point D, the survival probability of Main Board IPOs tends to decline sharply, and that of Second Board IPOs becomes stable. Figure 3 also depicts the likelihood of 0.50 (median) that a listed IPO will survive at least 25.39 years on Second Board and 23.02 years on Main Board.
Figure 3 does not depict whether the survival curves of Second Board and Main Board are statistically equivalent. That is, we want to estimate whether the true (population) curves are different. So, we use the log-rank test, which is essentially a large-sample chi-square test. The null hypothesis is that there is no difference between the survival curves of Main Board and Second Board. Table 7 reveals that the log-rank statistic is 0.13, and its corresponding p-value is highly insignificant. So, we do not reject the null hypothesis and conclude that the survival curves for the two listing boards are the same.
We also compare Main Market with ACE Market. Table 8 describes survival-specific descriptive statistics comparing Main Market with ACE Market with a tracking period from 2002 to 2020. The hazard rate is substantially low for ACE market IPOs, along with better survival time. Survival time descriptive statistics depict the survival of overall IPOs of both the listing markets exceptionally better and still far from median survival time from 2002 to 2020.
Figure 4 demonstrates the KM survival curves for Main Market and ACE Market from 2002 to 2020. Figure 4 illustrates that the listed IPOs survive up to a minimum of 2.71 years (survival probability is 1.00 up to point A) for Main Market IPOs and 3.17 years for ACE Market IPOs. Subsequently, the stepwise gradual delisting of listed IPOs starts. From point A to point B, the survival of ACE Market IPOs is better than that of Main Market IPOs. From point B onward, the widened gap between IPO survival probabilities indicates that ACE Market IPOs are much better than Main Market IPOs. Finally, the survival curves become parallel from point C, showing that the survival time of IPOs listed on both the listing markets exhibits a constant probability of survival. The survival of ACE Market IPOs is substantially better than that of Main Market IPOs.
We use the log-rank test to estimate whether the true (population) curves are different for Main Market and ACE Market. Table 9 reveals that the log-rank statistic is 9.08, and its corresponding p-value is highly significant (0.0026). So, we reject the null hypothesis and conclude that the survival curves for the two listing boards are not the same. The same is also evident from the KM survival curves.

4.5. Inferential Statistics Cox Proportional Hazard Model

Using Equation (4), Table 10 depicts inferential statistics using Cox proportional hazard (PH) model for the IPOs listed on Main Board (Model I), Second Board (Model II), and the combined Main Board and Second Board (Model III). The coefficients for all the models were obtained by using maximum likelihood (ML) estimate. For a large sample, the z statistic is the Wald statistic used to estimate the ML estimate. The hazard ratio represents a point of the estimate of the effect of predictors on the dependent variable, survival time.
Model I shows that the coefficient of share premium is negative and statistically significant at the 1% level. The hazard ratio (HR) is 0.63627, indicating that the failure risk of IPOs decreases (survival time increases) by 0.3637 years with a 1% increase in share premium. The coefficient of firm size is positive and significant at the 1% level with a hazard ratio of 2.04623. It indicates that a 1% increase in firm size increases the failure risk (decreases the survival) of an IPO by 0.0105 years. The dependent variable is in years and firm size is in log form. Accordingly, we transform it into years as (2.04623–1.00)/100. The coefficient of listed capital is negative and statistically significant at the 5% level. The hazard ratio (HR) is 0.27419, indicating that the failure risk of an IPO decreases (survival time increases) by 0.7258 years with a 1% increase in listed capital. Risk factors have a positive coefficient significant at the 1% level with a hazard of 1.10069, indicating that one unit increase in risk factors increases the failure risk (decreases the survival) of an IPO by 0.10 years.
Out of three control variables, the coefficient of firm age is negative and statistically significant at the 5% level. The hazard ratio (HR) is 0.96953, indicating that the failure risk of an IPO decreases (survival time increases) by 0.03 years with a 1-year increase in ex ante firm age. Likewise, the coefficient of share premium is negative and statistically significant at the 1% level for Second Board (Model II) and in the combined results of Main Board and Second Board (Model III) with respective hazard ratios. The coefficient of firm size is positive and significant at the 1% level in Model II and Model III. However, the failure risk of large-firm-size IPOs listed on Second Board is substantially high compared to Main Board IPOs, as depicted by the magnitude of high HR of 4.92905. The coefficient of listed capital is negative and statistically significant at 5% and 1% levels for Model II and Model III, respectively. Risk factors have a positive coefficient significant at 1% for both models II and III with their respective hazard ratios. The coefficient of firm age is negative and statistically significant at the 1% level for Model II and Model III.
We test the PH assumption using the goodness of fit (GIF) approach based upon the Schoenfeld residuals technique initially proposed by Schoenfeld [69]. The P(PH) depicts that all explanatory variables hold the PH assumption as Prob > chi2 is greater than the threshold value 0.10, indicating the Schoenfeld residuals are not related to survival time.
Using Equation (4), Table 11 depicts inferential statistics using Cox proportional hazard (PH) model for the IPOs listed on Main Market, including Main Board from 1990 to 2017 (Model IV); overall combined results for Main Market (including Main Board) and Second Board IPOs that listed on Second Board and then transferred to Main Market upon merger in 2009, from 1990 to 2017 (Model V); and ACE Market (Model VI) from 2002 to 2017. In Model IV and Model V, the coefficient of share premium is negative and statistically significant at the 1% level with respective hazard ratios. The coefficient of firm size is positive and significant at the 5% level in Model IV and Model V. However, the failure risk of large-firm-size IPOs listed on Main Market is substantially high compared to the Model V IPOs, as depicted by a high HR of 1.62601. The coefficient of listed capital is negative and statistically significant at 10% and 5% levels for Model IV and Model V, respectively.
Risk factors have a positive coefficient significant at 1% for both models with their respective hazard ratios. The coefficient of firm age is negative and statistically significant at 10% and 1% levels for Model IV and Model V, respectively. The financial leverage has a positive coefficient, significant at 10% and 5% for Model IV and Model V, respectively. Model VI (ACE Market) depicts that share premium is the only significant variable with a positive coefficient. The hazard ratio of share premium is 1.23003, indicating that the failure risk of IPOs increases (survival time decreases) by 0.23 years with a 1% increase in share premium. The rest of the variables for ACE Market are insignificant. The P(PH) depicts that all explanatory variables hold the PH assumption as Prob>chi2 is greater than the threshold value 0.10, indicating the Schoenfeld residuals are not related to survival time.

4.6. Robustness Tests

We use several robustness parametric distributions (unreported) such as exponential, Weibull, log-logistic, lognormal, and generalized gamma to find the true shape of the parametric distribution that closely resembles the overall semi parametric models explained in Table 10 and Table 11. We find the Weibull log relative hazard model the best estimate for robustness. The Weibull model’s hazard function is h(t) = λpt p − 1, where p and λ > 0. As with the exponential model, λ will be reparameterized with regression coefficients. The additional parameter p is called a shape parameter which determines the shape of the hazard function. If p > 1, then the hazard increases as time increases. If p = 1, then the hazard is constant, and the Weibull model becomes equivalent to the exponential model h(t) = λ. If p < 1, then the hazard decreases over time. The Weibull parametric model’s unique property, that if PH assumption holds, then accelerated failure time (AFT) also holds, makes it more flexible and momentous [70].
Table 12 illustrates the empirical results of Weibull distribution for models I, II, and III. These results exhibit a minimal deviation from the results reported in Table 10 and Table 11 using the Cox PH estimation technique. The estimate of shape parameter p is greater than 1.00 for models I, II, and III in Table 12, indicating that IPOs listed on both Main Board and Second Board follow increasing Weibull shape. It is also evident from the significant p-value (0.000) of ln(p) that p is not equal to 1.00. Hence, an exponential parametric model is inappropriate for the IPOs listed on Main Board and Second Board over the follow-up period 1990–2015.
Table 13 illustrates the empirical results of Weibull distribution for models IV, V, and VI. The estimate of shape parameter p is greater than 1.00, showing hazard function for the overall Main Market, Main Market (including Second Board), and ACE Market IPOs also exhibit increasing Weibull. Hence, an exponential parametric model is inappropriate for the IPOs listed on Main Board and Second Board over the follow-up period 1990–2017.
Using Equation (2), we have derived Weibull regression cumulative hazard function curves to demonstrate the shape of the curve in Figure 5 and Figure 6. The cumulative hazard plot consists of the cumulative hazard time versus the time t_i of the ith delisting. Figure 5 demonstrates Weibull regression cumulative hazard function curves for the models I, II and III. It is evident that IPOs listed on Main Board (Model I) indicate a gradual and consistent increase in IPO delisting. Sharp delisting occurs from year 12 to year 24 over the tracking period 1990–2015. The cumulative hazard for the IPOs listed on Second Board (Model II) indicates fewer IPO delistings at the early stage, approximately up to 7 years, and then a sharp increase in IPO delistings from year 8 to year 18. Subsequently, the IPO delisting increases gradually. We derive this inference from the life table of survival data with cumulative hazard (unreported). The cumulative hazard for Model III impacts Second Board IPOs, which remain vulnerable at early stages starting from year 7 until year 19. Then, the delisting tendency of IPOs increases gradually. These results depict that most of the IPO failure occurs from year 9 to year 23 for both the listing boards with tracking period 1990–2015.
Figure 6 demonstrates Weibull regression cumulative hazard function curves for the models IV, V and VI. The cumulative hazard for the IPOs listed on Main Market (Model IV) improves over time. The IPOs listed on Main Market (from 2009 to 2017) survive better, which ultimately improves the cumulative hazard curve for the overall Main Market with tracking period 1990–2020. The cumulative hazard for Model V indicates fewer IPO delistings at the early stage and a sharp increase in IPO delistings from year 8 to year 25. Later on, the IPO delisting is improved. We derive this inference from the life table of survival data with cumulative hazard (unreported). The cumulative hazard for Model VI remained stable and less alarming because of fewer IPO delistings from 2002 to 2020.

5. Discussion

Unlike previous short-period studies [10,16,25] consisting of developed capital markets, a short sample period, and mixed determinants (from the firm, investor, and regulator perspectives) of IPO survival, this study has examined the impact of ex ante strategic IPO characteristics, with substantially long tracking periods comprising 25.65 and 30.97 years, on IPO survival probabilities. We have also made comparisons of the listing board and markets over the tracking period to examine the rationality for IPO survival of the merger of Second Board with Main Board (2009) and introducing a new listing market, ACE Market (2002).
The descriptive statistics for Main Board and Second Board with tracking period 1990–2015 shows that 786 IPOs (the population) represent 59% listings on Second Board and 41% listings on Main Board. After the Second Board (2009) merger, Main Board was renamed Main Market, where only 115 IPOs were listed from 2009–2017. Therefore, the unification of Main Board and Second Board substantially reduced the new IPOs, adversely affecting the market size. It is worth mentioning that MESDAQ Market’s (Currently ACE Market) launching in 2002 was not an alternative to the Second Board.
The Kaplan–Meier survival estimates comparing Main Board and Second Board remained consistent and very close over the tracking period 1990–2015. Further, the insignificant value of the log-rank test for the equality of survival functions establishes that the survival curves for Main Board and Second Board were the same statistically. This relationship supports the objective of Bursa Malaysia introducing Second Board to support Main Board. However, despite the survival consistency of Second Board IPOs with Main Board IPOs, the Malaysian regulatory authority merged this board with Main Market. As a result, the overall IPO activity was substantially reduced from 2009 to 2017 on Bursa Malaysia. The underlying rationale for merging Second Board with Main Market was improving the market liquidity of Main Market. Nevertheless, this rationale is not justifiable as the merger of Second Board into Main Market restricted the IPOs via Second Board. This regulatory decision hindered the IPOs of those firms that would have been listed on Second Board due to its less stringent listing requirements.
The Kaplan–Meier survival estimates for comparing Main Market and ACE Market with tracking period 2002–2020 indicate that the two survival curves are not statistically the same. However, the survival of ACE Market IPOs is substantially higher than that of Main Market IPOs, which is also consistent with introducing ACE Market only for high-growth and technology companies. The objective of ACE Market was to support Main Market. The Kaplan–Meier survival estimates support us in interpreting the outcomes of inferential statistics of the listing boards/markets.
The Cox PH model estimates for subsamples (I to VI) describe the predictive role of the ex ante strategic firm characteristics for IPO survival. For models I to V, the IPO survival is positively related to sharing premium, indicating that IPO failure risk decreases as firms charge higher share premium. This result is consistent with previous studies [52,53,54]. It has been observed that Malaysian firms charge high premiums because of the fixed price mechanism for IPO pricing. According to the listing requirements, Main Market/Board and Second Board firms should be profitable in an ex ante 5-year period. Moreover, the high IPO oversubscription by prospective investors enables IPO firms to set high premiums. The issuers also take advantage of prospective investors’ optimism based on their companies’ ex ante high growth performance and charge high premiums [60]. Empirical findings rationalize the high IPO premium ensures the investors’ optimism about firms’ future sustainable growth prospects and longer survival profile. The significant and negative association between share premium and IPO survival for ACE Market reflects their listing regulation that high-growth and technology companies may be listed with ex ante loss history, which precludes them from charging high share premiums. Even if these companies exaggerate the ex ante fundamental to charge a high share premium, it would negatively impact IPO survival.
The IPO survival is negatively related to firm size. That is, as firm size increases, the probability of IPO failure increases. This result supports the notion ‘too big to fail’ that big firms face survival challenges due to complexities in managing large-scale operations, where available resources remain underutilized [25]. Thus, supported by the previous study [56], Bursa Malaysia is an emerging market where large firms face high systematic risk and are subject to high business failure risk. Another reason identified from the delisting reasons (unreported) is that some large-firm-size IPOs opted for voluntary delisting and converted to private companies again.
We tested listed capital due to its unique attribute in the Malaysian capital market. Consistent with our hypothesis, empirical results portray that an increase in listed capital increases the survival probability (decreases the failure risk). This result leads to the inference that prospective investors might think that the high listed capital is a signal of the utilization of equity proceeds to meet the firms’ near future immediate expansion needs. However, from the issuer perspective, the financial risk of these firms is lower because of the low debt–equity ratio, which can be utilized in the future to raise external finance, ensuring longer IPO survival.
The IPO survival has a negative correlation with disclosed risk factors, depicting that Malaysian IPOs follow the notion ‘higher the risk, higher the return’ and a higher probability of default accordingly [23,62]. This further indicates that the risk diversification of Malaysian firms is not adequate. A unique characteristic of Malaysian IPOs is that most companies launching IPO have many subsidiaries. This characteristic increases the associated potential risk factors. IPO prospectus information further reveals that most firms do not classify the risk factors into certain classifications, like business, industry, local, or global risks. Instead, the IPO prospectus contains several risk factors. Among control variables, only firm age is a variable that has a significant positive impact on firm survival from models I to V. This result is consistent with previous studies [10,16,71] showing that a long business (longer ex ante age at IPO listing date) history enables issuers to assure investors about long-term growth and survival prospects of the business. The financial leverage is only a significant negative impact on firm survival in Model IV, which depicts that large firms listed on Main Market tend to have more hazard risk (low survival probability).
We use Weibull log relative hazard model to establish the robustness of the empirical results. Table 12 and Table 13 illustrate that the empirical results of Weibull distribution for all the models I to VI exhibit a minimal deviation from the results reported in Table 10 and Table 11 using the Cox PH estimation technique. The estimate of shape parameter p is greater than 1.00 for all the models I to VI with different intensities of increasing Weibull tendency. It is also evident that p is not equal to 1.00 in all the models. Hence, an exponential parametric model is inappropriate for the IPOs listed.
This study is limited to IPOs listed from 1990 to 2017. Accordingly, it does not consider any IPO listed before 1990 and delisted during the tracking period 1990 to 2020. This study does not account for the recurrent events and competing risk segregating the voluntary and involuntary IPOs. We suggest these as areas for future research because investigating various reasons for IPO delisting may provide informative insights for predicting IPO survival profiles.

6. Conclusions

This study examines the survival of initial public offerings (IPOs) listed on different security listing boards, namely Main Market, Second Board, and ACE Market in the Malaysian equity capital market, Bursa Malaysia, over different horizons with an expanded dataset comprising 31 years. We specifically examine the predictive role of ex ante firm strategic prospectus characteristics as early warning signals for the sustainable survival of Malaysian IPOs. We also evaluate and compare the survival curves of IPOs listed on different listing boards/markets over different horizons concerning different tracking periods according to the changes in regulatory regimes. We also analyze the rationale for unifying the two listing boards (Main Board and Second Board) in 2009 and its potential consequences. Overall empirical results show that survival curves for IPOs listed on Main Board and Second Board were not statistically different. However, Second Board remained more vulnerable to hazard. Our results suggest that merging Second Board with Main Board was not a rational decision to enhance market liquidity. Instead, it hindered many IPOs that would be listed on Second Board because of its less stringent listing requirements. The survival curves for IPOs listed on Main Market and ACE Market are statistically different. Empirical results reveal that ex ante higher share premium, higher percentage listed capital, and longer firm age at the listing date significantly increase the survival (reduce hazard) of IPOs listed on Main Market and Second Board. Conversely, the bigger firm size and more risk factors significantly reduce the survival (increase hazard) of the listed IPOs mentioned above. However, share premium is the only variable that has a negative and significant correlation with IPO survival in ACE Market. These findings support the notion that ex ante strategic firm characteristics convey early warning signals for predicting the survival of Malaysian IPOs.
The findings of this study have implications for prospective investors interested in subscribing to IPOs, affecting their buy-and-hold strategy from an IPO survival profile perspective. IPO prospectus ex ante information facilitates how long an IPO stock is likely to remain listed, which can help the market to anticipate stock pricing and liquidity. Ex ante IPO survival information enables researchers to estimate post IPO survival probability and compare the empirical results across listing security markets with varying IPO prospectus information disclosures. Being the frontline regulator for the capital market, Bursa Malaysia should reassess the need to reintroduce an alternative market to enhance the capital market size. Though the Leading Entrepreneur Accelerator Platform (LEAP) Market was introduced in 2017, it could not attract many IPOs over the years. Empirical findings of this study can be generalized to other developing and emerging markets, particularly in the Asia Pacific region, where the IPO prospectus considerably reduces information asymmetry and ex ante strategic firm characteristics act as early warning signals in predicting IPO survival.

Author Contributions

Conceptualization, I.A.; methodology, I.A.; software, I.A.; validation, I.I. and S.S.S.; formal analysis, I.A.; investigation, I.A.; resources, I.A.; data curation, I.A.; writing—original draft preparation, I.A.; writing—review and editing, I.I. and S.S.S.; supervision, I.I. and S.S.S.; All authors have read and agreed to the published version of the manuscript.

Funding

This research received no external funding.

Institutional Review Board Statement

Not applicable.

Informed Consent Statement

Not applicable.

Data Availability Statement

Data have been manually collected from Bursa Malaysia with prior written approval and authorized access. The paid IPO data can be obtained from Historical Data Packages of Bursa Malaysia.

Acknowledgments

We express our gratitude to Wasim Ahmad (University of Birmingham) for assisting in duration modeling and Hooy Chee Wooi (Universiti Sains Malaysia) for valuable comments during the candidature defense. We are also thankful to Ravikumar Maniam (knowledge Management Centre, Bursa Malaysia) for providing authorized access to historical IPO data.

Conflicts of Interest

The authors declare no conflict of interest.

References

  1. Ayadi, R.; Abid, I.; Guesmi, K. Survival of reorganized firms in France. Financ. Res. Lett. 2021, 38. [Google Scholar] [CrossRef]
  2. Espenlaub, S.; Goyal, A.; Mohamed, A. Impact of legal institutions on IPO survival: A global perspective. J. Financ. Stab. 2016, 25, 98–112. [Google Scholar] [CrossRef]
  3. Balios, D.; Eriotis, N.; Missiakoulis, S.; Vasiliou, D. Delisted versus voluntary delisted versus remain listed: An ordered analysis. Appl. Econ. Lett. 2014, 22, 66–70. [Google Scholar] [CrossRef]
  4. Kashefi Pour, E.; Lasfer, M. Why do companies delist voluntarily from the stock market? J. Bank. Financ. 2013, 37, 4850–4860. [Google Scholar] [CrossRef]
  5. Algebaly, E.-A.M.; Ibrahim, Y.; Ahmad-Zaluki, N.A. The determinants of involuntary delisting rate in the Egyptian IPO equity market. Rev. Account. Financ. 2014. [Google Scholar] [CrossRef]
  6. Helbing, P. A review on IPO withdrawal. Int. Rev. Financ. Anal. 2019, 62, 200–208. [Google Scholar] [CrossRef]
  7. Feng, C.; Patel, P.C.; Xiang, K. The well-trodden path: Complementing market and entrepreneurial orientation with a strategic emphasis to influence IPO survival in the United States. J. Bus. Res. 2020, 110, 370–385. [Google Scholar] [CrossRef]
  8. Serio, R.G.; Dickson, M.M.; Giuliani, D.; Espa, G. Green Production as a Factor of Survival for Innovative Startups: Evidence from Italy. Sustainability 2020, 12, 9464. [Google Scholar] [CrossRef]
  9. Josefy, M.A.; Harrison, J.S.; Sirmon, D.G.; Carnes, C. Living and Dying: Synthesizing the Literature on Firm Survival and Failure across Stages of Development. Acad. Manag. Ann. 2017, 11, 770–799. [Google Scholar] [CrossRef]
  10. Espenlaub, S.; Khurshed, A.; Mohamed, A. IPO Survival in a Reputational Market. J. Bus. Financ. Account. 2012, 39, 427–463. [Google Scholar] [CrossRef]
  11. Martinez, I.; Serve, S. Reasons for Delisting and Consequences: A Literature Review and Research Agenda. J. Econ. Surv. 2017, 31, 733–770. [Google Scholar] [CrossRef]
  12. Jain, B.A.; Martin, C.L.M.C.L. The Association Between Audit Quality and Post-IPO Performance: A Survival Analysis Approach. Rev. Account. Financ. 2005, 4, 50–75. [Google Scholar] [CrossRef]
  13. Chi, J.; McWha, M.; Young, M. The performance and the survivorship of New Zealand IPOs. Int. Rev. Financ. Anal. 2010, 19, 172–180. [Google Scholar] [CrossRef]
  14. Ferris, S.P.; Hao, Q.; Liao, M.-Y. The Effect of Issuer Conservatism on IPO Pricing and Performance*. Rev. Financ. 2013, 17, 993–1027. [Google Scholar] [CrossRef]
  15. Austin, P.C. A Tutorial on Multilevel Survival Analysis: Methods, Models and Applications. Int. Stat. Rev. 2017, 85, 185–203. [Google Scholar] [CrossRef] [PubMed]
  16. Ahmad, W.; Jelic, R. Lockup Agreements and Survival of UK IPOs. J. Bus. Financ. Account. 2014, 41, 717–742. [Google Scholar] [CrossRef] [Green Version]
  17. Alhadab, M.; Clacher, I.; Keasey, K. Real and accrual earnings management and IPO failure risk. Account. Bus. Res. 2015, 45, 55–92. [Google Scholar] [CrossRef]
  18. Macey, J.; O’Hara, M.; Pompilio, D. Down and out in the stock market: The law and economics of the delisting process. J. Law Econ. 2008, 51, 683–713. [Google Scholar] [CrossRef] [Green Version]
  19. Bhattacharya, U.; Borisov, A.; Yu, X. Firm mortality and natal financial care. J. Financ. Quant. Anal. 2015, 50, 61–88. [Google Scholar] [CrossRef]
  20. Lewellyn, K.B. A cross-national investigation of IPO activity: The role of formal institutions and national culture. Int. Bus. Rev. 2014, 23, 1167–1178. [Google Scholar] [CrossRef]
  21. Fertala, N. The shadow of death: Do regional differences matter for firm survival across native and immigrant entrepreneurs? Empirica 2007, 35, 59–80. [Google Scholar] [CrossRef]
  22. Cattaneo, M.; Meoli, M.; Vismara, S. Financial regulation and IPOs: Evidence from the history of the Italian stock market. J. Corp. Financ. 2015, 31, 116–131. [Google Scholar] [CrossRef]
  23. Derouiche, I.; Sassi, S.; Toumi, N. The control-ownership wedge and the survival of French IPOs. J. Appl. Account. Res. 2018, 19, 271–294. [Google Scholar] [CrossRef]
  24. Shari, W. Survival of the Malaysian initial public offerings. Manag. Sci. Lett. 2019, 607–620. [Google Scholar] [CrossRef]
  25. Iwasaki, I.; Kočenda, E. Survival of service firms in European emerging economies. Appl. Econ. Lett. 2019, 27, 340–348. [Google Scholar] [CrossRef]
  26. Makrominas, M.; Yiannoulis, Y. IPO determinants of delisting risk: Lessons from the Athens Stock Exchange. In Accounting Forum; Routledge: London, UK, 12 March 2021; pp. 1–25. [Google Scholar]
  27. Souitaris, V.; Zerbinati, S.; Peng, B.; Shepherd, D. Should I stay or should I go? Founder power and exit via initial public offering. Acad. Manag. J. 2020, 63, 64–95. [Google Scholar] [CrossRef]
  28. Ghahroudi, M.R.; Hoshino, Y.; Fakhraei, E. Ownership Structure, Capital Structure, and Firm Survival. Int. J. Econ. Financ. 2019, 11, 1–19. [Google Scholar] [CrossRef]
  29. Baumöhl, E.; Iwasaki, I.; Kočenda, E. Institutions and determinants of firm survival in European emerging markets. J. Corp. Financ. 2019, 58, 431–453. [Google Scholar] [CrossRef] [Green Version]
  30. Corhay, A.; Teo, S.; Tourani Rad, A. The long run performance of Malaysian initial public offerings (IPO): Value and growth effects. Manag. Financ. 2002, 28, 52–65. [Google Scholar] [CrossRef]
  31. Ahmad-Zaluki, N.A.; Campbell, K.; Goodacre, A. The Long Run Share Price Performance of Malaysian Initial Public Offerings (IPOs). J. Bus. Financ. Account. 2007, 34, 78–110. [Google Scholar] [CrossRef]
  32. Low, S.-W.; Yong, O. Explaining over-subscription in fixed-price IPOs—Evidence from the Malaysian stock market. Emerg. Mark. Rev. 2011, 12, 205–216. [Google Scholar] [CrossRef]
  33. Mohd Rashid, R.; Abdul-Rahim, R.; Yong, O. The influence of lock-up provisions on IPO initial returns: Evidence from an emerging market. Econ. Syst. 2014, 38, 487–501. [Google Scholar] [CrossRef]
  34. Tajuddin, A.H.; Abdullah, N.A.H.; Taufil-Mohd, K.N. Does Growth Opportunity Matter in Explaining the Oversubscription Phenomena of Malaysian IPO? Procedia Soc. Behav. Sci. 2016, 219, 748–754. [Google Scholar] [CrossRef] [Green Version]
  35. Albada, A.; Yong, O.; Mat Hassan, M.E.; Abdul-Rahim, R. Retention Ratio, Lock-Up Period and Prestige Signals and Their Relationship With Initial Public Offering (IPO) Return: Malaysian Evidence. Asian Acad. Manag. J. Account. Financ. 2018, 14, 1–23. [Google Scholar] [CrossRef]
  36. Albada, A.; Low, S.-W.; Yong, O. Prestige signals and heterogeneity of opinion regarding IPO values: Malaysian evidence. Int. J. Emerg. Mark. 2019, 15, 302–319. [Google Scholar] [CrossRef]
  37. Albada, A.; Yong, O.; Low, S.-W. Relationship between prestige signals and over-subscription ratio. Int. J. Manag. Financ. 2019, 15, 564–579. [Google Scholar] [CrossRef]
  38. Albada, A.; Yong, O.; Low, S.-W. Signalling Effect of Auditor Reputation and Lock-up Period on Over-Subscription Ratio: Evidence from Malaysian Fixed-Price IPOs. Int. J. Bus. Soc. 2020, 21, 253–267. [Google Scholar] [CrossRef]
  39. Albada, A.; Yong, O. A Review of IPO Under-pricing Phenomenon in Asia. Int. J. Bank. Financ. 2020, 14, 1–26. [Google Scholar] [CrossRef]
  40. Spence, M. Job Market Signaling. Q. J. Econ. 1973, 87, 355–374. [Google Scholar] [CrossRef]
  41. Connelly, B.L.; Certo, S.T.; Ireland, R.D.; Reutzel, C.R. Signaling Theory: A Review and Assessment. J. Manag. 2010, 37, 39–67. [Google Scholar] [CrossRef]
  42. Akerlof, G. The Market for Lemons: Qualitative Uncertainty and the Market Mechanism. Q. J. Econ. 1970, 84, 488–500. [Google Scholar] [CrossRef]
  43. Leland, H.E.; Pyle, D.H. Informational asymmetries, financial structure, and financial intermediation. J. Financ. 1977, 32, 371–387. [Google Scholar] [CrossRef]
  44. Daily, C.M.; Certo, S.T.; Dalton, D.R. Investment bankers and IPO pricing: Does prospectus information matter? J. Bus. Ventur. 2005, 20, 93–111. [Google Scholar] [CrossRef]
  45. Ding, R. Disclosure of Downside Risk and Investors’ Use of Qualitative Information: Evidence from the IPO Prospectus’s Risk Factor Section. Int. Rev. Financ. 2016, 16, 73–126. [Google Scholar] [CrossRef]
  46. Bhabra, H.S.; Pettway, R.H. IPO prospectus information and subsequent performance. Financ. Rev. 2003, 38, 369–397. [Google Scholar] [CrossRef]
  47. Carpentier, C.; Suret, J.-M. The survival and success of Canadian penny stock IPOs. Small Bus. Econ. 2011, 36, 101–121. [Google Scholar] [CrossRef] [Green Version]
  48. Van der Goot, T.; van Giersbergen, N.; Botman, M. What determines the survival of internet IPOs? Appl. Econ. 2009, 41, 547–561. [Google Scholar] [CrossRef]
  49. Mousa, F.-t.; Bierly, P.E.; Wales, W.J. Different strokes: IPO risk factors, investor valuation, and firm survival. J. Manag. Organ. 2014, 20, 348. [Google Scholar] [CrossRef]
  50. Gao, L.; Rezaee, Z.; Yu, J. Peer firms’ earnings predictability and pricing efficiency–evidence from IPOs*. Eur. J. Financ. 2020, 26, 1332–1353. [Google Scholar] [CrossRef]
  51. Loughran, T.; Ritter, J. Why has IPO underpricing changed over time? Financ. Manag. 2004, 33, 5–37. [Google Scholar] [CrossRef] [Green Version]
  52. Bayar, O.; Chemmanur, T.J. What drives the valuation premium in IPOs versus acquisitions? An empirical analysis. J. Corp. Financ. 2012, 18, 451–475. [Google Scholar] [CrossRef]
  53. Guo, H. IPO first-day return and ex ante equity premium. J. Financ. Quant. Anal. 2011, 46, 871–905. [Google Scholar] [CrossRef]
  54. Ljungqvist, A.; Nanda, V.; Singh, R. Hot markets, investor sentiment, and IPO pricing. J. Bus. 2006, 79, 1667–1702. [Google Scholar] [CrossRef]
  55. Riaz, S.; Hanifa, M.H.; Zainir, F. Does Foreign Institutional Equity Participation Instigate Sustainable Corporate Investment Efficiency? Evidence from Emerging Economies. Sustainability 2021, 13, 4190. [Google Scholar] [CrossRef]
  56. Moosa, I. The myth of too big to fail. J. Bank. Regul. 2010, 11, 319–333. [Google Scholar] [CrossRef] [Green Version]
  57. Fishman, A.; Don-Yehiya, H.; Schreiber, A. Too big to succeed or too big to fail? Small Bus. Econ. 2018, 51, 811–822. [Google Scholar] [CrossRef]
  58. Hensler, D.A.; Rutherford, R.C.; Springer, T.M. The survival of initial public offerings in the aftermarket. J. Financ. Res. 1997, 20, 93–110. [Google Scholar] [CrossRef]
  59. Helbing, P.; Lucey, B.M.; Vigne, S.A. The determinants of IPO withdrawal–Evidence from Europe. J. Corp. Financ. 2019, 56, 415–436. [Google Scholar] [CrossRef] [Green Version]
  60. Baker, M.; Wurgler, J. Market timing and capital structure. J. Financ. 2002, 57, 1–32. [Google Scholar] [CrossRef]
  61. Schultz, P. Unit initial public offerings: A form of staged financing. J. Financ. Econ. 1993, 34, 199–229. [Google Scholar] [CrossRef]
  62. Ng, S.H.; Lee, C.S. Does IPO prospectus in Malaysia disclose relevant risk? Asia-Pac. J. Bus. Adm. 2019, 11, 301–323. [Google Scholar] [CrossRef]
  63. Edelmann, D.; Welchowski, T.; Benner, A. A consistent version of distance covariance for right-censored survival data and its application in hypothesis testing. Biometrics 2021. [Google Scholar] [CrossRef]
  64. Kaplan, E.L.; Meier, P. Nonparametric estimation from incomplete observations. J. Am. Stat. Assoc. 1958, 53, 457–481. [Google Scholar] [CrossRef]
  65. Cox, D.R. Regression models and life-tables. J. R. Stat. Soc. Ser. B Methodol. 1972, 34, 187–202. [Google Scholar] [CrossRef]
  66. Pelaez-Verdet, A.; Loscertales-Sanchez, P. Key Ratios for Long-Term Prediction of Hotel Financial Distress and Corporate Default: Survival Analysis for an Economic Stagnation. Sustainability 2021, 13, 1473. [Google Scholar] [CrossRef]
  67. Zhang, J.; Thomas, L.C. Comparisons of linear regression and survival analysis using single and mixture distributions approaches in modelling LGD. Int. J. Forecast. 2012, 28, 204–215. [Google Scholar] [CrossRef] [Green Version]
  68. Okwo, H.; Ezenwakwelu, C.; Igwe, A.; Imhanrenialena, B. Firm size and age mediating the firm survival-hedging effect: Hayes’3-Way parallel approach. Sustainability 2019, 11, 887. [Google Scholar] [CrossRef] [Green Version]
  69. Schoenfeld, D. Partial residuals for the proportional hazards regression model. Biometrika 1982, 69, 239–241. [Google Scholar] [CrossRef]
  70. Patel, K.; Kay, R.; Rowell, L. Comparing proportional hazards and accelerated failure time models: An application in influenza. Pharm. Stat. J. Appl. Stat. Pharm. Ind. 2006, 5, 213–224. [Google Scholar] [CrossRef] [PubMed]
  71. Yan, J.; Williams, D.W. Timing is everything? Curvilinear effects of age at entry on new firm growth and survival and the moderating effect of IPO performance. J. Bus. Ventur. 2020. [Google Scholar] [CrossRef]
Figure 1. Source: authors’ estimates from Historical Data Package, Bursa Malaysia, and Investor Digest.
Sustainability 13 08063 g001
Figure 2. IPO tracking period for Main Market (1990–2020).
Sustainability 13 08063 g002
Figure 3. Authors’ estimates from Historical Data Package, Bursa Malaysia.
Sustainability 13 08063 g003
Figure 4. Authors’ estimates from online Bursa Malaysia data.
Sustainability 13 08063 g004
Figure 5. Weibull regression—cumulative hazard function curves.
Sustainability 13 08063 g005
Figure 6. Weibull regression—cumulative hazard function curves.
Sustainability 13 08063 g006
Table 1. Structural equity market changes.
Listing Market (L_mkt)Year of InceptionNew NameRenamed or Merger YearMerged WithStatus
Main Board1974Main
Market
2009-Active
Second Board1988-2009Main MarketMerged
MESDAQ Market2002ACE Market2009-Active
Table 2. Population and sample descriptive statistics.
Listing Market (L_mkt)DurationPopulation Total Listed IPOsSample
IPOs
Sample Delisted IPOsSample PercentageSample Percentage DelistingFollow-Up Period
Second Board (SB)1990–200946143215193.71%34.95%6 Years (2010–2015)
Main Board (MB)1990–20093252728683.69%31.62%6 Years (2010–2015)
Main Market (including MB)1990–201742935010481.59%29.71%3 Years (2018–2020)
Main Market and Second Board1990–201789078225587.87%32.61%3 Years (2018–2020)
ACE Market2002–20171791611889.94%11.18%3 Years (2018–2020)
Total 11990–2017106994327388.21%28.95%-
1 For sample, total includes the sum of the Second Board (432), Main Market (including Main Board) (350), and ACE Market (161).
Table 3. Variable description.
VariableNotationDefinitionMeasurementData Source
Dependent Variable
Survival Time
S_tIPO tracking period
(listing period + follow-up)
Number of years from listing date to delisting date or cutoff date (follow-up period), whichever is the earliestInvestor Digest, Bursa Malaysia (BM)
CensoringδIPO listing status at follow-up cutoff date0 = Alive IPOs
1 = Delisted IPOs
Historical Data Package BM; delisting info BM
Explanatory Variables:
Exposure Variable
Listing Markets
L_mktIPO listing markets/listing boardsDummy Variable
1 = Main Market/Board
0 = Otherwise
BM, IPO prospectus
Effect Modifiers
Share Premium
S_prThe positive difference between the offer price and par valueNo. of times of the par valueIPO prospectus, Investor Digest, Historical Data BM
Firm SizeF_sizePro forma total assets adjusted by utilization of IPO proceedsLog of adjusted total assetsIPO prospectus
Listed CapitalL_capOutstanding listed pro forma capital adjusted by public issueThe ratio of outstanding shares to authorized sharesInvestor Digest, IPO prospectus
Offer SizeO_sizeTotal number of shares against the public issue and offer for sale sharesSum of public issue and offer for
sale shares to total outstanding
shares adjusted by new shares
IPO prospectus
Risk FactorsR_facRisk factors disclosed in IPO prospectusNumber of risk factorsIPO prospectus
Control Variables:
LeverageF_levFinancial leverageThe ratio of total liabilities to total assets adjusted by IPO proceeds utilizationIPO prospectus
Firm AgeF_ageFirms age from incorporating as a private entity to the listing dateNumber of years as a private firm at IPO listing dateIPO prospectus, Eikon DataStream, S&P 500.
ProfitabilityEPSProfitability from equity investors’ perspectiveNet profit attributable to equity
shareholders to total outstanding shares adjusted by new shares
IPO prospectus
Table 4. General descriptive statistics.
MeasureL_mkt 1Obs.S_tS_prF_sizeL_capO_sizeR_facF_LevF_ageEPS
MeanMain Market 235016.302462.678668.469210.521410.2516420.128570.4243010.108600.46358
Median(P50)35016.034252.000008.372040.533060.2491020.000000.421117.402730.21000
St. Dev.3507.643492.417700.558170.226670.115195.190690.209649.183061.30826
Minimum3502.712331.000007.281400.045000.008449.000000.000960.528770.01000
Maximum35030.972625.000010.428521.000000.7380233.000000.9398948.2301417.21000
P253509.906851.550008.095960.360000.1567516.000000.259841.906850.12000
P7535023.334252.800008.695870.686670.3145123.00000.5652416.567120.39000
MeanSecond Board 343219.263322.429587.817560.629140.2472216.604170.434607.449540.61539
Median(P50)43218.742472.200007.841940.662410.2144016.000000.434314.461640.31000
St. Dev.4326.118551.029920.275590.235450.112374.287060.171447.047591.08301
Minimum4323.356160.800006.352370.019600.047627.000000.006000.591780.02000
Maximum43230.884938.000008.668321.000000.6800033.000000.9148532.6767113.0000
P2543214.712331.700007.638460.400000.1522113.500000.302571.669860.19000
P7543224.431512.800008.004860.800000.3000019.00000.5501612.058900.57000
MeanACE Market16112.725934.101117.569390.553120.2412321.546580.245814.958100.13843
Median(P50)16115.035623.800007.548170.528000.2500022.000000.206592.873970.04300
St. Dev.1614.640682.043990.331770.196000.089014.378850.191175.456430.30176
Minimum1613.172321.000006.032570.126000.0046711.000000.000980.413700.01000
Maximum16118.7068512.300008.491001.000000.6940031.000000.8598130.646582.20000
P251619.460272.500007.361520.416000.2019818.000000.104171.441100.02400
P7516116.169865.000007.772450.673320.2690025.000000.346386.558900.08200
MeanOverall94317.048242.807418.017050.576180.2478418.756100.398548.011120.47761
Median(P50)94316.808222.300007.937150.586320.2439618.000000.397654.769860.23000
St. Dev.9436.934081.928270.545280.231120.109785.079610.201917.899191.10212
Minimum9432.712330.800006.032570.019600.004677.000000.000960.413700.01000
Maximum94330.9726025.0000010.428521.000000.7380233.000000.9398948.2301417.21000
P2594311.789041.700007.664210.400000.1538515.000000.244971.682190.11000
P7594323.194523.200008.259570.792000.3000022.000000.5406112.660270.43000
1 Equity listing market comprises three IPO listing places in Bursa Malaysia called Main Market (previously Main Board), Second Board (merged with Main Market in 2009), and ACE market (previously MESDAQ). 2 It includes those IPOs directly listed on Main Board/Market. That is, it does not include any IPO that transferred from Second Board to Main Board/Market. 3 Second Board IPOs also include those transferred from Second Board to Main Board/Market from 1990 to 2017 with a follow-up period from 2017 to 2020.
Table 5. Variance inflation factors.
VariableMain MarketSecond BoardACE MarketOverall
VIF1/VIFVIF1/VIFVIF1/VIFVIF1/VIF
S_pr1.170.8518831.140.8803611.250.8003951.080.925182
F_size1.270.7893761.310.7655971.160.8641421.220.822302
L_cap1.010.9897581.060.9410931.040.9570451.040.957214
O_size1.030.9746811.040.9569891.170.8565471.010.985508
R_fac1.240.8092701.040.9612941.040.9599951.180.850260
F_lev1.080.9276371.210.8274431.080.9277091.150.866860
F_age1.020.9760991.110.8972701.150.8692481.060.945860
EPS1.040.9586821.130.8817271.030.9706101.050.952089
Table 6. Survival-specific descriptive statistics for each listing board/market.
Listing Market (L_mkt)No. of IPOsDelisted IPOs (δ1)Censored IPOs (δ0)Time at Risk tjHazard Rate 1Survival Time 2
25%50%75%
Second Board 3
(1990–2009)
432151281508.68510.296843714.8925.39-
Main Board 3
(1990–2009)
27286186312.13780.27551915.1323.02-
Main Market 4
(1990–2017)
350104246403.40750.25780316.05--
Main Market and
Main Board 5
(1990–2017)
782255527912.43860.27947115.1327.12-
ACE Market 6
(2002–2017)
16118143170.82190.10537211.70--
Overall (All Markets)9432736701117.82230.24422416.2028.15-
1 The hazard rate is based upon total delisted IPOs and total times at risk = 1 n δ j/ 1 n t j. 2 The survival-specific median time has been calculated using time at risk statistics. 3 IPO tracking period ranges from 1990 to 2015. 4 After the Second Board and Main Market merger in 2009, Main Board was renamed ‘Main Market’. Main Market IPOs include only those listed on Main Board (1990–2009) and then on Main Market (2010 to 2017) and do not include those IPOs listed on the Second Board and transferred to Main Market upon meeting Main Market’s listing requirements. IPO tracking period ranges from 1990 to 2020. 5 It includes all IPOs listed on Main Market (including Main Board) and those moved to Main Market upon merger in 2009. IPO tracking period ranges from 1990 to 2020. 6 IPO tracking period ranges from 2002 to 2020.
Table 7. Log-rank test for equality of survivor functions.
Listing Market (L_mkt)Events ObservedEvents Expected
Second Board151.00153.71
Main Board86.0083.29
Total237.00237.00
chi2(1) = 0.13. Pr > chi2 = 0.7218.
Table 8. Survival-specific descriptive statistics (comparison: Main Market and ACE Market IPOs).
Listing Market (L_mkt)No. of IPOsDelisted IPOs (δ1)Censored IPOs (δ0)Time at Risk tjHazard RateSurvival Time
25%50%75%
ACE Market 116118143170.74060.105423---
Main Market 217137134168.66550.21936911.89--
Overall33255277339.40610.1620477---
1 ACE (previously MESDAQ) Market IPOs listed from 2002 to 2017. The follow-up time is 3 years (2018 to 2020). 2 Main Market (previously Main Board) IPOs listed from 2002 to 2017. The follow-up time is 3 years (2018 to 2020).
Table 9. Log-rank test for equality of survivor functions.
Listing Market (L_mkt)Events ObservedEvents Expected
ACE Market18.0029.08
Main Market37.0025.92
Total55.0055.00
chi2(1) = 9.08. Pr > chi2 = 0.0026.
Table 10. Inferential statistics—Cox proportional hazard model.
VariableModel 1: Main Board (MB)Model II: Second Board (SB)Model III: Combined MB and SB
Coeff.p-ValueHRP(PH)Coeff.p-ValueHRP(PH)Coeff.p-ValueHRP(PH)
S_pr−0.4521 ***0.0030.636270.1570−0.2903 ***0.0020.747980.6868−0.2347 ***0.0000.694720.1724
(−2.94) (−3.12) (−4.69)
F_size0.71600 ***0.0012.046230.18391.59514 ***0.0004.929050.29520.92963 ***0.0002.533570.2986
(3.23) (5.10) (5.62)
L_cap−1.29391 **0.0100.274190.2185−0.89374 **0.0160.409120.8811−1.0342 ***0.0000.355490.3542
(−2.56) (−2.42) (−3.61)
O_size0.474650.6091.607450.3097−0.0418160.6030.658250.6642−0.162250.7880.850220.5834
(0.51) (−0.52) (−0.27)
R_fac0.09594 ***0.0001.100690.42550.10807 ***0.0001.114130.13420.08595 ***0.0001.089740.1992
(3.74) (5.50) (3.67)
F_lev0.399410.3971.490930.93540.164790.7441.179150.22730.411980.2151.509800.4555
(0.85) (0.33) (1.24)
F_age−0.03093 **0.0340.969530.9894−0.0338 ***0.0070.966720.5347−0.0301 ***0.0010.970310.8728
(−2.11) (−2.70) (−3.29)
EPS−0.030810.8550.969660.19080.588960.4001.060660.28440.0310620.6151.031550.2014
(−0.18) (0.84) (0.50)
L_mkt--------−0.9937 ***0.0000.370180.1610
--------(−5.32)
Obs. (IPOs)272432704
Total Delisted86151237
IPO Interval1990–20091990–20091990–2009
Follow-up6 Years (2010–2015)6 Years (2010–2015)6 Years (2010–2015)
Log likelihood−412.101−784.285−1371.044
LR chi2 (8)49.9393.72LR chi2 (9) = 117.68
Prob > chi20.00000.00000.0000
*** p < 0.01, ** p < 0.05; z value in parentheses. Notes: Table 10 describes the inferential statistics of the Cox proportional hazard (PH) model for Main Board, Second Board, and combined results for Main Board and Second Board. Model I illustrates the inferential statistics for the IPOs listed on Main Board. Model II depicts the results for the IPOs listed on Second Board. Model III shows the combined results for Main Board and Second Board. We combine Main Board and Second Board on three premises: (1) Bursa Malaysia introduced Second Board to encourage medium enterprises and support the Main Board. (2) Any transition from Second Board to Main Board is neither a delisting (from Second Board) nor a new listing (on Main Board). (3) The Kaplan–Meier (KM) curves of the two listing boards remained very close to each other over the tracking period (1990–2015), and the log-rank test statistics indicate that the two survival curves are statistically insignificant. The tracking periods for models I, II, and III range from 1990 to 2015 (IPO listing period: 1990–2009; follow-up period: 2010–2015). The inferential statistics comprise the coefficients, p-values, the hazard ratio, and proportional-hazards assumption test (PH test) based on Schoenfeld residuals, separately for each covariate. The hazard ratio (HR) column explains the marginal effect of the explanatory variables on IPO survival. As a benchmark, the hazard ratio equal to 1 indicates no marginal effect of a predictor on IPO survival time.
Table 11. Inferential statistics—Cox proportional hazard model.
VariableModel IV: Main Market (MM)Model V: Main Market Including SBModel VI: ACE Market
Coeff.p-ValueHRP(PH)Coeff.p-ValueHRP(PH)Coeff.p-ValueHRP(PH)
S_pr−0.4401 ***0.0010.643920.2059−0.2465 ***0.0000.7814620.24640.2070 *0.0561.230030.8292
(−3.38) (−3.64) (1.91)
F_size0.48613 **0.0181.626010.20110.27038 **0.0241.310460.16041.087470.2222.966760.9287
(2.36) (2.26) (1.22)
L_cap−0.84342 *0.0530.430230.1712−0.66977 **0.0130.511820.2223−0.83050.5090.0436020.9071
(−1.94) (−2.47) (−0.66)
O_size−0.148090.8570.862340.8560−0.434150.4360.647810.4064−3.95010.2450.019250.2054
(−0.18) (−0.78) (−1.16)
R_fac0.07404 ***0.0011.076850.28950.08062 ***0.0001.083960.13710.045620.4431.046670.5017
(3.36) (5.65) (0.77)
F_lev0.77476 *0.0872.170080.66040.78492 **0.0142.192240.3952−0.20330.8840.815990.2081
(1.71) (2.45) (−0.15)
F_age−0.02336 *0.0580.976900.5609−0.0302 ***0.0000.970200.64100.006110.9171.006130.6633
(−1.90) (−3.52) (0.10)
EPS−0.033720.7950.9668380.27780.030320.5751.030780.17380.448480.5231.565930.5522
(−0.26) (0.56) (0.64)
Obs. (IPOs)350782161
Total Delisted10425518
IPO Interval1990–20171990–20172002–2017
Follow-up3 Years (2018–2020)3 Years (2018–2020)3 Years (2018–2020)
Log likelihood−527.074−1505.252−81.653
LR chi2 (8)42.7988.3011.33
Prob > chi20.00000.00000.1836
*** p < 0.01, ** p <0.05, * p < 0.1; z value in parentheses. Notes: Table 11 shows the inferential statistics of the Cox proportional hazard (PH) model for Main Market (including Main Board), Main Market (including Main Board and Second Board), and ACE Market. Model IV depicts the inferential statistics for the IPOs listed on Main Board from 1990 to 2009 and then on Main Market from 2010 to 2017. Model IV does not include any IPO that was listed on Second Board and then moved to either Main Board (up to 2009) or Main Market (from 2010 to 2017). The tracking period for the Model IV ranges from 1990 to 2020 (IPO listing period: 1990–2017; follow-up period: 2018–2020). Model V depicts the overall results for the IPOs listed on Main Market (including Main Board) and Second Board. We have combined Main Market/Main Board and Second Board results on the premise already explained in the notes given under Table 10. The tracking period of Model V is the same as that of Model IV. Model VI presents the inferential statistics for ACE Market. The tracking period for ACE Market ranges from 2002 to 2020 (IPO listing period: 2002–2017; follow-up period: 2018–2020). We do not combine Main Market and ACE Market because the survival curves (depicted in Figure 4) are significantly different from each other, as shown by the statistically significant log-rank test for the equality of survival function.
Table 12. Weibull regression—log relative-hazard form.
VariableModel I: Main Board (MB)Model II: Second Board (SB)Model III: Overall MB and SB
Coeff.p-ValueHRCoeff.p-ValueHRCoeff.p-ValueHR
S_pr−0.46718 ***0.0020.62676−0.28077 ***0.0020.75519−0.36134 ***0.0000.69673
(−3.03) (−3.06) (−4.70)
F_size0.72968 ***0.0012.074421.69018 ***0.0005.420480.95046 ***0.0002.58690
(3.32) (5.52) (5.74)
L_cap−1.32667 ***0.0090.26535−0.95218 **0.0100.38589−1.22495 ***0.0000.29377
(−2.63) (−2.57) (−4.22)
O_size0.458710.6201.58203−0.557090.4860.57286−0.203110.7360.81618
(0.50) (−0.70) (−0.34)
R_fac0.09726 ***0.0001.102140.10757 ***0.0001.113560.09809 ***0.0001.10306
(3.79) (5.47) (6.39)
F_lev0.348860.4571.417460.088980.8601.093060.361540.2741.43554
(0.74) (0.18) (1.09)
F_age−0.03289 **0.0240.96764−0.03740 ***0.0030.96328−0.03703 ***0.0000.96364
(−2.26) (−2.99) (−3.94)
EPS−0.026120.8770.974210.064060.3571.066160.043730.4761.04470
(−0.15) (0.92) (0.71)
L_mkt −1.09828 ***0.0000.33344
(−5.83)
_Cons−13.6148 ***0.0001.22 × 10−6−23.6359 ***0.0005.43 × 10−11−16.04666 ***0.0001.07 × 10−7
(−7.04) (−8.81) (−11.35)
/ln_p0.77589 ***0.000-1.15824 ***0.000-0.99056 ***0.000-
p2.17253--3.18434--2.69274--
1/p0.46029--0.31403--0.37136--
Obs. (IPOs)272432704
Total Delisted86151234
IPO Interval1990–20091990–20091990–2009
Follow-up6 Years (2010–2015)6 Years (2010–2015)6 Years (2010–2015)
Log likelihood−168.893−224.090−404.83729
LR chi2 (8)51.97102.43139.51
Prob > chi20.00000.00000.0000
*** p < 0.01, ** p < 0.05; z value in parentheses.
Table 13. Weibull regression—log relative-hazard form.
VariableModel IV: Main Market (MM)Model V: Main Market (MM)
Including Second Board (SB)
Model VI: ACE Market
Coeff.p-ValueHRCoeff.p-ValueHRCoeff.p-ValueHR
S_pr−0.45706 ***0.0010.63314−0.23559 ***0.0000.790090.23023 **0.0371.25890
(−3.48) (−3.51) (2.08)
F_size0.47001 **0.0211.600010.21605 *0.0681.241161.148900.1903.15475
(2.31) (1.83) (1.31)
L_cap−0.89913 **0.0380.40692−0.72069 ***0.0080.48641−0.879420.4800.41502
(−2.08) (−2.66) (−0.71)
O_size−0.072360.9290.93018−0.494200.3760.61005−3.544650.2900.02887
(−0.09) (−0.89) (−1.06)
R_fac0.07639 ***0.0011.079380.08045 ***0.0001.083780.046230.4431.04732
(3.46) (5.62) (0.77)
F_lev0.712140.1162.038350.73366 **0.0212.08269−0.230950.8680.79377
(1.57) (2.31) (−0.17)
F_age−0.02530 **0.0400.97501−0.03344 ***0.0000.967100.013660.8131.01375
(−2.06) (−3.90) (0.24)
EPS−0.029840.8220.970590.038990.4671.039770.527770.4551.69515
(−0.23) (0.73) (0.75)
_Cons−10.54 ***0.0000.000026−9.63597 ***0.0000.000065−15.12096 **0.0282.71 × 10−7
(−6.13) (−9.32) (−2.20)
/ln_p0.60666 ***0.000-0.78814***0.000-0.258130.237-
p1.834312--2.19931--1.29451--
1/p0.54516--0.45468--0.77249--
Obs. (IPOs)350782161
Total Delisted10425518
IPO Interval1990–20171990–20172002–2017
Follow-up3 Years (2018–2020)3 Years (2018–2020)3 Years (2018–2020)
Log likelihood−228.548−496.19335−64.24333
LR chi2 (8)45.0786.4512.13
Prob > chi20.00000.00000.1456
*** p < 0.01, ** p < 0.05, * p < 0.1; z value in parentheses.
Publisher’s Note: MDPI stays neutral with regard to jurisdictional claims in published maps and institutional affiliations.

