Article

Risk Management in Seaports: A Community Analysis at the Port of Hamburg

Institute of Business Logistics and General Management, Hamburg University of Technology (TUHH), 21073 Hamburg, Germany
*
Author to whom correspondence should be addressed.
Sustainability 2021, 13(14), 8035; https://doi.org/10.3390/su13148035
Submission received: 20 May 2021 / Revised: 11 July 2021 / Accepted: 13 July 2021 / Published: 19 July 2021

Abstract

:
The aim of this work is to detect communities of stakeholders at the port of Hamburg regarding their communication intensity in activities related to risk management. An exploratory mixed-method design is chosen as a methodology based on a compact survey and semi-structured interviews, as well as secondary data. A compact survey at the port of Hamburg is utilized to address the communication intensity values among stakeholders. Based on 28 full responses, the data is extracted, cleansed, and prepared for the network analysis using the software “Gephi”. Thereafter, the Louvain community detection algorithm is used to extract the communities from the network. A plausibility check is carried out using 15 semi-structured interviews and secondary data to verify and refine the results of the community analysis. The results have revealed different communities for the following risk categories: (a) natural disasters and (b) operational and safety risks. The focus of cooperation is on the reactive process and emergency plans. For instance, emergency plans play an important role in the handling of natural disasters such as floods or extreme winds.

1. Introduction

Many organizations nowadays face multiple challenges due to globalization and continuous technological development. These challenges are associated with various risks that should be identified to prevent or mitigate any negative outcome on the economy, the environment, and the health and safety of people.
In a global supply chain and international logistics network, a seaport is a critical link. Seaports are no longer limited to only a part of the supply chain but are also being developed as strategic trade links between countries. They are a junction of cooperation between countries, including transportation, logistics, tourism, and energy. Moreover, they are important logistics hubs where different operations take place: the seaside, for loading and unloading vessels; the storage area, for storing and handling the numerous loads as well as the landside, for distributing the freight using various transport modes [1]. In seaports, a number of risks can occur near residential and industrial areas, potentially exposing people to accidents. Ports are also vulnerable to seismic motion and other natural disasters. If a risk occurs, it can quickly spread throughout the port region and have far-reaching negative consequences.
Seaport stakeholders interact with one another in different risk scenarios, with each seaport having a unique network structure. These network structures reflect the complex operations that are carried out at seaports and play an important role in the knowledge transfer among organizations and entities [2]. Different actors within a network can solve different but interconnected problems [3]. Strong ties within the network increase the degree of cooperation and visibility among its members. Therefore, knowledge transfer can utilize the network structure to strengthen the cooperation among a seaport’s stakeholders. For this reason, cooperative risk management can play an important role in efficiently mitigating varying sources of risks, such as natural disasters, oil spills, and the explosion of gases and chemicals at seaports.
The objective of this work is to detect communities of stakeholders at the port of Hamburg with regard to their communication intensity in activities related to risk management. Examining core stakeholder categories for risk management and their communication structure can facilitate the efficient management of risks during each phase of the risk management process during prevention and response. Therefore, this research paper tackles the following research questions: (i) which stakeholder categories are relevant for risk management in seaports? (ii) How do stakeholders at seaports interact with one another with regards to risk management activities? (iii) Who are the core actors in the communication and coordination of activities related to risk management in the port of Hamburg? The analysis is carried out for safety and operational risks as well as natural disasters such as the handling of dangerous goods and hurricanes. This study also analyzes theoretical and practical implications concerning cooperation, network structure, and the roles and responsibilities within a community. The comparison between different risk sources will facilitate a deeper analysis of these aspects.
The results of this paper will be used to develop a prescriptive process model for cooperative risk management in seaports to guide stakeholders in every phase of the risk management process. In this model, we will use the results of this paper to understand risk governance in seaports, as well knowledge creation, transfer, sharing, and application. Furthermore, the results can be used to compare the stakeholder network for risk management among several core seaports at the Baltic Sea Region as well as the North Sea Region. This comparison can be based on stakeholder structure, process and risk owners, cores stakeholder categories as well as their roles and responsibilities. Several measures can be used to evaluate the impact of a network on risk management. These include, for instance, the availability of complete and reliable data as well as information to carry out risk management-related activities, and the network centrality that affects the communication efficiency.
The remainder of this paper is structured as follows: Section 2 starts with a brief overview of seaports, risk management, network structure, community detection, along with related work. Thereafter, Section 3 describes the methodology of the paper, and Section 4 presents the results of the network analysis and community detection. In Section 5, theoretical and practical implications extracted from this research are elaborated. Lastly, the conclusion, limitations, and outlook of the conducted research are presented.

2. Literature Review

2.1. Seaports and Their Stakeholders

Seaports are often located in densely populated areas, with operational activities (e.g., loading and unloading of dangerous goods) conducted in close vicinity to vulnerable urban environments. In Germany, for example, according to the Federal Office of Statistics, 42.6 million tons of dangerous goods have been transported by sea and 46.8 million tons on inland waterways in 2016. These volumes are transshipped at ports, and they account, together, for approximately 31% of the total amount of dangerous goods transported [4].
While a seaport’s core function is transport integration, it may also become a major urban center, and an influential factor in national and regional development. Any seaport or seaport system must be viewed in national, regional, and international terms, and in relation to the various factors that influence its development and operation [5]. The economic function of a seaport—according to [6]—is to increase the producer and consumer’s surplus of those who originate the exports and who ultimately consume the imports passing through it, respectively.
The management of seaports is complex since it involves consideration and active monitoring of different operations as well as the concerns of all stakeholders. The operational activities at seaports such as bunkering and berth allocation operations are linked with different policies, management strategies as well as optimization approaches (see [7,8,9,10]). To carry out actions and decisions, port managers and operators should pay particular attention to the interests of stakeholders who are most critically and intimately involved [11,12].
According to [13], stakeholders in seaports can be categorized into two groups: internal and external. Internal stakeholders can be considered as an integral part of the seaport and are thereby connected directly to its operations. In contrast, external stakeholders are only linked indirectly to the operations conducted on the seaport premises [14].

2.2. Risk Management

In port facilities, many risk sources can be triggered by various threats. To classify them in an understandable manner, two main risk groups are presented: natural and man-made risk groups [15]. Natural risks occur ordinarily in the natural environment [16]. They endanger societies and organizations since they take place due to uncontrollable variations in the physiognomies of the planet, such geologic, volcanic, seismic, or mass movement variations [17].
Unlike natural disasters, man-made risks relate to intentional or unintentional actions that can potentially trigger danger to people or organizations [17]. A man-made risk occurs mainly as a consequence of one or more intentional or negligent human actions. Depending on the type of activity, situation, and consequence, risk groups can further be distributed in different categories, including operational, technical and technological, organizational, and environmental [18]. Both natural disasters and crises resulting from man-made risks are linked with seaport disruptions that are investigated by various authors (see [15,19,20,21]). These disruptions can greatly impact supply chains, the environment, as well as the health and safety of people.
Risk management must therefore be integrated into the core processes as well as the organizational culture. Failure to set and communicate a specific risk management strategy can lead to a significant failure to adequately manage the risks faced by an organization [22]. Different interpretations and customized steps exist when it comes to the risk management process. For instance, [23] mentions, in his book, a risk management process that consists of risk identification, assessment, prioritization, implementation, and tracking. In addition, [24] considers a four-step process scheme involving identification, evaluation, control, and monitoring. Furthermore, the risk management process requires proper governance to standardize, monitor, and improve the current implemented process, methods, measures, and communication means and devices [25].
Governance aims at achieving an acceptance of the consequences of the decision-making process, along with fulfilling the interests of the different actors. It is essential to establish an inclusive risk governance process in which all affected partners are considered and where the selection of possible measures and plans are restricted based on the available resources [26].

2.3. Network Structure and Community Detection

Network science encompasses an interdisciplinary research area that analyzes the different types of relationships within a network and develops associated models to understand their network structure. It aims to develop theoretical and practical approaches to enhance the comprehension of natural and man-made networks [27].
Networks nowadays can be found everywhere on the internet, genetic, social networks and other areas [28]. The term “network” can be utilized to describe different phenomena, ranging from multinational corporations and national economic systems to small service and entrepreneurial firms [29].
A network, in its basic form, records a list of individuals and the connections between pairs of these individuals. From a mathematical point of view, a network takes the shape of a graph (an unweighted, undirected graph), with nodes representing the individuals and edges representing the connections [30]. Furthermore, a “network,” based on [31], can be described as a connection “between individuals, organizations, groups, as well as between collectives of organizations.” It encompasses not only the relationships between the network participants but also the network in its entirety. The network can be described using its structure (e.g., nodes and links) and its behavior (the network activities as a result of the interactions between nodes and links). In essence, a network is a model of representation of observable reality [32].
Many networks of interest exist and can be divided naturally into modules and communities. A network can be divided into communities, with every group of nodes carrying out different functions with some degree of independence [33]. Community detection can be measured using modularity, which measures the cohesiveness of communities [34]. Modularity reflects “the extent, relative to a null model network, to which edges are formed within modules instead of between modules” (Barber, 2007). It is based on a scale value between −1 and 1 that calculates the density of edges inside communities to the edges outside communities [35].

2.4. Related Work

A brief discussion of existing relevant works is provided in this subsection. The research on stakeholder analysis in general is gaining importance in various fields. However, there are only a few publications that deal with stakeholder analysis of risk management in seaports (see Table 1). None of the examined publications provided a community analysis for risk management in seaports.
Ref. [36] provided a stakeholder analysis carried out by port authorities. Their paper studies the application of stakeholder management as executed by port authorities. Ref. [11] incorporates the stakeholders in the prioritization process that deals with important sustainability topics in selected seaports including the ports of Hamburg, Antwerp, and Rotterdam. Ref. [37] focus on the stakeholder perception of seaport resilience strategies; the paper analyzed the roles specific stakeholders can take to lead long-term resilience strategies, such as the port itself or a state agency. Ref. [38] aim in their paper to empirically study the key factors of seaport competitiveness from the perspective of Iberian seaports stakeholders by applying the Analytic Hierarchy Process (AHP) model. Ref. [13] differentiate between internal and external stakeholders based on their activities within the scope of the port authority. Ref. [39] provided a general approach to port planning based on different objectives of the various stakeholders influenced and involved by port development. An ontology and descriptive analysis for cooperative risk management in seaports were provided by [4]. The authors provided an overall stakeholder analysis process that is linked with risk management, cooperation aspects, and seaport type and structure.
This research fulfills the research gap by providing a community analysis of stakeholders concerning risk management at seaports using the case study at the port of Hamburg. The next section elaborates on the methodology of this research paper.

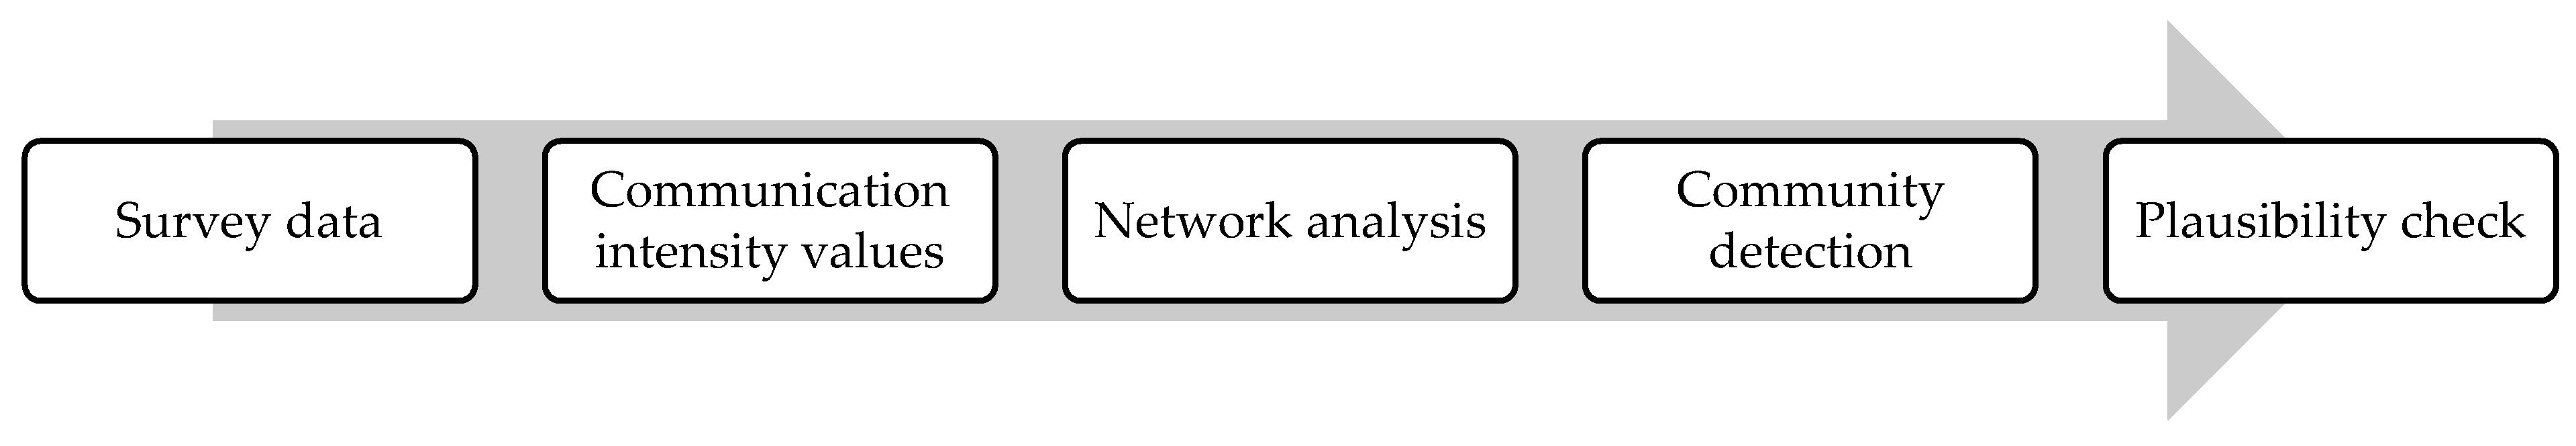
3. Materials and Methods

An exploratory mixed-method design is chosen in this paper for triangulation (convergence of results from different methods) and expansion (extending the breadth and range of inquiry) purposes [40]. The results of the network analysis carried out by the compact survey are verified and expanded in the plausibility check phase based on the semi-structured interviews and secondary data.
The network analysis is based on the full responses extracted from a survey study at the port of Hamburg to analyze the stakeholder network and detect communities that communicate with one another concerning risk management activities. The port of Hamburg is a universal port that handles different types of cargo, and it was selected in this research as a representative case. Figure 1 presents the approach of this study.

3.1. Survey Data

The survey, part of the EU project HAZARD “Mitigating the Effect of Emergencies in The Baltic Sea Region Ports”, was developed to address different stakeholders involved in activities related to risk management in major seaports of Baltic Sea Region (BSR), including the port of Hamburg. The online survey ran for two months (from November 2018 to January 2019) on LimeSurvey.
The online survey comprised four sections that included closed-ended questions in a list form. The survey consisted of 20 questions distributed within 4 main sections: (a) general information; (b) requirements of risk management; (c) risk management process; (d) stakeholder analysis and cooperation aspects. The last section of the compact survey (i.e., stakeholder analysis and cooperation aspects) is used in this paper.
The communication intensity values are based on an ordinal scale integrated into the online survey (never “0” to always “4”). The ordinal scale is used since it has ordered categories where variables have an explicit hierarchy in the response choices. Two questions for communications during natural disasters as well as for operational and safety risks were addressed. For instance, the question regarding operational and safety risks was formulated as follows:
How often do you communicate (two-way communication, warnings and disclosures) with the following list of stakeholders when it comes to operational and safety risk sources (e.g., handling of dangerous goods)?
Table 2 displays a sample of the stakeholder groups addressed in the online survey. An initial analysis using a literature review and interviews revealed the main stakeholder categories at seaports, such as port and environmental authorities, the waterways police, and shipping companies.

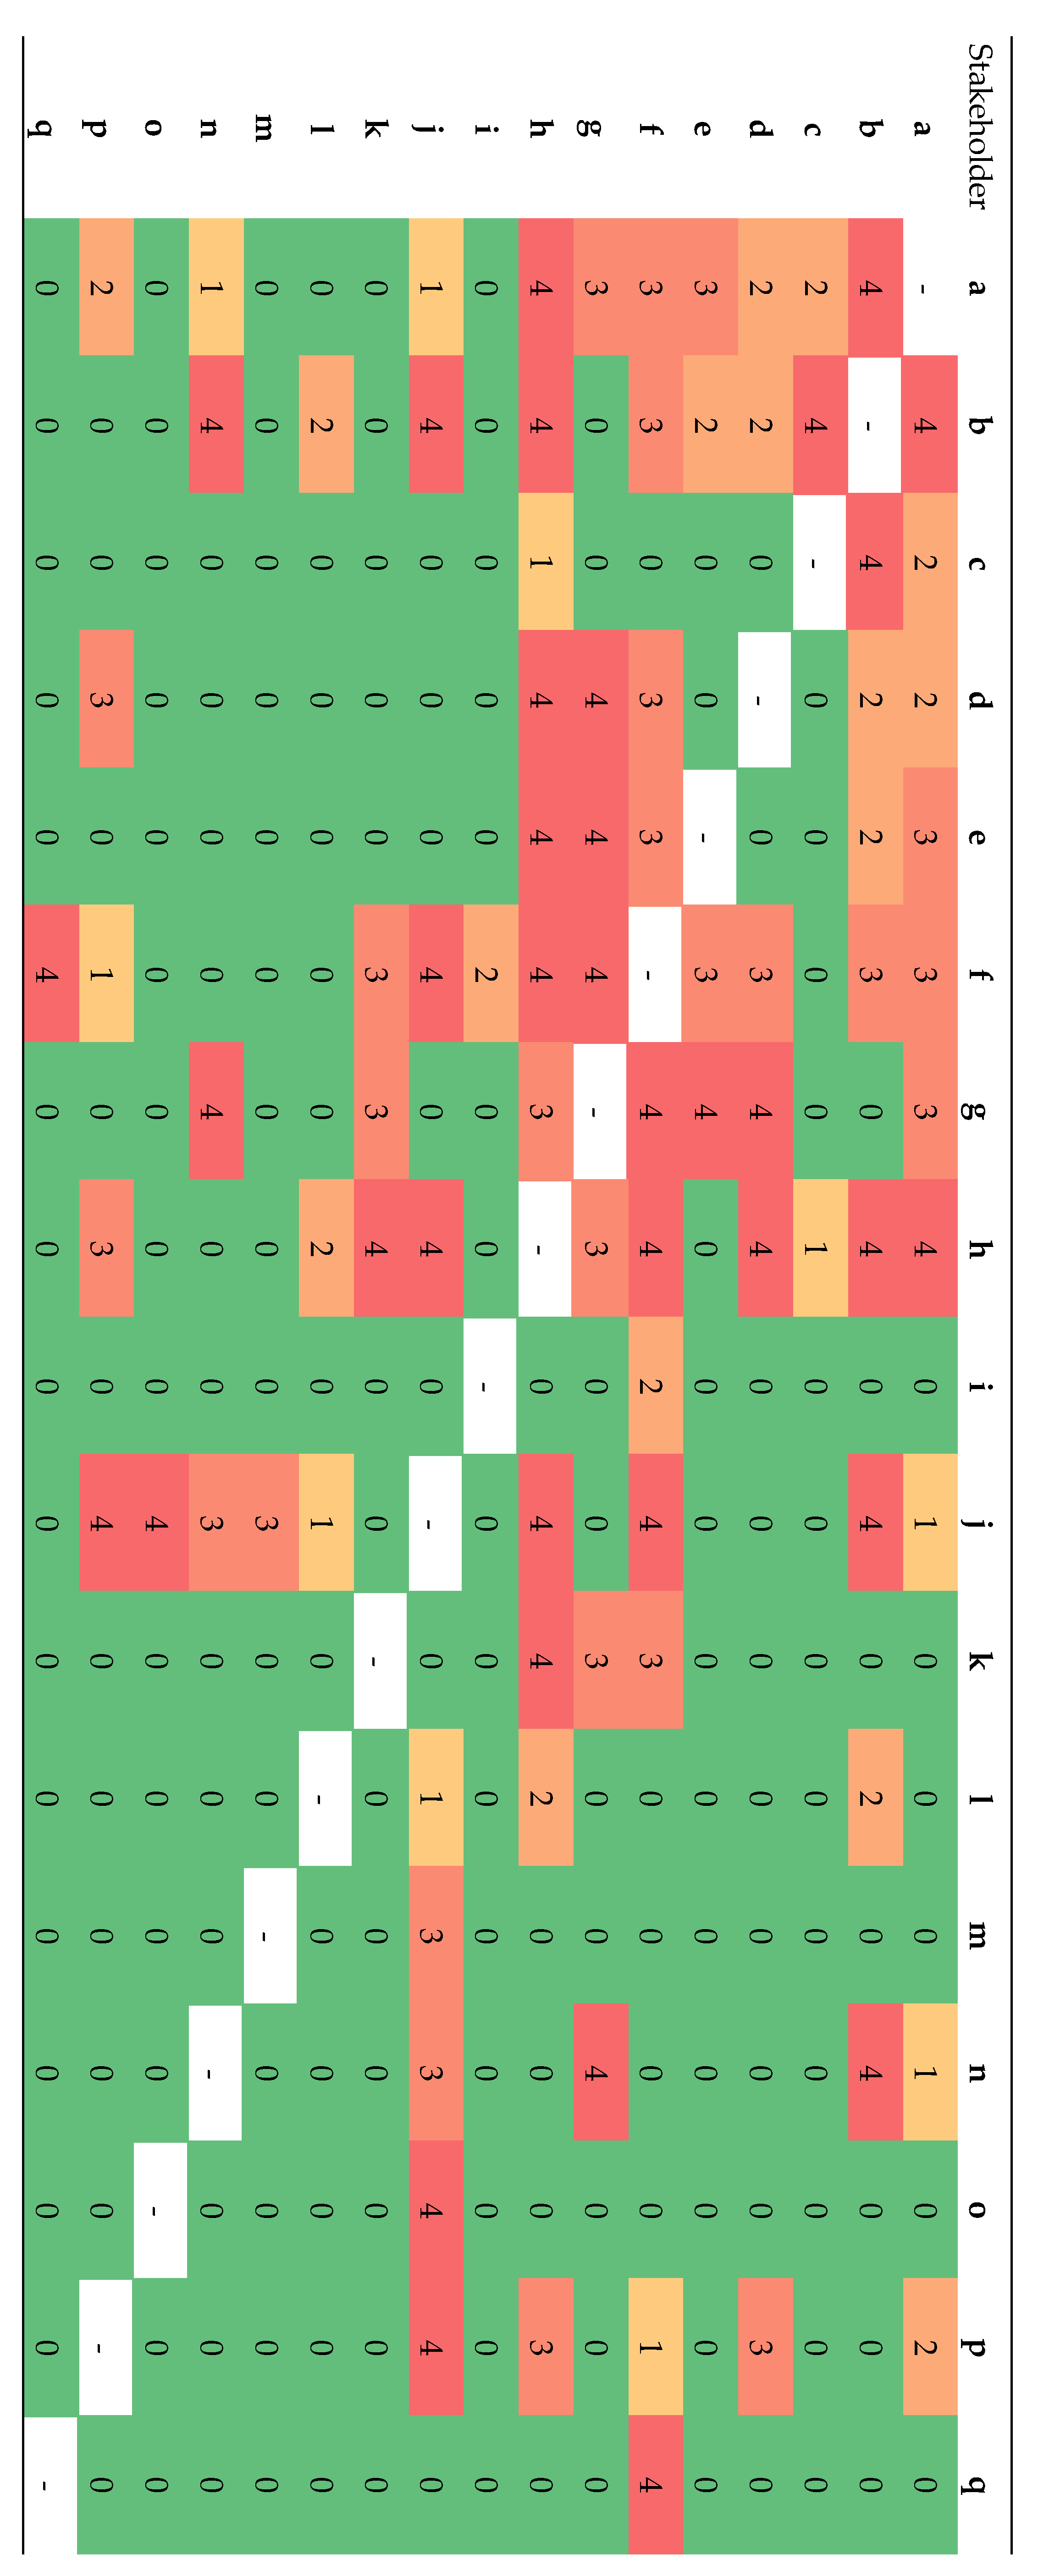
3.2. Communication Intensity Values

After extracting the survey data, the communication intensity values were further cleansed and prepared for the network analysis. A special template for the network analysis tool, Gephi, was prepared; it comprises the source and destination nodes, as well as the weight and direction of communication. Gephi has been used as a network analysis tool in various network analysis papers, such as those related to disaster reduction [41], mapping supply chain risks [42], social network analysis [43], and stakeholder analysis [44], and it was therefore utilized for the stakeholder analysis in this work.
The communication intensity values were assigned to each stakeholder category by calculating the average value based on the number of responses. Table 3 and the corresponding equation provide an example of such a calculation. Each intensity value corresponds to a participant in the online survey. For example, two stakeholders from the Authority for Environment and Energy (intensity values 1 and 2) participated in the online survey and entered the corresponding values, for instance, with the waterways police (see Equation (1)).
Authority for environmental & energy → Waterways police = 8/2 = 4 (always)

3.3. Network Analysis

The communication intensity values (weight) were utilized to create the undirected network graph in Gephi. All edges are bidirectional; therefore, the type of each value was set to “undirected.” Moreover, the position of each stakeholder in the network was based on the value generated by the software using the Yifan Hu layout algorithm. Based on [45], the Yifan Hu algorithm has better performance on small networks. The thickness of each arrow represents the intensity of communication based on the defined ordinal scale. To analyze and compare the generated network, specific network measures had to be defined.
Centrality is an example of network measures that are based on structural characteristics. Centrality indicates the position of an actor in a network relative to the others [46]. Three types of centrality have been discussed in the social network literature: “closeness,” “degree,” and “betweenness” centrality [47]. Closeness centrality measures “how close a node is to all other nodes” [48]. It represents the actor’s ability to access all other actors in the network independently. The degree centrality defines the centrality of an actor by the number of connections an actor has with other actors in the network [47]. Betweenness centrality can be defined as a measure that assesses the importance of a node in terms of the relationship among other nodes in the examined network [48]. It considers access as well to other actors based on the existence of an intermediary actor that is located between other actors in the network. This can be represented as the level of control an intermediary actor has over the access of other actors to different regions of the network [47].
Three additional network measures were also calculated using Gephi: average degree, network diameter, and graph density. Average degree indicates the average number of edges compared to the number of nodes in a network [49]. Network diameter refers to the required maximum number of connections to traverse the graph [50]. Graph density is the level of connected edges in comparison to the total possible value [50]. These measures were used to compare the generated networks.

3.4. Community Detection

Based on the Louvain community detection algorithm embedded in Gephi, the Louvain modularity method was applied to investigate the communities in the port of Hamburg based on the intensity of communication during activities related to risk management. Ref. [51] compared several methods for community detection, and they have concluded that the Louvain community detection algorithm is the best method to find reasonably sized communities in a reasonable amount of time. A plausibility check was carried out afterwards based on the interview study and secondary sources.

3.5. Plausibility Check

Plausibility checks are normally used to identify errors in data processing and to assess the validity of data [52]. In this study, a plausibility check was performed to ensure that the stakeholder analysis from Gephi matches the construction of individuals and communities in the context of the seaport of Hamburg. Based on the results of the check, the communities were refined.
A semi-structured interview was carried out between October 2017 and April 2018 at the port of Hamburg, comprising 15 interviews with stakeholders from different categories, such as terminal operators, authorities, and shipping companies, with an average duration of 1 h per interview. The developed interview guideline consisted of aspects related to risk management, regulations, cooperation, and the requirements and difficulties with regard to cooperative risk management in seaports. The interviews were analyzed based on a coding analysis using the MAXQDA software. For the qualitative content analysis of interviews in this paper, coding categories were extracted directly from the text data using the conventional approach. These categories were then used to organize the set of codes and interpret the findings from the interviews. The conventional approach is suitable for exploring a particular phenomenon, especially when the existing literature and theories on the examined phenomenon are limited [53]. The MAXQDA software was used for the coding process, and in total eight main coding categories were extracted.
Utilizing methodological triangulation, two coding categories in the interview study involved analyzing the cooperation aspects and intensity of communication among the stakeholders in the port of Hamburg. Each interviewee was asked to verify and fill out a communication intensity value assessment (based on the frequency of warnings, disclosures, and two-way communication) using a developed stakeholder map. In addition to the results of the interview study, secondary sources—represented by online internet sources and documents—were utilized to cover stakeholders involved in specific risk sources. Some of these sources were suggested by the interview partners.

4. Results and Discussion

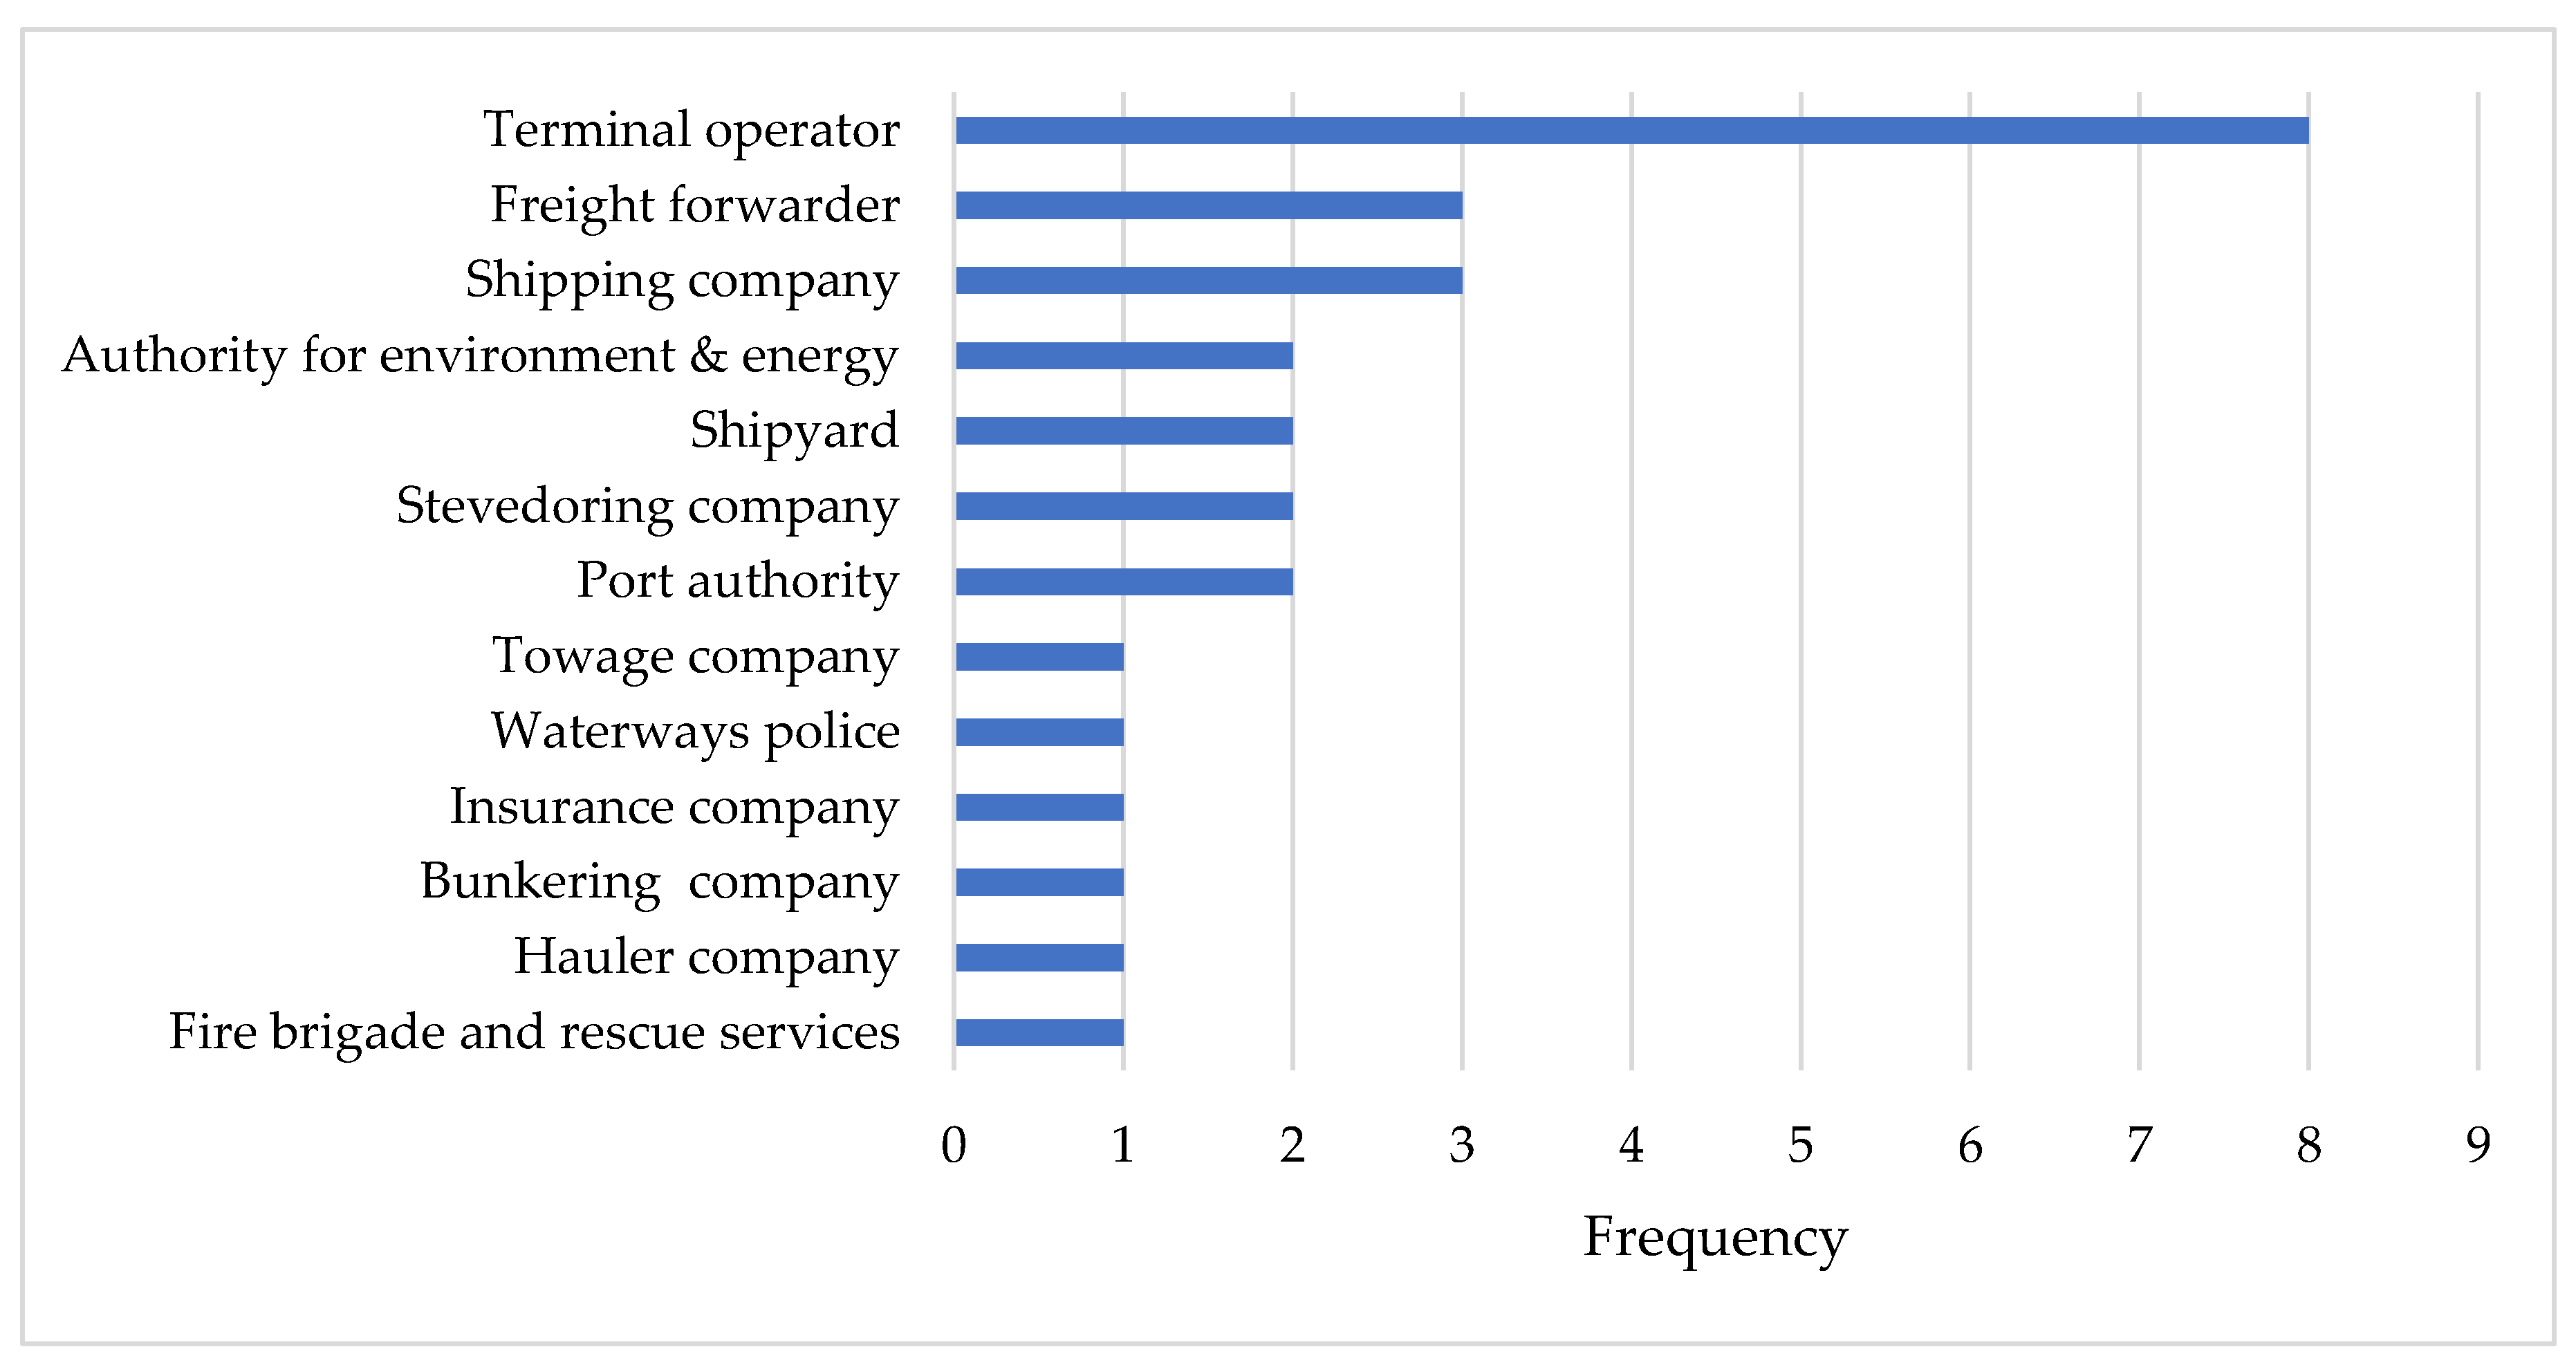
4.1. Survey Data and Descriptive Analysis

The 28 full responses out of 43 responses (partially answered) at the port of Hamburg were extracted from the online survey. The data were prepared and cleansed in a matrix, which included all stakeholders that participated in the online survey, such as authorities, terminal operators, and shipping companies. The ordinal scale that was utilized has five values (from 0: never to 4: there is always communication). These values were used as input to create a network and communication intensity map using Gephi to analyze the network of stakeholders at the port of Hamburg.
Figure 2 displays the responses based on the participating stakeholders in the compact online survey. Exactly 50% of the responses were from terminal operators, freight forwarders, and shipping companies, and approximately 28% were from port and environment authorities, stevedore companies, and shipyards. The rest covers other stakeholder categories, such as the waterways police, fire brigade and rescue services, and towage and haulier companies. The analysis is conducted on a group level based on the average value, and there are no large differences between responses in the same group. The values in the smaller groups do not include any outliers and errors in data processing are checked in the plausibility check phase. Any level of skewness does not affect the results since each response in the online survey is connected with a fixed number of target nodes (see Table 4).

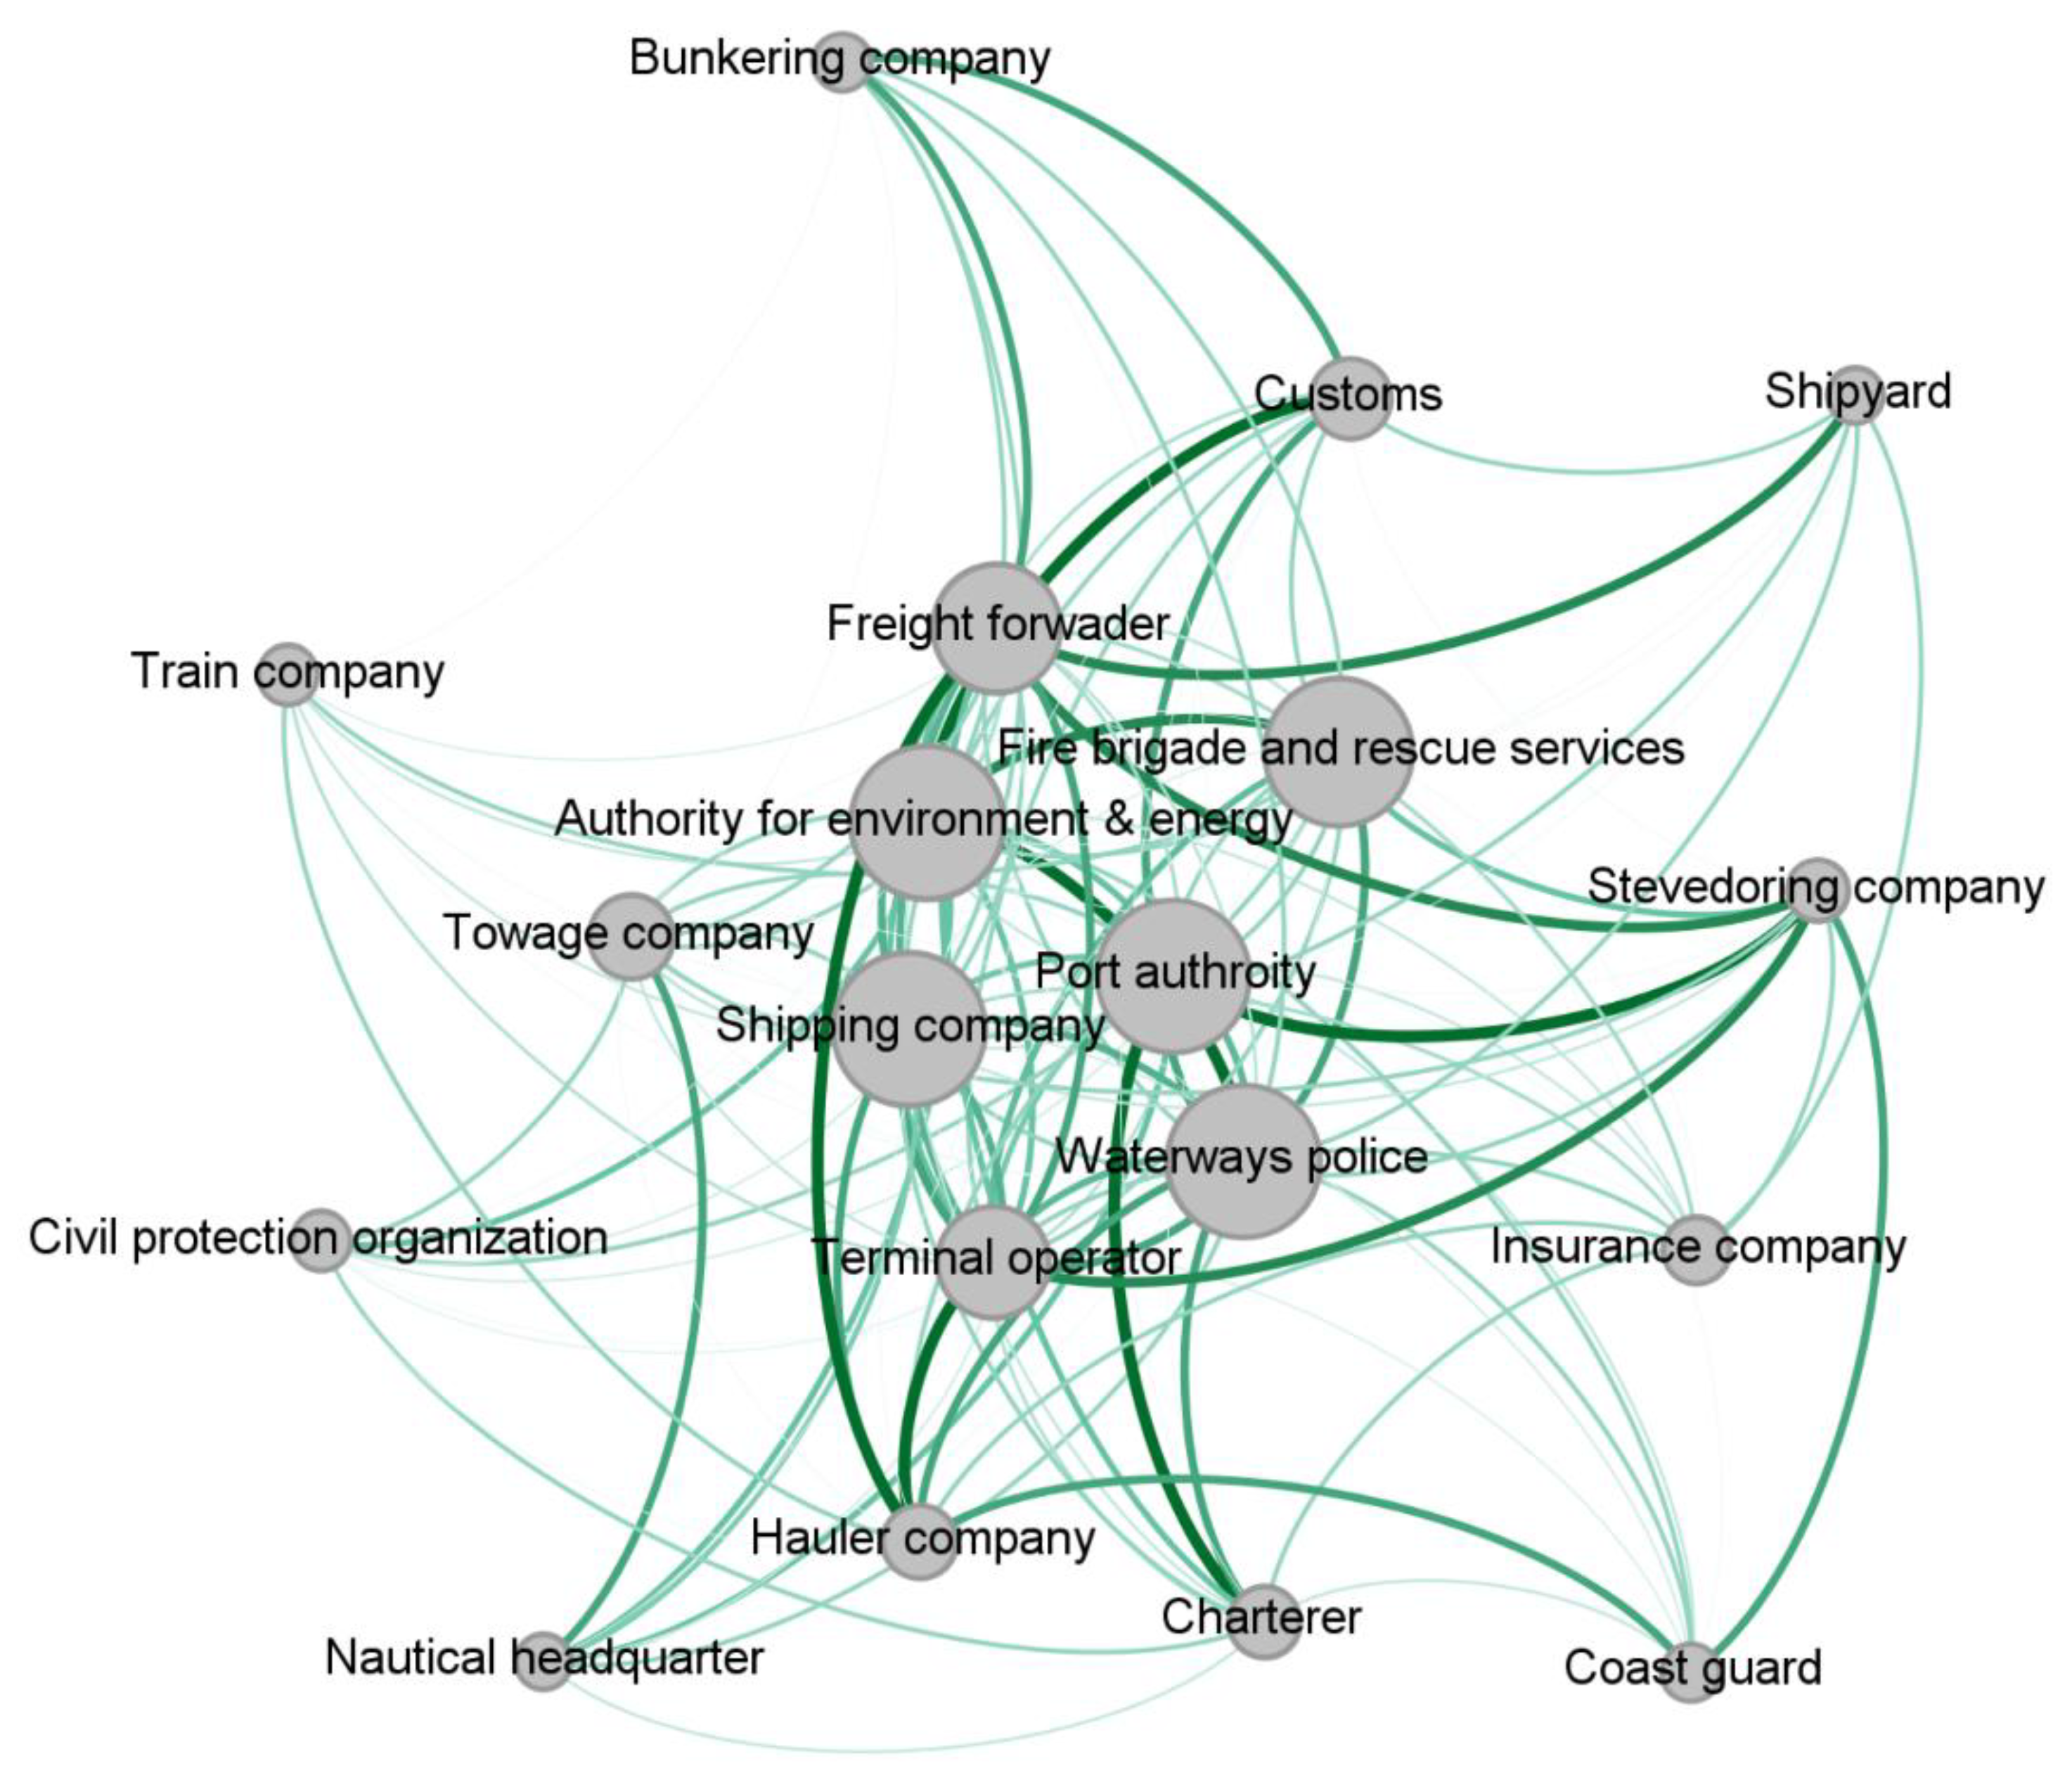
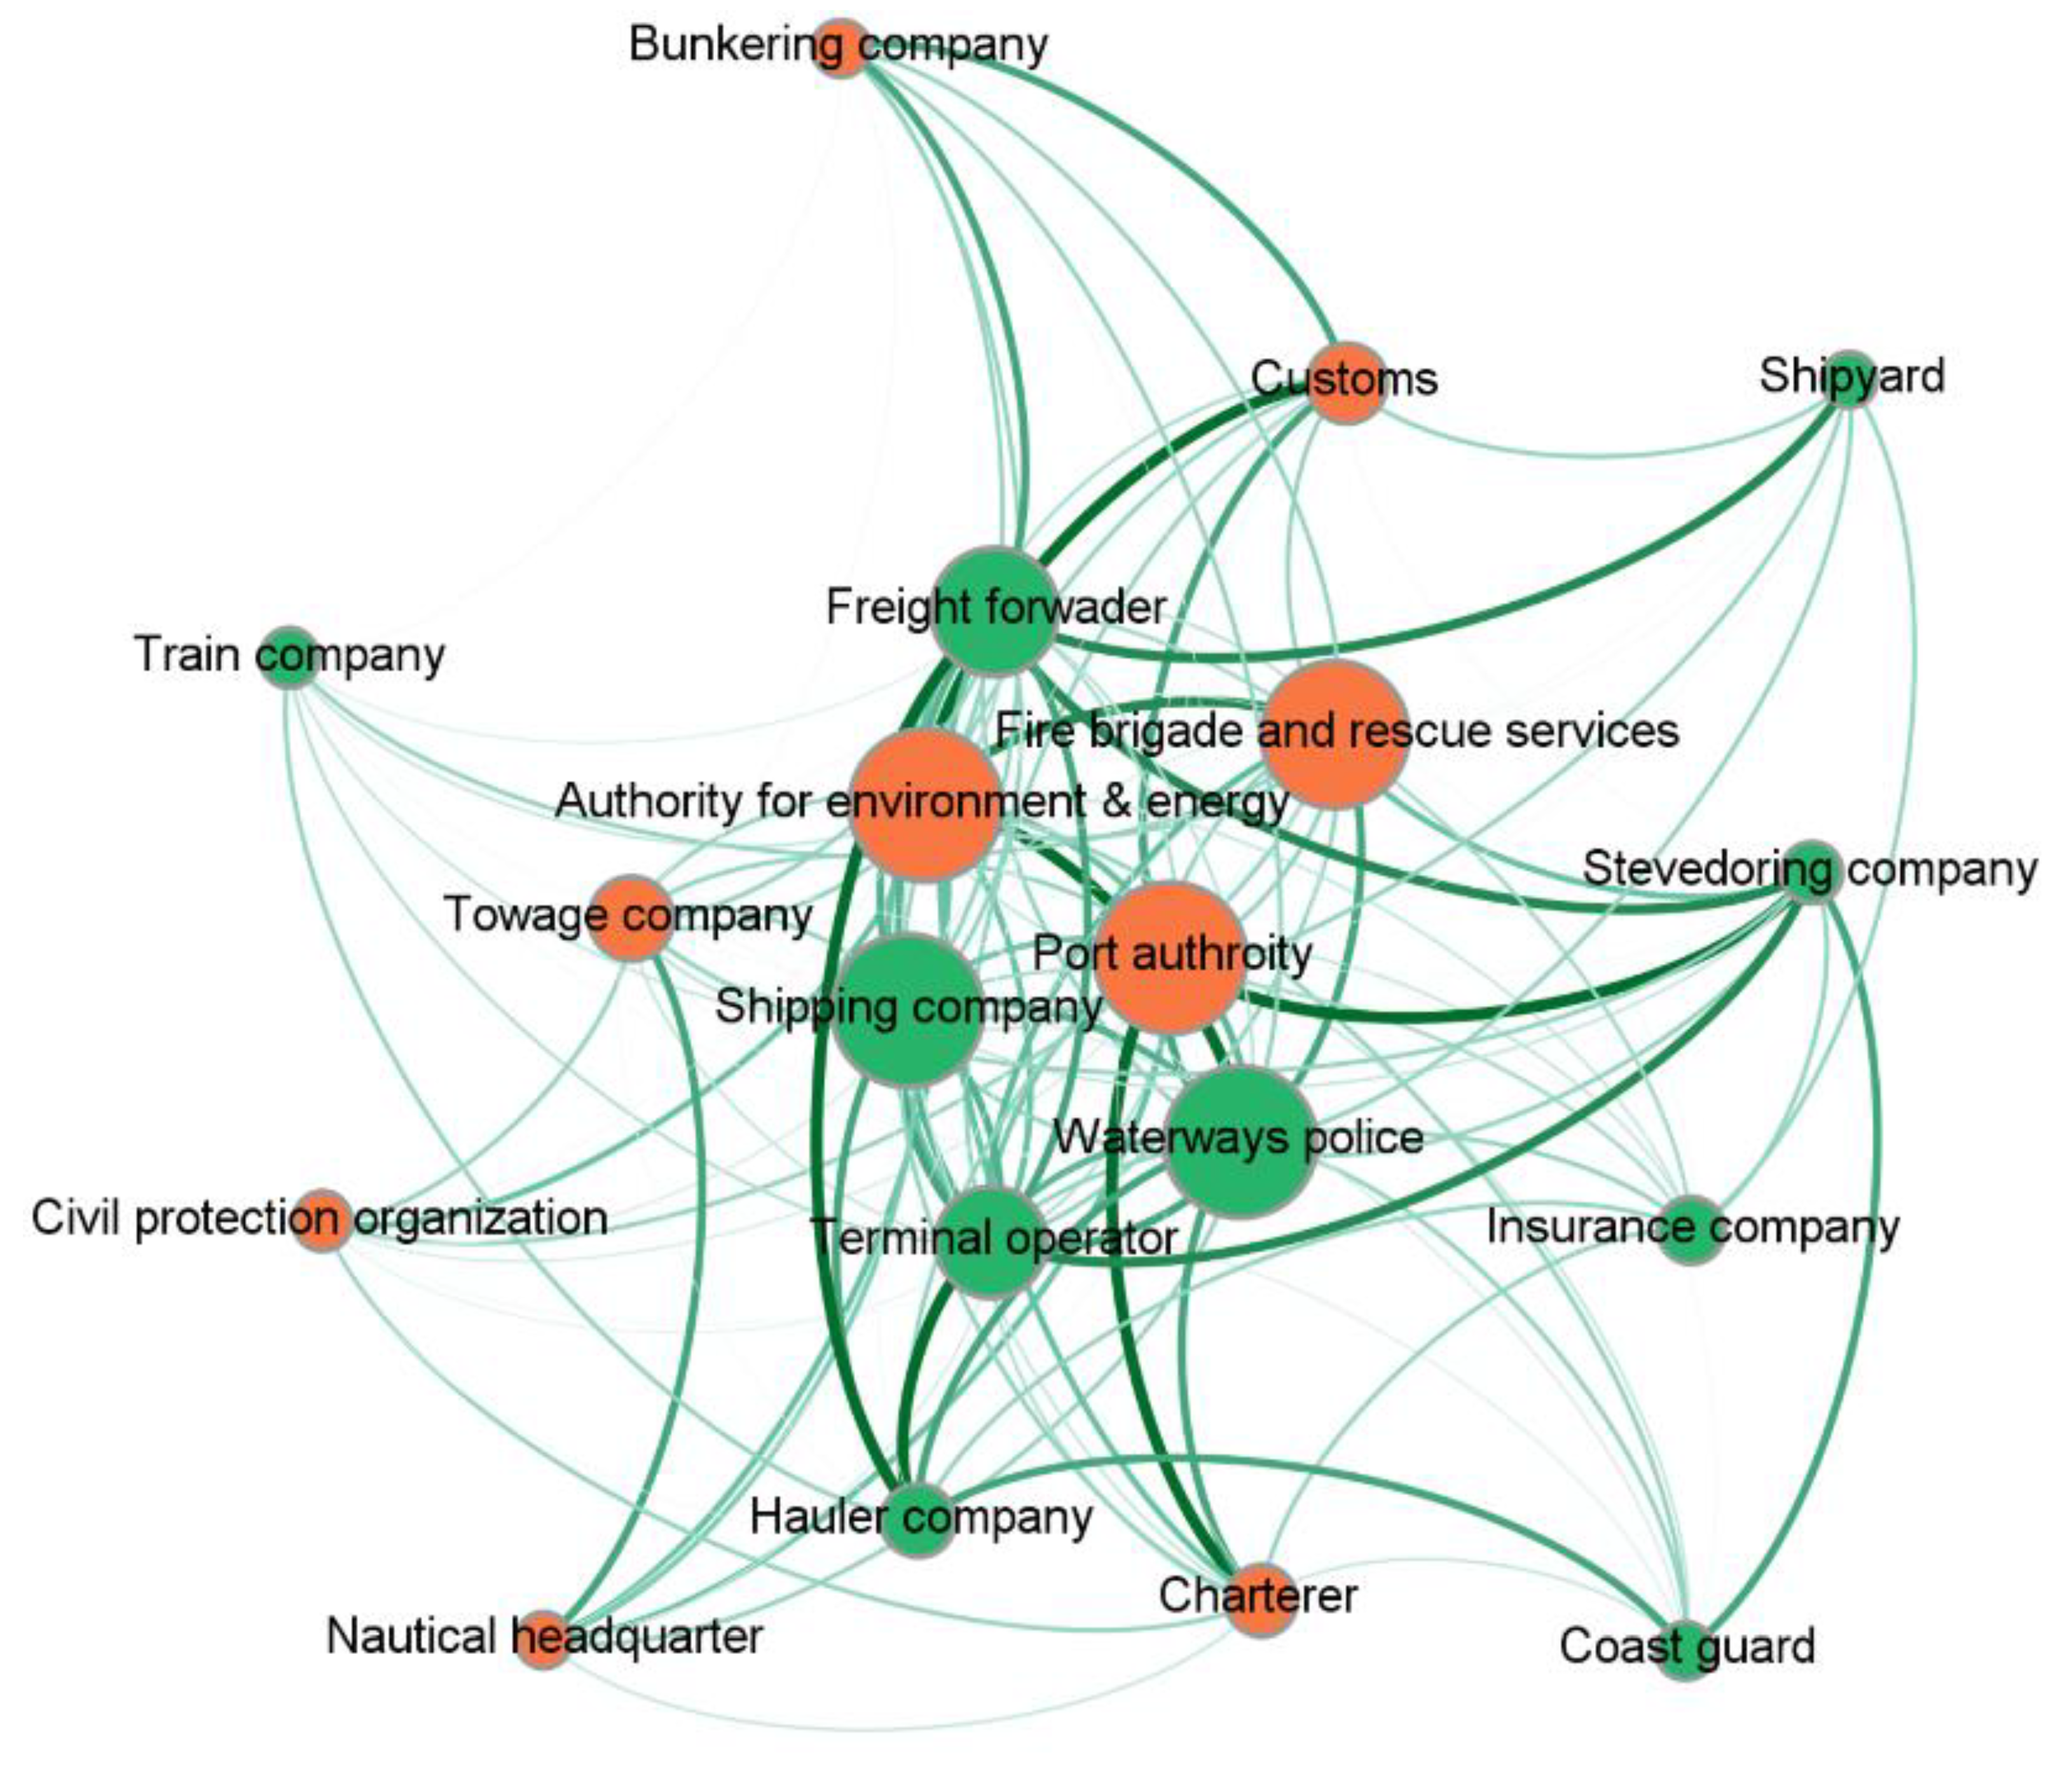
4.2. Network Analysis

The final values (weights) were used to create the undirected network graph in Gephi (see Table 5). The table lists the source and target nodes, edge type, and corresponding weight (i.e., communication intensity value). Each edge is bidirectional, meaning that the communication is initiated by both partners in the network. The position of each stakeholder in the network, as previously mentioned, is based on the value generated by the software using the Yifan Hu layout algorithm. The intensity of communication is represented by the thickness of each edge based on the defined ordinal scale.

4.2.1. Natural Disasters

Figure 3 indicates that the waterways police, the Authority for Environment and Energy, fire brigade and rescue services, and the port authority might be core actors when it comes to cooperation in case of emergencies. As mentioned earlier, the thickness of each edge indicates the communication intensity value, whereas the size of each node represents the value of betweenness centrality, which measures how often a node appears on the shortest paths between nodes in a network. It reveals the nodes that are critical for connecting other nodes to one another.
The network has a low average betweenness centrality value of 3%, indicating the lack of clear core actors that coordinate activities regarding natural disasters. However, terminal operators and the Authority for Environment and Energy possess the highest betweenness centrality values (12%) in the network, signalling the high degree of influence they have over the flow of information and data among other stakeholders. The value of betweenness centrality is calculated based on the number of nodes in the network as well as the number of shortest paths between nodes [54]. Other network analysis studies achieved high betweenness centrality values ranging from 6–8.5% (see [55,56]).

4.2.2. Operational and Safety Risks

Figure 4 presents the stakeholder network analysis of operational and safety risks. The figure reveals a larger set of stakeholders that cooperate with one another concerning operational and safety risks. For instance, these risks can be connected to the handling of dangerous goods, the collision of containers, leakages of hazardous materials, and work-related safety risks. Based on discussion with stakeholders at the port of Hamburg, the most frequent risk source is linked with dangerous goods, such as the explosion of hazardous gases and chemicals [57].
The network has a low average betweenness centrality value of 2%, indicating the lack of clear core actors that coordinate activities regarding operational and safety risks. Moreover, six stakeholder groups have an average betweenness centrality value of 4%, revealing that the coordination of operational and safety risks is decentralized due to the different risks that could occur in this category.

4.2.3. Network Parameters

Table 6 lists the network parameters’ values for each examined risk category. The network of natural disasters has a network diameter of 3, compared to 2 in the case of operational and safety risks. This means that the shortest path length between nodes requires three steps, suggesting a higher hierarchical and decentralized process that requires accurate coordination among the involved stakeholders.
Based on the results of network density, a conclusion is that certain stakeholders (e.g., the haulier company, charterer, and bunkering company) are not within the cooperation network for natural disasters, in comparison to their connection to other stakeholders in the case of operational and safety risks. This has led to a lower value for the network density (73.3%). The same conclusion can be applied to the average degree of natural disasters (i.e., an average of 11 edges that are adjacent to every node in the network). Another possible reason for the higher average degree value in the case of operational and safety risks (15.7) is the number of operational processes that connect different stakeholders, such as transhipment, loading/unloading, and storage processes.

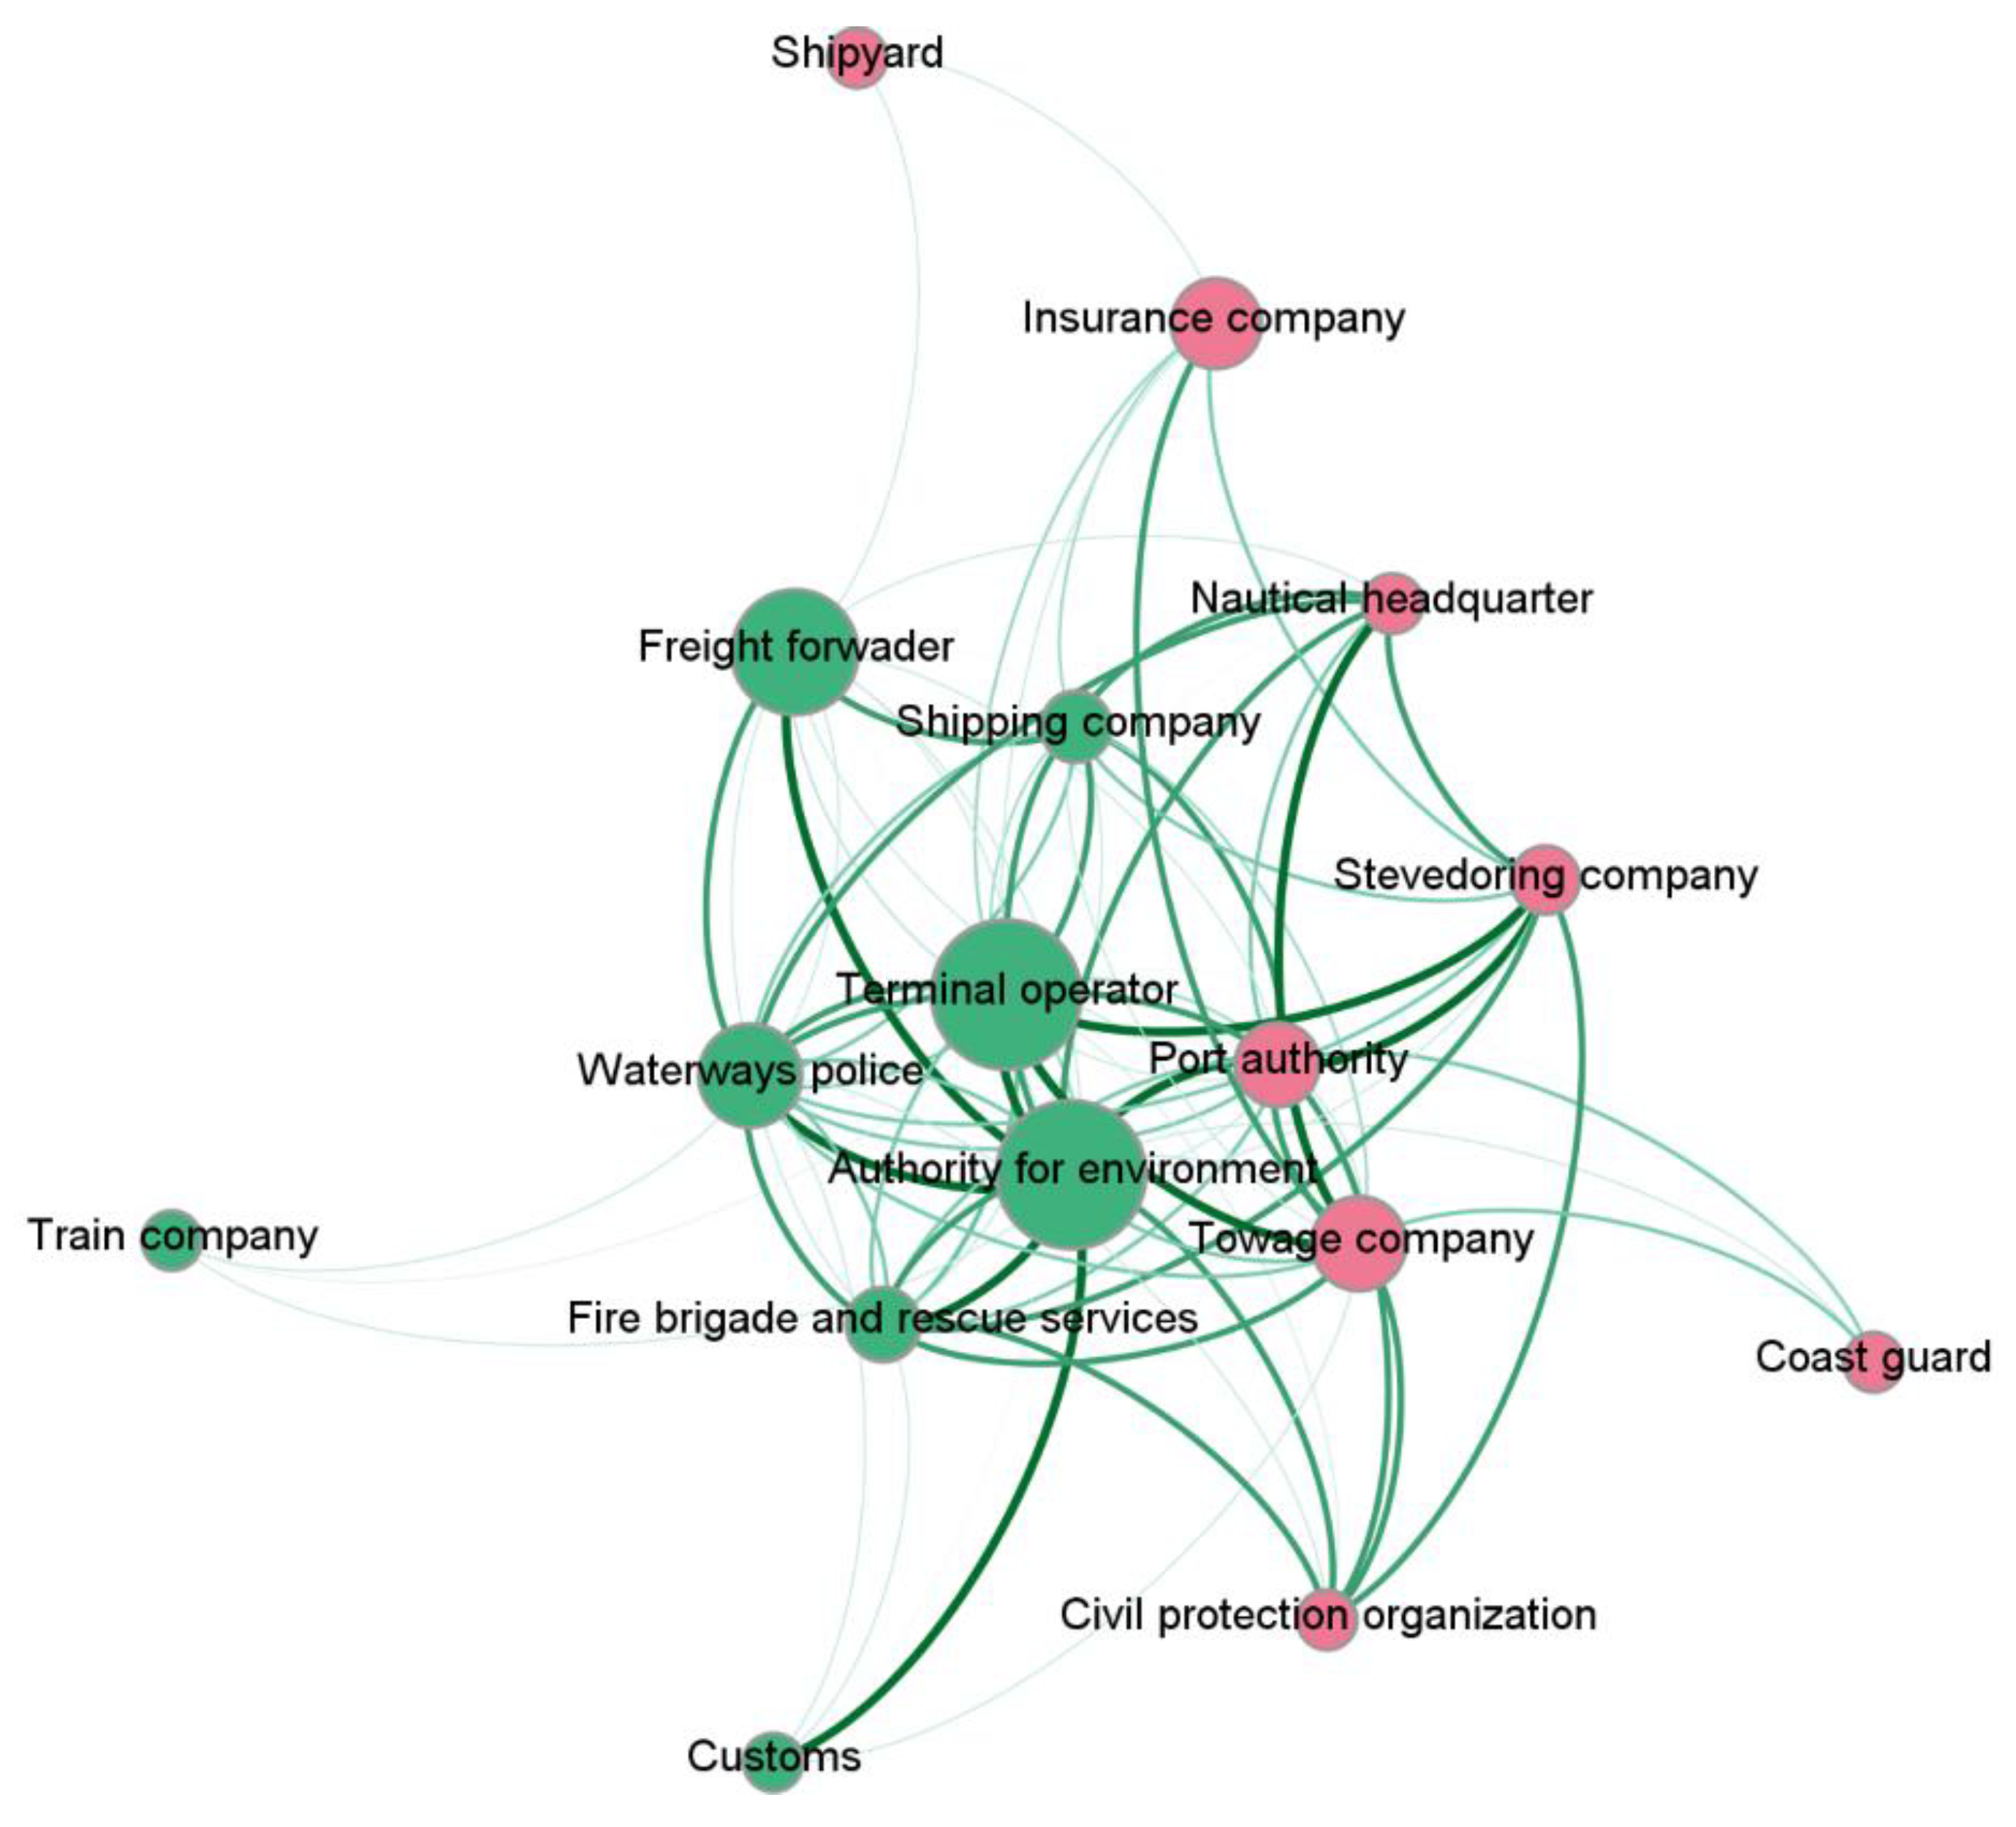
4.3. Community Detection

A modularity resolution of 1.0 was used in both networks: (1) natural disasters and (2) operational and safety risk sources. This resolution is a parameter in the Louvain modularity algorithm in Gephi and was initially adjusted to several values until the highest modularity value was reached (average modularity in both networks = 0.1). Since the number of nodes and edges represent a small network, the modularity value is considerably smaller than for those resulting from large networks.

4.3.1. Natural Disasters

Figure 5 illustrates the two communities extracted for natural disasters. The communities are uniformly distributed, with each comprising eight stakeholder groups.
Table 7 lists the members of each community. The second community, for instance, reveals the stakeholders connected to the port authority, such as nautical headquarters, the towage company, the civil protection organization, and the coast guard. Many of these stakeholders are also connected via edges to other stakeholder groups. Critical verification of these communities was carried out in the plausibility check phase.

4.3.2. Operational and Safety Risks

Figure 6 depicts the two communities extracted for operational and safety risks. The communities are larger in size compared to the case of natural disasters, comprising ten and nine stakeholder groups, respectively.
Table 8 lists the members of each community. A change in community members can also be noticed. In addition, from a supply chain point of view, the operational activities of terminal operators, shipping companies, freight forwarders, train companies, and haulier companies appear to be closely linked, thus making them part of the same community. A critical verification of these communities was carried out in the plausibility check phase.

4.4. Plausibility Check

A plausibility check was carried out using the stakeholder analysis section of the interview study and grey literature. This check would verify the communities revealed based on the online survey study. The 15 semi-structured interviews with different stakeholder categories were utilized to determine the communication intensity value for the activities related to risk management at the port of Hamburg. A preliminary stakeholder map was prepared using the Smaply software (Smaply.com can be used to generate stakeholders maps) and was refined in each interview, and the same ordinal scale (from 0: no communication to 4: always) was used for the communication intensity value. The values of this stakeholder map were analyzed using MS Excel.
Based on the interview study, the focus of cooperation is particularly concentrated on the reactive process and the emergency and evacuation plans. For instance, environmental threats, once identified, have a direct influence on initiating a communication channel between the Authority for Environment and Energy and other stakeholders, especially the waterways police and the fire brigade:
“If something happens, then we are no longer in risk management but in emergency management. In that case, we completed a special training where we worked out everything that is reasonably imaginable with regards to the different scenarios” (#harbour pilots).
In the event of a storm surge, the Port Staff (HASTA: Hafenstab) is responsible for all technical and organizational measures necessary to ensure safety in the port. HASTA is part of the Hamburg Port Authority (HPA) disaster control system. The Ministry of Interior and Sport coordinates storm surge protection centrally across all authorities. Apart from the Ministry of Interior and the HPA, the stakeholders involved in flood protection are rescue services, the waterways police, the Authority for Environment and Energy, the civil protection organization, and district authorities. Figure 7 displays the stakeholders involved in the case of a storm surge at the port of Hamburg [58].
With respect to risk management, none of the interviewed stakeholders mentioned their cooperation with bunkering companies or shipyards. Therefore, a further examination was conduction using secondary sources and grey literature. According to German statutory accident insurance, work safety at shipyards requires early and careful coordination of the work and the associated occupational safety measures [59].
Shipyards, such as the HPA shipyard, repair and maintain vessels of the port authority, the waterways police, and rescue services. In this situation, the shipyard is called a state shipyard. Shipyards typically inspect ships and vessels for leakages and other defective parts. Furthermore, fire brigade and rescue services normally try to salvage ships and vessels in case of leakages, fires, and other risk sources [60].
Table 9 lists the corresponding stakeholder category for each assigned code in the heat map. Figure 8 displays the heat map created using the communication intensity values provided by the 15 interviewed stakeholders in the interview study. The stakeholder map that they filled out contains 17 stakeholders. The first column and row in the matrix correspond to one of the stakeholder categories mentioned in Table 9.
Based on the communication intensity values, the heat map indicates that terminal operators, shipping companies, the waterways police, fire brigade and rescue services, the Authority for Environment and Energy, and freight forwarders are core actors in the communication and coordination of activities related to risk management at the port of Hamburg.
The cooperation aspects connected to these stakeholder groups, as well as the other mentioned stakeholders, include risk-specific response plans, leadership and coordination, and the exchange of data and information. Another aspect is connected to consultation and regular meetings between freight forwarders, terminal operators, and shipping companies with regard to dangerous goods. Another example is related to the coordination among stevedoring companies and the waterways police in case of a disruption:
“We work intensively with the waterways police and the shipping companies. We provide consultation and assistance to each other, such as in dangerous goods class “1”, which is my area of expertise” (#freight forwarder).
“If something happens in an individual disruption case where the stevedores are involved, it is essential that we contact them” (#waterways police).
With regard to operational and safety risks, terminal operators, shipping companies, stevedore companies, and the waterways police are part of the same community. The exception is in natural disasters, where terminal operators, shipping companies, the Authority for Environment, fire brigade and rescue services, and the waterways police are part of one community, and stevedore companies, the port authority, and nautical headquarters are part of another community. A shipping company mentioned their cooperation with waterways police in case of operational and safety risks such as the falling of containers:
“Waterways police help us to carry out a smooth process in order to make sure that everything is planned correctly to avoid accidents, such as the falling of containers” (#shipping company).
Furthermore, in relation to storm surges, the port authority should be part of the same community with the waterways police and rescue services, as mentioned above (see Figure 7). In the case of operational and safety risks, the nautical headquarters coordinates the emergency measures with the upper port authority, using the HPA as a connection point. The three stakeholder groups are part of the same community (see Figure 6):
“The tugboats cannot do anything theoretically. In case of an emergency, it would very much like to call the harbor pilots. In this case, of course, we are the connection point with the upper port authority” (#port authority).
The plausibility check revealed some errors and discrepancies between the extracted communities on the one hand and the stakeholder analysis conducted using the interview study on the other. The results revealed that the communities are interdependent, since several stakeholders play an important role in the coordination and communication of the aforementioned risk categories.

5. Implications

A cooperative risk management network should comprise human beings and nonhuman actors represented by IT and online solutions with the associated databases to facilitate interaction and knowledge transfer during each phase of the risk management process. This is an aspect that is linked with the actor network theory. In particular, the “enrolment and translation” aspect of the actor network theory (see [61]) can be applied in the network of stakeholders at the seaport. Relevant stakeholders are enrolled in the actor network based on their involvement in specific risk sources during prevention and/or response. The social network theory indicates that a better understating of relationships among individuals can reveal opportunities to make changes in current processes. Analyzing communication means and cooperation aspects for activities related to risk management can reveal potential for improvements.
In addition to the aforementioned theoretical implications, several practical implications were extracted from this study, including stakeholder identification and risk governance.
First, the roles and responsibilities for risk management should be clearly defined, especially for the process owner, as well as risk owners in every organization. The definition of these roles and responsibilities will establish a clear cooperation among core stakeholders at the seaport. These roles and responsibilities should be easily accessible, e.g., via a shared knowledge reservoir, and should be classified according to specific filtering criteria (e.g., stakeholder category, risk sources and risk owners). Second, there is a need to have a central stakeholder that coordinates and leads the risk management process at the seaport. The port authority, in a landlord port for instance, is a recommended central stakeholder to lead and coordinate the strategic and tactical levels of risk management with other core stakeholders. Third, the organizations should define the resources required to improve the status of risk management, and to align their policies with the overall objective defined by the process owner. In this context, there is a need to have adequate human resources who possess expertise and knowledge in risk management on the one hand, and relevant as well as structured information resources that are available everytime to the organization on the other hand. Organizational policies should include formal instructions such as purpose, scope, risk gonvernance, risk sources, risk management process, and risk reporting. Fourth, clear communication means and procedures should be defined within the circle of core stakeholders to ensure an efficient communication, especially when responding to accidents and disasters. In this regard, these communication means and procedures should be clearly defined for risk prevention (i.e., proactive risk management including the assessment process along with defined treatment plans and measures) and response (i.e., implementation and monitoring of treatment plans as well as measures). Lastly, mutual training and exercises can increase the level of trust, and thereby an exchange of data and information for risk management-related activities can be facilitated. Organizing such training and exercises has as well a direct influce in transferring and applying relevant expert knowledge in risk management.

6. Conclusions, Limitations and Outlook

This paper aimed to analyze communities of stakeholders at the port of Hamburg with regard to their communication intensity in activities related to risk management. Natural disasters as well as operational and safety risks define the scope of the research work. The results were extracted using an online compact survey based on the communication intensity values. Each value is based on the frequency of face-to-face communication, warnings, and disclosures concerning the activities related to risk management.
The results revealed that the communities are interdependent, especially for core stakeholder categories that coordinate and lead specific risk sources. As observed from the comparison of the communities between natural disasters on the one hand and operational and safety risks on the other, several stakeholders emerge in the cooperation network. This indicates the emergence of specific clusters according to the risk type. In addition, the average values of betweenness centrality in the two extracted networks are low, which indicates the lack of clear core actors who coordinate the risk management activities during prevention and/or response. The selection of risk owners for each risk category, in each participating organization, is thus essential to facilitate efficient cooperation in risk management. This selection should be based on a clear definition of tasks and responsibilities in each phase of the risk management process. After the identification of core stakeholders, a risk governance process can be initiated, where the participating entities provide an effective oversight of the risk management process at the seaport.
The main limitation of this work can be extracted from the network analysis process: only 28 full survey responses were available for the analysis. Moreover, the plausibility check was based on 15 semi-structured interviews and secondary data that were available to the authors.
In terms of the research outlook, a larger set of stakeholders should be addressed to verify the communication and cooperation aspects of stakeholders in a seaport system. It is important to consider the differences in the stakeholders’ structure based on the type and functions of the examined seaport. From a methodological prescriptive, this work can utilize quantitative data analysis techniques such as Analytical Hierarchy Process (AHP) and Bayesian methods (see [62,63]) to expand and verify the findings of this research. Furthermore, further research should be conducted to examine the role and process of risk governance in seaports. Finally, a prescriptive process model for cooperative risk management in seaports should be developed to guide stakeholders in every phase of the risk management process.

Author Contributions

Conceptualization, A.N., M.S. and W.K.; methodology, A.N.; formal analysis, A.N. and M.S.; investigation, A.N., M.S. and W.K.; visualization, A.N.; writing—original draft preparation, A.N., M.S. and W.K.; writing—review and editing, A.N., M.S. and W.K. All authors have read and agreed to the published version of the manuscript.

Funding

This work was supported by the European Regional Development Fund (ERDF) and the European Neighbourhood Instrument (ENI) within the scope of the Interreg Baltic Sea Region Programme through the EUSBSR flagship project HAZARD (http://blogit.utu.fi/hazard/ (accessed on 15 April 2021)). Publishing fees supported by Funding Programme “Open Access Publishing” of Hamburg University of Technology (TUHH).

Institutional Review Board Statement

Not applicable.

Informed Consent Statement

Not applicable.

Data Availability Statement

Please contact the corresponding author.

Acknowledgments

The authors would like to thank the editor and the anonymous reviewers for the constructive feedback provided.

Conflicts of Interest

The authors declare no conflict of interest. The funders had no role in the design of the study; in the collection, analyses, or interpretation of data; in the writing of the manuscript, or in the decision to publish the results.

References

  1. Gharehgozli, A.H.; Roy, D.; de Koster, R. Sea container terminals: New technologies and OR models. Marit. Econ. Logist. 2016, 18, 103–140. [Google Scholar] [CrossRef]
  2. Reagans, R.; McEvily, B. Network structure and knowledge transfer: The effects of cohesion and range. Adm. Sci. Q. 2003, 48, 240–267. [Google Scholar] [CrossRef] [Green Version]
  3. Lazer, D.; Friedman, A. The network structure of exploration and exploittation. Adm. Sci. Q. 2007, 52, 667–694. [Google Scholar] [CrossRef] [Green Version]
  4. Pileggi, S.F.; Indorf, M.; Nagi, A.; Kersten, W. CoRiMaS—An Ontological Approach to Cooperative Risk Management in Seaports. Sustainability 2020, 12, 4767. [Google Scholar] [CrossRef]
  5. Hoyle, B.S.S. Seaports and Development: The Experience of Kenya and Tanzania; Taylor Francis: Hoboken, NJ, USA, 2012. [Google Scholar]
  6. Goss, R.O. Economic policies and seaports. The economic functions of seaports. Marit. Policy Manag. 1990, 17, 207–219. [Google Scholar] [CrossRef]
  7. De, A.; Choudhary, A.; Turkay, M.; Tiwari, M.K. Bunkering policies for a fuel bunker management problem for liner shipping networks. Eur. J. Oper. Res. 2021, 289, 927–939. [Google Scholar] [CrossRef]
  8. De, A.; Pratap, S.; Kumar, A.; Tiwari, M.K. A hybrid dynamic berth allocation planning problem with fuel costs considerations for container terminal port using chemical reaction optimization approach. Ann. Oper. Res. 2020, 290, 783–811. [Google Scholar] [CrossRef] [Green Version]
  9. De, A.; Wang, J.; Tiwari, M.K. Hybridizing Basic Variable Neighborhood Search with Particle Swarm Optimization for Solving Sustainable Ship Routing and Bunker Management Problem. IEEE Trans. Intell. Transp. Syst. 2020, 21, 986–997. [Google Scholar] [CrossRef]
  10. De, A.; Wang, J.; Tiwari, M.K. Fuel Bunker Management Strategies within Sustainable Container Shipping Operation Considering Disruption and Recovery Policies. IEEE Trans. Eng. Manag. 2021, 68, 1089–1111. [Google Scholar] [CrossRef] [Green Version]
  11. Wagner, N. Identification of the most important sustainability topics in seaports. Logist. Transp. 2017, 34, 79–88. [Google Scholar]
  12. Matusiewicz, M.; Rolbiecki, R. The tendency of city stakeholders to implement sustainable logistics measures using the port city of Gdynia as an example. Zesz. Nauk. Akad. Morska Szczec. 2021. Available online: https://repository.am.szczecin.pl/handle/123456789/2666 (accessed on 15 July 2021).
  13. Notteboom, T.; Winkelmans, W. Stakeholders relations management in ports: Dealing with the interplay of forces among stakeholders in a changing competitive environment. In Proceedings of the IAME 2002—International Association of Maritime Economists Annual Conference 2002, Panama City, Panama, 12–15 November 2002. [Google Scholar]
  14. Nagi, A.; Indorf, M.; Singer-Neumann, C.; Ojala, L. Current State of Risk Assessment in Seaports: An Empirical Study. In Logistik im Wandel der Zeit—Von der Produktionssteuerung zu Vernetzten Supply Chains; Springer: Berlin/Heidelberg, Germany, 2019; pp. 79–101. [Google Scholar]
  15. John, A.; Yang, Z.; Riahi, R.; Wang, J. A risk assessment approach to improve the resilience of a seaport system using Bayesian networks. Ocean Eng. 2016, 111, 136–147. [Google Scholar] [CrossRef] [Green Version]
  16. Schmidt, J.; Matcham, I.; Reese, S.; King, A.; Bell, R.; Henderson, R.; Smart, G.; Cousins, J.; Smith, W.; Heron, D. Quantitative multi-risk analysis for natural hazards: A framework for multi-risk modelling. Nat. Hazards 2011, 58, 1169–1192. [Google Scholar] [CrossRef]
  17. Kaundinya, I.; Nisancioglu, S.; Kammerer, H.; Oliva, R. All-hazard guide for transport infrastructure. Transp. Res. Procedia 2016, 14, 1325–1334. [Google Scholar] [CrossRef] [Green Version]
  18. John, A.; Paraskevadakis, D.; Bury, A.; Yang, Z.; Riahi, R.; Wang, J. An integrated fuzzy risk assessment for seaport operations. Saf. Sci. 2014, 68, 180–194. [Google Scholar] [CrossRef] [Green Version]
  19. Loh, H.S.; Thai, V.V. Management of disruptions by seaports: Preliminary findings. Asia Pac. J. Mark. Logist. 2015, 27, 146–162. [Google Scholar] [CrossRef]
  20. Zhang, Y.; Lam, J.S.L. Estimating economic losses of industry clusters due to port disruptions. Transp. Res. Part A Policy Pract. 2016, 91, 17–33. [Google Scholar] [CrossRef]
  21. Lam, J.S.L.; Su, S. Disruption risks and mitigation strategies: An analysis of Asian ports. Marit. Policy Manag. 2015, 42, 415–435. [Google Scholar] [CrossRef]
  22. Hopkin, P. Fundamentals of Risk Management: Understanding, Evaluating and Implementing Effective Risk Management, 5th ed.; Kogan Page Limited: London, UK, 2018. [Google Scholar]
  23. Garvey, P.R. Analytical Methods for Risk Management: A Systems Engineering Perspective; CRC Press: Boca Raton, FL, USA, 2008. [Google Scholar]
  24. Müssigmann, N. Mitigating risk during strategic supply network modelling. In Managing Risks in Supply Chains: How to Build Reliable Collaboration in Logistics; Schmidt: Berlin/Heidelberg, Germany, 2006; pp. 213–226. [Google Scholar]
  25. IRGC. IRGC Guidelines for Emerging Risk Governance. 2015. Available online: https://infoscience.epfl.ch/record/228053/files/Guidelines%20for%20Emerging%20Risk%20Governance.pdf?version=1 (accessed on 15 September 2020).
  26. Aven, T.; Renn, O. Risk Management and Governance: Concepts, Guidelines and Applications; Springer: Berlin/Heidelberg, Germany, 2010. [Google Scholar]
  27. Börner, K.; Sanyal, S.; Vespignani, A. Network science. Annu. Rev. Inf. Sci. Technol. 2007, 41, 537–607. [Google Scholar] [CrossRef]
  28. Barabási, A.L. Network Science; Bell Bain Ltd.: Glasgow, UK, 2016. [Google Scholar]
  29. Achrol, R. Changes in the theory of interorganizational relations in marketing: Toward a network paradigm. J. Acad. Mark. Sci. 1996, 25, 56–71. [Google Scholar] [CrossRef]
  30. Estrada, E. Network Science: Complexity in Nature and Technology; Springer: London, UK, 2010. [Google Scholar]
  31. Seufert, A.; Krogh, G.; von Bach, A. Towards knowledge networking. J. Knowl. Manag. 1999, 3, 180–190. [Google Scholar] [CrossRef] [Green Version]
  32. Lewis, T.G. Network Science: Theory and Applications; John Wiley Sons: Hoboken, NJ, USA, 2011. [Google Scholar]
  33. Newman, M.E.J. Modularity and community structure in networks. Proc. Natl. Acad. Sci. USA 2006, 103, 8577–8582. [Google Scholar] [CrossRef] [Green Version]
  34. Newman, M.E.J.; Girvan, M. Finding and evaluating community structure in networks. Phys. Rev. E 2004, 69, 26113. [Google Scholar] [CrossRef] [Green Version]
  35. Cherifi, H. Complex Networks and Their Applications; Cambridge Scholars Publishing: Newcastle upon Tyne, UK, 2014. [Google Scholar]
  36. Aerts, G.; Dooms, M.; Haezendonck, E. Stakeholder management practices found in landlord seaport authorities in Flanders: An inside-out perspective. Int. J. Shipp. Transp. Logist. 2015, 7, 597–620. [Google Scholar] [CrossRef]
  37. Becker, A.H.; Matson, P.; Fischer, M.; Mastrandrea, M.D. Towards seaport resilience for climate change adaptation: Stakeholder perceptions of hurricane impacts in Gulfport (MS) and Providence (RI). Prog. Plan. 2015, 99, 1–49. [Google Scholar] [CrossRef]
  38. Da Cruz, M.R.P.; Ferreira, J.J.; Azevedo, S.G. Key factors of seaport competitiveness based on the stakeholder perspective: An Analytic Hierarchy Process (AHP) model. Marit. Econ. Logist. 2013, 15, 416–443. [Google Scholar] [CrossRef]
  39. Dooms, M.; Macharis, C.; Verbeke, A. Proactive stakeholder management in the port planning process: Empirical evidence from the Port of Brussels. Comput. Rev. 2004, 1–34. Available online: http://hdl.handle.net/10419/117092 (accessed on 15 July 2021).
  40. Creswell, J.W.; Plano Clark, V.L. Designing and Conducting Mixed Methods Research, 3rd ed.; Sage Publications: Thousand Oaks, CA, USA, 2018. [Google Scholar]
  41. Clark-Ginsberg, A. Participatory risk network analysis: A tool for disaster reduction practitioners. Int. J. Disaster Risk Reduct. 2017, 21, 430–437. [Google Scholar] [CrossRef]
  42. Nuss, P.; Graedel, T.E.; Alonso, E.; Carroll, A. Mapping supply chain risk by network analysis of product platforms. Sustain. Mater. Technol. 2016, 10, 14–22. [Google Scholar] [CrossRef] [Green Version]
  43. Thirumalai, C.; Sree, K.S.; Gannu, H. Analysis of cost estimation function for facebook web click data. Int. Conf. Electron. Commun. Aerosp. Technol. 2017, 2, 172–175. [Google Scholar]
  44. Zedan, S.; Miller, W. Using social network analysis to identify stakeholders’ influence on energy efficiency of housing. Int. J. Eng. Bus. Manag. 2017, 9, 1–11. [Google Scholar] [CrossRef] [Green Version]
  45. Jacomy, M.; Venturini, T.; Heymann, S.; Bastian, M. ForceAtlas2, a continuous graph layout algorithm for handy network visualization designed for the Gephi software. PLoS ONE 2014, 9, e98679. [Google Scholar] [CrossRef] [PubMed]
  46. Freeman, L.C.; Roeder, D.; Mulholland, R.R. Centrality in Social Networks II: Experimental Results; School of Social Sciences, University of California: Irvine, CA, USA, 1979. [Google Scholar]
  47. Rowley, T. Moving beyond dyadic ties: A network theory of stakeholder influences. Acad. Manag. Rev. 1997, 22, 887–910. [Google Scholar] [CrossRef]
  48. Chen, H.; Yang, C.C. Intelligence and Security Informatics. In Proceedings of the IEEE ISI 2008 International Workshops: PAISI, PACCF, and SOCO 2008, Taipei, Taiwan, 17 June 2008; Springer: Berlin/Heidelberg, Germany, 2008. [Google Scholar]
  49. Khokhar, D. Gephi Cookbook; Pakt Publishing Ltd.: Birmingham, BI, USA, 2015. [Google Scholar]
  50. Cherven, K. Mastering Gephi Network Visualization; Packt Publishing Ltd.: Birmingham, BI, USA, 2015. [Google Scholar]
  51. Rahiminejad, S.; Maurya, M.R.; Subramaniam, S. Topological and functional comparison of community detection algorithms in biological networks. BMC Bioinform. 2019, 20, 212. [Google Scholar] [CrossRef]
  52. Schink, T.; Garbe, E. Assessment of the representativity of in-patient hospital diagnoses in the German Pharmacoepidemiological Research Database. Das Gesundh. 2010, 72, P10. [Google Scholar] [CrossRef]
  53. Hsieh, H.-F.; Shannon, S.E. Three approaches to qualitative content analysis. Qual. Health Res. 2005, 15, 1277–1288. [Google Scholar] [CrossRef] [PubMed]
  54. Zarghami, S.A.; Gunawan, I. A domain-specific measure of centrality for water distribution networks. Eng. Constr. Archit. Manag. 2020, 27, 341–355. [Google Scholar] [CrossRef]
  55. Nacher, J.C.; Schwartz, J.-M. A global view of drug-therapy interactions. BMC Pharmacol. 2008, 8, 5. [Google Scholar] [CrossRef] [PubMed] [Green Version]
  56. Zaabi, H.A.; Bashir, H. Analyzing interdependencies in a project portfolio using social network analysis metrics. In Proceedings of the 2018 5th International Conference on Industrial Engineering and Applications (ICIEA), Singapore, 26–28 April 2018; pp. 490–494. [Google Scholar]
  57. Nagi, A.; Porten, H.; Indorf, M.; Kersten, W.; Bazaras, D.; Purre, A.H.; Harteela, M.; Elonen, A. Current Status of Risk Management Process at Major Baltic Sea Region Seaports. In Publications of the Hazard Project; University of Turku: Turku, Finland, 2019. [Google Scholar] [CrossRef]
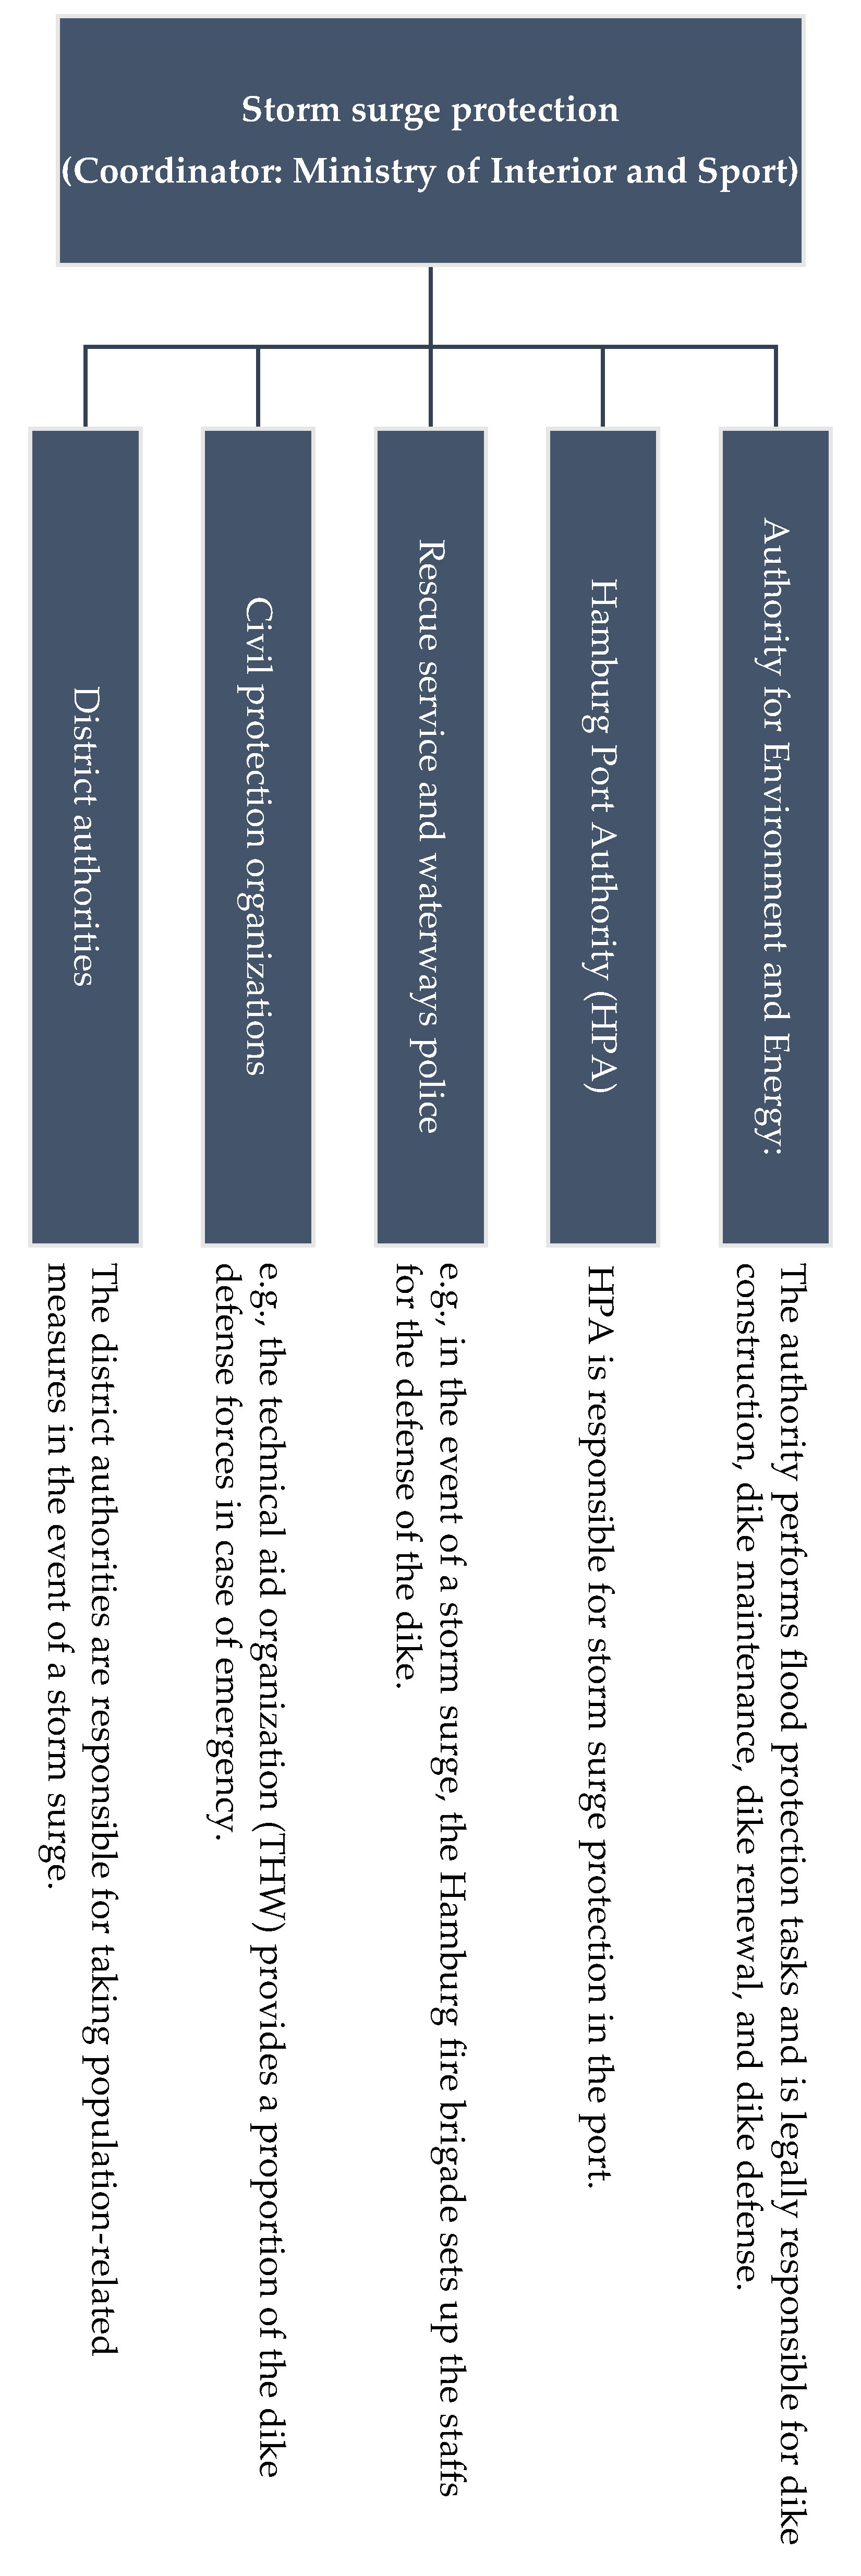
  58. Behörde für Inneres und Sport. Wie ist der Sturmflutschutz Organisiert? 2019. Available online: https://www.hamburg.de/innenbehoerde/sturmflut/3423026/sturmflut-organisation/ (accessed on 15 September 2019).
  59. German Statutory Accident Insurance (DGUV). Sicheres und Gesundes Arbeiten auf Werften. 2019. Available online: www.dguv.de/de/mediencenter/pm/presse-archiv/2019/quartal_1/details_1_355174.js (accessed on 10 November 2020).
  60. Abendblatt. Harburg und Die Schiffe 100 Jahre Werftgeschichte. 2019. Available online: www.abendblatt.de/regionalausgaben/article227148419/Harburg-und-die-Schiffe-100-Jahre-Werftgeschichte.htm (accessed on 12 October 2020).
  61. Walsham, G. Actor-Network Theory and IS Research: Current Status and Future Prospects. In Information Systems and Qualitative Research; Springer: Berlin/Heidelberg, Germany, 1997; pp. 466–480. [Google Scholar]
  62. Goswami, M.; Daultani, Y.; De, A. Decision modeling and analysis in new product development considering supply chain uncertainties: A multi-functional expert based approach. Expert Syst. Appl. 2021, 166, 114016. [Google Scholar] [CrossRef]
  63. Choudhary, A.; De, A.; Ahmed, K.; Shankar, R. An integrated fuzzy intuitionistic sustainability assessment framework for manufacturing supply chain: A study of UK based firms. Ann. Oper. Res. 2021. [Google Scholar] [CrossRef]
Figure 1. Approach of the research work.
Sustainability 13 08035 g001
Figure 2. Responses in the online survey based on stakeholder categories.
Sustainability 13 08035 g002
Figure 3. Stakeholder network analysis (natural disasters).
Sustainability 13 08035 g003
Figure 4. Stakeholder network analysis (operational and safety risks).
Sustainability 13 08035 g004
Figure 5. Community groups (natural disasters).
Sustainability 13 08035 g005
Figure 6. Community groups (operational and safety risks).
Sustainability 13 08035 g006
Figure 7. Involved stakeholders in the case of storm surge [58].
Sustainability 13 08035 g007
Figure 8. Heat map based on the communication intensity value of the interviews.
Sustainability 13 08035 g008
Table 1. Related work.
Papers/ScopeRisk ManagementSeaportStakeholder AnalysisCommunity Detection
Pileggi et al., 2020 [4] Sustainability 13 08035 i001 Sustainability 13 08035 i001 Sustainability 13 08035 i002 Sustainability 13 08035 i003
Wagner, 2017 [11] Sustainability 13 08035 i003 Sustainability 13 08035 i003 Sustainability 13 08035 i002 Sustainability 13 08035 i003
Aaerts et al., 2015 [36] Sustainability 13 08035 i003 Sustainability 13 08035 i001 Sustainability 13 08035 i001 Sustainability 13 08035 i003
Becker et al., 2015 [37] Sustainability 13 08035 i002 Sustainability 13 08035 i001 Sustainability 13 08035 i001 Sustainability 13 08035 i003
Da Cruz et al., 2013 [38] Sustainability 13 08035 i003 Sustainability 13 08035 i003 Sustainability 13 08035 i003 Sustainability 13 08035 i003
Notteboom and Winkelmans, 2007 [13] Sustainability 13 08035 i003 Sustainability 13 08035 i001 Sustainability 13 08035 i001 Sustainability 13 08035 i003
Dooms et al., 2004 [39] Sustainability 13 08035 i003 Sustainability 13 08035 i001 Sustainability 13 08035 i001 Sustainability 13 08035 i003
This work Sustainability 13 08035 i001 Sustainability 13 08035 i001 Sustainability 13 08035 i001 Sustainability 13 08035 i001
Sustainability 13 08035 i001: fully fulfilled— Sustainability 13 08035 i002: partially fulfilled— Sustainability 13 08035 i003: not fulfilled.
Table 2. Sample of addressed stakeholder groups with ordinal scale.
Stakeholder CategoryN/ANever
(0)
Rarely
(1)
Sometimes
(2)
Very Often
(3)
Always
(4)
Port authority
Authority for Environment and Energy
Civil protection organization
Fire brigade and rescue services
Table 3. Sample for calculating the communication intensity values.
Source NodeTarget NodeIntensity Value (1)Intensity Value (2)
Authority for Environment and EnergyPort authority 33
Authority for Environment and EnergyCivil protection organization33
Authority for Environment and EnergyFire brigade and rescue services44
Authority for Environment and EnergyWaterways police44
Table 4. Targets node in the online survey.
#Target Node#Target Node
1Port authority11Train company
2Authority for Environment and Energy12Customs
3Civil protection organization13Nautical headquarter
4Fire brigade and rescue services14Insurance company
5Waterways police15Charterer
6Coast guard16Stevedoring company
7Terminal operator17Shipyard
8Shipping company18Bunkering company
9Towage company19Hauler company
10Freight forwarder
Table 5. Sample of the communication intensity values.
SourceTargetTypeWeight
Authority for
Environment and Energy
Civil protection
organization
Undirected3
Authority for
Environment and Energy
Waterways policeUndirected4
Authority for
Environment and Energy
Coast guardUndirected0,5
Authority for
Environment and Energy
Terminal operatorUndirected3,5
Authority for
Environment and Energy
Shipping companyUndirected2,5
Table 6. Network parameters’ values for each risk category.
Network ParameterRisk CategoryValue
Average degreeNatural disasters11
Operational and safety risks15.7
Network diameterNatural disasters3
Operational and safety risks2
Graph densityNatural disasters73.3%
Operational and safety risks87.1%
Table 7. Members of each community extracted for natural disasters.
Community 1Community 2
Authority for environmentCivil protection organization
CustomsCoast guard
Fire brigade and rescue servicesInsurance company
Freight forwarderNautical headquarter
Terminal operatorPort authority
Train companyShipyard
Shipping companyStevedoring company
Waterways policeTowage company
Table 8. Members of each community extracted for operational and safety risks.
Community 1Community 2
Coast guardAuthority for environment and energy
Freight forwarderBunkering company
Haulier companyCharterer
Insurance companyCivil protection organization
Shipping companyCustoms
ShipyardFire brigade and rescue services
Stevedoring companyNautical headquarter
Terminal operatorPort authority
Train companyTowage company
Waterways police
Table 9. Coding categories of the stakeholder groups in the heat map.
#Stakeholder Group#Stakeholder Group
aTerminal operatorjFreight forwarder
bShipping companykPolice
cStevedore companylCustoms
dPort authoritymHaulier company
eNautical headquarternTrain company
fAuthority for environment and energyoAirport
gFire brigades and rescue servicespInsurance company
hWaterways policeqCivil protection organization
iTowage company
Publisher’s Note: MDPI stays neutral with regard to jurisdictional claims in published maps and institutional affiliations.

