2. Materials and Methods
To achieve the goal of the present case study, i.e., to design and test the optimal solution of bottlenecks in the logistics flow, it was necessary to select appropriate methods and approaches, which are described below.
Effective use of a suitable push and pull concept depends on the correct setting of the disconnection point of the logistics chain. This placement depends on the customer’s requirements and the company’s ability to meet specific customer requirements. Often, push and pull concepts are characterized by the so-called “Production to stock” and “production to order”, etc. In general, the push concept can be characterized as “production to stock”, the volume and content of which is given by the prediction of demand, and the pull concept can be defined as “production to order”, which exactly copies the customer’s requirements. When differentiating these concepts, a deeper look at push and pull is needed (some companies produce products in stock using the pull concept without specific orders from the customer, such as Toyota). Also, the use of a pull system in response to a specific order does not have to mean lean production if it is not synchronized with supply. The main difference between the push and pull concept is the way the information is transmitted. Push is controlled by a central plan (MRP), pull is controlled by a customer (Kanban). These characteristics of the push and pull concepts can be considered partially correct, as it is possible to implement a pull using the MRP system [
16,
17,
18].
According to Hopp, W. J. and Spearman, M. L. (2004) [
1], these definitions are misleading as they do not express the true nature of the traction system. In their study, they define a pull production system as one that is limited by the amount of WIP (Work-In-Process/Intermediate Stocks) that the system is able to process and a push production system as one that is not explicitly limited by the amount of WIP in the system. The physical pressure or pull of the material and information has nothing to do with the definition of push and pull. An example is the Kanban system with a fixed number of cards, which determines the amount of material in production, particularly in a warehouse that cannot be exceeded [
15,
16,
17].
Description of Kanban system according to Sugimori [
19]:
In the Kanban System, a form of order card called Kanban is used. These come in two kinds, one of which is called ‘conveyance Kanban’ that is carried when going from one process to the preceding process, while the other is called ‘production Kanban’ and is used to order production of the portion withdrawn by the subsequent process. These two kinds of Kanban are always attached to the containers holding parts.
When the content of a container begins to be used, conveyance Kanban is removed from the container. A worker takes this conveyance Kanban and goes to the stock point of the preceding process to pick up this part. He then attaches this conveyance Kanban to the container holding this part.
Then, the production Kanban attached to the container is removed and becomes a dispatching information for the process. They produce the part to replenish the one withdrawn as early as possible.
Thus, the production activities of the final assembly line are connected in a manner like a chain to the preceding processes or to the subcontractors and materialize the just-in-time production of the entire processes.
What Toyota considers as a goal through the Kanban System related above is total conveyor line production system connecting all the external and internal processes with invisible conveyor lines.
Kanban is a visual control system whose task is to ensure that employees are informed about the state and movement of stocks at a given moment, and to streamline the use of human potential in stock management directly in production. If the individual supply tasks within the supply sequence are defined in time, it is possible to determine the time slips in production, at what stage of production the product is, what operations still follow, and what the estimated time until the end of production is. The essence of this system is to assign a task according to the workload of the worker/machine. In this context, it is necessary to identify and systematically eliminate (i.e., increase availability) critical points in the production process that limit the smooth flow of stocks through production. The main advantage of Kanban is transparency [
20,
21,
22,
23,
24,
25,
26,
27,
28]. Transparency of Kanban means the visibility of the flow to those responsible for the outcome. Kanban in combination with appropriately selected software creates an integrated system that maximizes visualization, allows assignation of tasks and to specific employees, minimizes manual administration, ensures greater speed and accuracy of data processing, and improves key business indicators.
Traditionally there are two types of Kanban [
29]:
When starting to work with Kanban numbers, one should always aim to decrease them. This can be done by working on the following three aspects:
reducing production lots;
reducing lead time;
reducing the safety margin stock buffer.
The Rules of Pull Production with Kanban [
30]:
Rule 1: Downstream processes withdraw items from upstream processes.
Rule 2: Upstream processes produce only what has been withdrawn.
Rule 3: All processes send only 100% defect-free products to the next process; no process accepts defects into their operations.
Rule 4: Level production is established to ensure market-in standards.
Rule 5: Kanbans always accompany the parts themselves for visual control.
Rule 6: The number of Kanbans is decreased over time to reveal hidden areas for improvement.
Another approach that is applied in the article to achieve the goal is modeling and simulation in selected software. Modelling and simulation in the environment Tx Plant Simulation is built on object-oriented modelling, i.e., hierarchically structured system models. This allows for the real system to be decomposed into separate functional units, particularly subsystems. It the best way to describe an analyzed system precisely [
30,
31].
3. Case Study—Analysis of the Current State
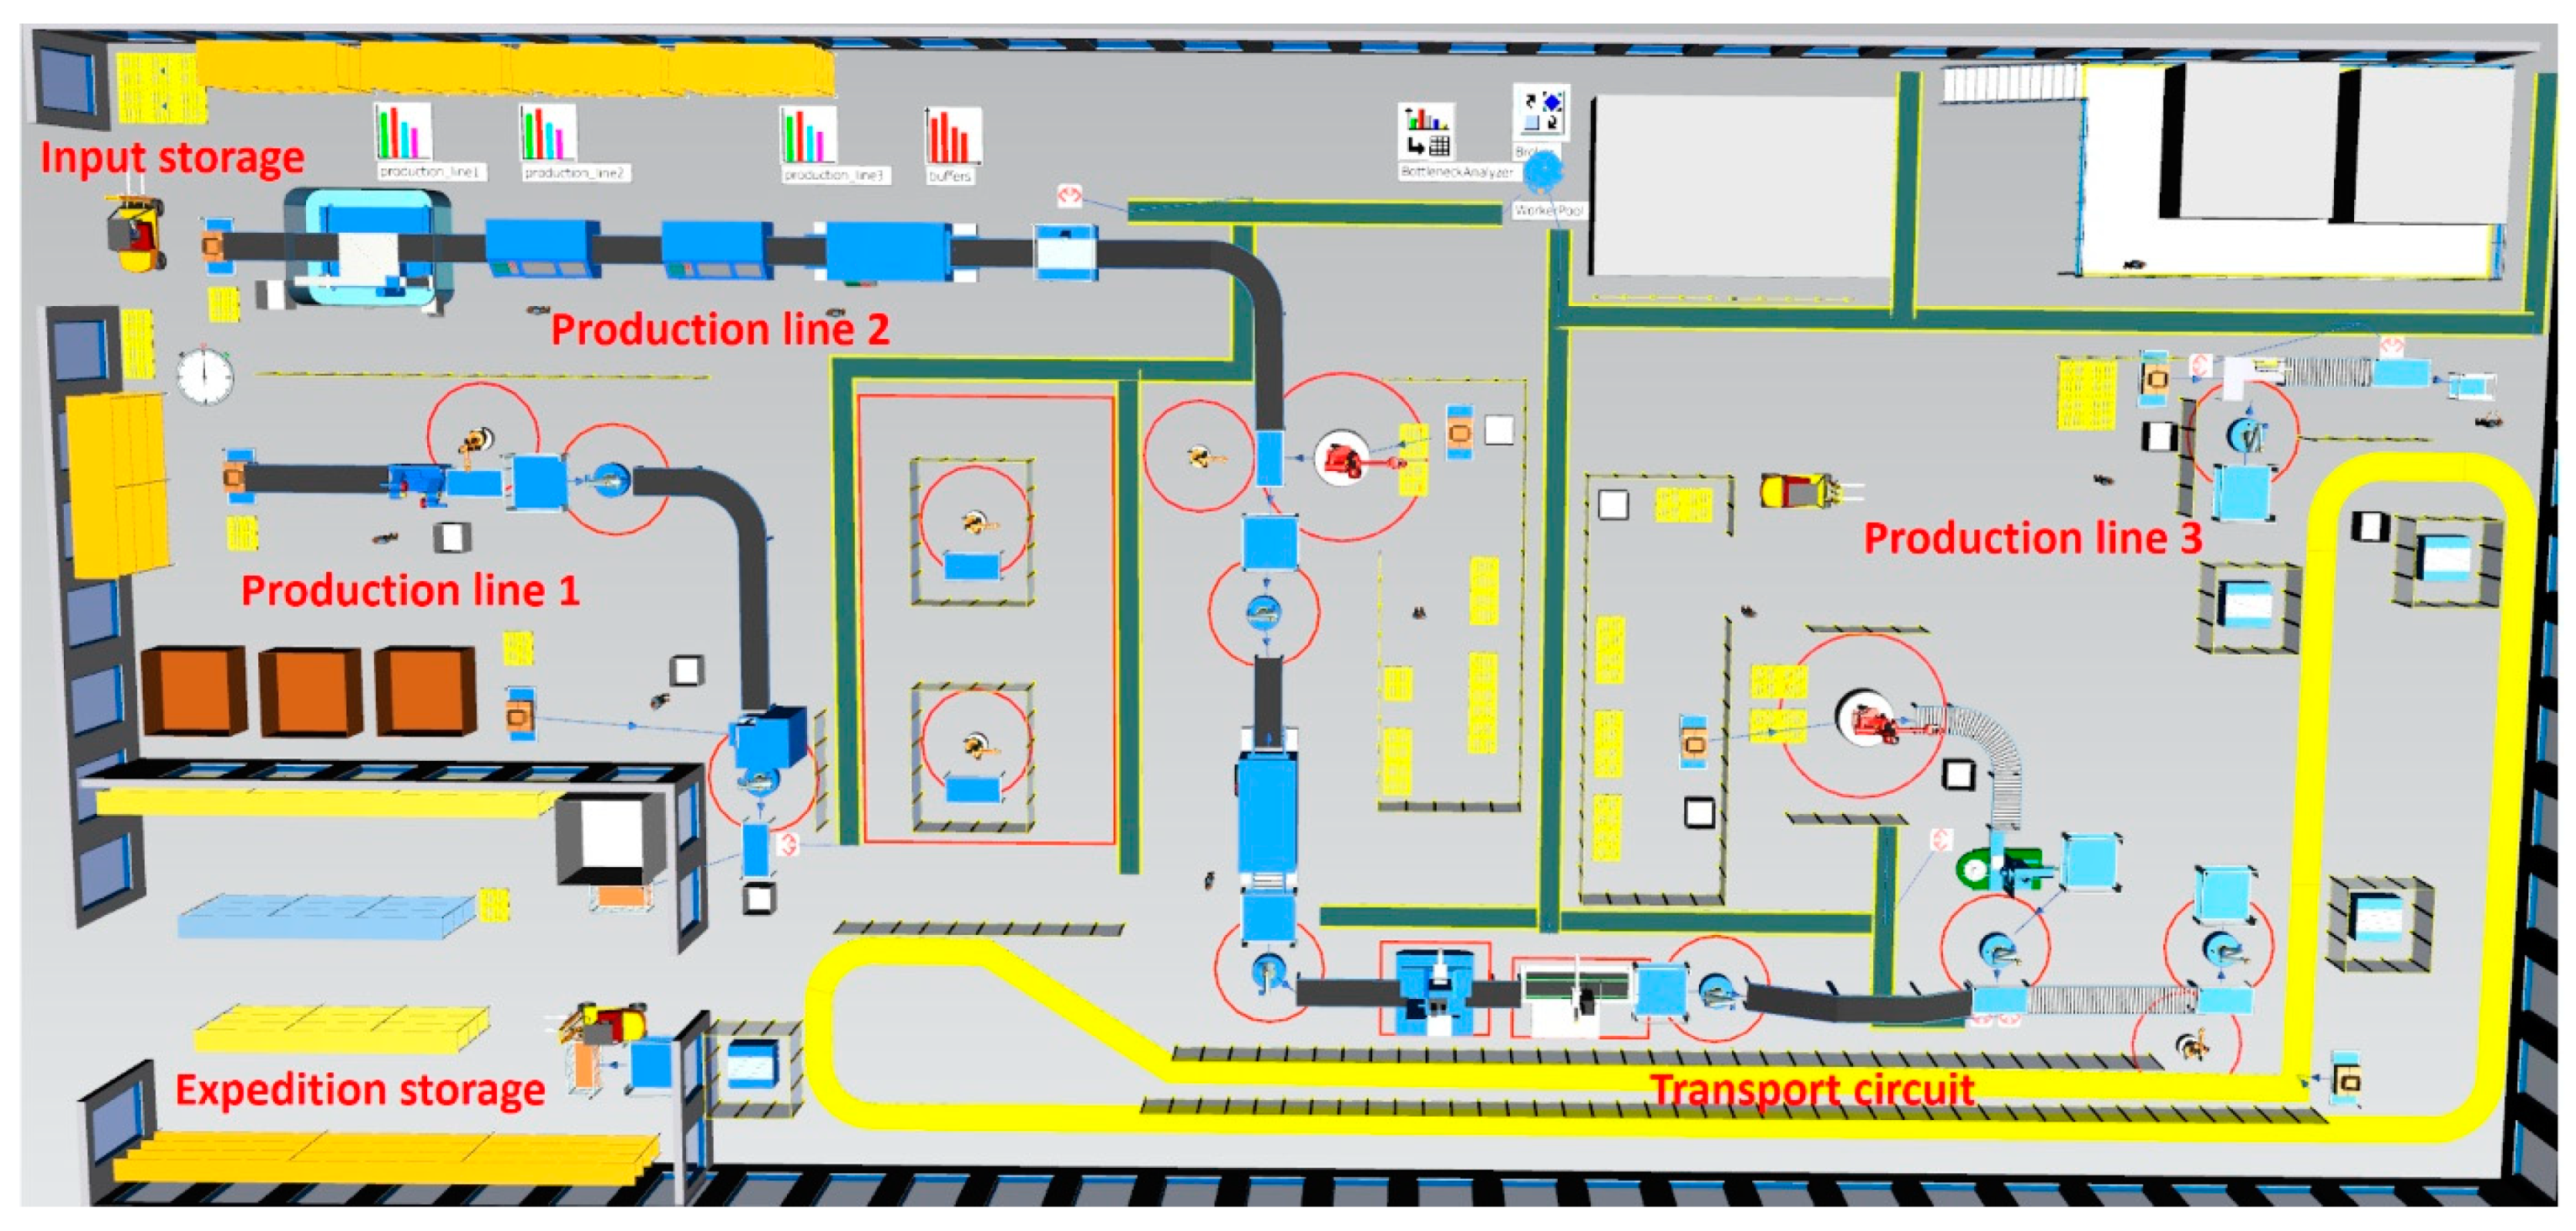
The solved case study deals with a manufacturing company oriented to the production, assembly and distribution of solar panels and heat exchangers. The task was to create a simulation model of the business process and subsequent analysis of processes using various functions of the simulation software TX Plant Simulation. The simulation model created for the needs of the case study was processed on the basis of information provided from the surveyed company and also from the implementation of Gemba walk in operation. Subsequently, the simulation model was set up and simulated production for one work shift (8 h). The outputs corresponded to the actual production. Using the tools of the Tx Plant Simulation software, it was possible to define waste in the entire value chain, which subsequently made it possible to implement and test suggestions for improvement in virtual space.
The simulation model of the company includes operational and assembly workplaces, storage facilities for inter-operational supplies and a receipt and dispatch warehouse. The production workplace is also equipped with modern CNC technology or handling and welding robots. Material transport is provided by operators on high lift trucks. The production system is equipped with fully automatic workplaces as well as control and assembly workplaces operated by operators. The production process consists of three separate production lines, shown in
Figure 1. Production line number 1 for the production of heat exchangers consists of four workplaces and the output to the dispatch warehouse is a finished and inspected heat exchanger. Production line number 2 leads through the entire production hall and at the exit the semi-finished products are transported from the intermediate warehouse to the folding line number 3, where subsequently they are taken from the line exit to the dispatch warehouse. The individual production lines are shown in
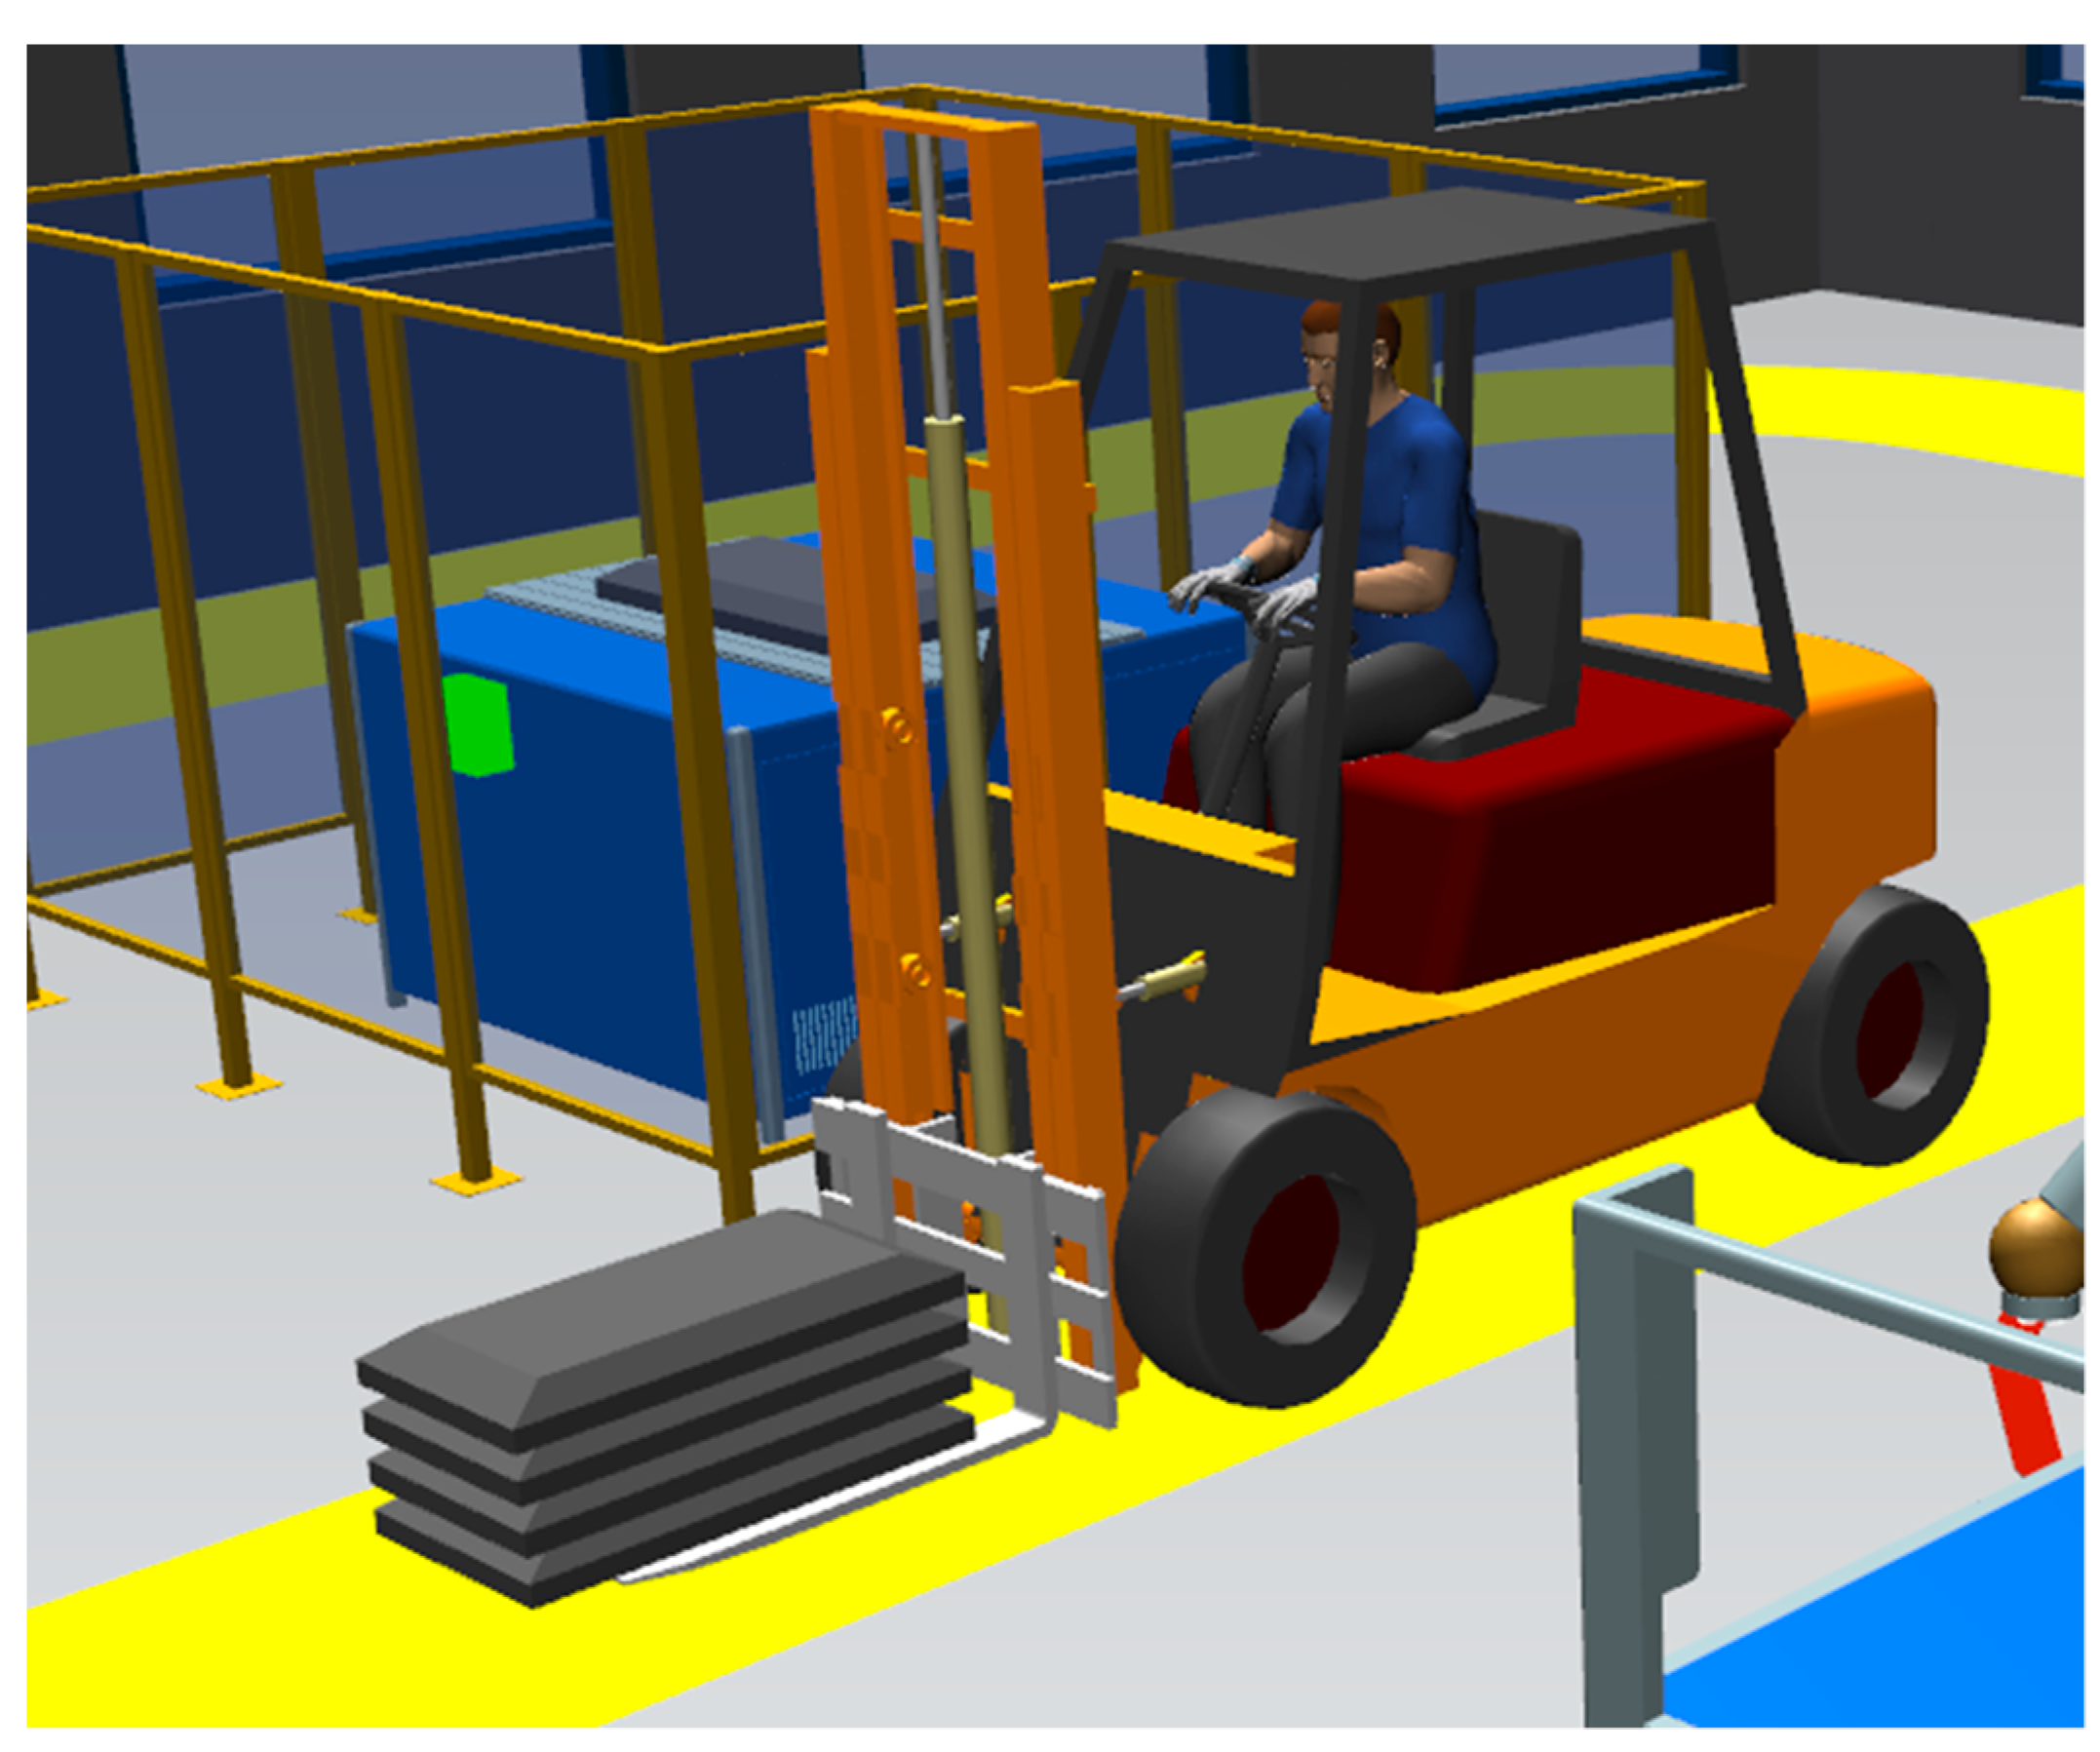
Figure 1. The production system is connected to the transport circuit, which serves for the transport of components between assembly lines number 2 and 3, and the subsequent transfer to the dispatch warehouse. It uses forklifts to transport and handle products and components.
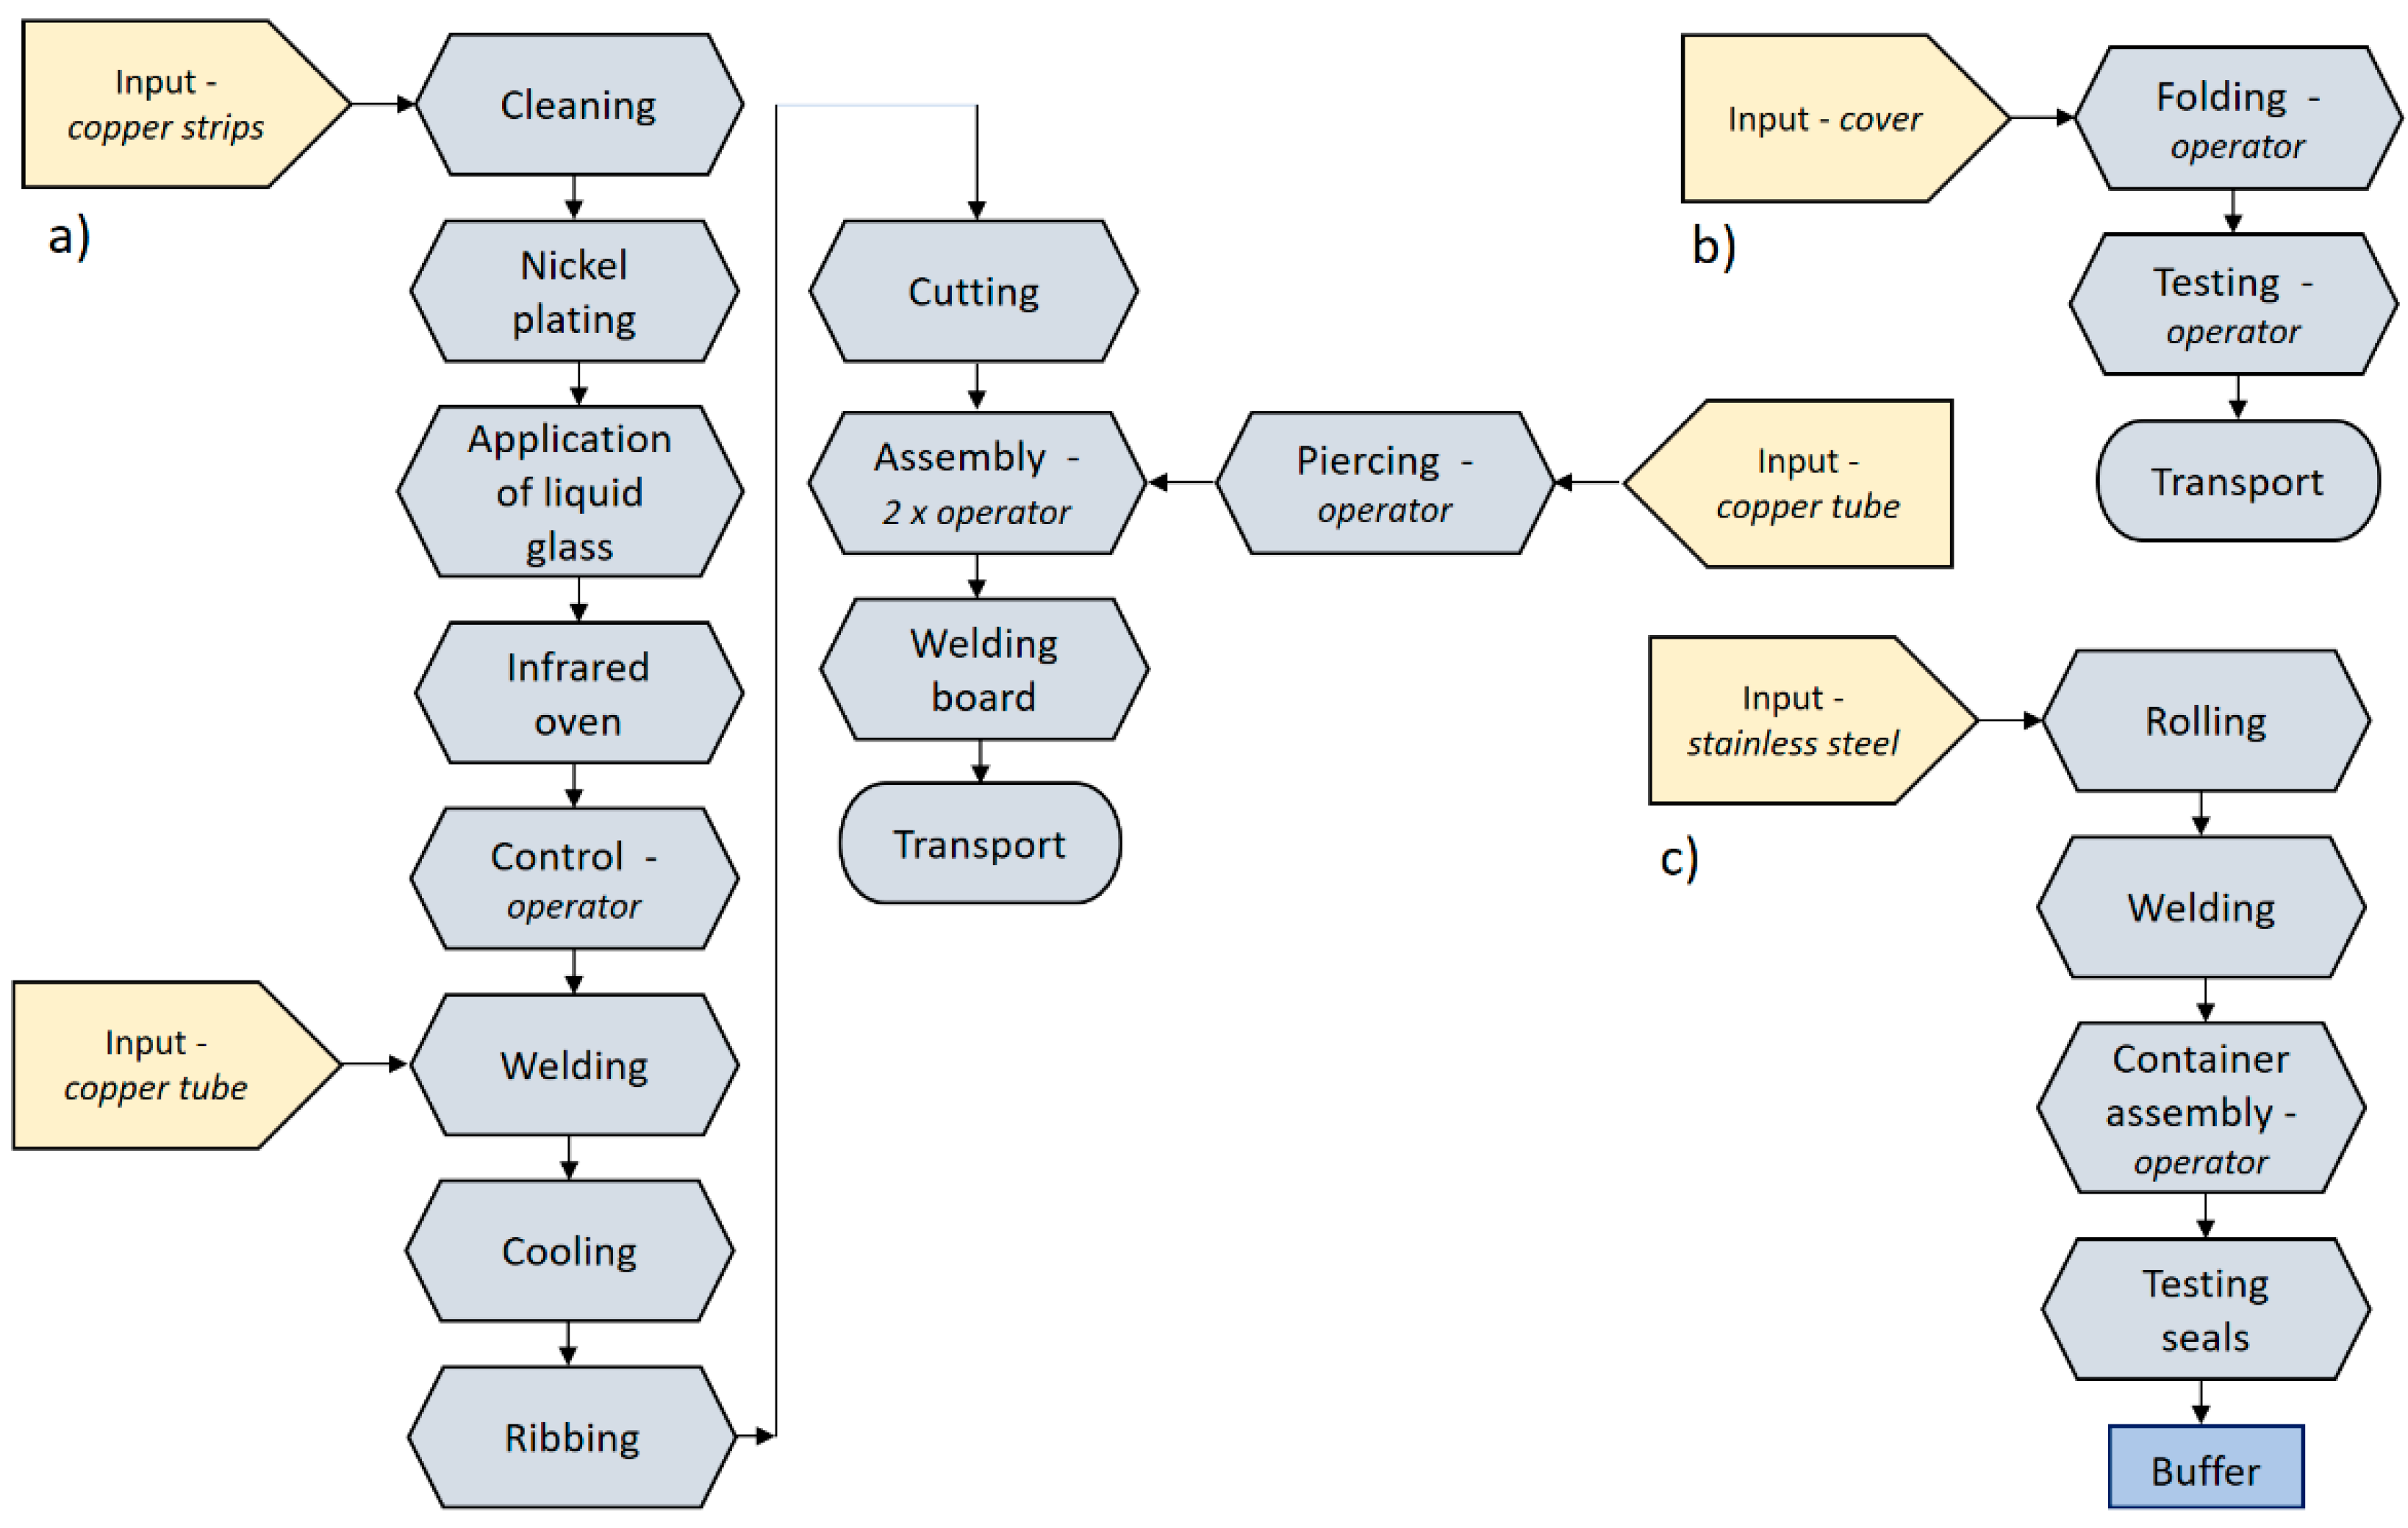
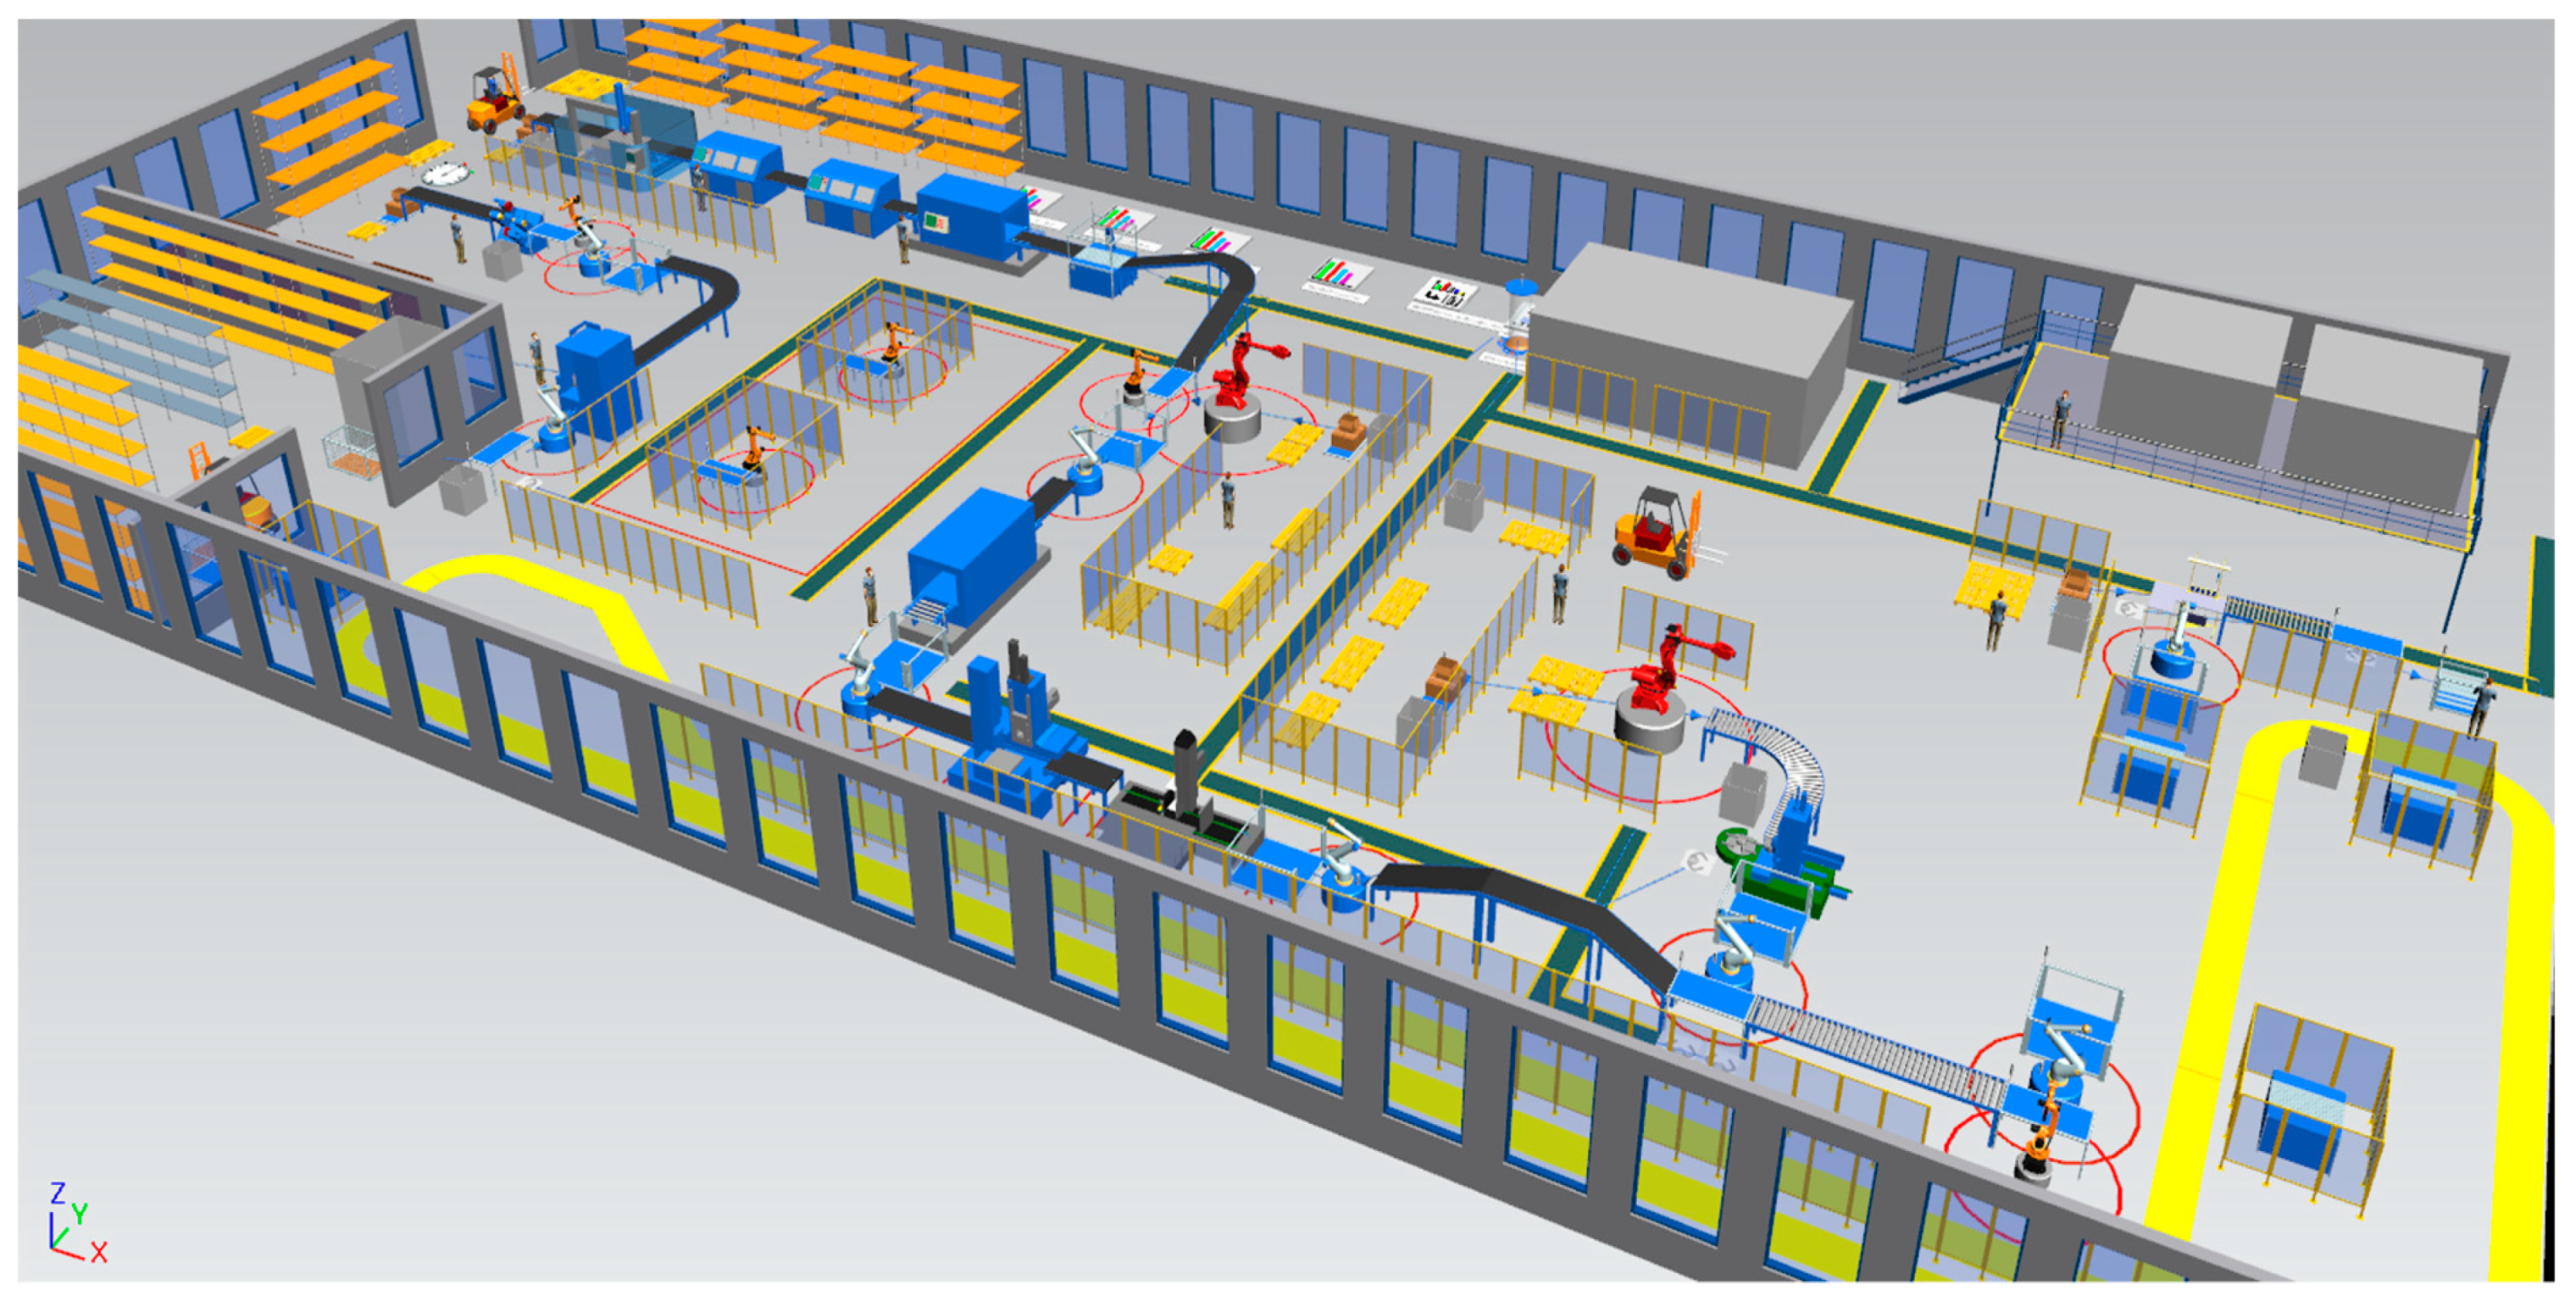
The production model consists of three production lines. Production line number 1 for the production of a heat exchanger consists of four workplaces. It starts with the entry of stainless steel into the rolling workplace, followed by the welding workplace and storage in the intermediate warehouse. It then proceeds with the conveyor for assembly and final testing of the seal. The finished and inspected heat exchanger is stored in a dispatch warehouse. Production line number 2 starts with the entry of copper strips into the cleaning workplace. This is followed by nickel plating, application of liquid glass and subsequent curing in an infrared oven. After removal from the furnace, the quality of the surface is checked and then the semi-finished product is moved for welding by a conveyor and stored in an intermediate storage and travels for cooling. It is then moved to the conveyors through ribbing and shearing operations and stored in an intermediate warehouse. At the assembly workplace, parts from the intermediate warehouses of the punching and cutting machine are connected. Subsequently, the parts are welded at the automated workplace and stored in the intermediate storage of transport to the finishing production line number 3. The transfer is performed by operators on forklift trucks. Line number 3 consists of a workplace for folding and final testing by operators. Subsequently, it is also transported from the intermediate warehouse to the dispatch warehouse by forklift trucks. Layout of a manufacturing plant created in 2D and 3D in the simulation software TX Plant Simulation is shown in
Figure 2 and
Figure 3.
The individual material inputs to the production process include stainless steel and the exchanger, which represent the input material for line number 1 for the production and installation of the heat exchanger. The inputs of the production line number 2 for the production of the solar panel include copper strips which enter at the beginning of the line and a copper tube which enters at the welding workplace and also into the piercing machine. In the final part of the production, a cover for individual panels is used as an input at the folding workplace. Individual operation times, availability and inputs are shown in
Table 1.
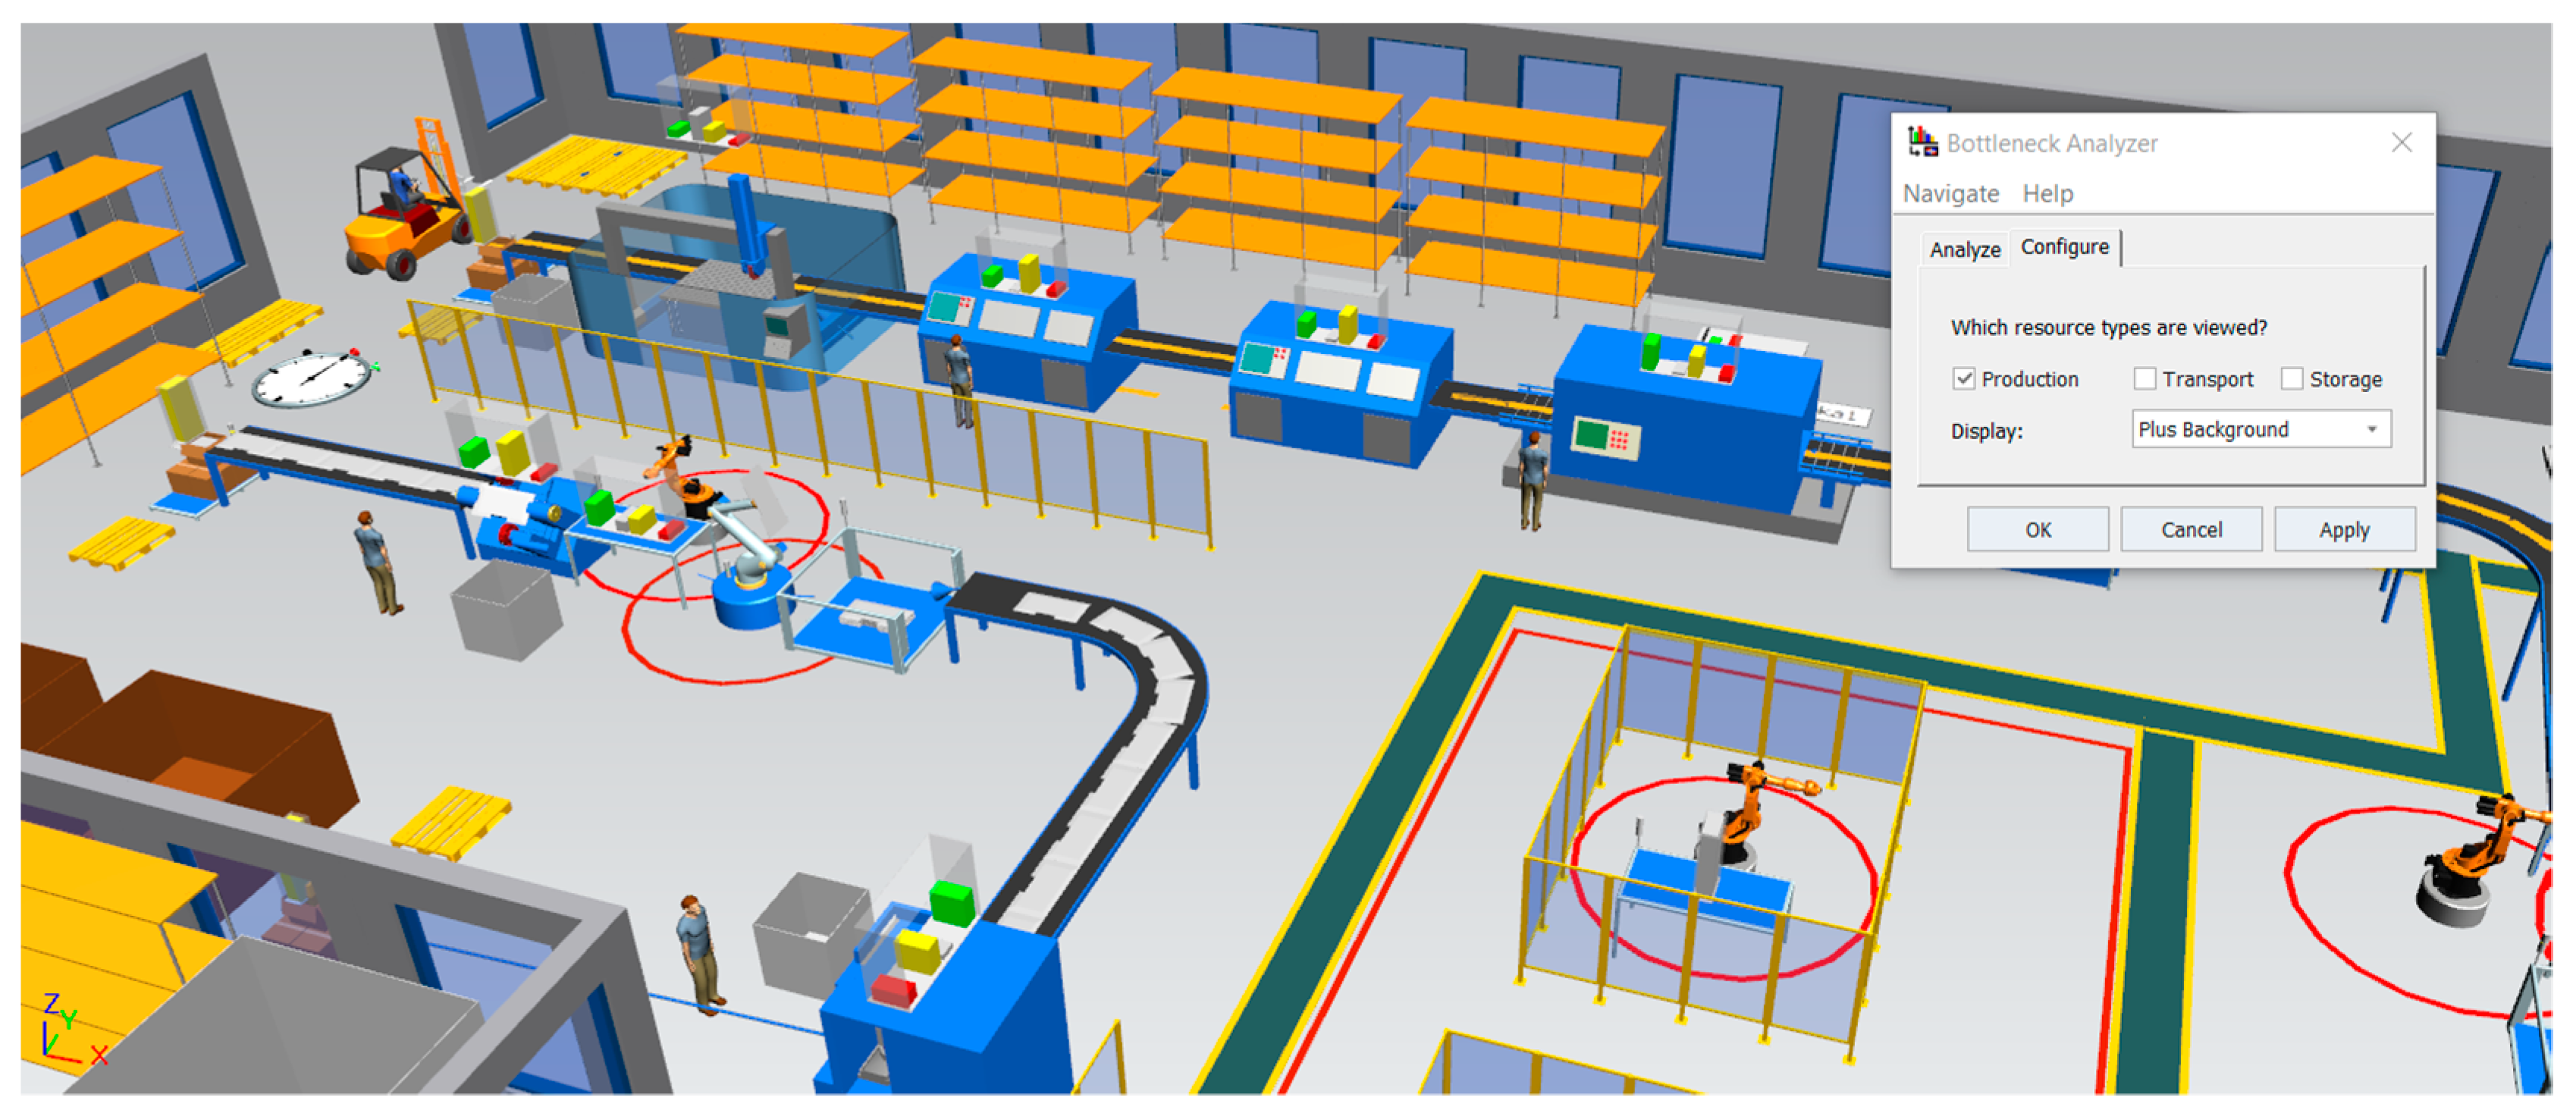
When analysing the material flow in the simulation model of the production process, it is effective to use the Bottleneck analyser tool. Using this tool, basic statistics of the material flow of objects are visualized, along with transport, production and storage statistics. It is an effective tool for detecting bottlenecks in a simulation model, shown in
Figure 4.
The results of the analysis using the Bottleneck analyzer are shown in
Table 2 and
Table 3. The results of the analysis of individual inputs into production show problems with the flow of material flow. According to the results, the material is blocked at the entrance to the production process and there is no smooth material flow. Percentage display of production workplace statistics in
Table 3 shows that individual workplaces are unevenly loaded and production times are significantly low. Blocking and waiting times in the material flow are high and create a bottleneck.
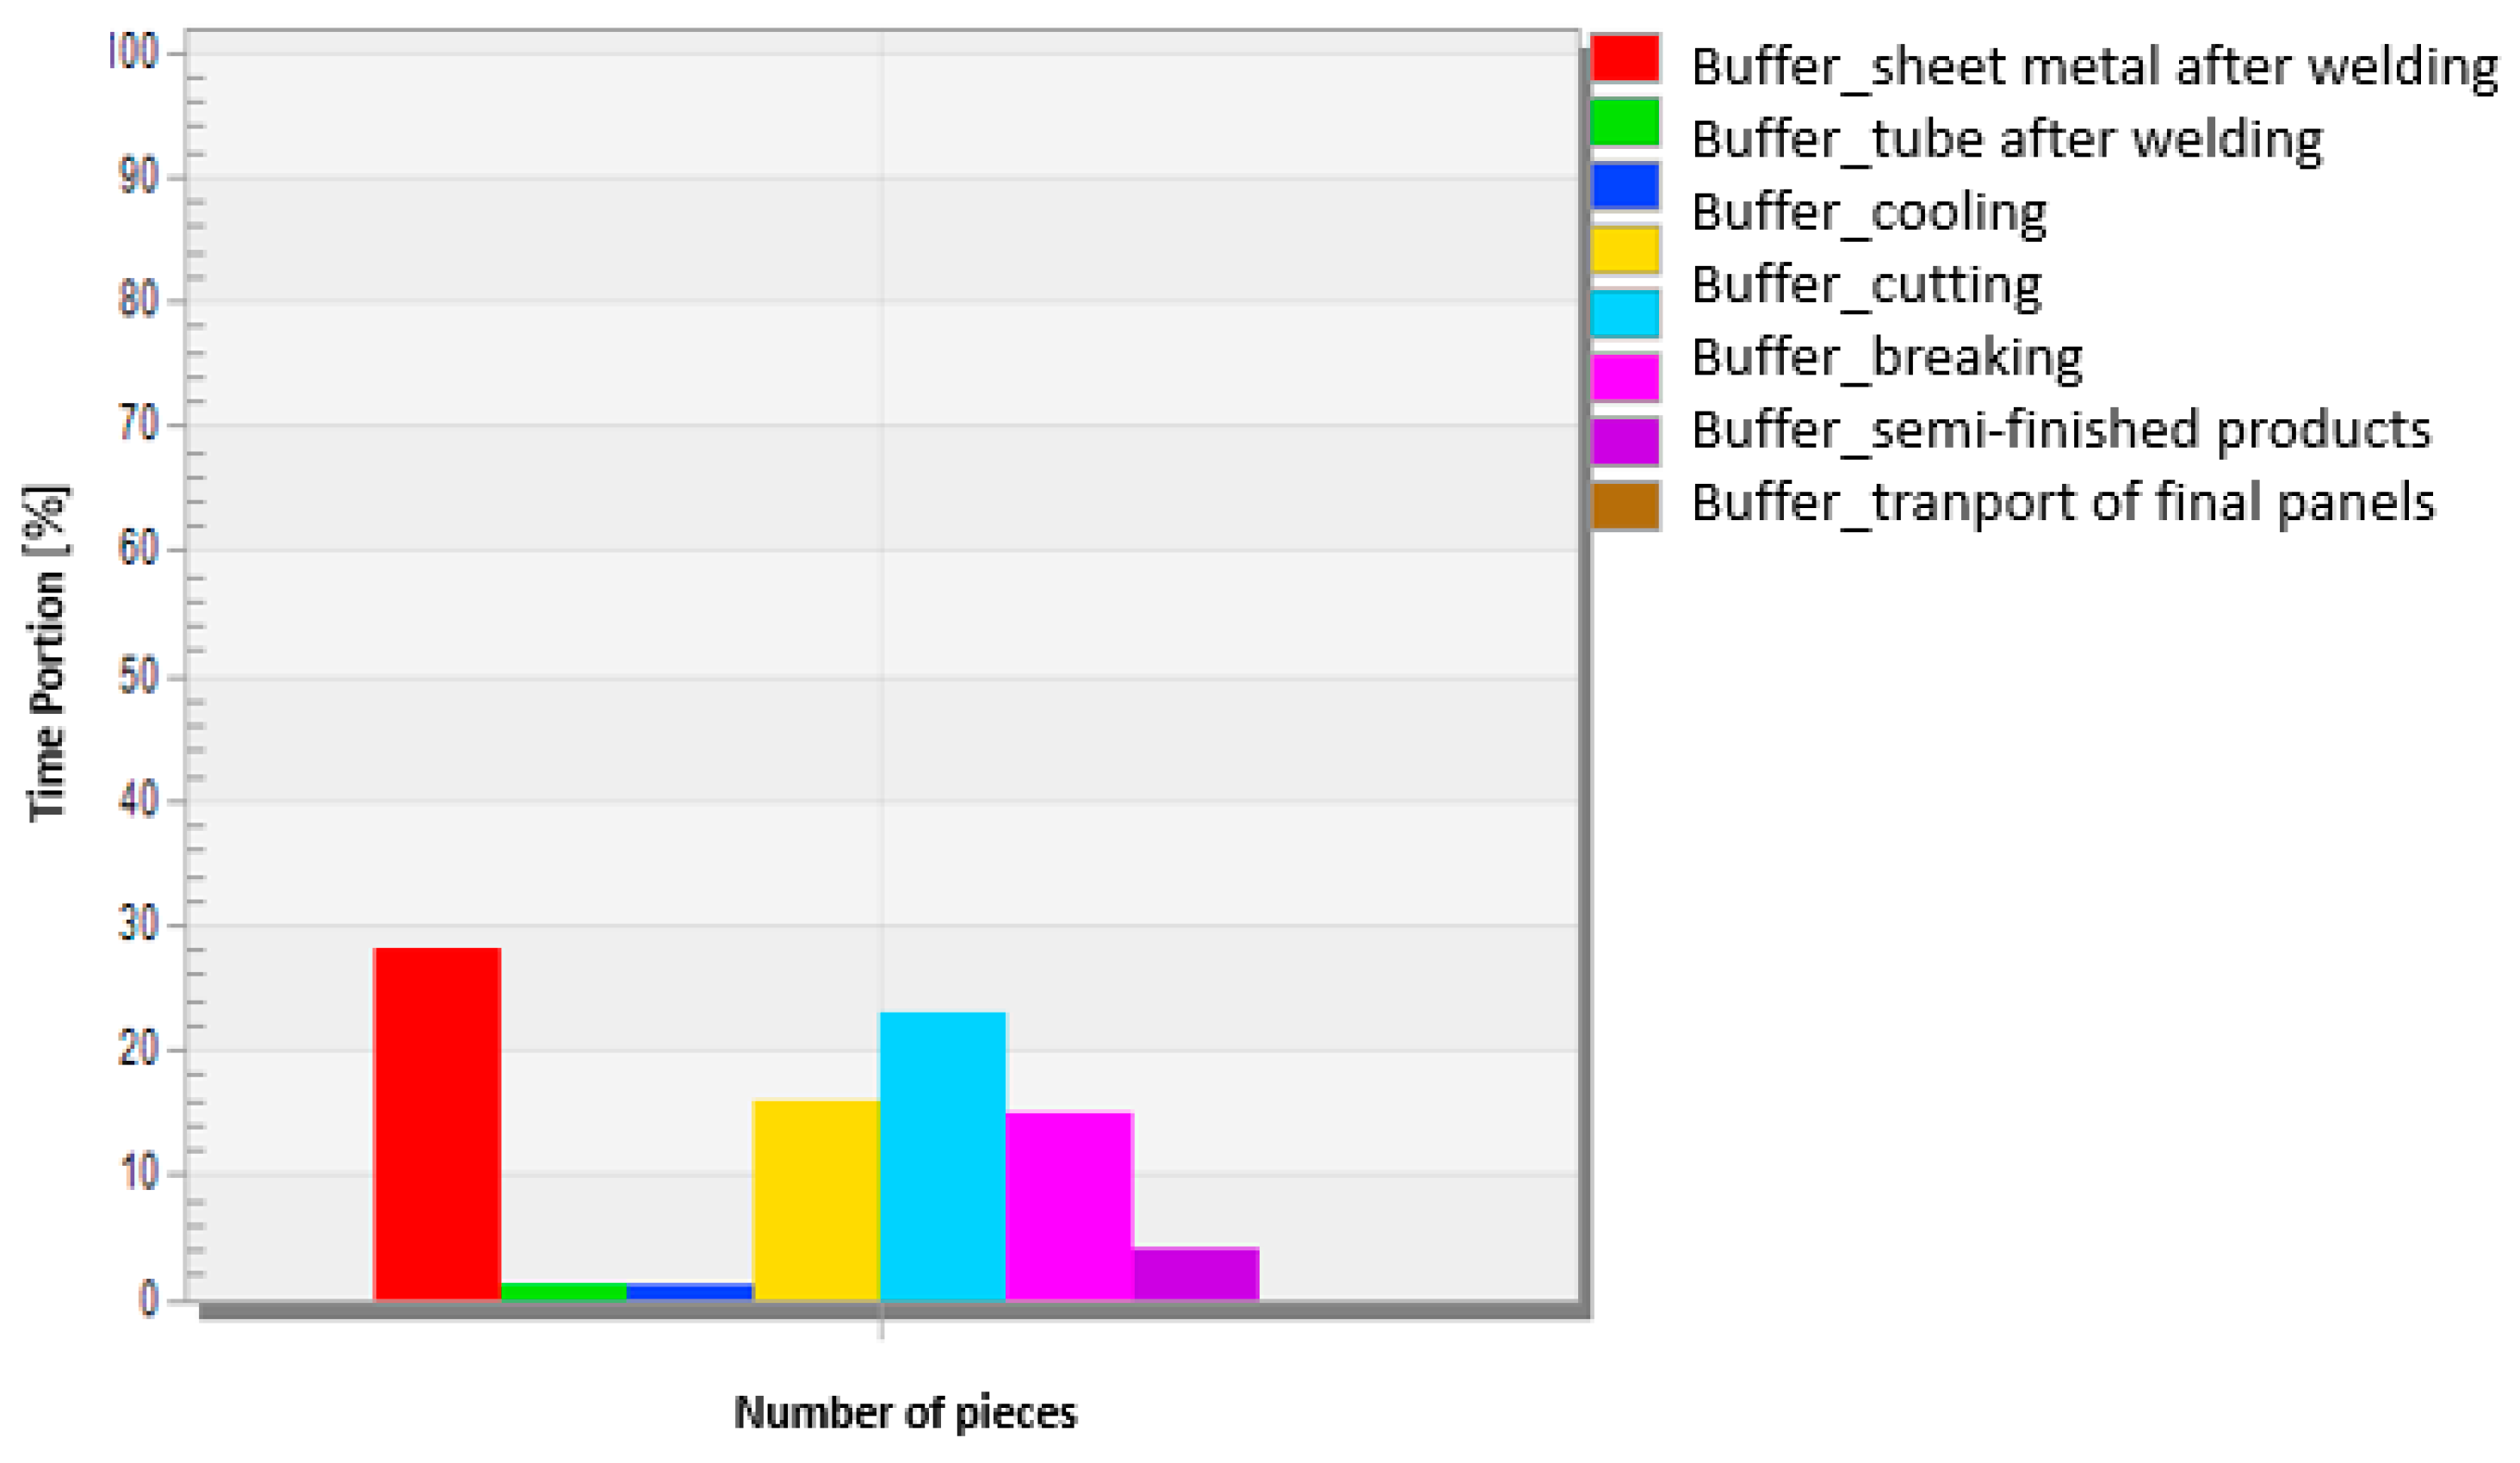
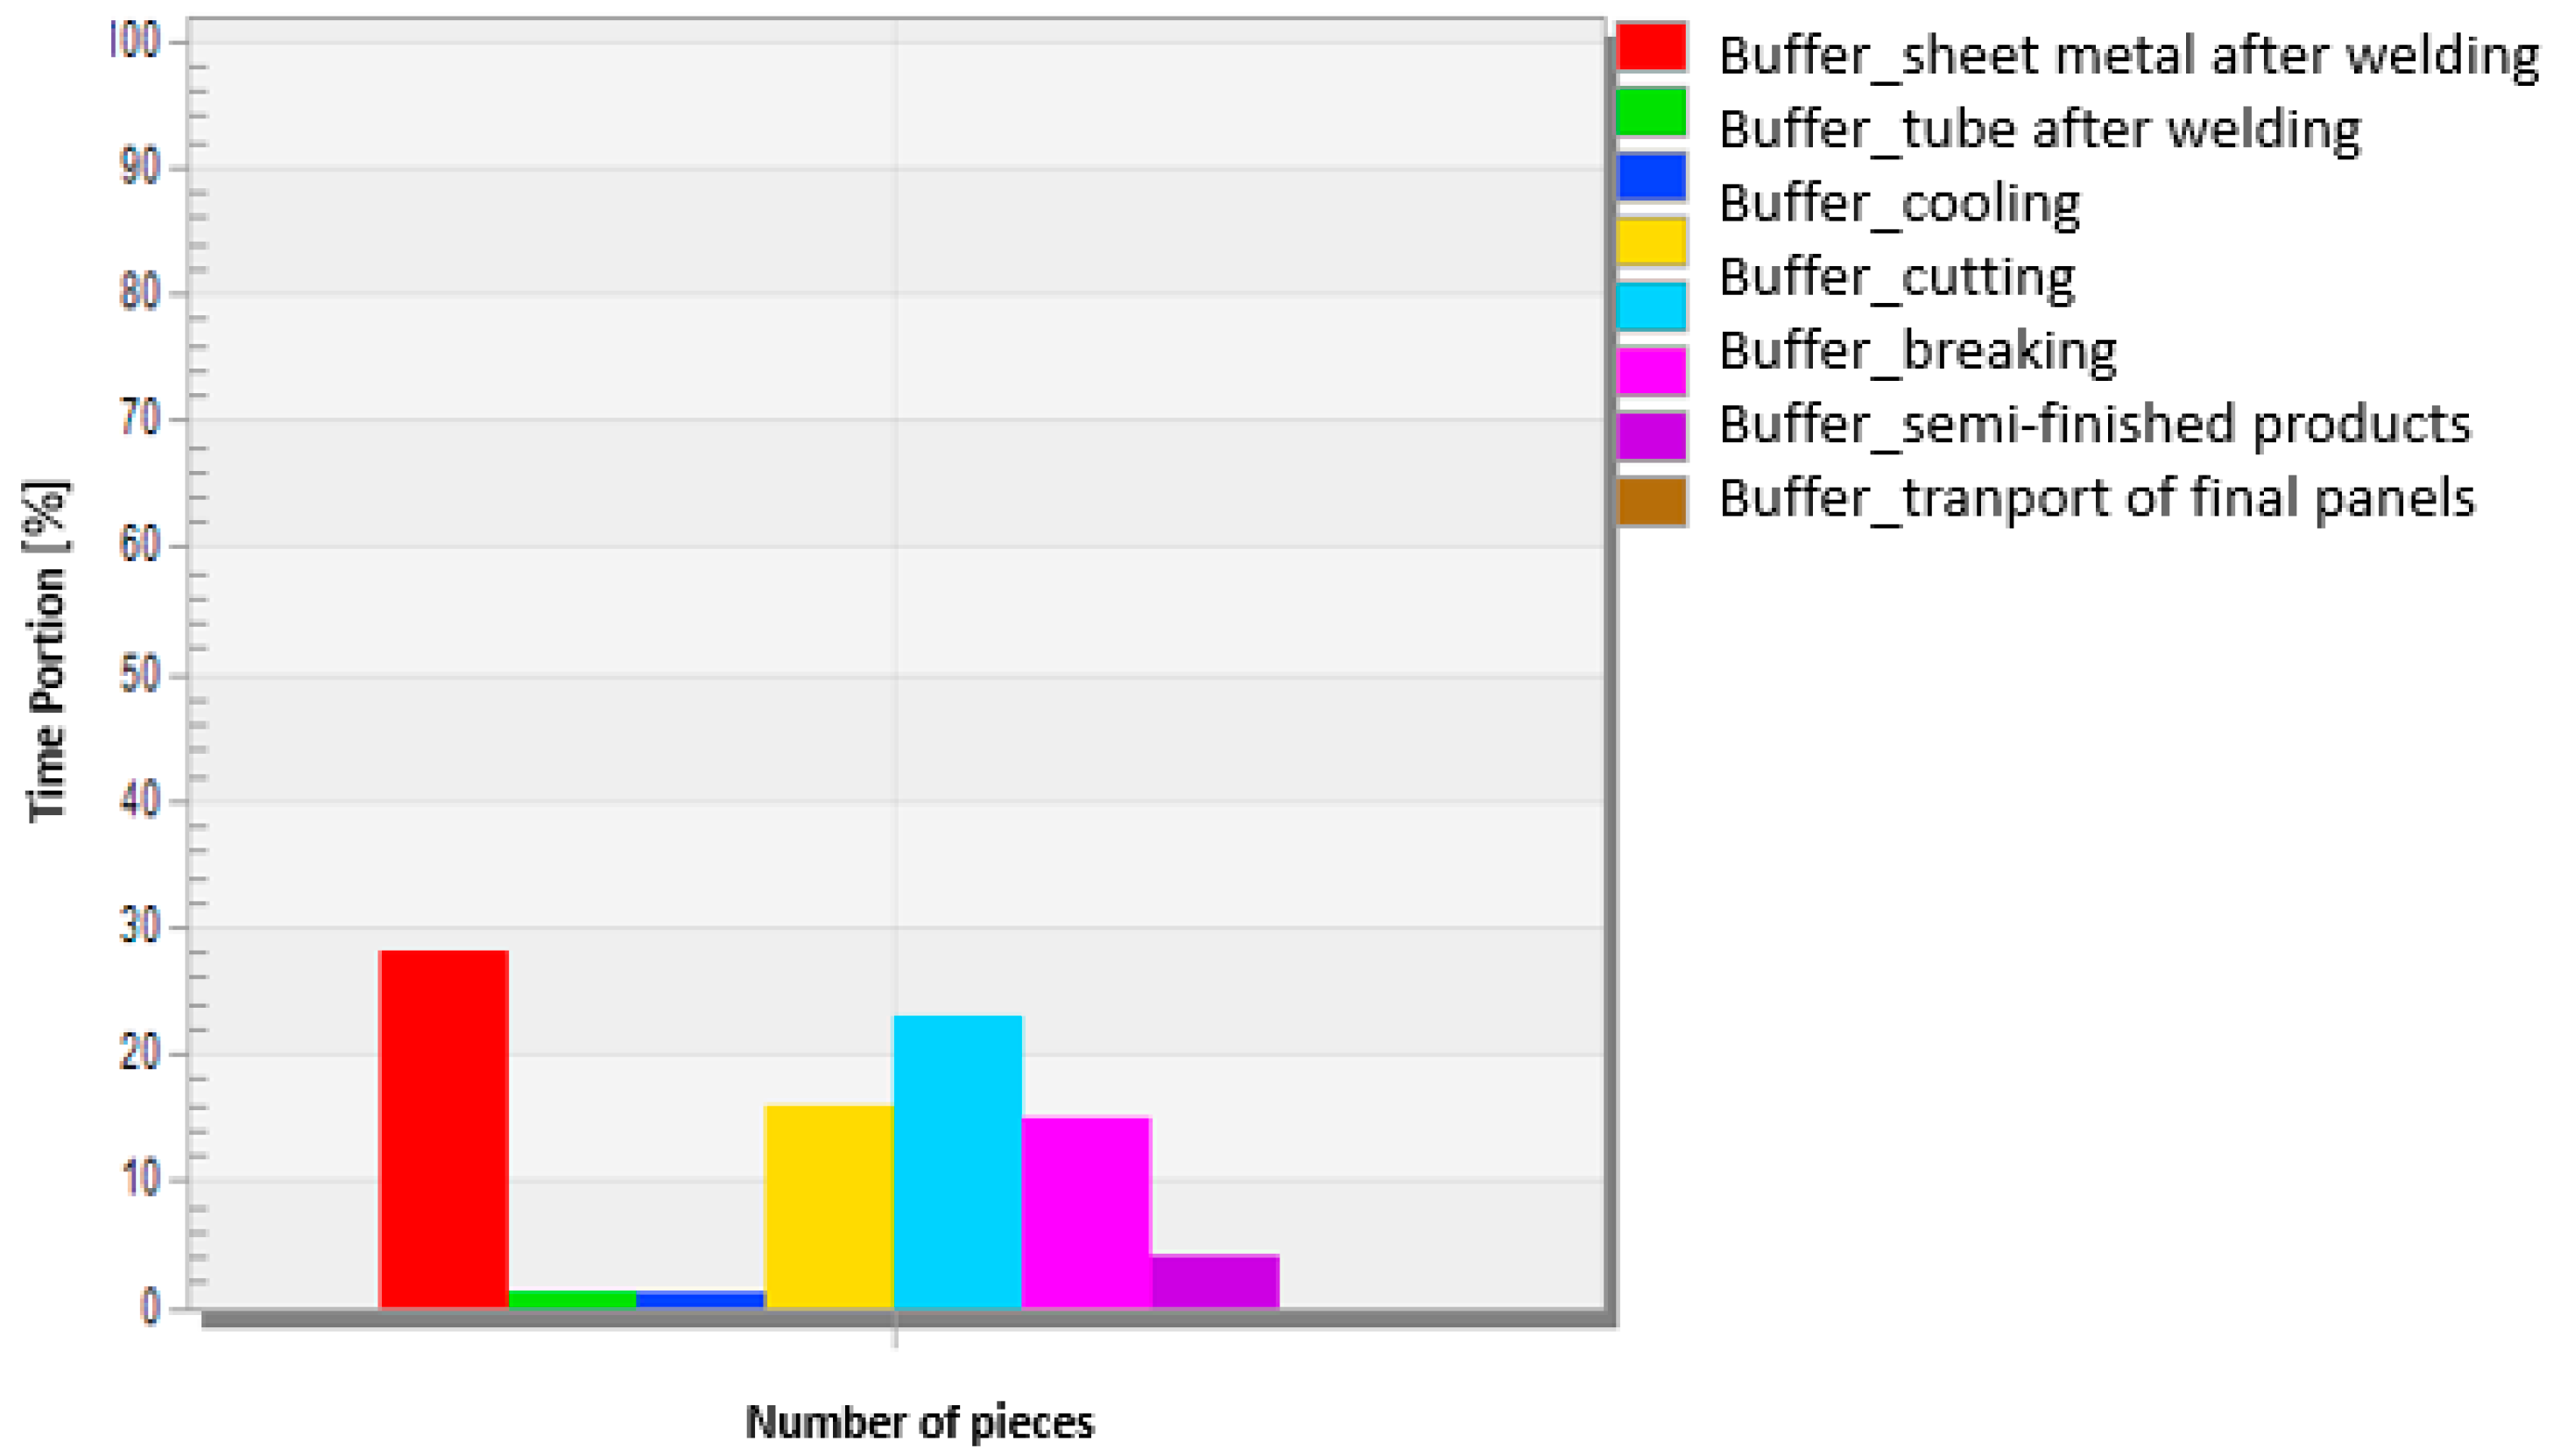
The display of the storage results in
Figure 5 points to the overfilling of inter-operational warehouses with a maximum capacity of 100 pieces, which is the result of overproduction and the pressure system of production. In principle, the transfer of material from the workplace to the next workplace does not take into account whether the next workplace is ready to manage the next batch of material.
The results of the analysis of individual simulation processes using the Bottleneck analyzer tool shown in
Table 4 show that line number 3 with final assembly and testing sites has more than 61% waiting times during the overall production process. The reason is the insufficient frequency of the transport circuit, when the folding workplace does not receive stocks of semi-finished products for further processing.
In practice, average traffic distance is a common metric for assessing the cost of creating traffic routes. The cost of the work depends mainly on the time of transport, which is affected not only by the distance, but also by the arrangement of roads and means used. In DES, it is possible to model these effects on transport time using kinematic simulation.
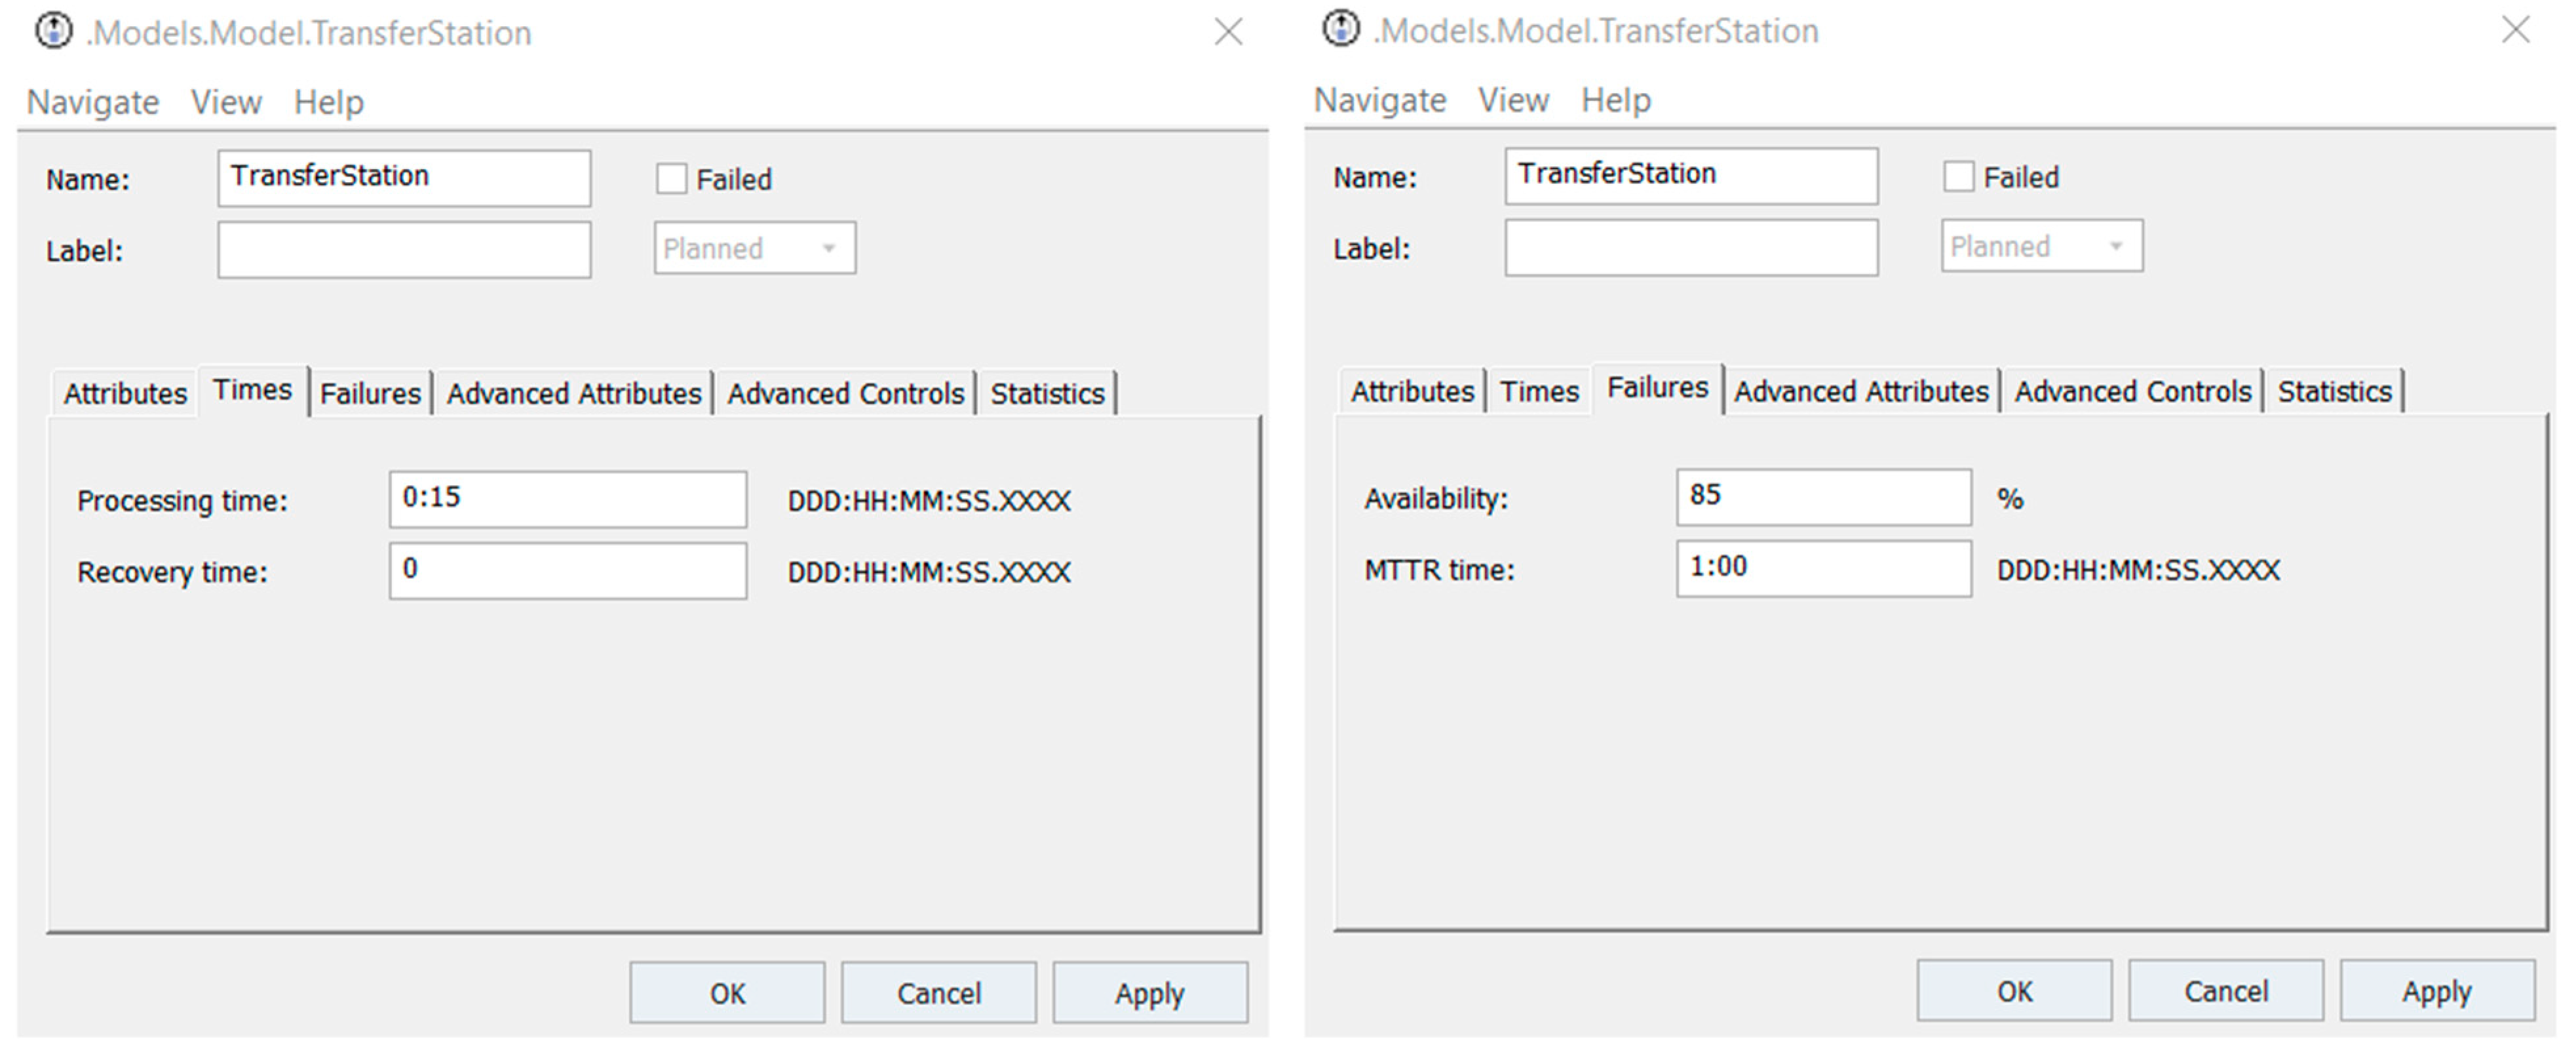
In the simulation model, it was necessary to set the individual parameters of the transporters, shown in
Figure 6, and individual transport stations when creating the transport circuit. In
Figure 7 the capacities and basic parameters of transporters can be seen in the simulation model. The settings of the individual stations can be seen in
Figure 8, where the basic parameters such as loading and unloading time, availability and possible maintenance time are shown.
From the results of the analysis and evaluation of the simulation model, it is clear that the identified bottlenecks such as transport, overproduction and high inter-operational stocks need to be addressed by replacing the pressure production system, and focusing on the traction system and the quantity of products required by the customer. The company is considering changing and modernizing the transport circuit and replacing two forklifts to move products with AGV technology.
4. Proposal of Measures and Testing of Improvement on a Simulation Model
When creating a lean production system, it is also necessary to ensure a lean supply of input material to the production. The result is a flow of material through the company more smoothly and accurately where it is needed, while minimizing losses. In the implementation of such material supply, it is necessary to create a database of each product with basic information, create warehouses and set up their management, then create internal material transport and finally integration with the corporate information system, using traction signals.
To implement the traction system, it is necessary to:
Implement traction signals.
Determine how often to deliver the material.
Calculate the number of signals for each product.
First of all, it is important to specify the values of individual stocks in the warehouse from which the individual material is delivered. Subsequently, the calculation of the maximum quantity, the determination of the average daily consumption of the stored material, the determination of the size of the received deliveries and thus also the necessary insurance stocks of the material. The calculation must be based on the database of materials in
Table 5.
Calculation of the maximum state of the product:
The size of deliveries is based on the frequency of deliveries transformed into the number of days of required inventory. In this case, the frequency of deliveries is five times a week, so the size of the delivery is one day of production. Insurance stocks for a specific product are stocks in addition to the minimum delivered quantity, in case of delay in delivery of material from the supplier one average daily consumption (900 or 700) is added and due to possible fluctuations in production also one day average consumption (900 or 700). When calculating stocks, it is necessary to take into account the variability in consumption and the variability of supplies.
In
Table 6 when calculating the maximum level of stocks, the size of the normal weekly stock multiplied by the size of the delivery in days plus the coverage of production variability and the coverage of supply variability are taken into account. Furthermore, it is also necessary to determine the maximum number of pallets (bins) in order to be able to store the maximum level of stocks. Calculation:
Table 7 shows a comparison of two variants of a possible decision on supply dates, every working day or only once a week.
When comparing the results in the supply of the original system once a week and the transition to a supply five times a week, it is possible to observe a significant reduction in the stored material, by about 60%. It is equally important to have sufficient space to store the required pallets. With daily supply, it is much easier and smaller spaces are needed.
E-Kanban will be used when implementing the traction system. The company has three main material flows managed by the e-Kanban system. They are divided into:
Supplier Kanban.
Transport Kanban.
Production Kanban.
The supplier Kanban includes the circuit between the supplier, the receiving material warehouse and the entry into the production process. The first step is to scan the Kanban in the warehouse and mark it as “empty”. Subsequently the Kanban card is disposed, simultaneously sending a real-time electronic signal to the supplier that the Kanban card has been used and disposed of. The supplier will receive a visual signal, which specifically is to be stocked. Then a new Kanban card with automatic scanning for transport is printed. Subsequently, the warehouses will be replenished with new Kanban cards. Finally, the Kanban card is scanned and the storage is marked as refilled.
Transport Kanban differs in that it is the flow of material from the warehouse to production to the production line. The electronic signal is routed to the material warehouse in real time and displays what needs to be picked up from the warehouse. Subsequently, stocks are replenished on the production line and the process is repeated. Production Kanban ensures the material flow between the production workplace and the warehouse or the transfer of products to another production line. Kanban orders are displayed on a Kanban board in the workplace which displays inventory levels and sorts them by importance. The number is then selected and new Kanban cards are selected and scanned for “production”. They are manufactured, brought to the required line and marked by scanning as completed. The Kanban card is used as a production signal but also as a supply signal to the warehouse if the supply of material to the workplace is required.
When implementing the Kanban system, it is important to know how many pull signals need to be in the material supply. The calculation is as follows:
When the route is disconnected, four times the delivery frequency is required to supply workplaces that need input materials. Calculations in
Table 8 are for a 1-h supply interval. In the case of an 8-h work shift with a 30-min break for workers, the production time of operation is 7 h and 30 min, which results in the supply of material will take place seven times. By multiplying the hourly consumption of material and four times the frequency supply and then dividing by the standard amount of material on one pallet, we get the number of Kanban cards in a one hour interval. In this case, it is a transport Kanban.
The production of two different products, a solar panel and heat exchangers in quantities according to customer requirements, is a sequential traction system. Production is managed according to orders in a short time and it is important to maintain the stability of processes. When calculating stocks of final production, it is important to know the daily average demand. For a solar panel product, it is 900 pieces per day, while for a heat exchanger it is 700 pieces per day as shown in
Table 9. When expressing the stock of final production, it is necessary to determine the current stock, the insurance stock and the safety stock. The planned replenishment of materials for these items is one day. Current stock is calculated by multiplying the average daily consumption by the number of days of replenishment. The insurance stock is calculated as a percentage of the variability of demand from the current stock and the safety stock is calculated as a percentage of the safety factor from the sum of the insurance and current stock. The stock of manufactured products must be determined for both types of products.
With the transport system in the company, it is important to decide on the mode of transport and set up the right transport circuit. When implementing new technologies in the company decided to introduce AGV supply as shown in
Table 10. The original forklifts are only used for the receipt and dispatch of goods, as they are inefficient means of transporting material. Originally, it was only possible to supply a large number of products and with long waiting times when loading and unloading material.
In the future, it is important to increase the frequency of deliveries to individual workplaces and at the same time increase productivity, with a higher frequency of supply, albeit smaller batches. When using AGV transport, shown in
Figure 9, the failure rate of vehicles is significantly lower than it was in the original mode of transport and at the same time simpler and shorter maintenance time. Centrally managed preventive maintenance of vehicles allows pre-detection of possible defects and wear of vehicles.
AGV can be used in the production or storage premises of the company. The most common ways and reasons for use are:
Transport of products by production processes.
Transport of cargo with heavy traffic or busy aisles.
Moving pallets or other unused items of production.
Transfer of ordered products to the distribution warehouse for removal from storage.
Delivery of spare parts if required by the workplace.
Among the main advantages of use and added value of autonomous means of transport are:
System load monitoring (resulting in minimization of damage, errors or losses).
More predictable planning of operation and maintenance costs.
Balancing production lines.
Use of sensors and minimize collisions and increased safety.
Flexible change of transport routes.
Less space required for handling and operation than with VZV.
Expanding truck capacity and improving operational efficiency.
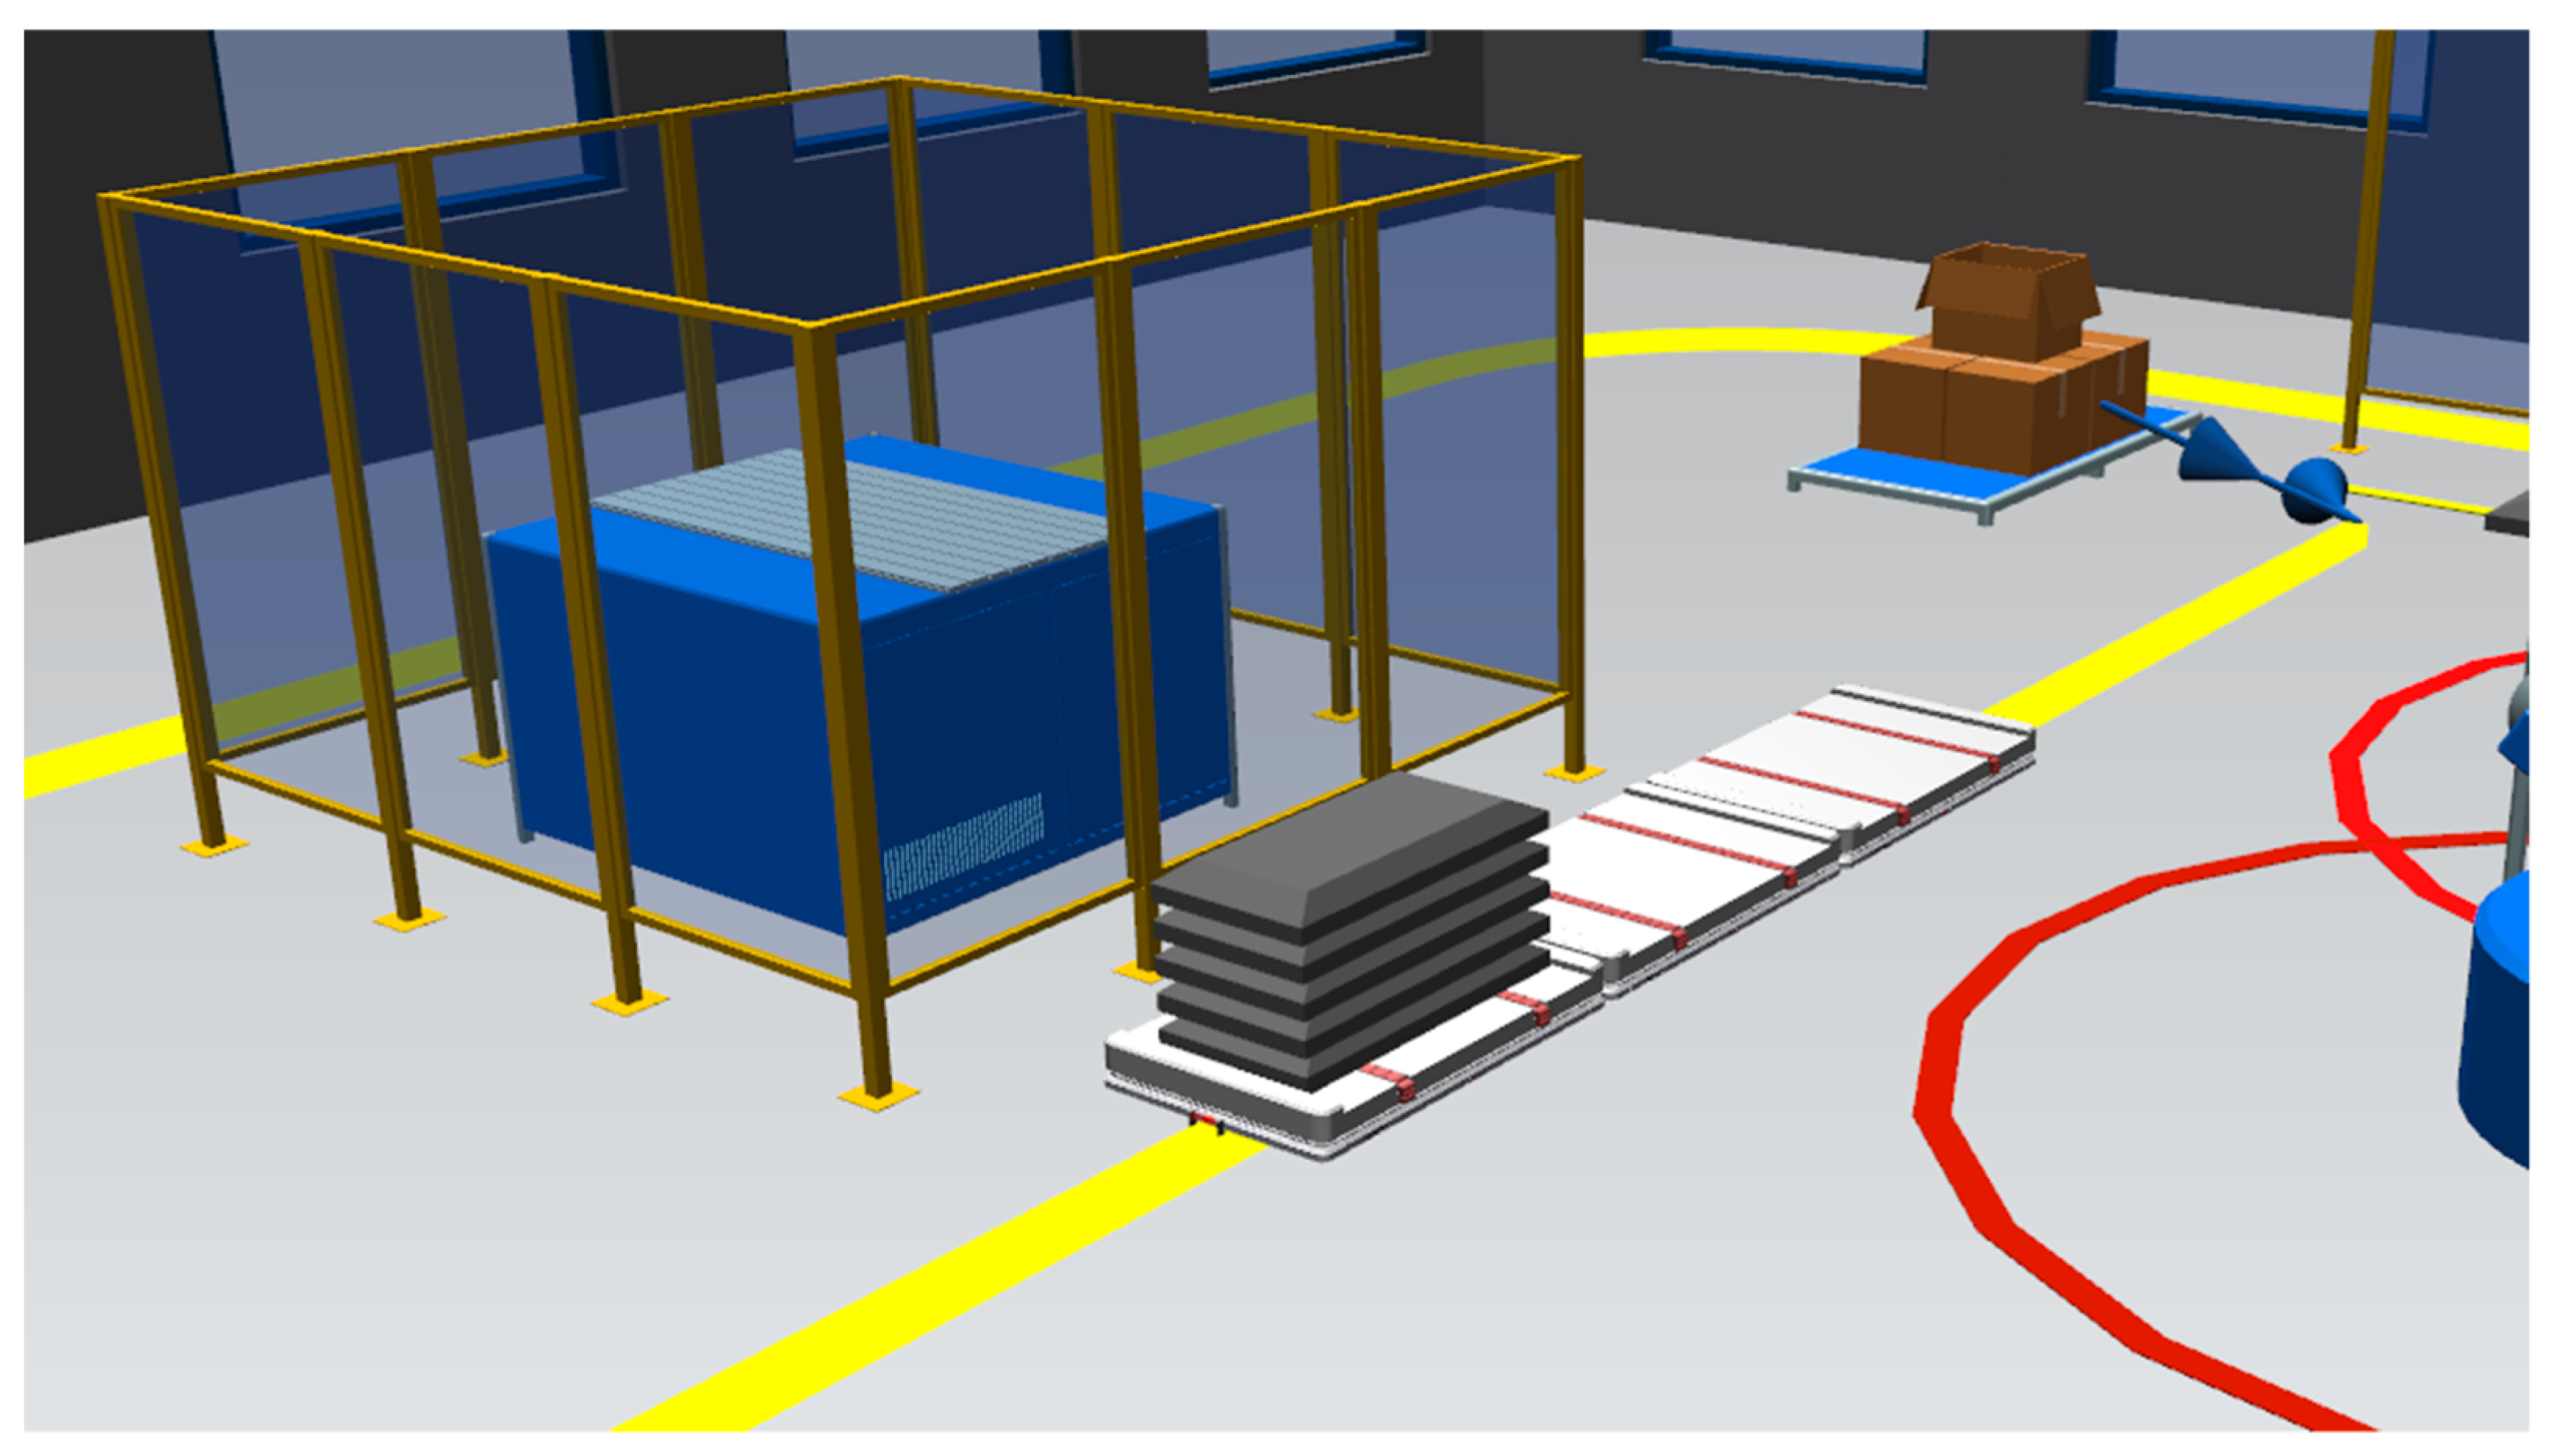
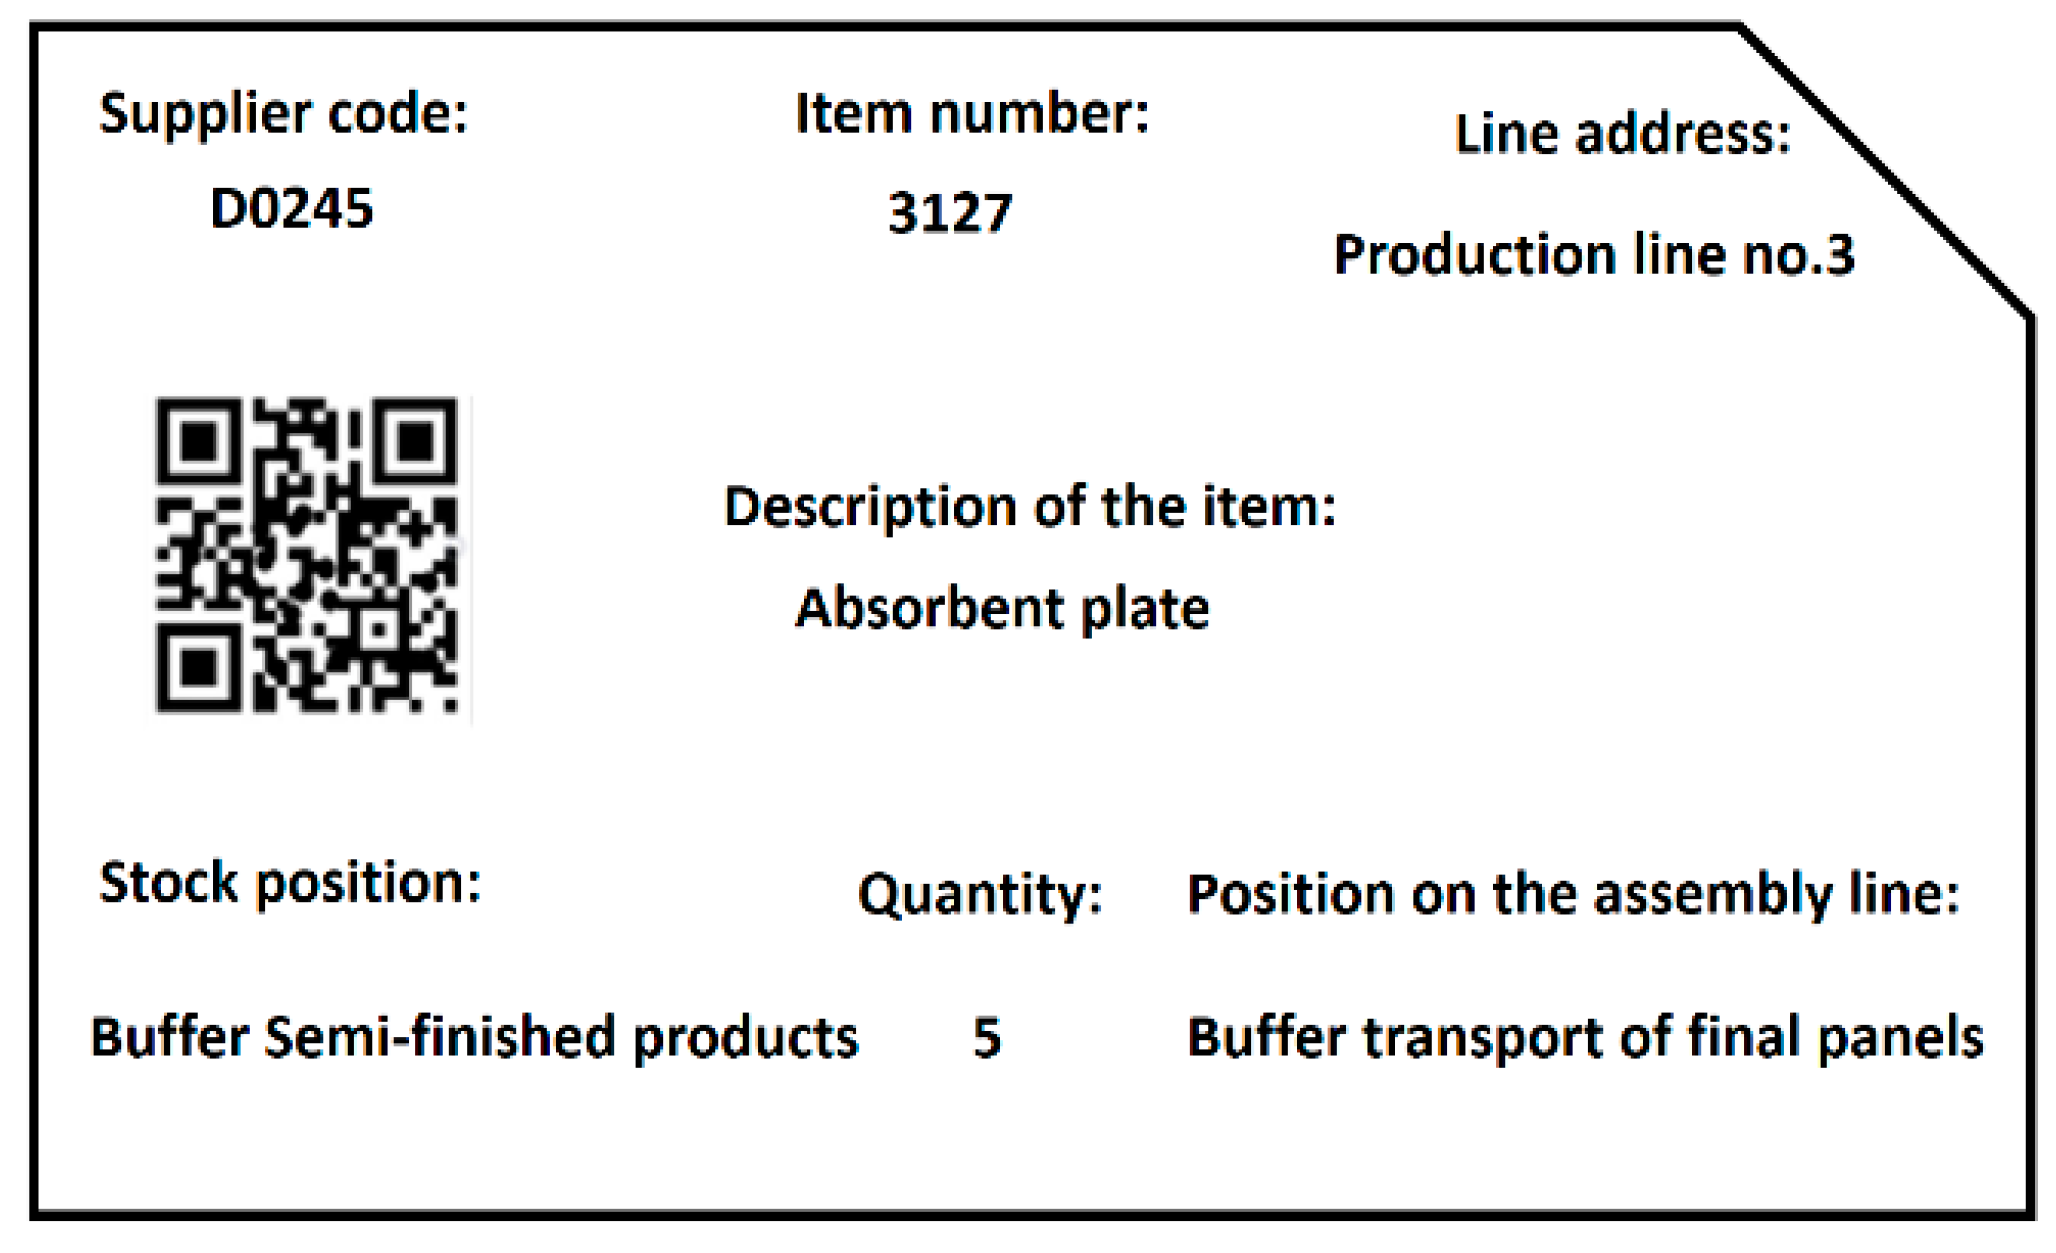
The inter-process Kanban is used within the company to move products from the intermediate warehouse to the next production process. The workplaces are regularly replenished with a small amount of material to achieve a smooth flow. It is also important to productively link the signals used to the company’s traffic routes. Kanban marking contains basic information about the origin of the product, whether it is an internal or external supplier, where it was originally stored, quantity, name, identification number and the position where the product should be delivered. By scanning the QR code, the transport device is able to transfer the items where they are needed (Kanban card is shown in
Figure 10).
The transport circuit is a connected route and at 10-min intervals the storage time does not exceed 33% of the total time, while the transport time does not exceed 33% of the remaining time. The route consists of the entry area of the trucks into the process, subsequently unloading the items from the intermediate storage, transport to the destination position and unloading into the intermediate storage. The circuit continues by loading the finished products at the end of production line number 3 and moving and unloading the items to the dispatch warehouse. Information about operation of the transport circuit of one truck is shown in
Table 11.
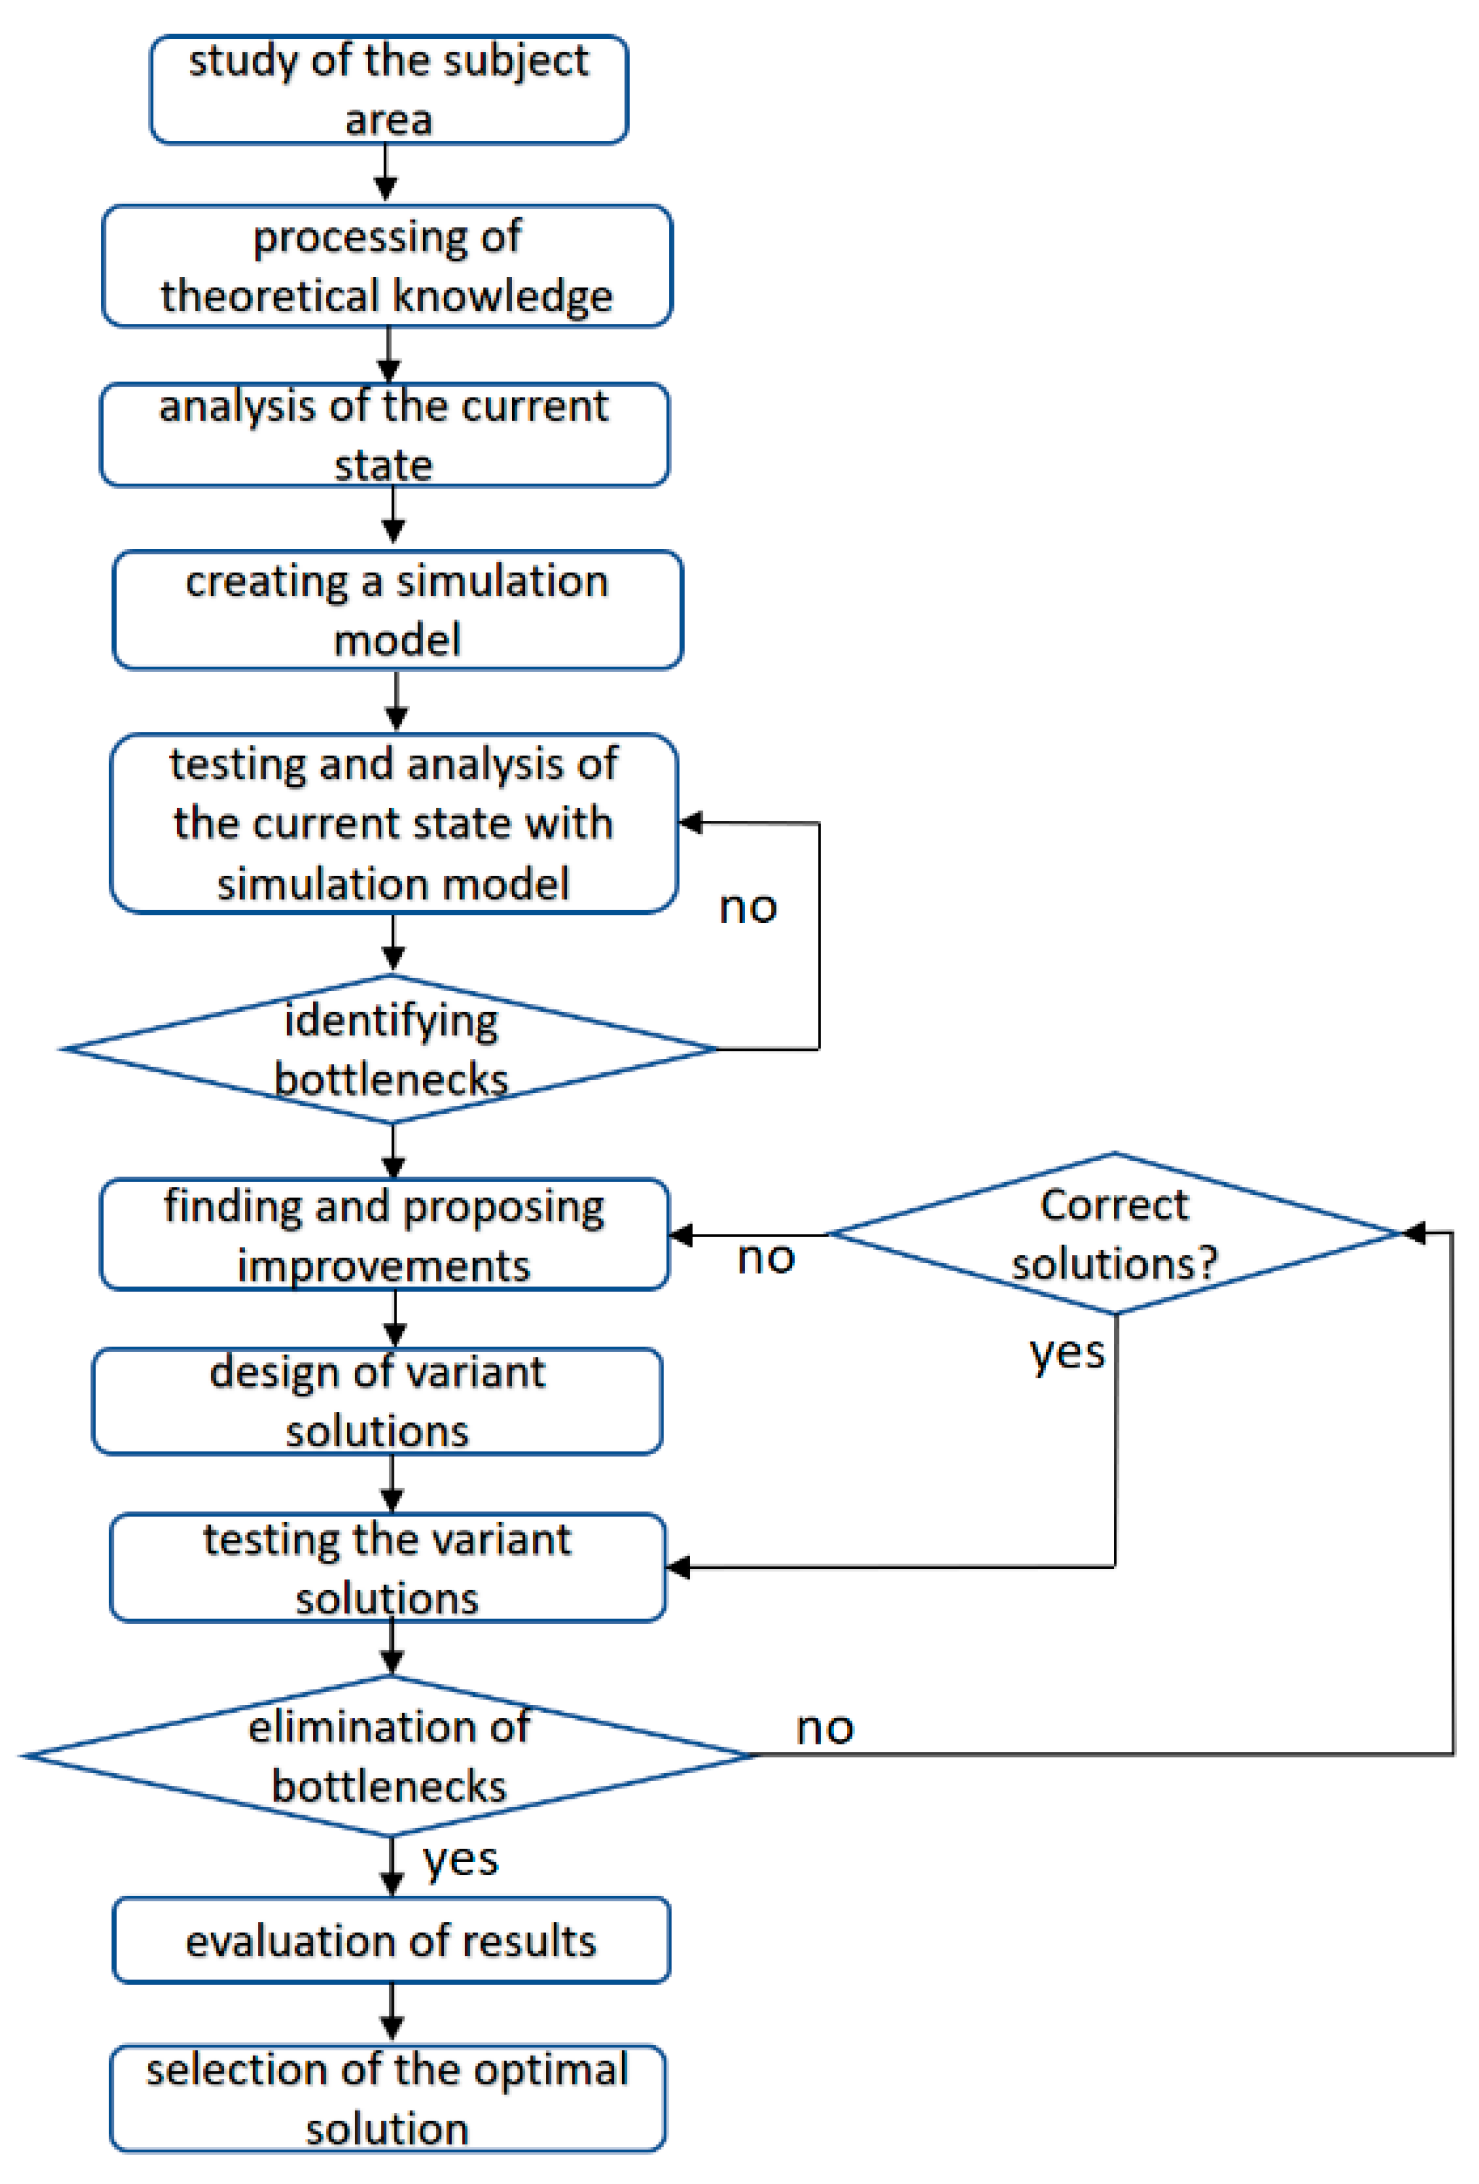
5. Discussion to Result of Realized Case Study
In solving the problem and achieving the required outputs, it is important to proceed logically, as shown in the sequence diagram
Figure 11.
The design of the use of the traction system and the introduction of Kanban signals can be implemented in a simulation model. Material inputs information are shown in
Table 12. Using the Kanban tools offered in the Plant Simulation library and the calculations from the previous chapter, the production and logistic simulation system will be changed.
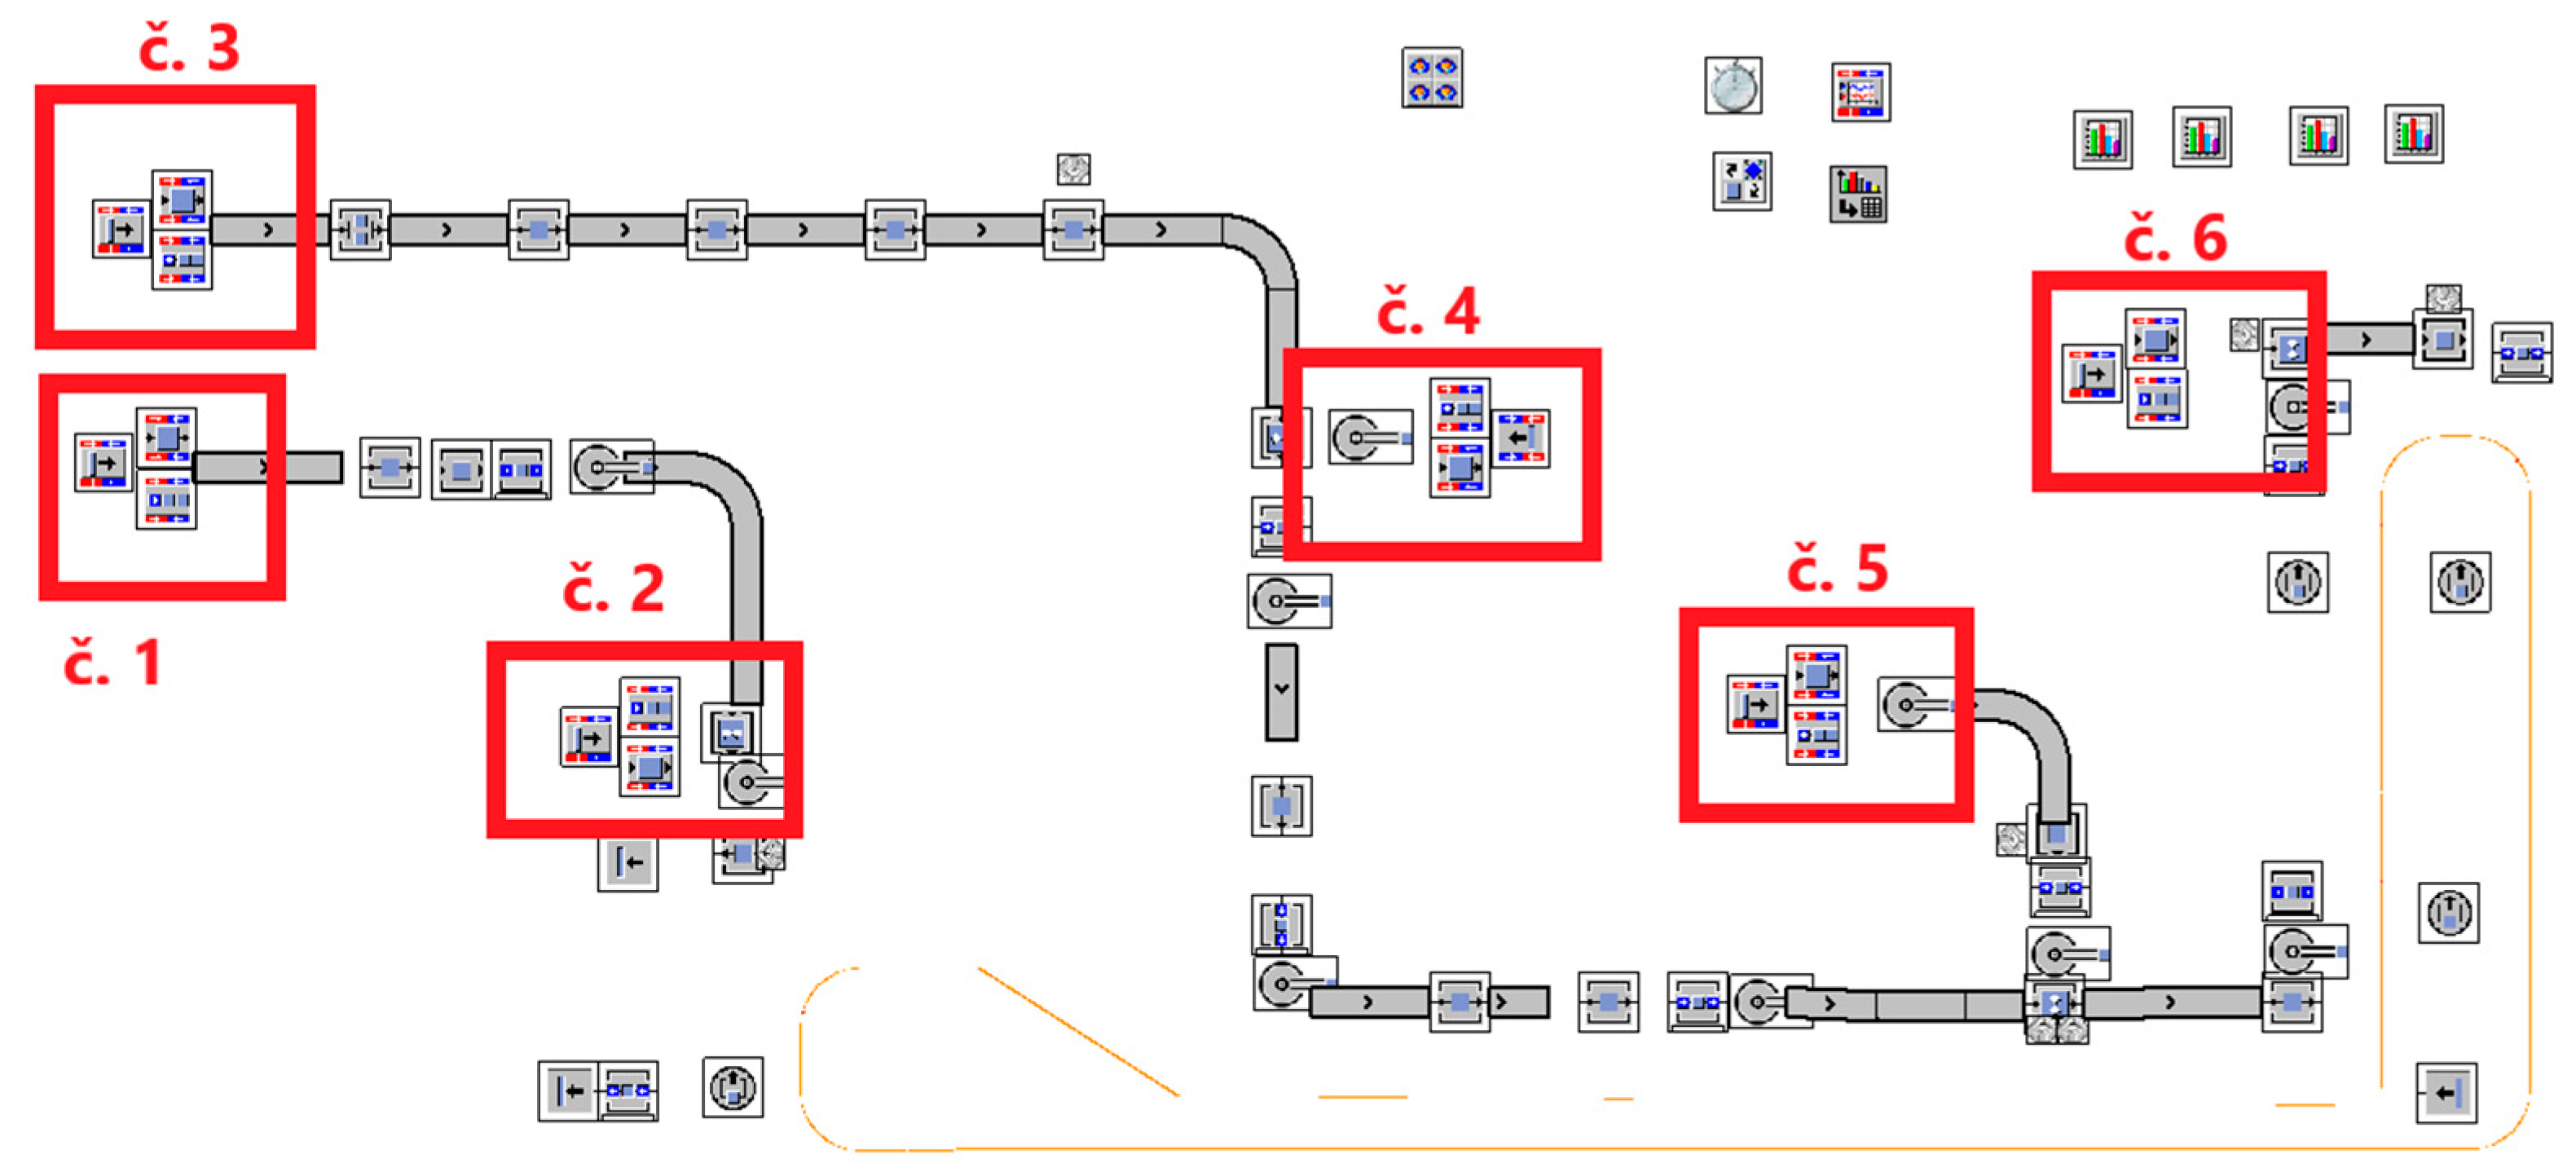
Figure 12 shows the individual inputs of materials into the production process, which had to be changed.
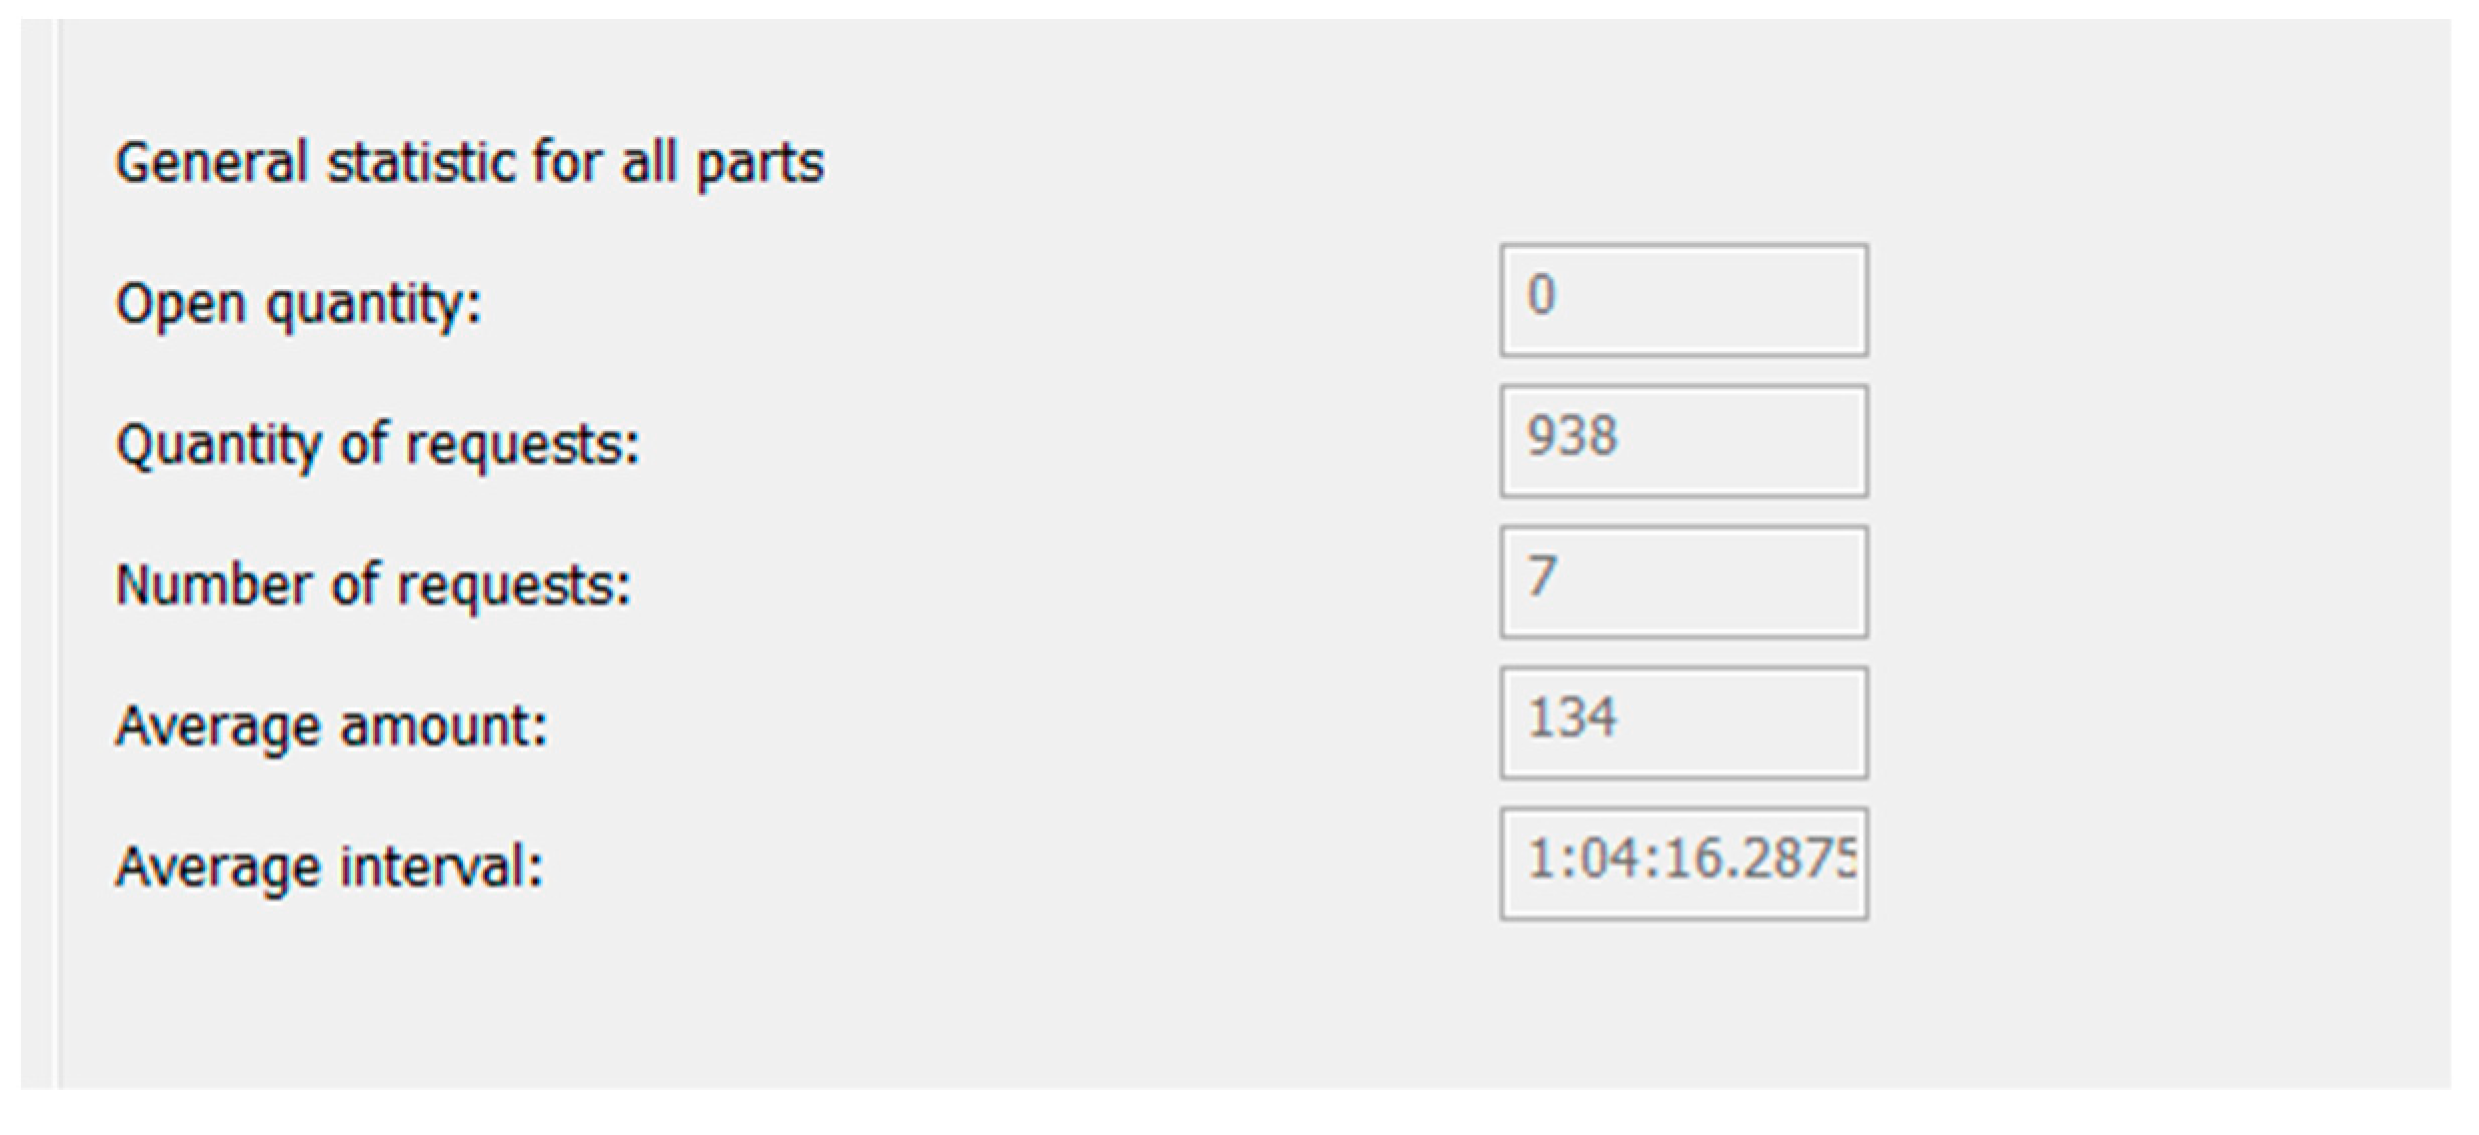
The implementation of traction signals was introduced in six parts of the production process. The goal was to increase material flow permeability and improve productivity. The individual detailed supply statistics after the end of the simulation are shown in
Figure 13.
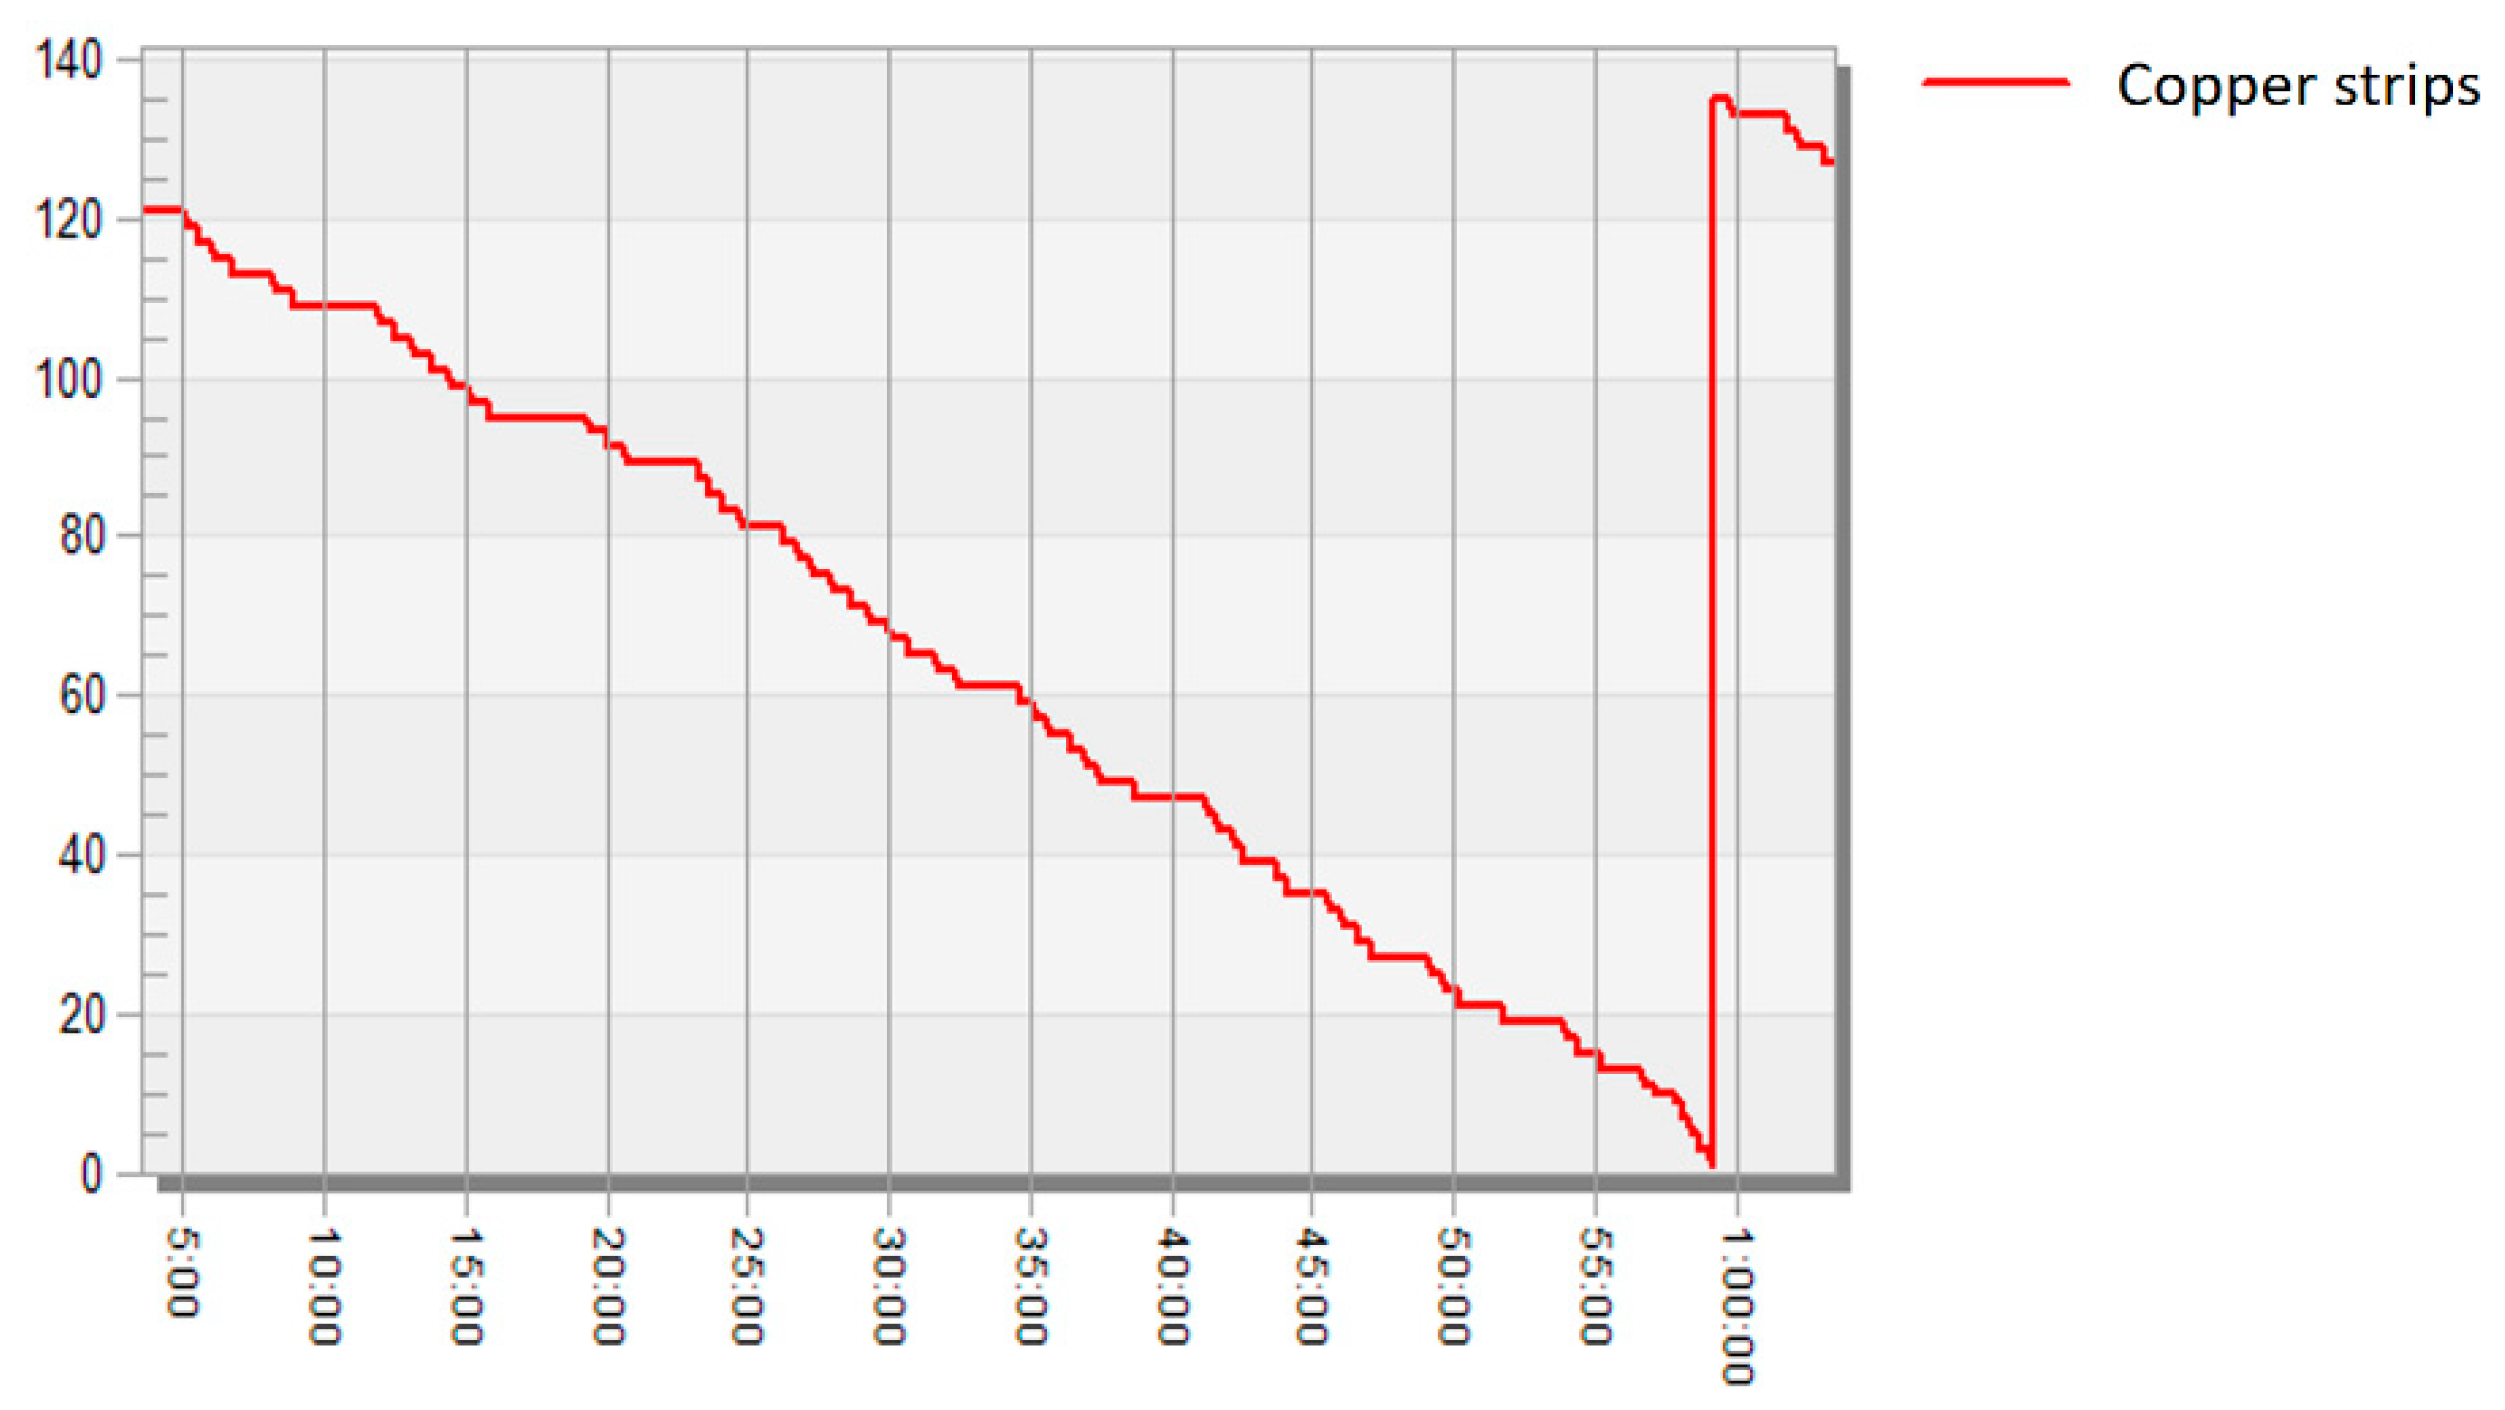
With a one-hour supply interval, the statistics show that the material in the tanks needs to be replenished seven times during 8 h of operation. Stocks need to be replenished with an average of 134 pieces for each required workplace approximately every hour. The fluidity of drawing stocks from the tanks can be seen on the graph from the simulation outputs,
Figure 14.
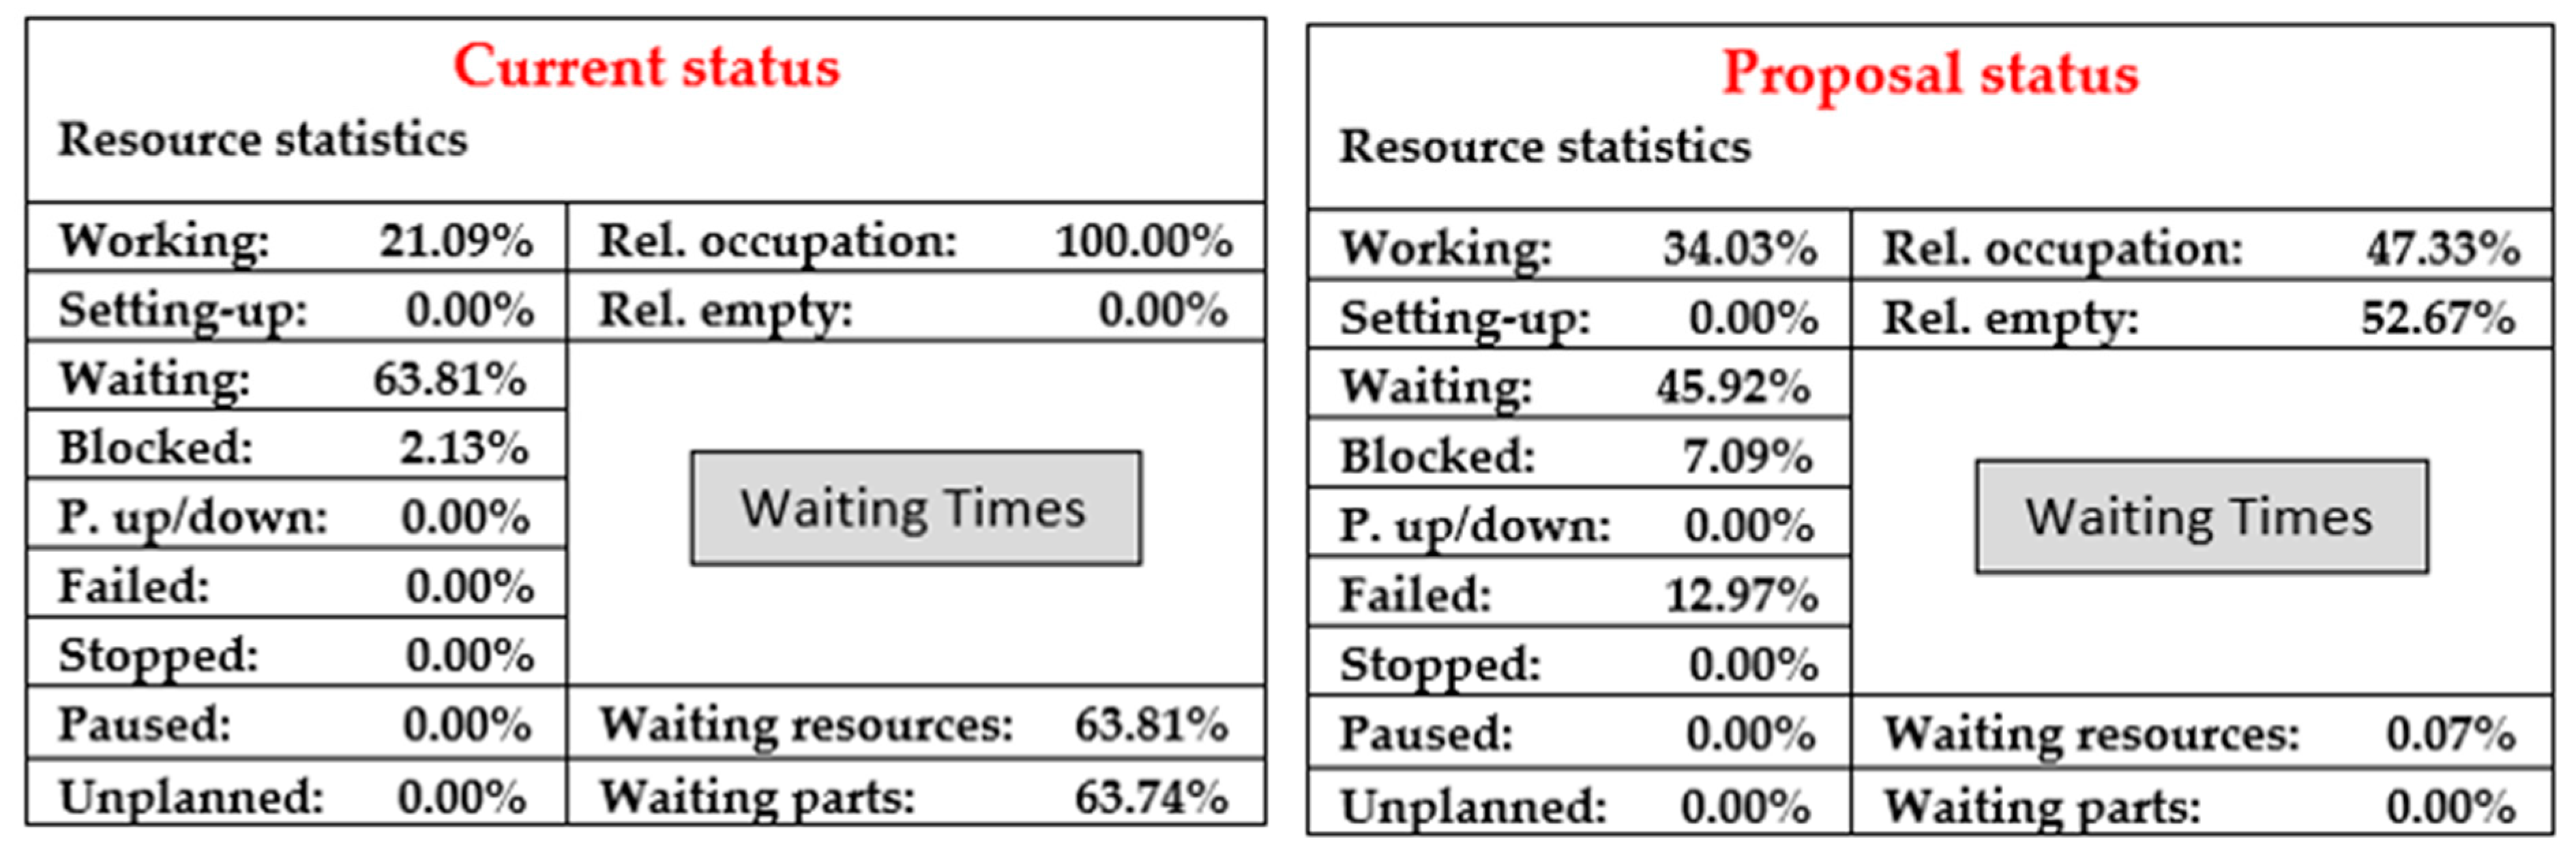
The achievement of the original goals, especially the increase of production and the minimization of inter-operational stocks, can be evaluated on the basis of the statistics of the simulation outputs. At 8 h of operation we can observe in
Table 13 in the production of the heat exchanger, an increase of the manufactured pieces from the original 693 to 967, which represents a throughput of 121 pieces in one hour. During the production of the solar panel on production line 2 and 3, there was an increase from the original 584 to 975, an increase in production of approximately 13% and an increase in value-added processes of approximately 13.5%. The biggest change for the better was the minimization of inter-operational stocks in the production process by about 70%. The inter-operational warehouses are shown in
Figure 15.
After analyzing the simulation with the Bottleneck analyzer tool, it is possible to compare the production workplaces of individual workplaces.
Table 14 shows statistics from the original state. An increase in production times of 5% on average can be seen. The Composing and Testing workplaces achieved an increase in production times of up to 12% and a reduction in waiting times of up to 25%, which is mainly due to a change in the method of transporting semi-finished products through the transport circuit. Another benefit is minimizing blocking.
The introduction of AGV helped to significantly reduce workplace waiting times by increasing the frequency of supply to line number 3 (
Table 15). Using five AGV vehicles with a capacity of five pieces of solar panel and a regular 10-min supply frequency, the results of reducing the waiting times of the following workplaces on line number 3 were achieved by 13%. The comparison of the original mode of transport with forklifts with the current AGV technology can be seen in
Table 15. Vehicles are more efficient as the waiting time of a vehicle on a route has been reduced by 30%, while working time has been increased by 30%.
After evaluation of the results of the simulation model after the implementation of the traction system and changes in transport, the positive results of the simulation are shown in
Figure 16. The individual goals were achieved, namely increasing production, modernizing transport, improving throughput and minimizing inter-operational stocks.
6. Conclusions
The potential in the Tx Plant Simulation software used in the case study can be seen in its dynamics and hierarchical structure, which allows it to work with and modify the already created model, and to create simulation models of material flow that can reflect a number of logistics and production systems operating on different principles. The library provides a number of active and passive material flow objects. The library contains the following hierarchically structured folders: material flow, information flow, resources, user interface, mobile units, tools and models. Thanks to these modular libraries, the process of creating simulation models suitable for various industries is very efficient. In these modular libraries, it is possible to modify objects to suit the requirements of a specific simulation target. Some of the modular libraries can be mentioned, such as AGVS, assembly, 3D conveyor, EOM 3D, Kanban, or personnel data processing from the RTLS system. The mentioned simulation model, which is the output of the case study, is therefore a suitable modification as well as the addition of the mentioned modular software libraries to use for solving other tasks arising from industrial practice. The future of designing, optimizing and balancing production and logistic systems is in a virtual and augmented reality. This case study has a good potential to implement these elements in conjunction with the simulation software Tx Plant Simulation and create a simulation model that would be part of a digital enterprise.
By using simulation software, the company can save costs in case of unsuccessful prototypes or implemented changes directly into production. On the simulation model, as pointed out in the present study, it is possible to try the introduction of new systems of operation, without the intervention directly into the real company. When changing the pressure system to a production traction system, the main goal was to minimize the inter-operational stocks that were created due to the imbalance of material flow in logistics. Also, the change of the transport system and the modernization of technologies have led to an increase in the production and throughput of products. From the evaluation of the resulting statistics, it is necessary to conclude that the use of simulation software is the future in implementing improvements in business processes. Another potential improvement of simulation processes is the connection of the model with virtual and augmented reality, which can increase the accuracy of individual parameters of the required project objectives.
The traction system is more than just a collection of tools and techniques; it is an essential approach to achieving improvements in the production process. The main result of the introduction of lean manufacturing elements and the combination with technologies and software can achieve the desired results, especially in terms of cost reduction in all areas of production. Minimizing undesirable factors in processes can lead to a reduction in the number of employees by replacing it with technology and eliminating the error caused by the human factor. Another consequence can be a reduction in the selling prices of products, which can be beneficial for the seller and at the same time for customers. The use of elements of modeling, simulation and digitization of processes moves the company into the digital age and allows it to interconnect individual processes and mutually automated communication of devices [
32,
33,
34,
35,
36,
37].


