Review

Infrastructure Elements for Smart Campuses: A Bibliometric Analysis

1
School of Built Environment, Engineering and Computing, Leeds Beckett University, Leeds LS2 8AG, UK
2
Department of Construction Economics and Management, University of Cape Town, Rondebosch, Cape Town 7700, South Africa
3
Centre for Sustainable Smart Cities, Central University of Technology, Bloemfontein 9301, South Africa
*
Author to whom correspondence should be addressed.
Sustainability 2021, 13(14), 7960; https://doi.org/10.3390/su13147960
Submission received: 14 June 2021 / Revised: 7 July 2021 / Accepted: 13 July 2021 / Published: 16 July 2021
(This article belongs to the Special Issue Smart City Development and Sustainability)

Abstract

:
Sustainable development can be attained at a microlevel and having smart campuses around the world presents an opportunity to achieve city-wide smartness. In the process of attaining smartness on campuses, the elements requiring attention must be investigated. There are many publications on smart campuses, and this investigation used the bibliometric analysis method to identify such publications produced over the last decade. A matrix of 578 nodes and 3217 edges was developed from 285 publications on smart campus construction and procurement. Fifteen cluster themes were produced from the bibliometric analysis. The findings revealed that China contributed 48.4% of all published articles on the smart campus. The findings presented a framework from the cluster themes under the four broad infrastructure areas of building construction or repurposing, technology and IT network, continuous improvement, and smart learning and teaching management. The implications of the findings identified that IT project management, traditional procurement strategy, and standard forms of contracts such as the New Engineering Contract (NEC) and the Joint Contract Tribunal (JCT) are applicable in the procurement of smart cities.

1. Introduction

The emergence of smart campuses worldwide has become an opportunity for educational institutions to enhance their utilisation of existing physical infrastructure to introduce smart technologies [1]. The construction and upgrading of smart campuses have seen the deployment of various infrastructures such as sensors, microgrids, smart classrooms; smart parking; smart meters; energy consumption management and digital technologies to improve learning and teaching on campuses [1,2]. Moreover, smart campuses are essential for meeting the United Nations’ sustainable development goals (SDGs) like affordable and clean energy and sustainable cities and communities [1]. Likewise, campuses are smaller communities within cities that may serve as micro smart cities and an available framework for smart city development [3,4]. Awuzie et al. [3] suggested that smart cities development in developing countries can be hinged on a clear strategic framework inclusive of governance, policymaking, and management of campuses.
Similarly, Verstaevel et al. [5] suggested that 70% of the world’s population will be living in urban areas by the year 2050, and the development of smart campus information technology (IT) applications is an integral part of creating smart campuses. The need for smart cities worldwide is predicated on the problems of the epidemic, climate change, unhealthy cities and access to modern amenities such as the internet of things [1,3]. The development of smart cities is viewed as expensive, non-inclusive of low-income earners, but Awuzie et al. [3] argued that the microlevel application of smart infrastructure through a smart campus is an opportunity for existing cities to transcend towards smart cities. On-campus, IT infrastructure such as smart buildings; mobile learning; e-learning on smart devices; smart classrooms; campus information portal; and renewable energy are opportunities for campuses to provide wider smart city development lessons [6,7]. Previous studies by Min-Allah and Alrashed [1], Chen et al. [2] and Awuzie et al. [3] are deficient in terms of new developments in smart campus infrastructure (especiually in the last 10 years), inclusive of improvement measures and the need to identify focal and emerging areas of smartness needs on campuses.
Consequently, the diverse IT infrastructure required to attain smart campus status is unknown in academic literature despite being reviewed in multiple articles. For instance, scholars like Huang [6]; Ma and Fu [7]; Du et al. [8]; Huang [9]; and Zhicheng and Feng [10] discussed cloud computing, the internet of things (IoTs), and digital technology in smart campuses. Moreover, many articles on smart campus development have considered the sustainability, technology, student behaviour, challenges and opportunities for their continued transitions into smart cities [11,12,13,14,15,16,17]. However, a significant challenge facing smart campus development is the paucity of studies seeking to articulate an existing framework for identifying all the infrastructural elements required for smart campus development. Such a smart campus infrastructure framework can foster a comprehensive approach to any campuses in developing and developed country contexts seeking to engage in micro smart city development.
This study intends to propose an inclusive framework of smart campus infrastructures by reviewing all existing literature on smart campus technologies. In achieving this aim, the bibliometric analysis of extant literature will be used to identify cogent smart campus technologies deployed in various countries worldwide. Bibliometrics is a very valuable tool to obtain good information and knowledge about the status of scientific research activities in specific disciplines, helping researchers to find novel trends and interests within investigation frameworks [18]. Bibliometric analysis can be employed in library and information sciences, which uses quantitative analysis and statistical methods to describe the distribution of patterns of publications according to some categories, such as field, source, topic, country or the author [19]. Biliometric analysis provided an opportunity to extensively review existing articles on smart campus studies. This form of analysis is useful for identifying important smart campus infrastructure not included in Min-Allah and Alrashed’s [1] sketch for a smart campus development, and for developing a comprehensive conceptual framework inclusive of new technologies and improvement mechanisms. In this investigation, the geographical location from which relevant publications analysed emanated will further highlight the regions of the world which have intensified research into smart campus development, thereby indicating emerging and future smart cities. This article intends to fill the knowledge gap of inadequate identification of infrastructure elements for smart campus development and identify regions of the world where smart campuses are being studied.
The structure of this study systemically provides a review of publications on smart campus technologies in Section 1, Section 2, Section 3, Section 4 and Section 5. Section 2 on the methodology described the data collection process, analysis, and visualisation. Section 3 presents the result of the analysis in a logical sequence that is inclusive of trends in smart campus research around the world. Further findings are presented in Section 4, where the bibliometric findings produced fifteen (15) cluster themes highlighting smart campus technologies, which are subsequently explained individually. The 15 cluster themes were used to produce the smart campus procurement framework in Section 4.1 and Section 4.2. Section 4.3 discusses the implications of the findings on procurement practices, sustainability, and further research. Section 5 elucidates the conclusion for future research and the limitations of this study.

2. Materials and Methods

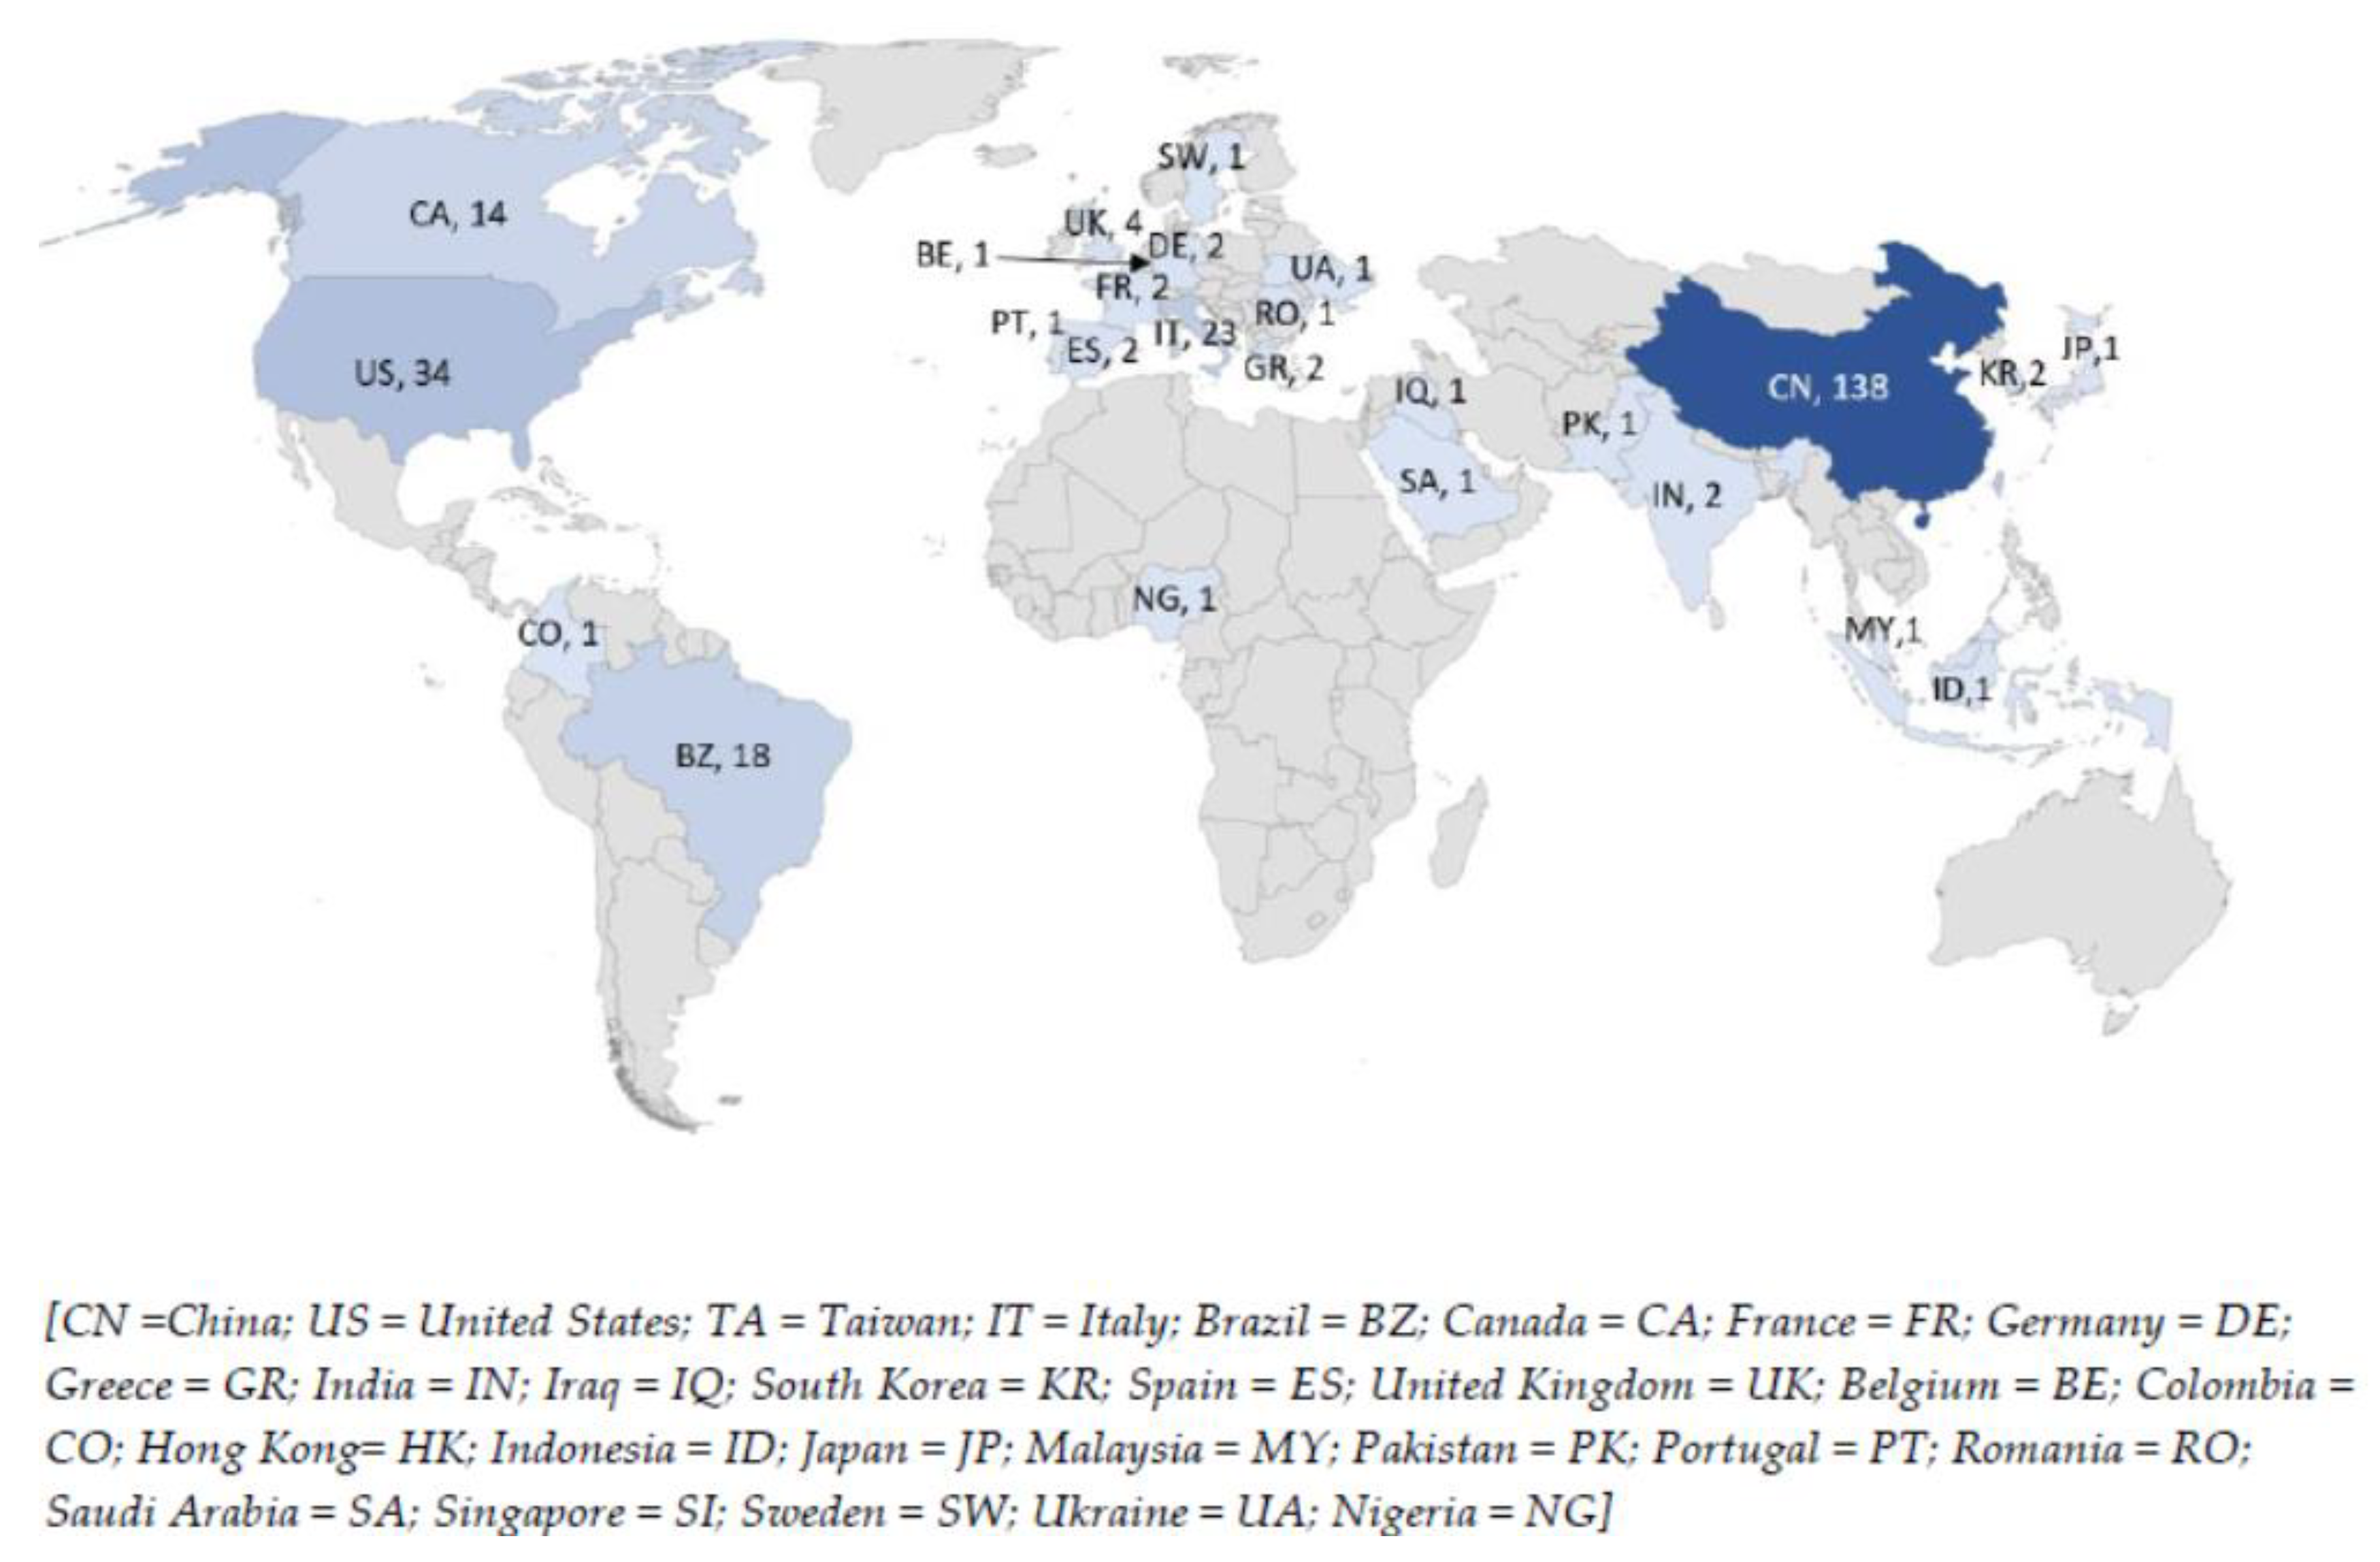
2.1. Data Collection

Data applied in this bibliometric analysis was extracted from Web of Science and Scopus because they are valid and consistent databases of journal articles, conference proceedings, reports and technical reports [17,18]. Web of Science and Scopus databases were selected because of their compatibility with the Gephi bibliometric analysis tool used in this study. Web of Science is considered one of the most relevant scientific citation index databases in the academic field [19,20,21,22]. Scopus remains the largest abstract and citation database of peer-reviewed literature, indexing content from 24,600 active titles and 5000 publishers, and is rigorously vetted and selected by an independent review board [23,24]. The results generated from the databases were profiled to eliminate duplicate articles and relevance. Google Scholar was not included in the database because the generality of research publications can be found in Web of Science and Scopus [24].
The first step in the bibliometric analysis followed in the steps adopted by previous bibliometric studies in smart campus studies like Zyoud et al. [19] and Zhai et al. [20] by developing a list of keyword combinations to ensure the collection of comprehensive and relevant data. Table 1 below presents the list of keywords combinations applied in the search for smart campus technologies.
The keyword combination in Table 1 was limited to 2011 to 2021 because their publications within this time range will effectively articulate the developments in smart campuses research.
The second stage of this analysis produced 538 outputs in conference proceedings, journal articles, survey data, books, book chapters on smart campus technologies, and construction. An estimated 538 articles were profiled for suitability. Upon reviewing the outputs, 285 relevant articles were selected and transferred to produce the matrix for the data analysis. The reduction of the articles from Web of Science and Scopus used the input variables in Table 1 to evaluate the content of the abstracts to filter out publications outside the scope of the input variables. Duplicate publications were also eliminated from the list of publications.
In the third stage of the analysis, the matrix produced nodes and edges for application in the Gephi software. In all, 578 nodes and 3217 edges were developed in the matrix. The nodes are the keywords in a network, and the edges represent connecting lines for each node within a network [25,26,27]. The nodes and edges were derived from the abstracts and keywords.
The fourth step made use of the nodes and edges tables in the matrix file to visualise the smart campus technologies in Gephi. This process led to identifying the trends in smart campus research, the geographical distribution of the publications and emerging themes from the analysis. The themes led to developing the framework containing the infrastructure elements for a smart campus, which will be essential for procurement and construction purposes.

2.2. Data Analysis and Visualisation

The dataset was visualised using Gephi software, and the analyses covered the strengths of keywords of smart campus technologies, construction and procurement [25,26,27]. The modularity of the nodes and harmonic closeness centrality were used to categorise similar and dominant nodes, thereby creating the cluster themes. Before this process, the overview of trends in smart campus research and the geographical distribution of the publications were presented in Section 3 to understand the growth and location of smart campus studies worldwide.

3. Results: Overview of Smart Campus Research

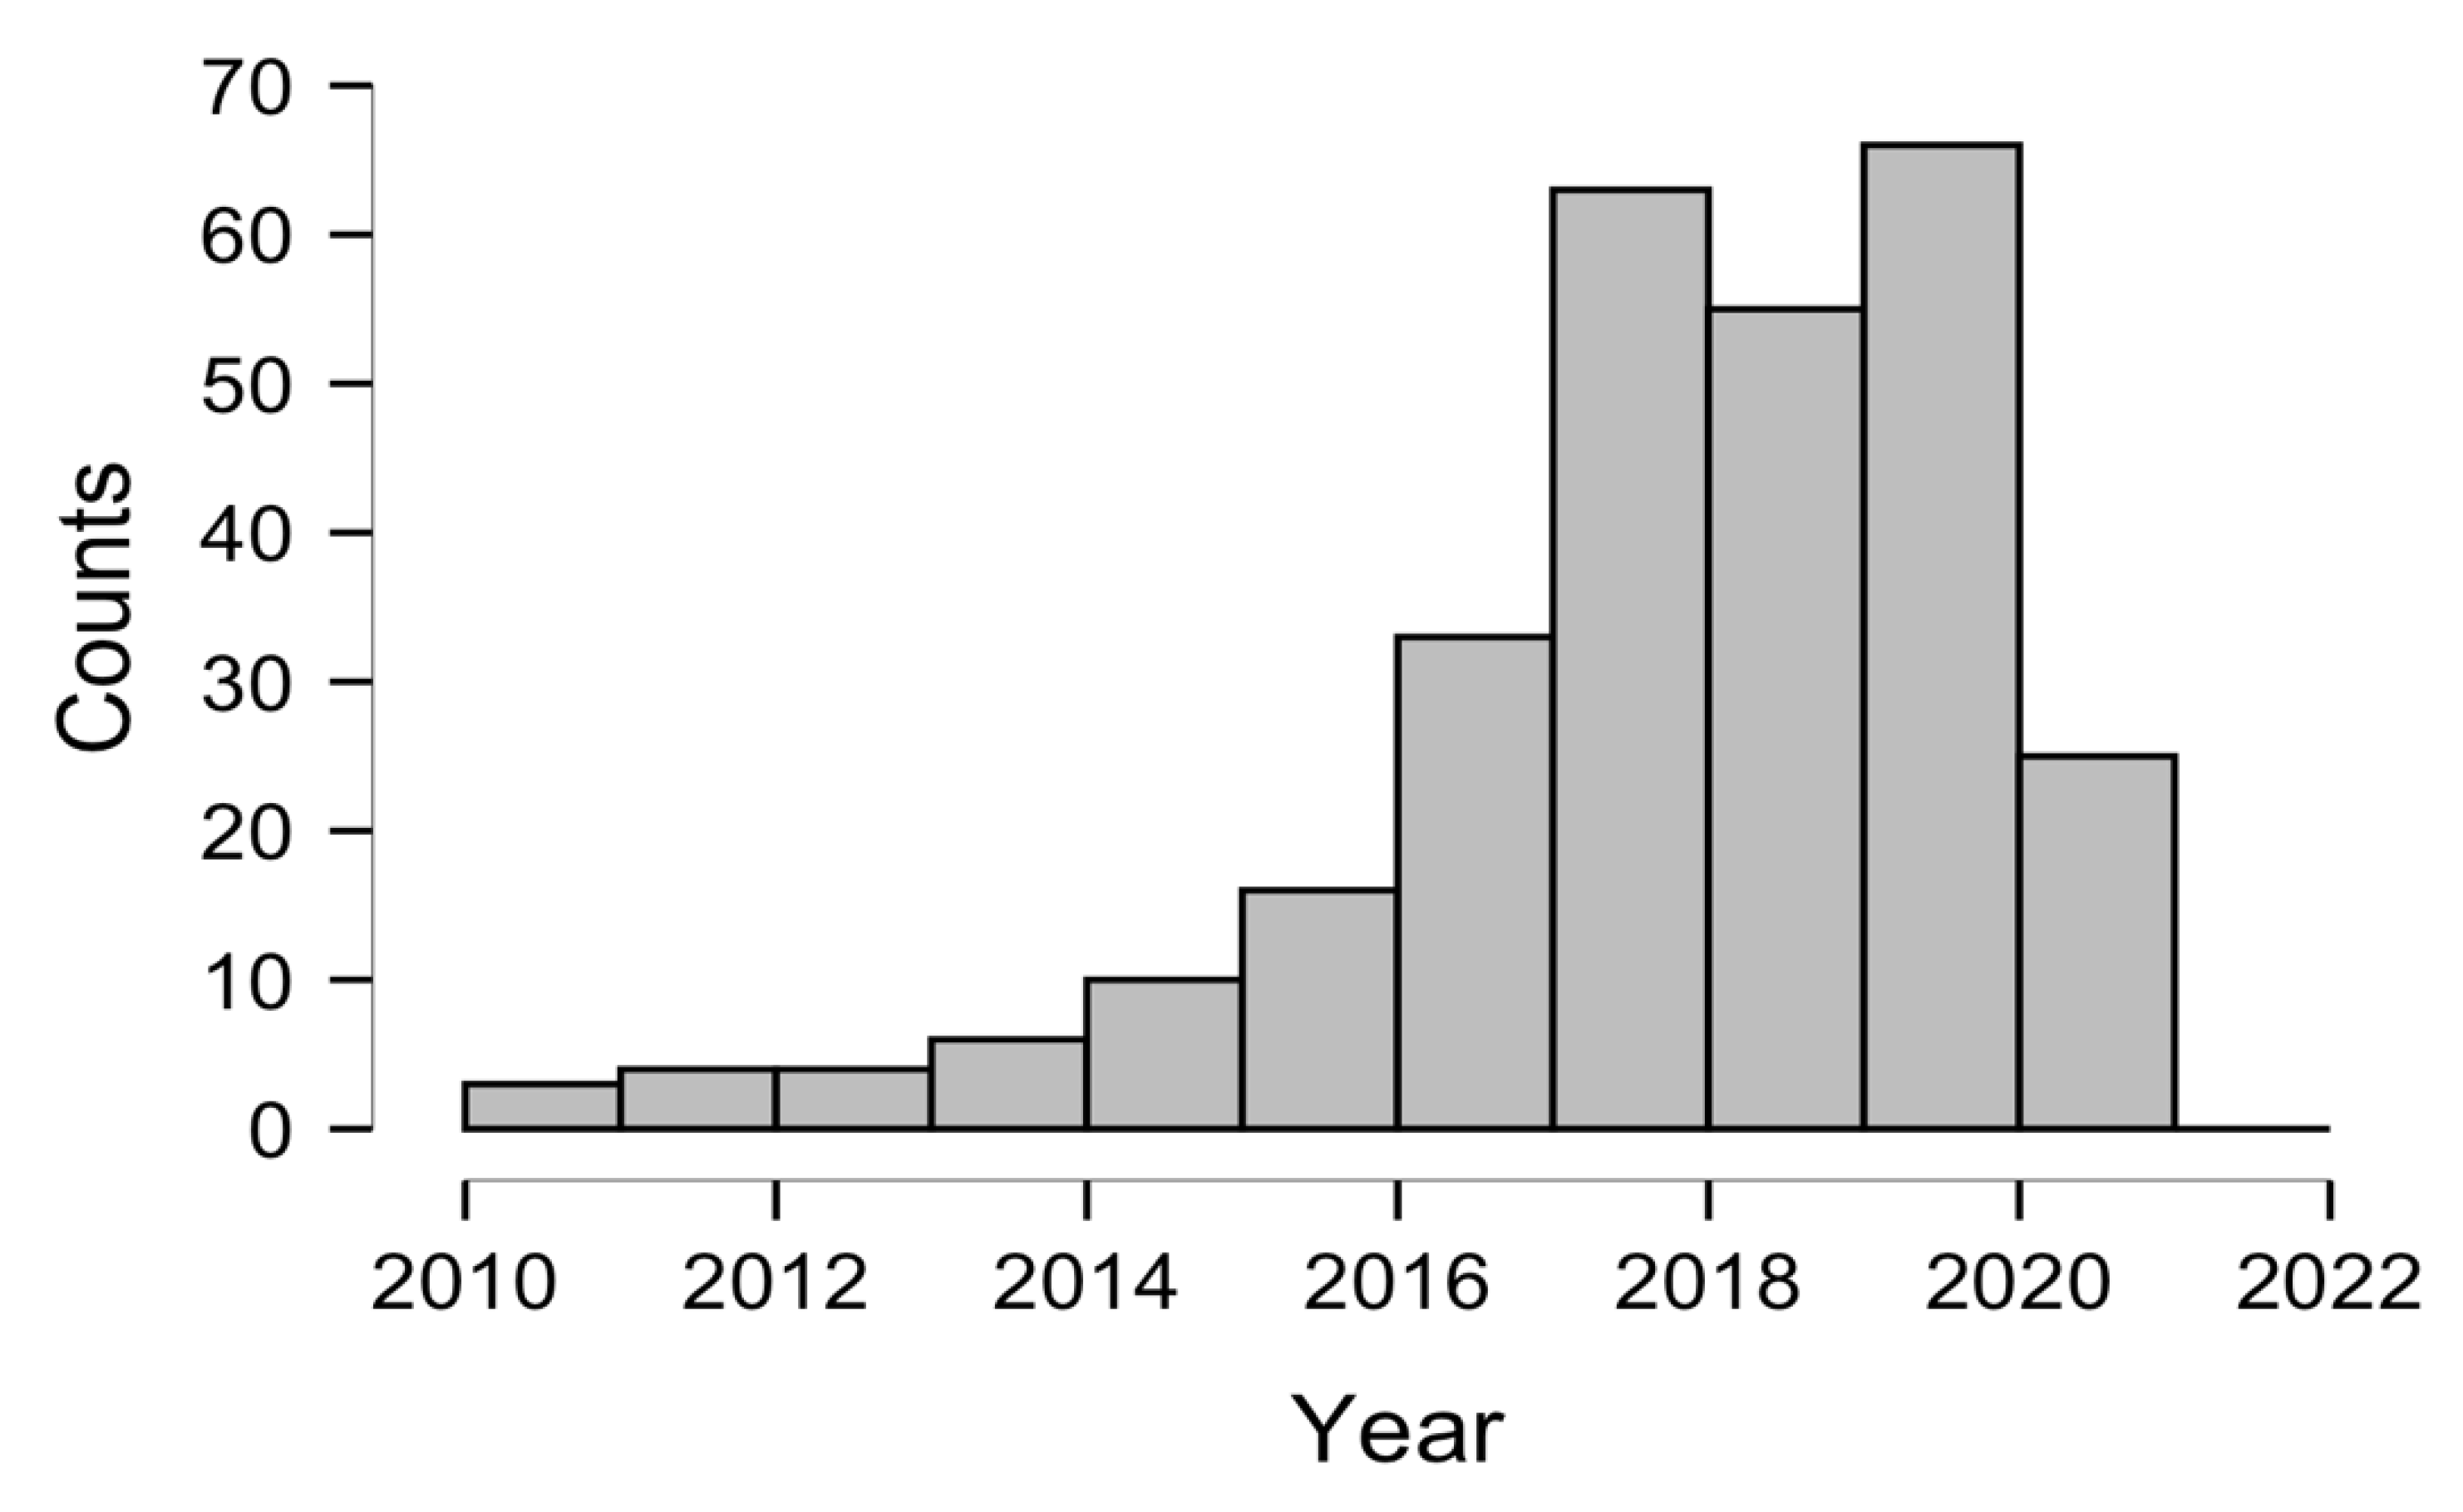
3.1. Trend in Smart Campus Research

Out of the 285 documents reviewed and analysed in this study in the last ten years, less than ten articles were published on smart campus technologies and construction between 2011 and 2014, as illustrated in Figure 1. From the year 2015 to 2017, 11 to 35 articles were published. The massive growth of publications in smart campus studies started in 2018 with 64 publications in a year. This number declined in 2019 to 55 articles. The highest growth in publication was experienced in 2020, with 68 articles (although bibliometric analyses are traditionally conducted including entirely up to a specific year) [28,29]. The publications from 2021 (up until June 2021) were included in the analysis because of the 25 recently published articles and their relevance.
The trends in smart campus publications from 2017 indicate more awareness and desire to study smart campus applications. Publications from 2021 are still in the growth process, with 25 articles far greater than the combination of smart-campus-related articles from 2011 to 2014. The non-inclusion of these 25 articles in this analysis will prove a major deficit in discussing new technologies related to smart campuses. This result denotes a greater need for smart campus development. With the growth in smart campus research, the geographical distribution of the articles, as illustrated in Figure 2, indicated that 138 articles emanated from China. They are forming 48.4% of the total sample size. The key articles from China are Wang [23]; Bastidas-Manzano [24]; Rochat [25]; and Thangaraj [26] that featured localised and regional studies on the construction of smart campuses using big data architecture, cloud computing, learning analytics and teaching systems.
Other dominant studies emerged from the United States of America, Taiwan, Italy, Brazil, and Canada with 34, 27, 23, 18 and 14 publications respectively. The combination of these countries only accounts for a combined percentage of 89.12% of the total publications of smart campus research, while other countries account for only 10.88% publication in this field of research. The focus of the publication search was to identify smart campus technologies and procurement indicators. This preliminary search analysis provided a basis for categorising smart campus infrastructure for procurement purposes.

3.2. Discussion of Smart Campus Infrastructure Themes

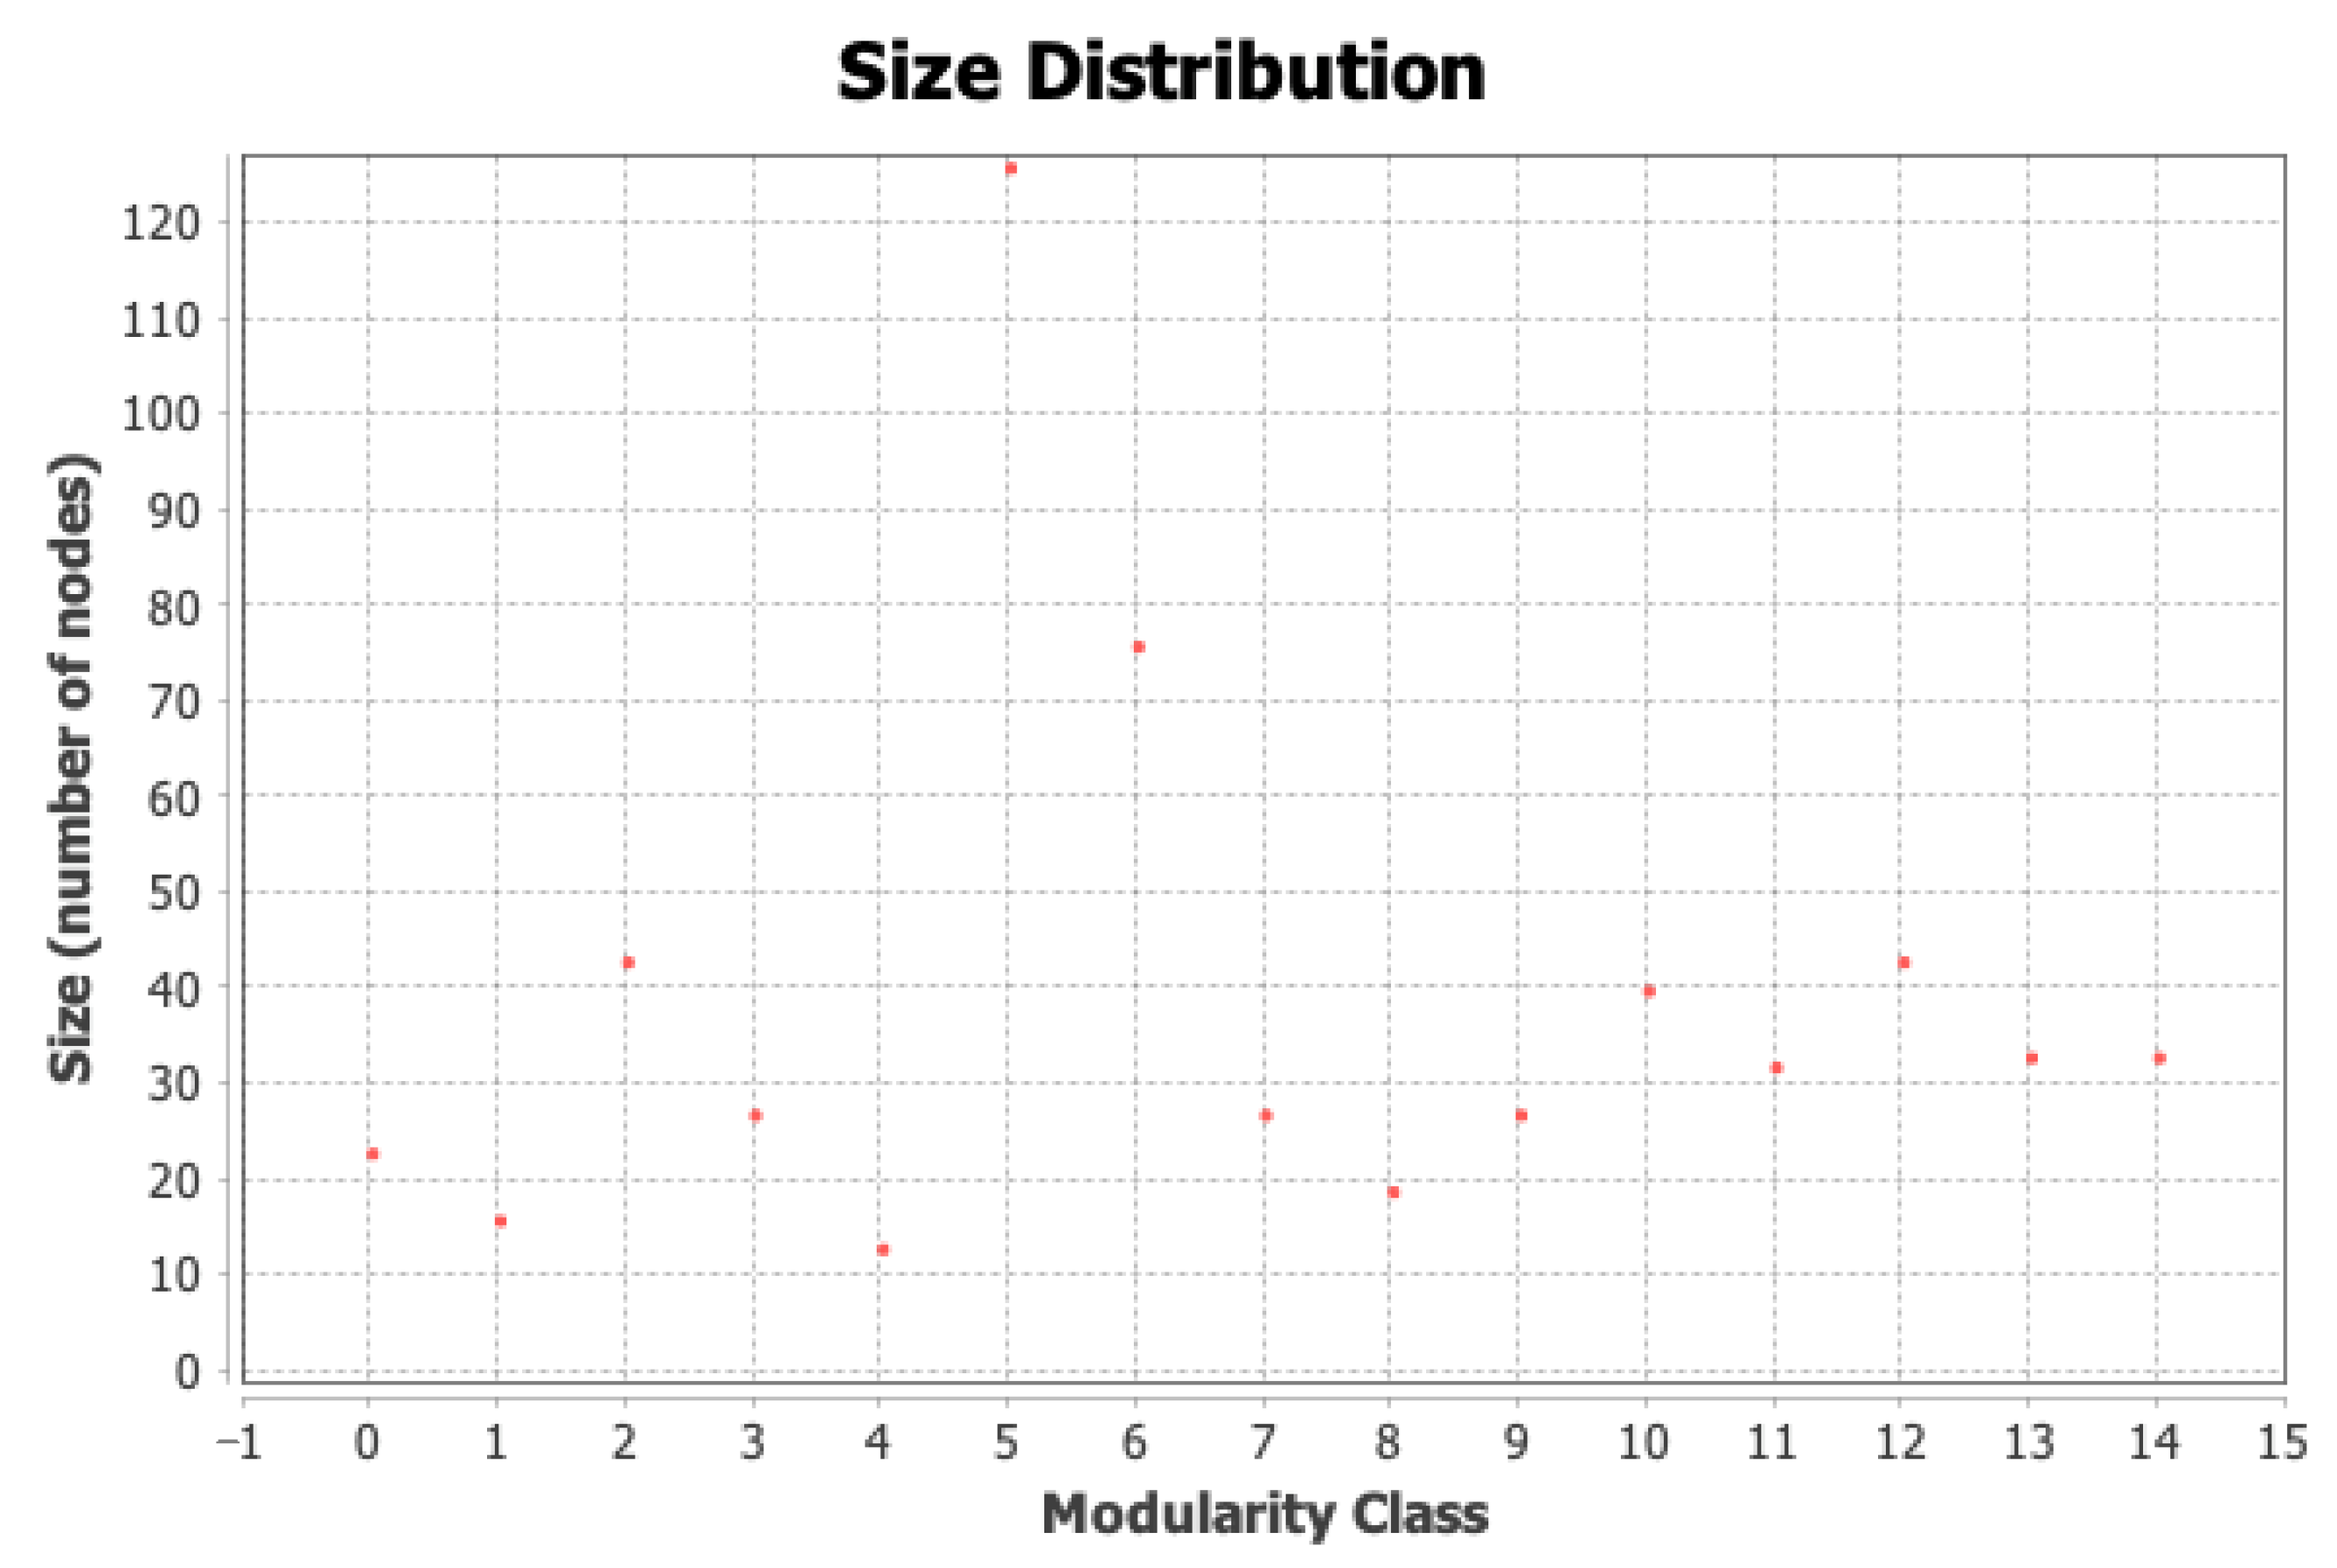
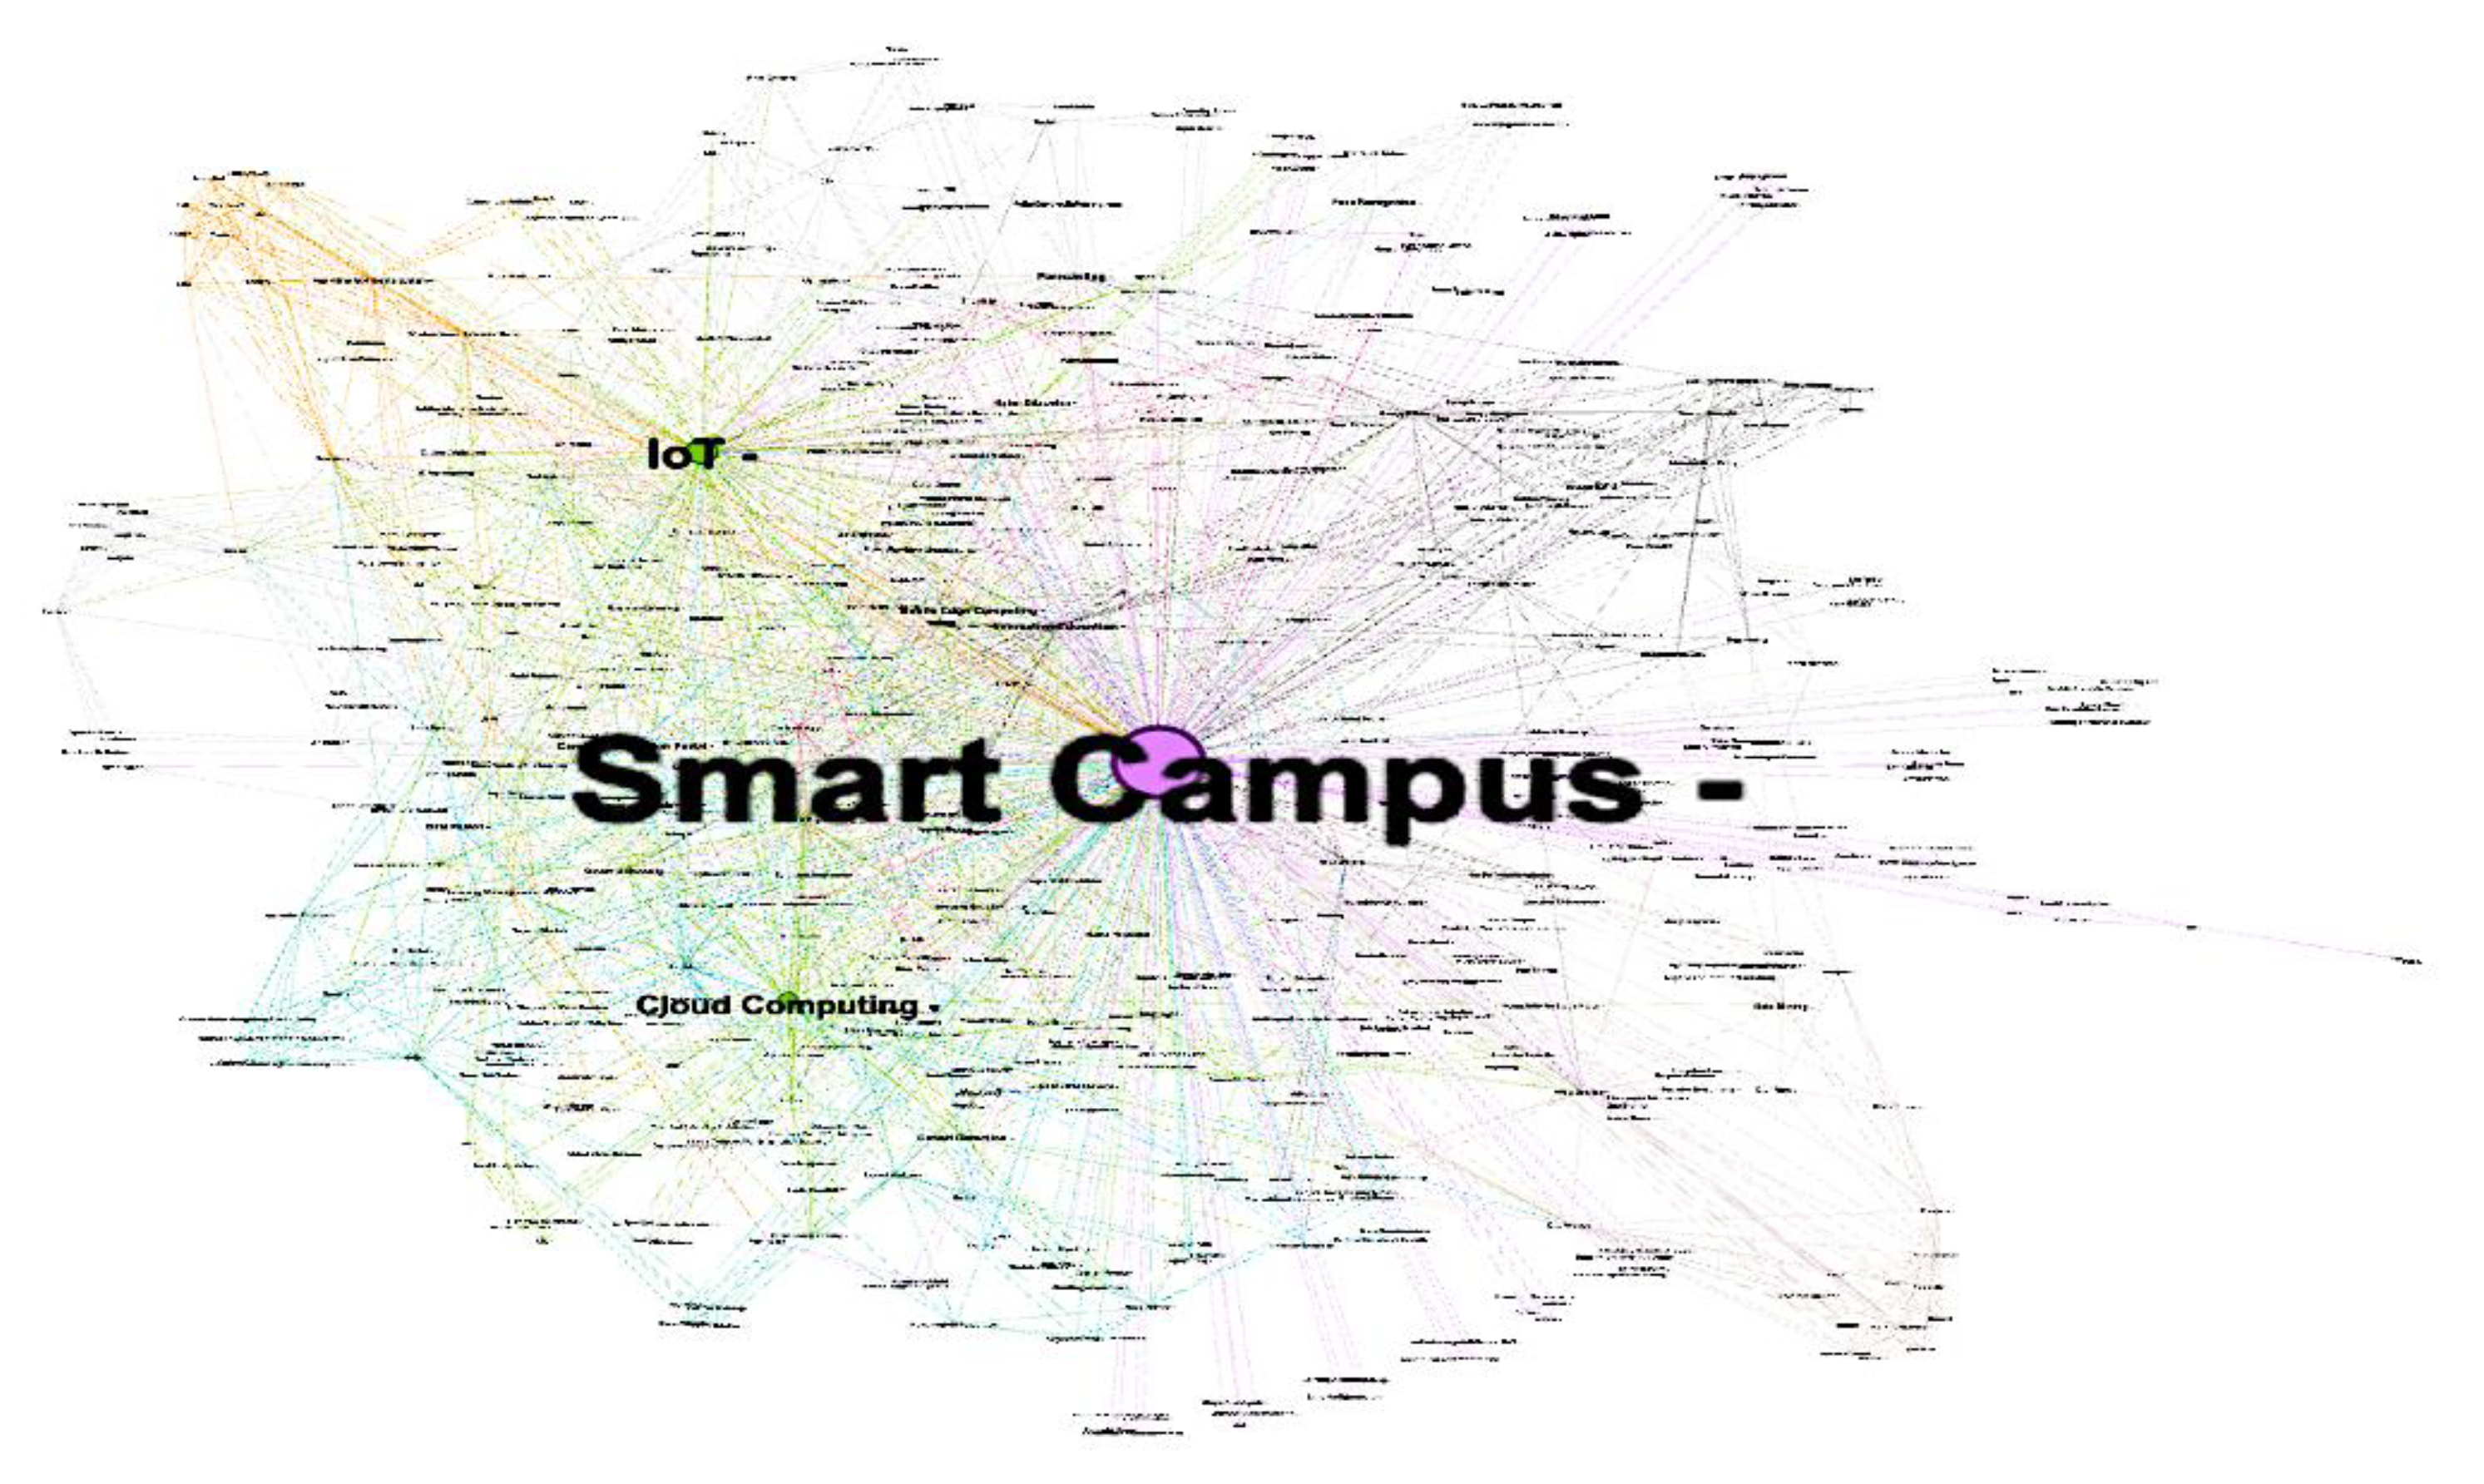
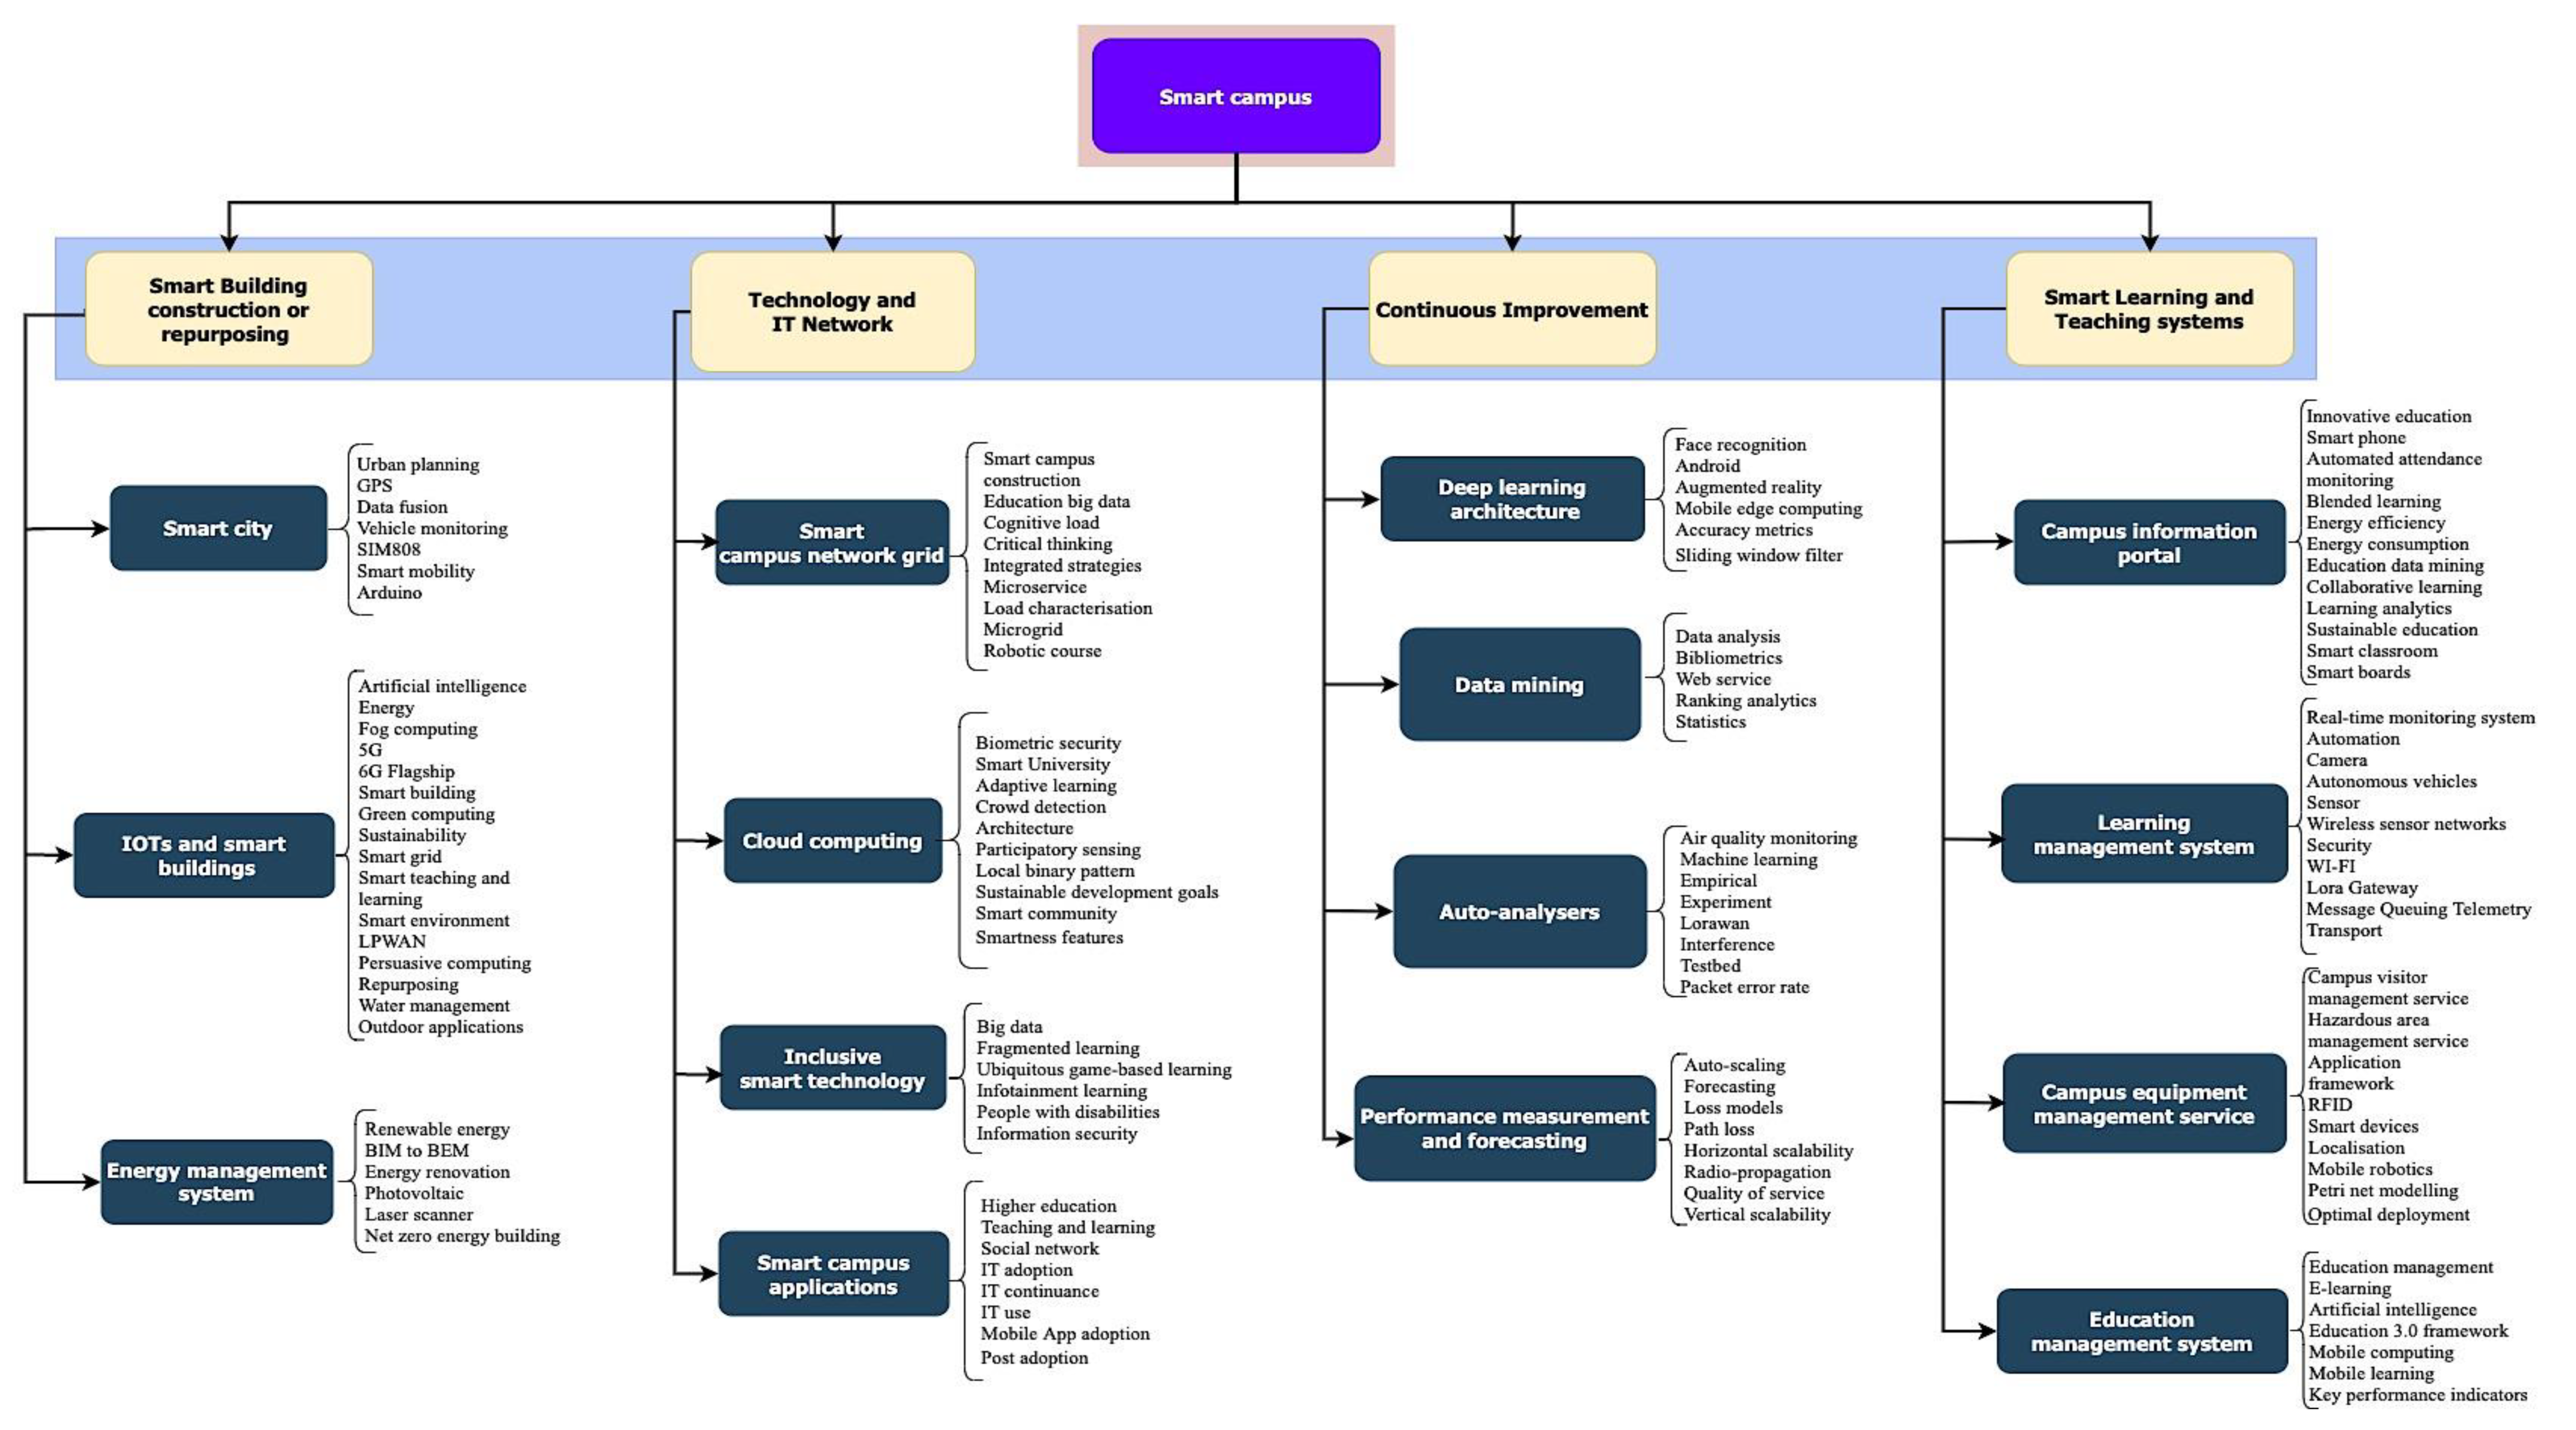
3.2.1. Categorising Smart Campus Infrastructure

Gephi is a social network analysis tool used to visualise the strength of connections between nodes [29]. The 578 nodes and 3217 edges produced the modularity class used to filter and rank nodes with a resolution of 0.480 accurately. Modularity class measures the strength of the network structure for commonalities and clusters [29,30]. The modularity analysis in this study produced 15 commonalities, as indicated in Figure 3. Correspondingly, the initial social network map as given in Figure 4 shows the combination of all 15 modularity classes.
The modularity class from Figure 3 was extracted and presented in Table 2 in terms of individual class percentage distribution in the network.
Modularity class 5 contains 21.80% of the network and has the cluster theme as being a smart campus network grid. Internet of things (IoTs) and smart buildings cluster theme is drawn from a 13.15% modularity class. 7.44% of the modularity produced the cloud computing cluster theme. Likewise, the campus information portal theme has a 7.44% modularity. Deep learning architecture and campus Equipment Management Services (CEMS) each have a percentage of 5.71%. Data mining is another major theme containing 5.54% of the modularity. Smart city, inclusive smart technology, and applications cluster themes each contribute 4.67% to the network. 3.29% of the cluster theme is the auto-analysers, and 3.29% of the network contains performance measurement and forecasting. The energy management system and education management system have 2.77% and 2.25% individually. Correspondingly, the cluster year of the publications in this analysis is between 2012 and 2020. The commonalities between the individual modularities from the social network map in Figure 4 used the most relevant harmonic closeness centrality of the edges connecting the nodes in each module.
The harmonic closeness centrality measures are a social network analysis modification of closeness centrality, which uses index values of the most central larger nodes [31,32]. Thus, the closeness of the nodes was measured, and indices were derived. Table 3, Table 4, Table 5, Table 6, Table 7, Table 8, Table 9, Table 10, Table 11, Table 12 and Table 13 present the harmonic closeness centrality measures for each node within a modularity network, the individual nodes forming the clusters and source of publications with the year. Section 4.1 and Section 4.2 discusses each smart campus cluster theme from Table 2 in order of their modularity numbers to support the framework in Section 5.

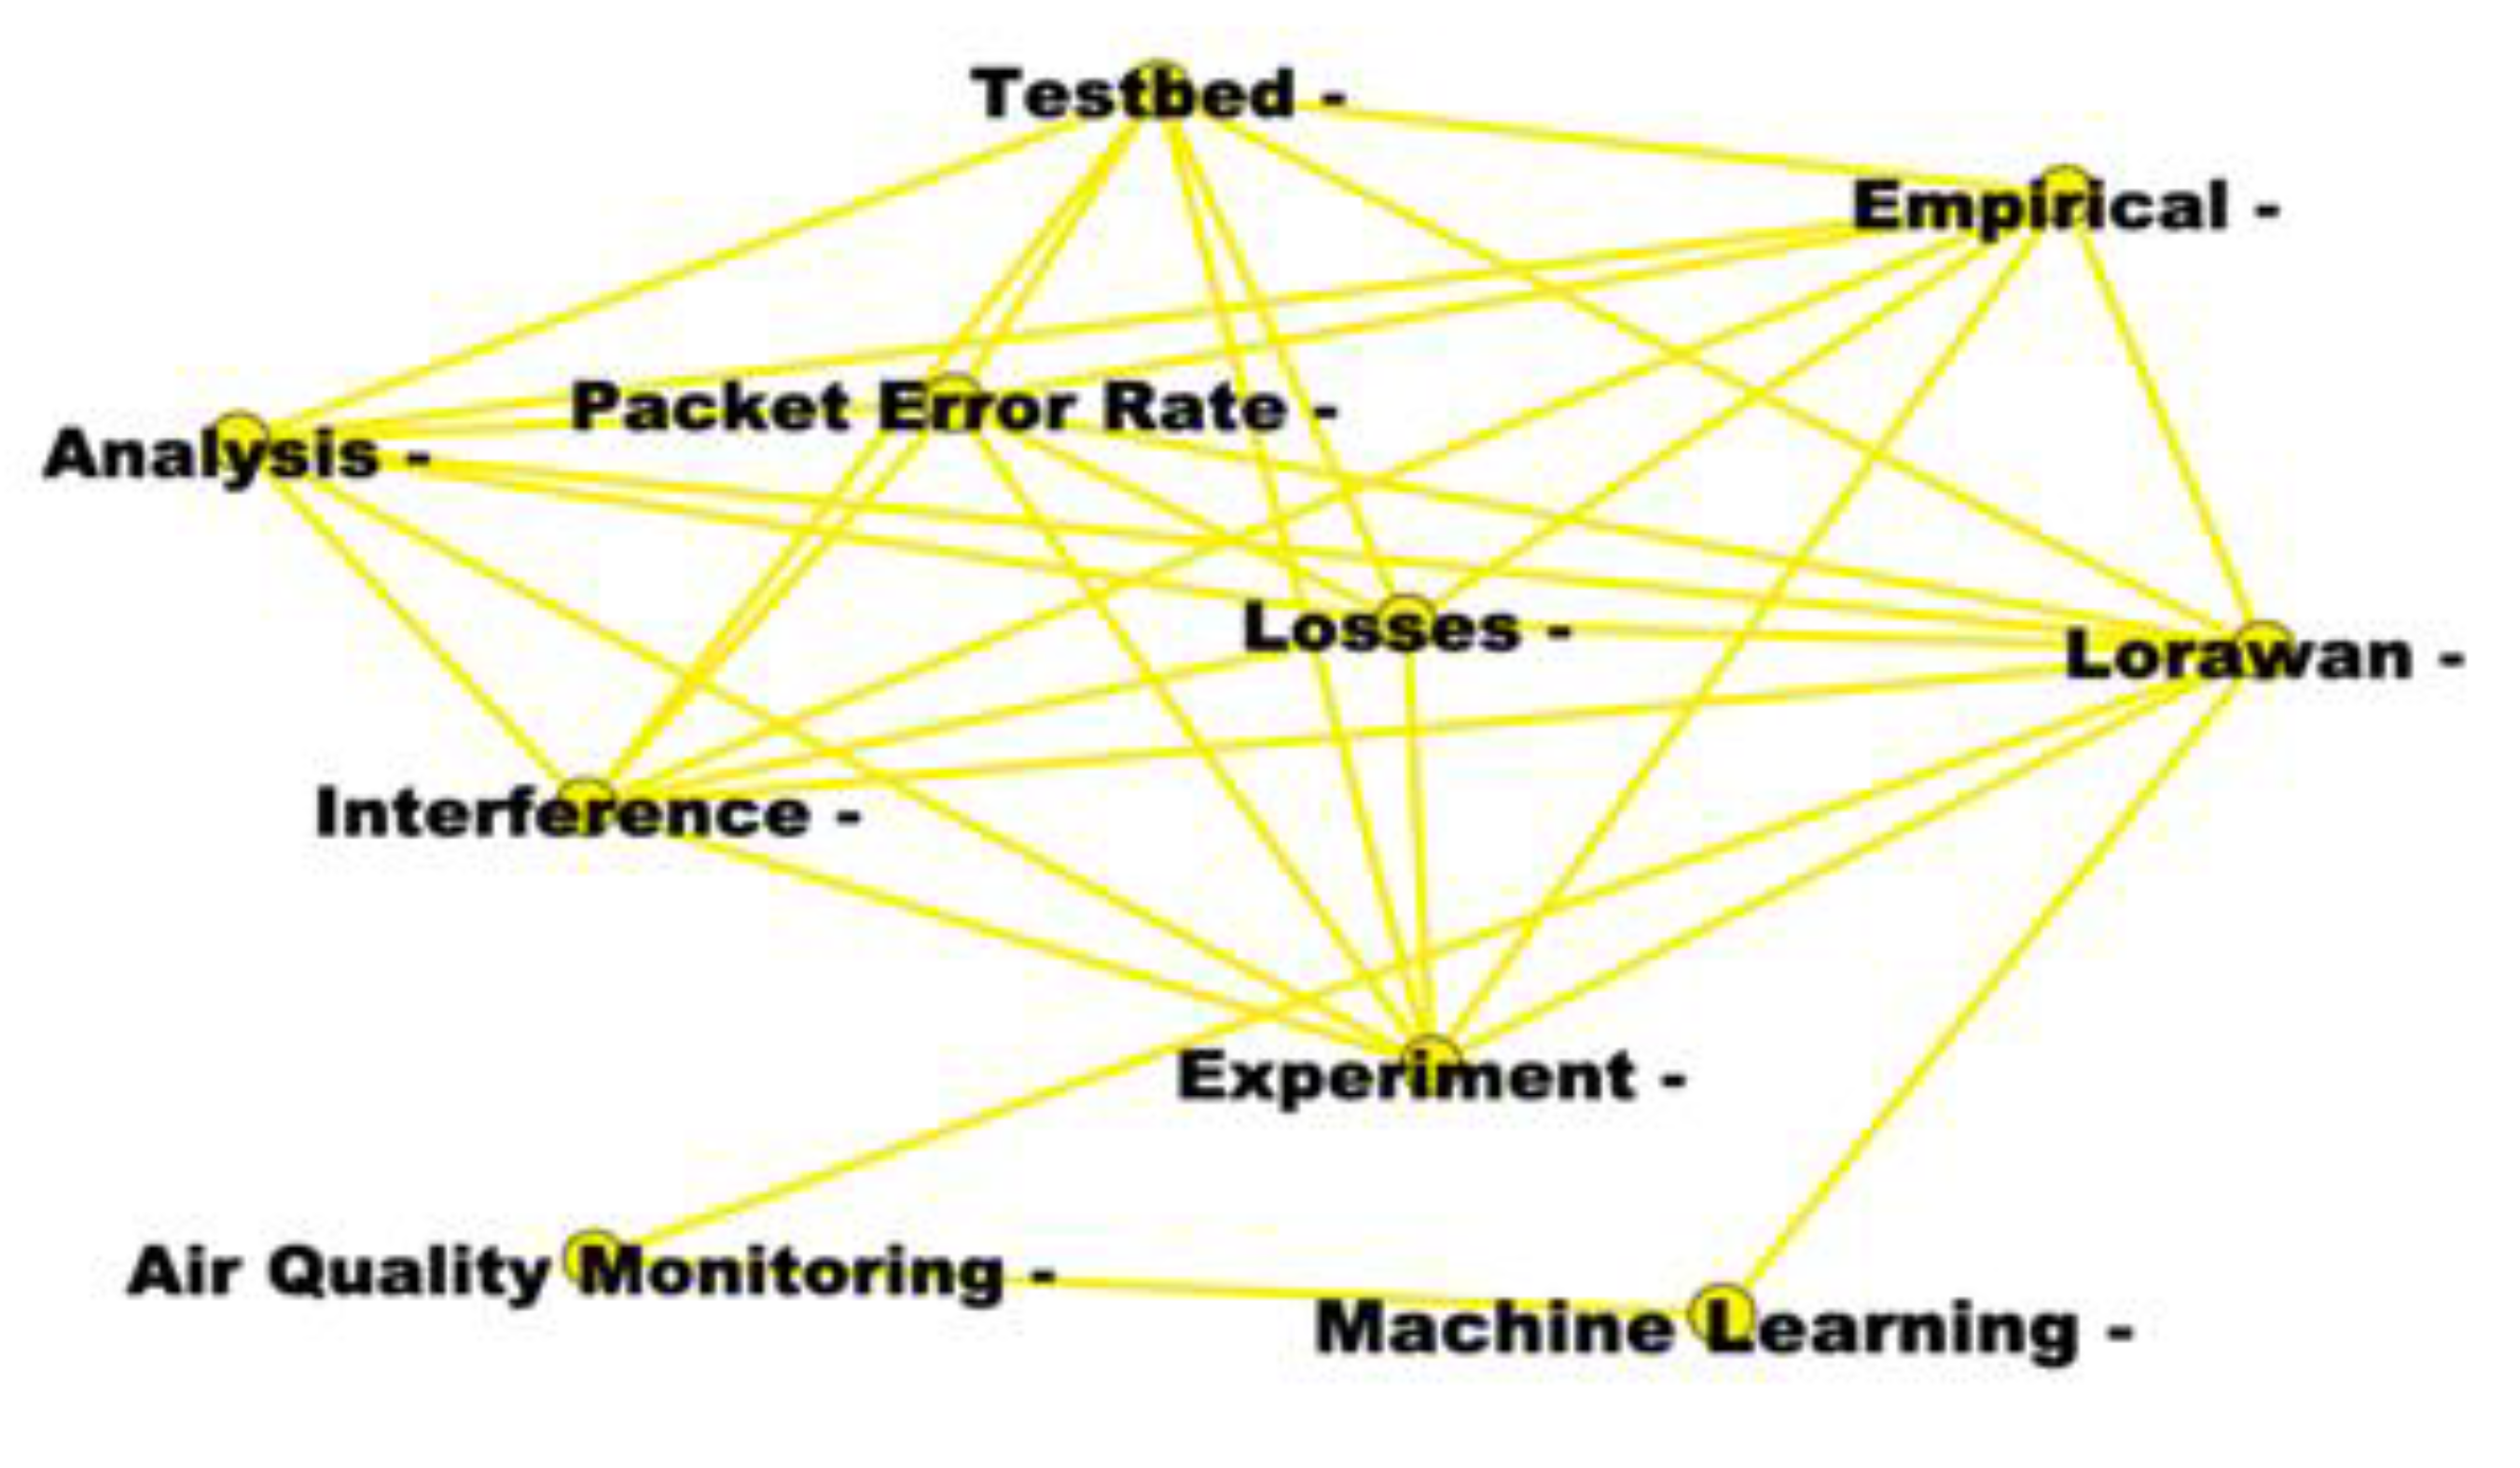
3.2.2. Auto-Analysers

The term “auto-analysers” was coined out of the nodes in modular class 0, which consists of air quality control monitoring with harmonic closeness centrality measure of 0.458, in campus buildings; the application of machine learning (0.422) and experiments (0.422) to understand the dynamic performance of buildings [1,21]. Six key journal articles and two conference papers produced the drivers for the auto-analyser theme and the average year of publication is 2018. Hence, auto-analysers are still new in smart campus research as indicated in Table 3. In terms of auto-analysers, the inclusion of unsupervised machine learning architecture to evaluate the performance of smart quality is an important component of smart buildings on campuses.
Machine learning, LoRaWAN and Air quality monitoring are the key drivers of the auto analysers group by appearing in 27.3%, 22.7% and 18.2% of relevant documents. Min-Allah and Alrashed [1] provided an example of a smart campus sketch where sensors designed by Google’s sidewalk Labs were deployed to monitor air quality in buildings on Campus in Saint Lois University, in the United States. As indicated in Table 3 and Figure 5, the packet error rate used to test the performance of an access receiver can be used along with testbeds to assess the performance of campus buildings [33,34]. The application of LoRaWaN, a point-to-multipoint networking protocol for encryption and identification, and wireless connecting battery-operated devices as a low power wide area network provided an opportunity to extract and assess data from air-quality monitoring devices [35]. Having a smart grid on campus with auto-analysers provides a foundation for smart campus development.

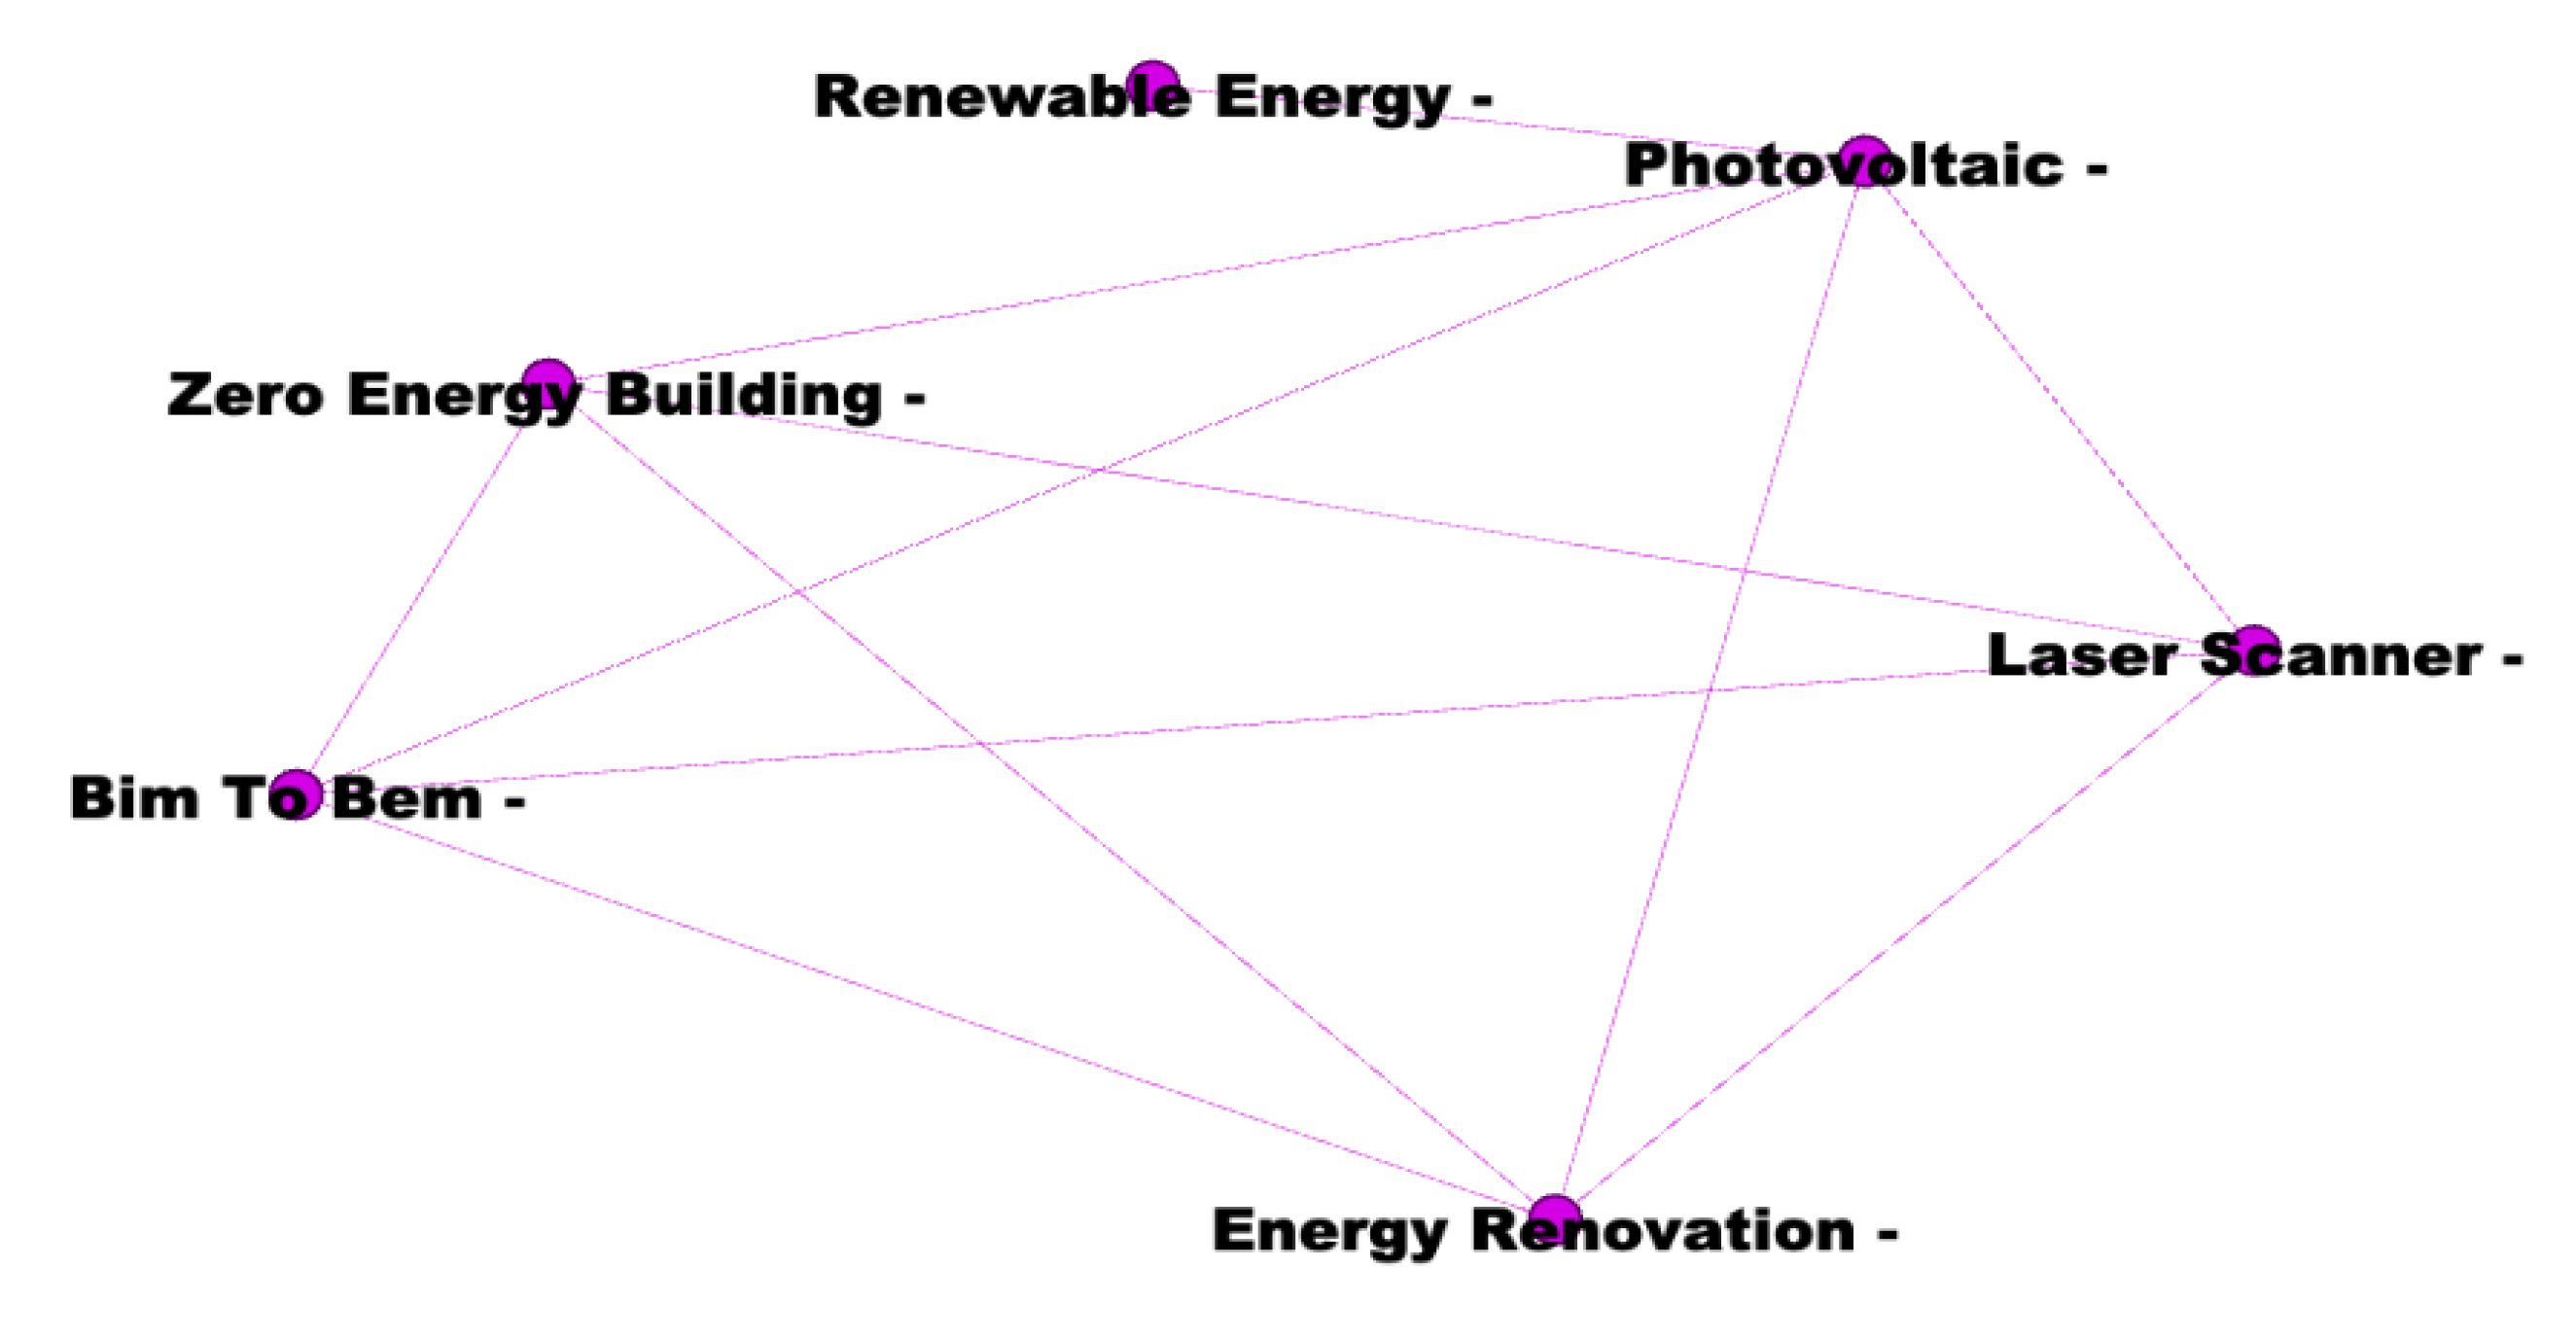
3.2.3. Energy Management System (EMS)

The development of auto-analysers as part of a smart campus network grid can be integrated with an energy management system (EMS). The EMS cluster theme was produced from modularity class 1, as shown in Figure 6 and Table 4. In Table 4, the dominant drivers are renewable energy with harmonic closeness centrality measure of 0.396; BIM to BEM (0.399); Photovoltaic (0.399); energy renovation (0.397); laser scanner (0.394); and net-zero energy building (0.359). All the publications that produced this theme were journals except for one conference article and the cluster year of publication is 2015.
Renewable energy and Photovoltaic devices as the main drivers of the energy management system continually recurred in 25% of analysed documents for this group. Net-zero energy buildings consume energy created on-site, mostly through renewable sources [56,57]. Net-zero energy buildings or retrofitted existing buildings on campuses can use photovoltaic solar panels and renovate an existing building to become energy efficient [58]. In achieving an EMS system on campus, building information modelling (BIM) can be applied in building energy model (BEM) when retrofitting or renovating existing campus buildings [59,60]. EMS can work effectively in a smart campus grid where there are machine learning-enabled analysers and cloud computing.

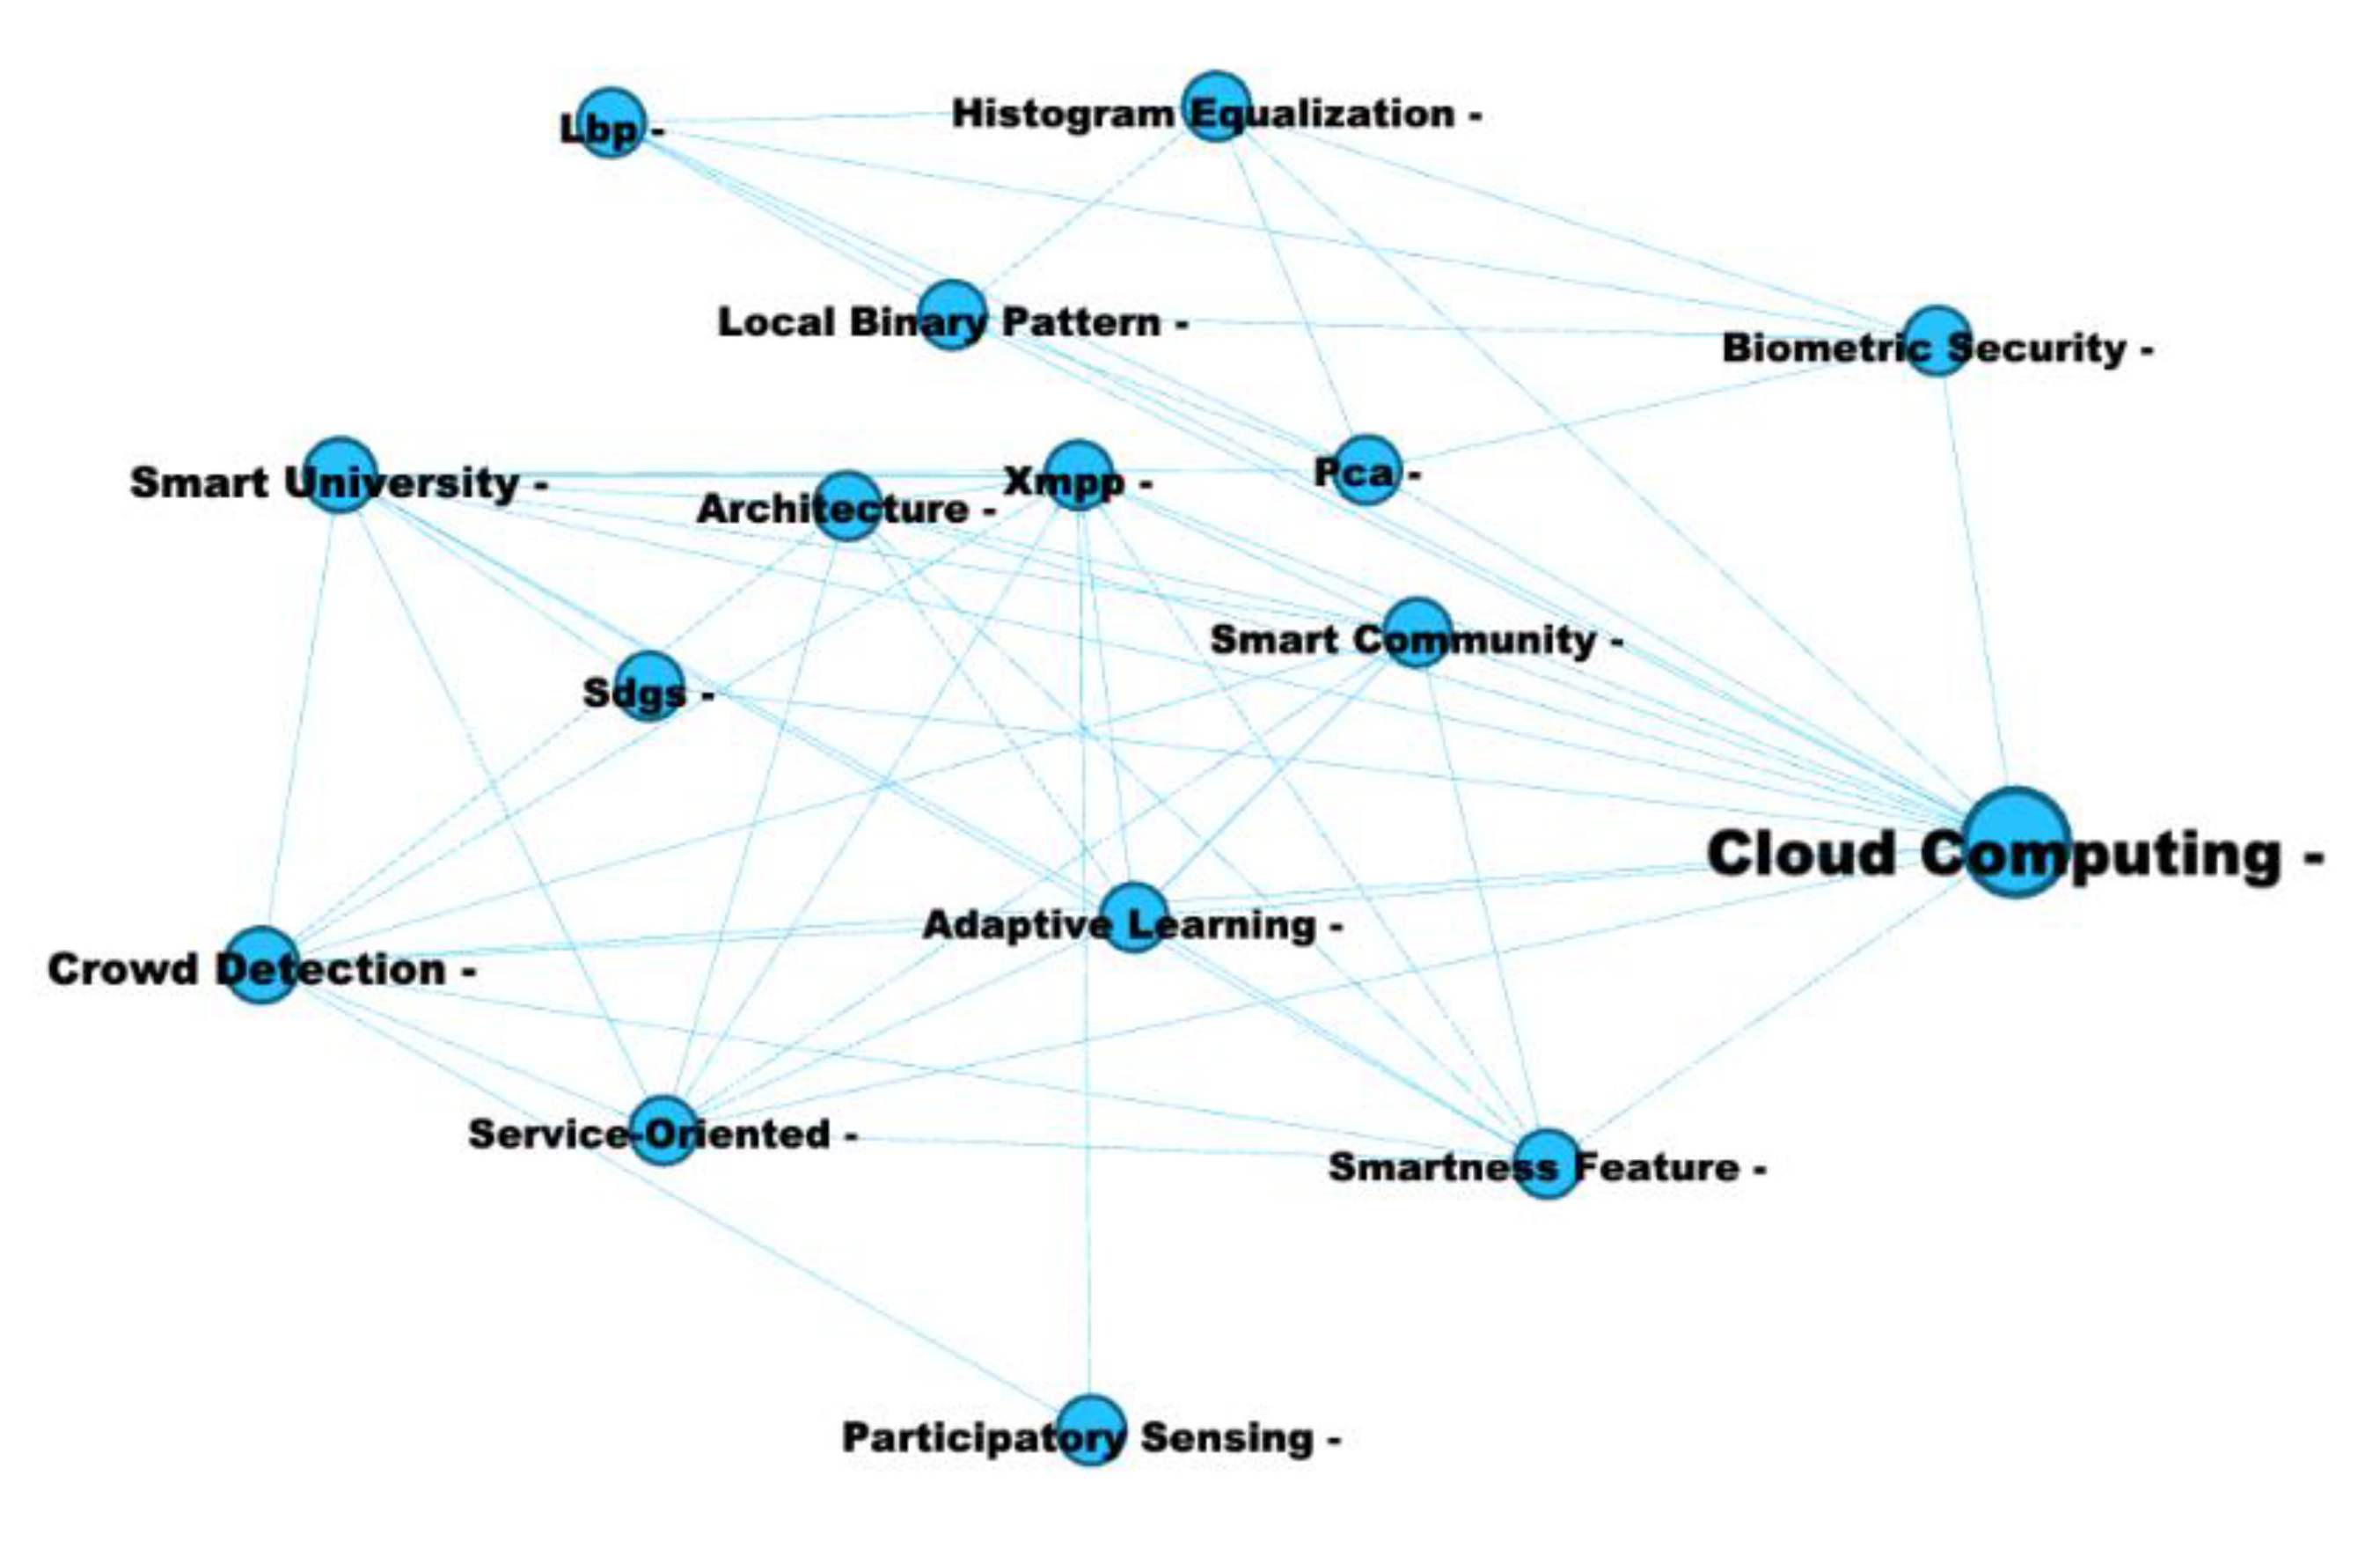
3.2.4. Cloud Computing
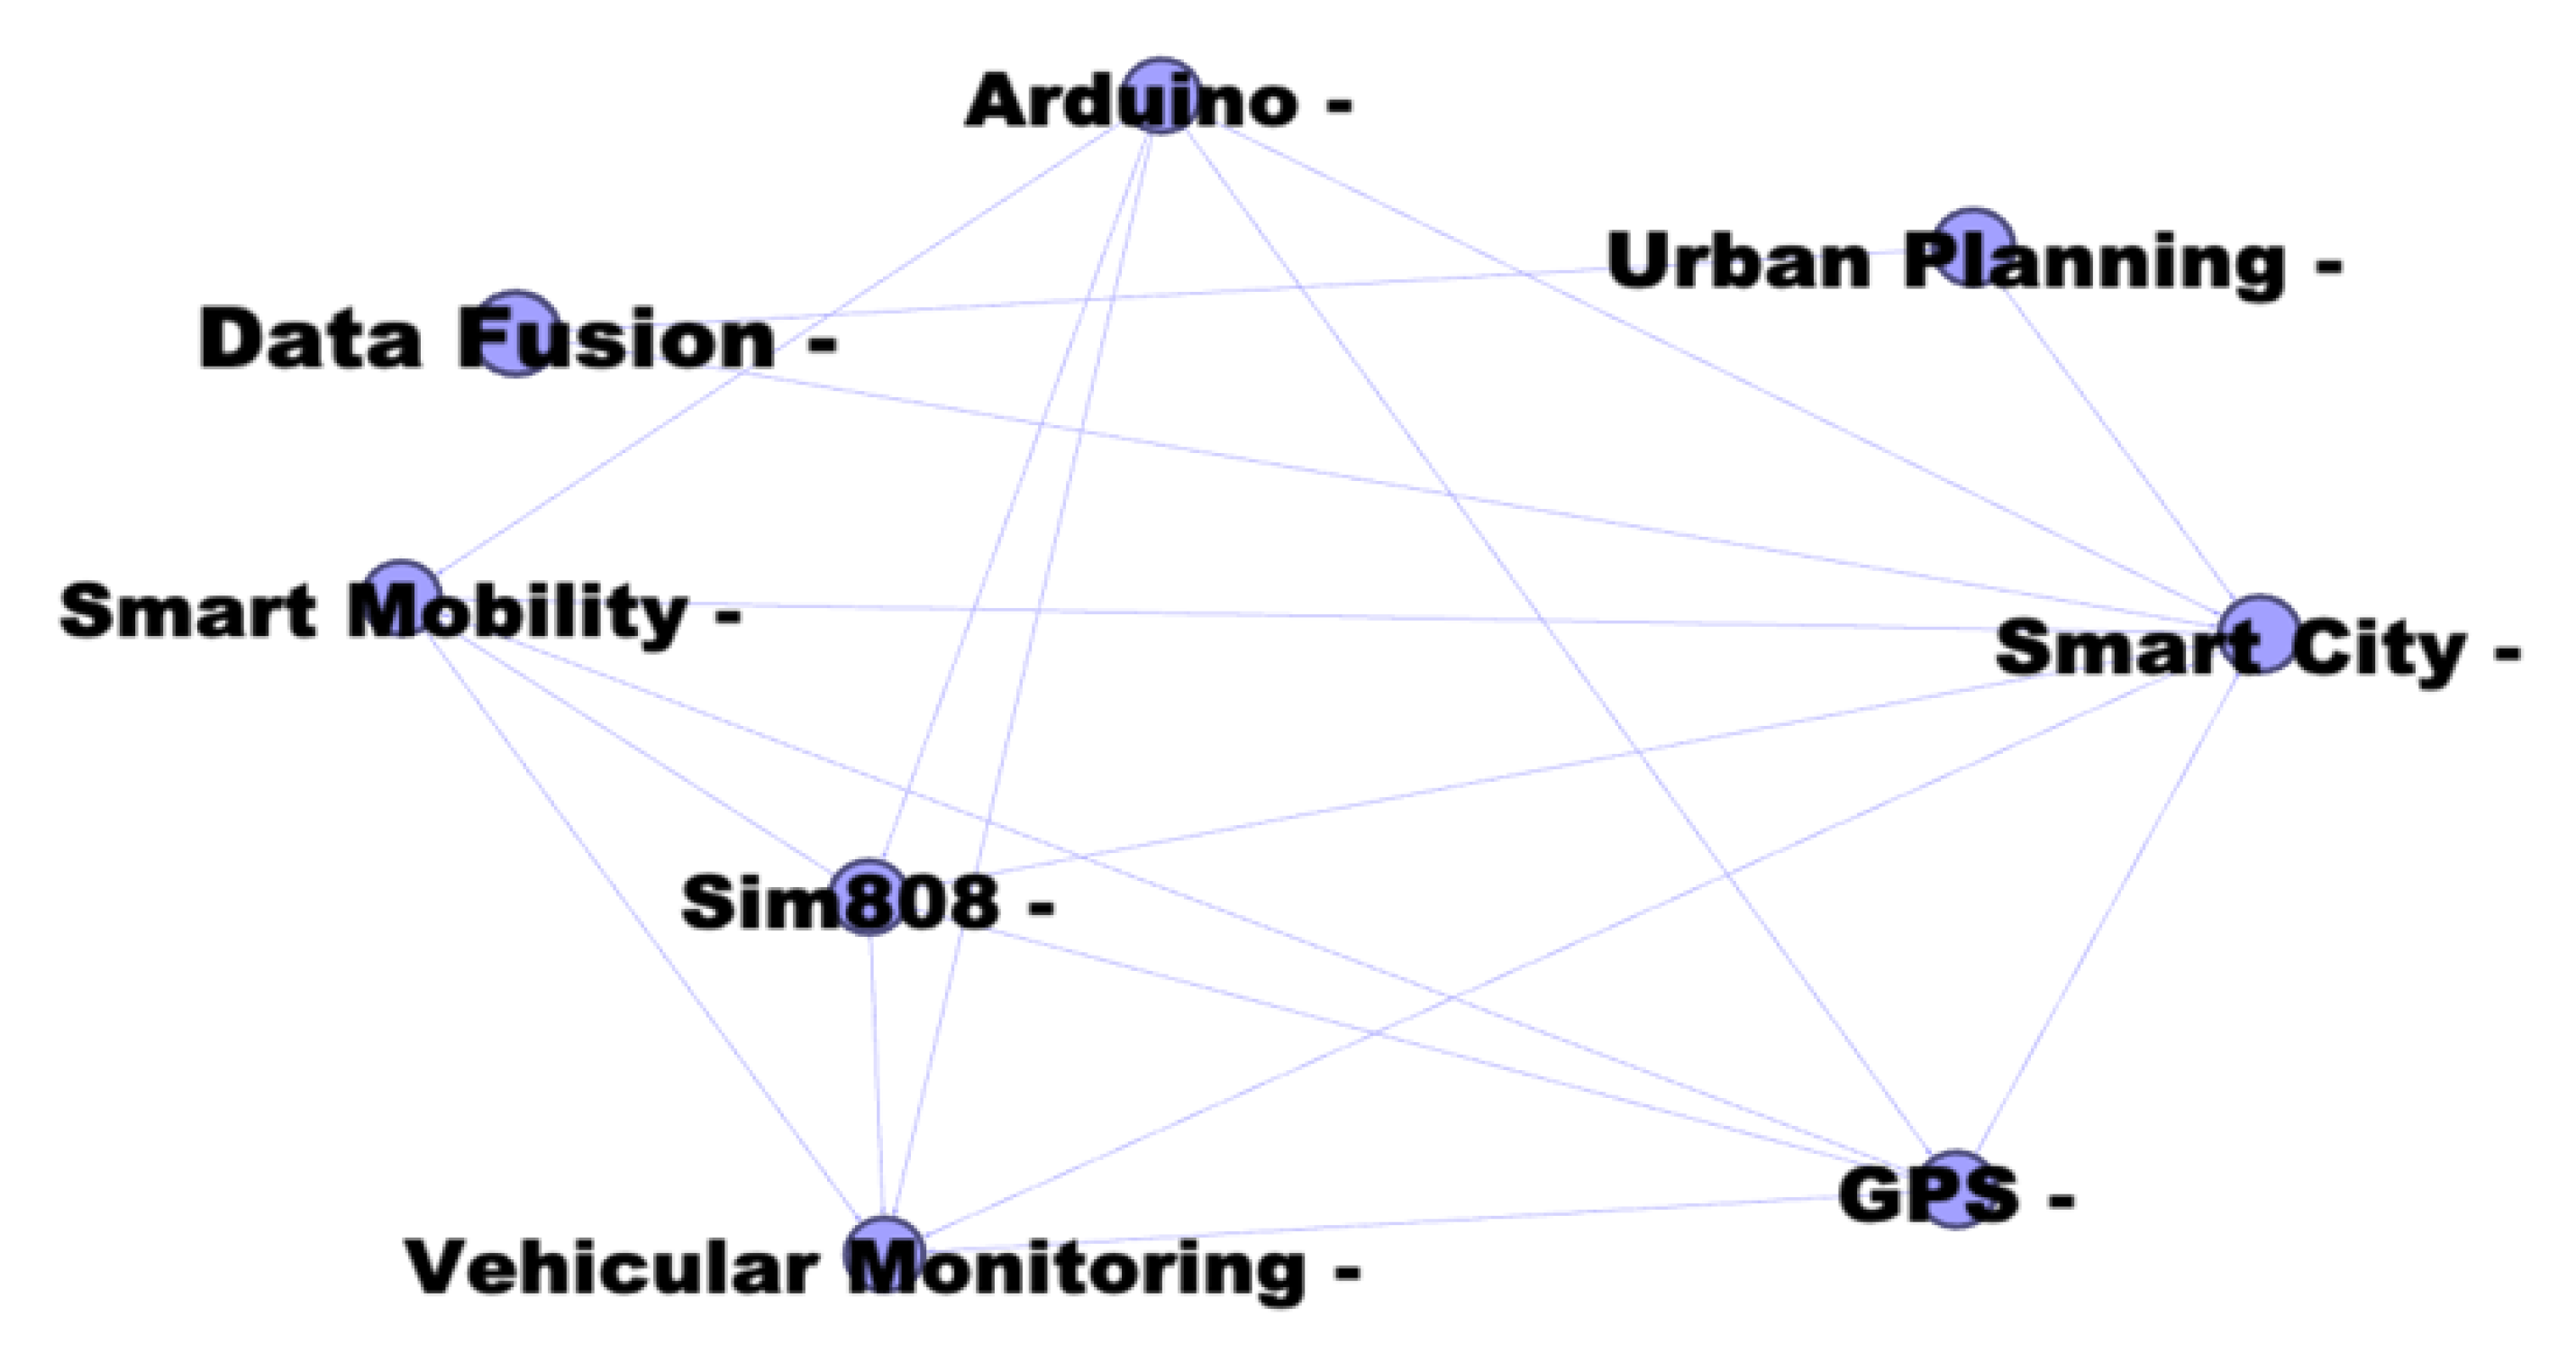
Cloud computing is a major component of any smart campus [9,10,39]. Cloud computing as indicated in Figure 7 is an unmanned storage database that is readily available to multiple users [40,41]. The creation of this cluster theme made use of important drivers such as biometric security with harmonic closeness centrality of 0.420; smart university, 0.442; adaptive learning, 0.478; crowd detection, 0.478; architecture, 0.474; Participatory sensing, 0.401; Local binary pattern, 0.396; Sustainable development goals (SDGs), 0.360; Smart community; and smart features, 0.358. The theme also came from a cluster of conference papers published mostly in the year 2020.
Cloud computing on campuses provides a strong foundation for smart cities. The smart university is the most predominant indicator of cloud computing through appearing on more than 32% of relevant documents to cloud computing, as shown in Table 5. Cloud computing is integral to achieving SDGs where cleaner and smart campus communities can be developed as prototypes of smart cities. Cloud computing also depends on the architecture and construction of smart university buildings, and can be useful in storing data for crowd detection and enhancing the smartness of campus buildings.

3.2.5. Smart City

The existence of a smart city makes it easier for the development of a smart campus. Figure 8 and Table 6 combined the drivers or urban planning with the harmonic closeness centrality indices of 0.394; Arduino, 0.400; global positioning system (GPS), 0.414; data fusion, 0.459; vehicle monitoring, 0.434; SIM808, 0.396; and smart mobility, 0.311. The publications arose mostly from a cluster of conference papers produced mostly in 2018. Smart cities’ themes are still very recent in the context of smart campus studies.
As presented in Table 6, Data fusion (25%), Smart mobility (18.8%) and GPS (18.8) are the significant drivers of the Smart city cluster, as shown in Table 6. The main feature of smart cities is the tracking and reporting system available to monitor vehicular movement and the urban environment. SIM808 combined the features of GPS with and complete quad-band global system for mobile communications to track the location of vehicles and people instantaneously [73,74,75,76]. SIM808 is a smart grid along with Arduino capable of creating interactive electronic objects such as text, audio, animation and other forms of visualisation that are important to smart city development [74,75,76]. A smart campus can exist seamlessly within a smart city if the local authority provides the required elements and infrastructure.

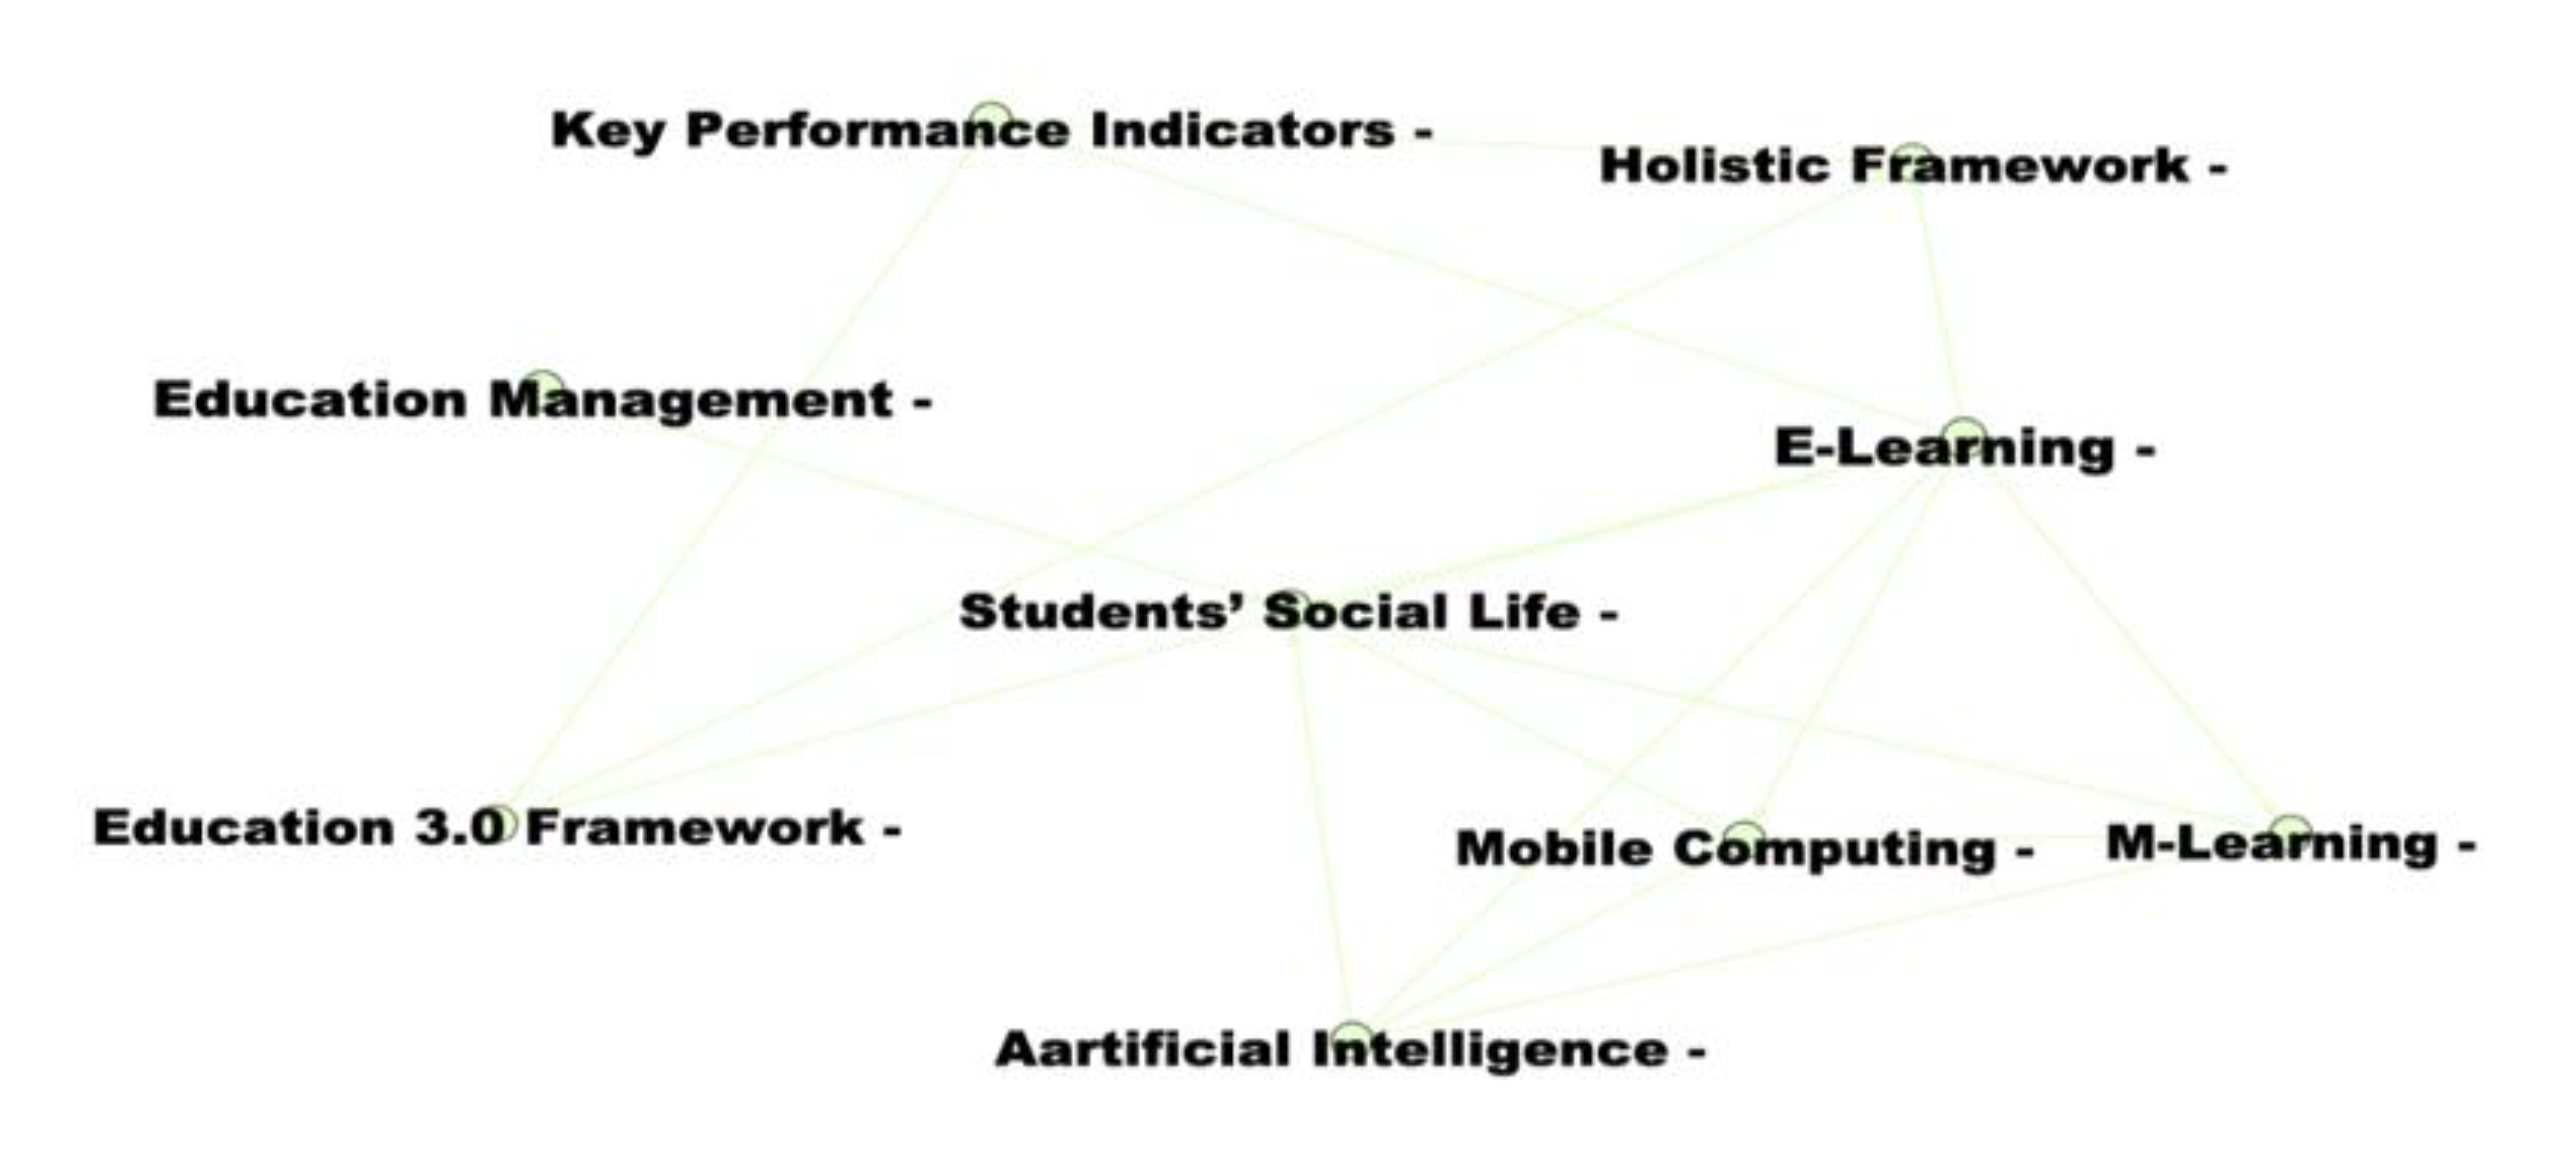
3.2.6. Education Management System

The education management system was produced from the nodes in Figure 9 (drivers in Table 7) from mostly conference papers published in 2012. The drivers with harmonic closeness centrality indices are education management, 0.399; E-learning, 0.473; artificial intelligence, 0.412; education 3.0 framework, 0.396; mobile computing, 0.393; mobile learning, 0.395; and key performance indicators, 0.390.
An education management system in a smart campus is an important component of smart infrastructure procurement. E-learning, Mobile computing and Artificial intelligence are the critical indicators of the education management system by being recapped on 30.8%, 23.1%, and 9.2% of related documents to the education management system. A smart campus requires mobile learning and computing adoption because students and academics already have smart mobile devices [15,81,82,83]. Therefore, the need to create an educational framework that identifies key performance indicators of smart and electronic learning hinged on artificial intelligence and mobile computing.

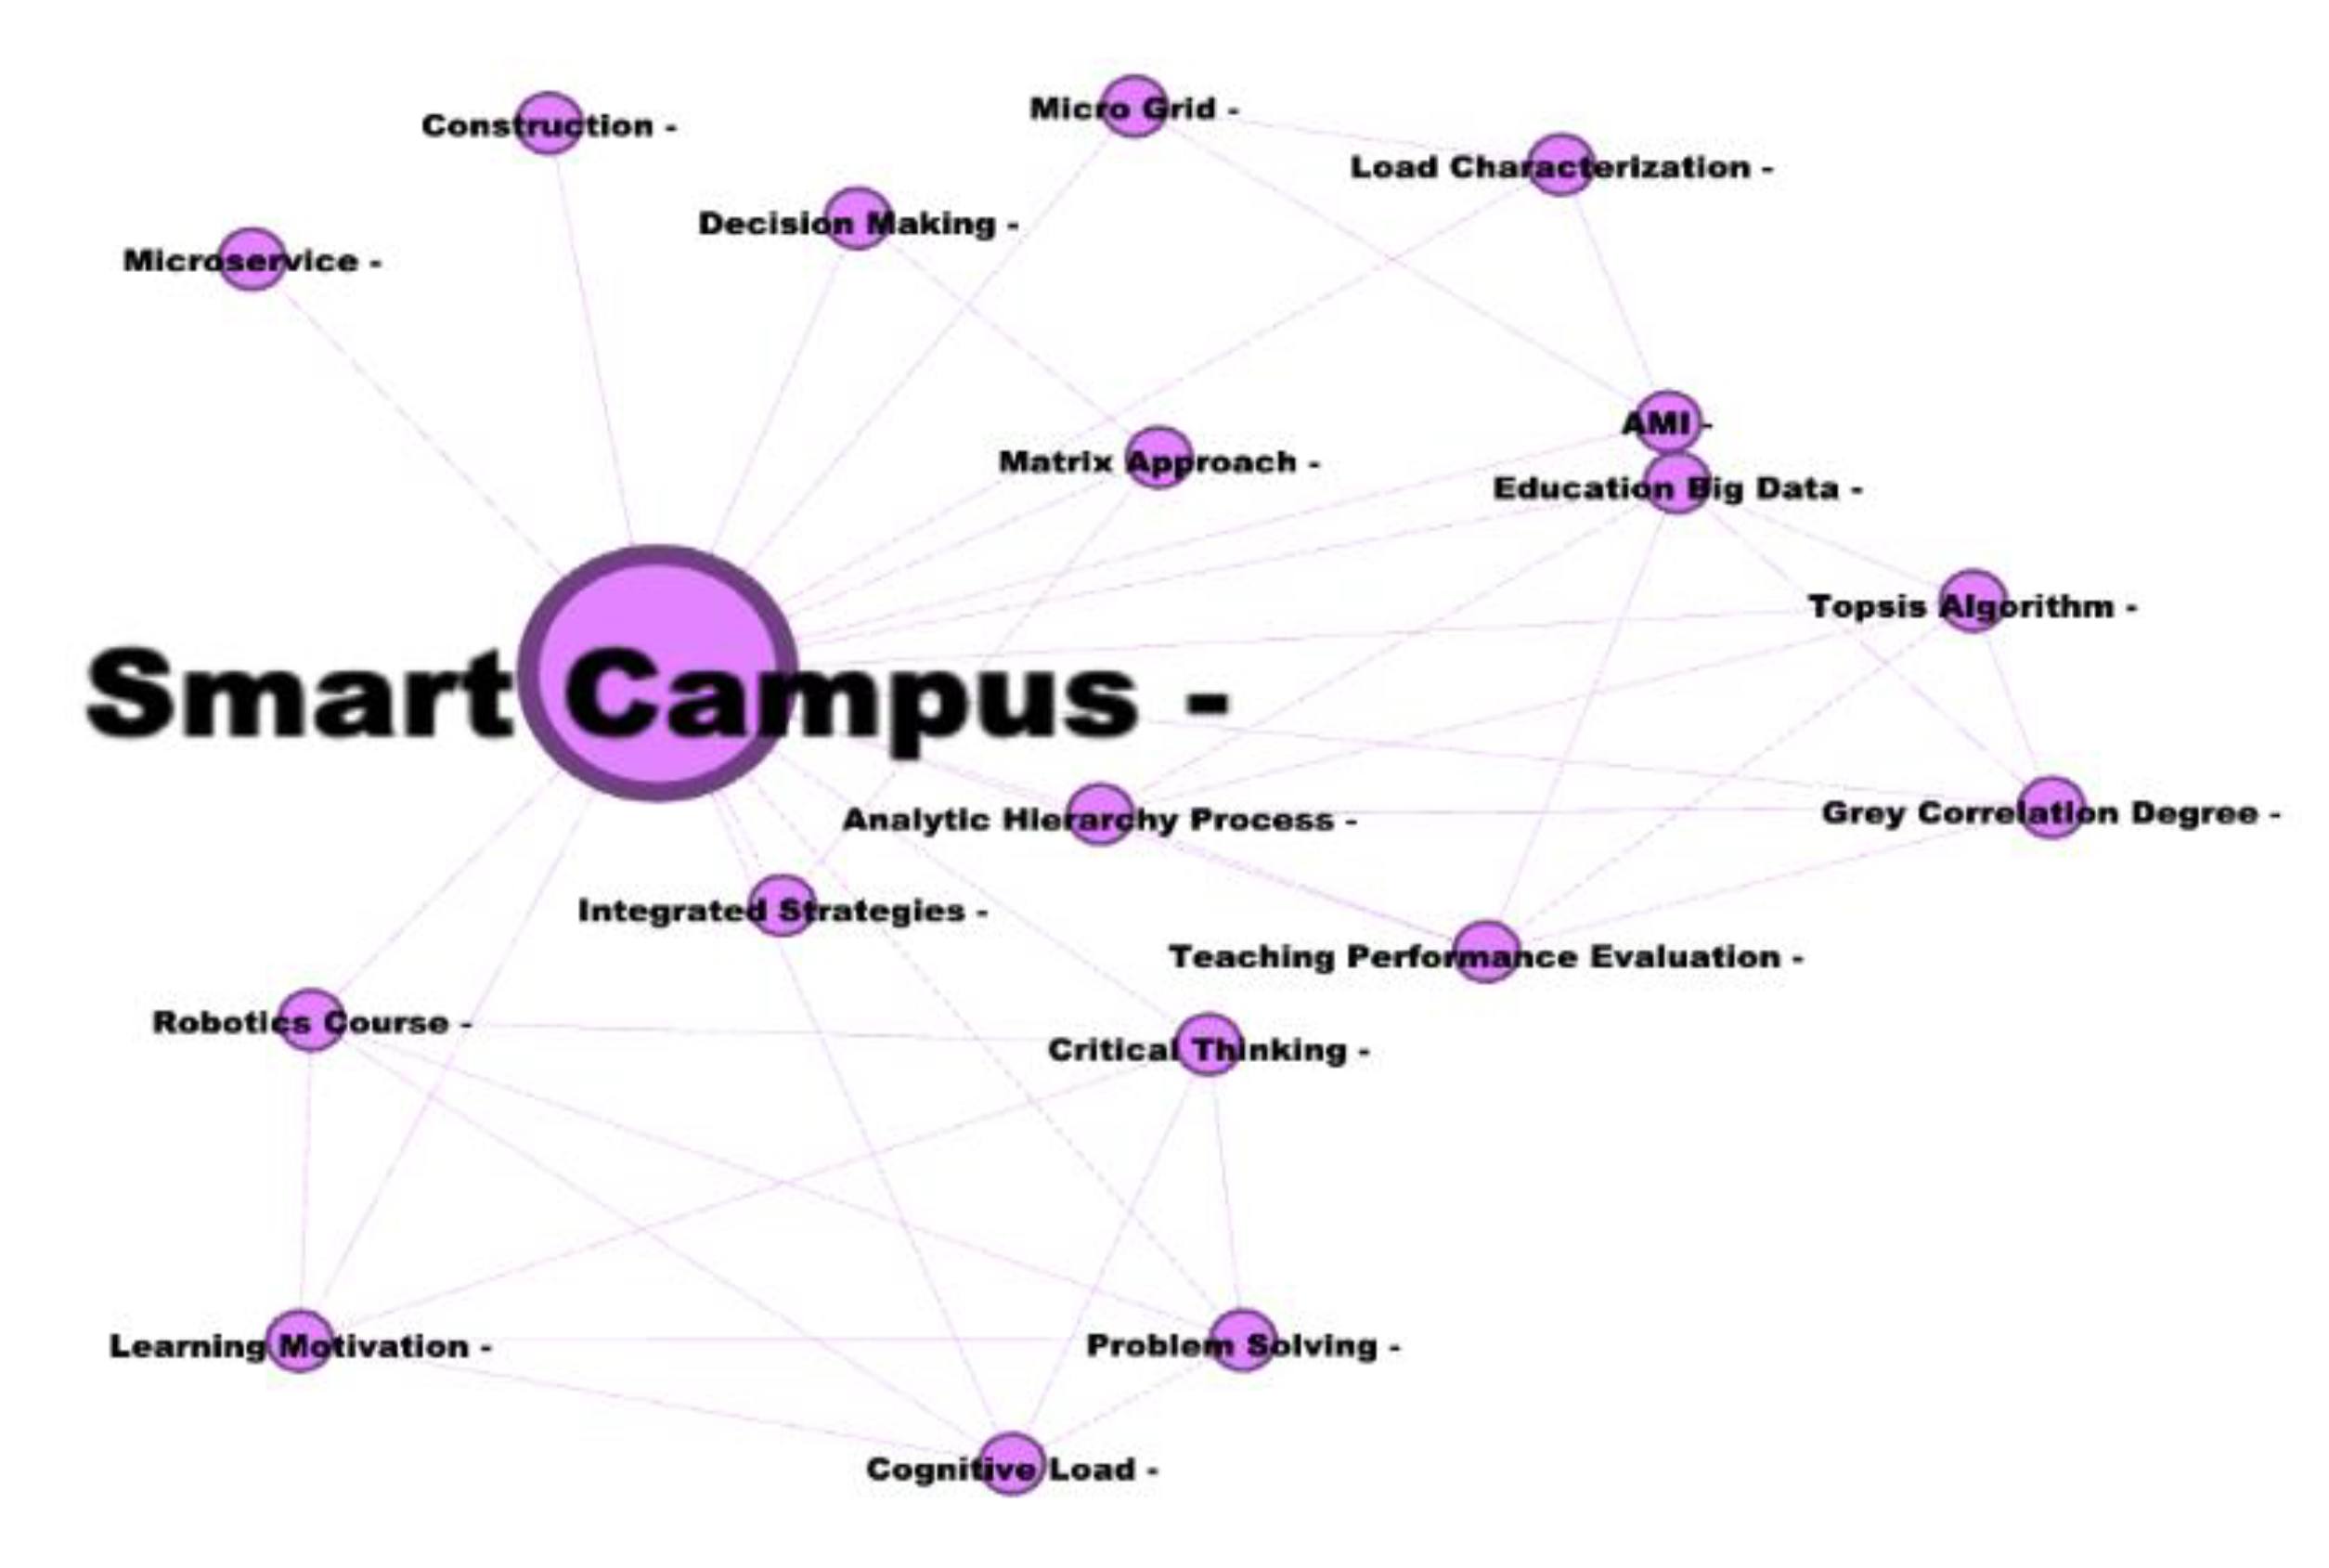
3.2.7. Smart Campus Network Grid

From the initial network analysis in Figure 4, the smart campus is the largest node. Relatedly, Figure 10 extracted the network analysis for modular class 5. The smart campus network grid in Table 8 depends on the smart campus construction, which is supported by the harmonic closeness centrality indices of 0.683 and 0.398 for smart campus and construction correspondingly. The cluster contributing articles are mainly from conference papers published within 2018.
As shown in Table 8, Smart campus appeared on 95.3% of the relevant articles and papers to the Smart campus network grid, which revealed the critical role of smart campus as the prime indicator of this group among other nine indicators. The smart campus network grid is the bedrock of creating a smart campus. Learning institutions need to develop smart buildings on campus [5,57,88,90,93,94]. Betancur et al. [95] suggested social participation in smart cities development. In this instance, end users are considered essential in drawing out plans for smart communities. Students on smart campuses constitute most of the end-user population on campus. Students use smartphones, and it will be easier for learning institutions to adopt the approach of a microgrid, microservice, education big data extraction and analysis. The inclusion of courses such as robotics courses and research can also foster the attainment of a smart campus. Internet of things cannot be separated from a smart campus network grid and will be discussed in the subsequent section.

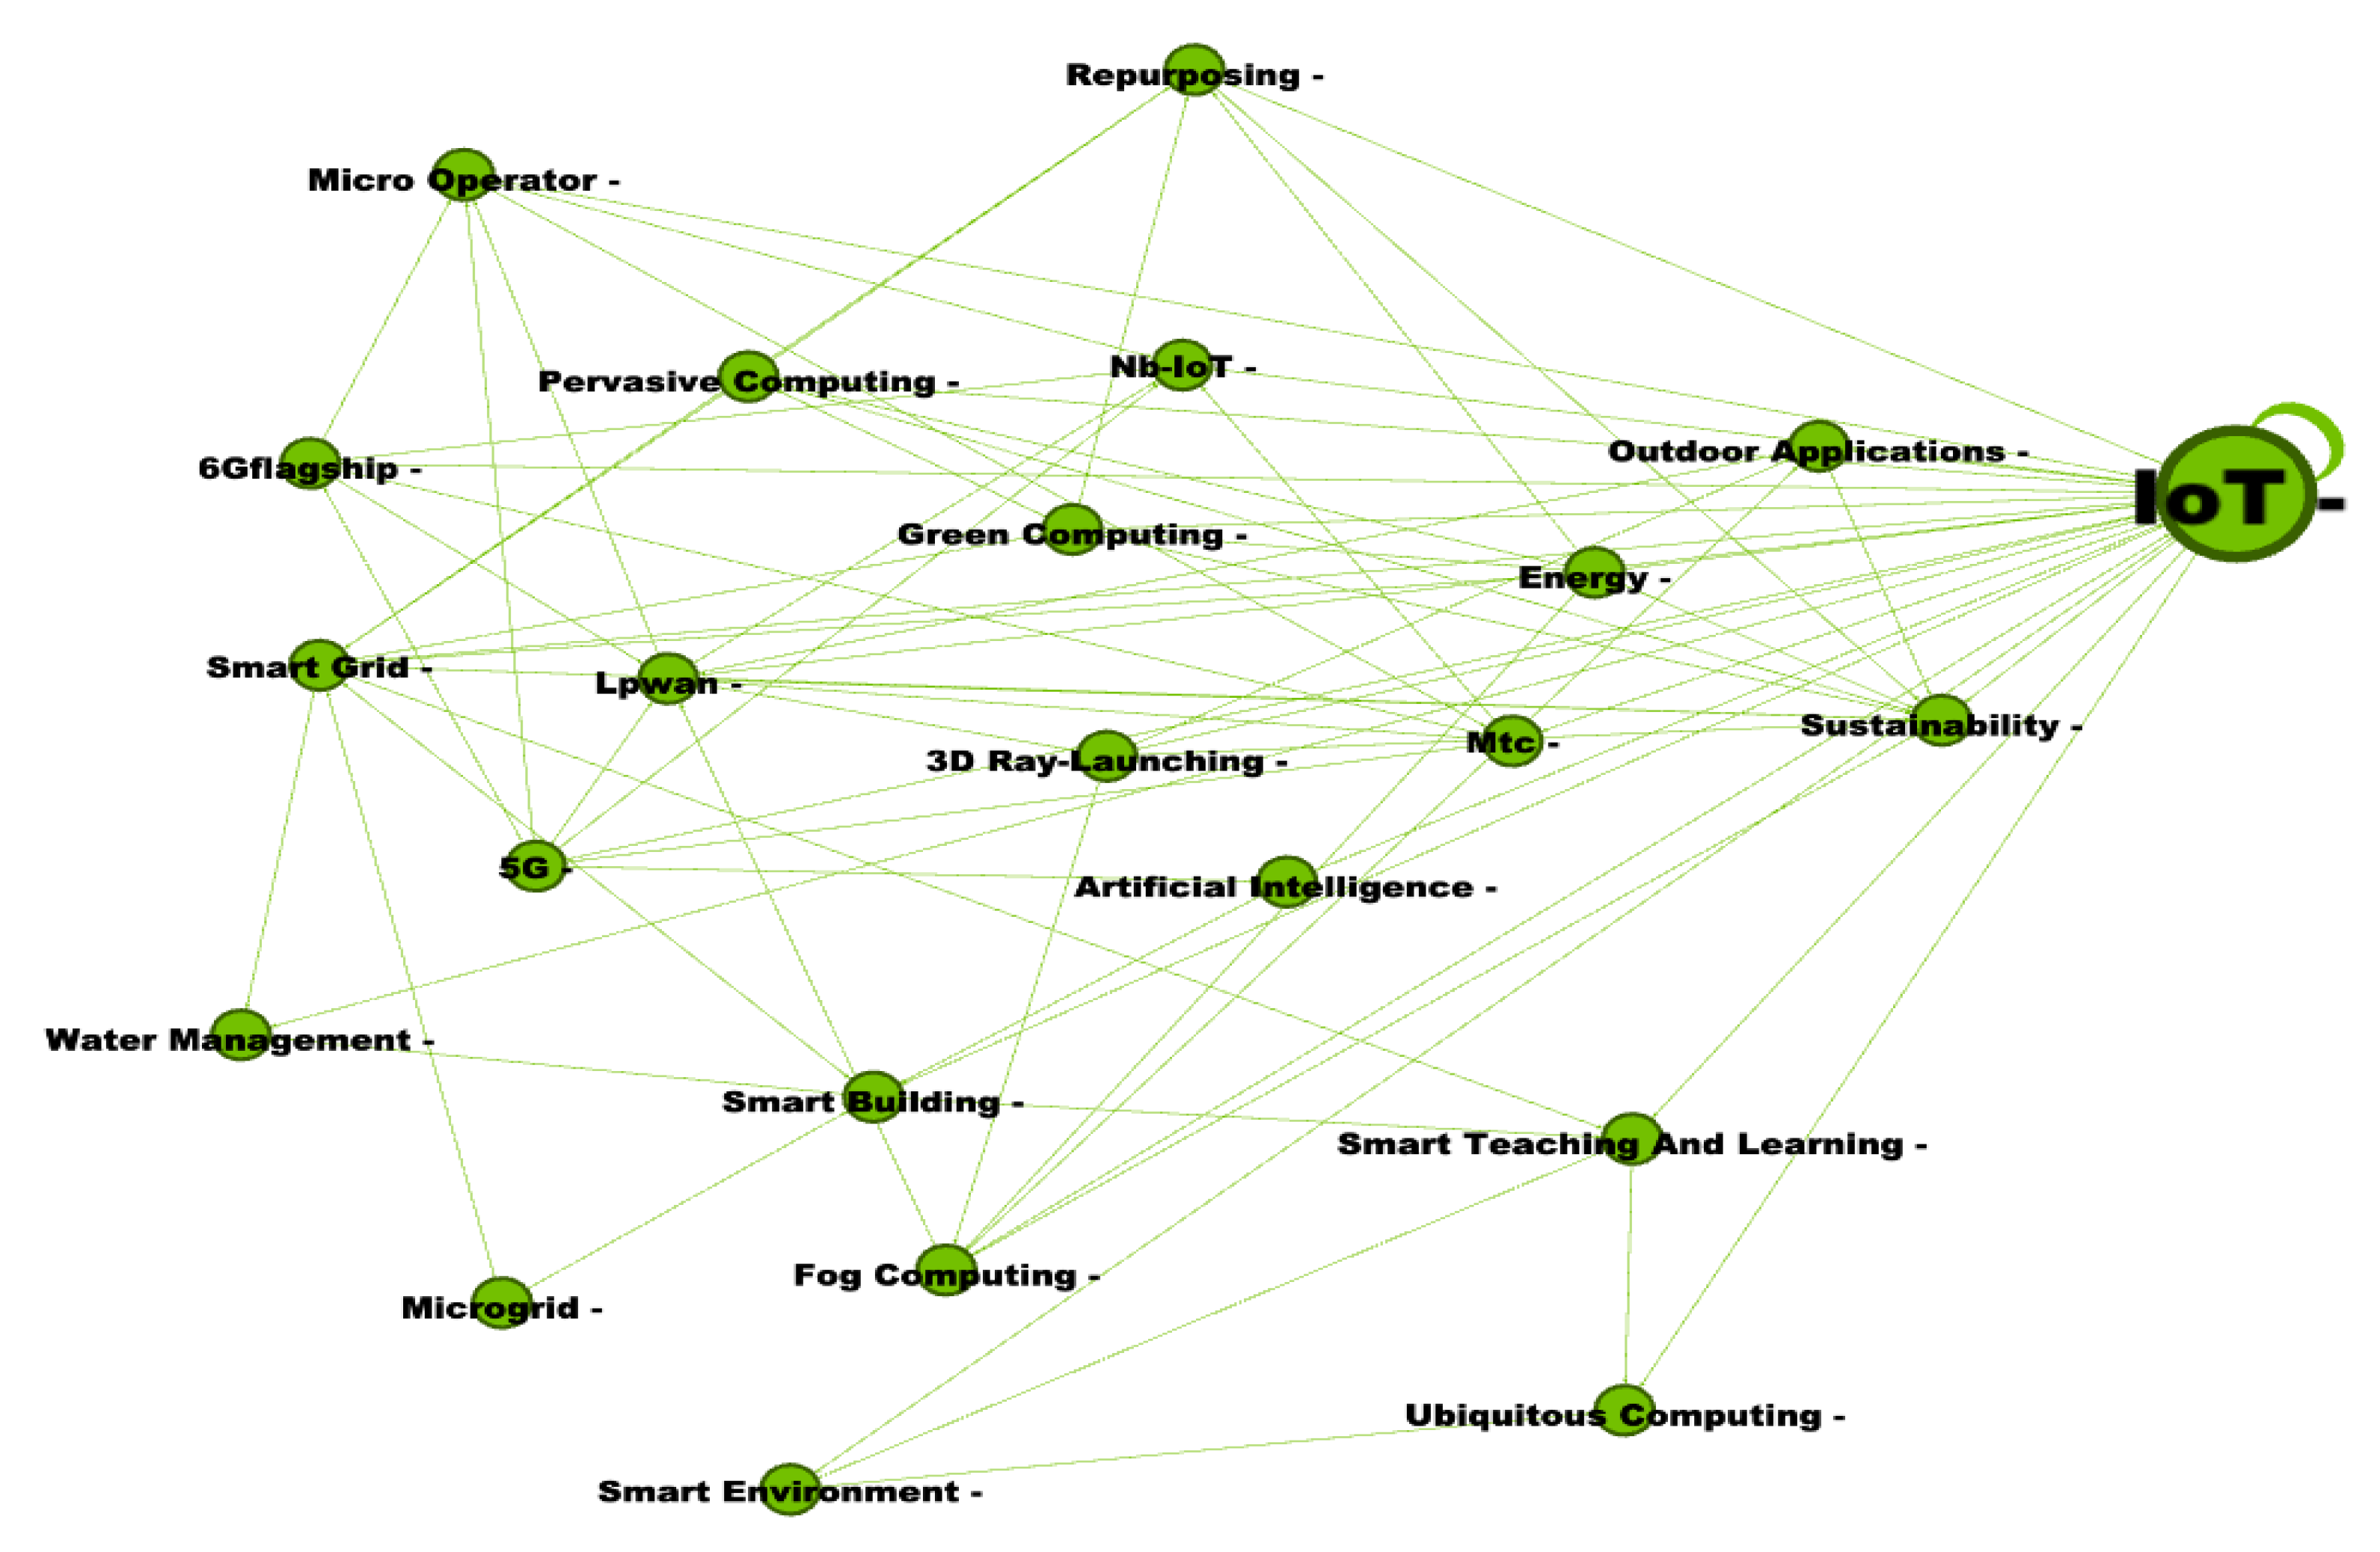
3.2.8. Internet of Things (IoTs) and Smart Buildings

Internet of things (IoTs) and smart buildings interlock with the smart network grid theme. Figure 11 illustrates the network for this theme, and Table 9 provides the important drivers in terms of their harmonic closeness centrality indices. The dominant driver is artificial intelligence, with an index of 0.641. Energy; Fog computing; 5G and 6G flagship have indices of 0.467, 0.452, 0.425, and 0.401, individually. Smart buildings, green computing, sustainability, and smart grid have their indices as 0.362, 0.401, 0.271, and 0.297, respectively. Likewise, the key sources for this theme emanated from conference papers that were published within 2020. Thus, implying that the studies and applications of the IoTs and smart buildings on campuses worldwide are recent developments.
Sustainability appeared on 18.2% of documents clustered under the internet of things (IoTs) and smart buildings module. Successively Smart grid, Artificial intelligence and Fog computing occurred in ±10% of relevant documents. Other cluster drivers from Table 9 are outdoor applications, water management, repurposing old campus buildings, persuasive computing, lower power wide area network, smart environment, teaching and learning. IoTs and smart buildings can benefit from 5G and the coming 6G flagship network system [97,98,99,100]. A smart campus will also require new smart buildings or repurposed old campus buildings to meet the needs of a smart environment for teaching and learning [29]. Water management on campus is also an essential component of a smart campus. Waterless urinals may be adopted to save millions of litres of water on campuses. A smart network grid will effectively integrate with smart buildings with IoTs.

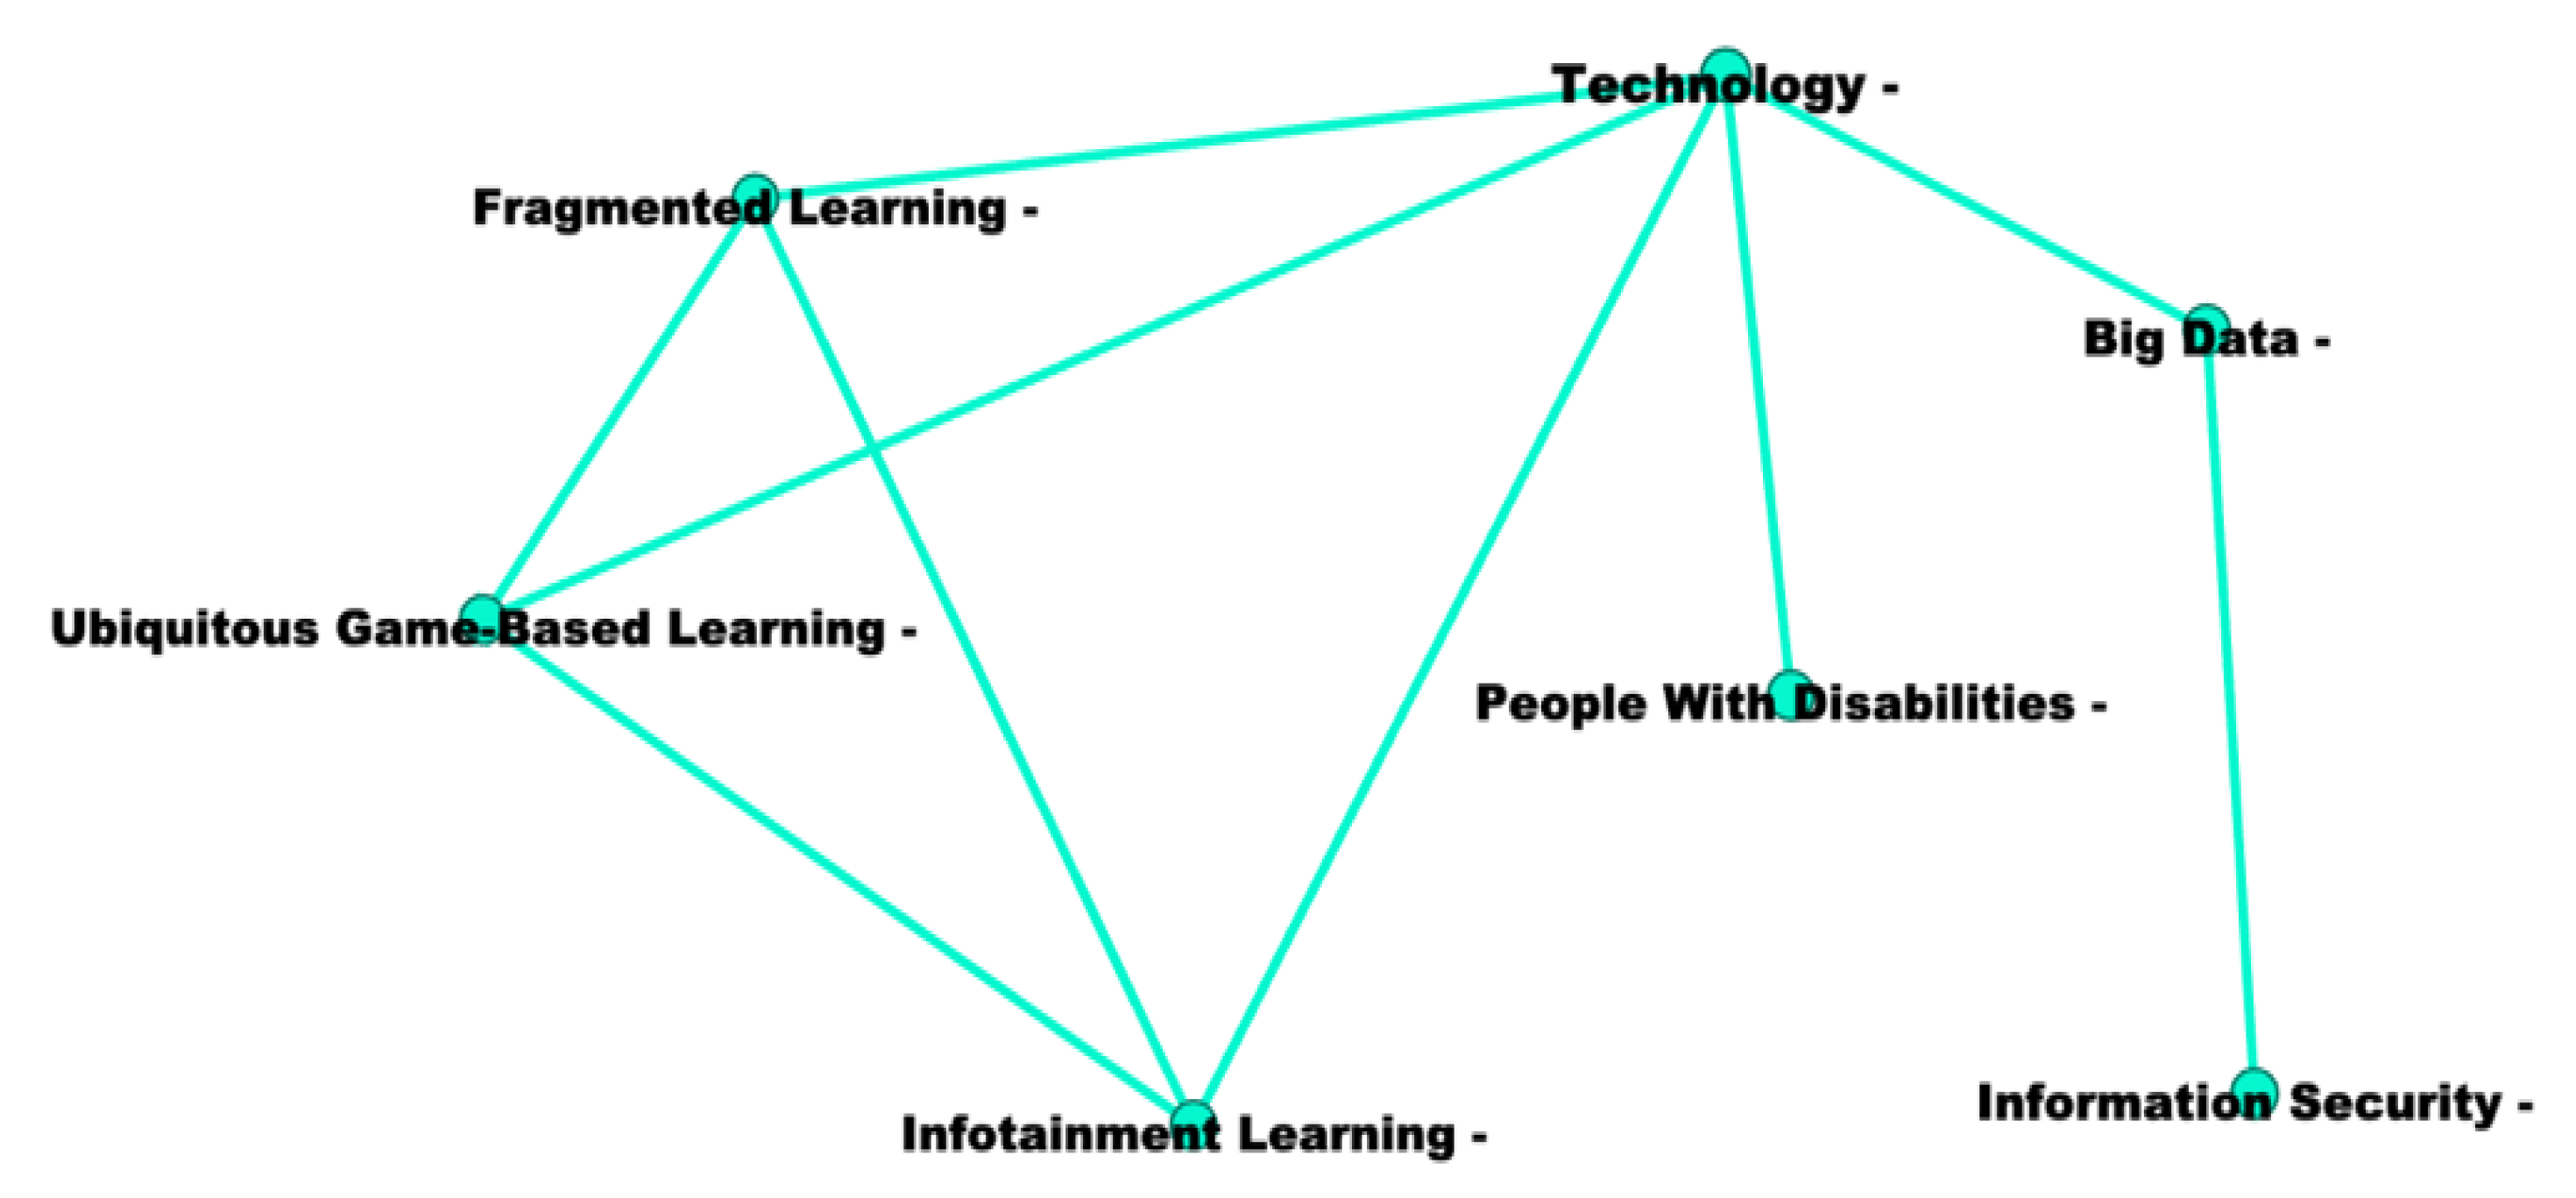
3.2.9. Inclusive Smart Technology

Inclusive smart technology in modular class 7 encapsulates the nodes in Figure 12. In Table 10, the inclusion of people with disabilities formed the basis of this cluster theme even though the harmonic closeness centrality index is 0.390. A smart campus with smart buildings needs to manage big data, create fragmented learning, and use ubiquitous game-based learning and infotainment learning for students with learning difficulties. The drivers mentioned above have harmonic closeness centrality indices of 0.517, 0.397, 0.351, 0.395, individually. Equally, information security with an index of 0.393 is required to create an inclusive smart campus thereby assuring the users of their data safety. This cluster theme was developed from key journal sources published from the year 2018.
In the Inclusive smart technology cluster, big data is the primary driver as it appeared on more than 50% of relevant journal articles and conference papers. Min-Allah and Alrashed [1] sketched a template for an inclusive smart campus technology where people services, smart utility, resource management, and educations services formed a good approach of providing inclusive services for the end-users on a campus. Inclusive technology from the perspective of learning can make use of game-based and infotainment learning [105,107]. Fragmented learning breaks down the teaching of topics into unique disciples to include a diverse population of students; this can be made possible [105,107]. Inclusive technology on campuses is important for promoting diversity, equality and management of learning and teaching.

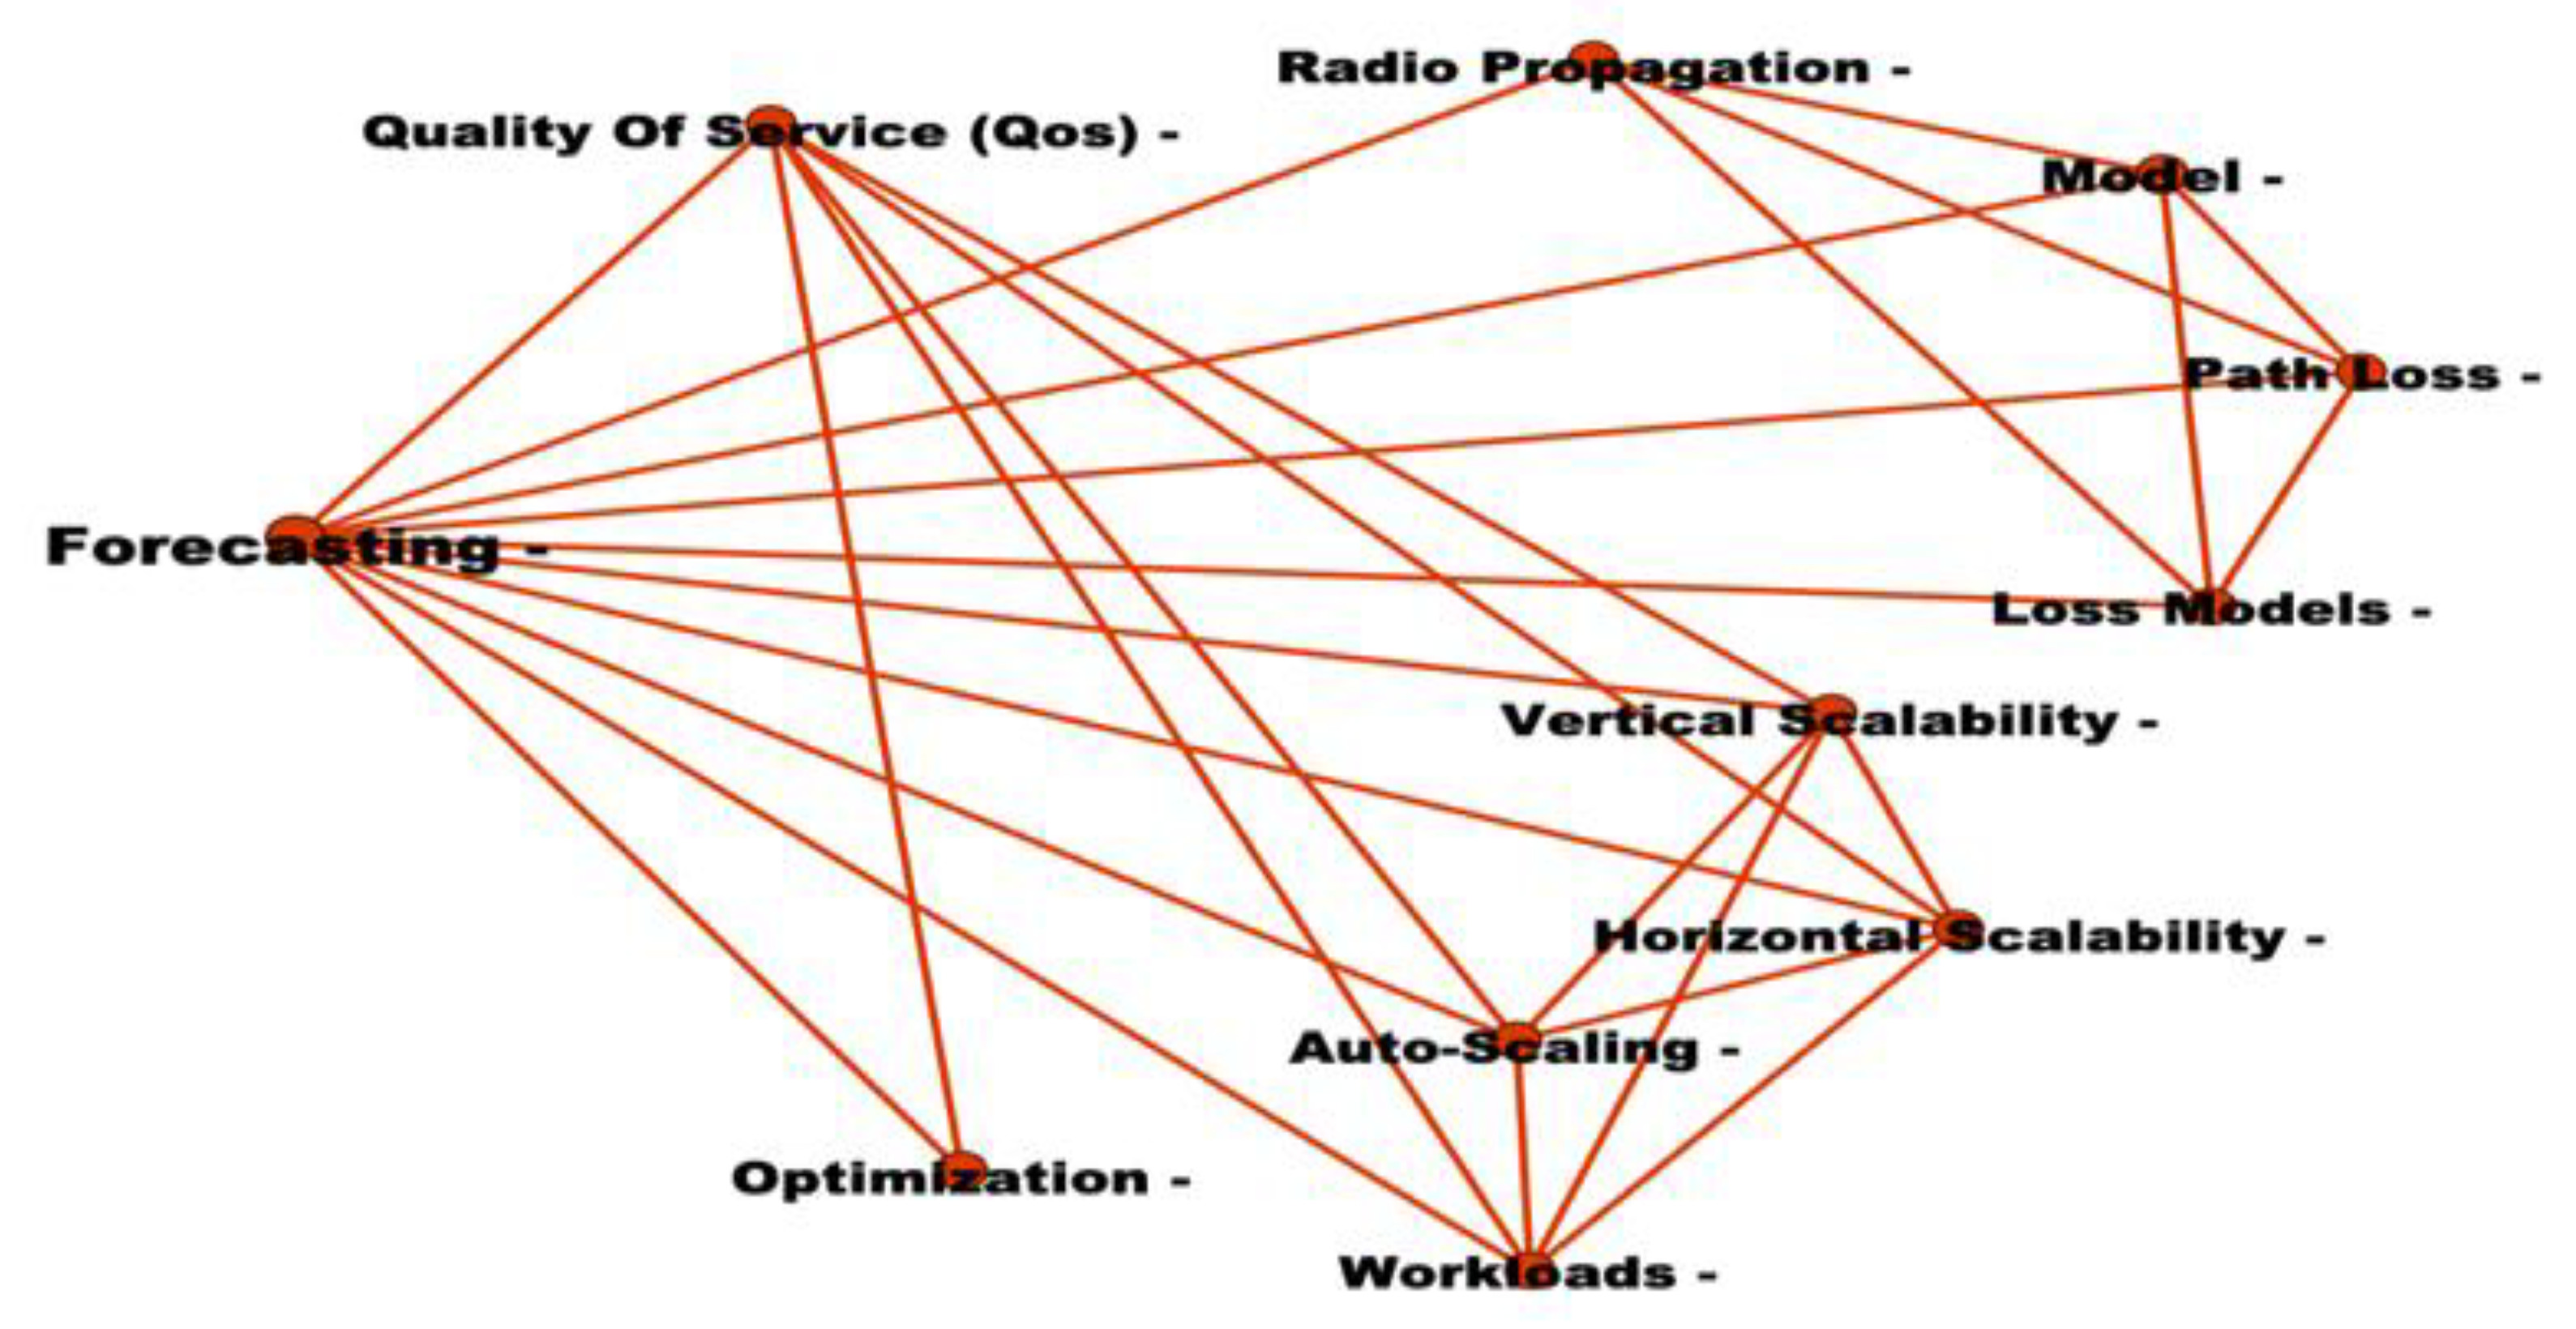
3.2.10. Performance Measurement and Forecasting

Modular class 8 produced performance measurement and forecasting cluster theme out of the nodes in Figure 13 as presented in Table 11. Performance measurement and forecasting are associated with auto-scaling, forecasting, loss models; path loss; horizontal scalability; radio-propagation; quality of service; and vertical scalability. The harmonic closeness centrality indices for the drivers are, respectively, 0.462, 0.460, 0.400, 0.402, 0.442, 0.392, 0.434, and 0.402. These drivers were drawn from a combination of journal articles and survey data published mostly in 2020.
As shown in Table 11, each performance measurement and forecasting cluster indicator frequently appeared between 8% to 15% of the relevant documents, while Forecasting as the prime indicator appeared on 23.1% of documents. Performance measurement and forecasting are crucial in understanding the impact of the smart grid network, IoTs, inclusive smart technology and every other smart application on teaching and learning [35,110,111]. In improving smart campus technology, the use of path and loss models and the quality of service can provide more clarity on the direction the smart campus infrastructure is going. Forecasting is also essential to assess the energy performance of campus buildings, the effectiveness of campus technologies in delivering quality services and learning experiences to students. Vertical scalability also helps to resize servers by increasing the power with additional features, while horizontal scalability included more resources and hardware to existing network infrastructures [35,58]. The development of servers and IoTs hardware on campuses will depend on forecasting and the previous performance of the system. Performance measurement and forecasting will create more opportunities for advances in smart campus applications.

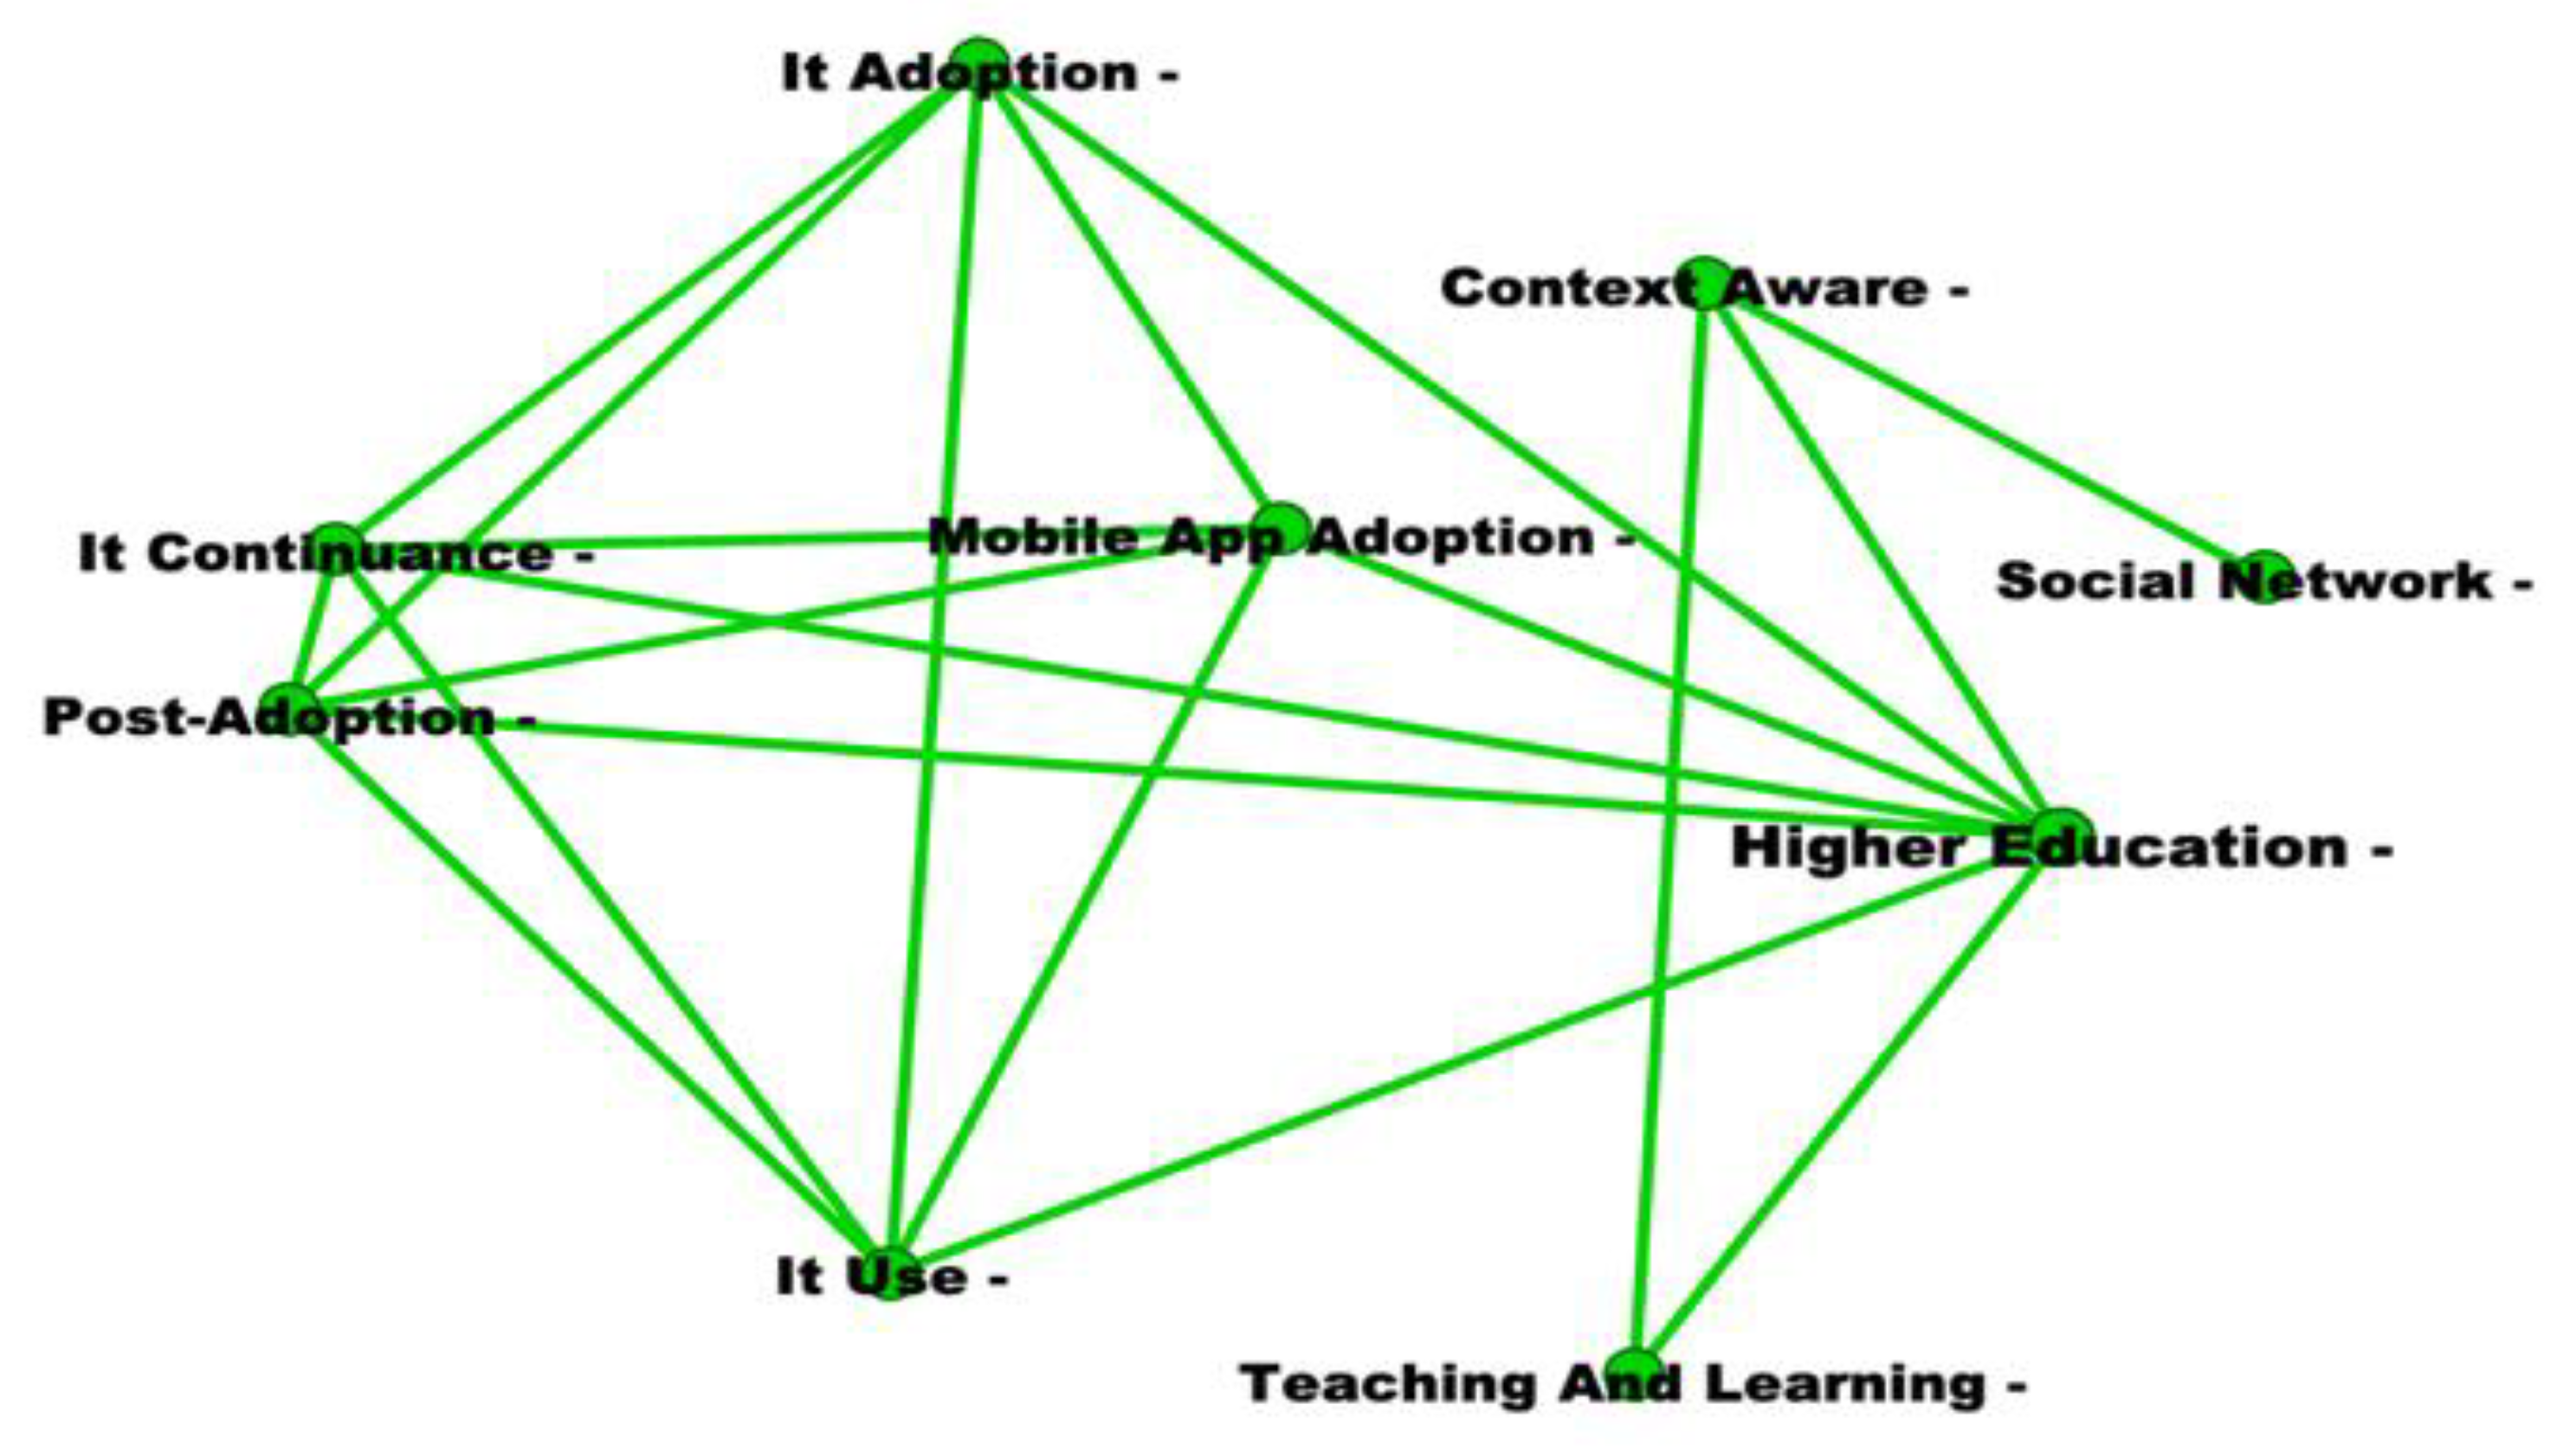
3.2.11. Smart Campus Applications

Smart campus applications in modular class 9, as illustrated in Figure 14, depends largely on mobile app adoption by students, academic and non-academic staff. Mobile app adoption has a harmonic closeness centrality index of 0.394. Social network, IT adoption, IT continuance, and IT use are fundamental drivers for smart campus applications, and indices are 0.393, 0.491, 0.399, and 0.397. Higher education and teaching and learning drivers have their indices of 0.460 and 0.492. This cluster theme emerged from conference papers published mostly in the year 2020.
Higher education and social networking are the key drivers of the Smart campus applications by appearing on 33.3% and 20% of analysed documents in this cluster. Table 12 focused more on higher education, teaching and learning applications of IT. Mobile applications are useful for timetabling, attendance monitoring, communication, and feedback purposes [2,90,115]. More importantly, mobile applications have become useful in teaching and learning using Microsoft applications. Social network applications can be developed specifically for the campus in the furtherance of the learning experience. Post-adoption of smart campus applications can be associated with the performance measurement and forecasting themes. By so doing, learning management systems can be developed and enhanced.

3.2.12. Learning Management System
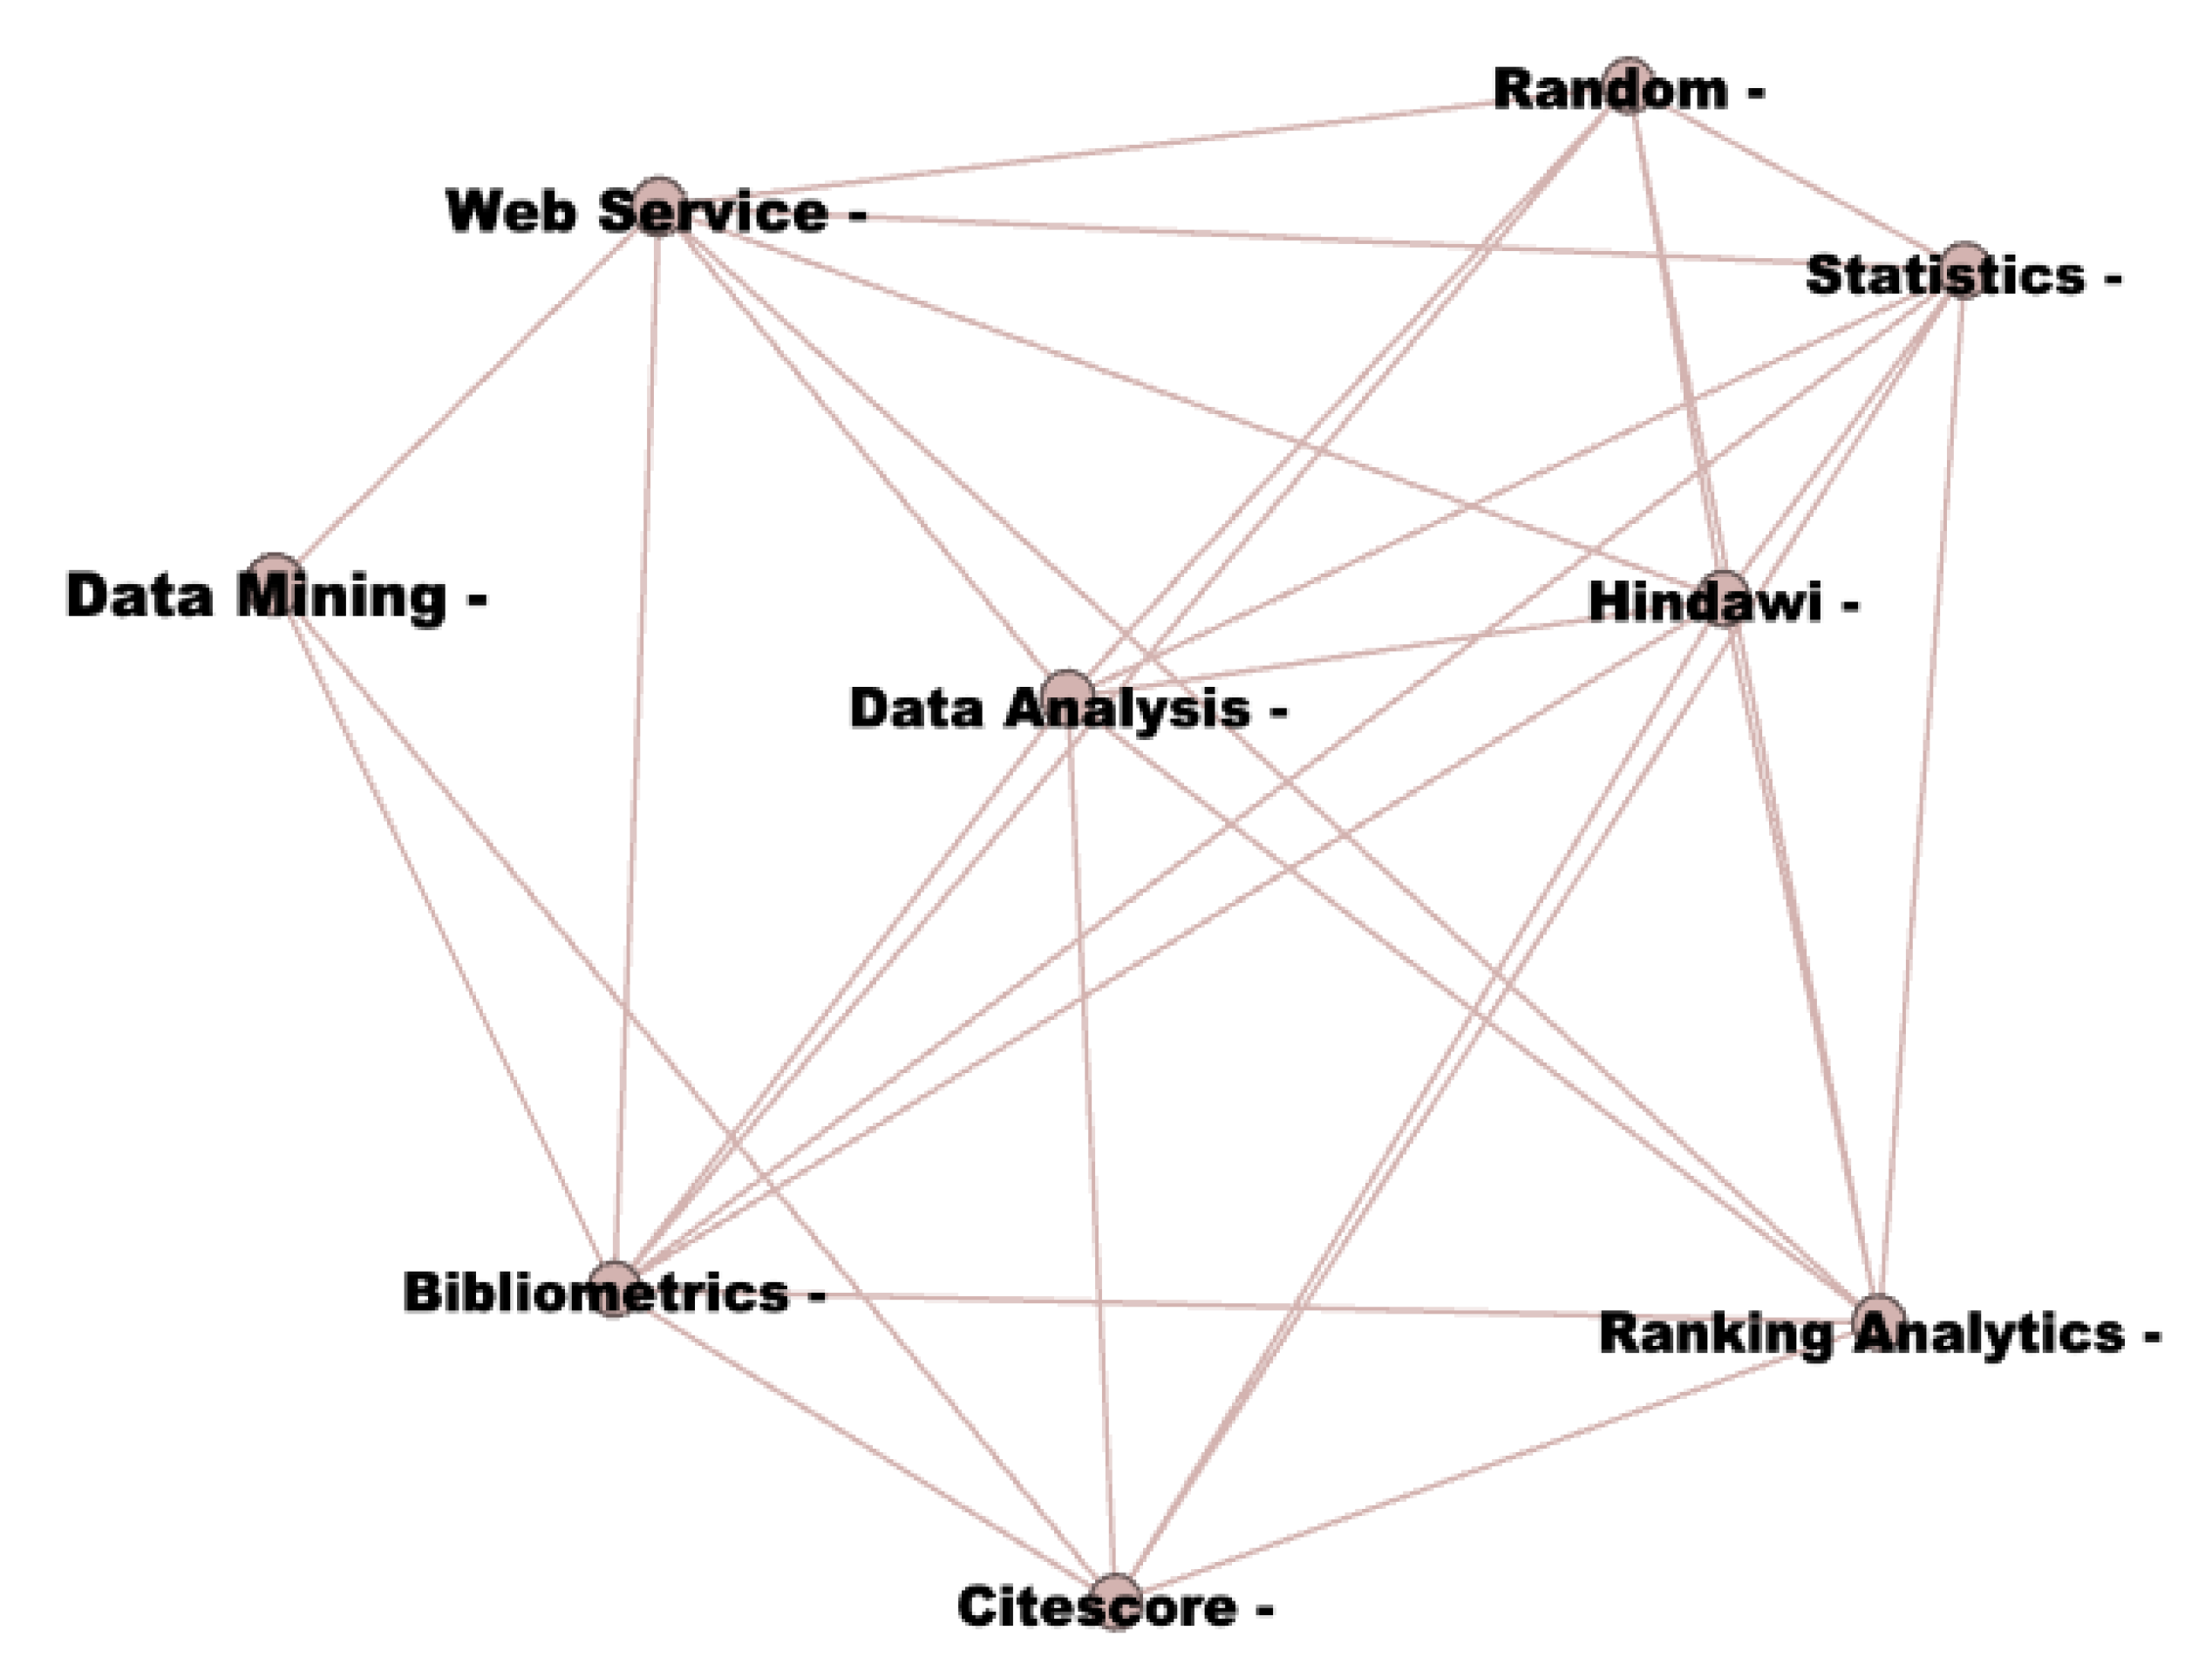
The “learning management system” cluster theme in modularity class 10 stemmed from a combination of conference and journal articles published mainly in 2018, as presented in Figure 15 and Table 13. Learning management systems can be integrated with IoTs and smart building, and smart campus applications. The components of learning management systems depend on wireless fidelity (WI-FI), real-time monitoring system; automation; camera; autonomous vehicles; sensors; wireless sensor networks; and Message Queuing Telemetry Transport (MQTT) devices. The above listed drives possess harmonic closeness centrality measures of 0.305, 0.447, 0.453, 0.451, 0.436, 0.417, 0.392, and 0.405 singly.
As shown in Table 13, Sensors and Security appeared on 18.2% of relevant documents, and Wireless sensor network appeared on 13.6% of analysed journal articles and conference papers. Learning management systems features depend on attendance monitoring, the availability of a good WI-FI system coupled with sensors, wireless sensors, and security features to efficiently harness data from end-users and support the delivery of teaching and learning [92,120,121]. The use of autonomous vehicles for student transportation on campuses is another idea that promotes students’ learning experience. An efficient WI-FI system is a foundation for IoTs on campuses. Learning is also enhanced when campus end-users have access to free and efficient WI-FI. Security on campus cannot be separated from learning. Campus end users want to feel safe when they learn. This safety pertains to the internet and physical security. Learning management systems can also be associated with data mining features as expressed in modular class 11.

3.2.13. Data Mining

Data mining is a process of extracting information and identifying patterns from large data sets with the aid of machine learning to perform performance measurement and forecasting [85,124,125,126]. The data mining cluster theme was produced from drivers with harmonic closeness centrality indices such as data analysis, 0.464; bibliometrics, 0.427; web service; 0.392; ranking analytics, 0.396; and statistics, 0.279. Publications mostly from 2018 and survey data formed the sources of the drivers in Table 14 and Figure 16.
Data analysis as the key driver of the Data mining group appeared on 30.4% of documents, while the other four drivers of this group appeared on 17.4% of manuscripts. The Data mining theme interacts with learning management systems when assessing students’ performance regarding their attendance in classes, internet usage; campus applications; student grades; library usage; and staff activities on campus and online. Data mining features are statistics based and makes use of machine learning and other analytics [4,103,127]. Data mining features are essential in all facets of smart campus management and improvement. The campus information portal is another theme that data mining will depend on.

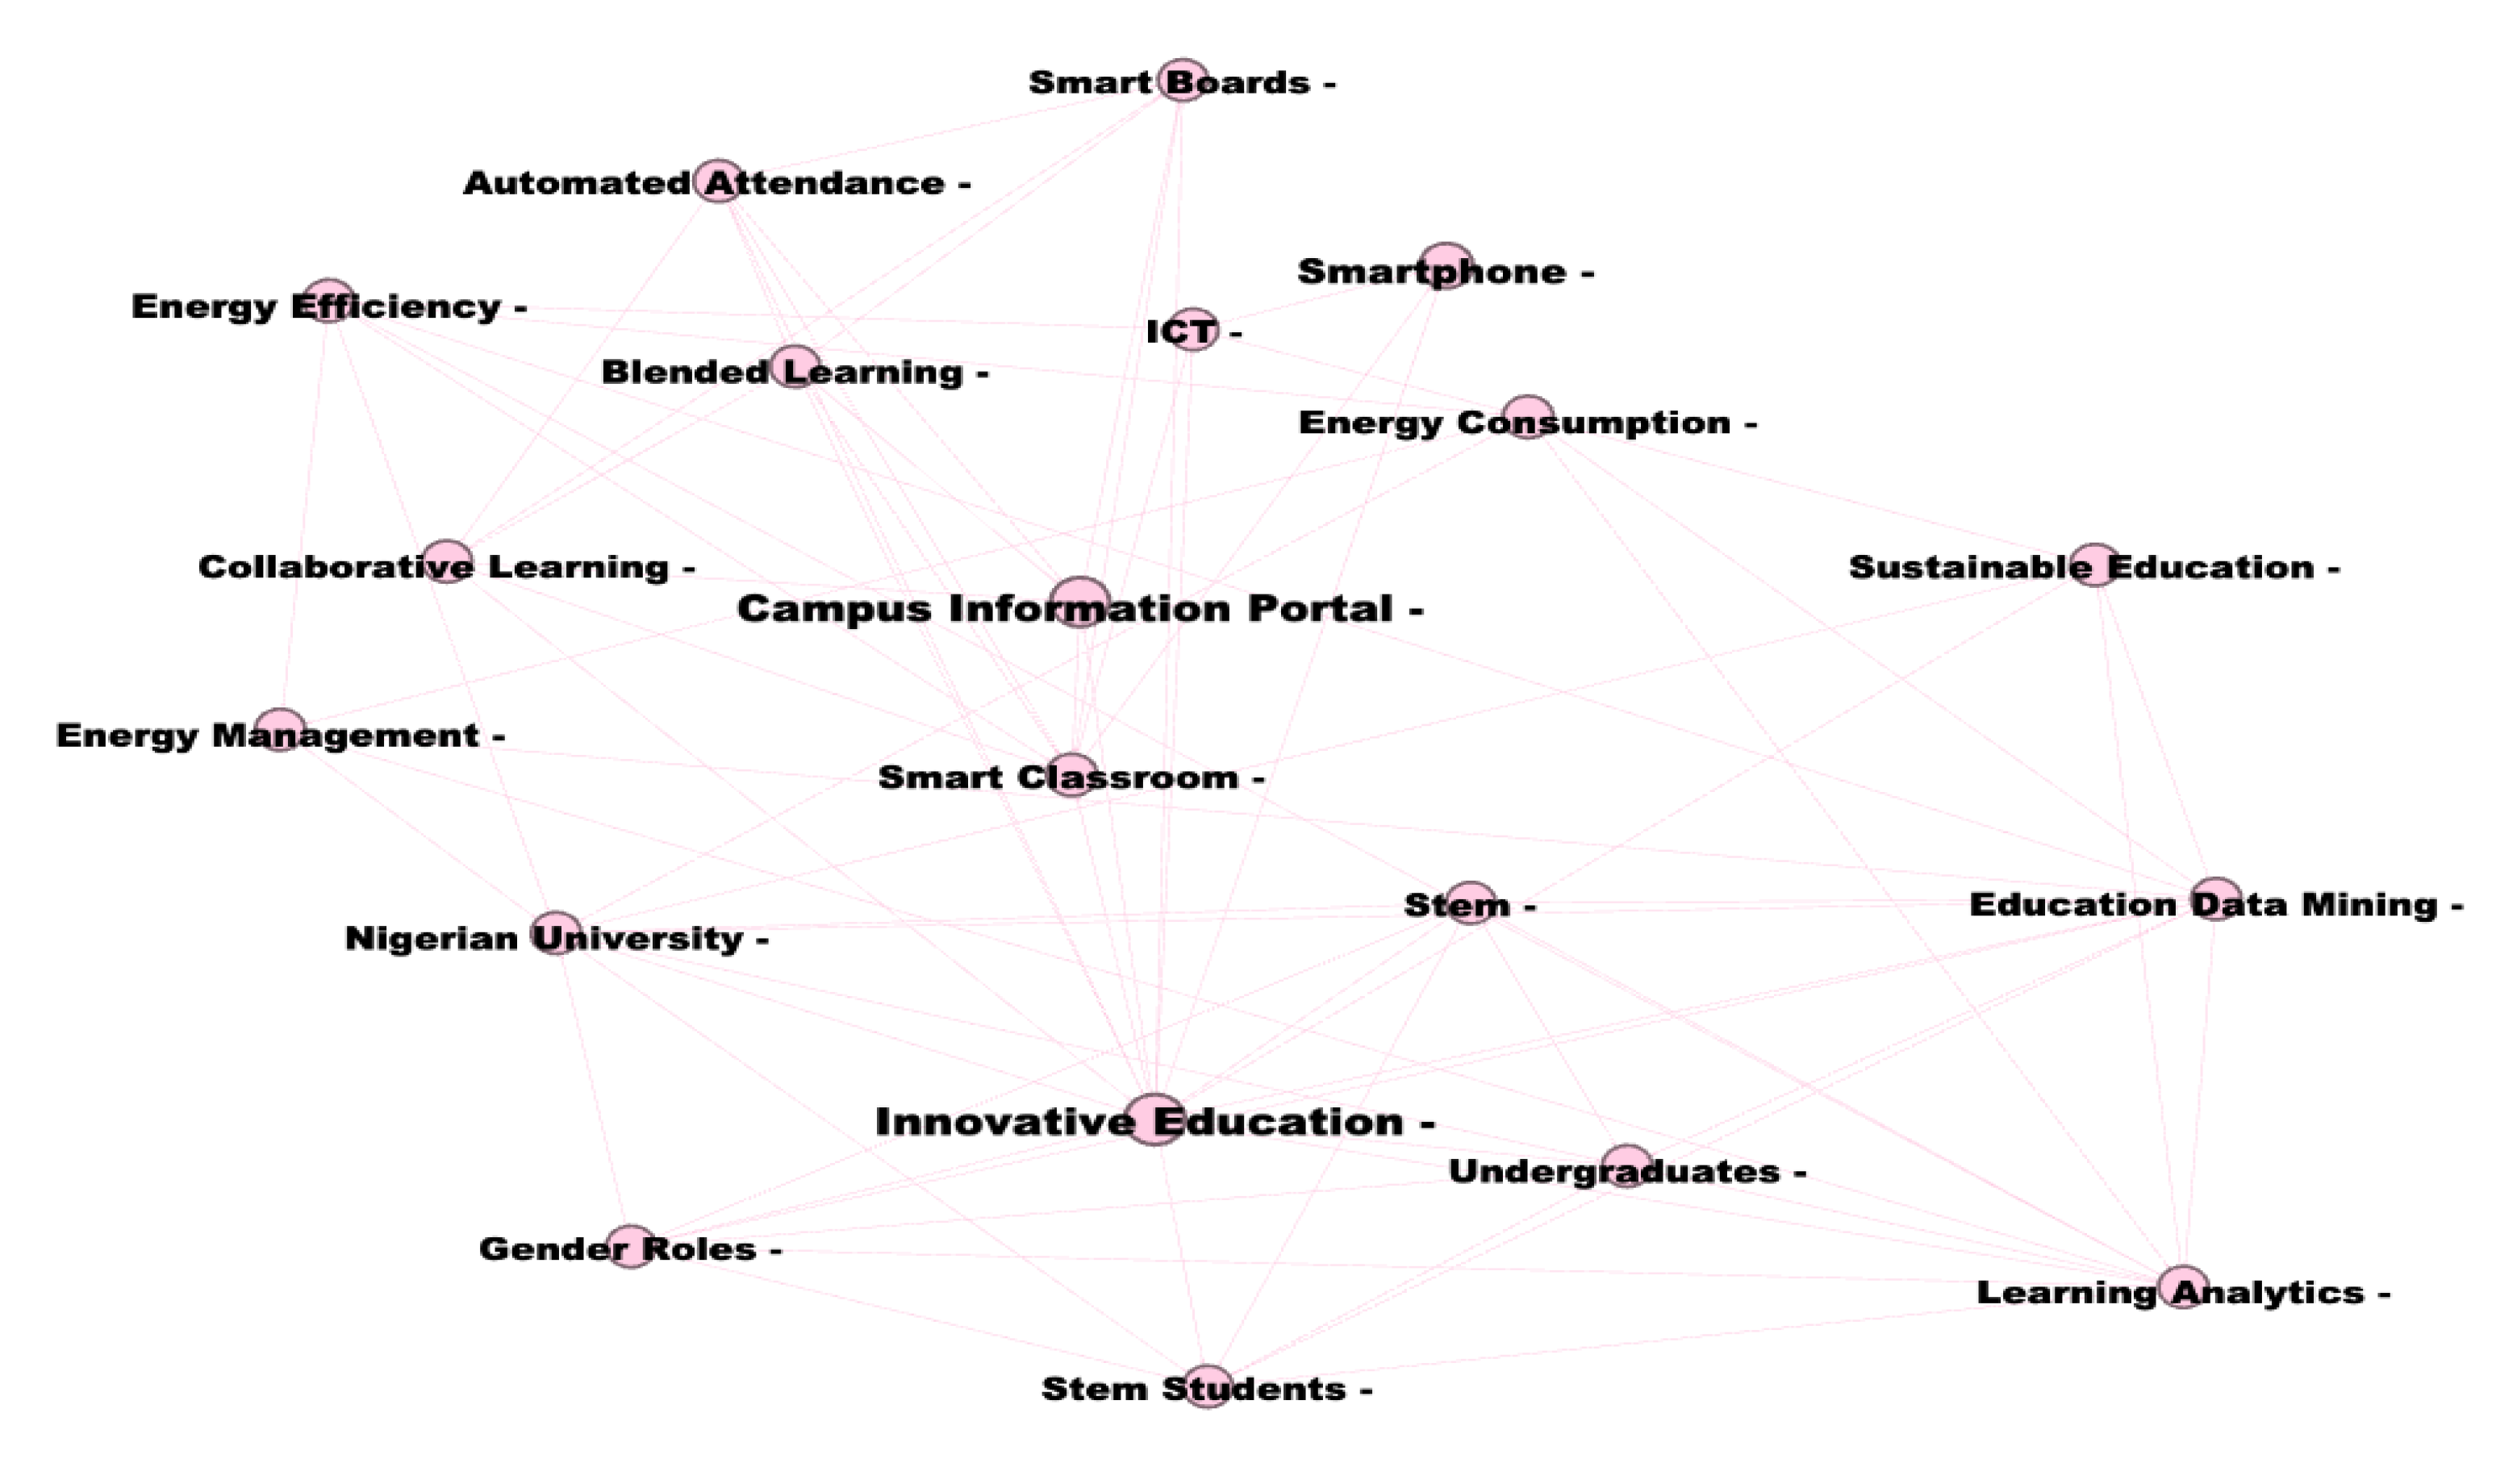
3.2.14. Campus Information Portal

Modularity class 12 combined key sources, mainly conference papers and journal articles published recently in the year 2020. The nodes in Figure 17 and Table 15 identified innovative education; smartphone; automated attendance monitoring; blended learning; energy efficiency; energy consumption; education data mining; collaborative learning; learning analytics; sustainable education; smart classroom; and smart boards as the basis of campus information portal. The individual harmonic closeness centrality indices of the abovelisted drivers are 0.504, 0.406, 0.446, 0.438, 0.481, 0.466, 0.441, 0.452, 0.417, 0.441, 0.368, and 0.392, respectively.
Energy efficiency is the predominant driver of the Campus information portal group as it appears on more than 20% of relevant documents. Energy consumption and efficiency, and education data mining are essential in smart campus development and information portal. It is imperative for campus end-users to know the amount of energy consumed and how they can contribute to achieving energy efficiency on campus. Sustainable education can be met through openness on energy-related information and the inclusion of end-users in attaining energy usage goals. Likewise, innovative learning and blended learning approaches such as online and classroom teaching should be visible for students through a campus portal [102,129]. In improving learning on campus, a smart classroom that comprises smart boards with touch screen capabilities will create an enabling environment for 21st-century learners and teachers. Hence, innovative learning depends on meeting the technological needs of students. In this instance, smartphones are essentially an integral part of smart campuses.

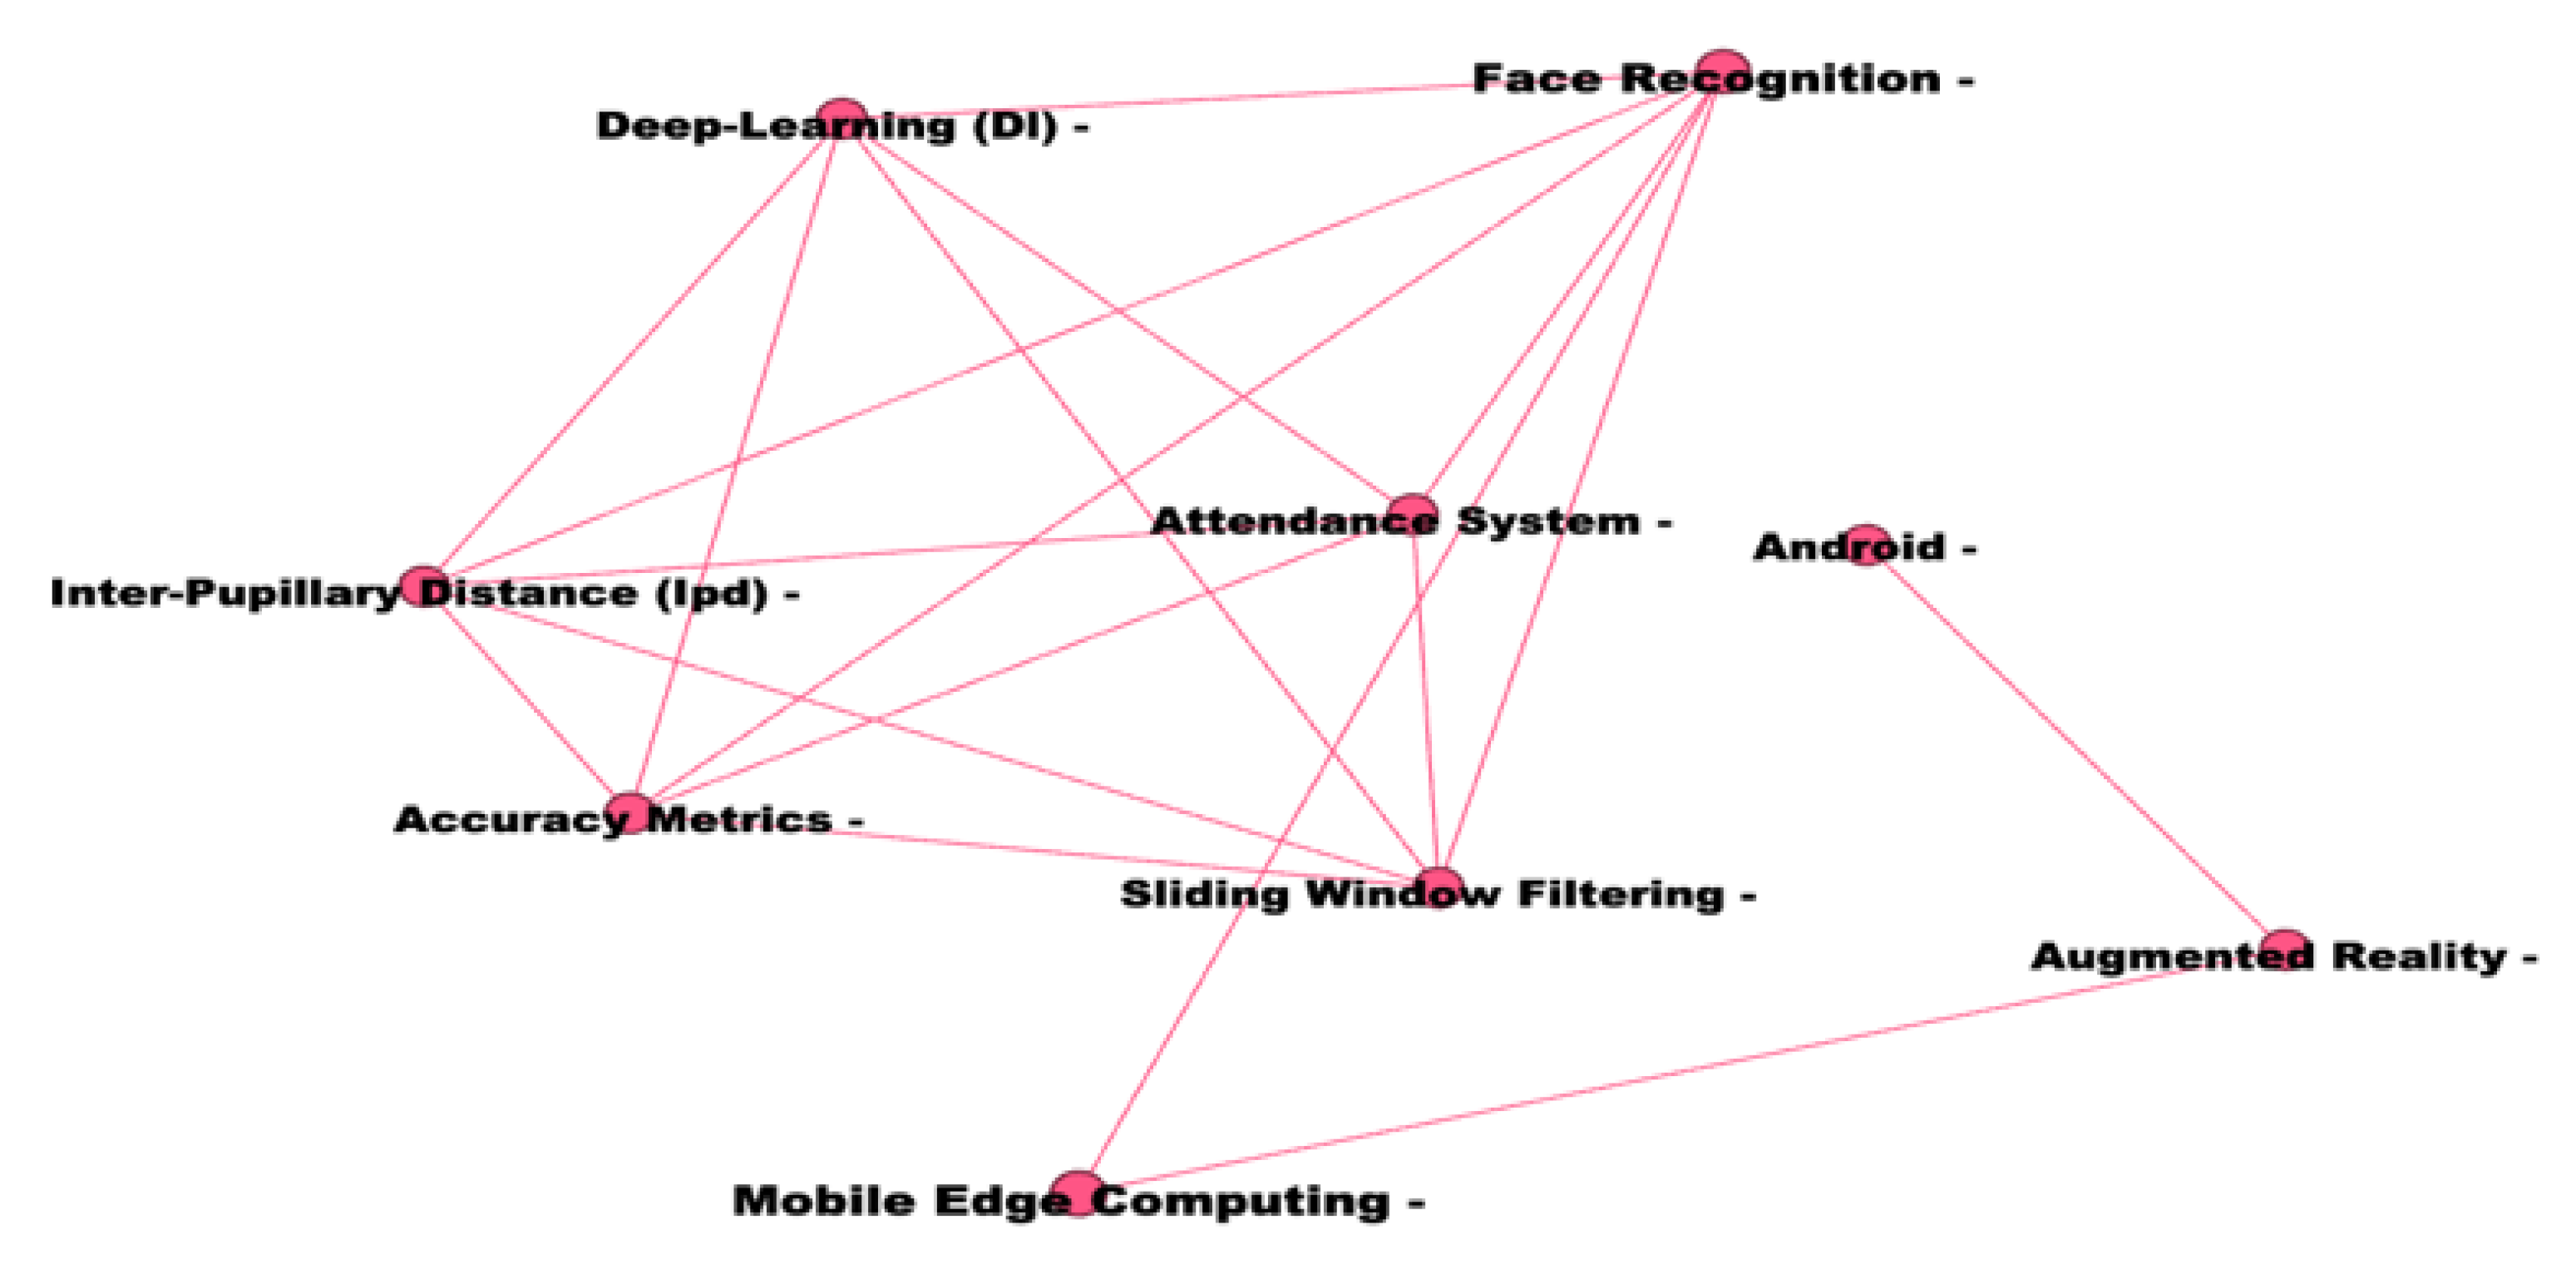
3.2.15. Deep Learning Architecture

Deep learning architecture is an advanced form of artificial neural network for problem-solving. A deep learning architecture theme can be built with data mining processes. Table 16 was developed from the network in Figure 18. The drivers of deep learning architecture and their harmonic closeness centrality indices are Face recognition, 0.459; Android, 0.414; Augmented reality, 0.404; Mobile edge computing, 0.474; Accuracy metrics, 0.393; and Sliding window filter, 0.391. Conference papers are the key sources of the contributing publications from the year 2020. Thus, implying that deep learning architecture is relatively new in smart campus applications and studies.
Augmented reality, Android and Face recognition are the key drivers of the Deep learning architecture, which occurred on 30%, 25%, and 20% of related manuscripts to Deep learning architecture. Deep learning architecture depends on features such as a sliding window filter used as an incremental database divided into several partitions; accuracy metrics augmented reality, face recognition and android devices [17,134,135]. The application of deep learning architecture is evident in face recognition on campuses. Face recognition is important for campus security and the efficient running of other services such as transportation and attendance monitoring.

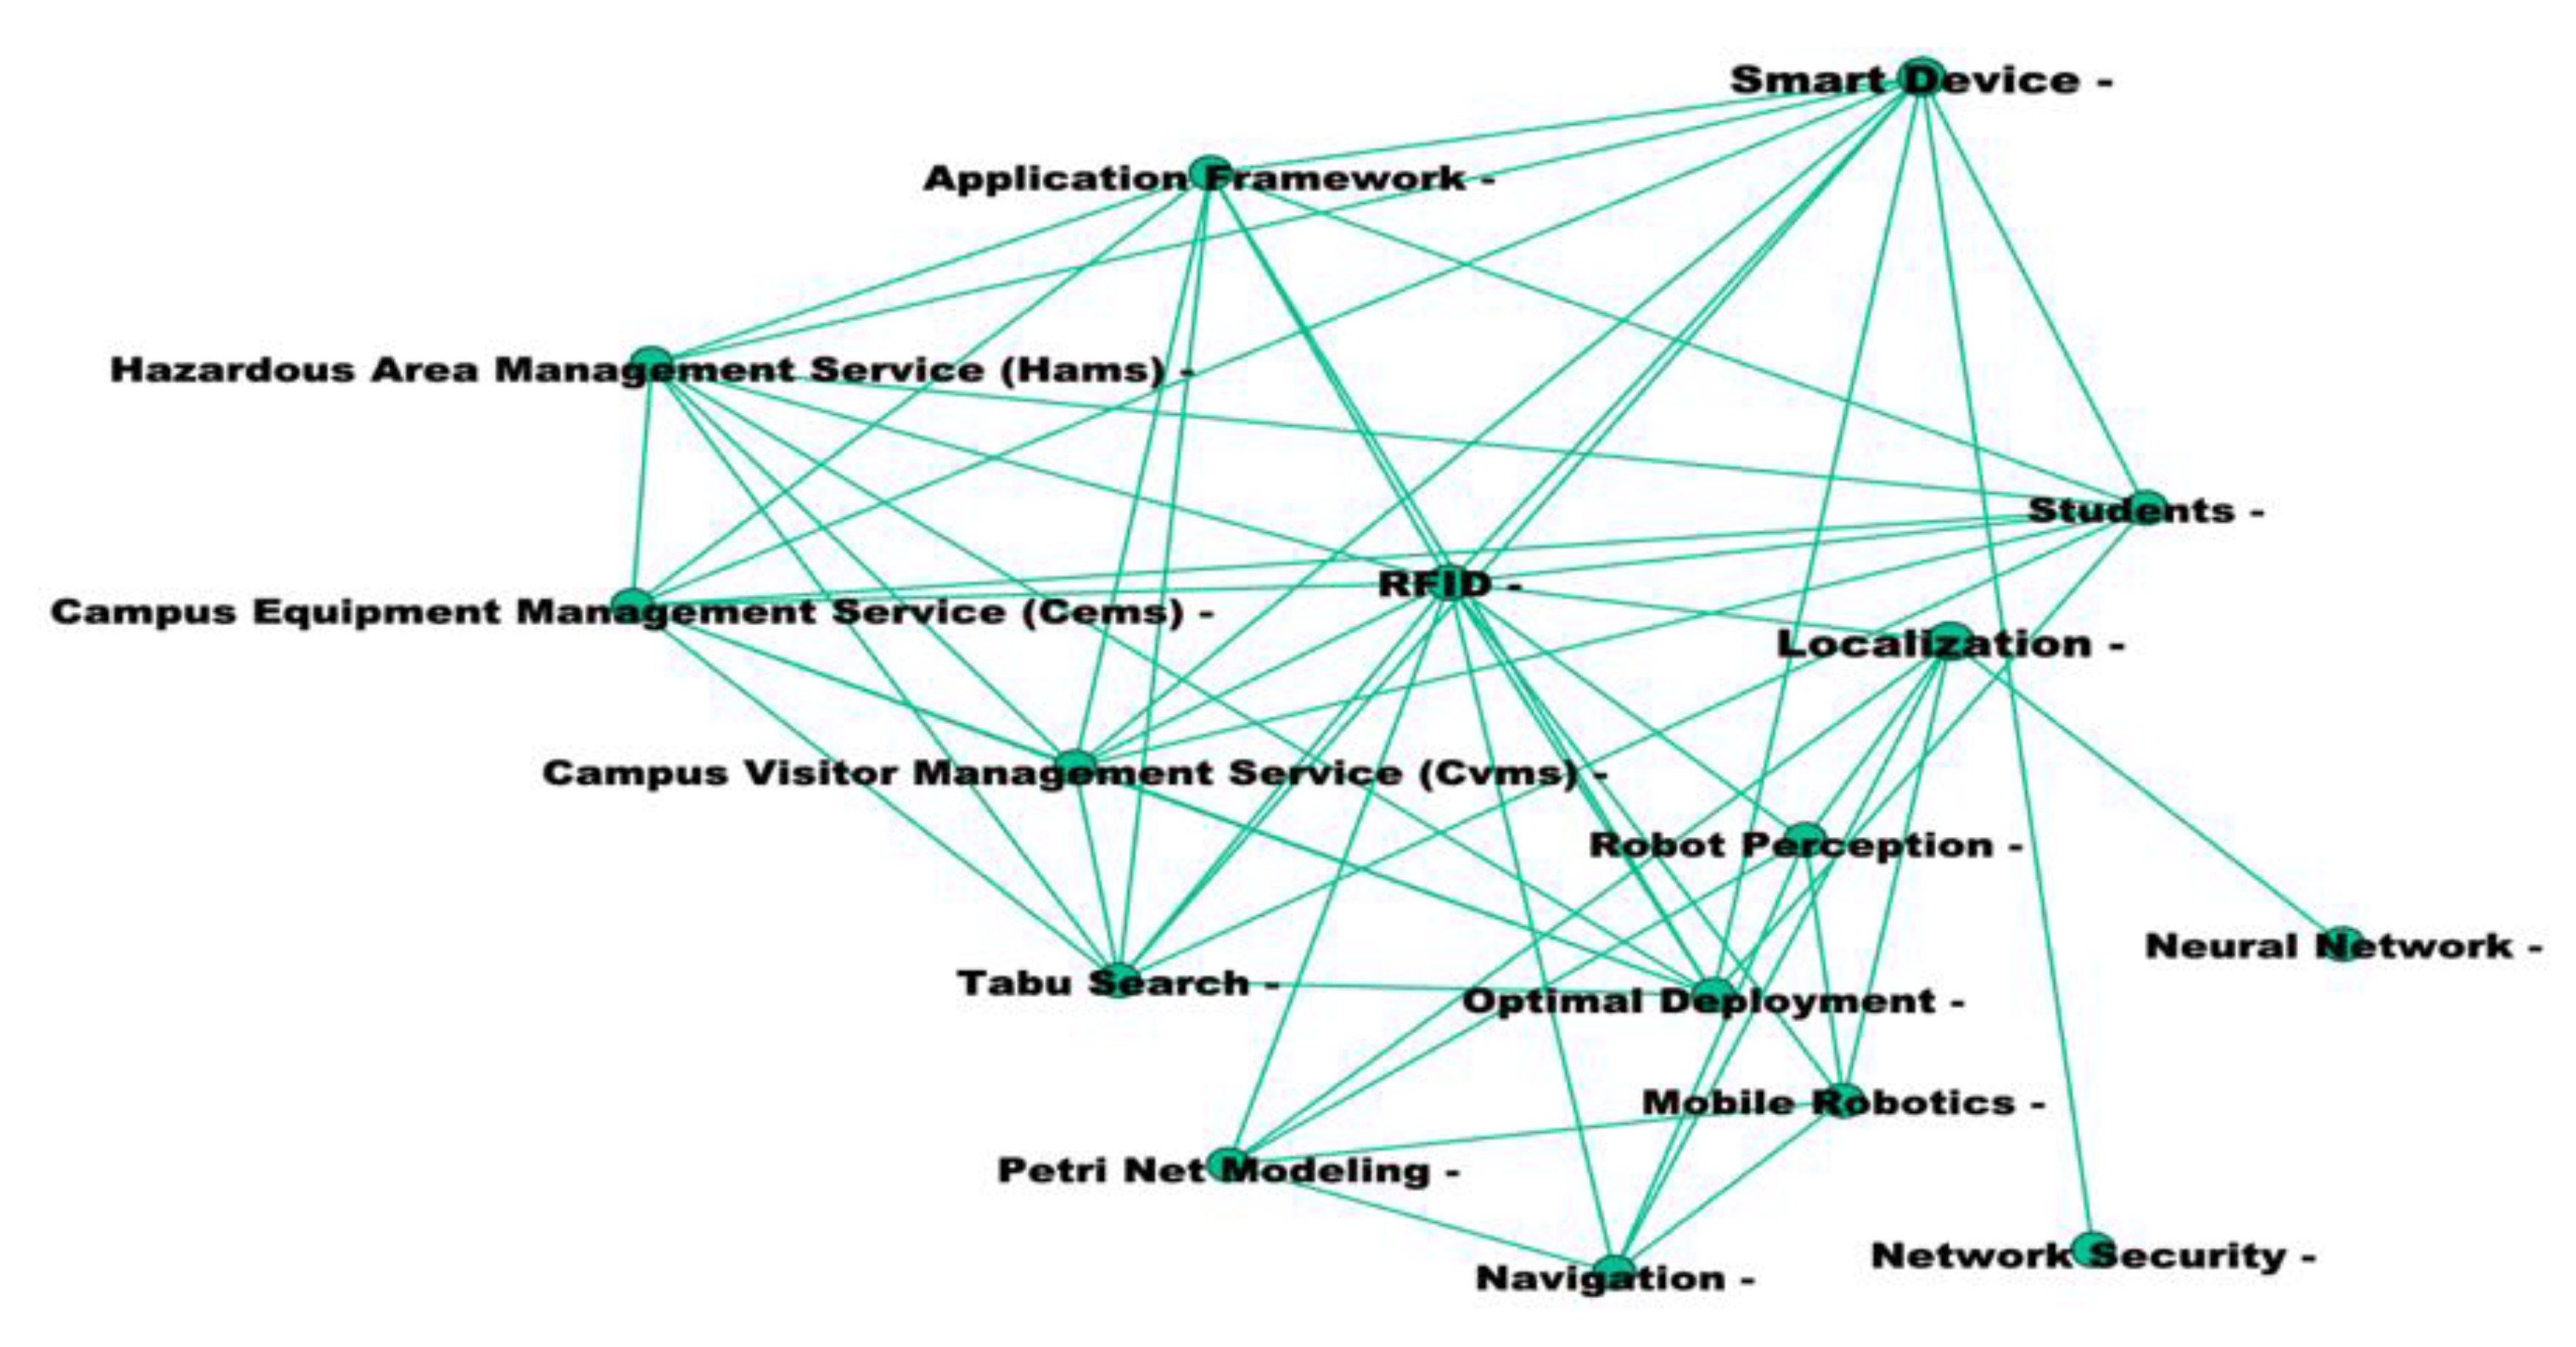
3.2.16. Campus Equipment Management Service (CEMS)

The campus equipment management system (CEMS) in the network displayed in Figure 19 was filtered to produce the drivers in Table 17. The drivers and harmonic closeness centrality indices contributing to the cluster theme of CEMS are campus visitor management service, 0.404; hazardous area management service (HAMS), 0.401; application framework, 0.462; radio-frequency identification (RFID), 0.411; smart devices, 0.416; localisation, 0.425; mobile robotics, 0.403; Petri net modelling, 0.397; and optimal deployment, 0.399. The cluster contributing sources came from journal articles published from the year 2012. CEMS is still emerging, and there are several studies about the development of CEMS in smart campus research.
As shown in Table 17, RFIS is the predominant driver of the Campus Equipment Management Service (CEMS) cluster as it appears on more than 30% of relevant documents. Zhou [138] noted that “campus information station has become an important part of the construction of smart campus”. Requirements of such campus visitor management systems and hazardous area management services are becoming increasingly important for physical and online campus security [84,133,136,137]. Interconnectivity with smart devices such as smartphones, smart meters, smart cameras can use RFID to transmit data and conduct performance measurement through Petri net modelling [140]. CEMS must be integrated with the Smart campus network grid, data mining, and performance measurement and forecasting. The framework in Figure 20 and implications of the smart campus technology further provides more insight into the importance and applications of the findings of this bibliometric analysis.

4. Implications of Findings

This section presents the findings in a conceptual framework. Further discussions are provided under the implications of findings which were derived from Figure 20. The implications for future research are also presented at the end of this section. The implications of findings in this section contains theoretical applications of the findings for policy formation, development, and enhancement of smart campuses.

4.1. Framework Conceptualisation

The findings from Section 4 aided in conceptualising a framework that highlights the infrastructure elements for smart campus development. The 15 cluster themes were categorised into four (4) main divisions. The four divisions are smart building construction or repurposing, technology, and IT network; continuous improvement; and smart learning and teaching systems. Smart building construction or repurposing encapsulates smart city clusters, IoTs and smart buildings, and energy management systems. Technology and IT network division comprise of smart campus network grid; cloud computing; inclusive smart technology; and smart campus applications.
Continuous improvement has a similar IT infrastructure for evaluating the performance of smart campus features. The continuous improvement consists of deep learning architecture, data mining, auto-analysers, and performance measurement and forecasting. The final division in the framework contains a campus information portal, a learning management system; a campus equipment management service (CEMS); and an education management system to produce the smart learning and teaching systems infrastructure. Each of the four divisions will be explained in Section 4.2.

4.2. Implications of Findings on Procurement of Smart Campus Infrastructure

The implications of the four categories in Figure 20 on procurement of smart campus infrastructure depends on the geographical location; the readiness of education institution where the campus is located; proximity to smart cities; a strategic vision of the education institution; source and availability of finance; technical know-how to construct and deploy smart cities infrastructure [1,36,37]. The relevant articles on smart campus procurement and construction will be discussed under the explanations of the four main divisions from Section 4.2.1, Section 4.2.2, Section 4.2.3 and Section 4.2.4.

4.2.1. Implications on Smart Campus Building Construction or Repurposing

Min-Allah and Alrashed [1] reported the role of smart cities in the development of smart campuses from the viewpoint of people, prosperity, governance and propagation, which should be in line with the community, infrastructure sustainability, administration and replicability on campuses. Zhou [138] also identified the inclusion and repurposing of teaching, scientific and management services infrastructures in constructing a digital campus. The construction of smart campus buildings depends on the available technology and the existence of a smart city. If the campus is situated within a smart city, Min-Allah and Alrashed’s [1] approach to creating a smart campus can be adopted along with the findings of this study which is inclusive of energy management systems in smart buildings. Inversely, the chances of repurposing or retrofitting existing campus buildings with the IoTs is another feasible methodology for the provision of smart buildings. What makes a building smart is the energy consumption and management approach, sustainability, IoTs capabilities, smart meters, water management and interconnectivity to harness data.
Construction or repurposing activities to deliver smart buildings will have to consider pertinent stakeholders, procurement method, contract documentation and arrangement, construction method statement, and information management. Standard procurement and contractual approaches such as traditional procurement and New Engineering Contracts (NEC) may suit smart building construction. For the repurposing of buildings, the Joint Contract Tribunal (JCT) for minor works can be applicable. BIM and GIS have been suggested as good approaches to mapping and constructing campuses [14,53]. The application of BIM and GIS in smart building construction will lay a foundation for easier facilities management using the Construction Operations Building Information Exchange (COBie) data.

4.2.2. Implications on Technology and IT Network in a Smart Campus

As suggested in Section 4.2.1 above, the IoTs forms the core of smart buildings. A smart network grid consisting of a microgrid on campus is an integral part of the smart campus building construction [1,132]. The existence of a smart campus network grid will be inclusive of cloud computing. Cloud computing infrastructure provides a single-point solution to solving the challenges of smart campus messaging, data processing, business interfaces, human-computer interaction and persuasive computing [132].
Cloud computing within an IT network must be all-encompassing in supporting the learning and teaching management system whereby students with disabilities are provided with the necessary tools to learn. Likewise, academic staff with disabilities must be included by creating campus-specific applications such as social networks, mobile applications, voice recognition or text-to-speech teaching aids. The construction of new technology on smart campus deal with IT project management. Consequently, there is a need to study the intricacies of contract, construction, and procurement of IT infrastructure on campuses.

4.2.3. Implications on Continuous Improvement of Smart Campus Infrastructure

The existence of smart campus infrastructures such as smart buildings, energy management systems under construction and IT network divisions in Figure 20 will be of no significance without performance measurement and forecasting, data mining, auto-analysers, and deep learning architecture for continuous improvement. The idea of continuous improvement in smart campus management pertains to learning from existing data, practices and understanding how the systems can be improved [127,128].
Data mining supports harnessing analysis with deep learning architecture of neural networks for understanding campus end-user behaviour and requirements [3,17,134,135,141,142,143]. Continuous improvement of smart campus infrastructure produces opportunities for research into smart campus applications, IT infrastructure, network, management, and applications [3,144,145]. Hence, a framework for improving the existing systems has used vertical and horizontal scalability, loss models, forecasting; statistics; and accuracy metrics. Similarly, evaluations of air quality and energy usage in smart buildings must support the idea of producing net-zero energy buildings. Sustainability and smart campuses meet at the point of net-zero energy provisions in buildings, whereby smart buildings use renewable energy such as photovoltaic panels to meet all the energy demands in a building [105,146]. In achieving this target, continuous assessment and improvement of smart buildings, technology and IT network, and energy management systems will provide a stronger foundation for sustainable buildings on campuses.

4.2.4. Implications on Smart Learning and Teaching Systems

The governance of a smart campus is hinged on services delivered through learning and teaching. Smart learning and teaching systems division of a smart campus infrastructure depends on on-campus information portals with the attachment of automated attendance; education data mining; collaborative learning; learning analytics; and smart classrooms with smart boards [89,94,122]. The learning management system governs how students and other campus end-users interact with the smart technology, smart buildings, and energy usage on campus while learning.
In learning and teaching on campus, the WI-FI system, mobile applications, and communications mostly through emails must be effective. The campus equipment management system also supports learning and teaching when visitors and material waste are managed. Finally, the education management system produces an opportunity for artificial intelligence to be cohesive with E-learning platforms for students and mobile learning applications. IT project management is required to deliver the infrastructure required for smart learning and teaching. In this infrastructure category, IT networks and applications can be developed either through contractors or the existing IT services on campuses. Other tools such as smart classrooms and boards can be procured and installed by the IT service or specialist contractors.

4.3. Implication of Findings for Future Research

The important outcomes of the study, as illustrated in Figure 20, form a foundation for further research into the procurement of smart campuses. The areas for future large-scale research are the following:
  • Application of BIM in delivering smart campuses
  • IT project management in smart campus procurement
  • Investigations into the best procurement strategies for smart campuses
  • Contractual arrangement in smart campus procurement.
The above-listed research areas should be viewed from the geographical and national outlooks because there will be peculiarities of smart campuses regarding campus sizes, the readiness to manage campuses, availability of technology, and financial capabilities.

5. Conclusions and Limitations of the Study

This study aimed to develop an inclusive framework for smart campus procurement by reviewing all available literature within the last ten years. The findings show a progression in the development of smart campus studies around the world. Smart campus research is still emerging because smart campuses are still under development around the world. The Asian continent, especially China, has been leading the pace in smart campus research. The delivery of smart campuses depends on construction or repurposing activities, technology, and IT network; smart learning and teaching management system for smart campus governance; and continuous improvement of existing smart campus infrastructure. The existence of smart cities makes it easier for smart campuses to emerge around the world and improve. The limitations of this study are evident in the methodological approach, which is more a review of existing literature, the application of keywords, abstracts, and publications in determining smart campus infrastructure. Qualitative and quantitative methods may identify more smart campus infrastructural elements. Nonetheless, the conceptual framework in this study provides a foundation for large scale studies into how sustainable development of the environment can be attained in smart campuses and a new direction for further studies into procurement practices in smart campus development.

Supplementary Materials

The following are available online at https://www.mdpi.com/article/10.3390/su13147960/s1, Table S1: Bibliometric Data Sources.

Author Contributions

Conceptualization, T.O. and A.M.; methodology, T.O., S.A. and A.M.; software, T.O.; formal analysis, T.O., A.M. and B.A.; investigation, T.O. and S.A.; resources, T.O.; data curation, T.O. and S.A.; writing—original draft preparation, T.O. and A.M.; writing—review and editing, T.O., A.M., B.A. and S.A.; visualization, T.O. and S.A.; supervision, S.A.; project administration, B.A. and S.A.; funding acquisition, T.O. and S.A. All authors have read and agreed to the published version of the manuscript.

Funding

This study was funded by the School of Built Environment, Engineering and Computing of the Leeds Beckett University, UK.

Institutional Review Board Statement

The study was conducted according to the guidelines of the Declaration of Leeds Beckett University, and approved by the Institutional Ethics Committee of the School of Built Environment, Engineering and Computing, Leeds Beckett University (Application Ref: 83397 and 20 April 2021).

Data Availability Statement

Data is available in the supplementary article file.

Acknowledgments

The authors acknowledge the support and sponsorship of this article by the Research Unit of the School of Built Environment, Engineering and Computing, Leeds Beckett University, UK.

Conflicts of Interest

The authors declare no conflict of interest.

References

  1. Min-Allah, N.; Alrashed, S. Smart campus—A sketch. Sustain. Cities Soc. 2020, 59, 102231. [Google Scholar] [CrossRef]
  2. Chen, Y.; Zhang, R. The Construction and Trend of Intelligent Information Campus. In Proceedings of the 13th International Conference on Enterprise Information Systems, Beijing, China, 8–11 June 2011; SciTePress—Science and and Technology Publications: Beijing, China, 2011. [Google Scholar] [CrossRef]
  3. Awuzie, B.; Ngowi, A.B.; Omotayo, T.; Obi, L.; Akotia, J. Facilitating successful smart campus transitions: A systems thinking-SWOT analysis approach. Appl. Sci. 2021, 11, 2044. [Google Scholar] [CrossRef]
  4. Wang, F.; Jia, Z.-S. Constructing Digital Campus Using Campus Smart Card System. In Advances in Intelligent and Soft Computing; Springer: Berlin/Heidelberg, Germany, 2012; pp. 19–26. [Google Scholar] [CrossRef]
  5. Verstaevel, N.; Boes, J.; Gleizes, M.-P. From Smart Campus to Smart Cities: Issues of the Smart Revolution. Available online: https://hal.archives-ouvertes.fr/hal-01873804/document (accessed on 6 July 2021).
  6. Huang, Z. An analysis of information security and protection strategies in colleges and universities in the environment of smart campuses. J. Phys. Conf. Ser. 2021, 1852, 042050. [Google Scholar] [CrossRef]
  7. Ma, N.; Fu, W. Analysis of cloud computing algorithm based on smart campus message system. Int. J. Perform. Eng. 2019, 15, 700. [Google Scholar] [CrossRef]
  8. Du, S.; Meng, F.; Gao, B. Research on the application system of smart campus in the context of smart city. In Proceedings of the 2016 8th International Conference on Information Technology in Medicine and Education (ITME), Fuzhou, China, 23–25 December 2016. [Google Scholar]
  9. Huang, C. On study of building smart campus under conditions of cloud computing and internet of things. IOP Conf. Ser. Earth Environ. Sci. 2017, 100, 012118. [Google Scholar] [CrossRef] [Green Version]
  10. Zhicheng, D.; Feng, L. Evaluation of the Smart Campus Information Portal. In Proceedings of the 2018 2nd International Conference on Education and E-Learning, Bali, Indonesia, 5–7 November 2018; ACM: New York, NY, USA, 2018. [Google Scholar] [CrossRef]
  11. Tang, R.H.; Tang, Y.R.; Dong, J. The Design and Application of “Cloud-Edge-End” Integrated Computation in the Higher Education Teaching Informatization Construction. In Proceedings of the 2020 4th International Conference on Management Engineering, Software Engineering and Service Sciences, Wuhan, China, 17–19 January 2020; ACM: New York, NY, USA, 2020. [Google Scholar]
  12. Liu, H.; Zhu, Y.; Zang, T.; Yu, J.; Cai, H. Jointly Modeling Individual Student Behaviors and Social Influence for Prediction Tasks. In Proceedings of the 29th ACM International Conference on Information & Knowledge Management, Online, 19–23 October 2020; ACM: New York, NY, USA, 2020. [Google Scholar]
  13. Geng, L. Research on the design of teaching service app based on user experience—Taking “i Sino-Korea” as an example. In Proceedings of the 2017 12th International Conference on Computer Science and Education (ICCSE), Houston, TX, USA, 22–25 August 2017. [Google Scholar]
  14. Abd, A.M.; Hameed, A.H.; Nsaif, B.M. Documentation of construction project using integration of BIM and GIS technique. Asian J. Civ. Eng. 2020, 21, 1249–1257. [Google Scholar] [CrossRef]
  15. Li, M. Based on the construction of financial management information platform of colleges and universities in 5G environment—Take guangzhou nanyang polytechnic vocational college as an example. J. Phys. Conf. Ser. 2020, 1616, 012011. [Google Scholar] [CrossRef]
  16. Nan, F.; Suo, Y.; Jia, X.; Wu, Y.; Shan, S. Real-time monitoring of smart campus and construction of weibo public opinion platform. IEEE Access 2018, 6, 76502–76515. [Google Scholar] [CrossRef]
  17. Rong, J. Research on intelligent campus construction based on virtual reality technology. In Proceedings of the 2020 International Conference on Computer Vision, Image and Deep Learning (CVIDL), Nanchang, China, 15–17 May 2020. [Google Scholar]
  18. Pérez-Acebo, H.; Linares-Unamunzaga, A.; Abejón, R.; Rojí, E. Research trends in pavement management during the first years of the 21st century: A bibliometric analysis during the 2000–2013 period. Appl. Sci. 2018, 8, 1041. [Google Scholar] [CrossRef] [Green Version]
  19. Zyoud, S.H.; Waring, W.S.; Al-Jabi, S.W.; Sweileh, W.M. Global cocaine intoxication research trends during 1975–2015: A bibliometric analysis of web of science publications. Subst. Abus. Treat. Prev. Policy 2017, 12, 6. [Google Scholar] [CrossRef] [Green Version]
  20. Zhai, Z.; Shan, M.; Darko, A.; Chan, A.P.C. Corruption in construction projects: Bibliometric analysis of global research. Sustainability 2021, 13, 4400. [Google Scholar] [CrossRef]
  21. Hosseini, M.R.; Martek, I.; Zavadskas, E.K.; Aibinu, A.A.; Arashpour, M.; Chileshe, N. Critical evaluation of off-site construction research: A scientometric analysis. Autom. Constr. 2018, 87, 235–247. [Google Scholar] [CrossRef]
  22. Elsevier. Content Coverage Guide. 2010. Available online: https://www.elsevier.com/__data/assets/pdf_file/0017/114533/Scopus_GlobalResearch_Factsheet2019_FINAL_WEB.pdf (accessed on 6 July 2021).
  23. Wang, H.; Chen, Q.; Hong, A.; Wang, X.; Hou, Z.; Cheng, L. The hotspots of smart education in China: Base on the bibliometric analysis and knowledge mapping. IOP Conf. Ser. Mater. Sci. Eng. 2020, 806, 012016. [Google Scholar] [CrossRef]
  24. Bastidas-Manzano, A.B.; Sánchez-Fernández, J.; Casado-Aranda, L.A. The past, present, and future of smart tourism destinations: A bibliometric analysis. J. Hosp. Tour. Res. 2021, 45, 529–552. [Google Scholar] [CrossRef]
  25. Rochat, Y. Closeness Centrality Extended to Unconnected Graphs: The Harmonic Centrality Index; University of Lausanne: Lausanne, Switzerland, 2009. [Google Scholar]
  26. Thangaraj, M.; Amutha, S. Mgephi: Modified gephi for effective social network analysis. Int. J. Sci. Res. Comput. Sci. Eng. Inf. Technol. 2018, 1, 39–50. [Google Scholar]
  27. Grandjean, M. Gephi: Introduction to Network Analysis and Visualization. 2015. Available online: http://www.martingrandjean.ch/gephi-introduction/ (accessed on 5 June 2021).
  28. Abejón, R.; Pérez-Acebo, H.; Clavijo, L. Alternatives for chemical and biochemical lignin valorization: Hot topics from a bibliometric analysis of the research published during the 2000–2016 period. Processes 2018, 6, 98. [Google Scholar] [CrossRef] [Green Version]
  29. Chen, H.; Jiang, W.; Yang, Y.; Yang, Y.; Man, X. State of the art on food waste research: A bibliometrics study from 1997 to 2014. J. Clean. Prod. 2017, 140, 840–846. [Google Scholar] [CrossRef]
  30. Qi, X.W.; Hao, Z.P. Design of smart wireless campus network based on zigbee. Appl. Mech. Mater. 2014, 687–691, 1864–1867. [Google Scholar] [CrossRef]
  31. Wan, L.; Deng, Z.H. Research on the construction of smarter campus system based on mobile phone M2M. Appl. Mech. Mater. 2014, 635–637, 1806–1810. [Google Scholar] [CrossRef]
  32. Wang, H.I. Constructing the green campus within the internet of things architecture. Int. J. Distrib. Sens. Netw. 2014, 10, 804627. [Google Scholar] [CrossRef] [Green Version]
  33. Zhang, W. Research and Practice of Cloud Desktop Teaching System. In Advances in Intelligent Systems and Computing; Springer International Publishing: Cham, Switzerland, 2020; pp. 638–642. [Google Scholar] [CrossRef]
  34. Feng, P. Construction of Smart Campus under the Background of Big Data. In Application of Intelligent Systems in Multi-Modal Information Analytics; Springer International Publishing: Cham, Switzerland, 2021; pp. 32–36. [Google Scholar]
  35. Putman, K.; Boekhout, H.D.; Takes, F.W. Fast Incremental Computation of Harmonic Closeness Centrality in Directed Weighted Networks. In Proceedings of the 2019 IEEE/ACM International Conference on Advances in Social Networks Analysis and Mining, Vancouver, BC, Canada, 27–30 August 2019; ACM: New York, NY, USA, 2019. [Google Scholar] [CrossRef]
  36. Althobaiti, M.M.; Technology, I.; Arabia, S. Toward a smart campus based on smart technologies and best. Build. Res. Inf. 2020, 49, 1–20. [Google Scholar]
  37. Wang, J.; Yu, X.; Zeng, Y.; Yang, D. The Design and Realization of Campus Information Release Platform Based on Android Framework. In Communications in Computer and Information Science; Springer: Berlin/Heidelberg, Germany, 2013; pp. 121–128. [Google Scholar] [CrossRef]
  38. Feng, P. Construction of Intelligent Campus Information under the Background of Big Data. In Advances in Intelligent Systems and Computing; Springer International Publishing: Cham, Switzerland, 2021; pp. 1012–1017. [Google Scholar]
  39. Qian, T.; Zhang, Q. Research on Teaching Management of Applied University Based on Big Data. In Advances in Intelligent Systems and Computing; Springer International Publishing: Cham, Switzerland, 2021; pp. 666–674. [Google Scholar] [CrossRef]
  40. Xiao, F.; Haigen, Y.; Qian, D.; Yusheng, H.; Hongyan, Y.; Wenting, X.; Jun, M.; Feng, G. Research and design of digital library based on virtual reality. In Proceedings of the 2019 IEEE 4th International Conference on Image, Vision and Computing (ICIVC), Xiamen, China, 5–7 July 2019. [Google Scholar]
  41. Rosado, L.; Hagy, S.; Kalmykova, Y.; Morrison, G.; Ostermeyer, Y. A living lab co-creation environment exemplifying factor 10 improvements in a city district. J. Urban Regen. Renew. 2015, 8, 171–185. [Google Scholar]
  42. Zhan, H.; Liu, Z.; Lu, F.; Ma, X.; Zhang, S.; Chen, Y. A Construction Framework Design of Smart Classroom in Universities Based on Pedagogy-Space-Technology Framework. In Innovative Computing; Lecture Notes in Electrical Engineering; Springer: Singapore, 2020; pp. 1647–1654. [Google Scholar]
  43. Kaplan, D. The Bellwether—A Passive House Tower Renews a Public Housing Campus. 50 Forward 50 Back: The Recent History and Essential Future of Sustainable Cities. Available online: https://global.ctbuh.org/resources/papers/download/4284-the-bellwethera-passive-house-tower-renews-a-public-housing-campus.pdf (accessed on 5 June 2021).
  44. Zhou, Z.; Yu, H.; Shi, H. Optimization of wireless video surveillance system for smart campus based on internet of things. IEEE Access 2020, 8, 136434–136448. [Google Scholar] [CrossRef]
  45. Mostafa, S.A.; Mustapha, A.; Ramli, A.A.; Jubair, M.A.; Hassan, M.H.; Abbas, A.H. Comparative Analysis to the Performance of Three Mobile Ad-Hoc Network Routing Protocols in Time-Critical Events of Search and Rescue Missions. In Advances in Simulation and Digital Human Modeling; Springer International Publishing: Cham, Switzerland, 2021; pp. 117–123. [Google Scholar]
  46. Pasetti, M.; Sisinni, E.; Ferrari, P.; Rinaldi, S.; Depari, A.; Bellagente, P.; Della Giustina, D.; Flammini, A. Evaluation of the use of class B LoRaWAN for the coordination of distributed interface protection systems in smart grids. J. Sens. Actuator Netw. 2020, 9, 13. [Google Scholar] [CrossRef] [Green Version]
  47. Chen, K.; He, J. Big-Data-Based Research on the Architecture Design of University Hydropower Intelligent Decision Service Platform. In Proceedings of the 2021 9th International Conference on Communications and Broadband Networking, Shanghai, China, 25–27 February 2021; ACM: New York, NY, USA, 2021. [Google Scholar] [CrossRef]
  48. Hou, D. Exploration and Practice of the Joint Operation Model of Campus Network in Border Universities. In Application of Intelligent Systems in Multi-modal Information Analytics; Springer International Publishing: Cham, Switzerland, 2021; pp. 715–722. [Google Scholar] [CrossRef]
  49. Zhen, Z. Research and Design of Big Data Unified Analysis Platform Based on Cloud Computing. In Application of Intelligent Systems in Multi-Modal Information Analytics; Springer International Publishing: Cham, Switzerland, 2021; pp. 908–913. [Google Scholar] [CrossRef]
  50. Formhals, J.; Feike, F.; Hemmatabady, H.; Welsch, B.; Sass, I. Strategies for a transition towards a solar district heating grid with integrated seasonal geothermal energy storage. Energy 2021, 228, 120662. [Google Scholar] [CrossRef]
  51. He, X.; Zhang, W. Research on the Application Status of University Sports Big Data. In Proceedings of the 2021 2nd International Conference on Computers, Information Processing and Advanced Education, Ottawa, ON, Canada, 25–27 May 2021; ACM: New York, NY, USA, 2021. [Google Scholar] [CrossRef]
  52. Wu, B.; Wang, Y.; Liu, R.; Tan, S.; Hao, R. Research of intelligent campus design based on immersive bim + vr technology. J. Phys. Conf. Ser. 2021, 1885, 052053. [Google Scholar] [CrossRef]
  53. Wu, B.; Hao, R.; Li, H.; Chai, Q.; Wang, Y. Research on intelligent campus system design based on BIM & VR/AR technology. J. Phys. Conf. Ser. 2021, 1885, 052050. [Google Scholar] [CrossRef]
  54. Pingrong, L.; Xiaoquan, S.; Junqin, Y. Research on the application of DevOps in the smart campus of colleges and universities. J. Phys. Conf. Ser. 2021, 1883, 012101. [Google Scholar] [CrossRef]
  55. Li, Y. Application of big data technology in campus security management under the background of information age. J. Phys. Conf. Ser. 2021, 1881, 022097. [Google Scholar] [CrossRef]
  56. Li, G.; Zheng, C.; Han, D.; Li, M. Research on smart campus architecture based on the six domain model of the internet of things. J. Phys. Conf. Ser. 2021, 1861, 012038. [Google Scholar] [CrossRef]
  57. Guofeng, X.; Mingzhu, L. The application of big data technology in the construction of smart campus in vocational colleges. J. Phys. Conf. Ser. 2021, 1827, 012134. [Google Scholar] [CrossRef]
  58. Crisis, J.S.; Van Els, R.H. Design of a Smart Microgrid Laboratory Platform for University Campus. In Transdisciplinary Engineering: Crossing Boundaries; Borsato, M., Ed.; IOS Press: Amsterdam, The Netherlands, 2016; pp. 206–215. [Google Scholar] [CrossRef]
  59. Mazza, I.F.S. Strategic Management of Resources and Technologies for a Smart and Green Space Campus. In Proceedings of the International Astronautical Congress, Jerusalem, Israel, 12–16 October 2015; pp. 9476–9480. [Google Scholar]
  60. Michailidis, I.T.; Schild, T.; Sangi, R.; Michailidis, P.; Korkas, C.; Fütterer, J.; Müller, D.; Kosmatopoulos, E.B. Energy-efficient HVAC management using cooperative, self-trained, control agents: A real-life german building case study. Appl. Energy 2018, 211, 113–125. [Google Scholar] [CrossRef]
  61. Kiefer, C.P.; Carrillo-Hermosilla, J.; Del Río, P.; Barroso, F.J.C. Diversity of eco-innovations: A quantitative approach. J. Clean. Prod. 2017, 166, 1494–1506. [Google Scholar] [CrossRef]
  62. Karabetça, A.R. Resilient materials and structures emulating natural organisms. In Proceedings of the 3rd International Conference on New Trends in Architecture and Interior Design, Helsinki, Finland, 28–30 April 2017. [Google Scholar]
  63. Cao, J.; Li, Z.; Luo, Q.; Hao, Q.; Jiang, T. Research on the construction of smart university campus based on big data and cloud computing. In Proceedings of the 2018 International Conference on Engineering Simulation and Intelligent Control (ESAIC), Changsha, China, 10–11 August 2018. [Google Scholar]
  64. Tang, Z. On study of application of big data and cloud computing technology in smart campus. IOP Conf. Ser. Earth Environ. Sci. 2017, 100, 012026. [Google Scholar] [CrossRef] [Green Version]
  65. Liu, Y.L.; Zhang, W.H.; Dong, P. Research on the construction of smart campus based on the internet of things and cloud computing. Appl. Mech. Mater. 2014, 543–547, 3213–3217. [Google Scholar] [CrossRef]
  66. Yang, C.T.; Chen, S.T.; Liu, J.C.; Liu, R.H.; Chang, C.L. On construction of an energy monitoring service using big data technology for the smart campus. Clust. Comput. 2020, 23, 265–288. [Google Scholar] [CrossRef]
  67. Fangguo, W. Design of teaching model of ideological and political education network course based on educational cloud platform. In Proceedings of the 2020 5th International Conference on Smart Grid and Electrical Automation (ICSGEA), Zhangjiajie, China, 13–14 June 2020. [Google Scholar]
  68. Reddy, S.K.; Pal, P.K. Detection of traversable region around a mobile robot by computing terrain unevenness from the range data of a 3D laser scanner. Int. J. Intell. Unmanned Syst. 2016, 4, 107–128. [Google Scholar] [CrossRef]
  69. Nielsen, E.S. Smart Growth Machines: The Ecological Modernization of Urban Political Economy. In From Sustainable to Resilient Cities: Global Concerns and Urban Efforts (Research in Urban Sociology, Vol. 14); Emerald Group Publishing Limited: Bingley, UK, 2014; pp. 169–190. [Google Scholar] [CrossRef]
  70. Slavova, M.; Okwechime, E. African smart cities strategies for agenda 2063. Afr. J. Manag. 2016, 2, 210–229. [Google Scholar] [CrossRef]
  71. Toutouh, J.; Arellano, J.; Alba, E. BiPred: A bilevel evolutionary algorithm for prediction in smart mobility. Sensors 2018, 18, 4123. [Google Scholar] [CrossRef] [PubMed] [Green Version]
  72. Shen, Q.; Wang, H.; Tang, B.-S. A decision-making framework for sustainable land use in Hong Kong’s urban renewal projects. Smart Sustain. Built Environ. 2014, 3, 35–53. [Google Scholar] [CrossRef]
  73. Cacho, A.; Mendes-Filho, L.; Estaregue, D.; Moura, B.; Cacho, N.; Lopes, F.; Alves, C. Mobile tourist guide supporting a smart city initiative: A brazilian case study. Int. J. Tour. Cities 2016, 2, 164–183. [Google Scholar] [CrossRef]
  74. Advanced Material Research. In Proceedings of the 2nd International Conference on Smart City and Systems Engineering, Changsha, China, 11–12 November 2017; Available online: https://searchworks.stanford.edu/view/13498238 (accessed on 5 June 2021).
  75. Sidawi, B.; Deakin, M. Diabetes, built environments and (Un) healthy lifestyles: The potential of smart city technologies. Smart Sustain. Built Environ. 2013, 2, 311–323. [Google Scholar] [CrossRef]
  76. Bifulco, F.; Tregua, M.; Amitrano, C.C.; D’Auria, A. ICT and sustainability in smart cities management. Int. J. Public Sect. Manag. 2016, 29, 132–147. [Google Scholar] [CrossRef]
  77. Wang, M.; Liu, Y. Wisdom city under the perspective of intelligent factors of the brand of meta-analysis in colleges and universities to explore. J. Phys. Conf. Ser. 2020, 1533, 032079. [Google Scholar] [CrossRef]
  78. Capdevila, I.; Zarlenga, M.I. Smart city or smart citizens? The barcelona case. J. Strat. Manag. 2015, 8, 266–282. [Google Scholar] [CrossRef]
  79. Scuotto, V.; Ferraris, A.; Bresciani, S. Internet of things: Applications and challenges in smart cities: A case study of IBM smart city projects. Bus. Process Manag. J. 2016, 22. [Google Scholar] [CrossRef]
  80. Nyberg, R.A.; Yarime, M. Assembling a Field into Place: Smart-City Development in Japan. In Emergence (Research in the Sociology of Organisations, Vol. 50); Emerald Publishing Limited: Bingley, UK, 2017; pp. 253–279. [Google Scholar] [CrossRef]
  81. Girtelschmid, S.; Steinbauer, M.; Kumar, V.; Fensel, A.; Kotsis, G. On the application of big data in future large-scale intelligent smart city installations. Int. J. Pervasive Comput. Commun. 2014, 10, 168–182. [Google Scholar] [CrossRef]
  82. Riezebos, J.; Huisman, B. Value stream mapping in education: Addressing work stress. Int. J. Qual. Reliab. Manag. 2020, 38, 1044–1061. [Google Scholar] [CrossRef]
  83. Ying, H. Study on the key algorithms and framework design of intelligent campus education platform based on big data technology. Bol. Tec. Tech. Bull. 2017, 55, 63–69. [Google Scholar]
  84. Li, Y.Y.; Chen, H.H.; Shao, W.C.; Jing, S.R.; Chiu, F.Y.; Su, H.J. Practices of innovative technology and education for sustainability in Taiwan sustainable campus program. In Proceedings of the 2017 Pacific Neighborhood Consortium Annual Conference and Joint Meetings (PNC), Taiwan, China, 7–9 November 2017. [Google Scholar]
  85. Molderez, I.; Ceulemans, K. The power of art to foster systems thinking, one of the key competencies of education for sustainable development. J. Clean. Prod. 2018, 186, 758–770. [Google Scholar] [CrossRef]
  86. Balzer, W.K.; Brodke, M.H.; Kizhakethalackal, E.T. Lean higher education: Successes, challenges, and realizing potential. Int. J. Qual. Reliab. Manag. 2015, 32, 924–933. [Google Scholar] [CrossRef]
  87. Zhang, W.; Jiang, L. Algorithm analysis for big data in education based on depth learning. Wirel. Pers. Commun. 2018, 102, 3111–3119. [Google Scholar] [CrossRef]
  88. Williams, A.; Kennedy, S.; Philipp, F.; Whiteman, G. Systems thinking: A review of sustainability management research. J. Clean. Prod. 2017, 148, 866–881. [Google Scholar] [CrossRef] [Green Version]
  89. Li, W. Design of smart campus management system based on internet of things technology. IEEE Access 2018, 6, 62601–62611. [Google Scholar] [CrossRef]
  90. Alkhammash, M.; Beloff, N.; White, M. An Internet of Things and Blockchain Based Smart Campus Architecture. In Advances in Intelligent Systems and Computing; Springer International Publishing: Cham, Switzerland, 2020; pp. 467–486. [Google Scholar] [CrossRef]
  91. Tang, H.; Chen, C. The construction of intelligent transportation system based on the construction of wisdom campus—Take soochow university as an example. In Proceedings of the 2016 Eighth International Conference on Measuring Technology and Mechatronics Automation (ICMTMA), Macau, China, 11–12 March 2016. [Google Scholar]
  92. Li, N.N.; Zhang, X.F.; Wang, Y.F.; Zhang, R. Design and implementation of campus dining application based on android. Appl. Mech. Mater. 2014, 556–562, 5250–5254. [Google Scholar] [CrossRef]
  93. Ebadi, N.; Kang, J.E.; Hasan, S. Constructing activity–mobility trajectories of college students based on smart card transaction data. Int. J. Transp. Sci. Technol. 2017, 6, 316–329. [Google Scholar] [CrossRef]
  94. Qianqiu, D. Exploration on the cultivation of college students’ leadership under the smart campus system. In Proceedings of the 2020 International Conference on Modern Education and Information Management (ICMEIM), Changsha, China, 18–20 September 2020. [Google Scholar]
  95. Betancur, M.J.; Restrepo, V.; Perez, J.J.; Restrepo, J.A.; Agudelo, A.; Cuartas-Ramirez, D. An approximation to the construction of pedestrian smart cities. In Proceedings of the 2019 IEEE 4th Colombian Conference on Automatic Control (CCAC), Medellin, Colombia, 15–18 October 2019. [Google Scholar]
  96. Chang, C.H.; Jiang, F.C.; Yang, C.T.; Chou, S.C. On construction of a big data warehouse accessing platform for campus power usages. J. Parallel Distrib. Comput. 2019, 133, 40–50. [Google Scholar] [CrossRef]
  97. Huang, Y.; Ali, S.; Bi, X.; Zhai, X.; Liu, R.; Guo, F.; Yu, P. Research on smart campus based on the internet of things and virtual reality. Int. J. Smart Home 2016, 10, 213–220. [Google Scholar] [CrossRef]
  98. Caranica, A.; Vulpe, A.; Fratu, O. Tenable Smart Building Security Flow Architecture Using Open Source Tools. In Advances in Intelligent Systems and Computing; Springer International Publishing: Cham, Switzerland, 2018; pp. 118–127. [Google Scholar]
  99. Xie, J.; Yang, Y. IoT-based model for intelligent innovation practice system in higher education institutions. J. Intell. Fuzzy Syst. 2021, 40, 2861–2870. [Google Scholar] [CrossRef]
  100. Fortino, G.; Russo, W.; Savaglio, C.; Shen, W.; Zhou, M. Agent-oriented cooperative smart objects: From iot system design to implementation. IEEE Trans. Syst. Man Cybern. Syst. 2018, 48, 1939–1956. [Google Scholar] [CrossRef]
  101. Vivi, Q.L.; Parlikad, A.K.; Woodall, P.; Ranasinghe, G.D.; Heaton, J. Developing a Dynamic Digital Twin at a Building Level: Using Cambridge Campus as Case Study. In Proceedings of the International Conference on Smart Infrastructure and Construction 2019 (ICSIC), Cambridge, UK, 8–10 July 2019; ICE Publishing: Cambridge, UK, 2019. [Google Scholar] [CrossRef] [Green Version]
  102. Zhang, L.; Yuan, H.; Chang, S.-H.; Lam, A. Research on the overall architecture of internet of things middleware for intelligent industrial parks. Int. J. Adv. Manuf. Technol. 2020, 107, 1081–1089. [Google Scholar] [CrossRef]
  103. Wang, L.; Li, K.; Chen, X. Internet of Things Security Analysis of Smart Campus. In Cloud Computing and Security; Springer International Publishing: Cham, Switzerland, 2018; pp. 418–428. [Google Scholar]
  104. Liu, B.; Du, Z. Advances in Services Science and Services Information Technology; WIT Press: Southampton, UK, 2014. [Google Scholar]
  105. Wang, Y.; Si, H.; Su, Y.; Xu, P. Advances in Applied Sciences and Manufacturing. In Proceedings of the 2013 International Forum on Materials Analysis and Testing Technology (IFMATT 2013), Qingdao, China, 9–10 December 2013; Collection of Selected, Peer Reviewed Papers. Available online: https://www.scientific.net/book/advances-in-applied-sciences-and-manufacturing/978-3-03826-334-0 (accessed on 6 July 2021).
  106. Haupt, T.C.; Pillay, K. Investigating the true costs of construction accidents. J. Eng. Des. Technol. 2016, 14, 373–419. [Google Scholar] [CrossRef]
  107. Pino, M.; Mortari, L. The inclusion of students with dyslexia in higher education: A systematic review using narrative synthesis: The inclusion of students with dyslexia in HE. Dyslexia 2014, 20, 346–369. [Google Scholar] [CrossRef] [PubMed] [Green Version]
  108. Ryder, D.T. Dyslexia Assessment Practice within the UK Higher Education Sector: Assessor, Lecturer and Student Perspectives. Ph.D. Thesis, University of Exeter, Exeter, UK, 2016. [Google Scholar] [CrossRef] [Green Version]
  109. Case Study: Supporting a Dyslexic Student. Available online: https://www.ed.ac.uk/student-disability-service/staff/supporting-students-key-information-for-staff/case-study-supporting-a-dyslexic-student (accessed on 6 July 2021).
  110. Bilau, A.B.; Ajagbe, A.S.; Kigbu, H.H.; Sholanke, A.B. Review of shortage of skilled craftsmen in small and medium construction firms in Nigeria. J. Environ. Earth Sci. 2015, 5, 98–111. [Google Scholar]
  111. Writing Skills. Dyslexia in Higher Education. Available online: http://crr.ugent.be/papers/Doctoraat_wim_tops.pdf (accessed on 6 July 2021).
  112. Zhang, X.; Sun, G.; Pan, Y.; Sun, H.; He, Y.; Tan, J. Students performance modeling based on behavior pattern. J. Ambient Intell. Humaniz. Comput. 2018, 9, 1659–1670. [Google Scholar] [CrossRef]
  113. Zhang, X.; Sun, G.; Pan, Y.; Sun, H.; Tan, J. Poor performance discovery of college students based on behavior pattern. In Proceedings of the 2017 IEEE SmartWorld, Ubiquitous Intelligence & Computing, Advanced & Trusted Computed, Scalable Computing & Communications, Cloud & Big Data Computing, Internet of People and Smart City Innovation (SmartWorld/SCALCOM/UIC/ATC/CBDCom/IOP/SCI), San Francisco, CA, USA, 4–8 August 2017. [Google Scholar]
  114. Xu, X.; Wang, Y.; Yu, S. Teaching performance evaluation in smart campus. IEEE Access 2018, 6, 77754–77766. [Google Scholar] [CrossRef]
  115. Bracco, S.; Delfino, F.; Pampararo, F.; Robba, M.; Rossi, M. Economic and environmental performances quantification of the university of genoa smart polygeneration microgrid. In Proceedings of the 2012 IEEE International Energy Conference and Exhibition (ENERGYCON), Florence, Italy, 9–12 September 2012. [Google Scholar]
  116. Zhai, X.; Dong, Y.; Yuan, J. Investigating learners’ technology engagement—A perspective from ubiquitous game-based learning in smart campus. IEEE Access 2018, 6, 10279–10287. [Google Scholar] [CrossRef]
  117. Kim, J.; Cheong, S.K. Research on an authentication algorithm for an electronic attendance system in the constructing of a smart campus. Int. J. Secur. Appl. 2013, 7, 199–208. [Google Scholar] [CrossRef]
  118. Gao, B.; Liu, F.; Du, S.; Meng, F. An OAuth2.0-Based Unified Authentication System for Secure Services in the Smart Campus Environment. In Proceedings of the International Conference on Computational Science, Wuxi, China, 11–13 June 2018; Lecture Notes in Computer Science. Springer International Publishing: Cham, Switzerland, 2018; pp. 752–764. [Google Scholar] [CrossRef]
  119. Liu, B.; Liu, R.; Lu, X.; Xie, Y.; Wang, X. Study of the virtual reality smart simulation campus based on vega. In Proceedings of the 2011 Second International Conference on Mechanic Automation and Control Engineering, Inner Mongolia, China, 15–17 July 2011. [Google Scholar]
  120. Sun, R.; Xi, J.; Yin, C.; Wang, J.; Kim, G.J. Location privacy protection research based on querying anonymous region construction for smart campus. Mob. Inf. Syst. 2018, 2018, 3682382. [Google Scholar] [CrossRef]
  121. Xing, C.J.; Yuan, L.; Yang, X.; Lai, T.-P.; Zhang, Z.-K. Research and practice on self-service terminal in smart campus. Tongxin Xuebao J. Commun. 2014, 35, 118–123. [Google Scholar] [CrossRef]
  122. Broujeny, R.S.; Madani, K.; Chebira, A.; Amarger, V.; Hurtard, L. Data-driven living spaces’ heating dynamics modeling in smart buildings using machine learning-based identification. Sensors 2020, 20, 1071. [Google Scholar] [CrossRef] [Green Version]
  123. Liu, D.; Huang, R.; Wosinski, M. Smart Learning in Digital Campus. In Smart Learning in Smart Cities; Lecture Notes in Educational Technology; Springer: Singapore, 2017; pp. 51–90. [Google Scholar]
  124. Qin, D.; Lin, W.; Xu, G.; Chen, X. Exploration of campus card management from the perspective of network security. Shenzhen Daxue Xuebao (Ligong Ban) J. Shenzhen Univ. Sci. Eng. 2020, 2020, 64–67. [Google Scholar] [CrossRef]
  125. Vivi, Q.L.; Parlikad, A.K.; Woodall, P.; Ranasinghe, G.D.; Heaton, J.; Li, G. Development of a virtual butterfly ecological system based on augmented reality and mobile learning technologies. Virtual Real. 2015, 19, 253–266. [Google Scholar] [CrossRef]
  126. Jiang, T.; Cao, J.; Su, D.; Yang, X. Analysis and data mining of students’ consumption behavior based on a campus card system. In Proceedings of the 2017 International Conference on Smart City and Systems Engineering (ICSCSE), Changsha, China, 11–12 November 2017. [Google Scholar]
  127. Wang, F.; Wang, F.; Hang, L. Research and implementation of campus card data analysis system. In Proceedings of the 13th International Conference on Enterprise Information Systems, Beijing, China, 8–11 June 2011; pp. 515–518. [Google Scholar]
  128. Chen, W.Z.Y. Data mining method for implicit user behavior in smart campus. Liaoning Gongcheng Jishu Daxue Xuebao (Ziran Kexue Ban) J. Liaoning Tech. Univ. (Nat. Sci. Ed.) 2020, 39, 434–439. [Google Scholar]
  129. Azad University of Quchan; National Institute of Technology Rourkela; University Polytechnic of Bucharest. Advanced Materials Research. In Proceedings of the 2013 International Conference on Mechatronics and Semiconductor Materials (ICMSCM 2013), Xi’an, China, 28–29 September 2013. [Google Scholar]
  130. Zhang, L.; Song, W. Research on Intrusion Detection Algorithm Based on Smart Campus Network Security. In Proceedings of the 2020 International Conference on Aviation Safety and Information Technology, Weihai, China, 14–16 October 2020; ACM: New York, NY, USA, 2020. [Google Scholar] [CrossRef]
  131. Li, Y. Research on building smart campus based on cloud computing technology. In Proceedings of the 2020 5th International Conference on Mechanical, Control and Computer Engineering (ICMCCE), Harbin, China, 25–27 December 2020. [Google Scholar]
  132. Zhang, Z.; Hu, G.; Wu, F.; Wang, C. The campus surveying control network digital construction planning and implementation. In Proceedings of the 2018 26th International Conference on Geoinformatics, Kunming, China, 28–30 June 2018. [Google Scholar]
  133. Cai, Z. Campus employment information network development based on android platform; big data and smart city. In Proceedings of the 2015 International Conference on Intelligent Transportation, Big Data and Smart City, Halong Bay, Vietnam, 19–20 December 2015; pp. 196–199. [Google Scholar] [CrossRef]
  134. Gupta, S.K.; Ashwin, T.S.; Guddeti, R.M.R. Students’ affective content analysis in smart classroom environment using deep learning techniques. Multimed. Tools Appl. 2019, 78, 25321–25348. [Google Scholar] [CrossRef]
  135. Chen, L.W.; Chen, T.P.; Chen, D.E.; Liu, J.X.; Tsai, M.F. Smart campus care and guiding with dedicated video footprinting through internet of things technologies. IEEE Access 2018, 6, 43956–43966. [Google Scholar] [CrossRef]
  136. Luo, L. Data acquisition and analysis of smart campus based on wireless sensor. Wirel. Pers. Commun. 2018, 102, 2897–2911. [Google Scholar] [CrossRef]
  137. Liang, W. Analysis of the application of artificial intelligence technology in the construction of smart campus. In Proceedings of the 2020 International Wireless Communications and Mobile Computing (IWCMC), Limassol, Cyprus, 15–19 June 2020. [Google Scholar]
  138. Zhou, X. Application research of face recognition technology in smart campus. J. Phys. Conf. Ser. 2020, 1437, 012130. [Google Scholar] [CrossRef]
  139. Moutinho, C.; Cunha, Á.; Caetano, E. Reducing Vibrations in a Footbridge Using a Semi-Active Tuned Mass Damper. In Proceedings of the 6th International Conference on Computational Methods in Structural Dynamics and Earthquake Engineering (COMPDYN 2015), Athens, Greece, 15–17 June 2017. [Google Scholar]
  140. Reddy, B.V.; Sahu, S.K.; Kandasamy, A.; de la Sen, M. (Eds.) Advanced Development in Industry and Applied Mechanics: Selected, Peer Reviewed Papers from the 3rd International Conference on Advances in Mechanics Engineering (ICAME 2014), July 28-29, Hong Kong, China; Trans Tech Publications: Zürich, Switzerland, 2014. [Google Scholar]
  141. Villegas-Ch, W.; Palacios-Pacheco, X.; Luján-Mora, S. Application of a smart city model to a traditional university campus with a big data architecture: A sustainable smart campus. Sustainability 2019, 11, 2857. [Google Scholar] [CrossRef] [Green Version]
  142. Banta, L.; Rossi, I.; Traverso, A.; Traverso, A.N. Advanced control of a real smart polygeneration microgrid. Energy Procedia 2014, 61, 274–277. [Google Scholar] [CrossRef] [Green Version]
  143. Mi, Z.; Cao, Z. Construction of the Computer Network Courses in College Physical Education Distance Video Teaching. In Advances in Intelligent Systems and Computing; Springer: Singapore, 2020; pp. 1567–1572. [Google Scholar]
  144. Omotayo, T.S.; Boateng, P.; Osobajo, O.; Oke, A.; Obi, L.I. Systems thinking and CMM for continuous improvement in the construction industry. Int. J. Product. Perform. Manag. 2019, 69, 271–296. [Google Scholar] [CrossRef]
  145. Omotayo, T.; Bankole, A.; Olanipekun, A.O. An artificial neural network approach to predicting most applicable post-contract cost controlling techniques in construction projects. Appl. Sci. 2020, 10, 5171. [Google Scholar] [CrossRef]
  146. Advanced Materials Research. In Proceedings of the 3rd International Conference on Energy, Environment and Sustainable Development (EESD 2013), Shanghai, China, 12–13 November 2013; Available online: https://hmongstudies.library.wisc.edu/catalog/HmongStudies2330 (accessed on 5 July 2021).
Figure 1. Annual trends in smart-campus-related publications.
Sustainability 13 07960 g001
Figure 2. Published articles on smart campus around the world.
Sustainability 13 07960 g002
Figure 3. Indicating the modularity classes from the social network analysis in Gephi.
Sustainability 13 07960 g003
Figure 4. Initial Smart campus social network map.
Sustainability 13 07960 g004
Figure 5. Network showing modularity 0-Auto-analysers.
Sustainability 13 07960 g005
Figure 6. Network showing modularity 1-Energy management system (EMS).
Sustainability 13 07960 g006
Figure 7. Network showing modularity 2-Cloud computing.
Sustainability 13 07960 g007
Figure 8. Network showing modularity 3-Smart city.
Sustainability 13 07960 g008
Figure 9. Network showing modularity 4-Education management system.
Sustainability 13 07960 g009
Figure 10. Network showing modularity 5-Smart campus network grid.
Sustainability 13 07960 g010
Figure 11. Network showing modularity 6-Internet of things (IoTs) and smart buildings.
Sustainability 13 07960 g011
Figure 12. Network showing modularity 7-Inclusive smart technology.
Sustainability 13 07960 g012
Figure 13. Network showing modularity 8-Performance measurement and forecasting.
Sustainability 13 07960 g013
Figure 14. Network showing modularity 9-Smart campus applications.
Sustainability 13 07960 g014
Figure 15. Network showing modularity 10-Learning management system.
Sustainability 13 07960 g015
Figure 16. Network showing modularity 11-Data mining.
Sustainability 13 07960 g016
Figure 17. Network showing modularity 12-Campus information portal.
Sustainability 13 07960 g017
Figure 18. Network showing modularity 13-Deep learning architecture.
Sustainability 13 07960 g018
Figure 19. Network showing modularity 14-Campus Equipment Management Service (CEMS).
Sustainability 13 07960 g019
Figure 20. Conceptual framework illustrating the infrastructure elements for smart campus.
Sustainability 13 07960 g020
Table 1. Publication extraction protocol.
SourceInput Variables
Web of Science and Scopus“Smart” AND “campus” AND “construction” OR “procurement” AND “smart” AND campus OR “infrastructure” AND “smart” AND “campus” OR “smart” AND “campus” AND “technologies” OR “Colleges” AND “Universities” AND “smart” OR “Digital” AND “Campus” AND “students”
Limiters2011–2021
Table 2. Indicating the modularity, cluster themes.
IDModularity NumberModularity Percentage (%)Cluster ThemesClustered Year of Publication
1521.80Smart campus network grid2018
2613.15Internet of things (IoT) and smart buildings2020
327.44Cloud computing2020
4127.44Campus information portal2020
5106.92Learning management system2018
6135.71Deep learning architecture2020
7145.71Campus Equipment Management Service (CEMS)2012
8115.54Data mining2018
934.67Smart city2018
1074.67Inclusive smart technology2018
1194.67Smart campus applications2020
1203.98Auto-analysers2019
1383.29Performance measurement and forecasting2020
1412.77Energy management system2015
1542.25Education management system2012
Table 3. Modularity 0-Auto-analysers (Sources: [1,14,23,24,33,34,35,36,37,38,39,40,41]).
ThemeDriversHarmonic Closeness CentralityNo. of Documents%Type of Publication
Auto-analysersAir quality monitoring0.458418.2%Journal articles & conference papers
Machine learning0.422627.3%Journal articles & conference paper
Empirical0.44214.5%Journal article
Experiment0.44129.1%Journal articles & conference paper
LoRaWAN0.421522.7%Journal articles & conference paper
Interference0.39414.5%Journal article
Testbed0.44529.1%Journal articles & conference paper
Packet error rate0.39214.5%Journal article
Table 4. Modularity 1-Energy management system (Source: [6,36,42,43,44,45,46,47,48,49,50,51,52,53,54,55,56,57,58,59,60]).
ThemeDriversHarmonic Closeness CentralityNo. of Documents%Type of Publication
Energy management system (EMS)Renewable energy0.396225.0%Journal articles & conference papers
BIM to BEM0.399112.5%Journal article
Energy renovation0.397112.5%Journal article
Photovoltaic0.399225.0%Journal articles
Laser scanner0.394112.5%Journal article
Net-zero energy building0.359112.5%Conference paper
Table 5. Modularity 2-Cloud computing (Sources: [5,7,9,10,11,30,31,37,39,61,62,63,64,65,66]).
ThemeDriversHarmonic Closeness CentralityNo. of Documents%Type of Publication
Cloud computingBiometric security0.42025.9%Journal article & Conference paper
Smart University0.4421132.4%Journal articles & conference papers
Adaptive learning0.47825.9%Journal articles
Crowd detection0.478617.6%Journal articles & conference papers
Architecture0.47425.9%Journal articles
Participatory sensing0.40138.8%Journal articles & conference papers
Local binary pattern0.39625.9%Journal article & Conference paper
Sustainable development goals (SDGs)0.360411.8%Journal articles
Smart community0.32012.9%Conference paper
Smartness features0.35812.9%Journal article
Table 6. Modularity 3-Smart city (Sources: [1,8,67,68,69,70,71,72,73,74,75,76,77,78,79,80,81]).
ThemeDriversHarmonic Closeness CentralityNo. of Documents%Type of Publication
Smart cityUrban planning0.394212.5%Conference papers
GPS0.414318.8%Journal articles & conference papers
Data fusion0.459425.0%Journal articles & conference paper
Vehicle monitoring0.434212.5%Journal articles & conference paper
SIM8080.39616.3%Journal articles & conference paper
Smart mobility0.311318.8%Journal articles & conference papers
Arduino0.40016.3%Conference paper
Table 7. Modularity 4-Education management system (Sources: [11,15,80,81,82,83,84,85,86]).
ThemeDriversHarmonic Closeness CentralityNo. of Documents%Type of Publication
Education management systemEducation management 0.399311.5%Journal articles
E-learning0.473830.8%Journal articles & conference papers
Artificial intelligence0.412519.2%Journal articles & conference papers
Education 3.0 framework0.39613.8%Conference paper
Mobile computing0.393623.1%Journal articles & conference papers
Mobile learning0.39513.8%Conference paper
Key performance indicators0.39027.7%Journal articles
Table 8. Modularity 5-Smart campus network grid (Sources: [5,9,34,57,87,88,89,90,91,92]).
ThemeLabelHarmonic Closeness CentralityNo. of Documents%Type of Publication
Smart campus network gridSmart campus0.68328595.3%Journal articles & conference papers
Construction0.39820.7%Conference papers
Education big data0.40220.7%Journal articles
Cognitive load0.39910.3%Conference paper
Critical thinking0.39710.3%Journal article
Integrated strategies0.40320.7%Journal article & Conference paper
Microservice0.39620.7%Journal articles
Load characterisation0.39510.3%Conference paper
Microgrid0.39220.7%Journal articles
Robotic course0.39010.3%Journal article
Table 9. Modularity 6-Internet of things (IoTs) and smart buildings (Sources: [29,54,77,94,95,96,97,98,99,100,101,102,103]).
ThemeLabelHarmonic Closeness CentralityNo. of Documents%Type of Publication
Internet of things (IoTs) and smart buildingsArtificial intelligence 0.64159.1%Journal articles & conference paper
Energy0.46723.6%Journal articles
Fog computing0.45259.1%Journal articles & conference papers
5G0.42535.5%Journal articles
6G Flagship0.40111.8%Journal article
Smart building0.36247.3%Journal papers
Green computing0.40111.8%Conference paper
Sustainability0.2711018.2%Journal articles & conference papers
Smart grid0.297610.9%Journal articles & conference paper
Smart teaching and learning0.29135.5%Conference paper
Smart environment0.22647.3%Conference paper
Lower power wide area network (LPWAN)0.36535.5%Journal articles & conference paper
Persuasive computing0.36011.8%Journal paper
Repurposing0.35935.5%Journal articles & conference paper
Water management 0.35935.5%Journal articles
Outdoor applications0.36011.8%Journal article
Table 10. Modularity 7-Inclusive smart technology (Sources: [20,104,105,106,107,108,109]).
ThemeLabelHarmonic Closeness CentralityNo. of Documents%Type of Publication
Inclusive smart technologyBig data0.5171453.8%Journal articles & conference paper
Fragmented learning0.39713.8%Journal article
Ubiquitous game-based learning0.351519.2%Journal articles
Infotainment learning0.39513.8%Journal article
People with disabilities0.39027.7%Journal articles & conference paper
Information security0.393311.5%Journal articles & conference paper
Table 11. Modularity 8-Performance measurement and forecasting (Sources: [12,35,43,58,99,110,111,112,113,114]).
ThemeDriversHarmonic Closeness CentralityNo. of Documents%Type of Publication
Performance measurement and forecastingAuto-scaling0.46217.7%Journal article
Forecasting0.460323.1%Journal articles
Loss models0.400215.4%Journal article & Survey data
Path loss0.402215.4%Journal article & Survey data
Horizontal scalability0.44217.7%Journal article
Radio-propagation0.392215.4%Journal articles
Quality of service0.43417.7%Survey data
Vertical scalability0.40217.7%Journal article
Table 12. Modularity 9-Smart campus applications (Sources: [2,90,99,115,116,117,118,119]).
ThemeLabelHarmonic Closeness CentralityNo. of Documents%Type of Publication
Smart campus applicationsHigher education0.460533.3%Journal articles & conference paper
Teaching and learning0.492213.3%Journal articles
Social network0.393320.0%Journal articles & conference paper
IT adoption0.49116.7%Conference paper
IT continuance0.39916.7%Conference paper
IT use0.39716.7%Conference paper
Mobile App adoption0.39416.7%Conference paper
Post-adoption0.39116.7%Conference paper
Table 13. Modularity 10-Learning management system (Sources: [85,87,92,120,121,122,123]).
ThemeLabelHarmonic Closeness CentralityNo. of Documents%Type of Publication
Learning management systemReal-time monitoring system0.44729.1%Journal article & Conference paper
Automation0.45329.1%Journal article
Camera0.45114.5%Journal article
Autonomous vehicles0.43614.5%Conference paper
Sensor0.417418.2%Journal articles & conference paper
Wireless sensor networks0.392313.6%Journal articles & conference paper
Security0.396418.2%Journal articles & conference paper
WI-FI0.30529.1%Conference papers
Lora Gateway0.40814.5%Journal article
Message Queuing Telemetry Transport (MQTT)0.40529.1%Journal article & Conference paper
Table 14. Modularity 11-Data mining (Sources: [4,34,72,85,102,103,123,124,125,126,127,128]).
ThemeDriversHarmonic Closeness CentralityNo. of Documents%Type of Publication
Data miningData analysis0.464730.4%Journal articles & conference papers
Bibliometrics0.427417.4%Journal articles, Conference papers & Survey data
Web service0.392417.4%Journal articles
Ranking analytics0.396417.4%Journal articles& survey data
Statistics0.279417.4%Journal articles & survey data
Table 15. Modularity 12-Campus information portal (Sources: [10,35,36,57,102,129,130,131]).
ThemeDrivers Harmonic Closeness CentralityNo. of Documents%Type of Publication
Campus information portalInnovative education0.50412.3%Journal article
Smartphone0.40612.3%Conference paper
Automated attendance monitoring0.44612.3%Conference paper
Blended learning0.43812.3%Conference paper
Energy efficiency0.481920.5%Journal articles & conference papers
Energy consumption0.466613.6%Journal articles & conference papers
Education data mining0.441613.6%Journal articles, Conference papers & Survey data
Collaborative learning0.45224.5%Conference papers
Learning analytics0.417511.4%Survey data
Sustainable education0.44149.1%Journal articles, Conference papers & Survey data
Smart classroom0.36836.8%Journal articles & conference papers
Smartboards0.392511.4%Journal articles & conference papers
Table 16. Modularity 13-Deep learning architecture (Sources: [1,17,23,132,133,134,135]).
ThemeLabelHarmonic Closeness CentralityNo. of Documents%Type of Publication
Deep learning architectureFace recognition0.459420.0%Journal articles & conference papers
Android0.414525.0%Journal articles & conference papers
Augmented reality0.404630.0%Journal articles & conference papers
Mobile edge computing0.474315.0%Journal articles & conference papers
Accuracy metrics0.39315.0%Conference paper
Sliding window filter0.39115.0%Conference paper
Table 17. Modularity 14-Campus Equipment Management Service (CEMS) (Sources: [84,105,129,133,136,137,138,139,140]).
ThemeDriversHarmonic Closeness CentralityNo. of Documents%Type of Publications
Campus Equipment Management Service (CEMS)Campus visitor management service 0.40415.3%Journal article
Hazardous area management service (HAMS)0.40115.3%Journal article
Application framework0.462210.5%Journal articles
RFID0.411631.6%Journal articles & conference papers
Smart devices0.416315.8%Journal articles & conference papers
Localisation0.425315.8%Journal articles & conference papers
Mobile robotics0.40315.3%Journal article
Petri net modelling0.39715.3%Journal article
Optimal deployment0.39915.3%Journal article
Publisher’s Note: MDPI stays neutral with regard to jurisdictional claims in published maps and institutional affiliations.

