
Life Cycle Cost Assessment of Offshore Wind Farm: Kudat Malaysia Case


 , and
, and 
Abstract
:1. Introduction
2. Methodology
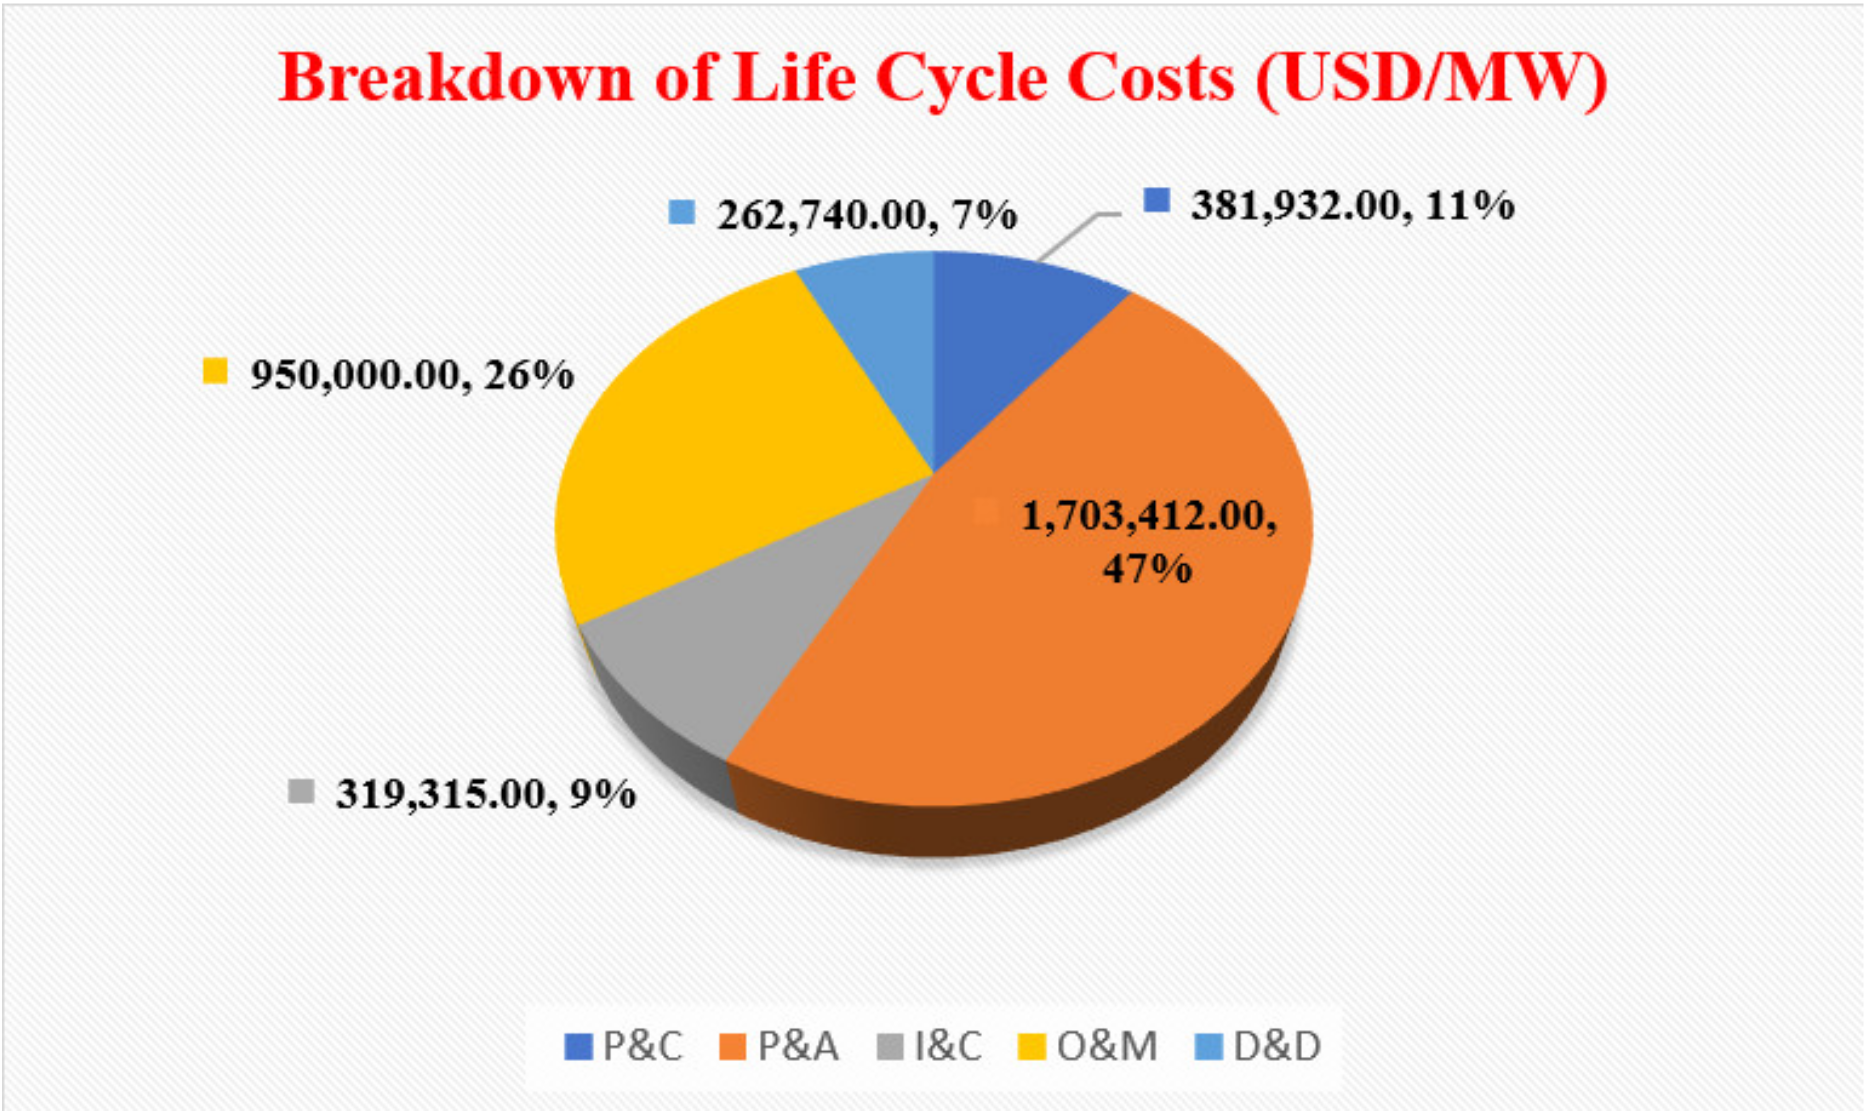
2.1. Breakdown of Life Cycle Cost Structure
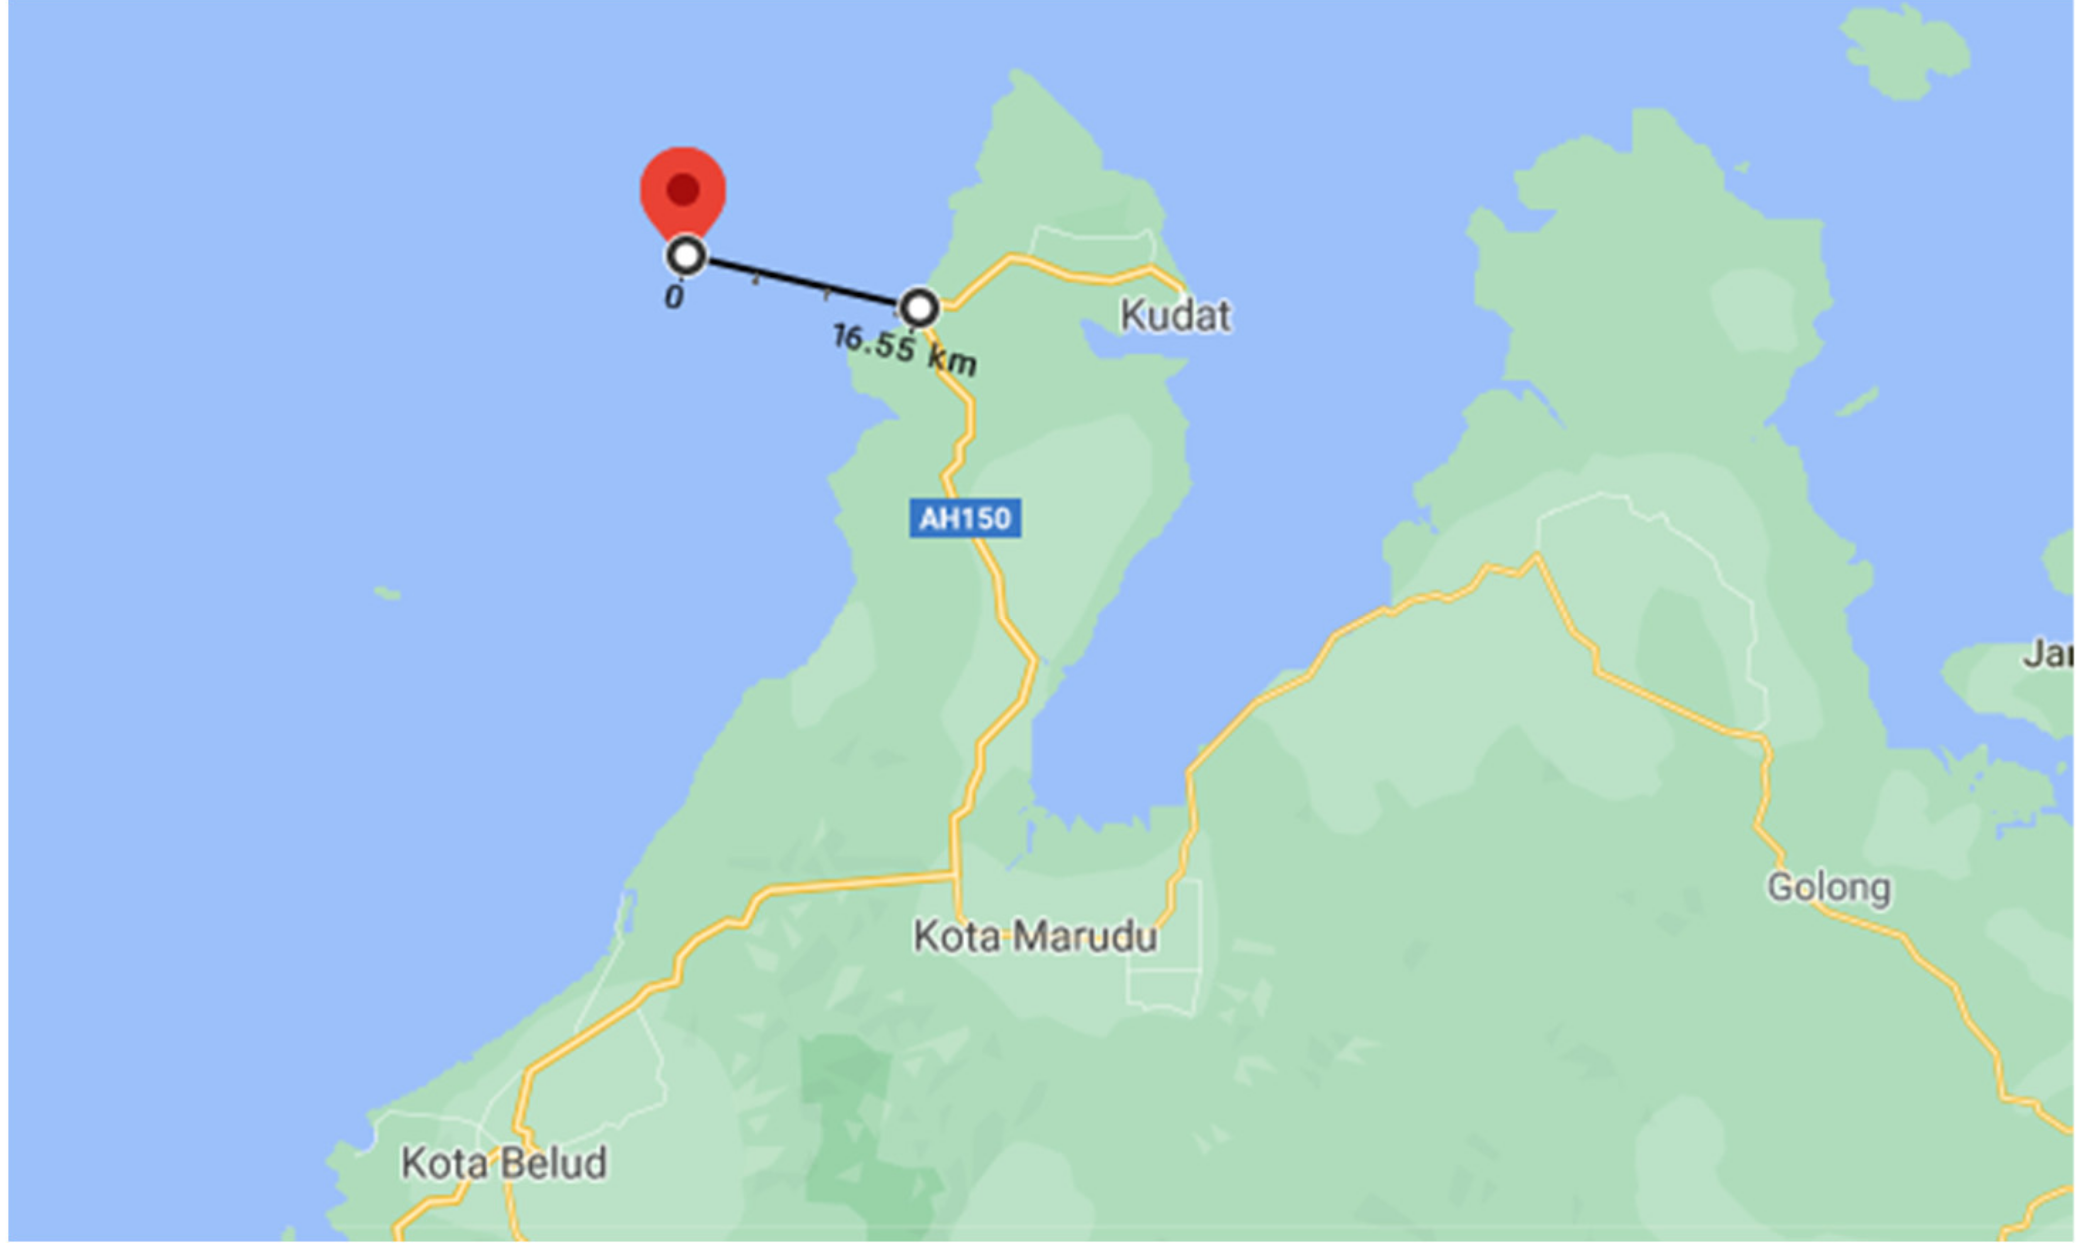
2.2. Site Selection
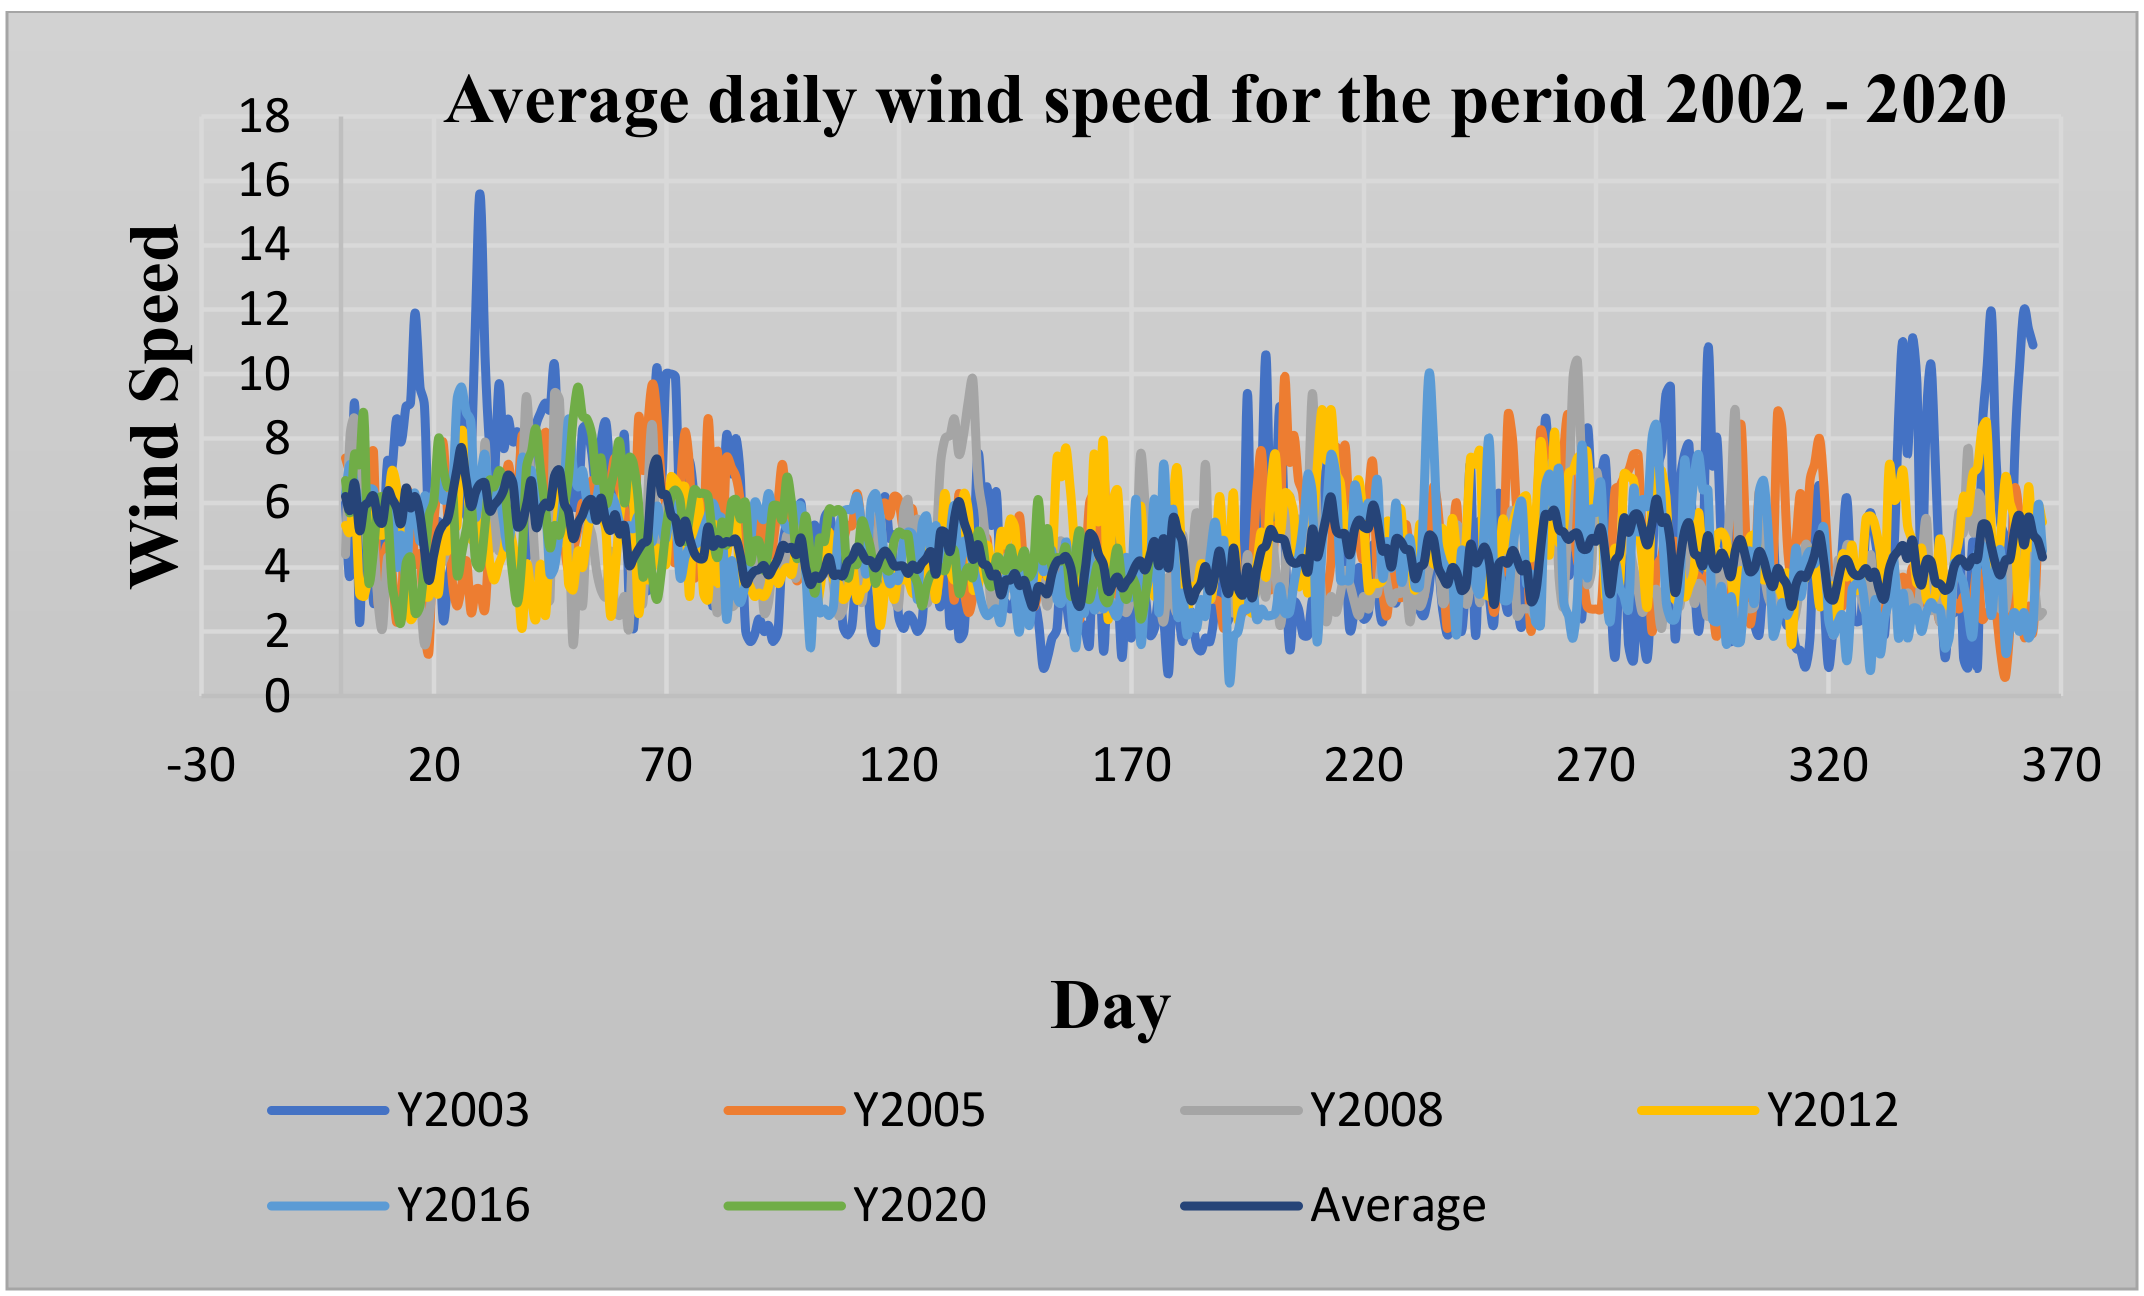
2.3. Collection of Wind Speed Data
2.4. Wind Resource Assessment
2.5. Levelized Cost of Offshore Wind Energy
3. Results and Discussion
3.1. Life Cycle Costs of Offshore Wind Turbine
3.2. Wind Resource Assessment
3.3. Electrical Power Out (MW)
3.4. Levelized Costs of Energy
4. Conclusions
Author Contributions
Funding
Institutional Review Board Statement
Informed Consent Statement
Data Availability Statement
Acknowledgments
Conflicts of Interest
References
- Holmberg, K.; Erdemir, A. Influence of tribology on global energy consumption, costs and emissions. Friction 2017, 5, 263–284. [Google Scholar] [CrossRef]
- Alaloul, W.S.; Musarat, M.A. Impact of zero energy building: Sustainability perspective. In Sustainable Sewage Sludge Management and Resource Efficiency; IntechOpen: London, UK, 2020. [Google Scholar]
- Kucaj, E.; Susaj, E.; Qaja, B. Renewable energy—A great energizing potential that eliminates environmental pollution. Eur. J. Econ. Bus. Stud. 2017, 3, 40–45. [Google Scholar] [CrossRef] [Green Version]
- Rathi, R.; Prakash, C.; Singh, S.; Krolczyk, G.; Pruncu, C.I. Measurement and analysis of wind energy potential using fuzzy based hybrid MADM approach. Energy Rep. 2020, 6, 228–237. [Google Scholar] [CrossRef]
- Wang, C.; Utsunomiya, T.; Wee, S.; Choo, Y. Research on floating wind turbines: A literature survey. IES J. Part A Civ. Struct. Eng. 2010, 3, 267–277. [Google Scholar] [CrossRef] [Green Version]
- Hu, W. Advanced Wind Turbine Technology; Springer: Berlin/Heidelberg, Germany, 2018. [Google Scholar]
- International Renewable Energy Agency (IRENA). Renewable Energy Target Setting; International Renewable Energy Agency: Abu Dhabi, United Arab Emirates, 2015. [Google Scholar]
- IRENA. Renewable Capacity Statistics 2020; IRENA: Abu Dhabi, United Arab Emirates, 2020. [Google Scholar]
- Perez, L.R. Design, Testing and Validation of a Scale Model Semisubmersible Offshore Wind Turbine Under Regular/Irregular Waves and Wind Loads. Master’s Thesis, University of Strathclyde, Glasgow, UK, 2014. [Google Scholar]
- Anaya-Lara, O.; Tande, J.O.; Uhlen, K.; Merz, K. Offshore Wind Energy Technology; Wiley Online Library: Hoboken, NJ, USA, 2018. [Google Scholar]
- Tavner, P. Offshore Wind Turbines: Reliability, Availability and Maintenance; The Institution of Engineering and Technology: Stevenage, UK, 2012. [Google Scholar]
- Nelson, V.; Starcher, K. Wind Energy: Renewable Energy and the Environment; CRC Press: Boca Raton, FL, USA, 2018. [Google Scholar]
- Veers, P.; Dykes, K.; Lantz, E.; Barth, S.; Bottasso, C.L.; Carlson, O.; Clifton, A.; Green, J.; Green, P.; Holttinen, H. Grand challenges in the science of wind energy. Science 2019, 366, 6464. [Google Scholar] [CrossRef] [Green Version]
- Blaabjerg, F.; Ma, K. Wind energy systems. Proc. IEEE 2017, 105, 2116–2131. [Google Scholar]
- Rohe, S. The regional facet of a global innovation system: Exploring the spatiality of resource formation in the value chain for onshore wind energy. Environ. Innov. Soc. Transit. 2020, 36, 331–344. [Google Scholar] [CrossRef]
- Li, Y.; Huang, X.; Tee, K.F.; Li, Q.; Wu, X.-P. Comparative study of onshore and offshore wind characteristics and wind energy potentials: A case study for southeast coastal region of China. Sustain. Energy Technol. Assess. 2020, 39, 100711. [Google Scholar] [CrossRef]
- Emeis, S. Wind Energy Meteorology: Atmospheric Physics for Wind Power Generation; Springer: Berlin/Heidelberg, Germany, 2018. [Google Scholar]
- Kazak, J.; van Hoof, J.; Szewranski, S. Challenges in the wind turbines location process in Central Europe–The use of spatial decision support systems. Renew. Sustain. Energy Rev. 2017, 76, 425–433. [Google Scholar] [CrossRef]
- Moustakas, K.; Loizidou, M.; Rehan, M.; Nizami, A.S. A Review of Recent Developments in Renewable and Sustainable Energy Systems: Key Challenges and Future Perspective; Elsevier: Amsterdam, The Netherlands, 2020. [Google Scholar]
- Crivellari, A.; Cozzani, V. Offshore renewable energy exploitation strategies in remote areas by power-to-gas and power-to-liquid conversion. Int. J. Hydrogen Energy 2020, 45, 2936–2953. [Google Scholar] [CrossRef]
- Röckmann, C.; Lagerveld, S.; Stavenuiter, J. Operation and Maintenance Costs of Offshore Wind Farms and Potential Multi-Use Platforms in the Dutch North Sea, in Aquaculture Perspective of Multi-Use Sites in the Open Ocean; Springer: Cham, Switzerland, 2017; pp. 97–113. [Google Scholar]
- Zaman, A.A.A.; Hashim, F.E.; Yaakob, O. Satellite-based offshore wind energy resource mapping in Malaysia. J. Mar. Sci. Appl. 2019, 18, 114–121. [Google Scholar] [CrossRef]
- Masseran, N.; Razali, A.M.; Ibrahim, K. An analysis of wind power density derived from several wind speed density functions: The regional assessment on wind power in Malaysia. Renew. Sustain. Energy Rev. 2012, 16, 6476–6487. [Google Scholar] [CrossRef]
- Hosseini, S.E.; Wahid, M.A. The role of renewable and sustainable energy in the energy mix of Malaysia: A review. Int. J. Energy Res. 2014, 38, 1769–1792. [Google Scholar] [CrossRef]
- Alsubal, S.; Liew, M.; Lim, E.; Harahap, I.S.; Nasser, A.M. The future of wind power in Malaysia: A review. In Proceedings of the International Conference on Civil, Offshore and Environmental Engineering, Kuching, Malaysia, 13–15 June 2021; Springer: Singapore, 2021. [Google Scholar]
- Nor, K.M.; Shaaban, M.; Rahman, H.A. Feasibility assessment of wind energy resources in Malaysia based on NWP models. Renew. Energy 2014, 62, 147–154. [Google Scholar] [CrossRef]
- Mekhilef, S.; Safari, A.; Chandrasegaran, D. Feasibility study of off-shore wind farms in Malaysia. Energy Sci. Res. 2012, 28, 877–888. [Google Scholar]
- Ibrahim, M.; Albani, A. The potential of wind energy in Malaysian renewable energy policy: Case study in Kudat, Sabah. Energy Environ. 2014, 25, 881–898. [Google Scholar] [CrossRef]
- Levitt, A.C.; Kempton, W.; Smith, A.; Musial, W.; Firestone, J. Pricing offshore wind power. Energy Policy 2011, 39, 6408–6421. [Google Scholar] [CrossRef]
- Castro-Santos, L.; Diaz-Casas, V. Floating Offshore Wind Farms; Springer: New York, NY, USA, 2016. [Google Scholar]
- Shafiee, M.; Brennan, F.; Espinosa, I.A. A parametric whole life cost model for offshore wind farms. Int. J. Life Cycle Assess. 2016, 21, 961–975. [Google Scholar] [CrossRef] [Green Version]
- Bjerkseter, C.; Ågotnes, A. Levelised Costs of Energy for Offshore Floating Wind Turbine Concepts; Norwegian University of Life Sciences: Ås, Norway, 2013. [Google Scholar]
- Laura, C.-S.; Vicente, D.-C. Life-cycle cost analysis of floating offshore wind farms. Renew. Energy 2014, 66, 41–48. [Google Scholar] [CrossRef]
- Howard, R. Offshore Wind Cost Reduction Pathways Project—Simple Levelised Cost of Energy Model; The Crown Estate: London, UK, 2012. [Google Scholar]
- Bahar, M.; Kamu, A.; Jantan, N.; Gabda, D. Analysis of wage distribution in Malaysia. J. Phys. Conf. Ser. 2020, 1489, 012031. [Google Scholar] [CrossRef] [Green Version]
- Bosch, J.; Staffell, I.; Hawkes, A.D. Global levelised cost of electricity from offshore wind. Energy 2019, 189, 116357. [Google Scholar] [CrossRef]
- Kaiser, M.J.; Snyder, B. Offshore Wind Energy Cost Modeling: Installation and Decommissioning; Springer Science & Business Media: Berlin/Heidelberg, Germany, 2012; Volume 85. [Google Scholar]
- Myhr, A.; Bjerkseter, C.; Ågotnes, A.; Nygaard, T.A. Levelised cost of energy for offshore floating wind turbines in a life cycle perspective. Renew. Energy 2014, 66, 714–728. [Google Scholar] [CrossRef] [Green Version]
- Estate, C. A Guide to an Offshore Wind Farm; Report; BVG Associates: Swindon, UK, 2010; pp. 1–70. [Google Scholar]
- Ahn, D.; Shin, S.-C.; Kim, S.-Y.; Kharoufi, H.; Kim, H.-C. Comparative evaluation of different offshore wind turbine installation vessels for Korean west–south wind farm. Int. J. Nav. Archit. Ocean Eng. 2017, 9, 45–54. [Google Scholar] [CrossRef]
- Kaiser, M.J.; Snyder, B. Offshore Wind Energy Installation and Decommissioning Cost Estimation in the US Outer Continental Shelf; US Department of the Interior, Bureau of Ocean Energy Management, Regulation and Enforcement, Herndon, VA TA&R: Washington, DC, USA, 2010; Volume 648. [Google Scholar]
- Dalgic, Y.; Lazakis, I.; Turan, O. Vessel Charter Rate Estimation for Offshore Wind O&M Activities; International Maritime Association of Mediterranean IMAM: London, UK, 2013. [Google Scholar]
- Maples, B.; Saur, G.; Hand, M.; van de Pietermen, R.; Obdam, T. Installation, Operation, and Maintenance Strategies to Reduce the Cost of Offshore Wind Energy; National Renewable Energy Lab. (NREL): Golden, CO, USA, 2013. [Google Scholar]
- Dinmohammadi, F.; Shafiee, M. A fuzzy-FMEA risk assessment approach for offshore wind turbines. Int. J. Progn. Health Manag. 2013, 4, 59–68. [Google Scholar]
- Hassan, G.G. A Guide to UK Offshore Wind Operations and Maintenance; Scottish Enterprise and The Crown Estate: Edinburgh, UK, 2013; Volume 21. [Google Scholar]
- Shafiee, M. Maintenance strategy selection problem: An MCDM overview. J. Qual. Maint. Eng. 2015, 21, 378–402. [Google Scholar] [CrossRef]
- Maienza, C.; Avossa, A.; Ricciardelli, F.; Coiro, D.; Troise, G.; Georgakis, C.T. A life cycle cost model for floating offshore wind farms. Appl. Energy 2020, 266, 114716. [Google Scholar] [CrossRef]
- Smith, G.; Garrett, C.; Gibberd, G. Logistics and cost reduction of decommissioning offshore wind farms. Presented EWEA Offshore 2015, 2015, 10–12. [Google Scholar]
- Topham, E.; McMillan, D. Sustainable decommissioning of an offshore wind farm. Renew. Energy 2017, 102, 470–480. [Google Scholar] [CrossRef] [Green Version]
- Adedipe, T.; Shafiee, M. An economic assessment framework for decommissioning of offshore wind farms using a cost breakdown structure. Int. J. Life Cycle Assess. 2021, 26, 344–370. [Google Scholar] [CrossRef]
- PCCI, INC. Decommissioning Cost Estimation for the Cape Wind Energy Project; PCCI Inc.: Alexandria, VA, USA, 2014. [Google Scholar]
- Sabeen, A.; Ngadi, N.; Noor, Z.Z. Minimizing the cost of municipal solid waste management in Pasir Gudang Johor Malaysia. J. Mater. Environ. Sci. 2016, 7, 1819–1834. [Google Scholar]
- Tambi, N.H.M.; Afrouzi, H.N.; Mehranzamir, K.; Ahmed, J. A review of available hybrid renewable energy systems in Malaysia. Int. J. Power Electron. Drive Syst. 2020, 11, 433–441. [Google Scholar] [CrossRef]
- Topham, E.; McMillan, D.; Bradley, S.; Hart, E. Recycling offshore wind farms at decommissioning stage. Energy Policy 2019, 129, 698–709. [Google Scholar] [CrossRef] [Green Version]
- Sanusi, N.; Zaharim, A.; Mat, S.; Sopian, K. Bivariate probability model for wind power density analysis: Case study. ARPN J. Eng. Appl. Sci. 2006. [Google Scholar]
- Sharuddin, N.N.S.; Ng, C.Y.; Tuhaijan, S.N.A.; John, K.V.; Wong, L.W. An evaluation of offshore wind renewable energy performance in Malaysia. Int. J. Biomass Renew. 2019, 8, 25–33. [Google Scholar]
- Albani, A.; Ibrahim, M.Z. Wind energy potential and power law indexes assessment for selected near-coastal sites in Malaysia. Energies 2017, 10, 307. [Google Scholar] [CrossRef] [Green Version]
- Mekhilef, S.; Chandrasegaran, D. Assessment of off-shore wind farms in Malaysia. In Proceedings of the TENCON 2011–2011 IEEE Region 10 Conference, Bali, Indonesia, 21–24 November 2011; IEEE: New York, NY, USA, 2011. [Google Scholar]
- NOAA USA. National Oceanic and Atmospheric Administration; NOAA USA: Boulder, CO, USA, 2009. [Google Scholar]
- Effiom, S.; Nwankwojike, B.; Abam, F. Economic cost evaluation on the viability of offshore wind turbine farms in Nigeria. Energy Rep. 2016, 2, 48–53. [Google Scholar] [CrossRef] [Green Version]
- Bruck, M.; Sandborn, P.; Goudarzi, N. A Levelized Cost of Energy (LCOE) model for wind farms that include Power Purchase Agreements (PPAs). Renew. Energy 2018, 122, 131–139. [Google Scholar] [CrossRef]
- Raturi, A.K. Renewables 2016 Global Status Report; REN21 Community: Bonn, Germany, 2016. [Google Scholar]
- Mathew, S. Wind Energy: Fundamentals, Resource Analysis and Economics; Springer: Berlin/Heidelberg, Germany, 2006. [Google Scholar]
- Lee, N.; Flores-Espino, F.; de Oliveira, R.C.; Roberts, B.J.; Brown, T.; Katz, J.R. Exploring Renewable Energy Opportunities in Select Southeast Asian Countries: A Geospatial Analysis of the Levelized Cost of Energy of Utility-Scale Wind and Solar Photovoltaics; National Renewable Energy Lab. (NREL): Golden, CO, USA, 2019. [Google Scholar]


| Phase | Cost Element | Cost per MW Installed (USD/MW) | Contribution to CAPEX/OPEX/DECOM % | Contribution to the Whole Life Cycle Costs % |
|---|---|---|---|---|
| CAPEX | P&C | |||
| CprojM | 90,000 | 3.74% | 2.50% | |
| Clegal | 7901 | 0.33% | 0.22% | |
| Csurveys | 30,066 | 1.25% | 0.83% | |
| Ceng | 2400 | 0.10% | 0.07% | |
| Ccontingency | 251,565 | 10.46% | 6.97% | |
| Total CP&C | 381,932 | 15.88% | 10.59% | |
| P&A | ||||
| CWT | 1,006,940 | 41.878% | 27.92% | |
| CSS | 500,000 | 20.79% | 13.86% | |
| CPTS | 190,599 | 7.93% | 5.29% | |
| Cmonitoring | 5873 | 0.24% | 0.16% | |
| Total CP&A | 1,703,412 | 70.84% | 47.23% | |
| I&C | ||||
| Cport | 34,960 | 1.45% | 0.97% | |
| CI&C-comp | 234,281 | 9.74% | 6.50% | |
| Ccomm | 570 | 0.02% | 0.02% | |
| CI&C-ins | 49,504 | 2.06% | 1.37% | |
| Total CI&C | 319,315 | 13.278% | 8.85% | |
| CAPEX | 2,404,659 | 66.67% | ||
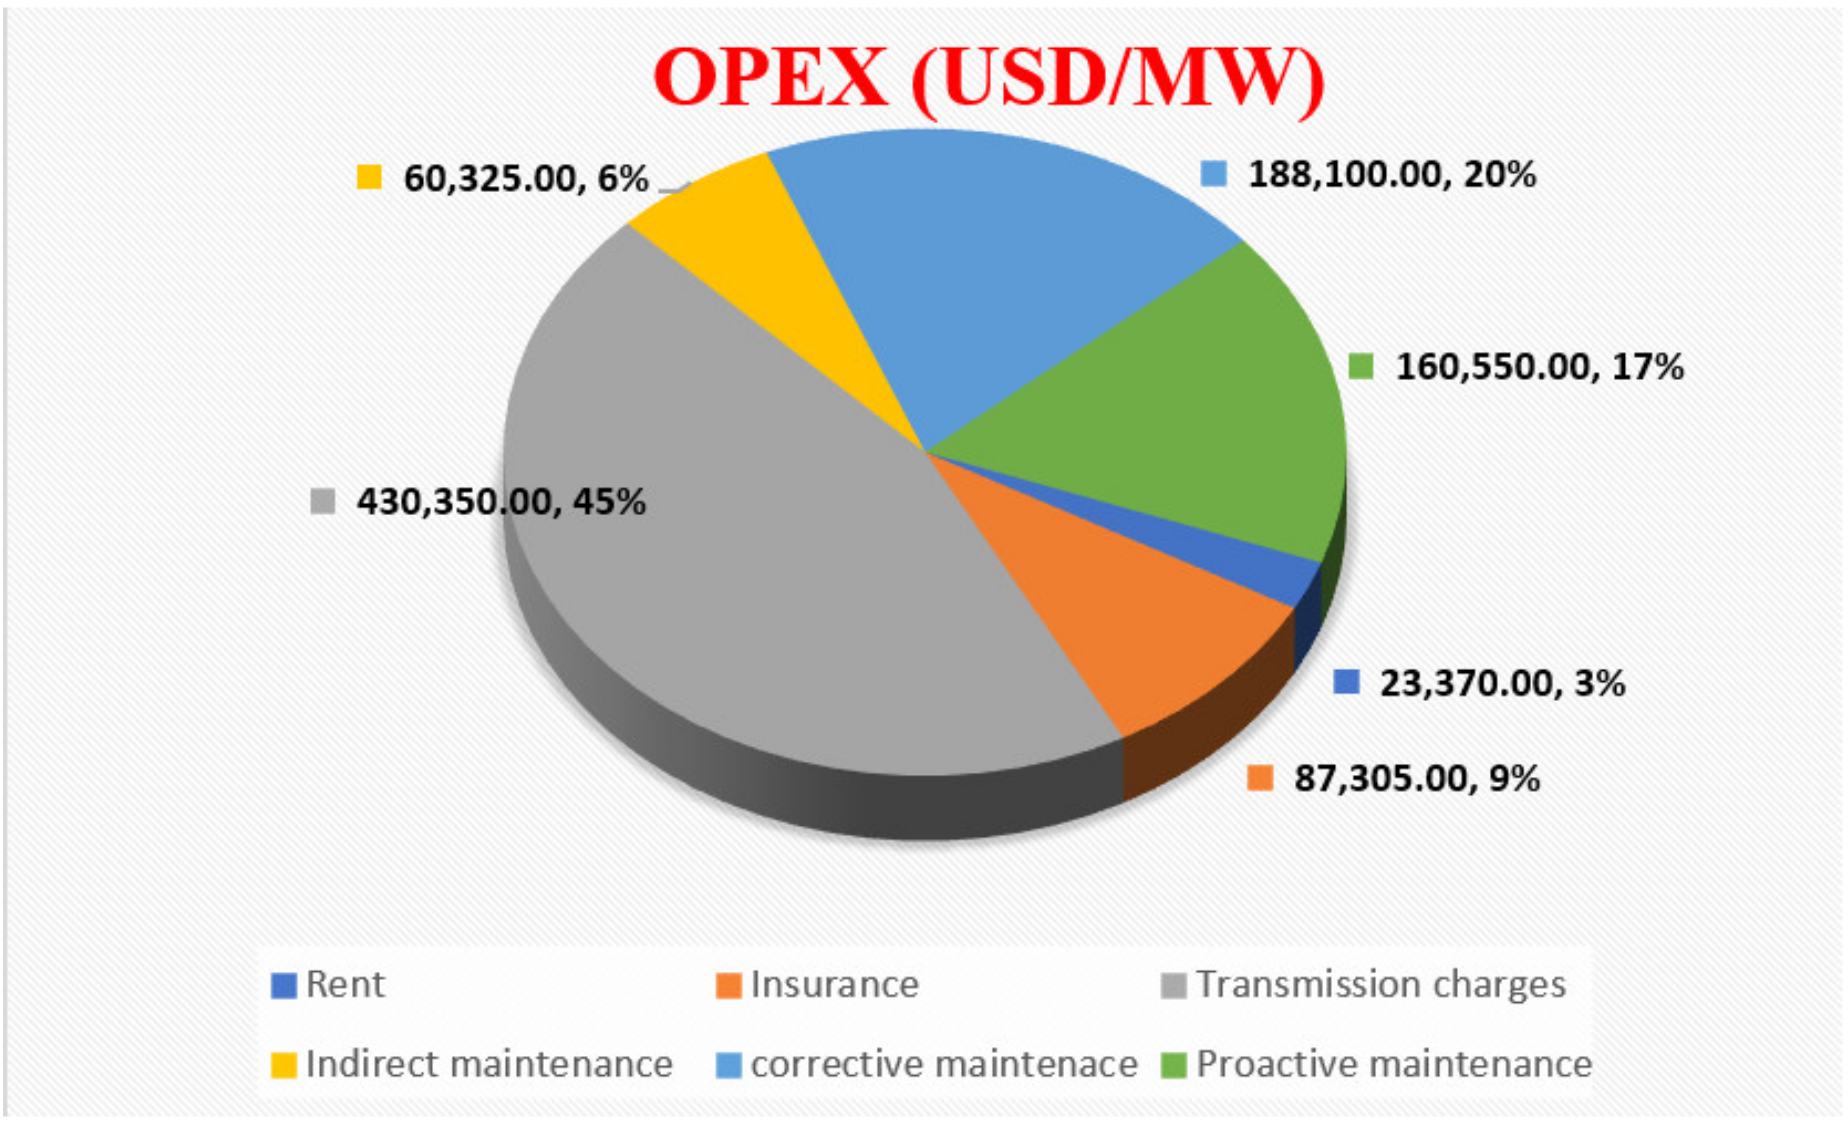
| OPEX | O&M | |||
| Crent | 23,370 | 2.46% | 0.65% | |
| CO&M-ins | 87,305 | 9.19% | 2.42% | |
| Ctransmission | 430,350 | 45.3% | 11.93% | |
| CO&M-indirect | 60,325 | 6.35% | 1.67% | |
| CProM | 188,100 | 19.8% | 5.22% | |
| CCM | 160,550 | 16.9% | 4.45% | |
| OPEX | 950,000 | 26.34% | ||
| DECOM | D&D | |||
| CD&D-port | 49,639 | 16.82% | 1.38% | |
| Cremove | 236,850 | 80.35% | 6.57% | |
| CWM | −43,045 | −14.59% | −1.19% | |
| CpostM | 8589 | 2.91% | 0.24% | |
| DECOM | 252,033 | 6.99% |
Publisher’s Note: MDPI stays neutral with regard to jurisdictional claims in published maps and institutional affiliations. |
© 2021 by the authors. Licensee MDPI, Basel, Switzerland. This article is an open access article distributed under the terms and conditions of the Creative Commons Attribution (CC BY) license (https://creativecommons.org/licenses/by/4.0/).
Share and Cite
Alsubal, S.; Alaloul, W.S.; Shawn, E.L.; Liew, M.S.; Palaniappan, P.; Musarat, M.A. Life Cycle Cost Assessment of Offshore Wind Farm: Kudat Malaysia Case. Sustainability 2021, 13, 7943. https://doi.org/10.3390/su13147943
Alsubal S, Alaloul WS, Shawn EL, Liew MS, Palaniappan P, Musarat MA. Life Cycle Cost Assessment of Offshore Wind Farm: Kudat Malaysia Case. Sustainability. 2021; 13(14):7943. https://doi.org/10.3390/su13147943
Chicago/Turabian StyleAlsubal, Shamsan, Wesam Salah Alaloul, Eu Lim Shawn, M. S. Liew, Pavitirakumar Palaniappan, and Muhammad Ali Musarat. 2021. "Life Cycle Cost Assessment of Offshore Wind Farm: Kudat Malaysia Case" Sustainability 13, no. 14: 7943. https://doi.org/10.3390/su13147943
APA StyleAlsubal, S., Alaloul, W. S., Shawn, E. L., Liew, M. S., Palaniappan, P., & Musarat, M. A. (2021). Life Cycle Cost Assessment of Offshore Wind Farm: Kudat Malaysia Case. Sustainability, 13(14), 7943. https://doi.org/10.3390/su13147943