
The Role of HVAC Design and Windows on the Indoor Airflow Pattern and ACH

 ,
,  ,
,  ,
,  ,
,  and
and 
Abstract
:1. Introduction
- Decrease of comfort level;
- Increase of health risk (i.e., asthma, inflammation, infections, allergy);
- Sick building syndrome (SBS);
- Decrease of productivity.
1.1. The COVID-19 Outbreak and the Role of HVAC on the Indoor Contamination Load
1.2. The Transmission Mechanism of Contaminated Aerosols by Airflow
- Larger respiratory droplets (more than 5 μm): These droplets can remain in the air for a short time, and travel can spread short distances, generally less than 1 m;
- Virus-laden, small, aerosolized droplets (less than 5 μm): These droplets can remain floating and travel more than 1 m.
1.3. The Impact of Supplementary Approaches in Decreasing Indoor Contamination Load
1.3.1. The Impact of Air Filtration Systems on Indoor Contamination Load
1.3.2. The Impact of Ultraviolet Light (UW) on Contaminated Aerosols
- 100 to 200 nm: Far UV or vacuum UV;
- 200 to 280 nm: UVC (suitable for disinfection and sensing);
- 280 to 315 nm: UVB (suitable for curing, medical applications, and tanning);
- 315 to 400 nm: UVA (suitable for curing, lithography, printing, and medical applications).
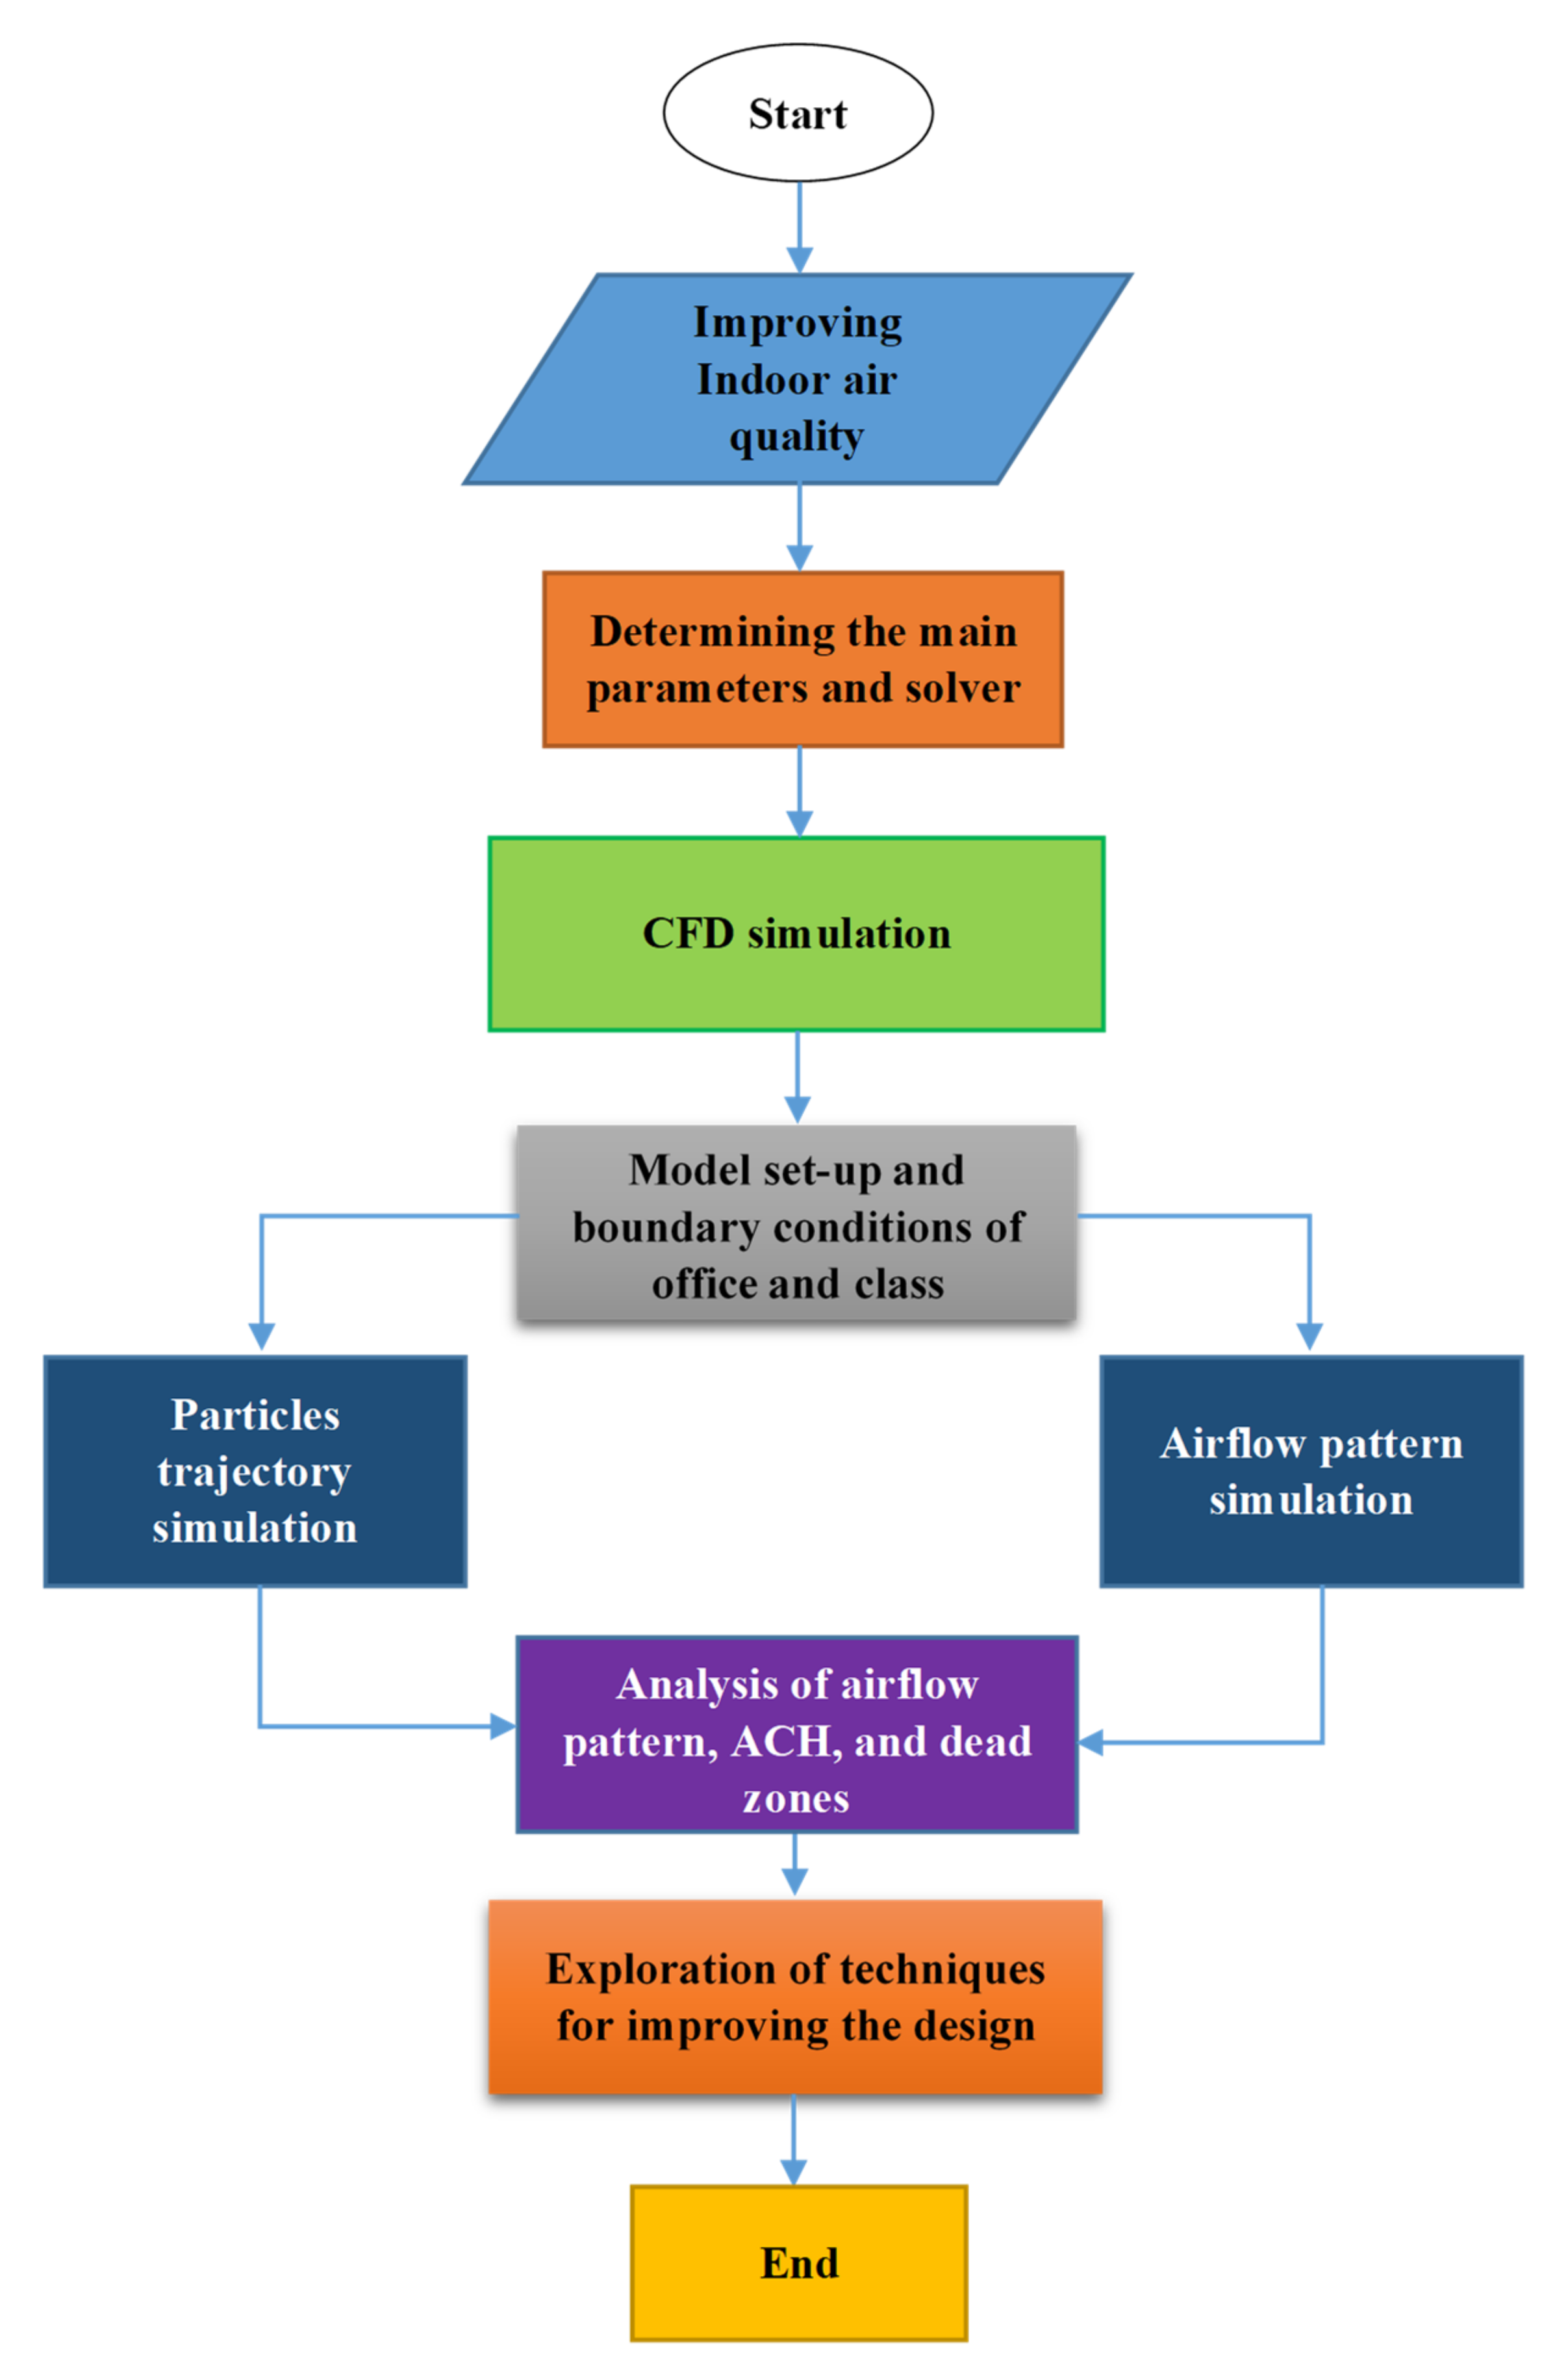
2. Materials and Methods
3. Model Development
3.1. Research Hypotheses and Assumptions
- Since the airflow pattern and ACH are among the analysis purposes, the simulations have been done in steady thermal conditions. Therefore, the steady-state condition with the inflow temperature of 25 °C has been used for simulation;
- The central air conditioner systems in the rooms are fully fresh air and without recirculation. In addition, the impact of natural ventilation is not considered in this study;
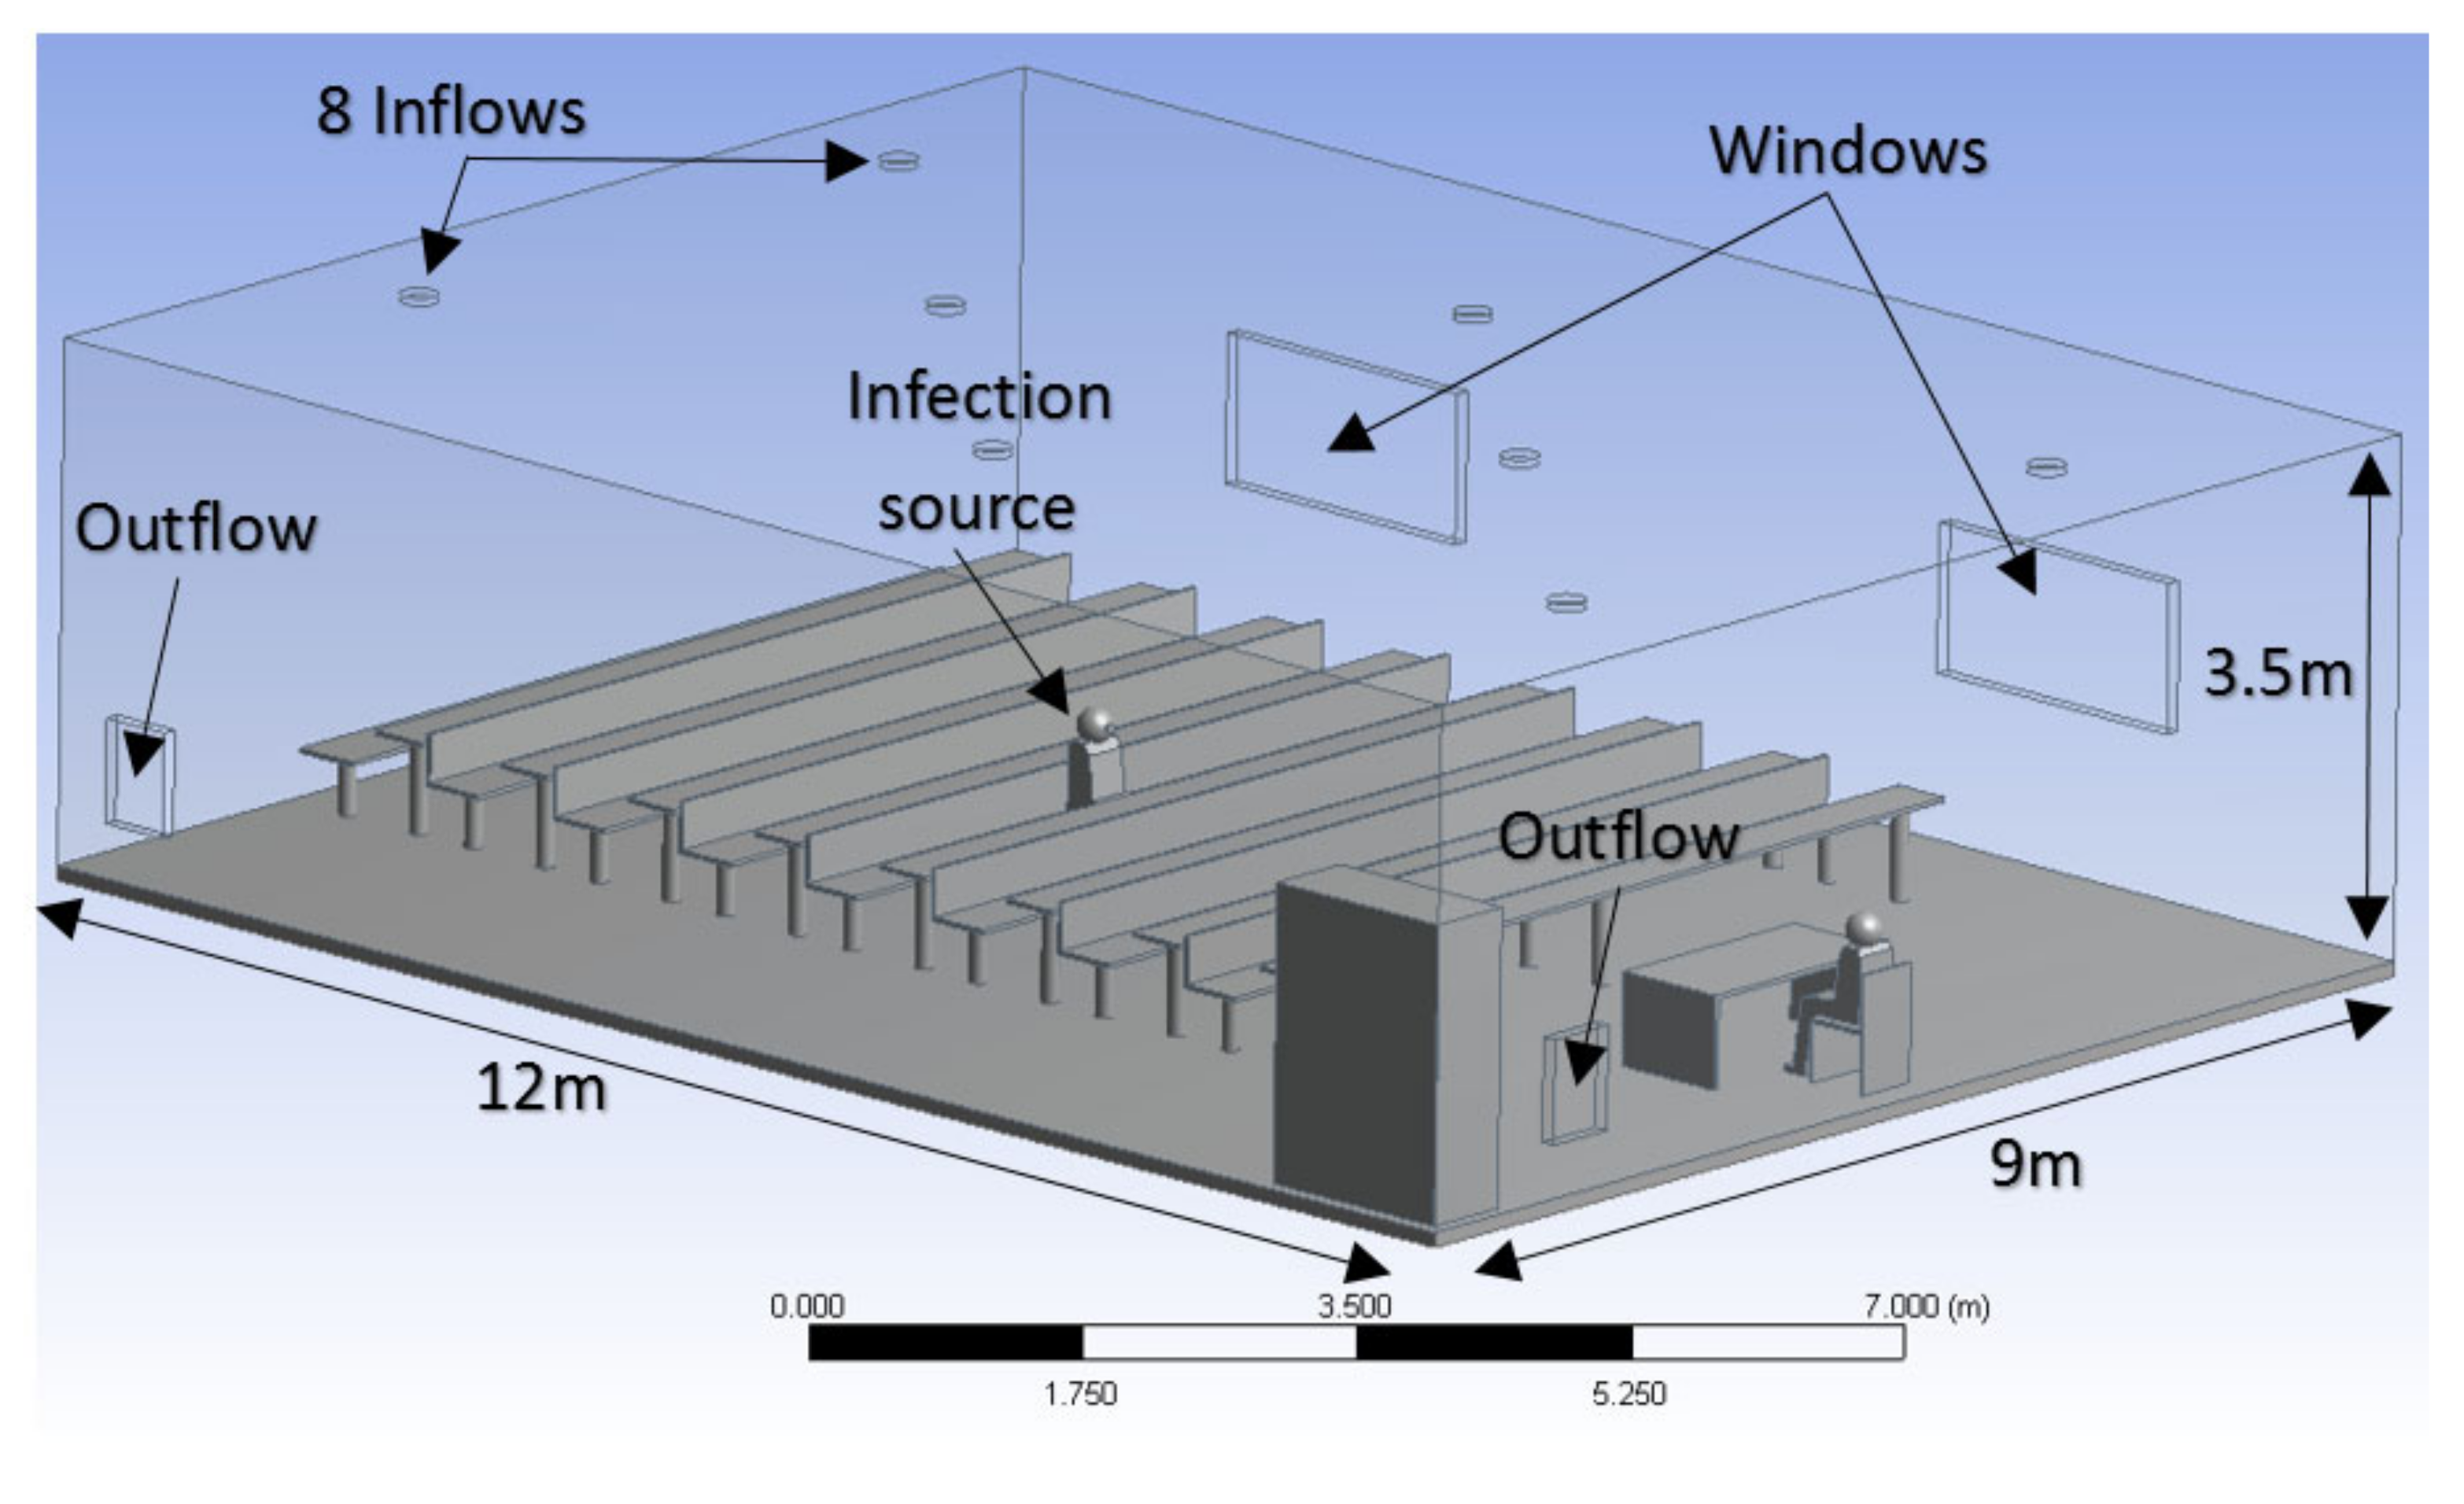
- To calculate the full ACH, the worst condition has been selected for the locations of the possible infection source (aerosol injection). Therefore, the class center, a location with the longest distances from the outlets and windows, has been selected. The remaining time of the particles in any other locations of the class will be less. In the office case, two different locations have been selected for analysis of the aerosol movement.
- The simulation of the cases with open and closed windows can show the impact of changing outflow on the airflow pattern and ACH. Therefore, the number of windows cannot change the main result;
- The outside wind could cause some turbulence and affect the airflow pattern. However, it has been neglected in the current study.
- The initial validation of the model with previous case studies could be acceptable for analysis of the rooms with bigger sizes and more objects;
3.2. Main Governing Equations
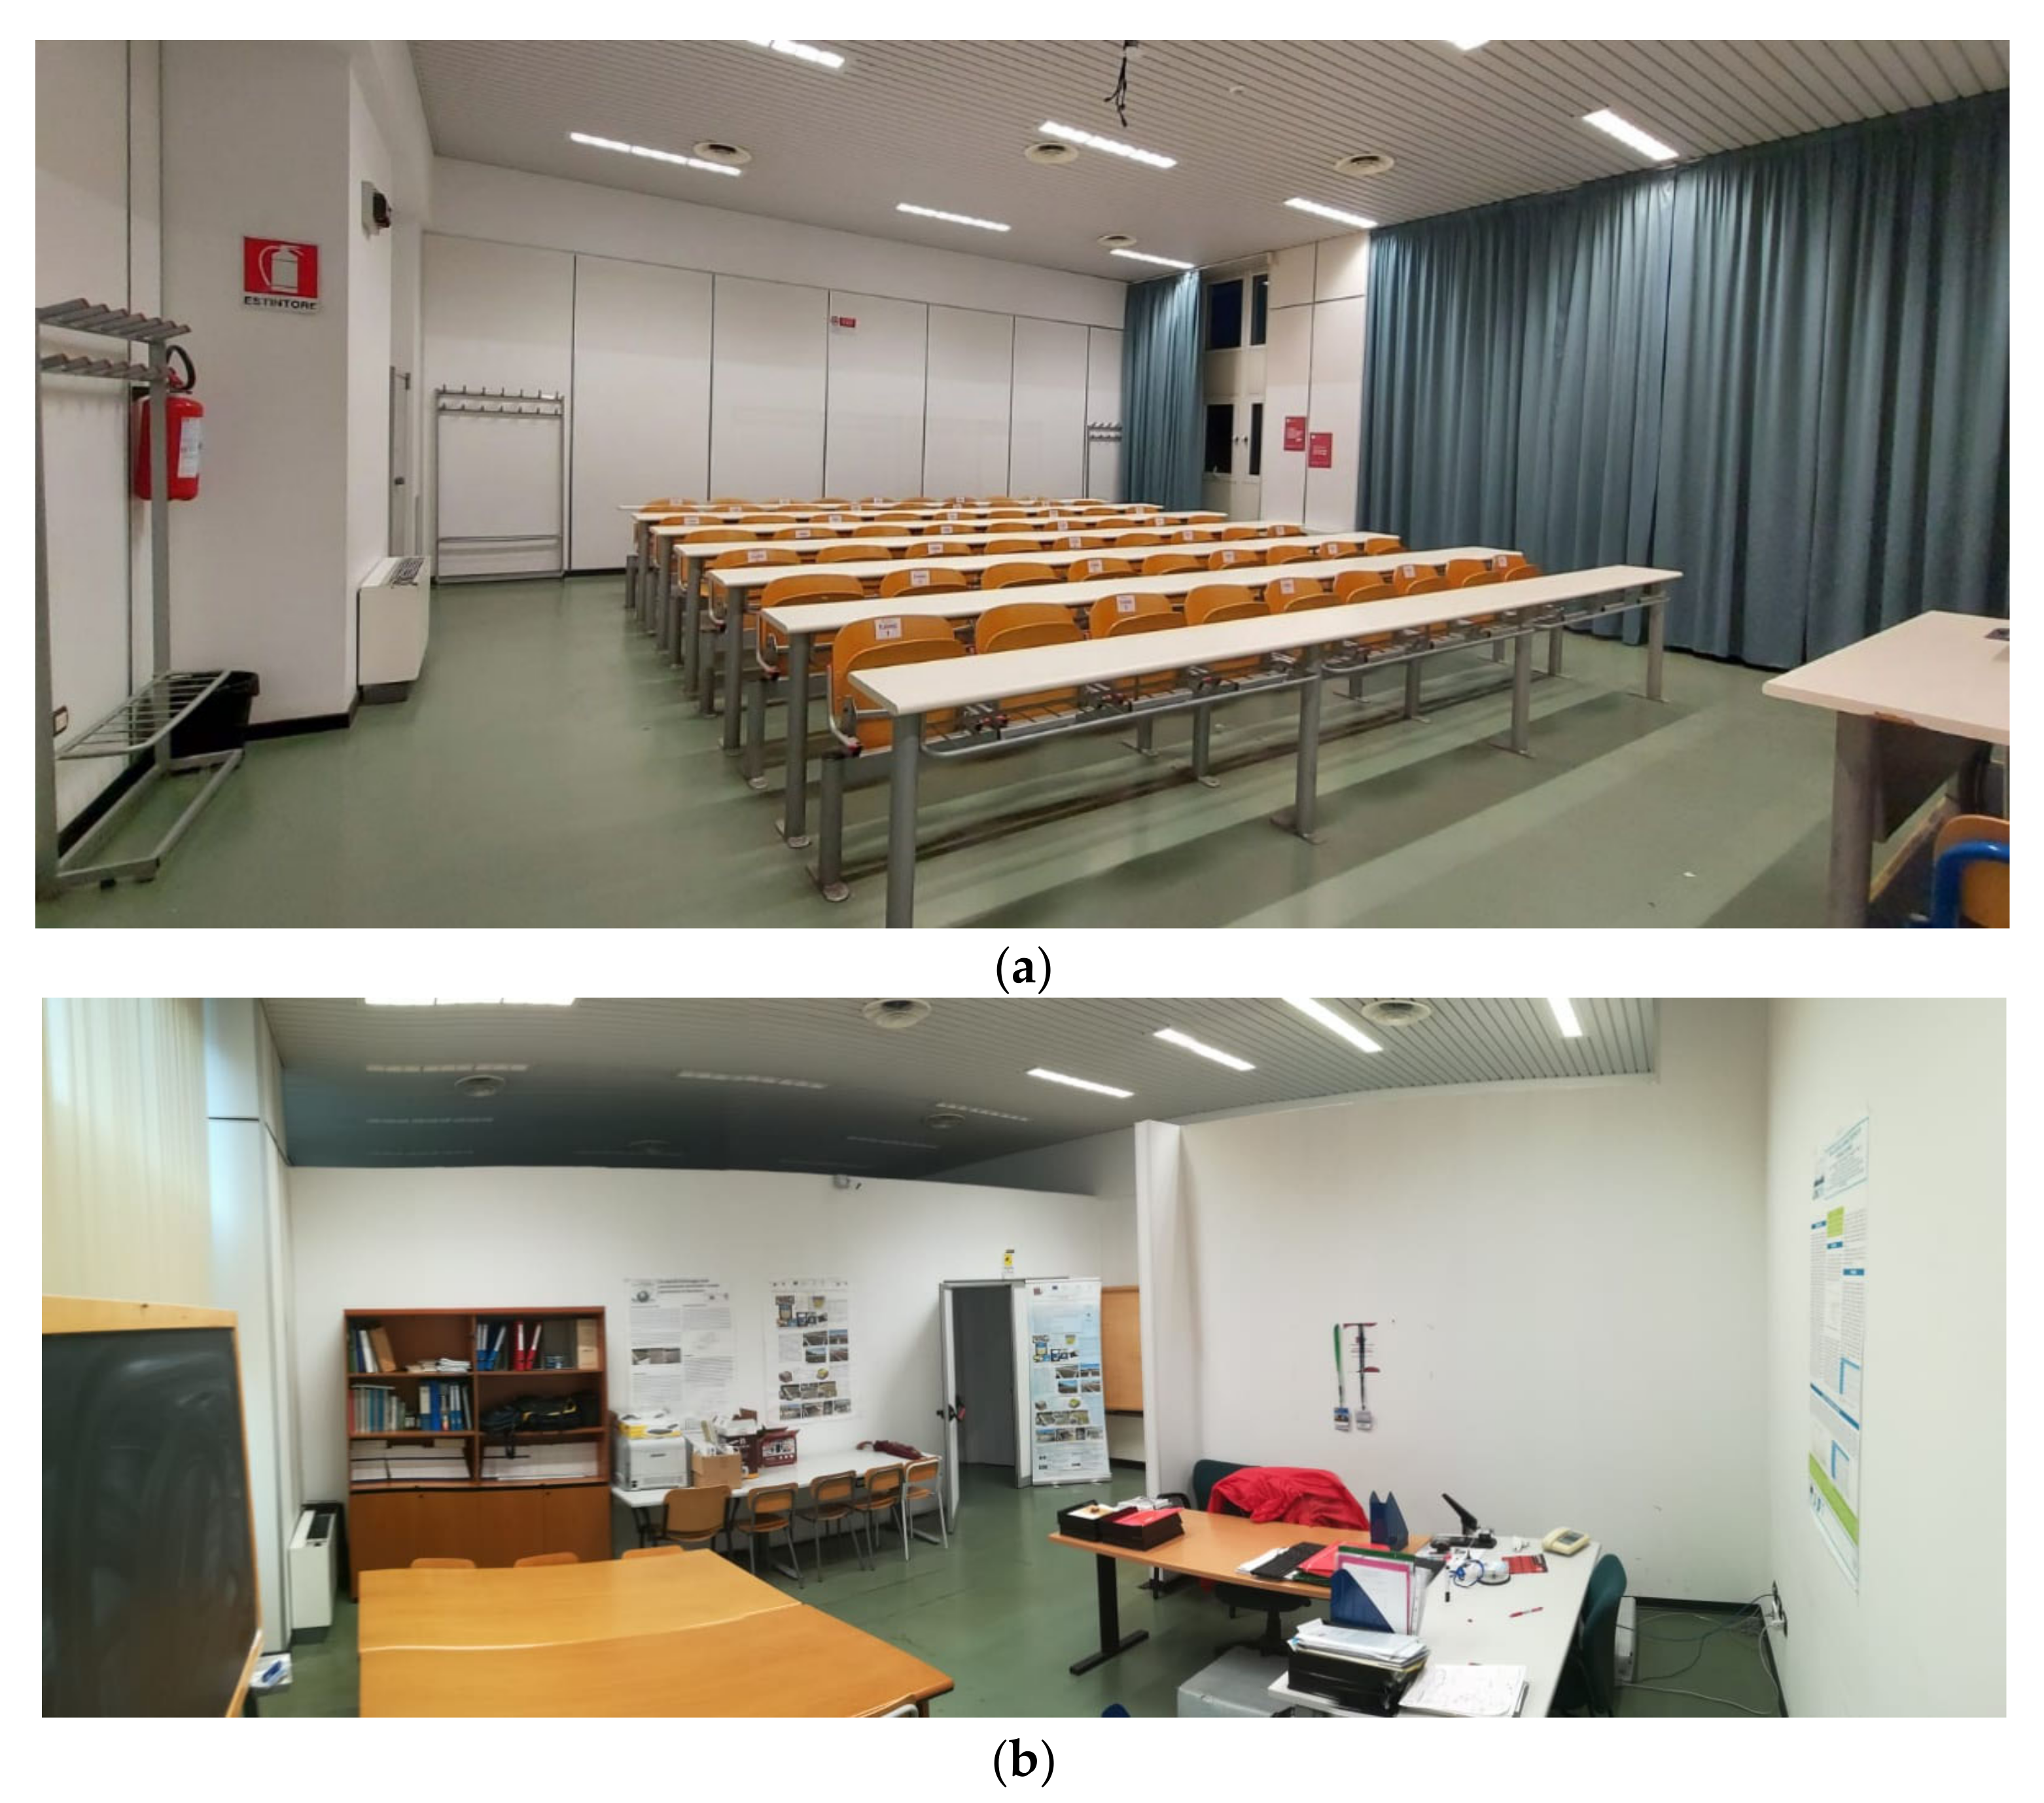
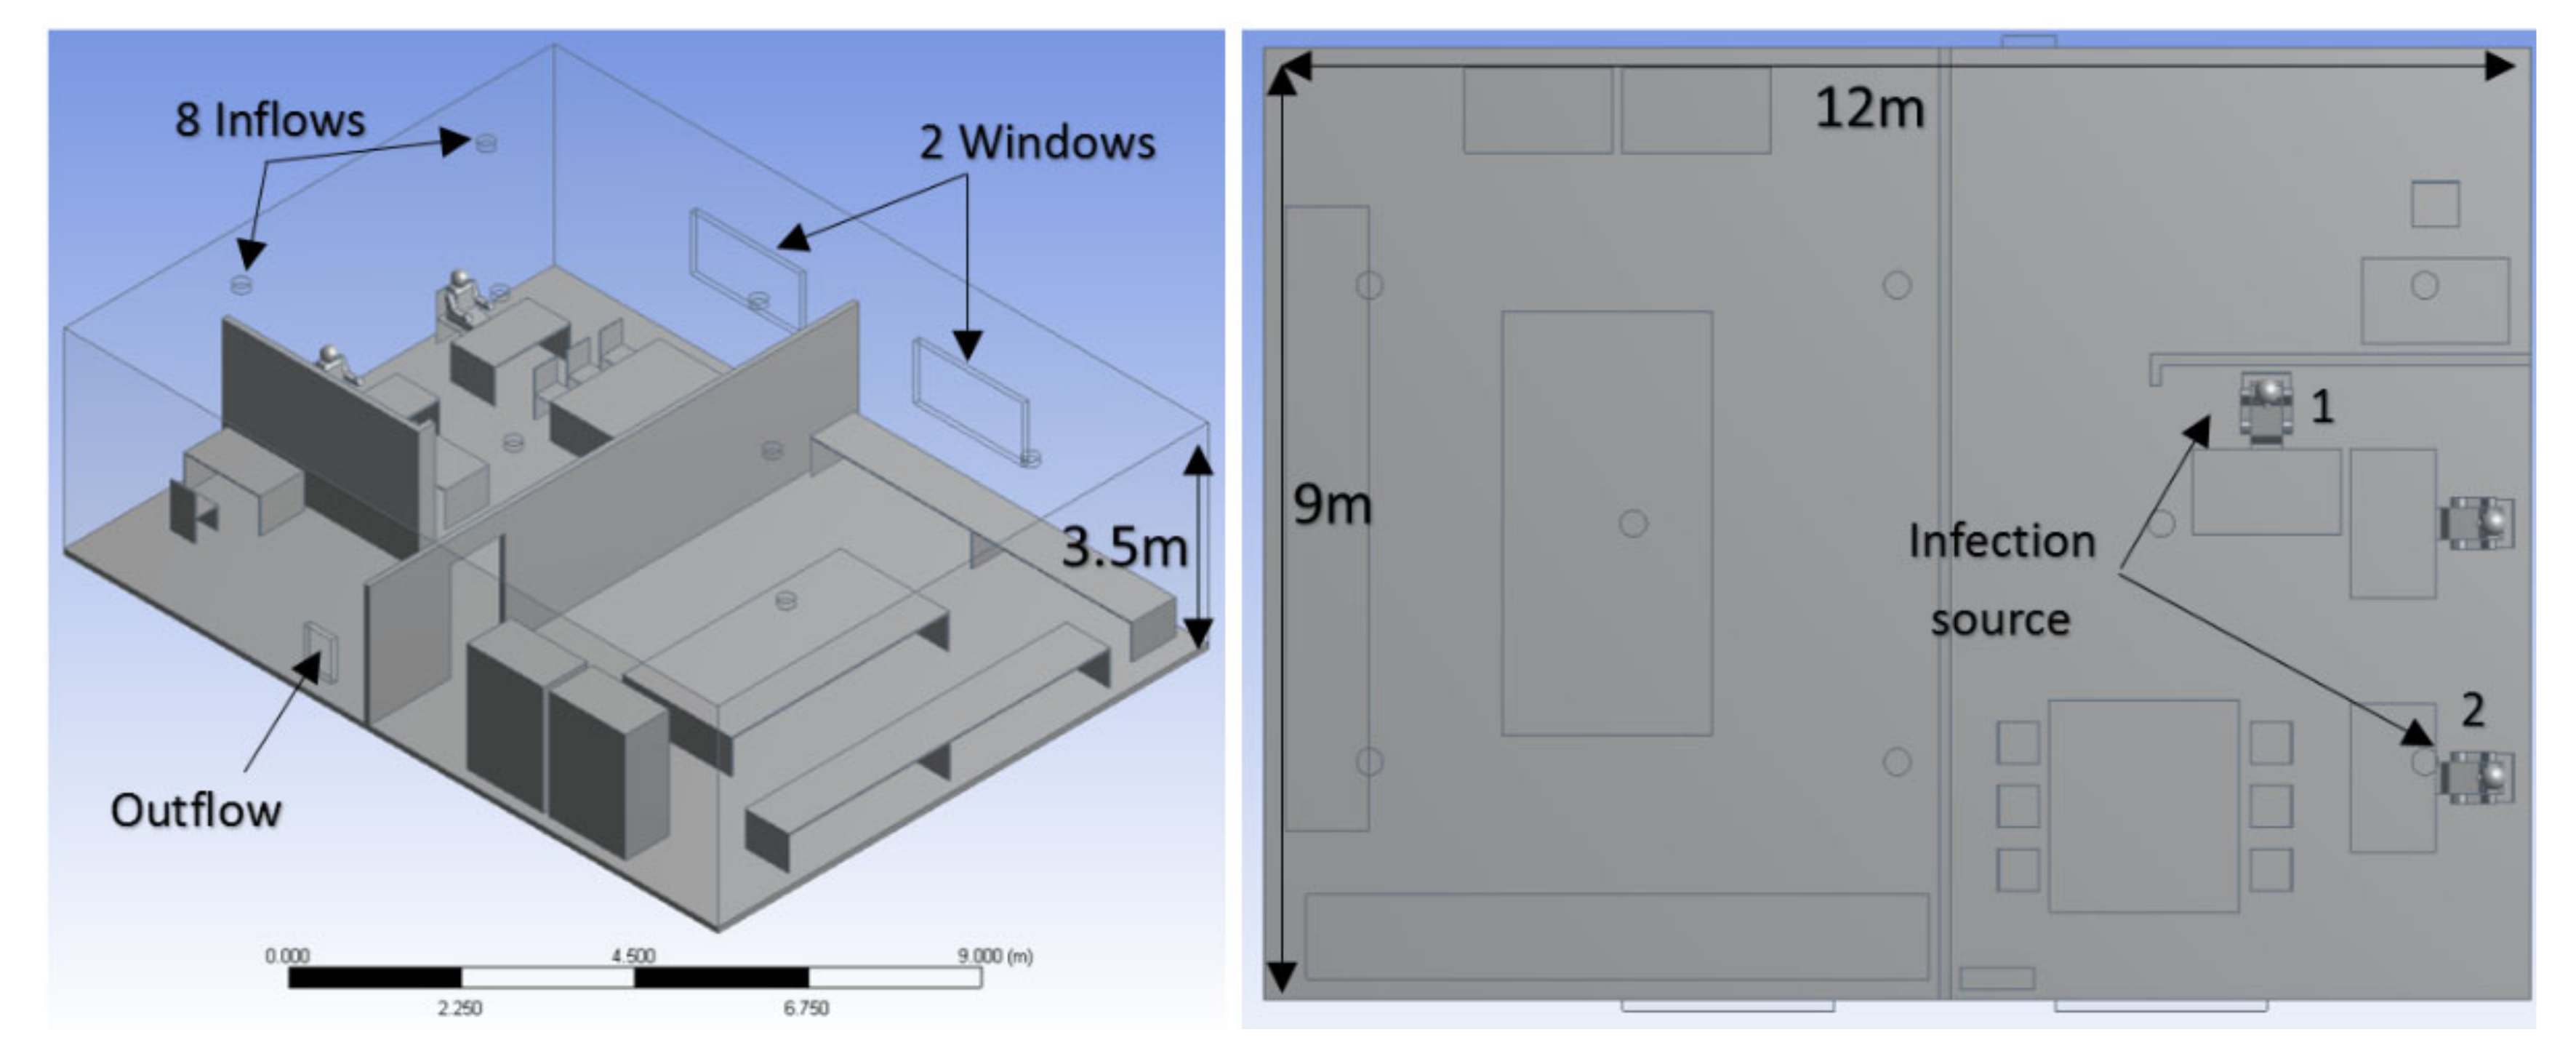
3.3. Model Design and Boundary Conditions
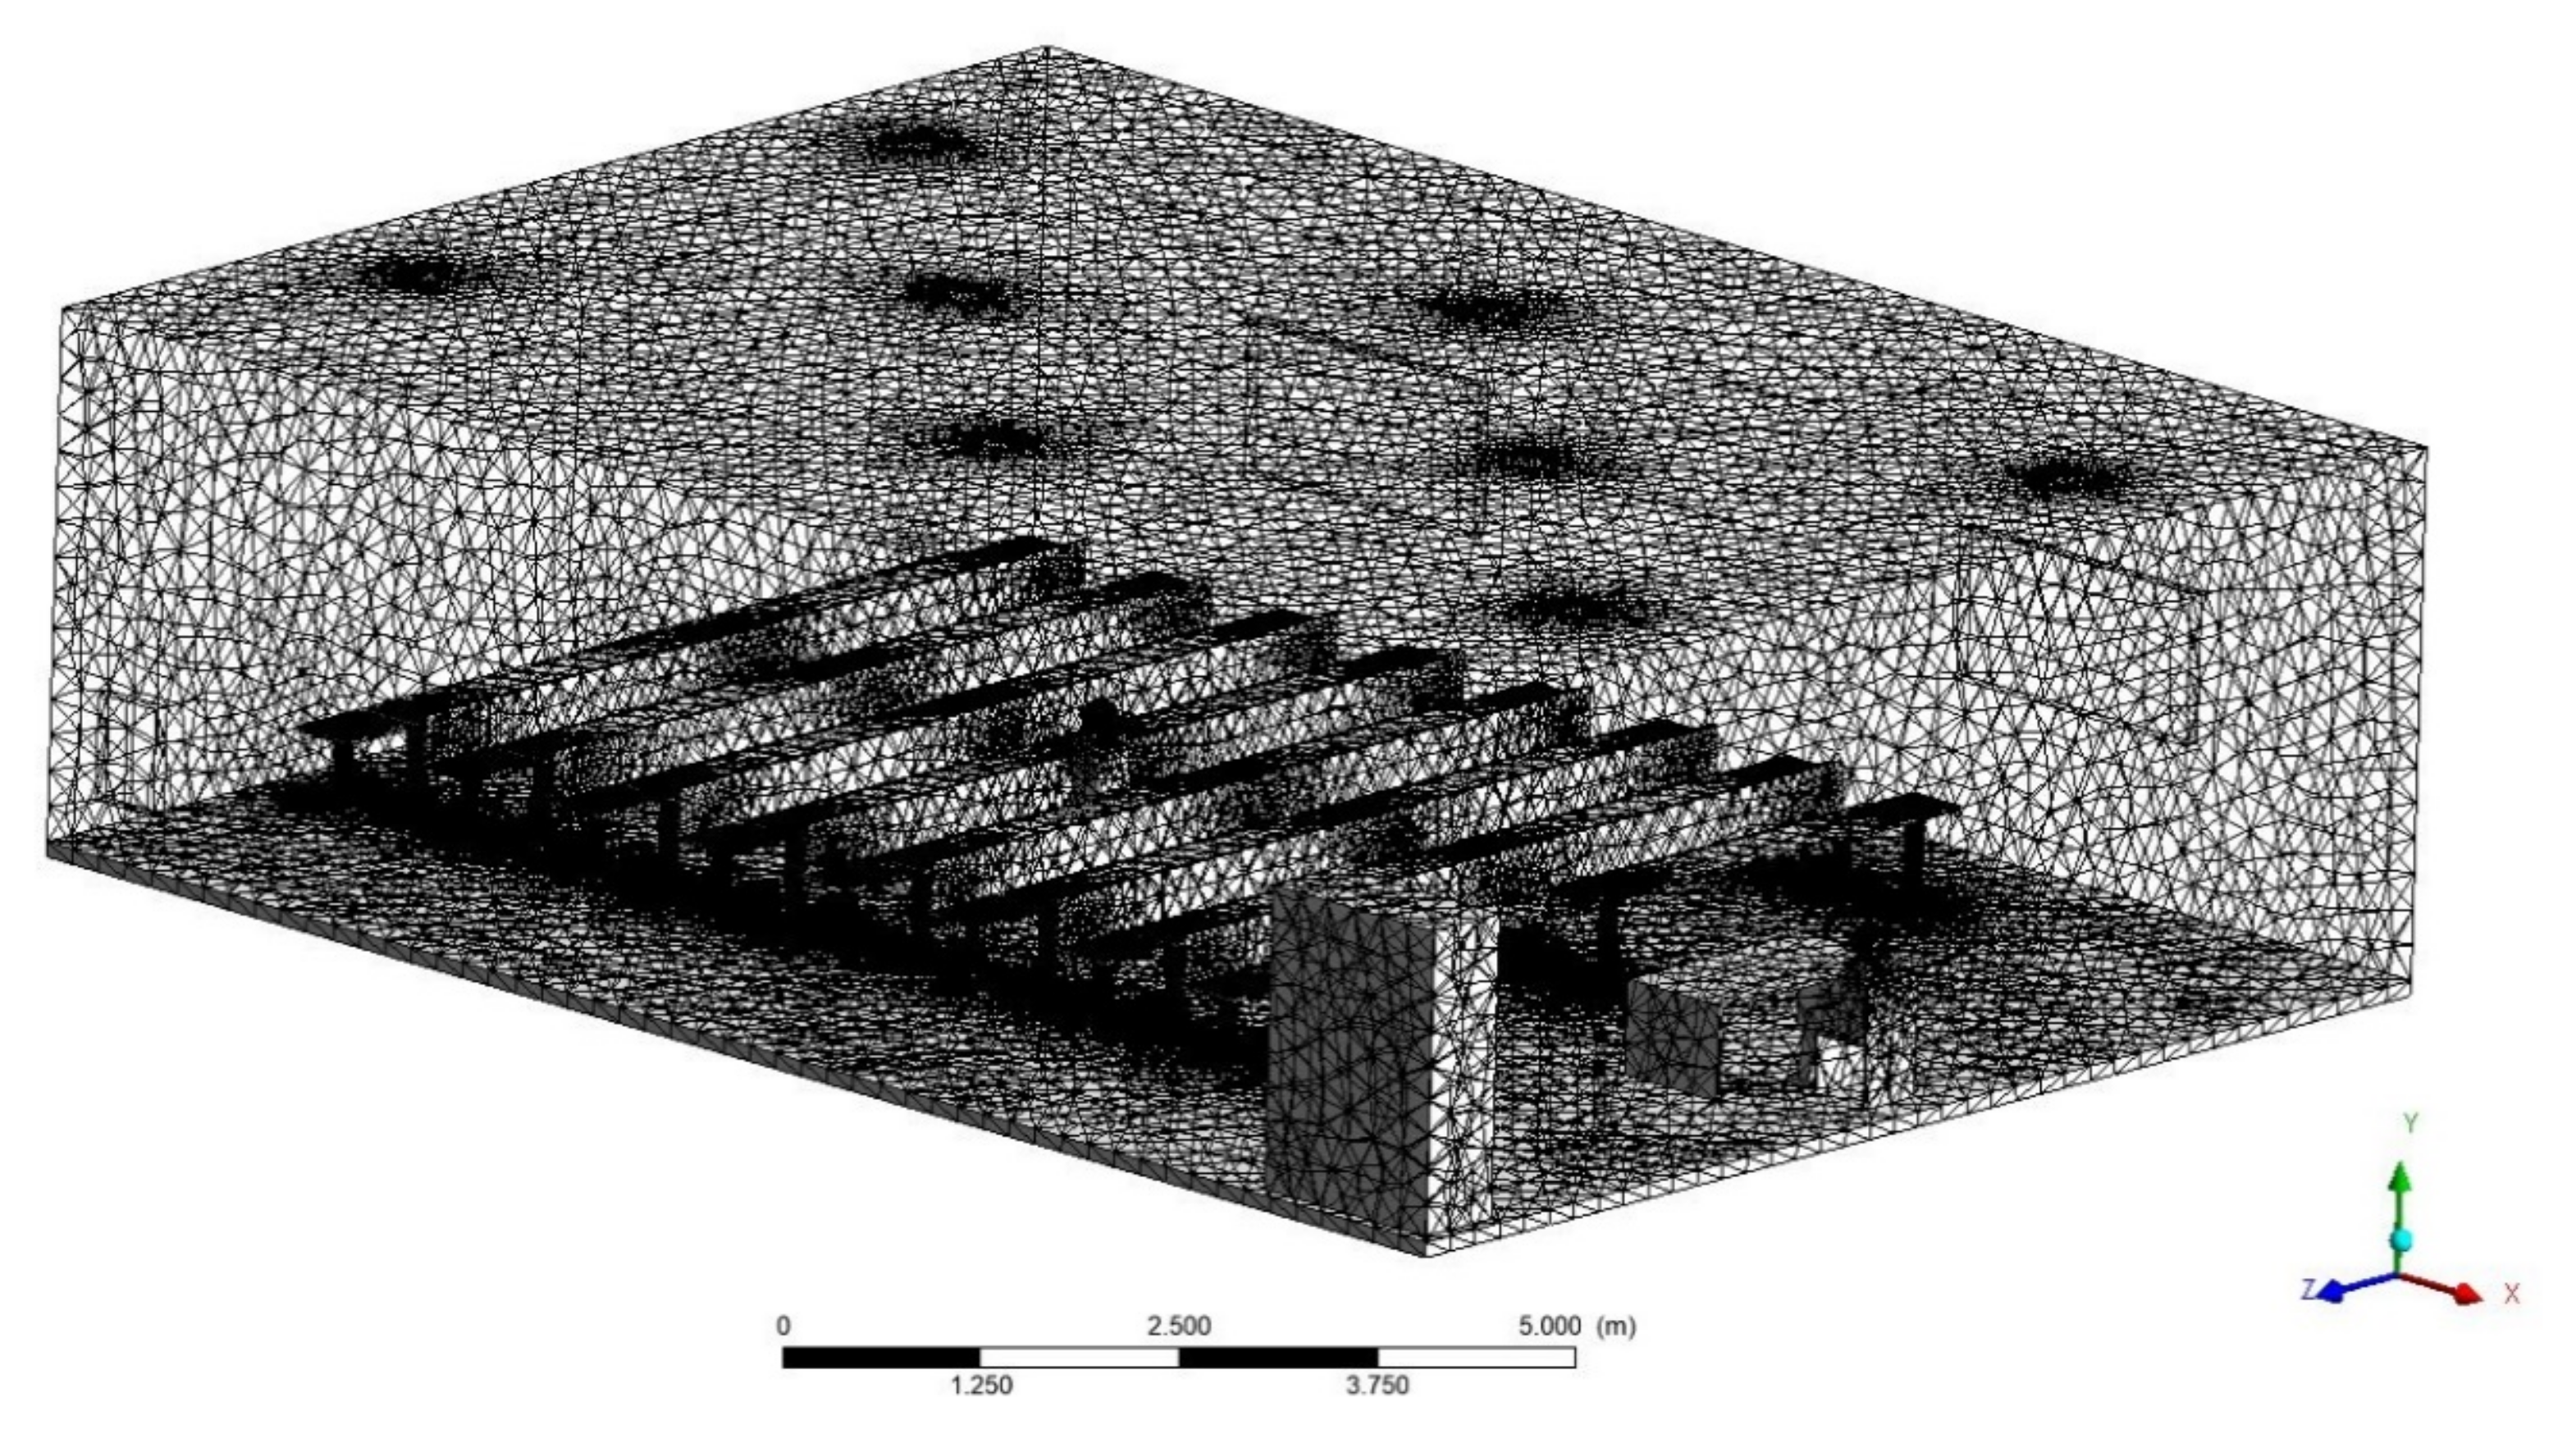
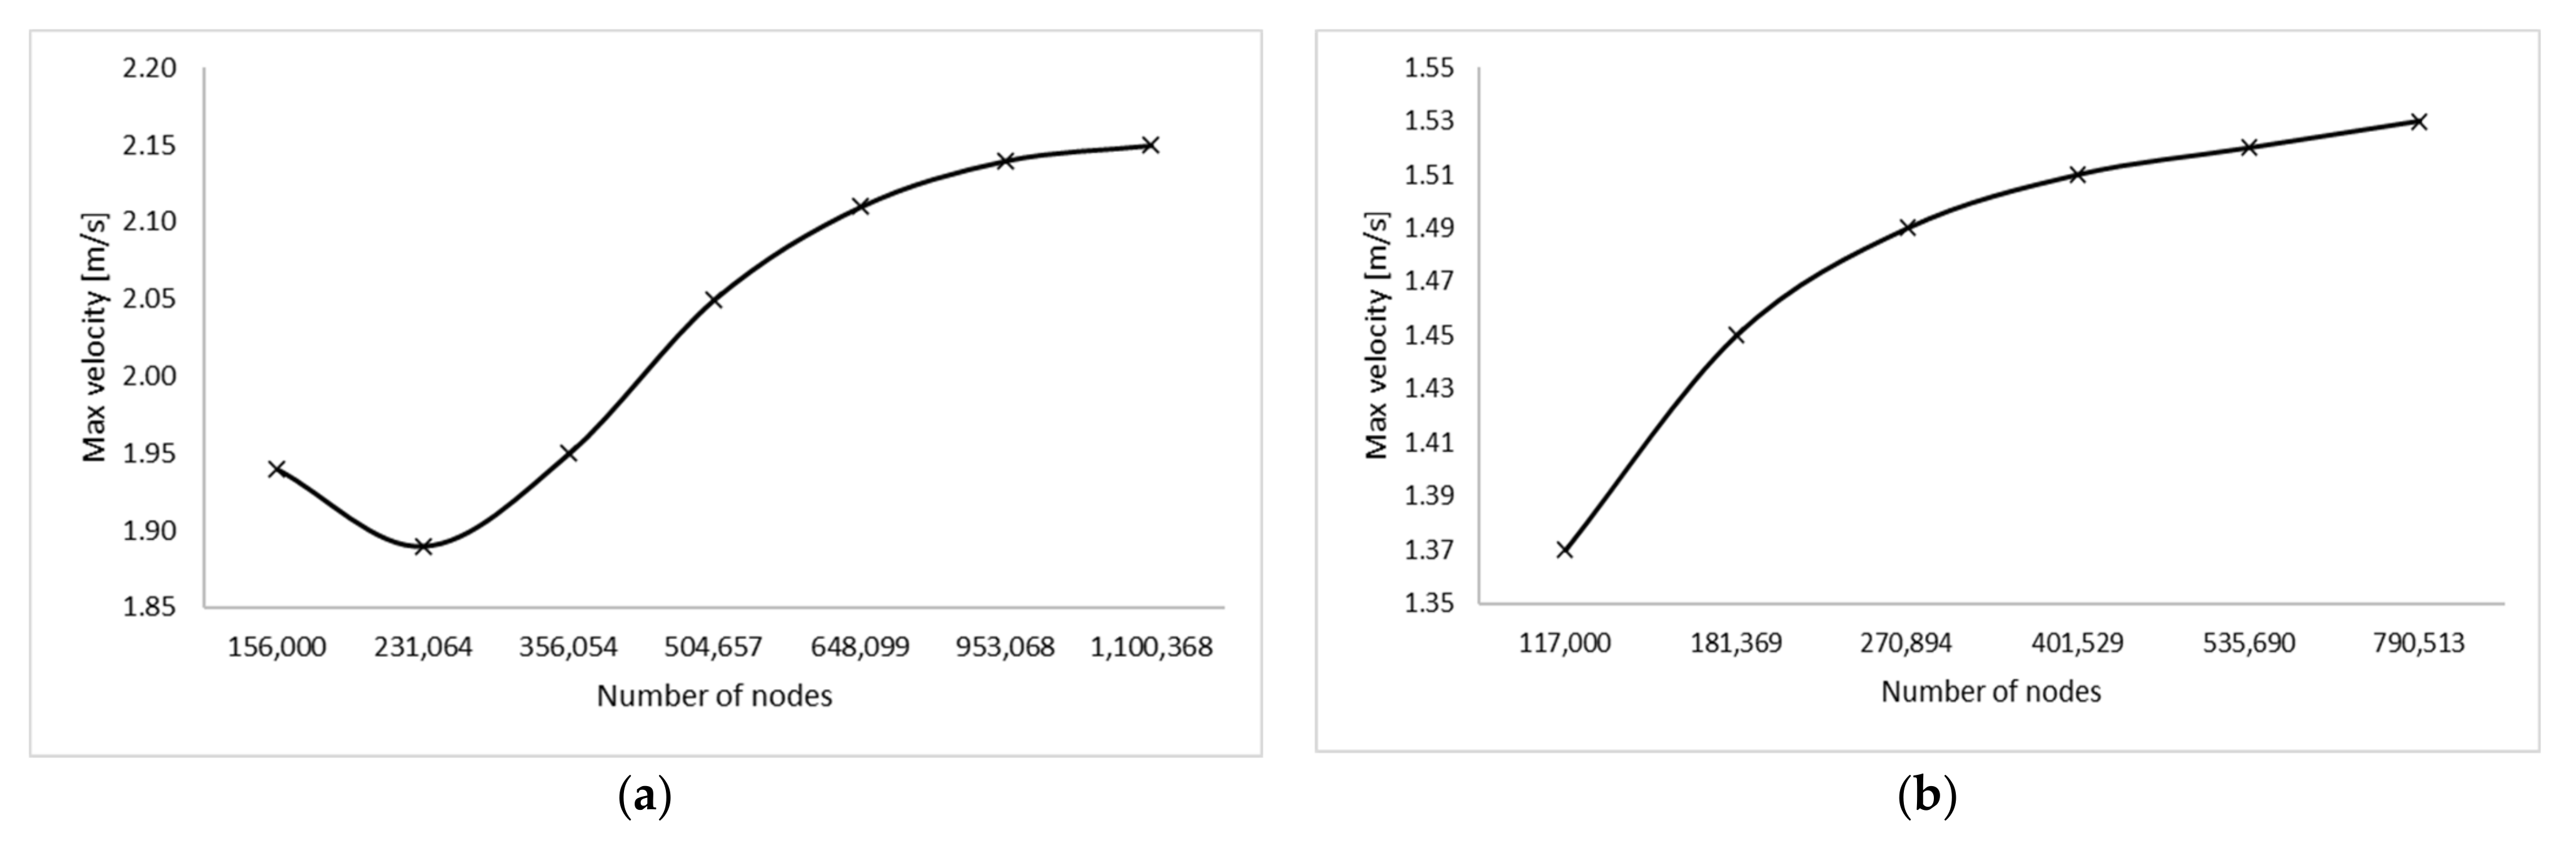
3.4. CFD Model Set Up
4. Results and Discussion
4.1. The Results of the CFD Model
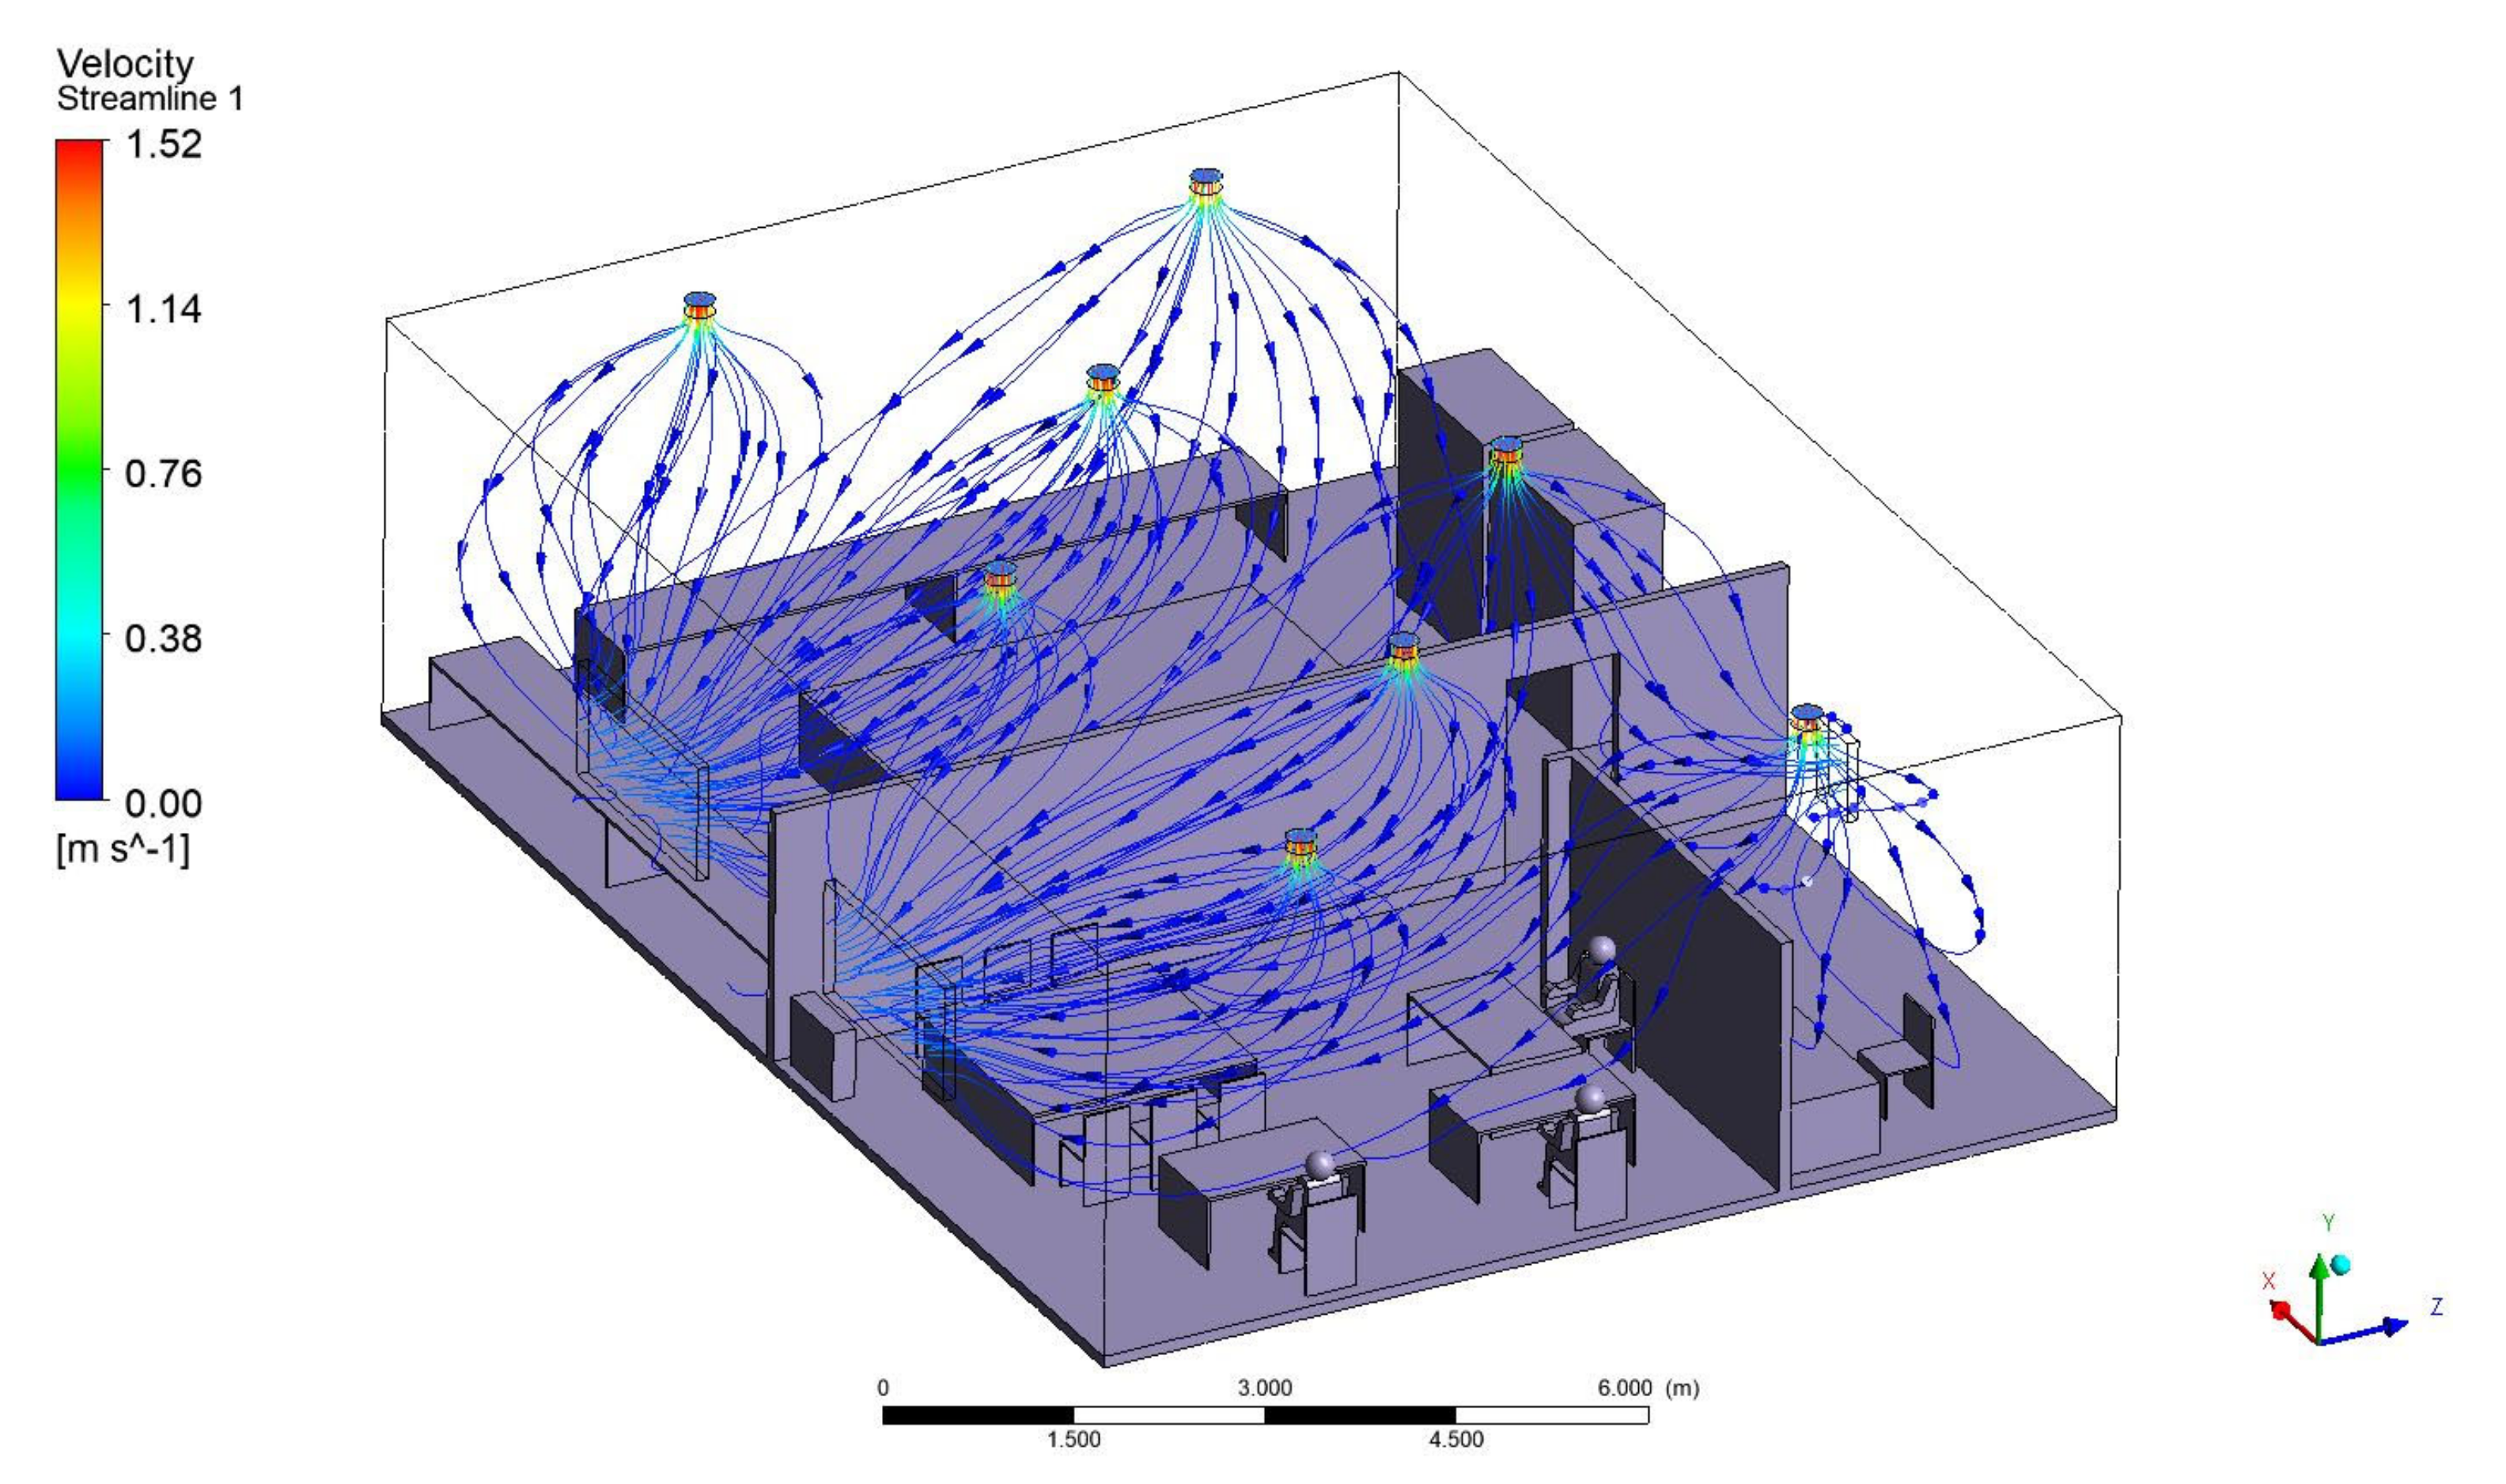
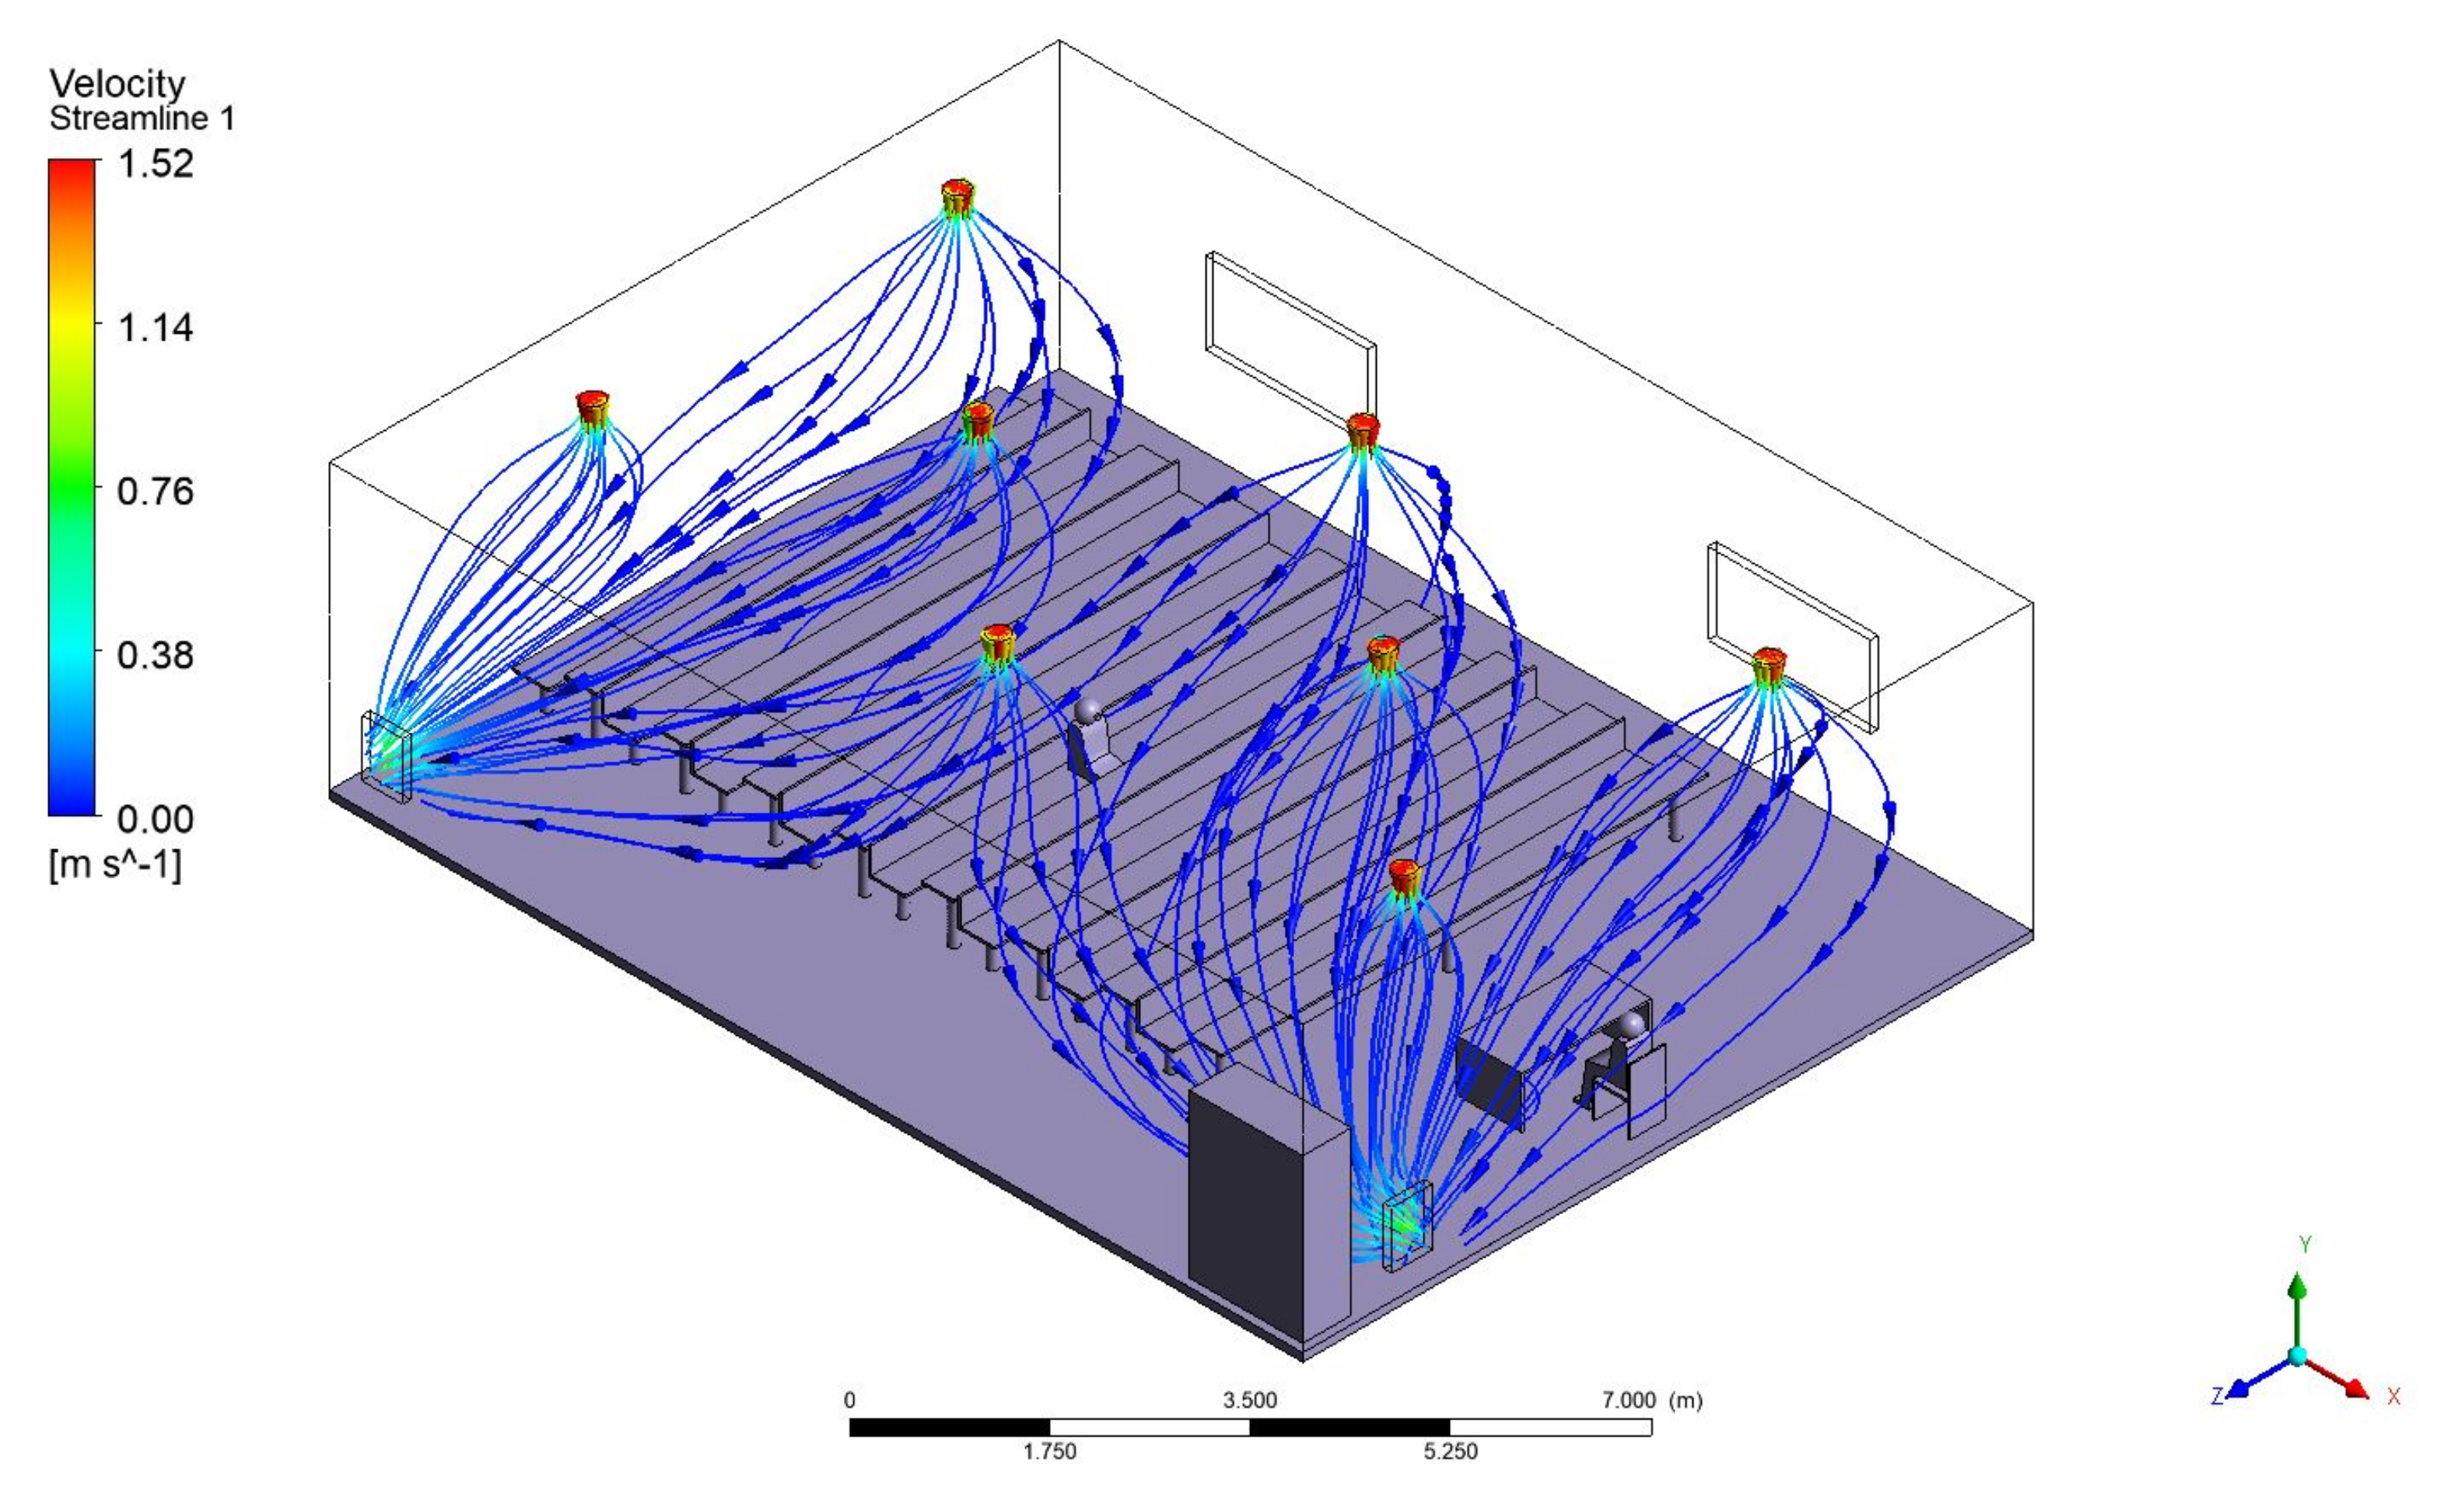
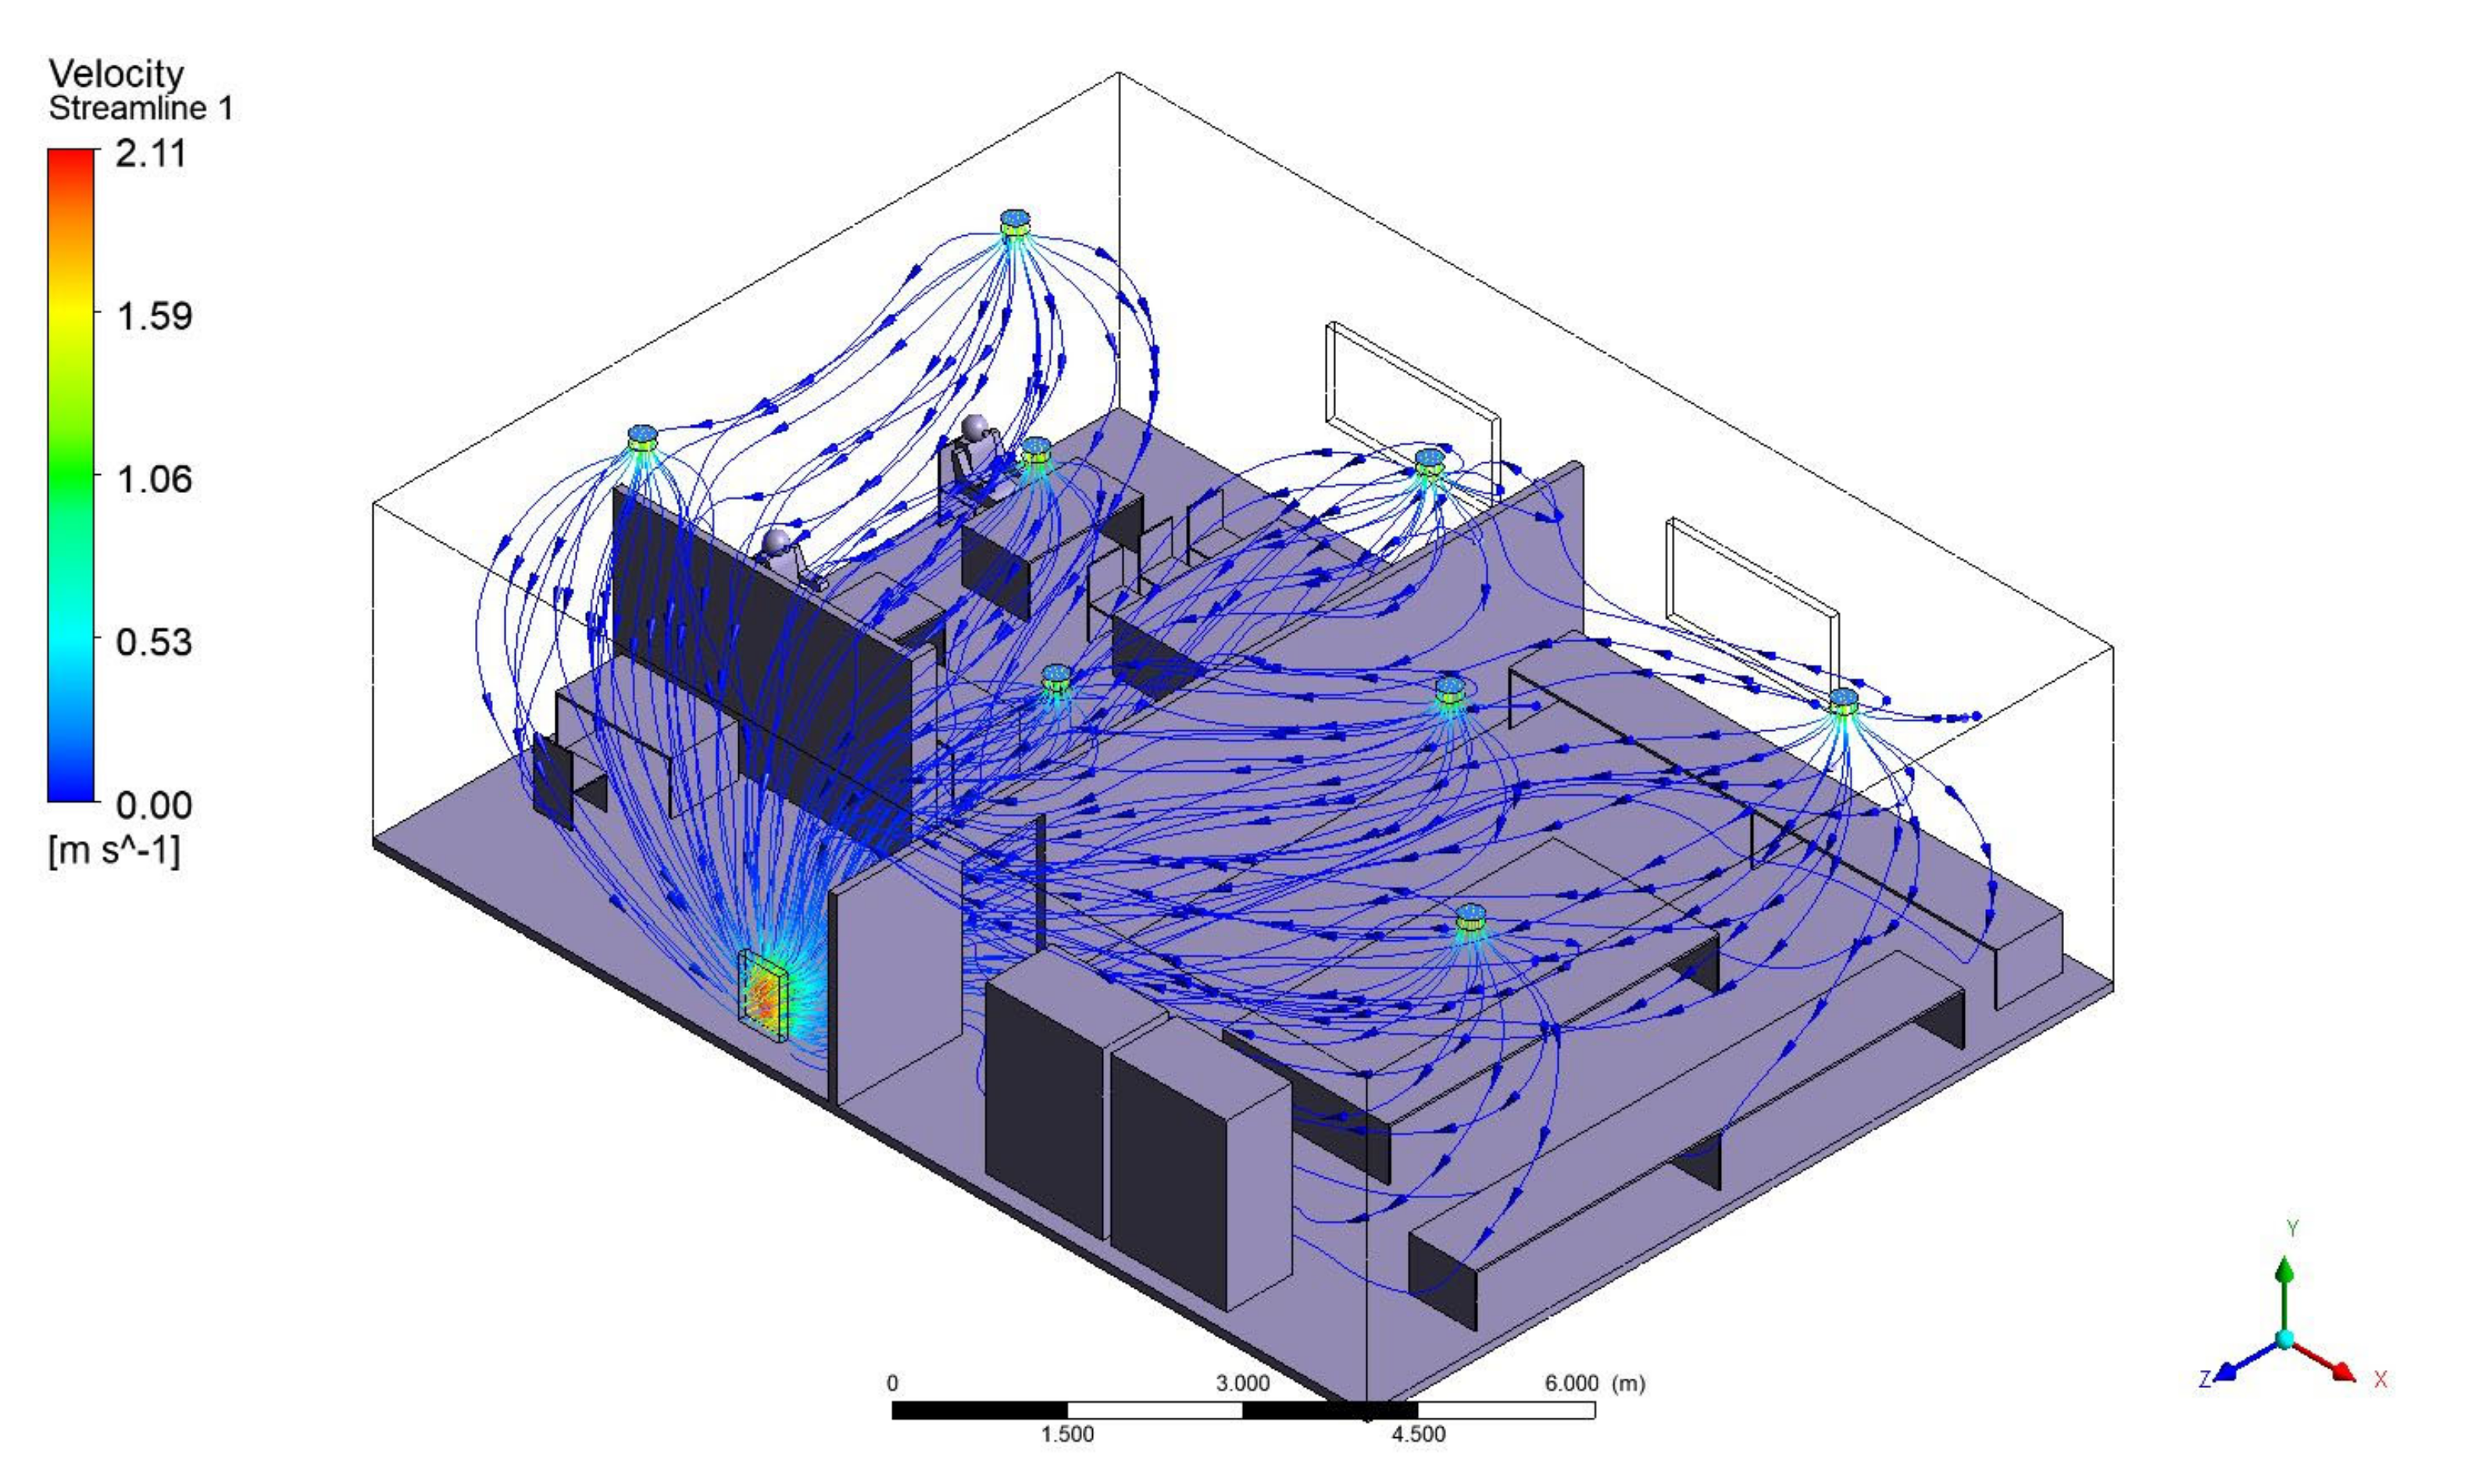
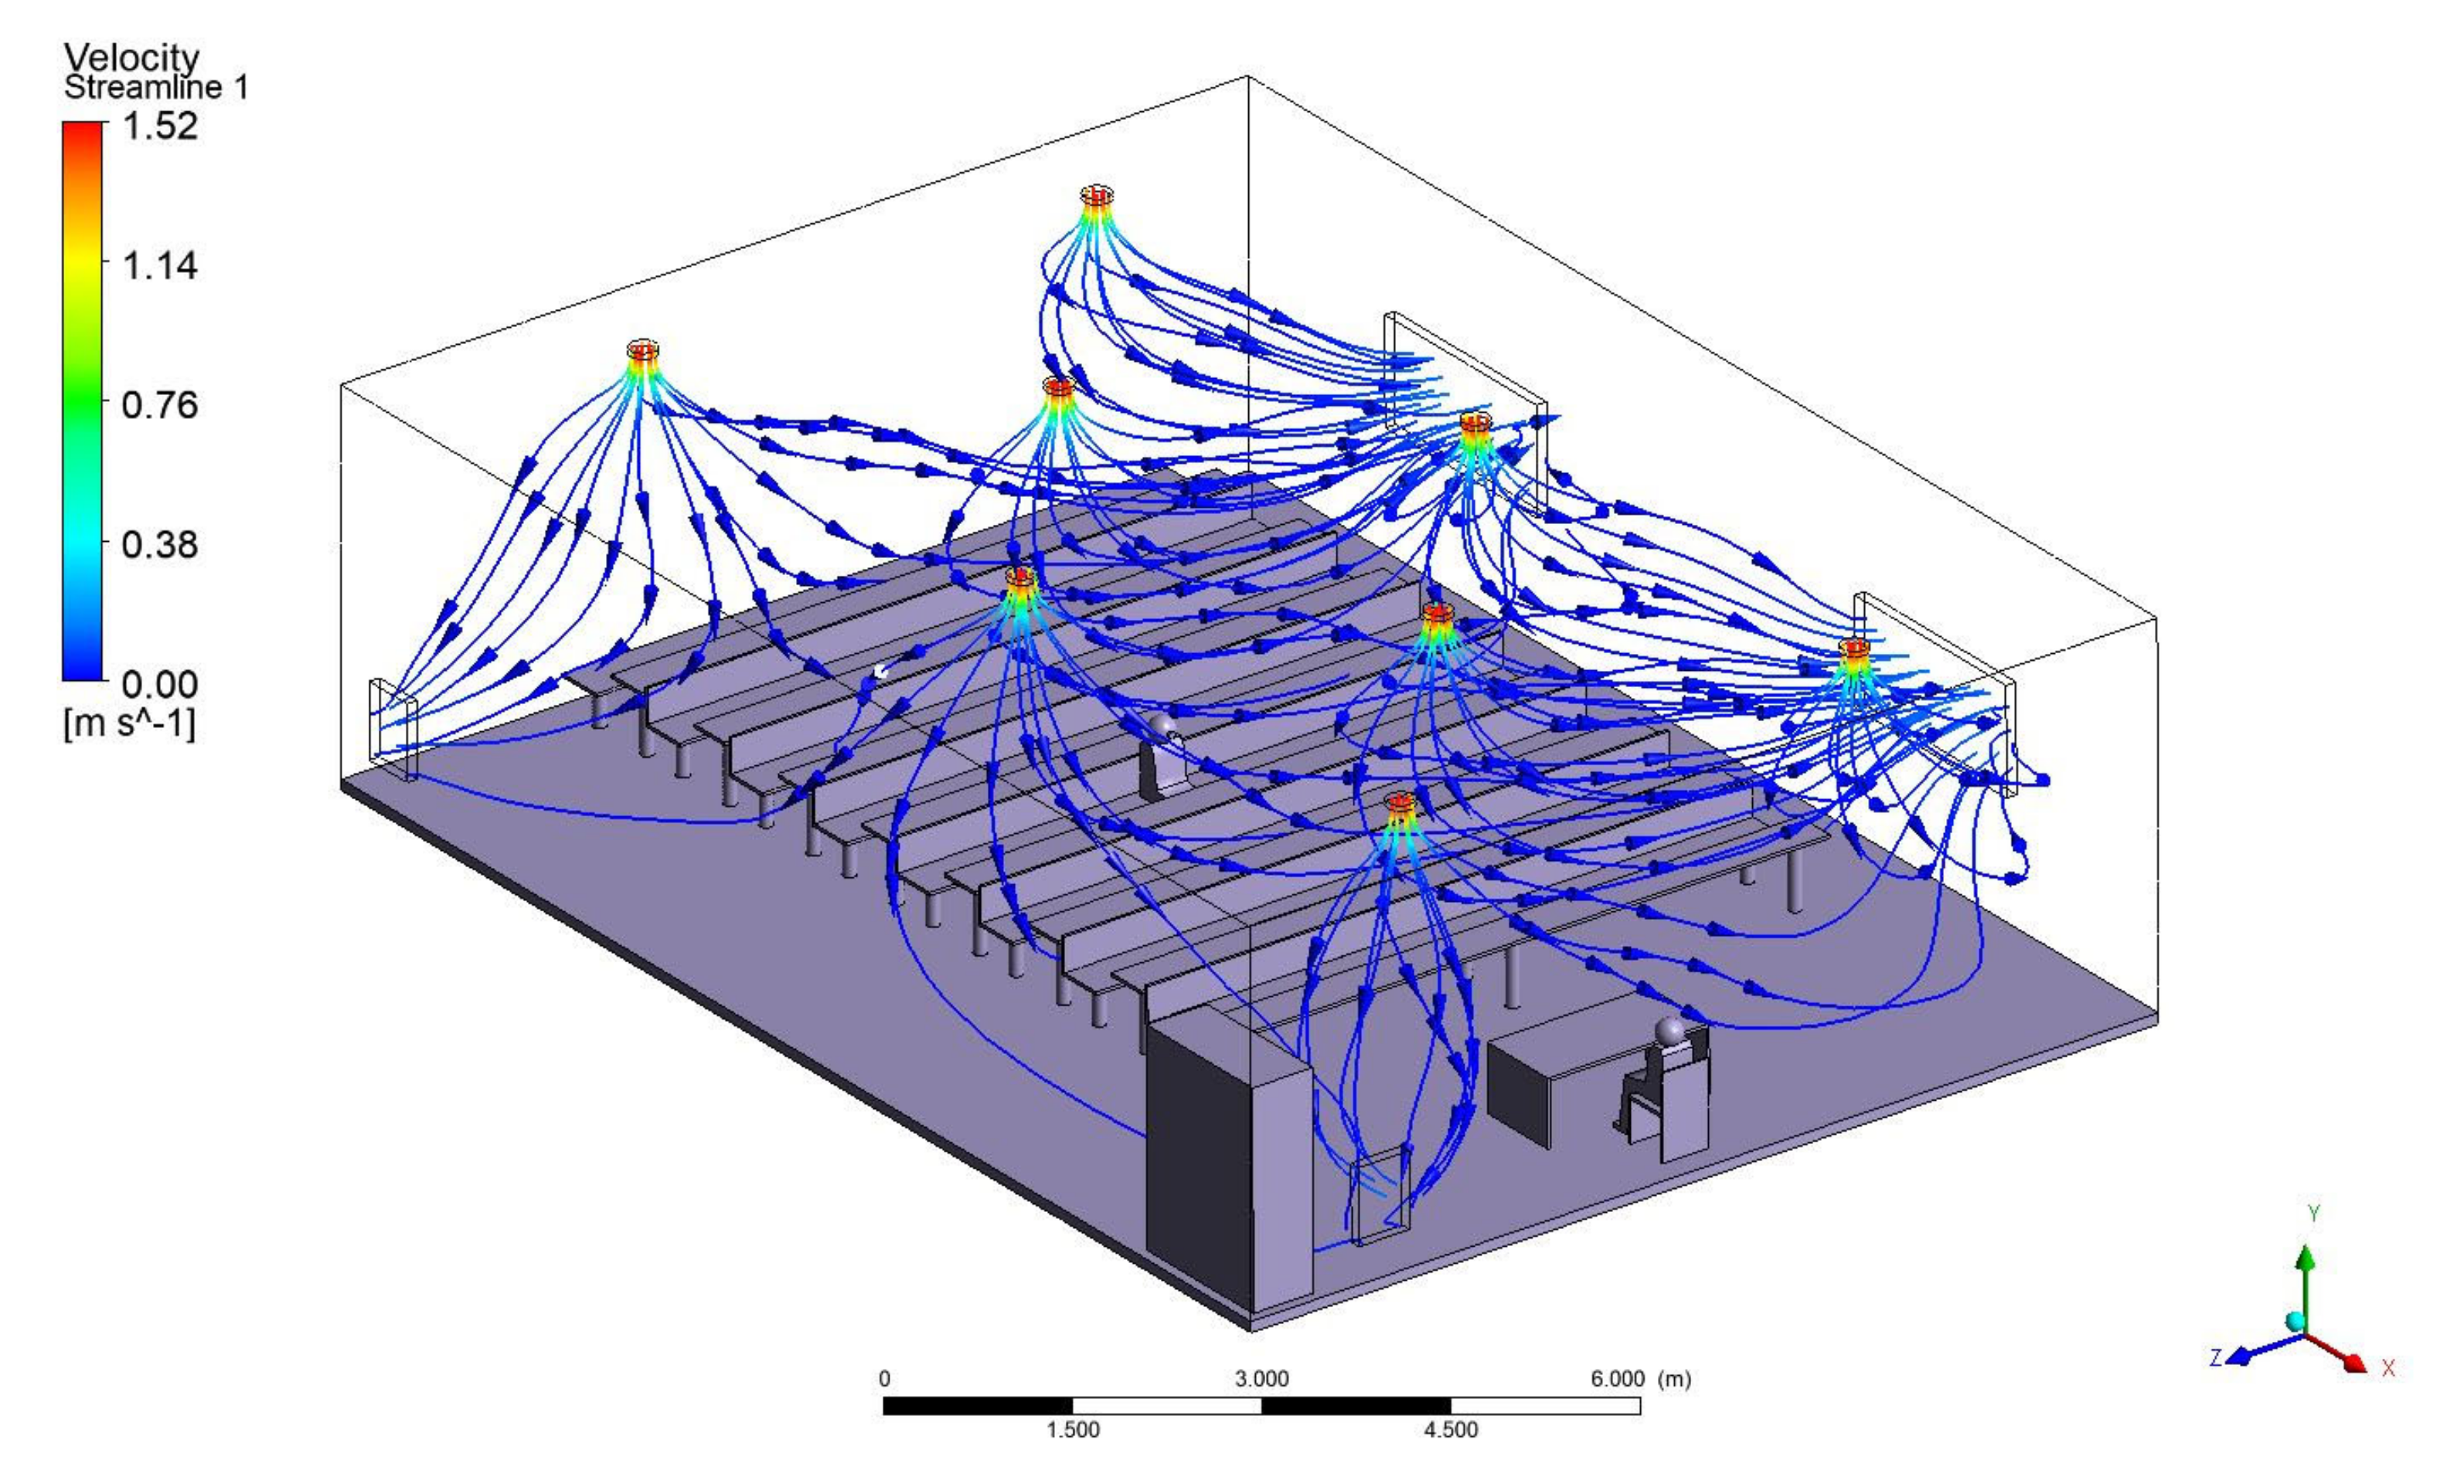
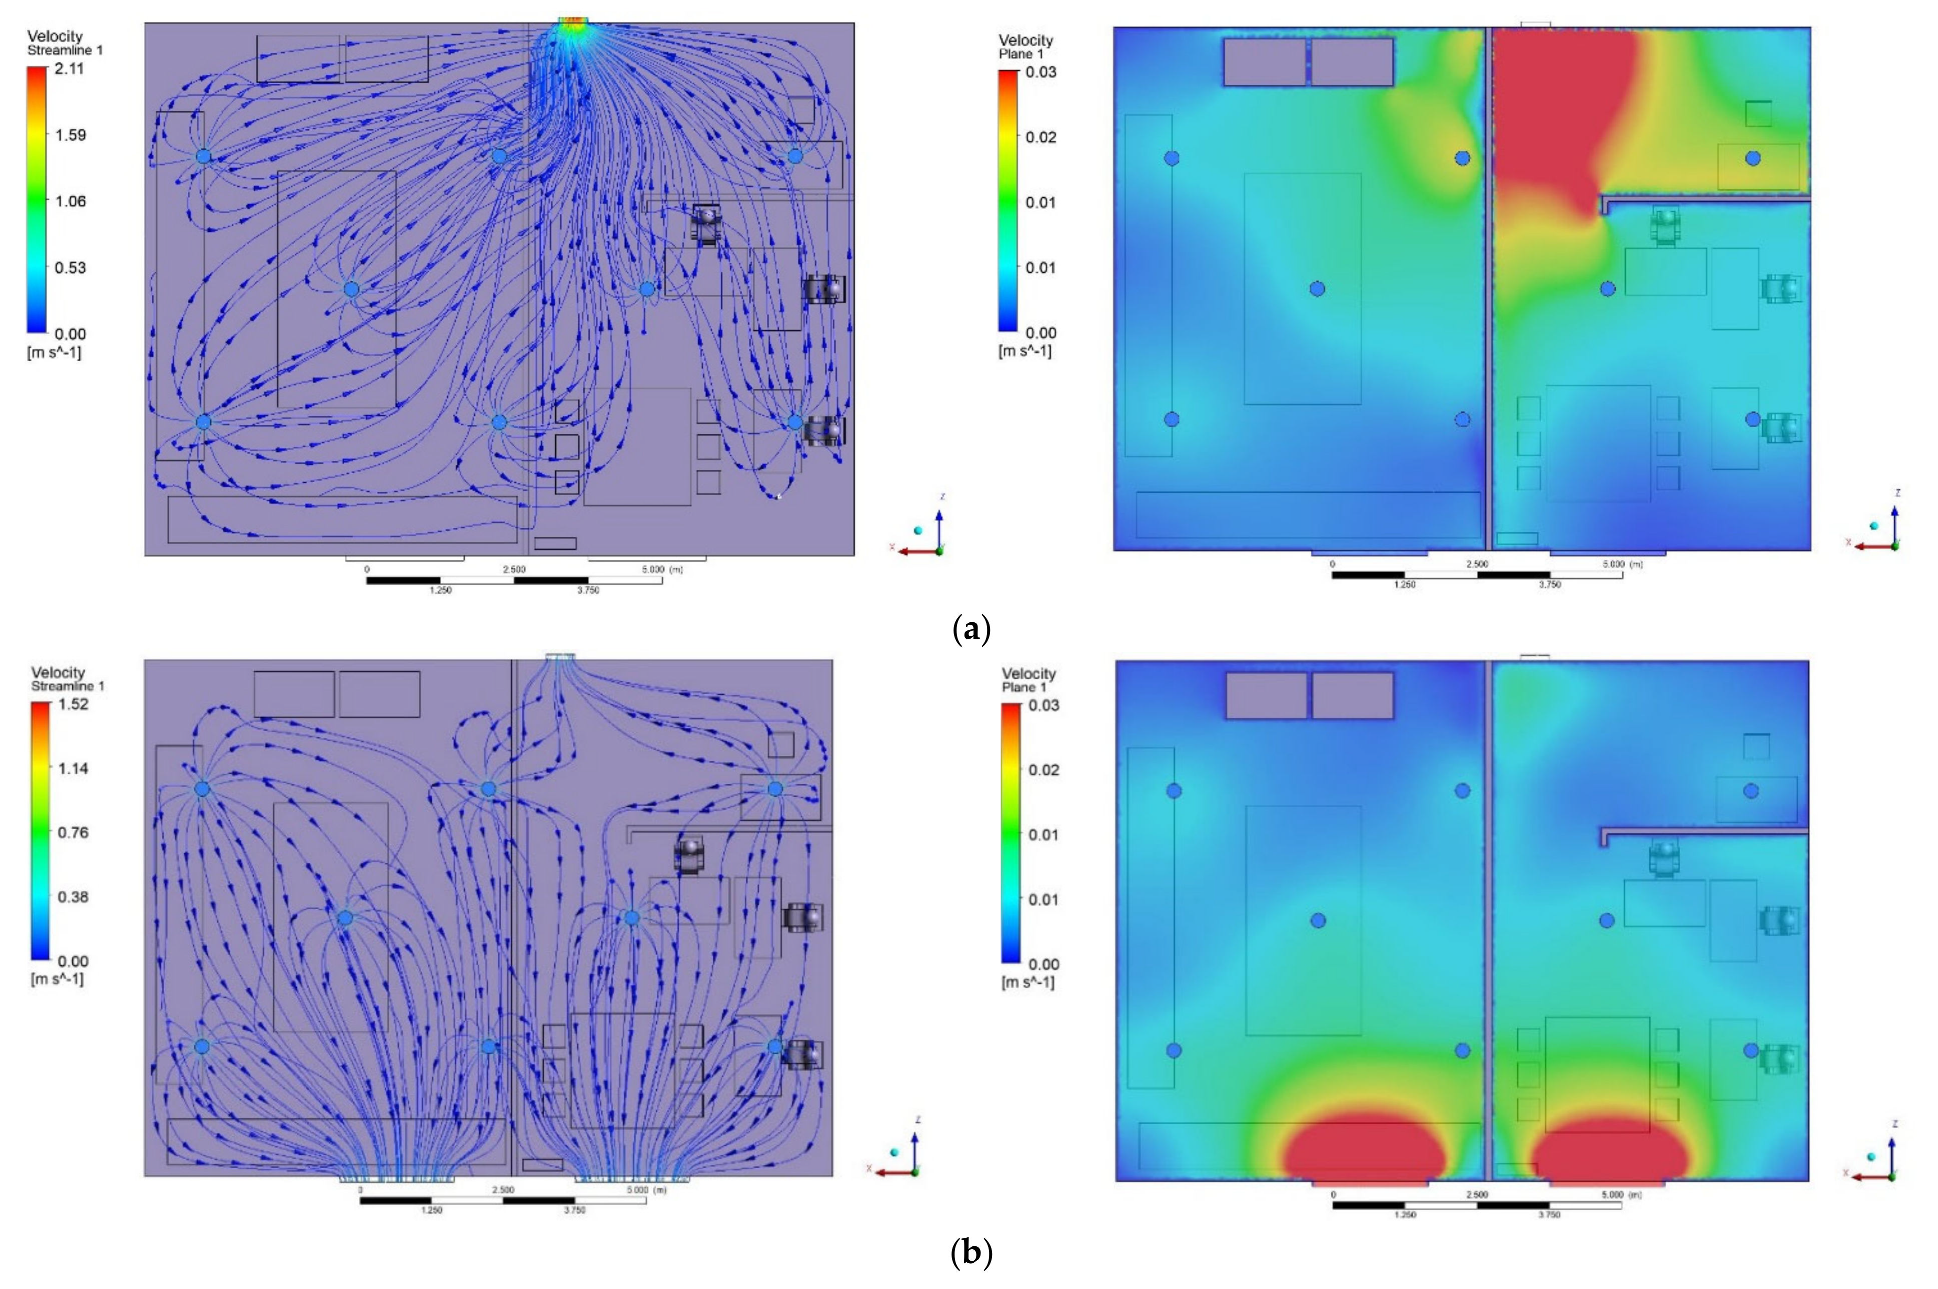
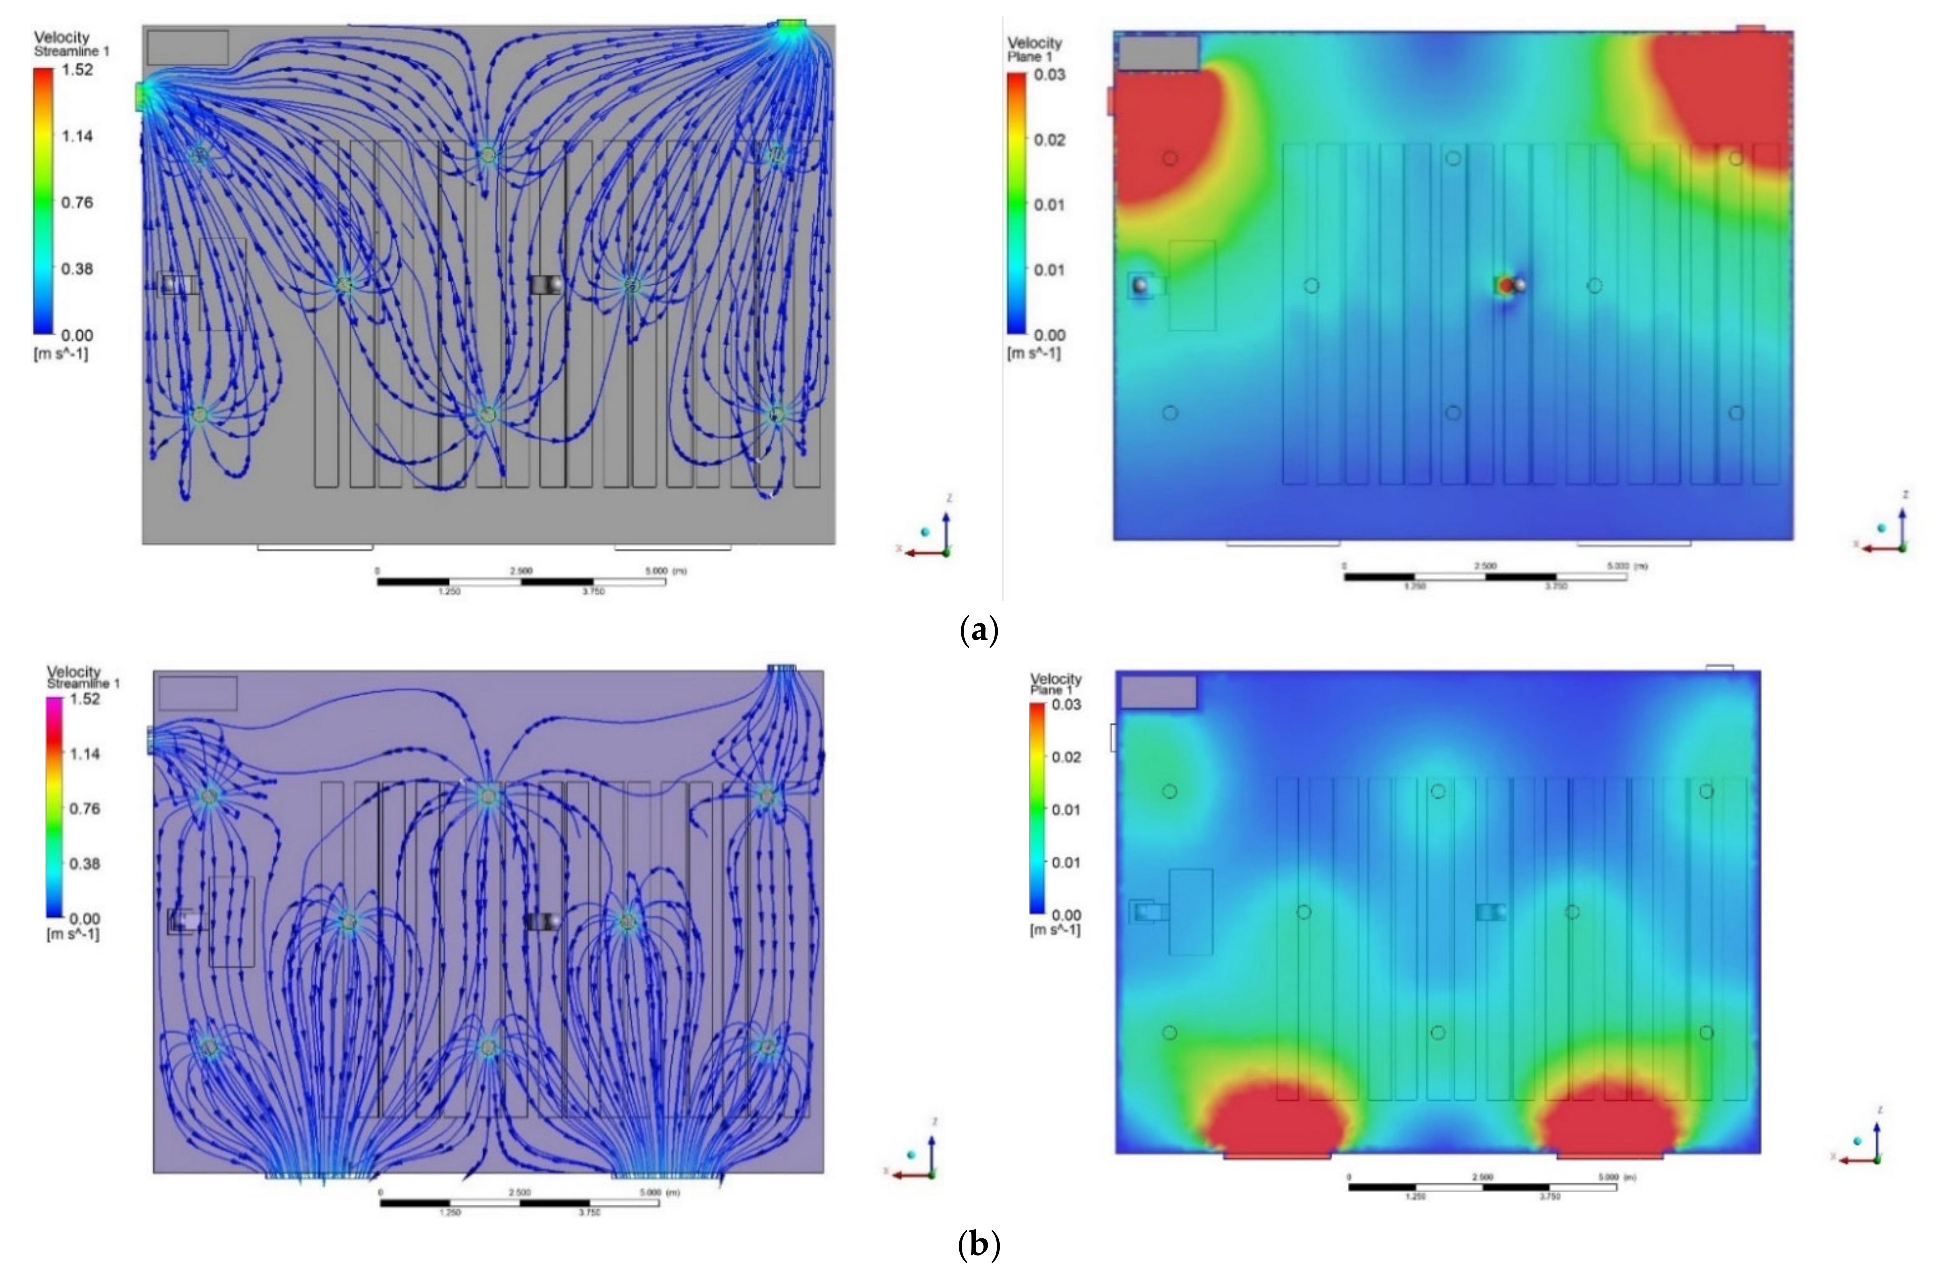
4.1.1. Indoor Airflow Patterns and the Impacts of Inlet/Outlet, Windows Locations
4.1.2. ACH in the Indoor Environments and the Impact of Dead Zones
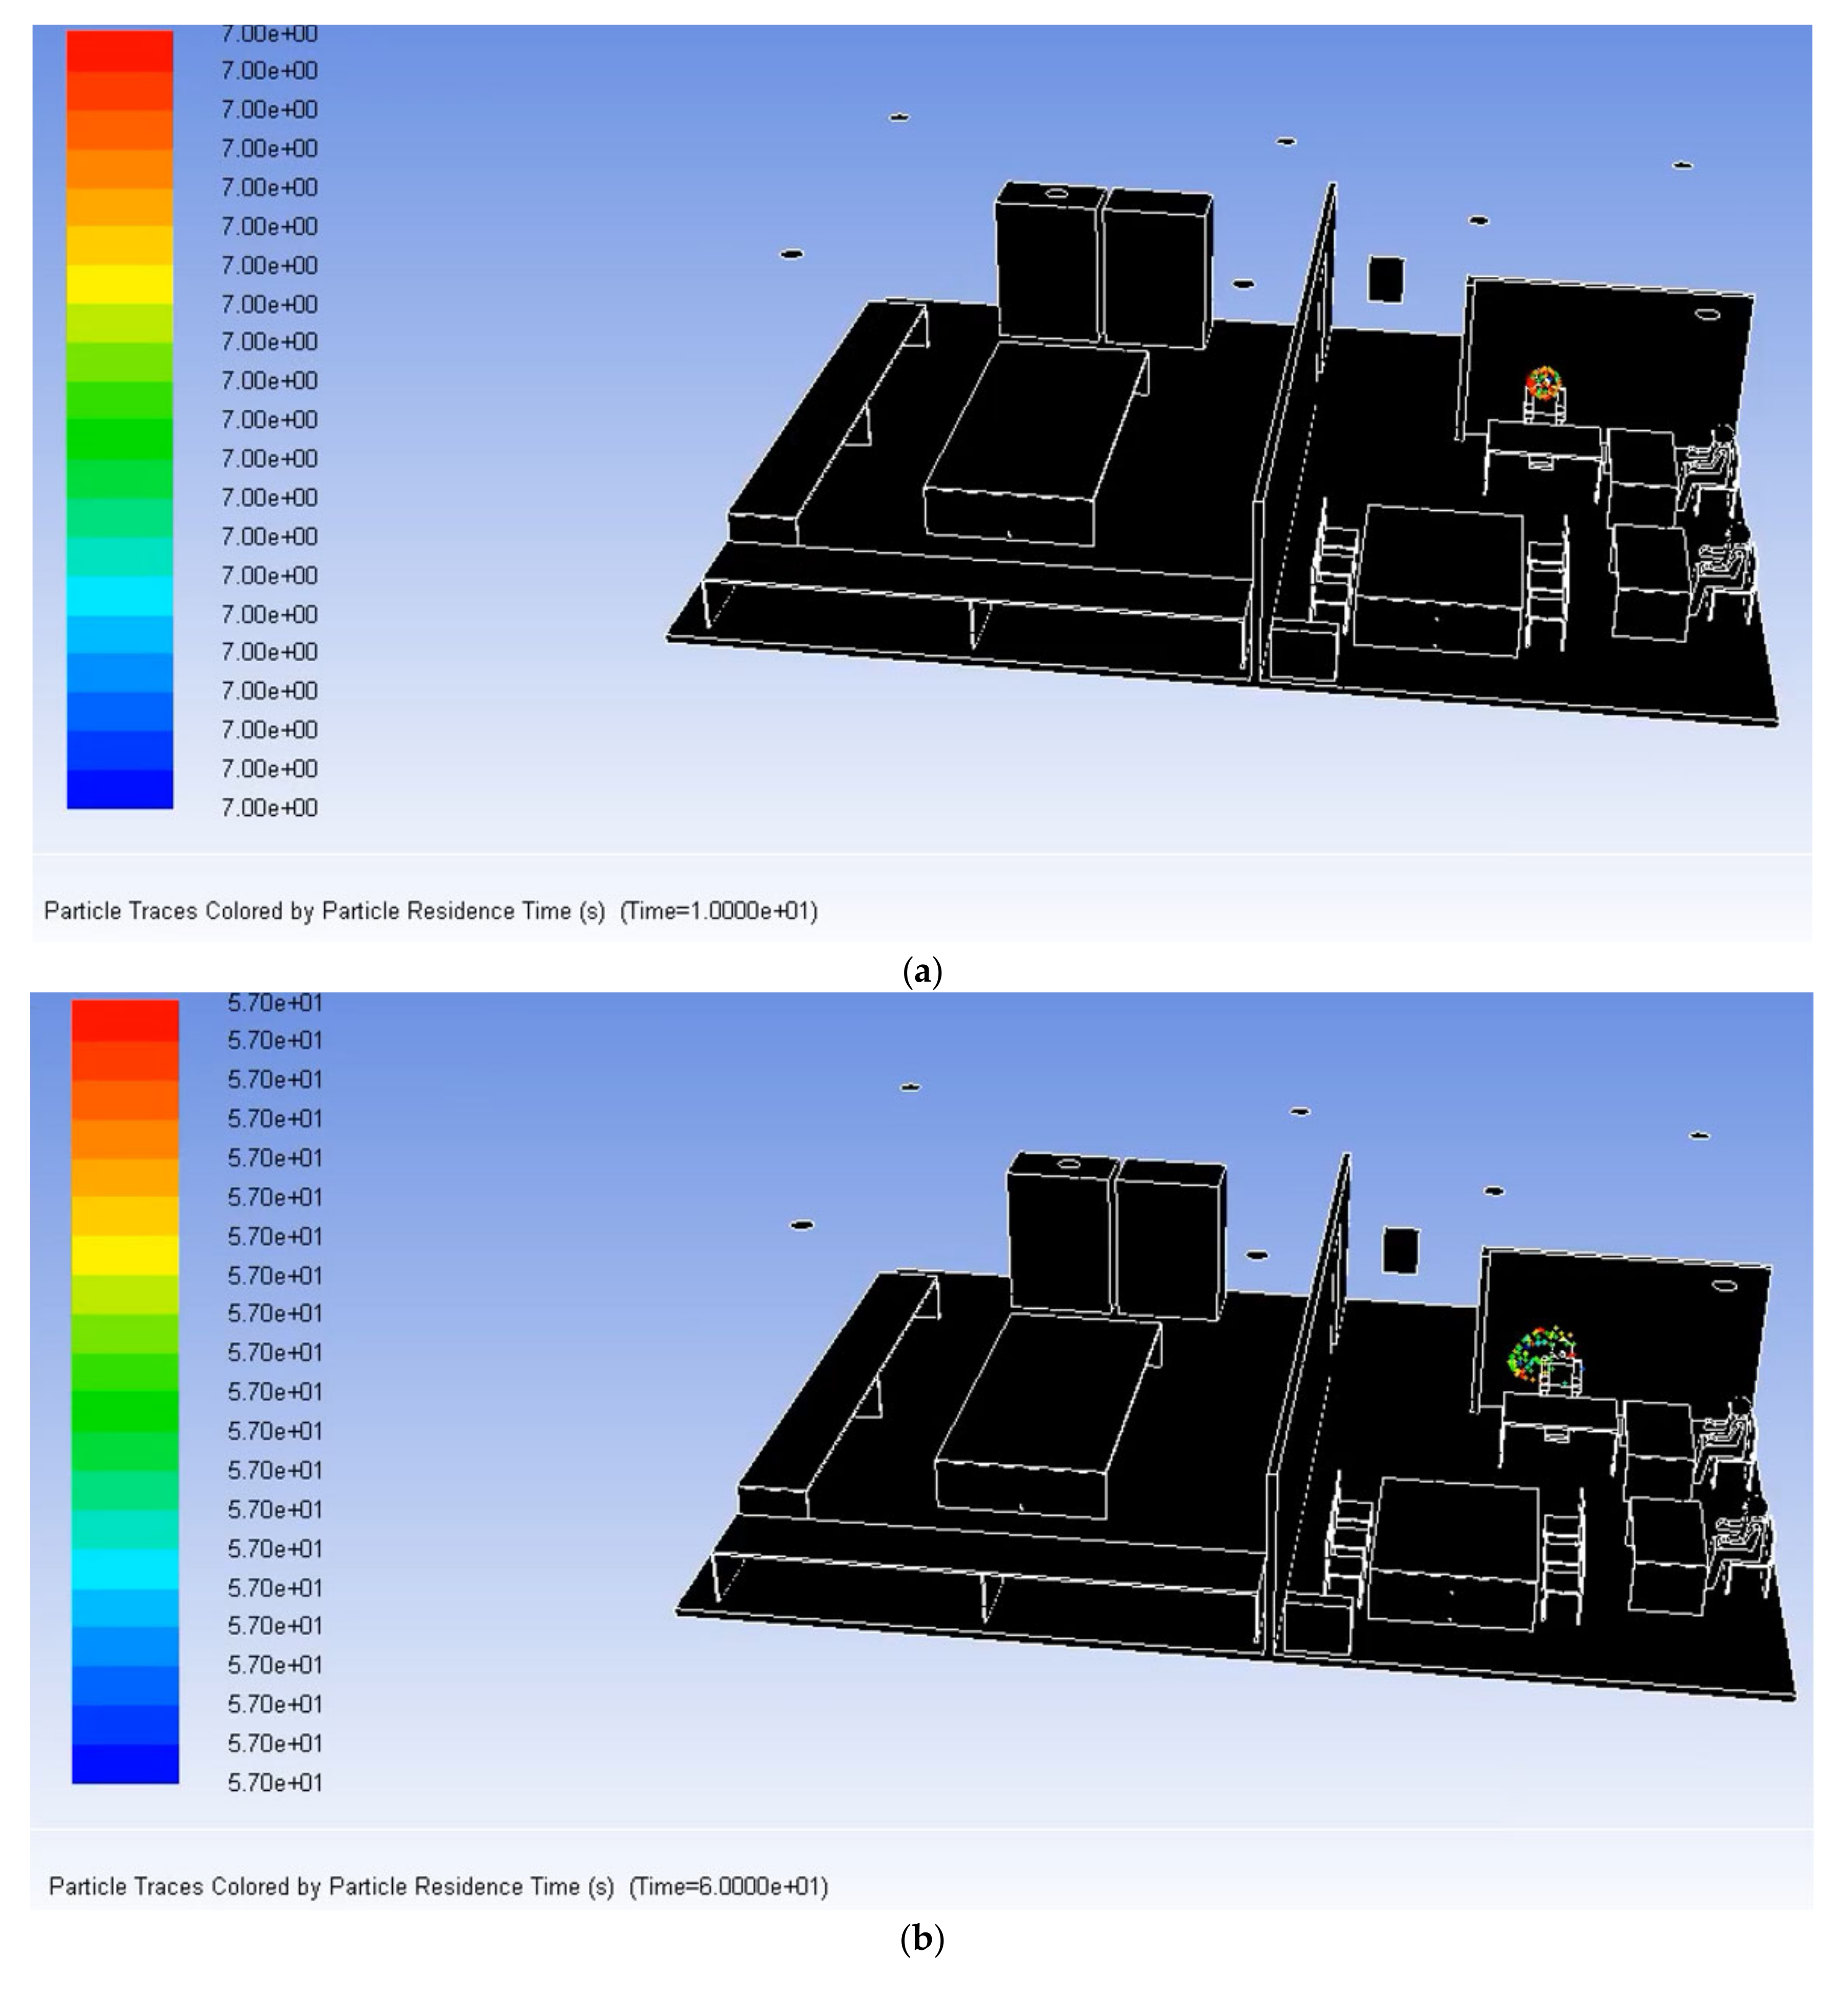
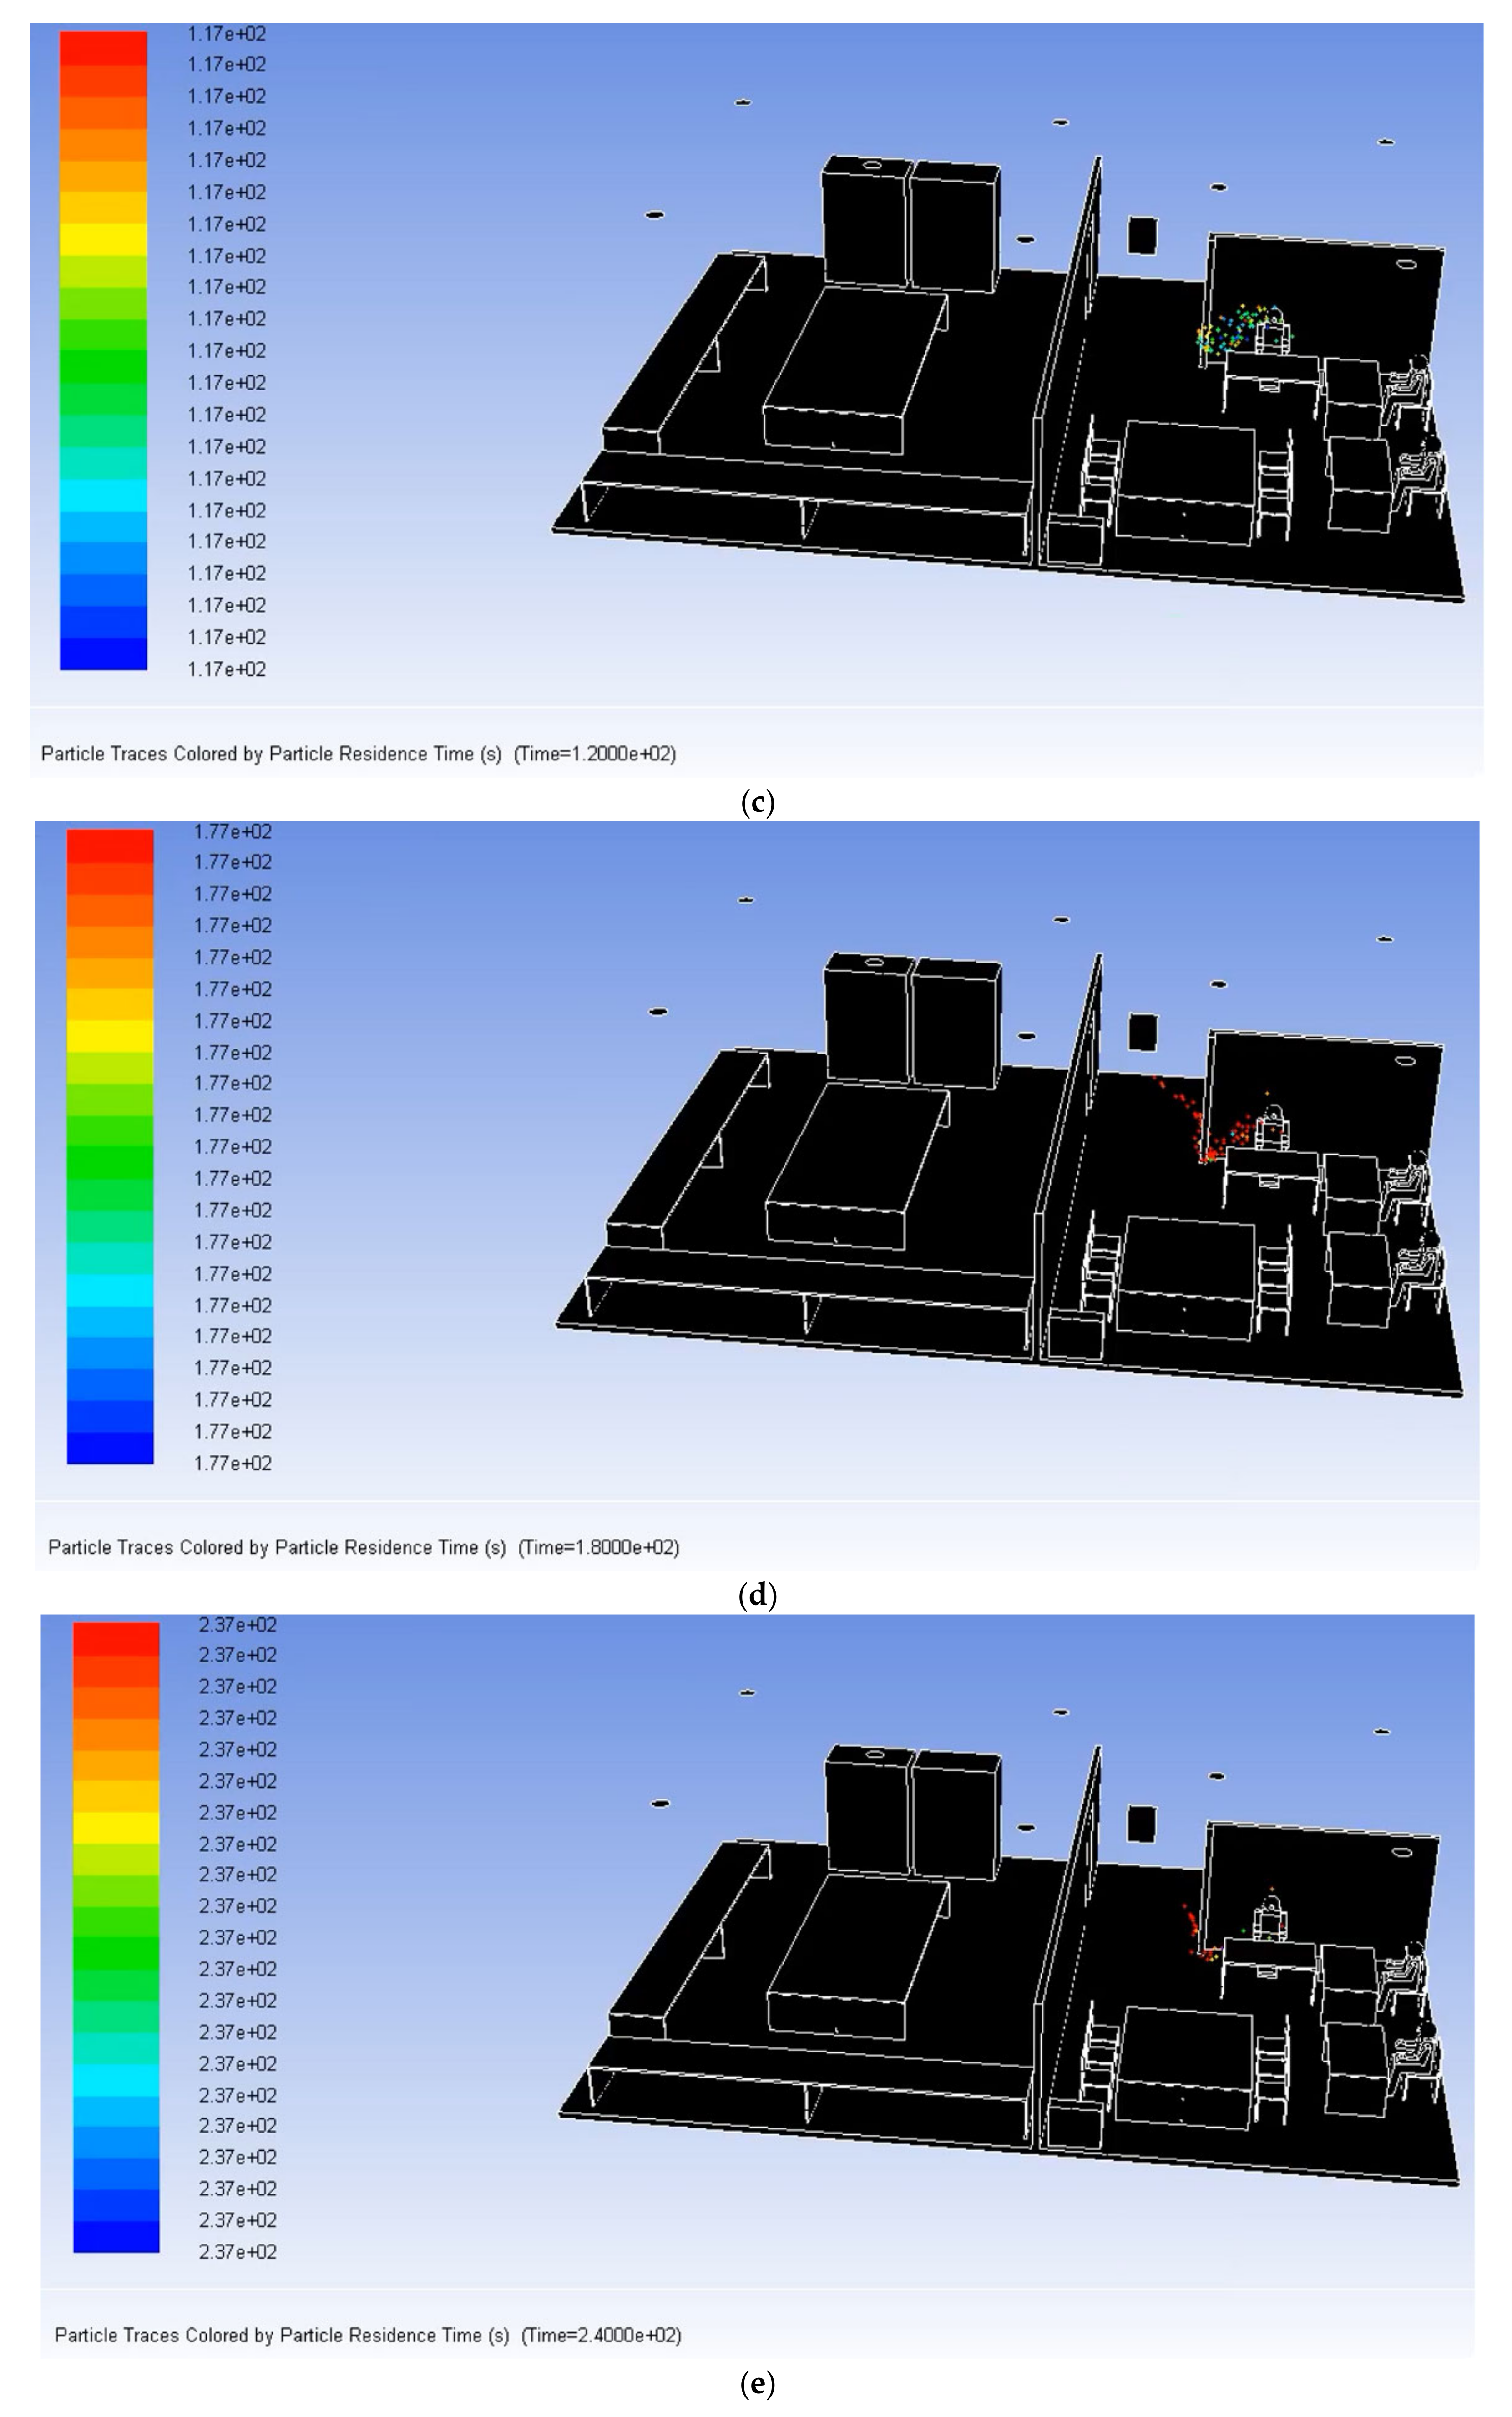
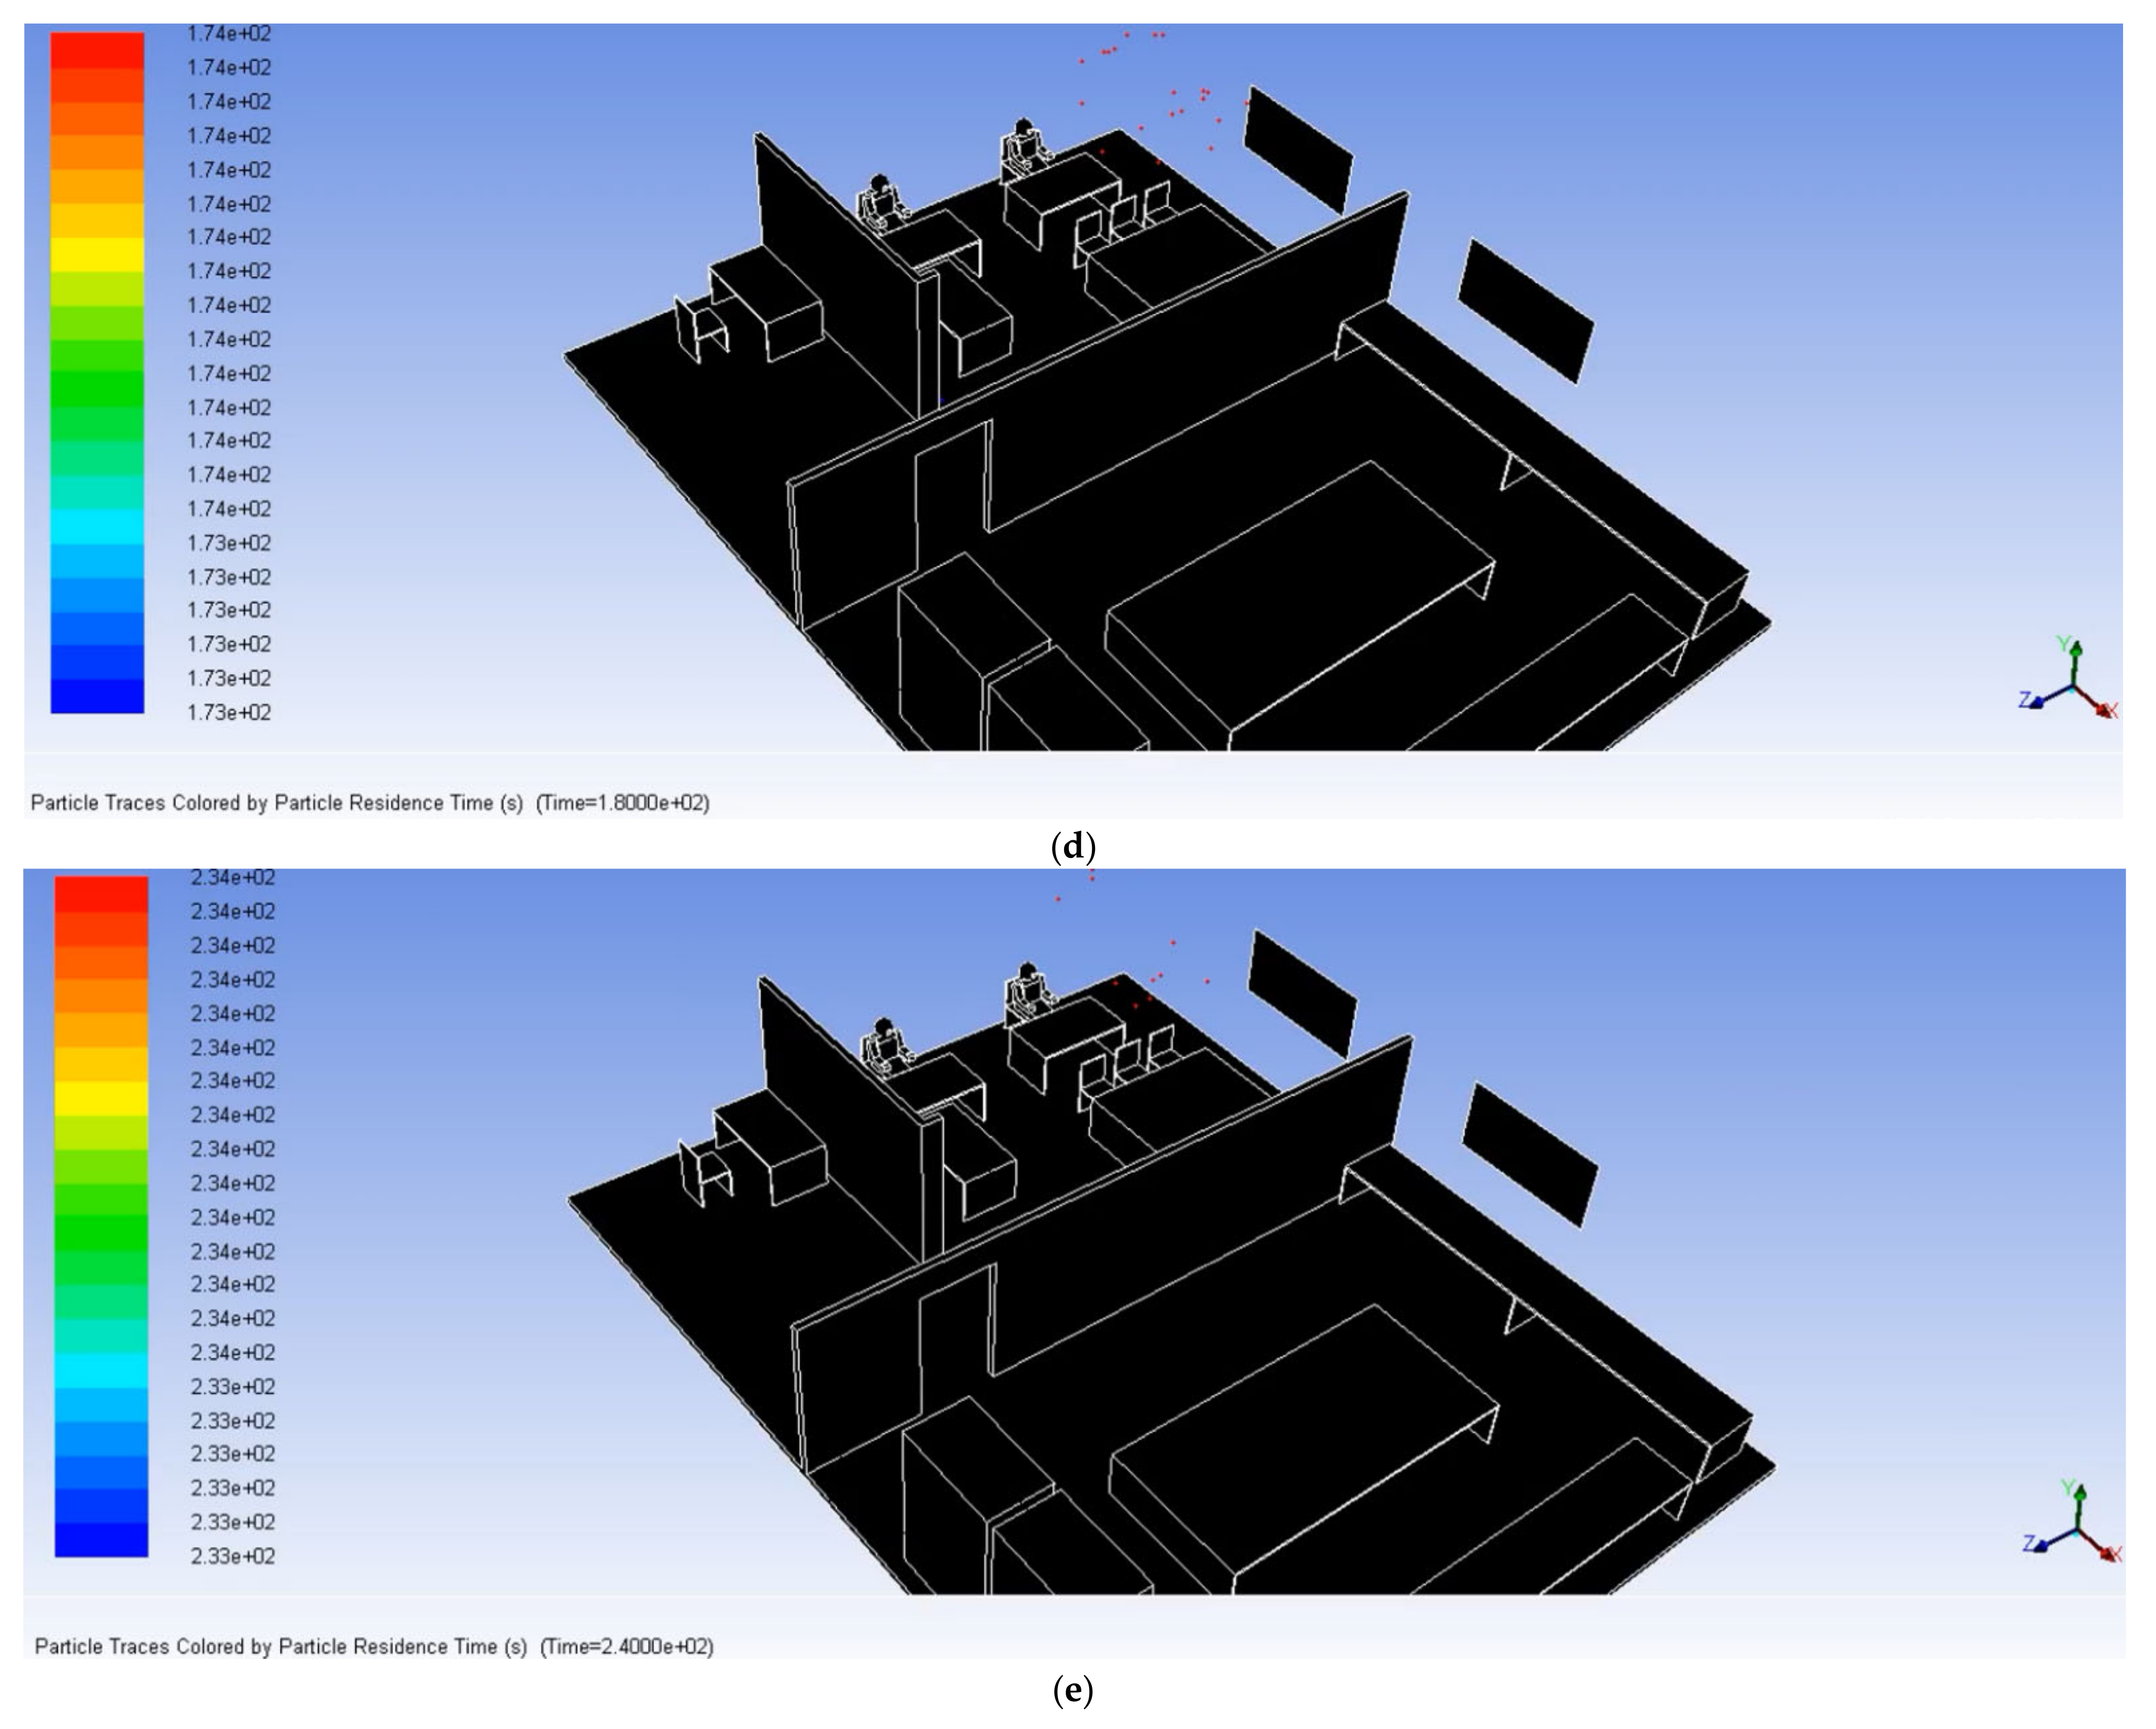
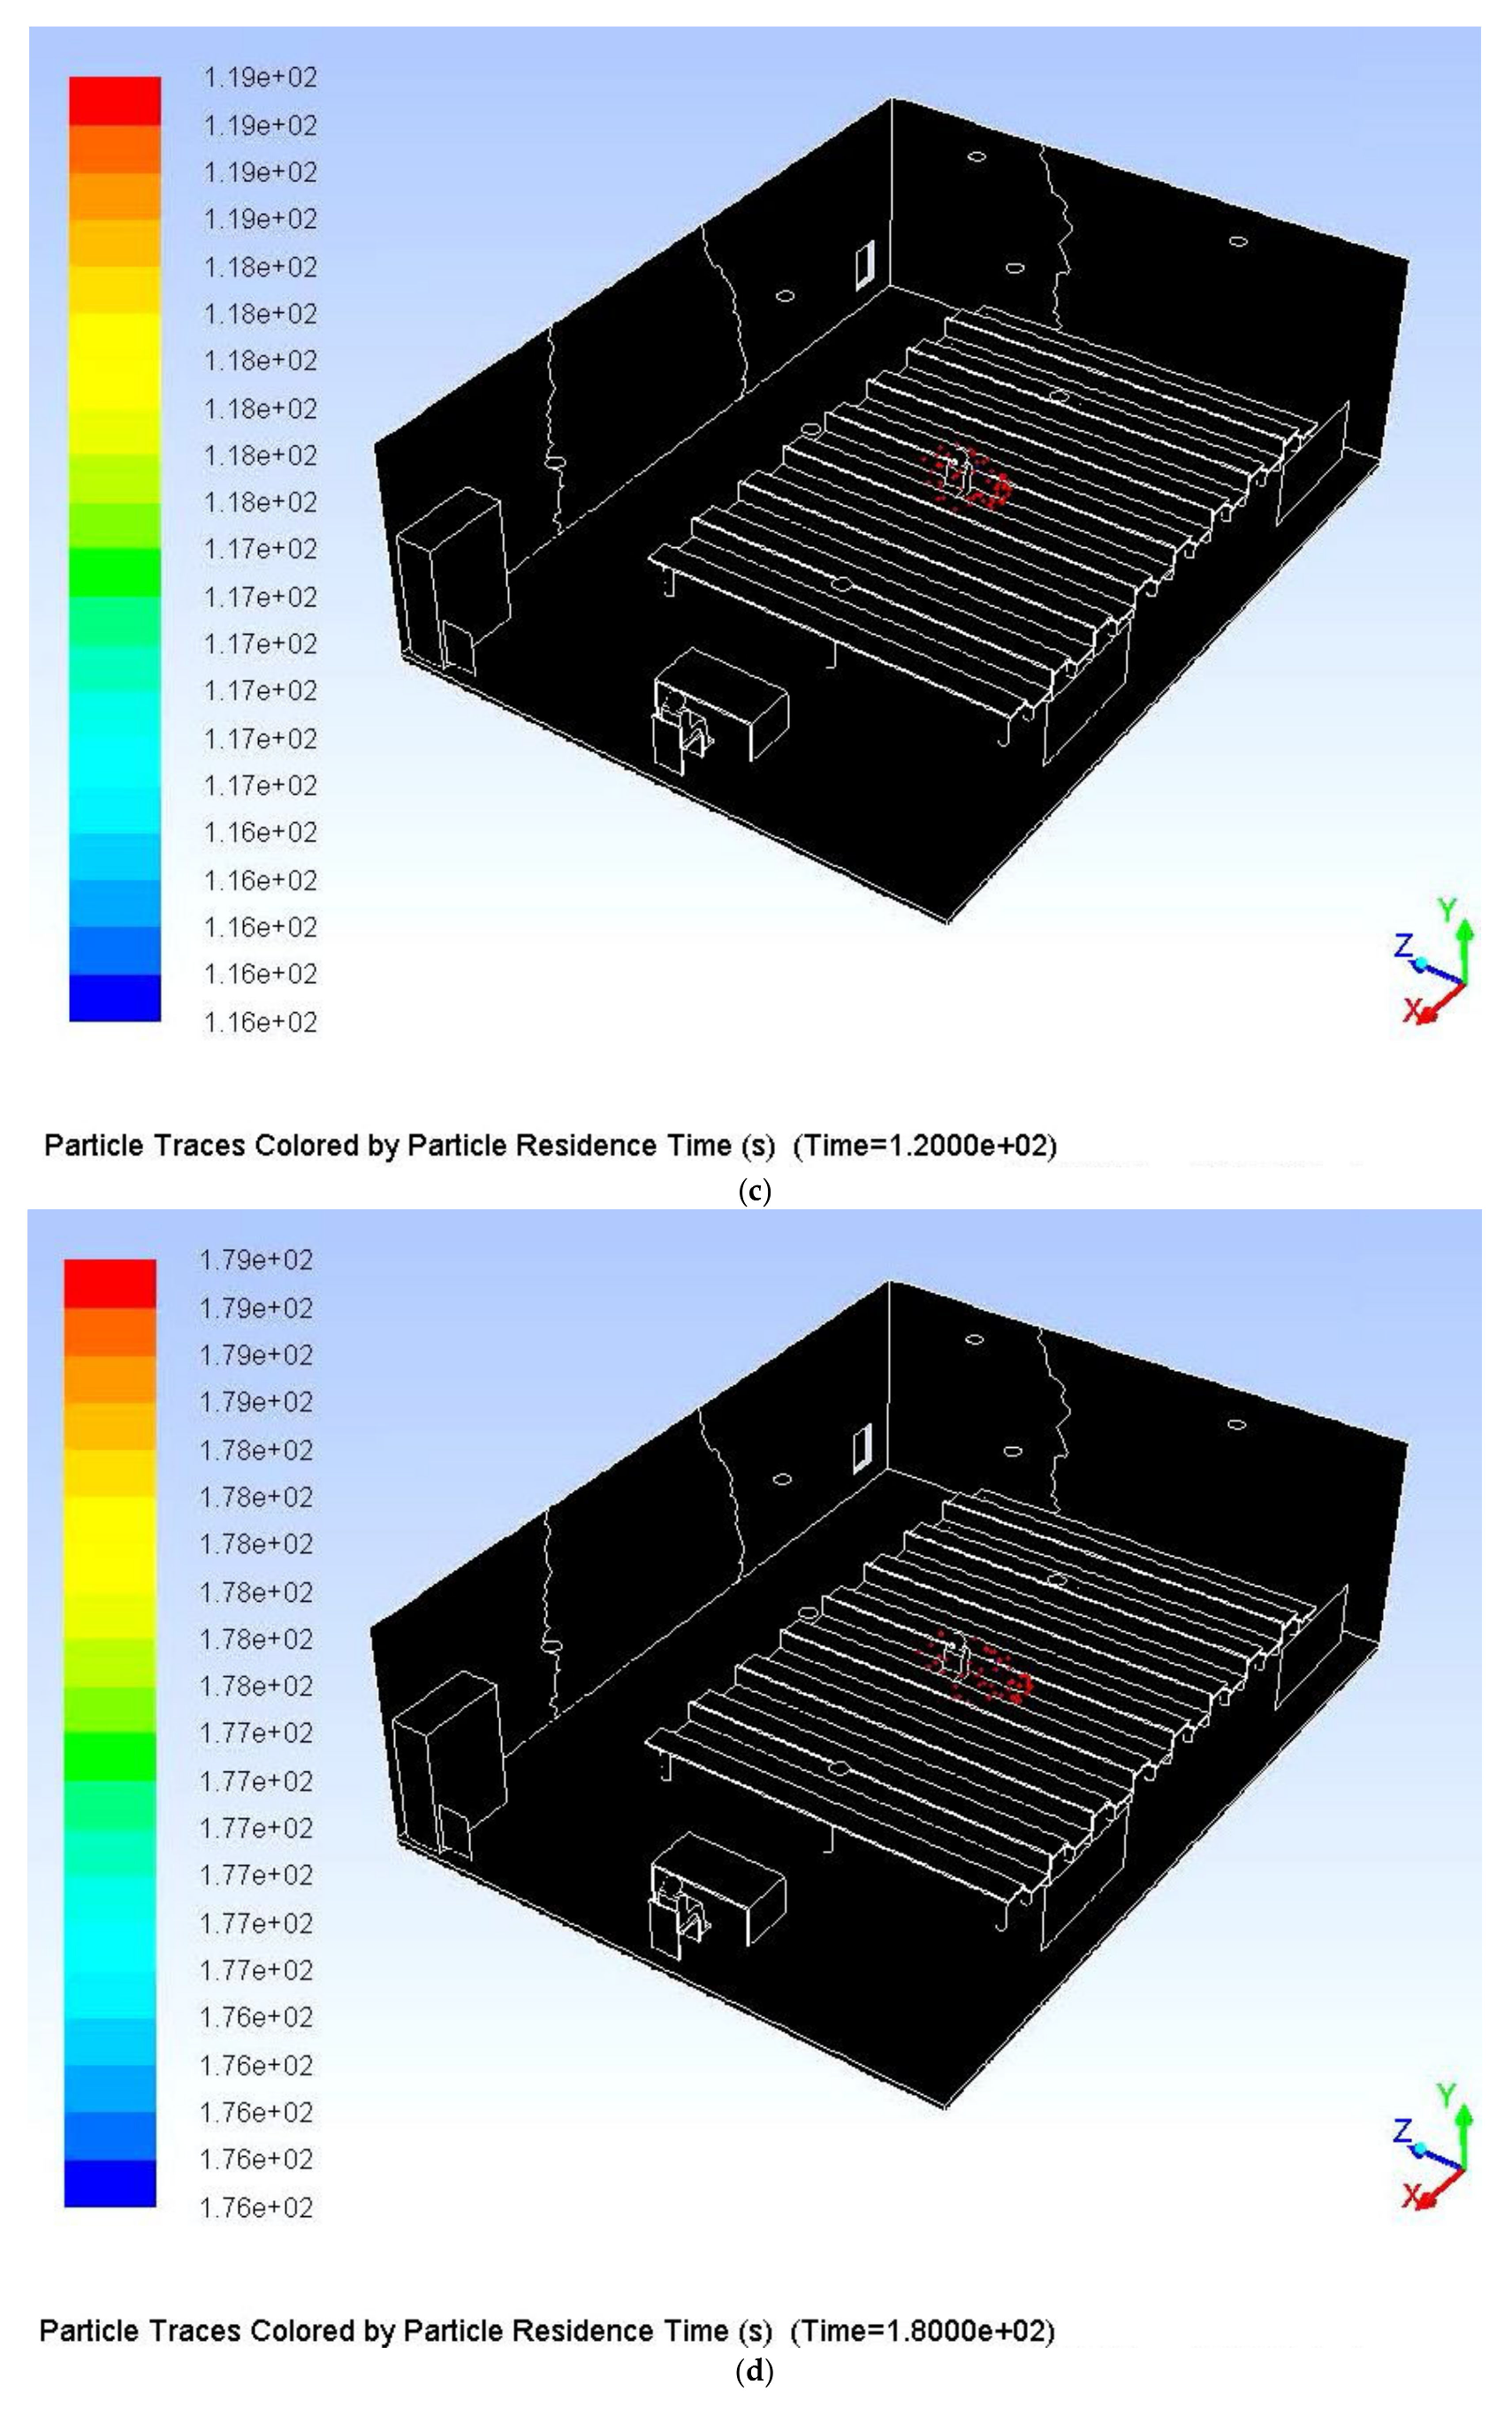
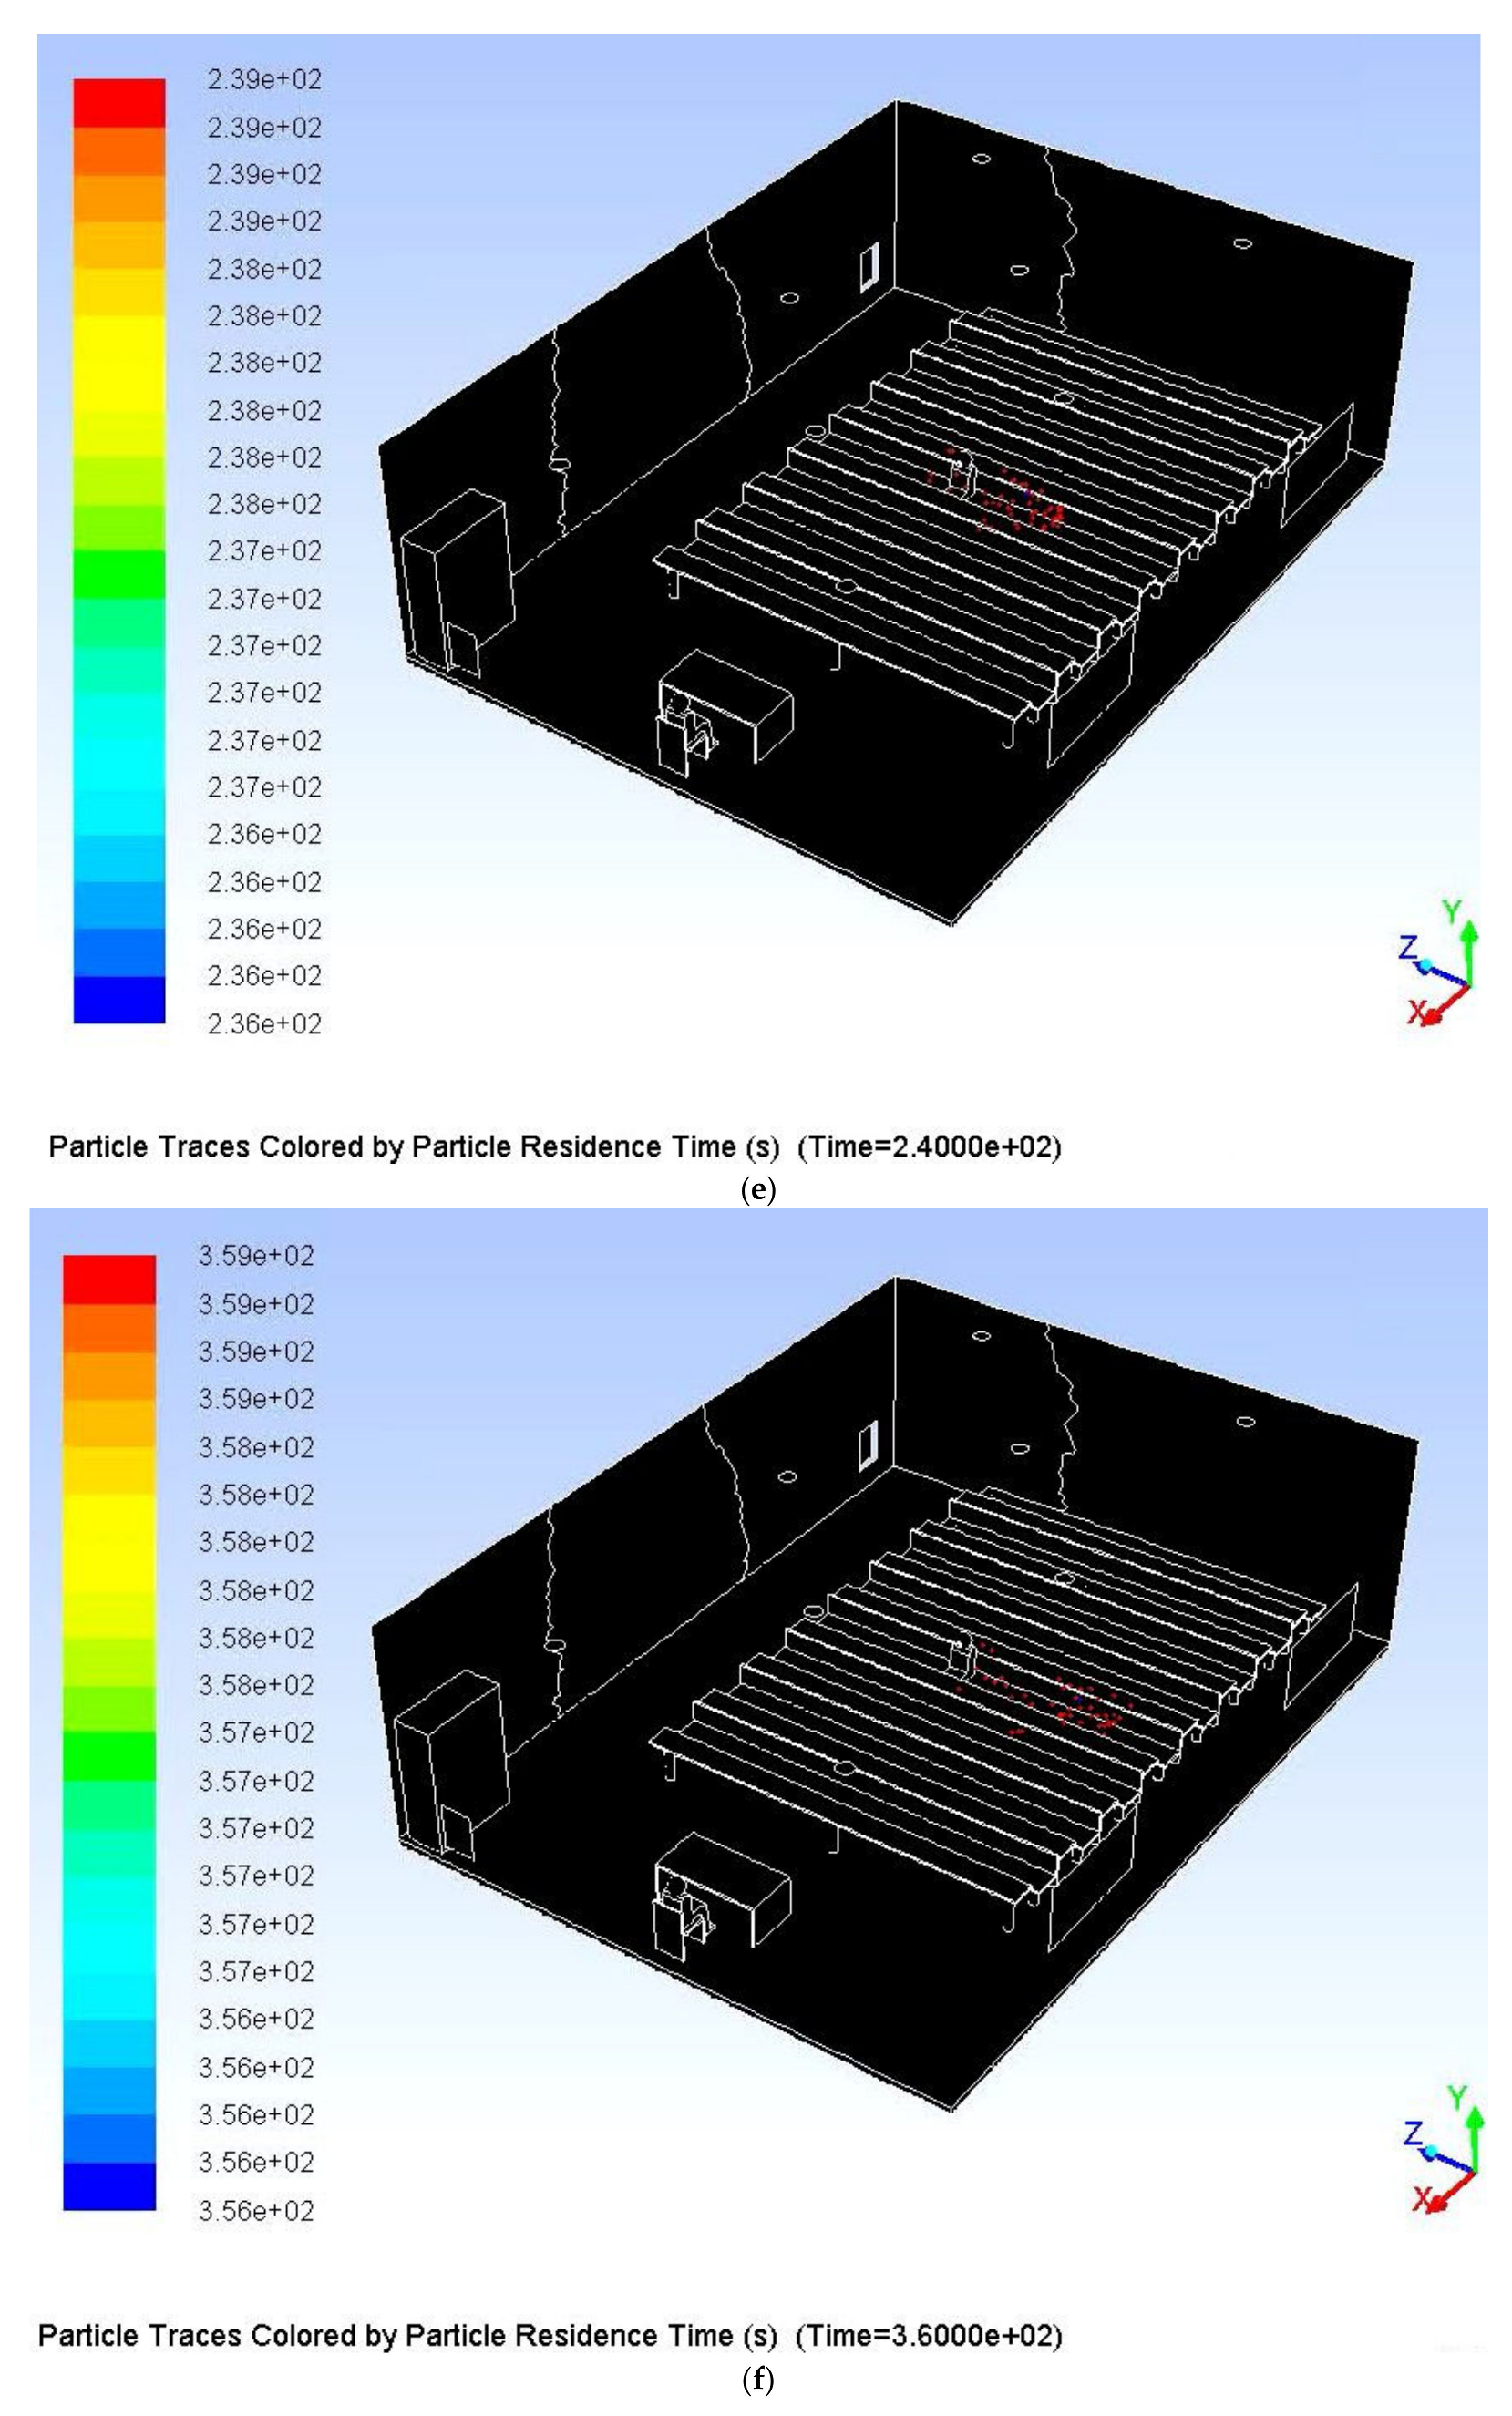
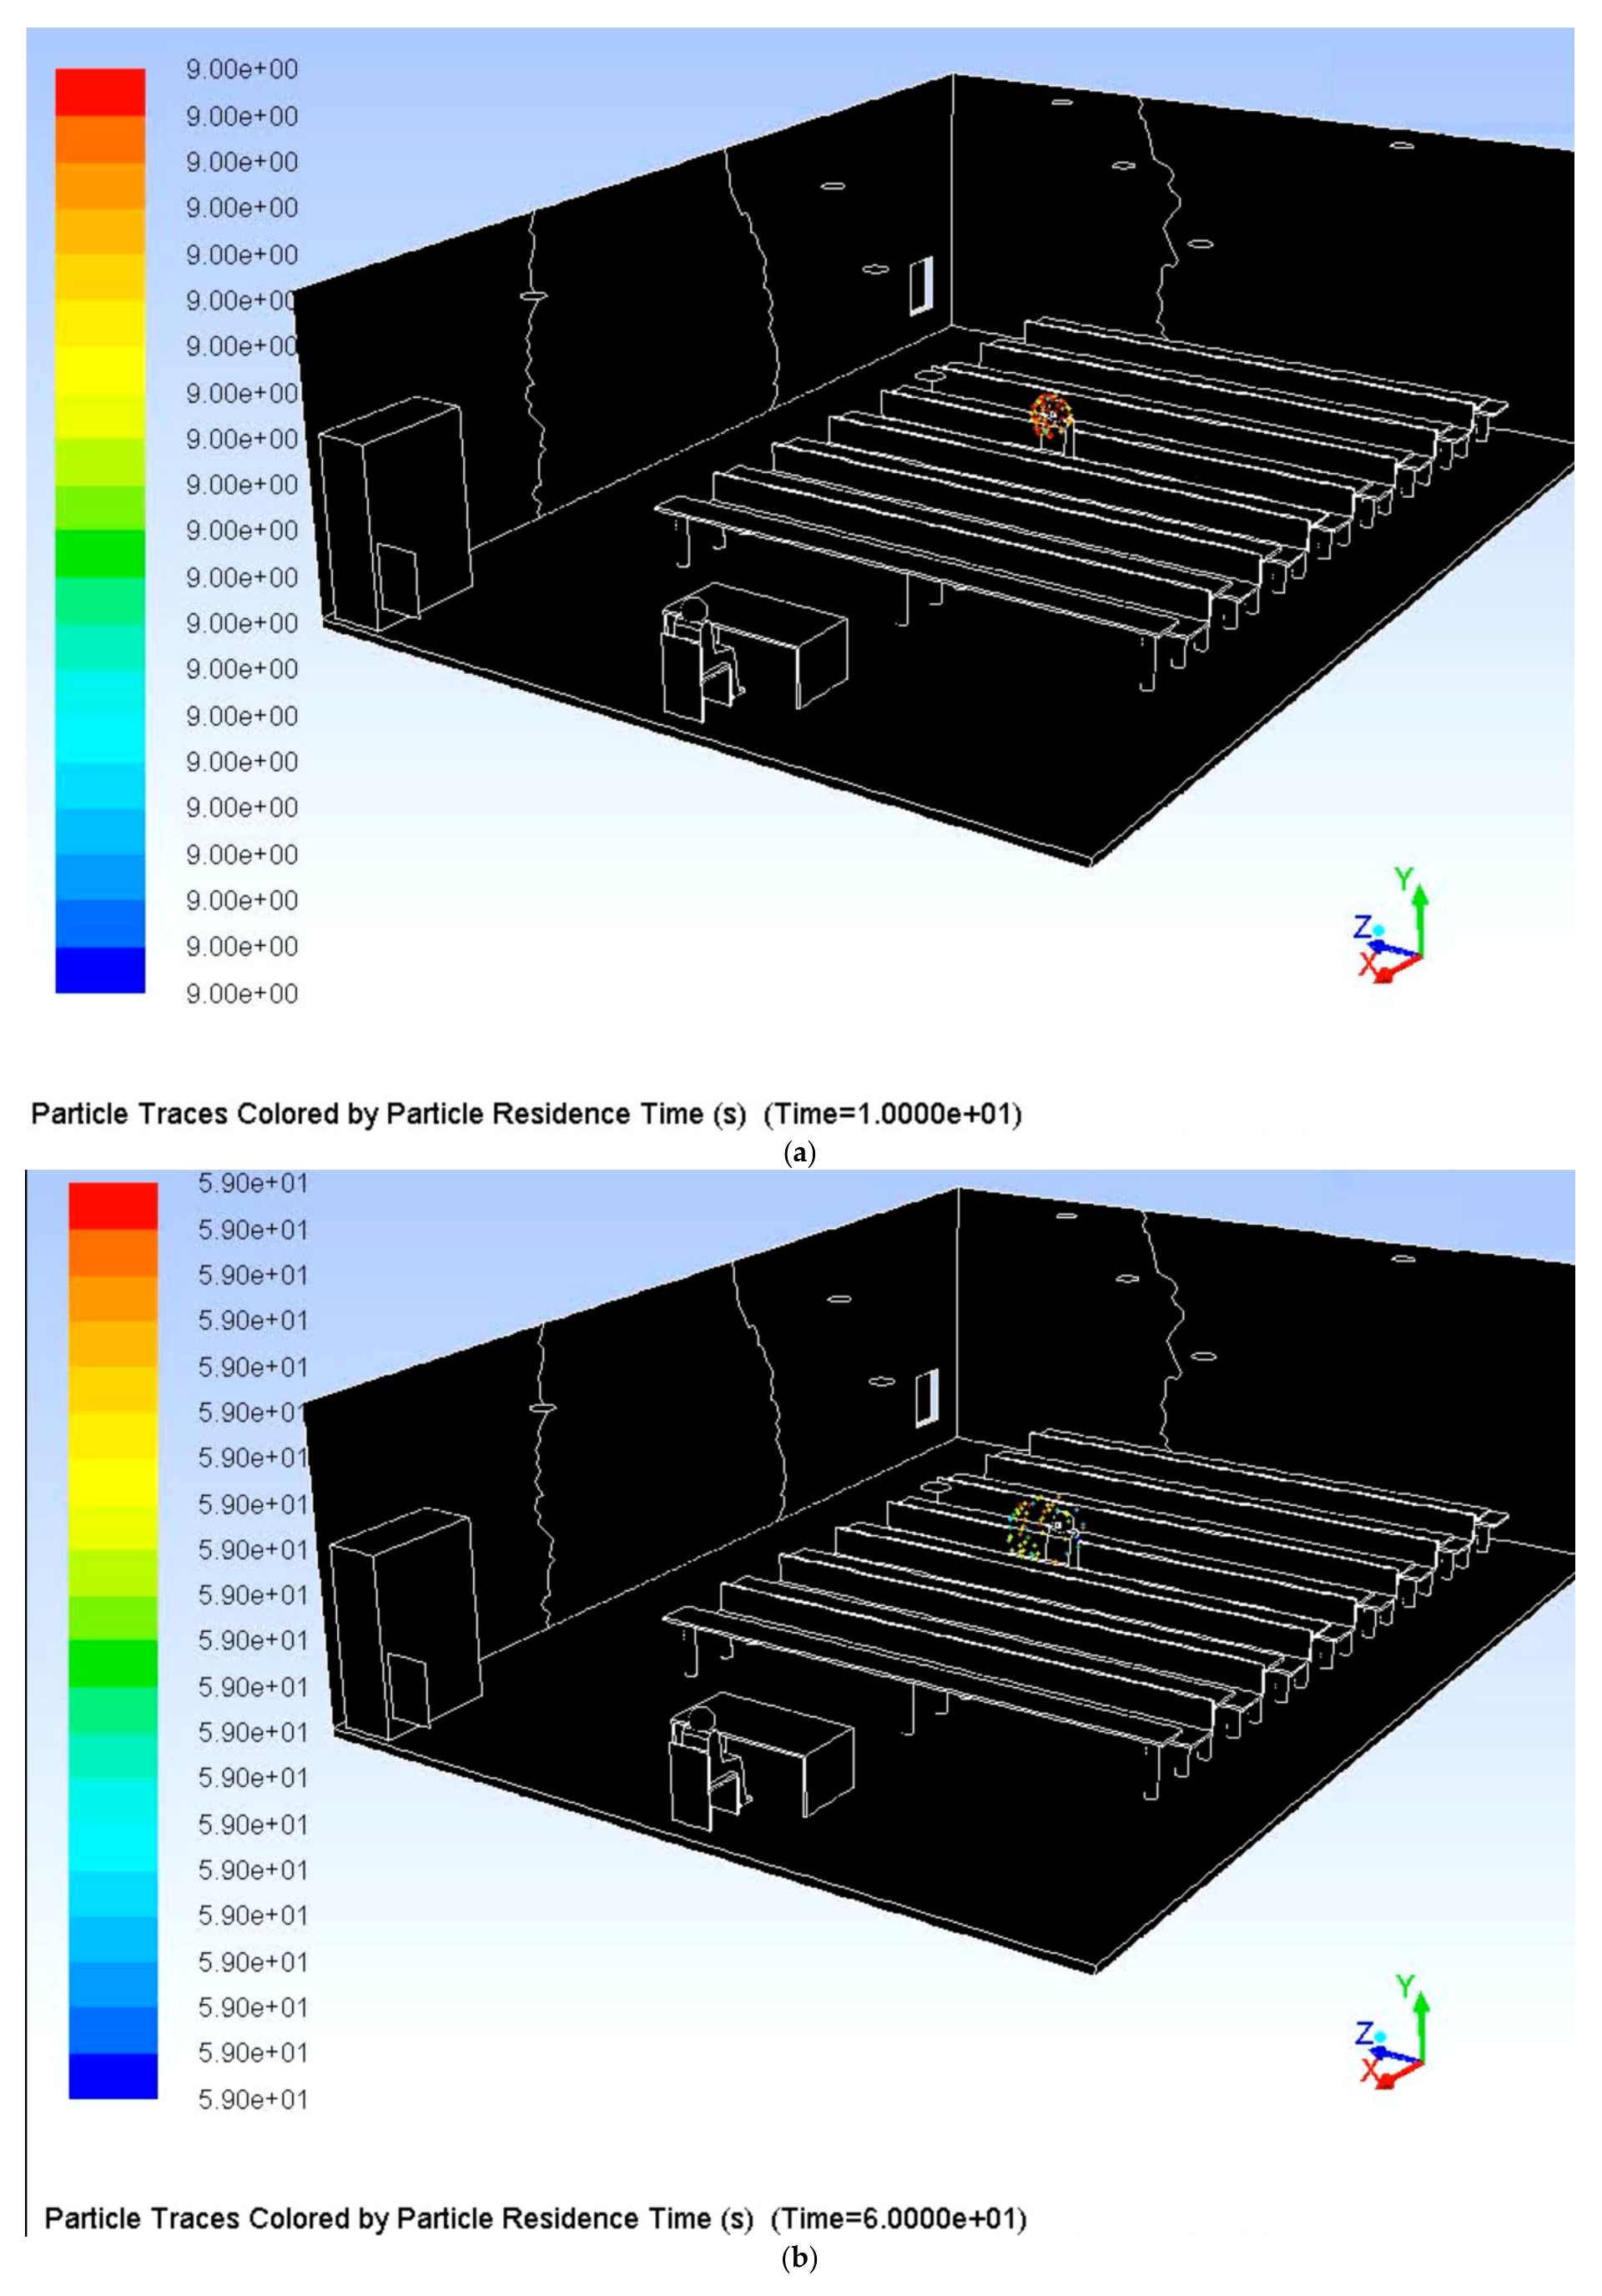
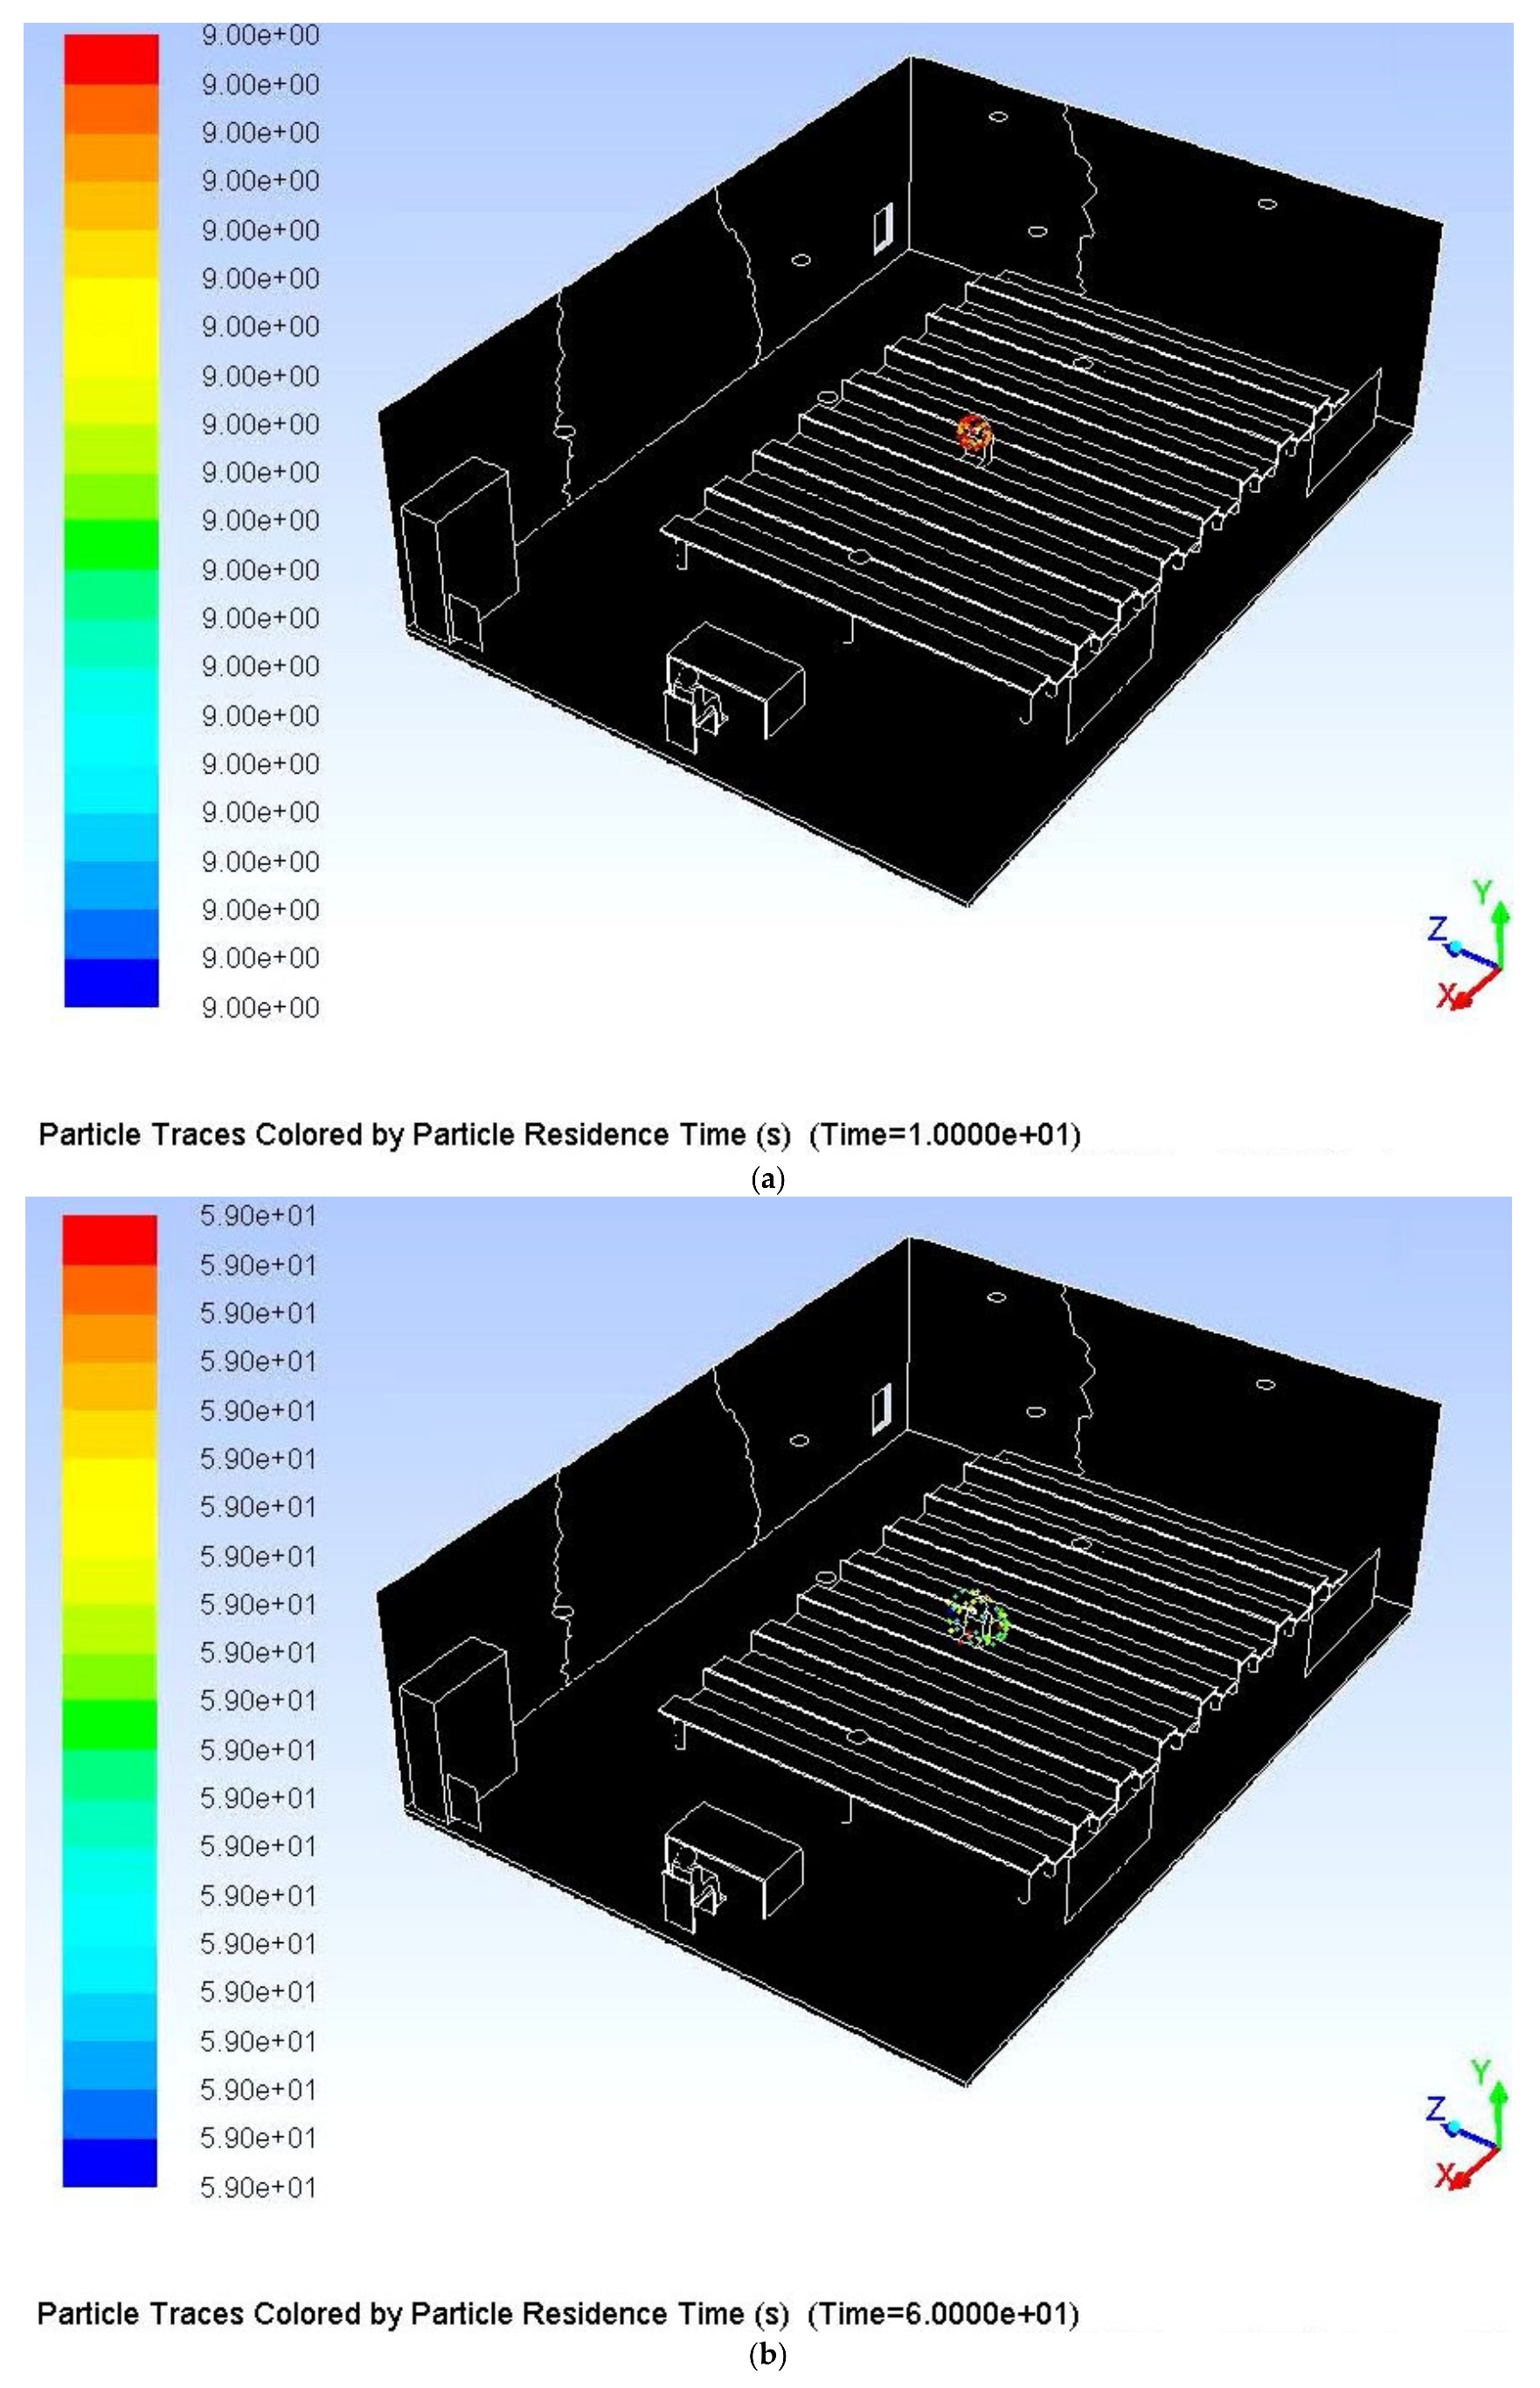
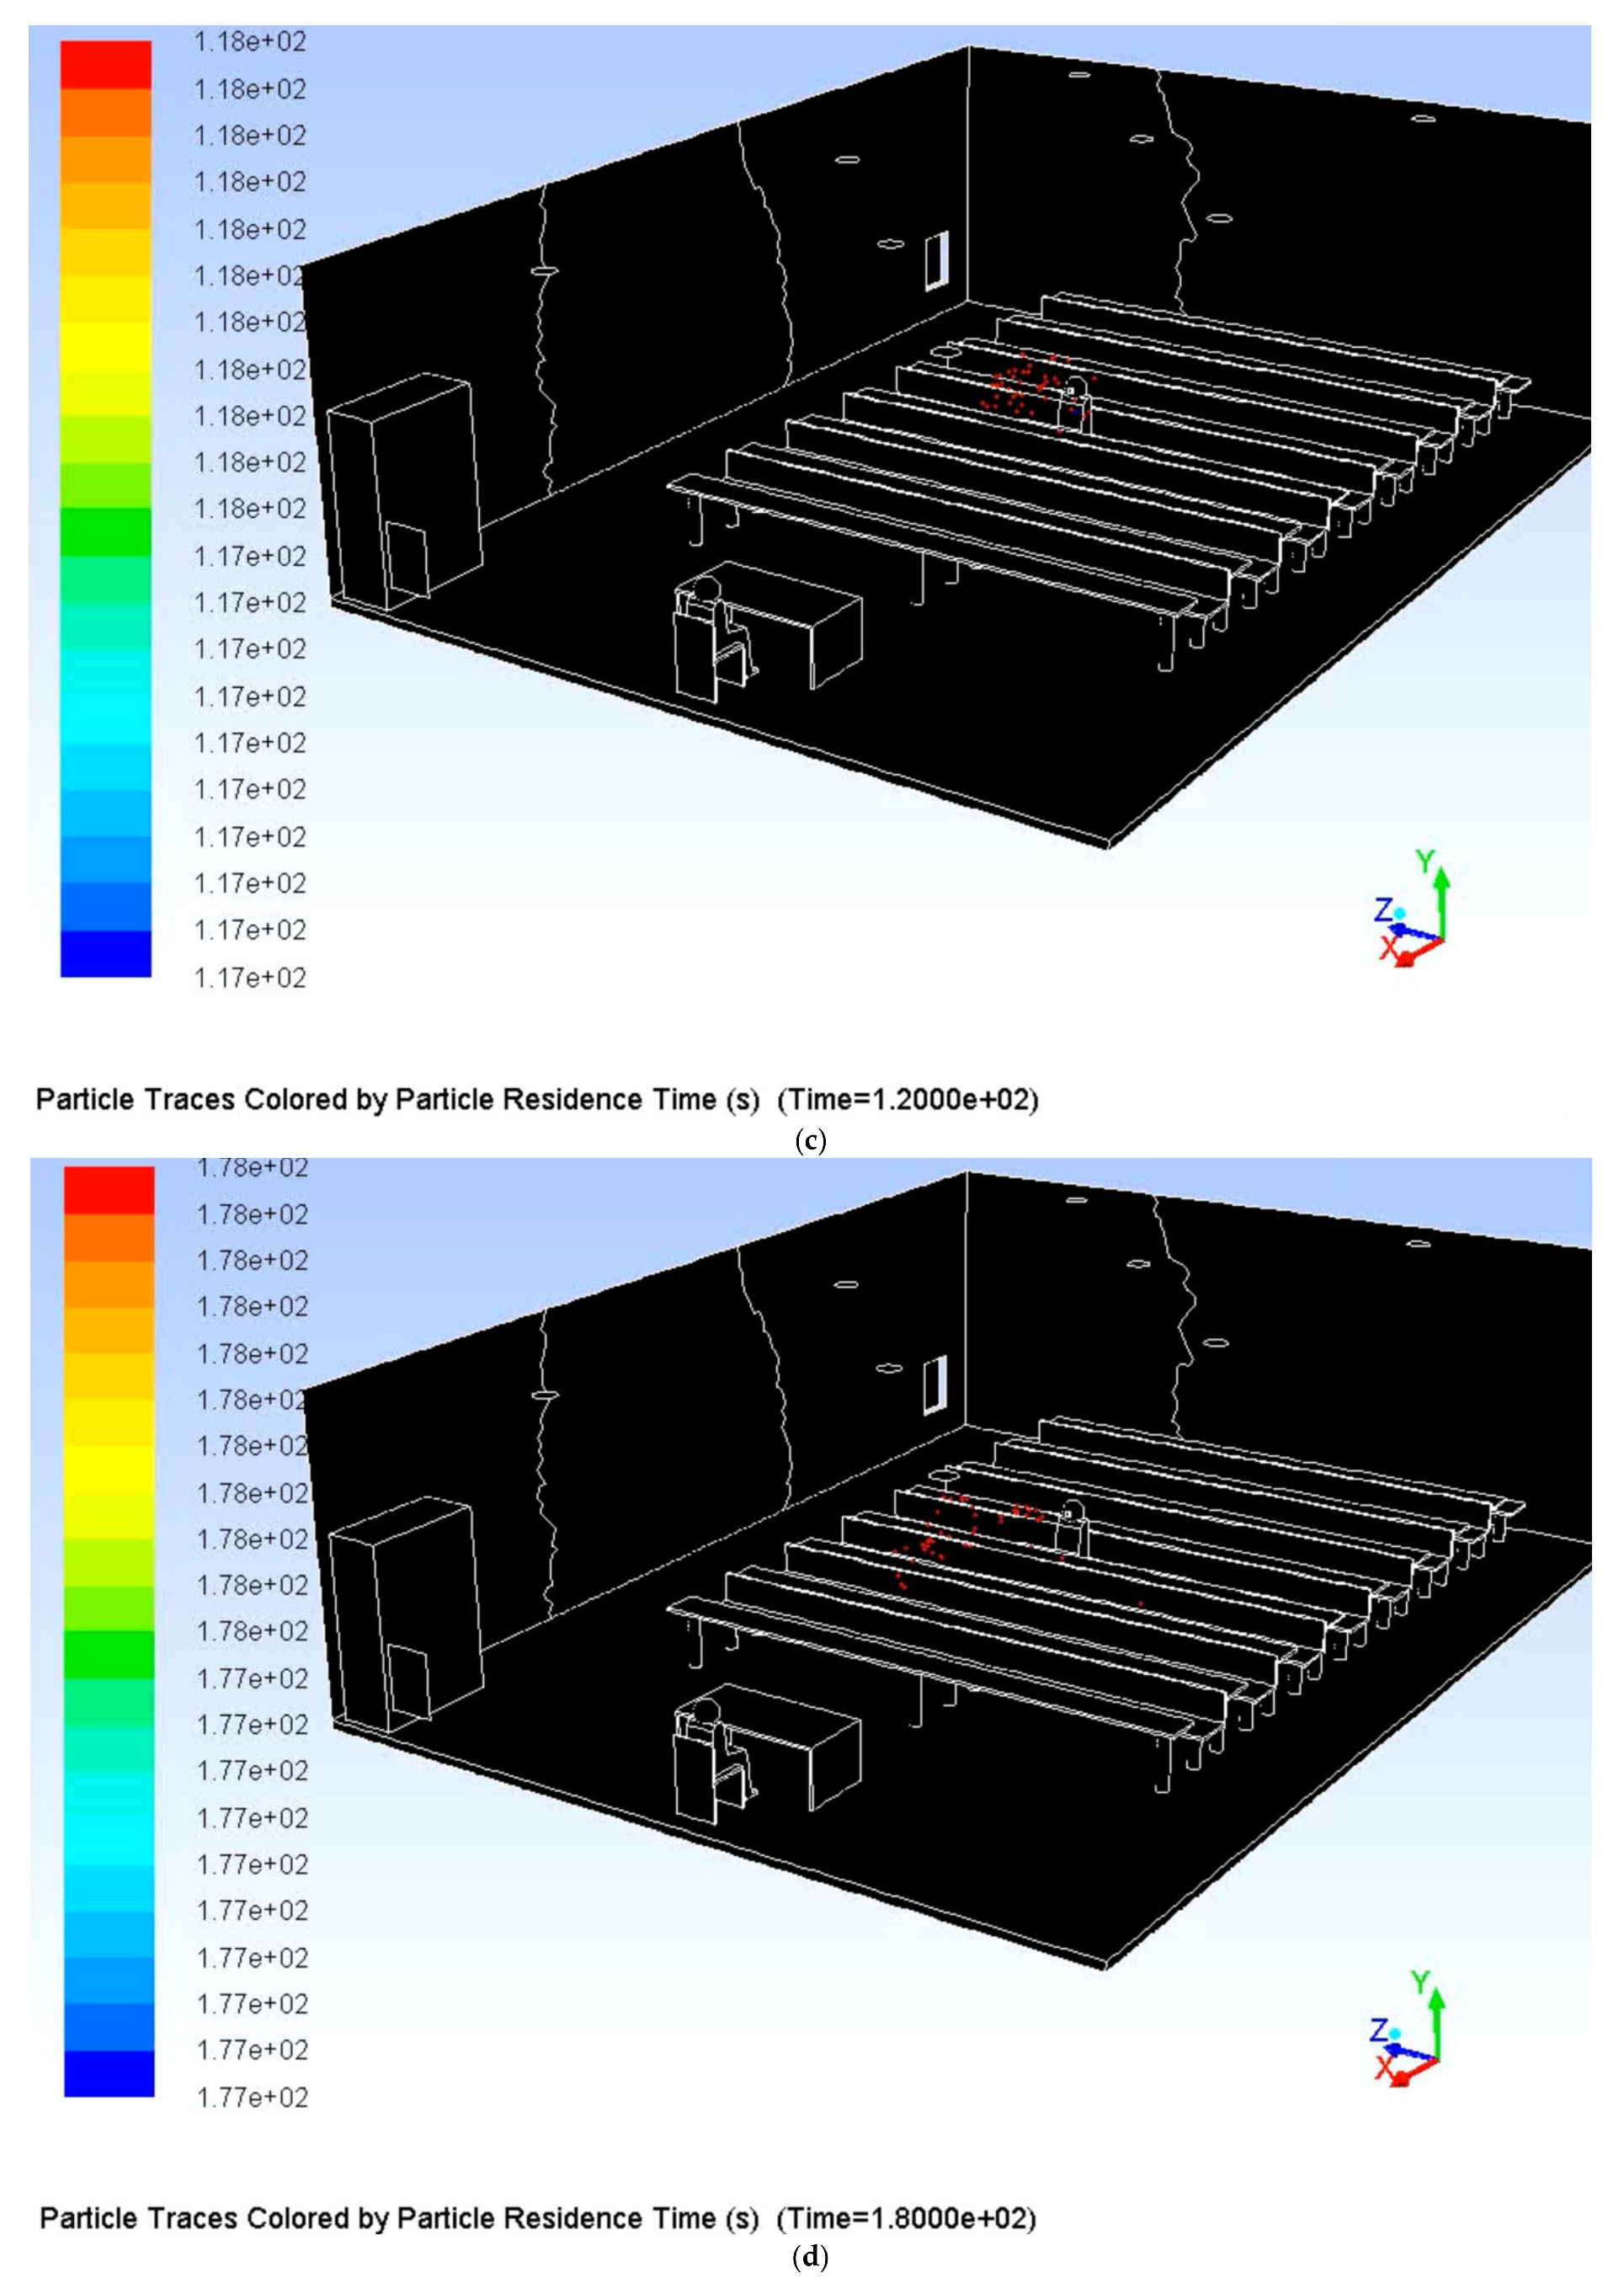
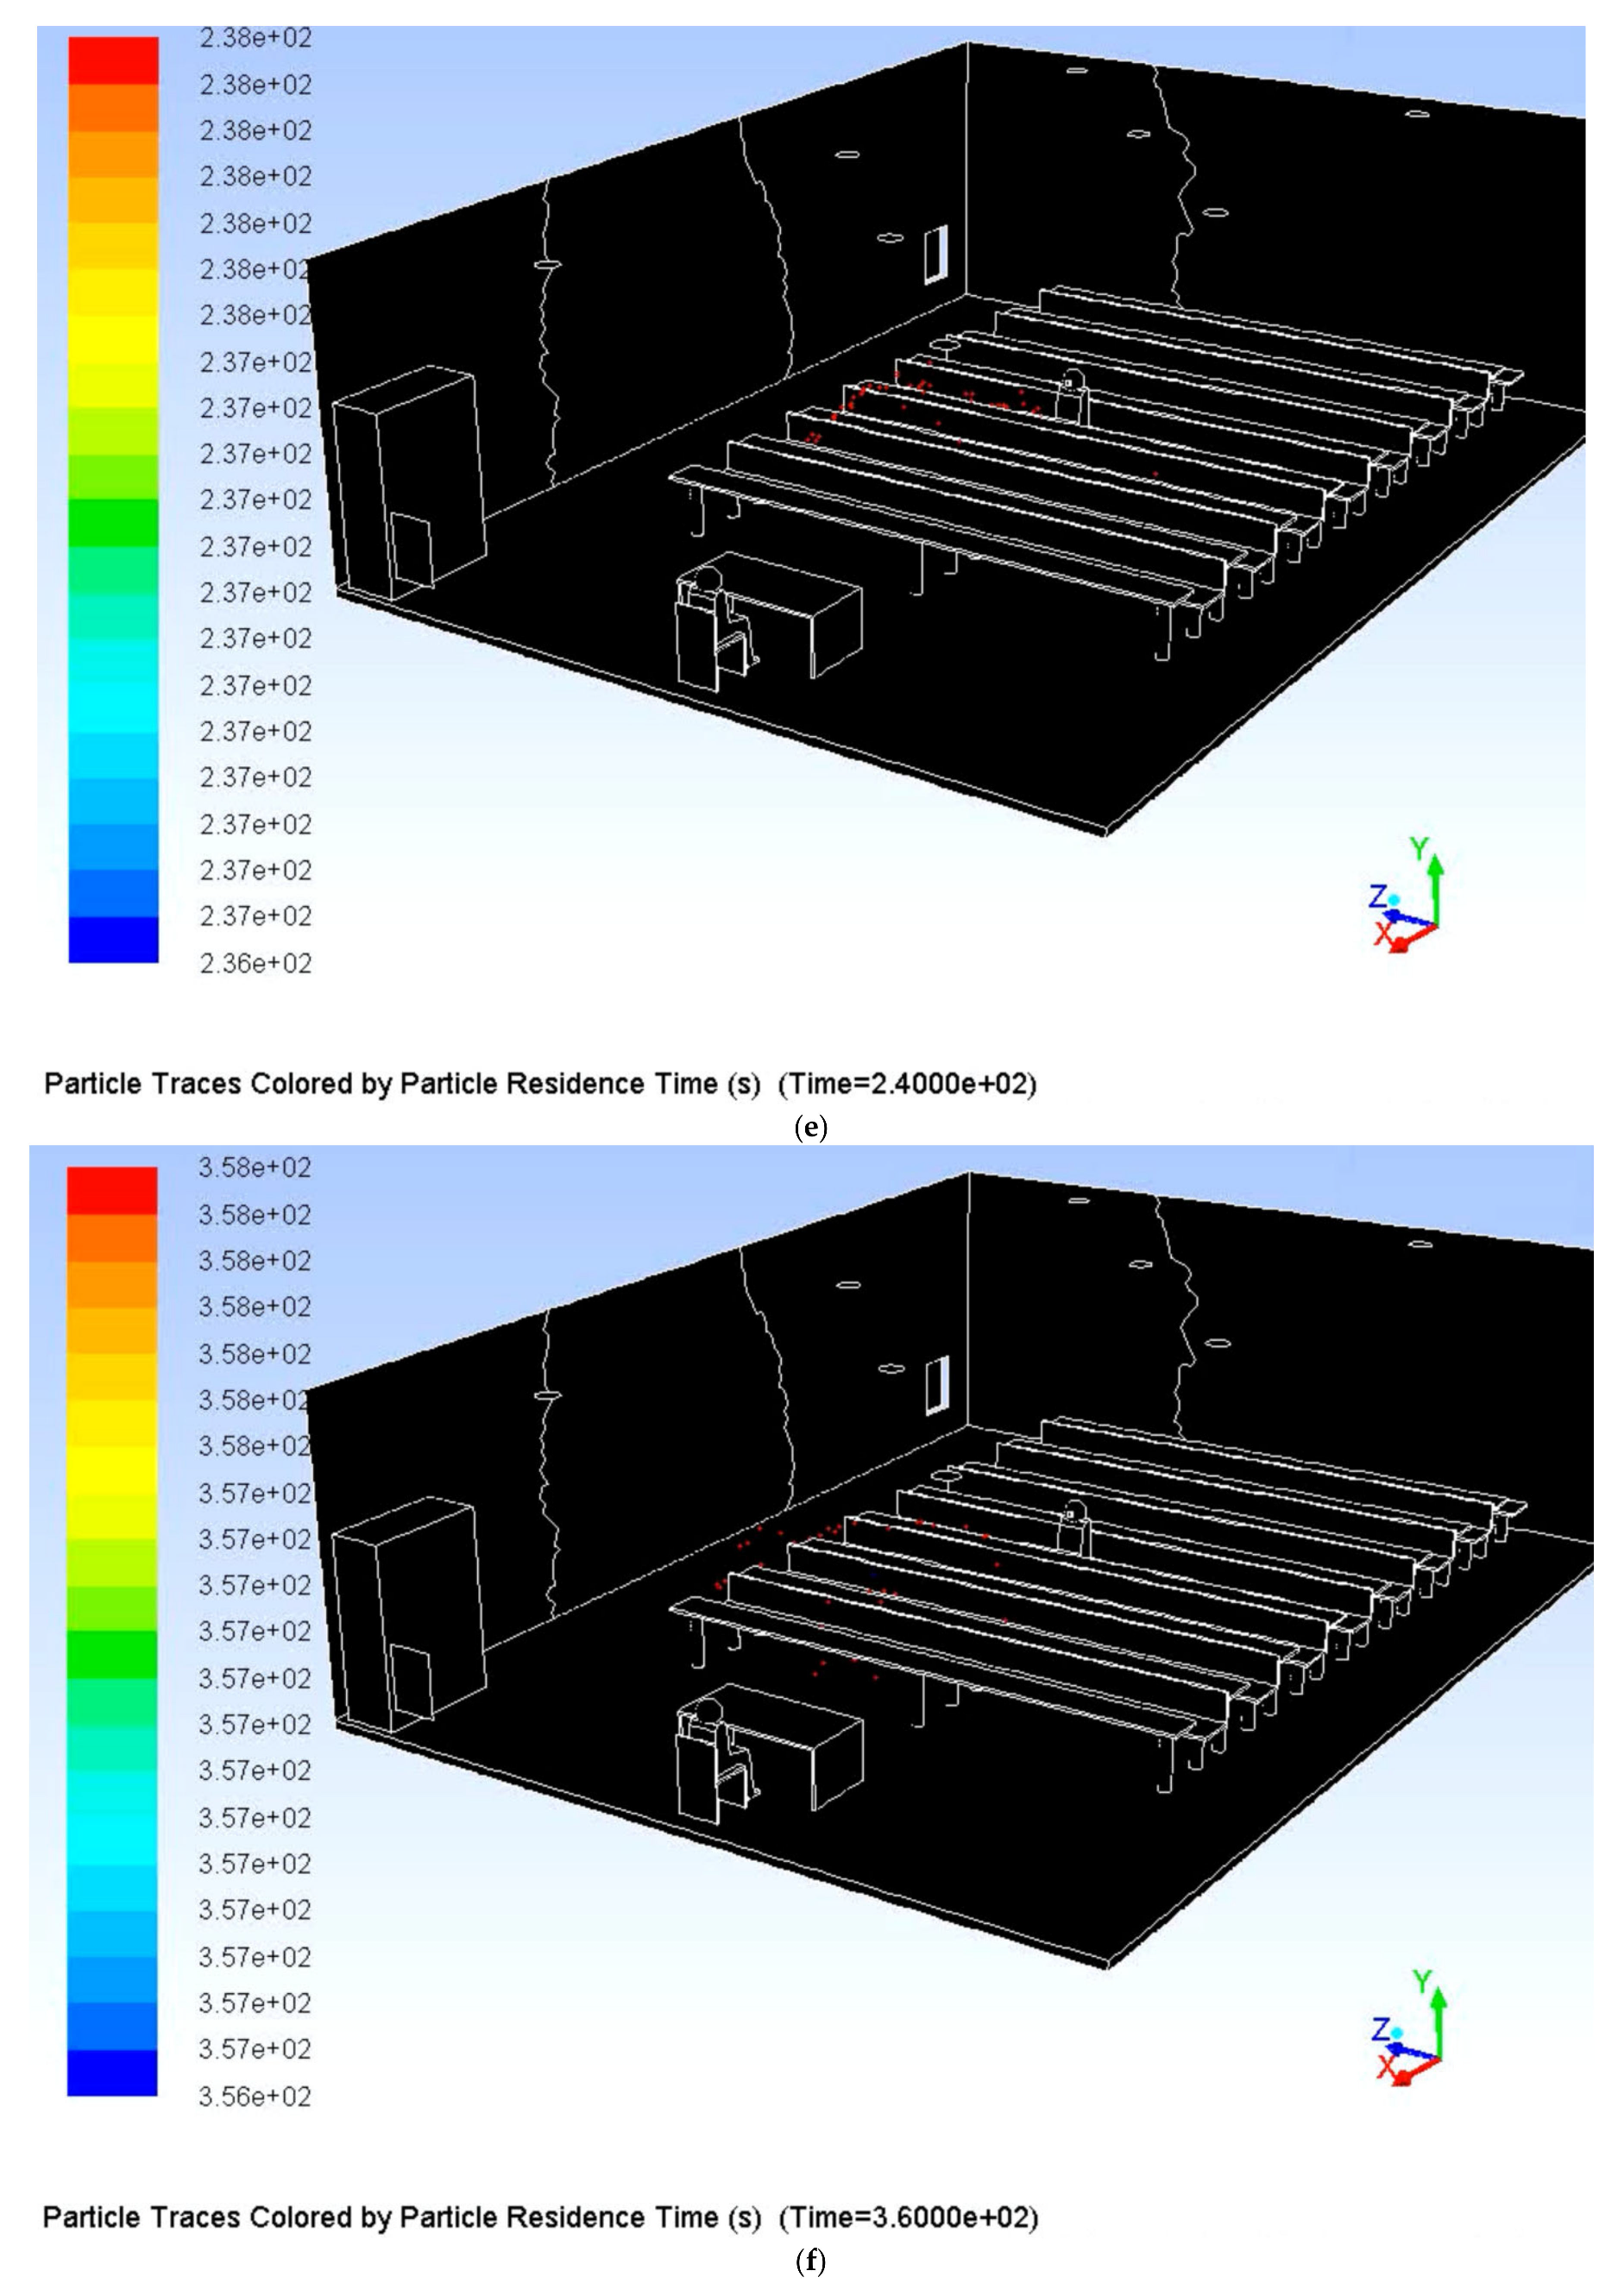
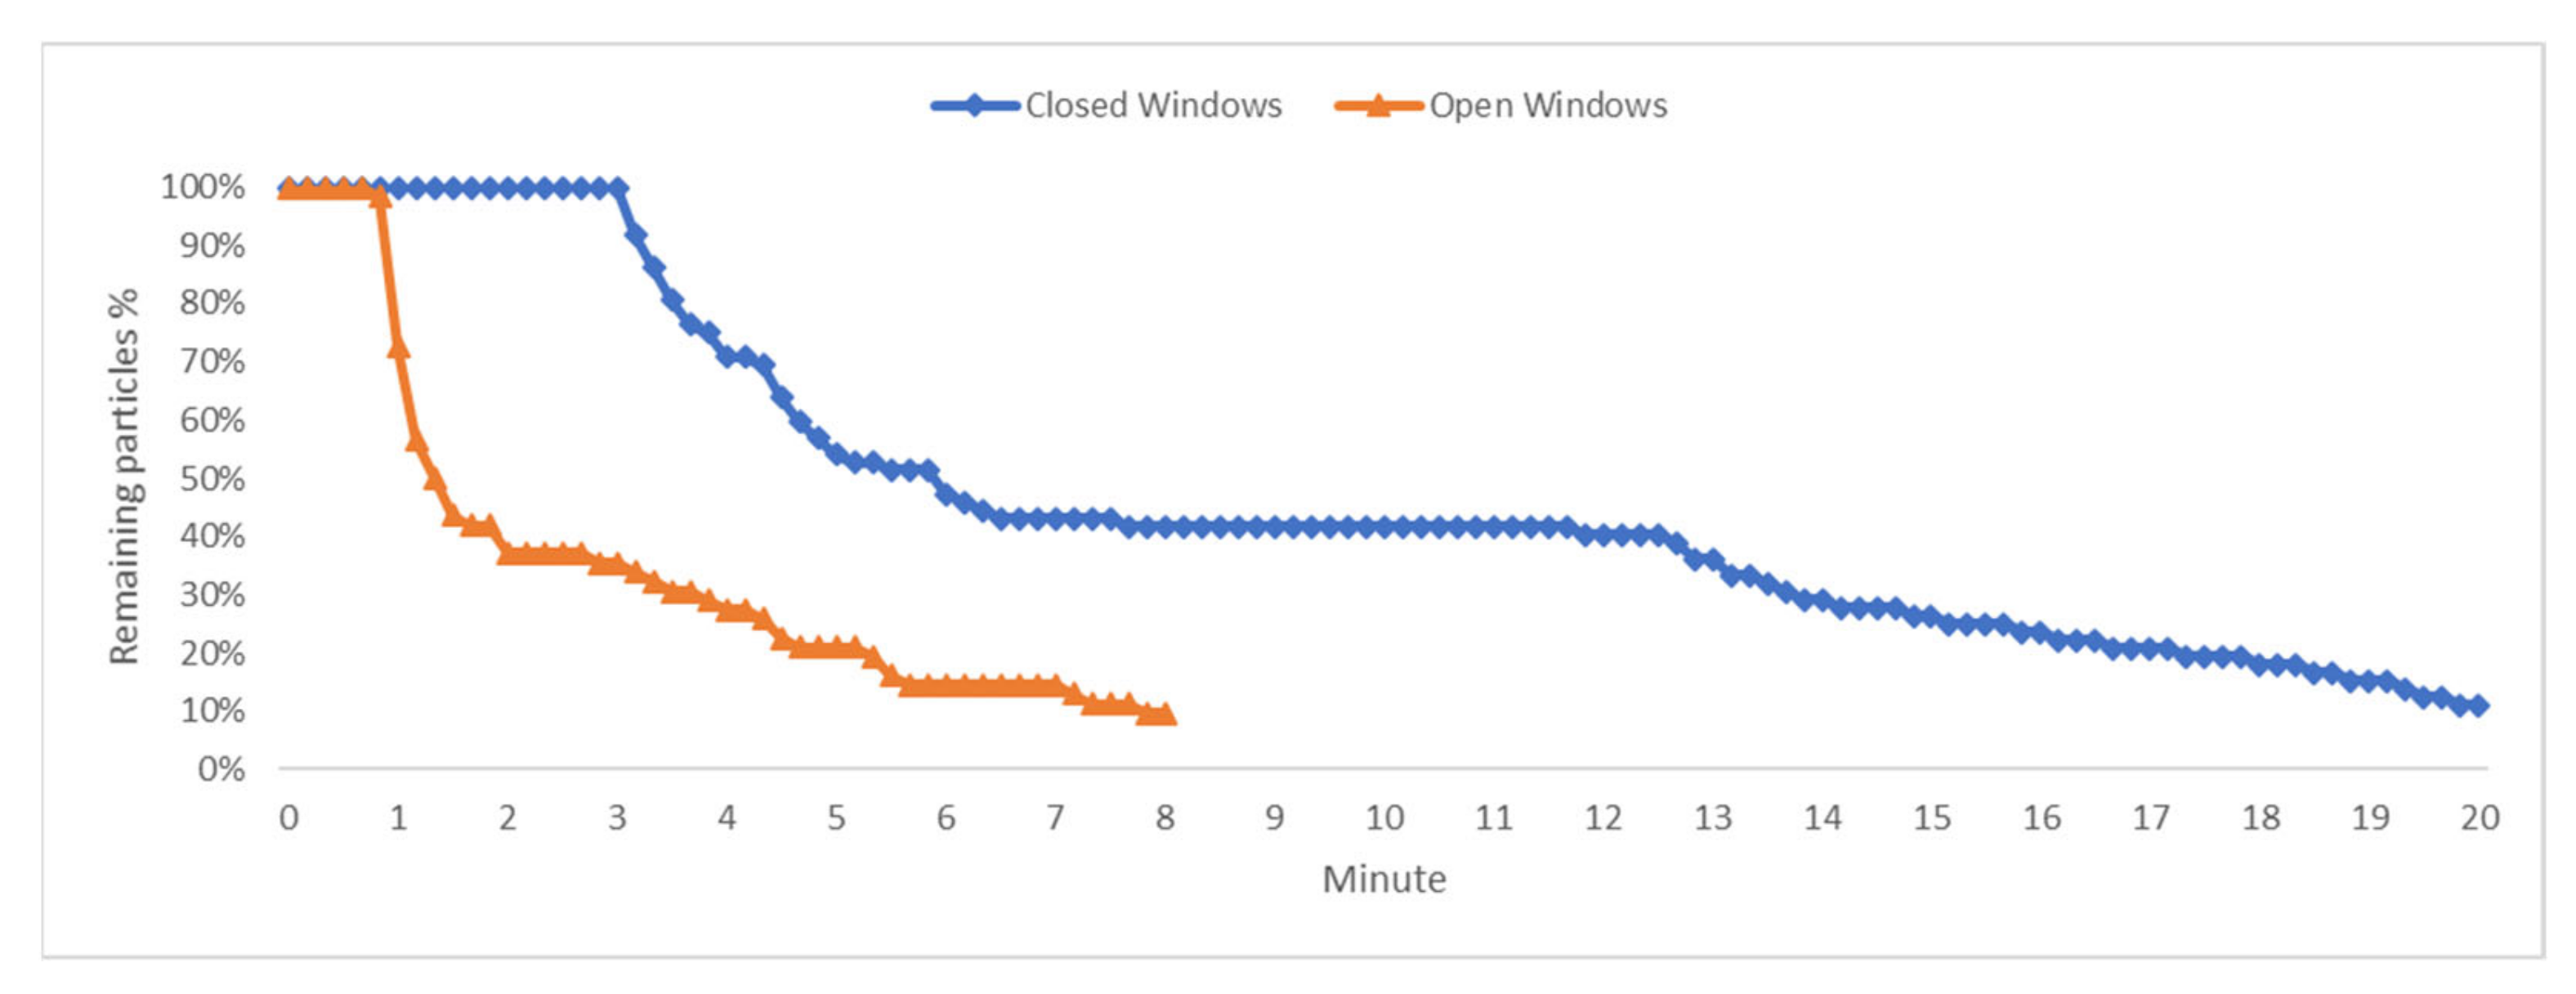
4.1.3. ACH and the Impact of Windows on the Trajectory of Contaminated Aerosols
4.1.4. Recommendations for Future Studies
5. Conclusions
Supplementary Materials
Author Contributions
Funding
Institutional Review Board Statement
Informed Consent Statement
Data Availability Statement
Conflicts of Interest
References
- Liddament, M. A guide to energy efficient ventilation. Phys. Rev. B 1996, 51, 274. [Google Scholar]
- Ramalho, O.; Wyart, G.; Mandin, C.; Blondeau, P.; Cabanes, P.A.; Leclerc, N.; Mullot, J.U.; Boulanger, G.; Redaelli, M. Association of carbon dioxide with indoor air pollutants and exceedance of health guideline values. Build. Environ. 2015. [Google Scholar] [CrossRef]
- Mandin, C.; Trantallidi, M.; Cattaneo, A.; Canha, N.; Mihucz, V.G.; Szigeti, T.; Mabilia, R.; Perreca, E.; Spinazzè, A.; Fossati, S.; et al. Assessment of indoor air quality in office buildings across Europe–The OFFICAIR study. Sci. Total Environ. 2017. [Google Scholar] [CrossRef] [Green Version]
- Arar, S.; Al-Hunaiti, A.; Masad, M.H.; Maragkidou, A.; Wraith, D.; Hussein, T. Elemental contamination in indoor floor dust and its correlation with PAHs, fungi, and gram+/− bacteria. Int. J. Environ. Res. Public Health 2019, 16, 3552. [Google Scholar] [CrossRef] [PubMed] [Green Version]
- Hsu, C.N.; Tsai, Y.L. Experimental measurement and computational simulation analysis of indoor air quality in office-integration of voltage adsorption dust collection device and energy recovery ventilator. Sens. Mater. 2020. [Google Scholar] [CrossRef]
- Dimitroulopoulou, C. Ventilation in European dwellings: A review. Build. Environ. 2012, 47, 109–125. [Google Scholar] [CrossRef]
- Hou, J.; Sun, Y.; Dai, X.; Liu, J.; Shen, X.; Tan, H.; Yin, H.; Huang, K.; Gao, Y.; Lai, D.; et al. Associations of indoor carbon dioxide concentrations, air temperature, and humidity with perceived air quality and sick building syndrome symptoms in Chinese homes. Indoor Air 2021. [Google Scholar] [CrossRef]
- Warner, J.A.; Frederick, J.M.; Bryant, T.N.; Weich, C.; Raw, G.J.; Hunter, C.; Stephen, F.R.; McIntyre, D.A.; Warner, J.O. Mechanical ventilation and high-efficiency vacuum cleaning: A combined strategy of mite and mite allergen reduction in the control of mite-sensitive asthma. J. Allergy Clin. Immunol. 2000, 105, 75–82. [Google Scholar] [CrossRef]
- Sundell, J. On the Association Between Building Ventilation Characteristics, some Indoor Environmental Exposures, some Allergic Manifestations and Subjective Symptom Reports. Indoor Air 1994, 4, 7–49. [Google Scholar] [CrossRef]
- Sun, Y.; Hou, J.; Cheng, R.; Sheng, Y.; Zhang, X.; Sundell, J. Indoor air quality, ventilation and their associations with sick building syndrome in Chinese homes. Energy Build. 2019, 197, 112–119. [Google Scholar] [CrossRef]
- Pamonpol, K.; Areerob, T.; Prueksakorn, K. Indoor air quality improvement by simple ventilated practice and sansevieria trifasciata. Atmosphere 2020, 11, 271. [Google Scholar] [CrossRef] [Green Version]
- Wallace, L.A.; Emmerich, S.J.; Howard-Reed, C. Continuous measurements of air change rates in an occupied house for 1 year: The effect of temperature, wind, fans, and windows. J. Expo. Anal. Environ. Epidemiol. 2002. [Google Scholar] [CrossRef] [Green Version]
- Wargocki, P.; Sundell, J.; Bischof, W.; Brundrett, G.; Fanger, P.O.; Gyntelberg, F.; Hanssen, S.O.; Harrison, P.; Pickering, A.; Seppänen, O.; et al. Ventilation and health in non-industrial indoor environments: Report from a European Multidisciplinary Scientific Consensus Meeting (EUROVEN). Indoor Air 2002, 12, 113–128. [Google Scholar] [CrossRef] [PubMed]
- Seppänen, O.A. Association of ventilation rates and CO2 concentrations with health and other responses in commercial and institutional buildings. Indoor Air 1999, 9, 226–252. [Google Scholar] [CrossRef]
- Rosenvald, N. Coronavirus cases. Available online: https://www.worldometers.info/coronavirus/ (accessed on 20 April 2021).
- Wikipedia Template: COVID-19 Pandemic Data. Available online: https://en.wikipedia.org/wiki/COVID-19_pandemic (accessed on 20 April 2021).
- Pirouz, B.; Arcuri, N.; Pirouz, B.; Palermo, S.A.; Turco, M.; Maiolo, M. Development of an assessment method for evaluation of sustainable factories. Sustainability 2020, 12, 1841. [Google Scholar] [CrossRef] [Green Version]
- Pirouz, B.; Palermo, S.A.; Maiolo, M.; Arcuri, N.; Piro, P. Decreasing water footprint of electricity and heat by extensive green roofs: Case of southern italy. Sustainability 2020, 12, 178. [Google Scholar] [CrossRef]
- Turco, M.; Brunetti, G.; Palermo, S.A.; Capano, G.; Grossi, G.; Maiolo, M.; Piro, P. On the environmental benefits of a permeable pavement: Metals potential removal efficiency and Life Cycle Assessment. Urban. Water J. 2020, 1–9. [Google Scholar] [CrossRef]
- United Nations The Sustainable Development Goals Report; United Nations Department of Economic and Social Affairs: New York, NY, USA, 2017. [CrossRef] [Green Version]
- Pirouz, B.; Arcuri, N.; Maiolo, M.; Talarico, V.C.; Piro, P. A new multi-objective dynamic model to close the gaps in sustainable development of industrial sector. In Proceedings of the IOP Conference Series: Earth and Environmental Science, Thessaloniki, Greece, 23–25 October 2019. [Google Scholar]
- Palermo, S.A.; Talarico, V.C.; Turco, M. On the LID systems effectiveness for urban stormwater management: Case study in Southern Italy. IOP Conf. Ser. Earth Environ. Sci. 2020, 410. [Google Scholar] [CrossRef]
- Mazzeo, D.; Matera, N.; De Luca, P.; Baglivo, C.; Maria Congedo, P.; Oliveti, G. Worldwide geographical mapping and optimization of stand-alone and grid-connected hybrid renewable system techno-economic performance across Köppen-Geiger climates. Appl. Energy 2020. [Google Scholar] [CrossRef]
- Mazzeo, D.; Kontoleon, K.J. The role of inclination and orientation of different building roof typologies on indoor and outdoor environment thermal comfort in Italy and Greece. Sustain. Cities Soc. 2020. [Google Scholar] [CrossRef]
- Baglivo, C.; Mazzeo, D.; Panico, S.; Bonuso, S.; Matera, N.; Congedo, P.M.; Oliveti, G. Complete greenhouse dynamic simulation tool to assess the crop thermal well-being and energy needs. Appl. Therm. Eng. 2020. [Google Scholar] [CrossRef]
- Kameel, R.; El-Din Khalil, E. Thermal comfort vs air quality in air-conditioned healthcare applications. In Proceedings of the 36th AIAA Thermophysics Conference, Orlando, FL, USA, 23–26 June 2003. [Google Scholar]
- Pirouz, B.; Maiolo, M. The role of power consumption and type of air conditioner in direct and indirect water consumption. J. Sustain. Dev. Energy Water Environ. Syst. 2018. [Google Scholar] [CrossRef] [Green Version]
- Lu, J.; Gu, J.; Gu, J.; Li, K.; Xu, C.; Su, W.; Lai, Z.; Zhou, D.; Yu, C.; Xu, B.; et al. COVID-19 Outbreak Associated with Air Conditioning in Restaurant, Guangzhou, China, 2020. Emerg. Infect. Dis. 2020. [Google Scholar] [CrossRef]
- Haghshenas, S.S.; Pirouz, B.; Haghshenas, S.S.; Pirouz, B.; Piro, P.; Na, K.S.; Cho, S.E.; Geem, Z.W. Prioritizing and analyzing the role of climate and urban parameters in the confirmed cases of COVID-19 based on artificial intelligence applications. Int. J. Environ. Res. Public Health 2020, 17, 3730. [Google Scholar] [CrossRef] [PubMed]
- Pirouz, B.; Haghshenas, S.S.; Haghshenas, S.S.; Piro, P. Investigating a serious challenge in the sustainable development process: Analysis of confirmed cases of COVID-19 (new type of Coronavirus) through a binary classification using artificial intelligence and regression analysis. Sustainability 2020, 17, 2427. [Google Scholar] [CrossRef] [Green Version]
- Pirouz, B.; Nejad, H.J.; Violini, G.; Pirouz, B. The role of artificial intelligence, MLR and statistical analysis in investigations about the correlation of swab tests and stress on health care systems by COVID-19. Information 2020, 11, 454. [Google Scholar] [CrossRef]
- Pirouz, B.; Haghshenas, S.S.; Pirouz, B.; Haghshenas, S.S.; Piro, P. Development of an assessment method for investigating the impact of climate and urban parameters in confirmed cases of COVID-19: A new challenge in sustainable development. Int. J. Environ. Res. Public Health 2020, 17, 2801. [Google Scholar] [CrossRef] [Green Version]
- Stewart, E.J.; Schoen, L.J.; Mead, K.; Sekhar, C.; Olmsted, R.N.; Vernon, W.; Pantelic, J. ASHRAE Position Document Airborne Infectious Diseases. 2020. Available online: https://www.ashrae.org/file%20library/about/position%20documents/pd_infectiousaerosols_2020.pdf (accessed on 21 April 2021).
- Fang, Z.; Huang, Z.; Li, X.; Zhang, J.; Lv, W.; Zhuang, L.; Xu, X.; Huang, N. How many infections of COVID-19 there will be in the “Diamond Princess”Predicted by a virus transmission model based on the simulation of crowd flow. arXiv 2020, arXiv:2002.10616. [Google Scholar]
- Wiles, K. Cruise Ship AC Systems Could Promote Rapid Coronavirus Spread, Prof Says–Purdue University News. Available online: https://www.purdue.edu/newsroom/releases/2020/Q1/cruise-ship-ac-systems-could-promote-rapid-coronavirus-spread,-prof-says.html (accessed on 20 April 2021).
- Lutz, B.D.; Jin, J.; Rinaldi, M.G.; Wickes, B.L.; Huycke, M.M. Outbreak of invasive Aspergillus infection in surgical patients, associated with a contaminated air-handling system. Clin. Infect. Dis. 2003. [Google Scholar] [CrossRef] [Green Version]
- Shajahan, A.; Culp, C.H.; Williamson, B. Effects of indoor environmental parameters related to building heating, ventilation, and air conditioning systems on patients’ medical outcomes: A review of scientific research on hospital buildings. Indoor Air 2019, 29, 161–176. [Google Scholar] [CrossRef] [PubMed]
- Balaras, C.A.; Dascalaki, E.; Gaglia, A. HVAC and indoor thermal conditions in hospital operating rooms. Energy Build. 2007. [Google Scholar] [CrossRef]
- Wong, L.T.; Chan, W.Y.; Mui, K.W.; Lai, A.C.K. An experimental and numerical study on deposition of bioaerosols in a scaled chamber. Aerosol Sci. Technol. 2010. [Google Scholar] [CrossRef] [Green Version]
- Olmedo, I.; Nielsen, P.V.; Ruiz de Adana, M.; Jensen, R.L.; Grzelecki, P. Distribution of exhaled contaminants and personal exposure in a room using three different air distribution strategies. Indoor Air 2012. [Google Scholar] [CrossRef] [PubMed]
- Beam, E.L.; Schwedhelm, S.; Boulter, K.; Kratochvil, C.; Lowe, J.; Hewlett, A.; Gibbs, S.G.; Smith, P.W. Personal protective equipment processes and rationale for the Nebraska Biocontainment Unit during the 2014 activations for Ebola virus disease. Am. J. Infect. Control. 2016. [Google Scholar] [CrossRef]
- Asadi, S.; Bouvier, N.; Wexler, A.S.; Ristenpart, W.D. The coronavirus pandemic and aerosols: Does COVID-19 transmit via expiratory particles? Aerosol Sci. Technol. 2020, 1–4. [Google Scholar] [CrossRef] [PubMed] [Green Version]
- Elias, B.; Bar-Yam, Y. Could Air Filtration Reduce COVID-19 Severity and Spread? New Engl. Complex. Syst. Inst. 2020. Available online: https://necsi.edu/could-air-filtration-reduce-covid19-severity-and-spread (accessed on 22 April 2021).
- Smith, S.H.; Somsen, G.A.; Van Rijn, C.; Kooij, S.; Van Der Hoek, L.; Bem, R.A.; Bonn, D. Aerosol persistence in relation to possible transmission of SARS-CoV-2. Phys. Fluids 2020. [Google Scholar] [CrossRef]
- Van Doremalen, N.; Bushmaker, T.; Morris, D.H.; Holbrook, M.G.; Gamble, A.; Williamson, B.N.; Tamin, A.; Harcourt, J.L.; Thornburg, N.J.; Gerber, S.I.; et al. Aerosol and Surface Stability of SARS-CoV-2 as Compared with SARS-CoV-1. N. Engl. J. Med. 2020. [Google Scholar] [CrossRef]
- Santarpia, J.L.; Rivera, D.N.; Herrera, V.L.; Morwitzer, M.J.; Creager, H.M.; Santarpia, G.W.; Crown, K.K.; Brett-Major, D.M.; Schnaubelt, E.R.; Broadhurst, M.J.; et al. Aerosol and surface contamination of SARS-CoV-2 observed in quarantine and isolation care. Sci. Rep. 2020. [Google Scholar] [CrossRef]
- Lee, J.; Yoo, D.; Ryu, S.; Ham, S.; Lee, K.; Yeo, M.; Min, K.; Yoon, C. Quantity, size distribution, and characteristics of cough-generated aerosol produced by patients with an upper respiratory tract infection. Aerosol Air Qual. Res. 2019. [Google Scholar] [CrossRef]
- Johnson, G.R.; Morawska, L.; Ristovski, Z.D.; Hargreaves, M.; Mengersen, K.; Chao, C.Y.H.; Wan, M.P.; Li, Y.; Xie, X.; Katoshevski, D.; et al. Modality of human expired aerosol size distributions. J. Aerosol Sci. 2011. [Google Scholar] [CrossRef]
- Fernstrom, A.; Goldblatt, M. Aerobiology and Its Role in the Transmission of Infectious Diseases. J. Pathog. 2013. [Google Scholar] [CrossRef] [Green Version]
- Kutter, J.S.; Spronken, M.I.; Fraaij, P.L.; Fouchier, R.A.; Herfst, S. Transmission routes of respiratory viruses among humans. Curr. Opin. Virol. 2018, 28, 142–151. [Google Scholar] [CrossRef] [PubMed]
- Cole, E.C.; Cook, C.E. Characterization of infectious aerosols in health care facilities: An aid to effective engineering controls and preventive strategies. Am. J. Infect. Control. 1998. [Google Scholar] [CrossRef]
- Nicas, M.; Jones, R.M. Relative contributions of four exposure pathways to influenza infection risk. Risk Anal. 2009. [Google Scholar] [CrossRef] [PubMed]
- Shaman, J.; Kohn, M. Absolute humidity modulates influenza survival, transmission, and seasonality. Proc. Natl. Acad. Sci. USA 2009. [Google Scholar] [CrossRef] [PubMed] [Green Version]
- Siegel, J.D.; Rhinehart, E.; Jackson, M.; Chiarello, L. Guideline for isolation precautions: Preventing transmission of infectious agents in healthcare settings 2007. In Hospital-Acquired Infections; Nova Science: Hauppauge, NY, USA, 2009; ISBN 9781606927281. [Google Scholar]
- Sportelli, M.C.; Izzi, M.; Kukushkina, E.A.; Hossain, S.I.; Picca, R.A.; Ditaranto, N.; Cioff, N. Can nanotechnology and materials science help the fight against sars-cov-2? Nanomaterials 2020, 10, 802. [Google Scholar] [CrossRef] [Green Version]
- Edmond, M.B.; Wallace, S.E.; McClish, D.K.; Pfaller, M.A.; Jones, R.N.; Wenzel, R.P. Nosocomial bloodstream infections in United States hospitals: A three- year analysis. Clin. Infect. Dis. 1999. [Google Scholar] [CrossRef] [Green Version]
- European Standards Standards EN 1822 and EN ISO 29463–EPA, HEPA and ULPA filters–European Standards. Available online: https://www.en-standard.eu/set-en-1822-and-en-iso-29463-standards-for-heigh-efficiency-air-filters-epa-hepa-and-ulpa/ (accessed on 20 April 2021).
- Abdul Salam, Z.H.; Karlin, R.B.; Ling, M.L.; Yang, K.S. The impact of portable high-efficiency particulate air filters on the incidence of invasive aspergillosis in a large acute tertiary-care hospital. Am. J. Infect. Control. 2010. [Google Scholar] [CrossRef]
- Jankowska, E.; Reponen, T.; Willeke, K.; Grinshpun, S.A.; Choi, K.J. Collection of fungal spores on air filters and spore reentrainment from filters into air. J. Aerosol Sci. 2000. [Google Scholar] [CrossRef]
- Beggs, C.B.; Donnelly, J.K.; Kerr, K.G.; Sleigh, P.A.; Mara, D.D.; Cairns, G. The use of engineering controls to disinfect Mycobacterium tuberculosis and airborne pathogens in hospital buildings. Indoor Built Environ. 2000. [Google Scholar] [CrossRef]
- Chuaybamroong, P.; Chotigawin, R.; Supothina, S.; Sribenjalux, P.; Larpkiattaworn, S.; Wu, C.Y. Efficacy of photocatalytic HEPA filter on microorganism removal. Indoor Air 2010. [Google Scholar] [CrossRef]
- Sportelli, M.C.; Picca, R.A.; Cioffi, N. Recent advances in the synthesis and characterization of nano-antimicrobials. TrAC Trends Anal. Chem. 2016, 84, 131–138. [Google Scholar] [CrossRef]
- Ungur, G.; Hrůza, J. Modified polyurethane nanofibers as antibacterial filters for air and water purification. RSC Adv. 2017. [Google Scholar] [CrossRef] [Green Version]
- Grant, W.B.; Giovannucci, E. The possible roles of solar ultraviolet-B radiation and vitamin D in reducing case-fatality rates from the 1918–1919 influenza pandemic in the United States. Dermatoendocrinol 2009, 10, 9063. [Google Scholar] [CrossRef]
- Bang, J.I.; Park, J.; Choi, A.; Jeong, J.W.; Kim, J.Y.; Sung, M. Evaluation of UR-UVGI system for sterilization effect on microorganism contamination in negative pressure isolation ward. Sustainability 2018, 10, 3192. [Google Scholar] [CrossRef] [Green Version]
- KLARAN What Is UVC Light? Available online: https://www.klaran.com/klaran-university/about-uvc (accessed on 21 April 2021).
- Sehulster, L.; Chinn, R.Y.W. Guidelines for environmental infection control in health-care facilities. Recommendations of CDC and the Healthcare Infection Control Practices Advisory Committee (HICPAC). MMWR Recomm. Rep. 2003, 52, 1–42. [Google Scholar]
- Sehulster, L.; Chinn, R.Y.W. Guidelines for environmental infection control in health-care facilities. Morb. Mortal. Wkly. Rep. 2003, 52, 1–42. [Google Scholar]
- Kowalski, W. Ultraviolet Germicidal Irradiation Handbook: UVGI for Air and Surface Disinfection; Springer: Cham, Switzerland, 2009; ISBN 9783642019982. [Google Scholar]
- Talbot, E.A.; Jensen, P.; Moffat, H.J.; Wells, C.D. Occupational risk from ultraviolet germicidal irradiation (UVGI) lamps. Int. J. Tuberc. Lung Dis. 2002, 6, 738–741. [Google Scholar] [PubMed]
- Nicas, M.; Miller, S.L. A multi-zone model evaluation of the efficacy of upper-room air ultraviolet germicidal irradiation. Appl. Occup. Environ. Hyg. 1999. [Google Scholar] [CrossRef]
- IUVA COVID-19 FAQ, What is the UVC dose for killing or disabling the COVID-19 virus? 2020. Available online: https://iuva.org/iuva-covid-19-faq (accessed on 21 April 2021).
- AHRI COVID Transmission and Air Conditioning Facts. Available online: http://www.ahrinet.org/App_Content/ahri/files/NewsRoom/AHRI-COVID-Report-FAQ.pdf (accessed on 21 April 2021).
- Xu, H.; Yan, C.; Fu, Q.; Xiao, K.; Yu, Y.; Han, D.; Wang, W.; Cheng, J. Possible environmental effects on the spread of COVID-19 in China. Sci. Total Environ. 2020. [Google Scholar] [CrossRef]
- Lim, T.; Cho, J.; Kim, B.S. The influence of ward ventilation on hospital cross infection by varying the location of supply and exhaust air diffuser using CFD. J. Asian Arch. Build. Eng. 2010. [Google Scholar] [CrossRef]
- Holland, M.; Zaloga, D.J.; Friderici, C.S. COVID-19 Personal Protective Equipment (PPE) for the emergency physician. Vis. J. Emerg. Med. 2020. [Google Scholar] [CrossRef] [PubMed]
- Palermo, S.A.; Zischg, J.; Sitzenfrei, R.; Rauch, W.; Piro, P. Parameter Sensitivity of a Microscale Hydrodynamic Model. In Proceedings of the Green Energy and Technology; Springer International Publishing: Basel, Switzerland, 2019. [Google Scholar]
- Piro, P.; Carbone, M.; Garofalo, G.; Sansalone, J. CSO treatment strategy based on constituent index relationships in a highly urbanised catchment. Water Sci. Technol. 2007, 56, 85–91. [Google Scholar] [CrossRef]
- Piro, P.; Carbone, M.; Sansalone, J. Delivery and Frequency Distributions of Combined Wastewater Collection System Wet and Dry Weather Loads. Water Environ. Res. 2012. [Google Scholar] [CrossRef]
- Carbone, M.; Garofalo, G.; Nigro, G.; Piro, P. A conceptual model for predicting hydraulic behaviour of a green roof. Procedia Eng. 2014, 70, 266–274. [Google Scholar] [CrossRef] [Green Version]
- Popovici, C.G. HVAC System Functionality Simulation Using ANSYS-Fluent. Energy Procedia 2017, 112, 360–365. [Google Scholar] [CrossRef]
- ANSYS Chapter 1: Basic Fluid Flow. Available online: https://ansyshelp.ansys.com/account/secured?returnurl=/Views/Secured/corp/v202/en/flu_th/flu_th_chp_models.html (accessed on 21 April 2021).
- ANSYS Inc. ANSYS FLUENT User’s Guide, chapter 15. Discrete Phase. Available online: https://www.afs.enea.it/project/neptunius/docs/fluent/html/th/node238.htm (accessed on 21 April 2021).
- Yongson, O.; Badruddin, I.A.; Zainal, Z.A.; Aswatha Narayana, P.A. Airflow analysis in an air conditioning room. Build. Environ. 2007. [Google Scholar] [CrossRef]
- ANSI ANSI/ASHRAE Standard 62.1-2010; Ventilation for Acceptable Indoor Air Quality. Ashrae. 2007. Available online: http://arco-hvac.ir/wp-content/uploads/2016/04/ASHRAE-62_1-2010.pdf (accessed on 22 April 2021).
- Asmi, A.; Putra, J.C.P.; Rahman, I.A. Simulation of room airflow using comsol multiphysics software. Appl. Mech. Mater. 2013, 465–466, 571–577. [Google Scholar] [CrossRef]
- Fulpagare, Y.; Agrawal, N. Experimental Investigation on Room Ait Flow Pattern & Thermal Comfort Qantification. Int. J. Eng. Sci. Emerg. Technol. IJESET 2013, 6, 120–132. [Google Scholar]
- Yu, J.; Leng, K.; Wang, F.; Ye, H.; Luo, Y. Simulation study on dynamic thermal performance of a new ventilated roof with form-stable pcm in Southern China. Sustainability 2020, 12, 9315. [Google Scholar] [CrossRef]
- Yang, X.; Ou, C.; Yang, H.; Liu, L.; Song, T.; Kang, M.; Lin, H.; Hang, J. Transmission of pathogen-laden expiratory droplets in a coach bus. J. Hazard. Mater. 2020. [Google Scholar] [CrossRef] [PubMed]
- Yang, L.; Li, X.; Yan, Y.; Tu, J. Effects of cough-jet on airflow and contaminant transport in an airliner cabin section. J. Comput. Multiph. Flows 2018. [Google Scholar] [CrossRef]
- Yan, Y.; Li, X.; Yang, L.; Yan, P.; Tu, J. Evaluation of cough-jet effects on the transport characteristics of respiratory-induced contaminants in airline passengers’ local environments. Build. Environ. 2020. [Google Scholar] [CrossRef]
- Zhang, B.; Guo, G.; Zhu, C.; Ji, Z. Transport of aerosol by coughing in an air-conditioned space. In Proceedings of the Thermal and Fluids Engineering Summer Conference, Las Vegas, NV, USA, 14–17 April 2019. [Google Scholar]
- Talaat, K.; Abuhegazy, M.; Mahfoze, O.A.; Anderoglu, O.; Poroseva, S.V. Simulation of aerosol transmission on a Boeing 737 airplane with intervention measures for COVID-19 mitigation. Phys. Fluids 2021, 33, 33312. [Google Scholar] [CrossRef]
- Wang, J.X.; Cao, X.; Chen, Y.P. An air distribution optimization of hospital wards for minimizing cross-infection. J. Clean. Prod. 2021, 279. [Google Scholar] [CrossRef]
- Zhang, C.; Bounds, C.P.; Foster, L.; Uddin, M. Turbulence modeling effects on the CFD predictions of flow over a detailed full-scale sedan vehicle. Fluids 2019, 4, 148. [Google Scholar] [CrossRef] [Green Version]
- Dong, H.; Qin, Z.; Liu, S.; Li, Y.; Shen, Y.; Wang, H.; Zong, Y.; Wu, X.; Si, H. Numerical investigation into the air flow distributions of the air conditioning system in the modular data center. Adv. Appl. Math. Mech. 2019, 11, 91–107. [Google Scholar] [CrossRef]
- Ahn, J.; Choi, H.Y. Effects of Supply Angle on Thermal Environment of Residential Space with Hybrid Desiccant Cooling System for Multi-Room Control. Appl. Sci. 2020, 10, 7271. [Google Scholar] [CrossRef]
- Ng, K.C.; Kadirgama, K.; Ng, E.Y.K. Response surface models for CFD predictions of air diffusion performance index in a displacement ventilated office. Energy Build. 2008, 40, 774–781. [Google Scholar] [CrossRef]
- Zhu, S.; Dalgo, D.; Srebric, J.; Kato, S. Cooling efficiency of a spot-type personalized air-conditioner. Build. Environ. 2017, 121, 35–48. [Google Scholar] [CrossRef]
- Pirouz, B.; Mazzeo, D.; Palermo, S.A.; Naghib, S.N.; Turco, M.; Piro, P. CFD Investigation of Vehicle’s Ventilation Systems and Analysis of ACH in Typical Airplanes, Cars, and Buses. Sustainability 2021, 13, 6799. [Google Scholar] [CrossRef]
- Yan, Y.; Li, X.; Shang, Y.; Tu, J. Evaluation of airborne disease infection risks in an airliner cabin using the Lagrangian-based Wells-Riley approach. Build. Environ. 2017, 121, 79–92. [Google Scholar] [CrossRef] [PubMed]
- Abuhegazy, M.; Talaat, K.; Anderoglu, O.; Poroseva, S.V.; Talaat, K. Numerical investigation of aerosol transport in a classroom with relevance to COVID-19. Phys. Fluids 2020, 32. [Google Scholar] [CrossRef] [PubMed]


| Case Study | Size [m] | Airflow Rate [m3/s] | Airflow Speed [m/s] | Refs. | ||
|---|---|---|---|---|---|---|
| Length | Width | Height | ||||
| Yongson et al. (2017) | 3.7 | 2.7 | 3 | - | 5 | [84] |
| ANSI/ASHRAE (2007) | - | - | - | - | 0.8 | [85] |
| Asmi et al. (2014) | - | - | - | 0.08–1.53 | 1.19 | [86] |
| Fulpagare and Agrawal (2013) | 14 | 13 | 3.6 | - | 0.7–1.4 | [87] |
| Yu et al. (2020) | - | - | - | - | 0.4–2.4 | [88] |
| Typical Office | 12 | 9 | 3.5 | 0.6 | 1.5 | 1 |
| Typical Class | 12 | 9 | 3.5 | 0.6 | 1.5 | |
| Aerosols | Particle Diameter [μm] | Injection Speed [m/s] | Mass Flow Rate [mg/s] | Injection Duration [s] | Refs. |
|---|---|---|---|---|---|
| Yang et al. (2020) | 10, 50 | 0.12 (respiration) | - | steady | [89] |
| Yang et al. (2018) | ≈10 | 11.2 (sneeze) | - | 0.5 | [90] |
| Yan et al. (2020) | 0–100 | 0.3–1 (respiration) | - | 0.5 | [91] |
| Zhang et al. (2019) | 5 | 4.2–10 (caugh and sneez) | 5 | 0.5 | [92] |
| Selected size of particles | 5 | 10 | 5 | 0.5 | 1 |
| Case Study | Nodes | Elements (Tetrahedra) | Skewness | Orthogonal Qiality |
|---|---|---|---|---|
| Office | 648,099 | 3,567,162 | 0.23 | 0.85 |
| Class | 535,690 | 2,725,893 | 0.24 | 0.85 |
| Item | Solution Setup | ||||
|---|---|---|---|---|---|
| Solver | Type | Pressure based | |||
| Velocity formulation | Absolute | ||||
| Gravity | −9.81 | ||||
| Time | Airflow analysis | Steady | Iteration | Office | 1300 |
| Class | 1300 | ||||
| Discrete analysis | Transient | Time step (s)/Number of time step/Max Iteration | Office | 1/1800/20 | |
| Class | 1/1800/20 | ||||
| Model | Viscous | k-epsilon | |||
| Discrete phase | |||||
| Material | Air, water liquid | ||||
| Boundary condition | Inlet | Velocity | |||
| Outlet | Pressure outlet | ||||
| Surrounded surface | Wall | ||||
| Injection | Velocity | ||||
| Temperature (airflow and the walls) | 25 °C | ||||
| Solution | Standard initialization | ||||
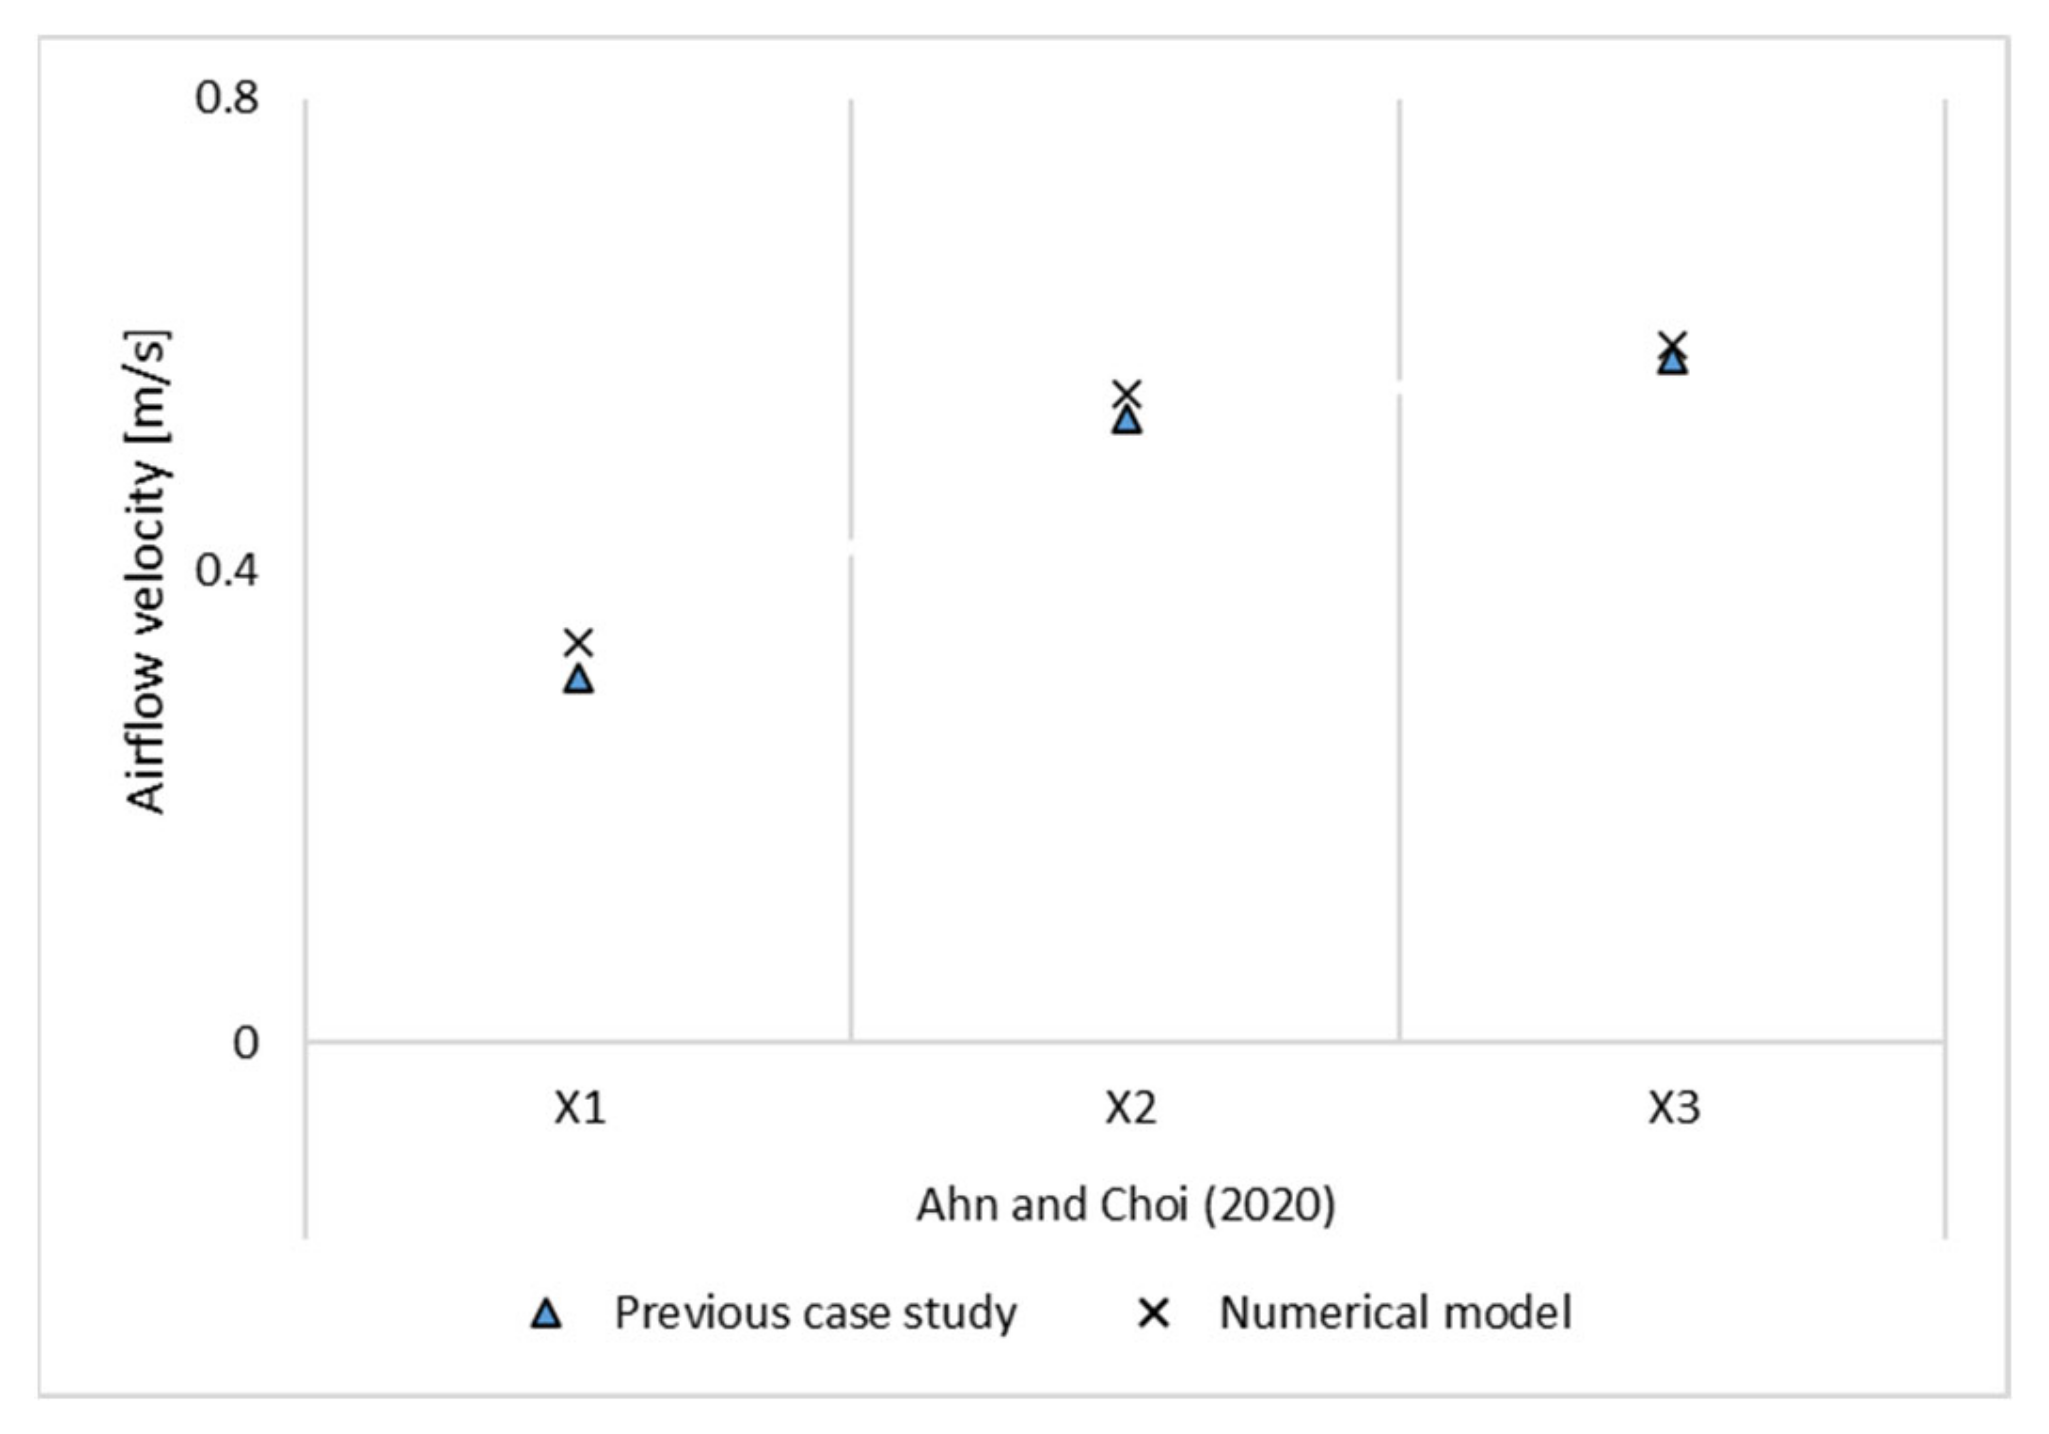
| Validation | The model of airflow analysis pattern has been validated based on experimental results of Ahn and Choi [97], and the discrete phase model of aerosols has been validated based on the study by Zhang et al. [92] | ||||
Publisher’s Note: MDPI stays neutral with regard to jurisdictional claims in published maps and institutional affiliations. |
© 2021 by the authors. Licensee MDPI, Basel, Switzerland. This article is an open access article distributed under the terms and conditions of the Creative Commons Attribution (CC BY) license (https://creativecommons.org/licenses/by/4.0/).
Share and Cite
Pirouz, B.; Palermo, S.A.; Naghib, S.N.; Mazzeo, D.; Turco, M.; Piro, P. The Role of HVAC Design and Windows on the Indoor Airflow Pattern and ACH. Sustainability 2021, 13, 7931. https://doi.org/10.3390/su13147931
Pirouz B, Palermo SA, Naghib SN, Mazzeo D, Turco M, Piro P. The Role of HVAC Design and Windows on the Indoor Airflow Pattern and ACH. Sustainability. 2021; 13(14):7931. https://doi.org/10.3390/su13147931
Chicago/Turabian StylePirouz, Behrouz, Stefania Anna Palermo, Seyed Navid Naghib, Domenico Mazzeo, Michele Turco, and Patrizia Piro. 2021. "The Role of HVAC Design and Windows on the Indoor Airflow Pattern and ACH" Sustainability 13, no. 14: 7931. https://doi.org/10.3390/su13147931
APA StylePirouz, B., Palermo, S. A., Naghib, S. N., Mazzeo, D., Turco, M., & Piro, P. (2021). The Role of HVAC Design and Windows on the Indoor Airflow Pattern and ACH. Sustainability, 13(14), 7931. https://doi.org/10.3390/su13147931