Abstract
Many countries are contemplating a smart sustainable approach to the next generation of cities. However, there are many obstacles to achieve this objective, such as planning and implementing sustainable dimensions. The aim of this study is to (1) investigate the level of importance of the different sustainable dimensions in Riyadh and (2) distinguish the effect of two proposed solutions on dimensions for a smart approach to rank the proposed solutions based on their level of impact in Riyadh. In this study, the sustainability dimensions are six main measurable criteria that include Smart Economy, Smart Mobility, Smart Environment, Smart People, Smart Governance, and Smart Living. The research also utilized a multi-step methodology that involved an expert-based survey and fuzzy analytic hierarchy process (F-AHP) to assess the performance indices of components for a smart method in Riyadh and evaluate the proposed solutions, namely, the construction of a metro network to link all of Riyadh to align with the government objective for 2030, and encouraging the construction of smart buildings through Leadership in Energy and Environmental Design (LEED) certification. The results show that Smart People, Smart Mobility, and Smart Living were the three most important sustainable indices for Riyadh. Furthermore, the results of the proposed construction projects illustrate that both projects had the same impact on five of the six sustainable indices, but that the metro project had a significantly higher impact on one of the indices. The study is also envisaged to aid decision-makers in prioritizing the upcoming public construction projects. Finally, this is the first study of its kind to address ranking real public construction projects in terms of sustainable development.
1. Introduction
Most cities around the world have, in this era when energy is needed for every aspect of daily life, increasing energy demands to meet the needs of their population. Consequently, a significant amount of energy is being consumed and a great deal of greenhouse gas emissions is being produced. In fact, it is estimated that cities demand more than 75% of the world’s energy production and generate more than 80% of global greenhouse gas emissions [1]. The importance of urban areas as a global phenomenon is confirmed by the proliferation of megacities with more than 20 million inhabitants throughout Asia, Latin America, and Africa [2]. Consequently, these cities consume a vast majority of resources, which contributes to their economic importance, but also negatively affects their environmental performance. The “smart cities” concept has frequently been used in the past two decades to illustrate the manner in which these enormous cities can reduce the negative environmental impacts that they produce through innovative means. Eger et al. (2009) defined smart cities as sustainable, connected urban areas that make vital decisions related to applying technology to every facet of society to address their key problems [3]. Bakıcı et al. (2013), on the other hand, defined a smart city approach as a high-tech, exhaustive, and advanced city that ties people, data, and infrastructure together through new technologies to create a more sustainable and greener city and more competitive and innovative commerce [4]. The terms “smart cities” and “intelligent cities” are used interchangeably, and usually refers to the same meaning. For example, [5] interpreted the concept of intelligent city to mean the use of all available technology and resources in an intelligent and coordinated manner in order to develop urban centers that are at the same time integrated, habitable, and sustainable. In another study, [6] defined the concept of “sustainable approach” as the application of information and communication technology (ICT) to every aspect of life. From all of these definitions, it can be concluded that a sustainable approach utilizes advanced technologies to collect data, analyze them, and use such analysis to improve operations and manage assets efficiently. It can also be concluded that in addition to technology, an important feature for a sustainable method is interconnectivity among different facilities, assets, and communities [7]. There are multiple views on what comprises a smart city. According to [8,9], originally there were four components of a smart city, namely, industry, education, participation, and technical infrastructure. However, this list was enhanced to define six components of a smart city: (1) Smart Economy (an economy that involves innovation, flexibility, integration of local and international markets, entrepreneurship, etc.), (2) Smart Mobility (with easy local and international accessibility, utilization of modern communication technologies and smart transportation systems, etc.), (3) Smart Environment (intelligent resource management, efforts of environmental protection, sustainability outlooks, etc.), (4) Smart People (with high qualifications, high quality of social interactions, openness towards external cultures, participation in public life, coexistence and tolerance, et.), (5) Smart Living (the quality of life in terms of cultural facilities, health conditions, safety, housing quality, etc.), and (6) Smart Governance (aspects of political participation in decision-making, the level of public and social services, transparency of governance, etc.).
Another view of the dimensions of any sustainable approach was suggested by [10], who viewed the key components of a sustainable city to be the technology, the people (creativity, diversity, and education), and the institutions (governance and policy), which help symbolize the sustainable approach concept generally. Furthermore, Berardi (2013) [11] linked the six components discussed earlier to different aspects of urban life.
The objectives of this research are (1) to investigate the level of importance of the different dimensions of a sustainable city with respect to the city of Riyadh (the capital of the Kingdom of Saudi Arabia), and (2) to determine the effect of two proposed solutions on the sustainable city dimensions in Riyadh to aid the city in the development process by ranking the proposed solutions based on their level of impact. Such a view is essential in the current days, as the Kingdom of Saudi Arabia (KSA) is witnessing an unprecedented level of investment in infrastructure and urban development. As an example, KSA planned a USD 141 billion investment over 10 years (starting in 2018) to upgrade its transportation infrastructure (the Saudi Arabian General Investment Authority 2018), which is only one component of a sustainable city. Accordingly, the findings of this research are expected to partake in enhancing KSA’s performance in aspects related to smart cities by highlighting the strengths and weaknesses of the current constituents and proposing solutions to make the studies city “smarter.”
To achieve the research objectives, this paper utilizes a survey to determine the city of Riyadh’s perceived importance of the six criteria proposed by [8], and then analyzes the survey’s results using the fuzzy analytic hierarchy process (F-AHP) (see Section 3). The paper proceeds from this point to a literature review of sustainable cities and the latest relevant research efforts on that topic, then to a literature review of the F-AHP process (See Section 2). The paper then continues with the methodology of the steps used to conduct this research (for example, how F-AHP is utilized to analyze the survey’s findings). After that, the research results (see Section 4) are demonstrated and a discussion takes place. Finally, the paper concludes (see Section 5) with an overall summary of the results and a conclusion.
2. Literature Review
2.1. Smart Cities
Nowadays, technology is integrated into the daily lives of humans in different capacities. With such an advancement, the “Internet of Things” (IoT) emerged as the third wave of technological and Web renaissance [12]. The IoT is characterized by data sharing and connectivity among embedded devices autonomously, where everything around us is connected in some sort [13]. Among the results of this is the emergence of sustainable cities. The concept of a smart city was formulated to use public services and resources to eventually enhance the quality of services offered to urban citizens [14]. Accordingly, smart cities utilize IoT technology in terms of autonomous urban data collection to enhance and optimize public services such as health care, transportation, education, power, etc. [15,16]. The concept of a smart city emerged with time beyond the IoT of facilities to include other aspects such as the citizens themselves in terms of level of education (and other social aspects), and several other aspects [17]. According to [18], there is a growing awareness regarding the societal, economic, environmental, and technological values of smart cities, in which the public is becoming more cooperative with the authorities to co-create smart cities.
Several studies have been made and techniques have been developed to evaluate the performance of a smart city and its metrics. One of the leading studies that defined smart city metrics and used them to assess cities was conducted by the University of Vienna. They developed assessment metrics to rank 70 European medium-sized cities [8]. These metrics use specific indicators for each of the six identified dimensions of a smart city, namely, (1) Smart Economy, (2) Smart Mobility, (3) Smart Environment, (4) Smart People, (5) Smart Living, and (6) Smart Governance. Another assessment system was developed by the Intelligent Community Forum, which annually announces the cities awarded as the “Smart 21 Communities.” This metric is based on five factors: broadband connectivity, a knowledgeable workforce, digital inclusion, innovation, and marketing and advocacy. According to [11], rating systems, through synthetic quantitative indicators, are receiving increasing attention from city managers and policymakers to help them decide where to focus time and resources and communicate city performance to citizens, visitors, and investors.
Furthermore, [1] demonstrated a methodology to define a model to evaluate a smart city based on fuzzy logic, using the main indicators discussed earlier and its sub-indicators to measure the “smartness” of the city. In parallel, [19] evaluated the performance of smart cities in the global economy by using two different databases: one with data from European smart cities, which identifies 70 medium-sized European smart cities and their six intelligence characteristics, and the other with data from The Financial Times’ “fDi Markets,” which contains information on a multitude of global greenfield investments by 70 smart cities for the period between 2003 and 2012. On the other hand, [20] demonstrated a ranking system used to compare three models of intelligent cities, namely, the Ruddolf Giffinger ranking of European smart cities, the mapping of smart cities in the European union by ITRE, and Boyd Cohen’s ranking of smart cities. It also considers many points such as goals, origin of initiative studies, types and element of geography, etc. Other researchers focused on developing models to assist planners in their efforts to construct a smart city, such as [21], who helped explain his framework “Smart City Reference Model” by using innovative ecosystem characteristics that transform all smart city elements into a greener and more intelligent city. Other researchers focused on increasing the performance of city intelligence by using modern technologies and equipment to achieve this goal. One such example is [22], who used machine learning to help with the modeling of smart road congestion. Another example is using unmanned aerial vehicles (UAV) to monitor the transportation system and report any accidents, as cited by [23]. Arribas-Bel et al. (2013) used a periodical ranking to understand the differences between different urban areas [24].
The population of the Kingdom of Saudi Arabia tripled from 9.3 million in 1980, to 26.3 million in 2018, according to the KSA General Authority for Statistics [25]. According to the Vision 2030 report, urbanization is expected to increase up to 97.6% by 2030, with Riyadh as the most populous city in the Kingdom [26]. In that report, it was highlighted that KSA is planning to have 10 smart cities by 2030. This paper aims at analyzing the current performance of the city of Riyadh to pinpoint areas that the government should focus on in the upcoming years to reach the smart city goal.
2.2. Assessments of Implementation in Cities
Modern cities are constantly evolving, and their citizens are becoming familiar with the city’s concepts of urban planning and smart cities. Therefore, several studies have been performed to evaluate these concepts in existing cities. For example, a qualitative investigation was conducted to improve transportation and people’s needs for education by using proper infrastructure planning. The investigation occurred in German cities between 2000 and 2010 [27]. Other qualitative studies focused on developing intelligent cities in Europe through data science [28,29]. The goal of these studies is to create policies for human well-being to lead to a sustainable planet. Other researchers turned their focus into an investigation to determine the essential attributes of intelligent cities. For example, [30] reported that an intelligent environment is an essential element for smart cities. In this example, the survey was between energy consumption, emissions, and the implications of the concept of a smart city. Another example is [10], who investigated and reported that the quality of life, urban services, education, and effective governance are driving factors in smart European cities.
On the other hand, researchers have used both qualitative and quantitative approaches to determine intelligent city indicators. In this aspect, [31] investigated the specific indicators using a survey for those who worked in the smart city field in Brazil. Additionally, the most effective indicators were determined using a data analysis technique. Ref [32] also used a questionnaire to inspect the main drivers for a smart city. However, the indicators were ranked based on the analytical hierarchy process (AHP). In addition, another researcher stated that smart economy and its sub-factors are the most critical indicator in a smart city, as cited in [33]. Therefore, ranking those indicators can massively help identify the indicators that need further improvement, as cited in [10,30,32,33]. Respondents and their backgrounds are also crucial to the credibility of questionnaires, as they should be in work related to smart cities. According to [34], the non-unified definitions of sustainable cities led to specific smart cities in a given country. As a result, the concept of a general smart city would not be achieved.
3. Methodology
3.1. Overview
This paper illustrates the performance of Riyadh on the ‘‘Smart City Index,’’ as described in (George Cristian, L.; Roscia,2012), utilizing as indicators the six main keys of a smart city, which are Smart Economy (C1), Smart Mobility (C2), Smart Environment (C3), Smart People (C4), Smart Governance (C5), and Smart Living (C6). A questionnaire was developed and distributed with those 6 indicators in a multi-criteria comparison form related to the city of Riyadh. Furthermore, the study identified the obstacles that Riyadh faces towards smartness and addressed the city component using the fuzzy analytical hierarchy process (F-AHP). The flowchart of the methodology is shown in Figure 1. Further explanation of the methodological steps is provided hereunder.
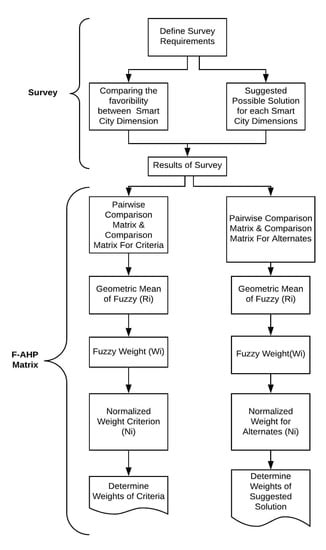
Figure 1.
Framework for determining weights of smart city dimensions and alternates.
3.2. Survey
A survey was developed that targeted engineers in general and sustainability. There were two types of questions on the survey: The first one aimed at identifying the weights of the six dimensions for measuring the “Smart City Index” for Riyadh. In other words, the first part of the survey was concerned with determining the relative importance of the six indicators of smart cities specifically for Riyadh. The second question type in the survey was related to determining which possible solution would be plausible for each smart city dimension, with two alternative solutions suggested in order to identify the most beneficial one for Riyadh. The first solution was A1: the construction of a metro network to link all of Riyadh to align with the government objective for 2030. The second solution was A2: encouraging the construction of green and smart buildings through Leadership in Energy and Environmental Design (LEED) certification.
Steven K. Thompson’s equation was used to calculate the sample size. As a result, although the minimum number of participants was 69, only 45 were received. Several researchers provided different acceptable sample sizes for descriptive or experimental research. Some sources suggested an acceptable range of 20–50 respondents [35]. Other sources accepted only 10–15 respondents for questionnaire-based research [36,37,38,39]. Thus, the sample size used in this study (45) was even higher than those of previous studies [40].
The selection criteria for participants focused on the prior experience with the smart city concept, in addition to some demographic factors such as gender, knowledge, and qualifications. Therefore, only experienced people were involved in this study because a questionnaire is more effective when participants have previous knowledge in the subject of research, which is confirmed by other researchers [41].
In the first part of the survey, the participants were asked the following question: “For the six criteria of a smart city, please compare the categories in terms of importance in Riyadh.” The comparison was made in a pairwise form, where the participants were required to compare each pair of smart city criteria (C1 to C6) in terms of relative importance. In the second part of the survey, the participants were asked the following: “For each criteria of a smart city, consider which of the proposed solutions would be most significant for Riyadh.” This comparison was also made in a pairwise form, where the participant reflected on the importance of each solution with respect to each criteria.
3.3. F-AHP Process
F-AHP is a reflection of human thinking when dealing with uncertain information to reach a certain decision. In short, F-AHP is a more advanced form of multi-criteria analysis, although the traditional multi-criterial analysis has been used in several applications before, such as re-designing transport systems [42] and evaluating parking spaces in cities [43]. The analytical hierarchy process (AHP) in general is a decision-making technique that aids in the solution of complex multiple criteria problems in a number of application domains [44,45,46]. AHP is an effective and practical approach that considers complex and unstructured decisions [47]. The outcome of AHP generally is a prioritized ranking or weighting of each decision alternative, based on the application [44]. F-AHP is similar to AHP in all aspects except that F-AHP sets the AHP scale into the fuzzy triangle scale instead of discrete numerical data. Fuzzy logic in general is powerful in representing the uncertainty of human judgment [48]. This makes it even easier to deal with the qualitative and quantitative data, and to use the hierarchy processes and pairwise comparison matrix to reduce conflicts and reach the fuzzy weight phase for each criteria and alternate solution [49].
In order to apply F-AHP, the performance index of sustainable energy planning was calculated using the F-AHP method in order to integrate the uncertainties and interdependencies with the defined criteria that would have an effect on sustainable energy planning in Riyadh.
3.3.1. Structural Hierarchy of the F-AHP Model
The F-AHP process starts by recognizing the criteria affecting the performance index of the sustainable energy planning components and categorizing them into the main criteria and their related factors. The structural hierarchy of F-AHP is presented in Figure 2. The F-AHP procedure is divided into two branches: The first branch is to determine the weight of the smart city dimensions (C1 to C6), and the second branch is to determine the weight of the proposed alternatives (A1 and A2) for each smart city dimension.
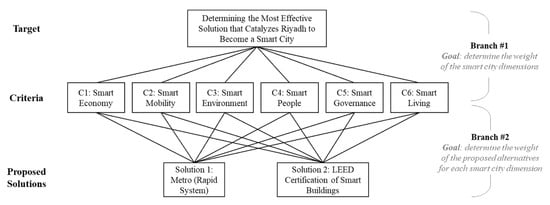
Figure 2.
Structural hierarchy of the F-AHP model.
3.3.2. Comparative Judgment Matrices
Once the hierarchy is structured, the next step is to establish comparative judgment by feeding the model with the pairwise comparisons that were obtained from the questionnaires. We had three levels in the hierarchy. As such, two sets of comparison matrices were formed; each set prioritized the elements in a hierarchical level with respect to an element of the higher level. As such, the first set was just one pairwise comparison matrix comparing the six criteria in terms of how important each one of them was relative to one another in the context of Riyadh city as a future smart city. There were five degrees of relevant importance used, namely, Equally Important, Weakly More Important, Fairly More Important, Strongly More Important, Absolutely More Important.
The second set (the one in the second F-AHP branch) was a series of matrices for the purpose of determining the weight of the proposed solutions with respect to each criterion. Figure 3 demonstrates the different sets of pairwise comparison matrices used as the basis for the F-AHP model. Note that the information inputted in such matrices was obtained from the questionnaire that was completed by the surveyed experts. In total, seven pairwise comparison matrices were used. However, any changes in the number of criteria and the number of alternatives would lead to a change in the total number of pairwise matrices and their form as well.
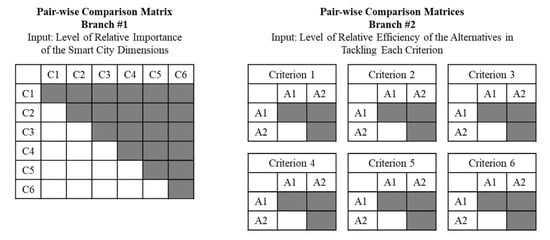
Figure 3.
Comparative judgment matrices.
3.3.3. Fuzzification
A fuzzification scale processes the collected responses to integrate the uncertainties present at this level. As mentioned earlier, the experts’ judgment was represented by a “fuzzy number” instead of a discrete number. One of the most commonly used shapes for a fuzzy number is the triangular shape, with a membership function that is defined by three numbers (l, m, u), where l represents the lower boundary, m represents the most probable one (the tip of the triangle), and u represents the upper boundary of the triangle. As such, any pairwise comparison in this project was transformed into a triangular fuzzy comparison matrix, as shown in Equation (1).
The fuzzification scale process is similar to Saaty’s fuzzification scale, where the variance between the most probable (the actual response from experts) and the upper and lower matrices is equal to one. This process was applied to all the pairwise comparisons that were collected from experts via the survey. The fuzzification scale used is presented in Table 1. The corresponding triangular fuzzy sets are demonstrated in Figure 4.

Table 1.
Importance degree of AHP, fuzzy process.
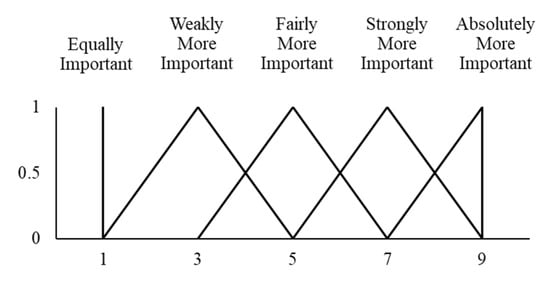
Figure 4.
Comparative judgment matrices.
The fuzzification process continues with the calculation of the geometric mean of fuzzy (Ri) for each alternative (Cn) in the comparison matrix using Equation (2). The final step in the fuzzification process is calculating the fuzzy weight (Wi) for each alternative (Cn) in the comparison matrix using Equation (3).
3.3.4. Defuzzification
Defuzzification is the process of transforming the fuzzy sets into point estimates by calculating the average weight (Mi) for each of the comparison alternatives (Cn), and the normalized weight criterion (Ni) for each of the comparison alternatives (Cn), as shown in Equations (4) and (5), respectively. Ni represents the final normalized weights of the compared criteria.
4. Results and Discussion
The research methodology was applied to the city of Riyadh. The survey was completed by 45 participants, where 66.7% of the participants were engineers, and 26.4% were academic staff. Additionally, around 4.4% of participants were undergraduate students from the College of Engineering, and a minority of participants (2.2%) were environmental consultants.
When it comes to the pairwise comparison of the six criteria for a sustainable approach, Table 2 provides the fuzzified weights of the criteria as determined by the participants.
Table 2.
Fuzzified comparison matrices of smart city criteria for Riyadh.
The fuzzification and defuzzification process (stated in the methodology) was applied, and the resulting normalized weight for each criterion is presented in Figure 5. It can be concluded from the figure that the most significant criteria in terms of importance to Riyadh city were C4: Smart People (19.4%), C2: Smart Mobility (18.8%), and C6: Smart Living (18.8%). These elements can be described as those that the experts perceived to need more focus from the Saudi authorities in order to progress and catalyze the transformation of Riyadh into a smart city. An interesting observation in these results is that the three most important criteria to the Saudi public are those related to their personal quality of life in (Smart People, Smart Mobility, and Smart Living). These are the three criteria that directly influence citizens. The other three criteria (Smart Environment, Smart Governance, and Smart Economy) influence citizens, but in an indirect way. As such, this observation could help the Saudi government in setting development priorities to address issues that directly affect the citizens first, and then address the more indirect ones later.
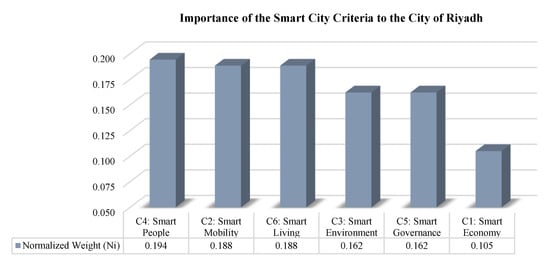
Figure 5.
F-AHP result—importance of the smart city criteria to the city of Riyadh.
In terms of the second branch of the F-AHP matrix (the one relating the proposed solutions to the sustainable approach criteria), the methodological steps were followed to determine which had more effects on the main components of a sustainable method. As mentioned earlier, the two solutions were A1: the construction of a metro to link all of Riyadh and to align with the government objective for 2030, and A2: encouraging the construction of green and smart buildings through LEED certification. The more weight the solution receives with respect to a certain criteria (branch), the more the attention it should get from the government to achieve the sustainable approach concept in that branch. The fuzzification and defuzzification processes (stated in the methodology) were applied to this branch, and the resulting normalized weight for the proposed solutions is presented in Figure 6. Interestingly, the two solutions had the same weights in five out of the six criteria (all except Smart Governance). This means that the two solutions (metro and LEED certification) are equally important (or will have the same effect) in enhancing the corresponding five sustainable approach dimensions. The only criterion (or dimension) where the two solutions had differing weights was Smart Governance, where the metro network solution had a normalized weight of 71% and the LEED certification solution had a weight of 29%. This difference was expected and logical. If we look at the definition of Smart Governance, we find that one of its primary constituents is public and social service. A metro network is indeed highly linked to Smart Governance through that constituent, which explains why it had a higher weight than LEED certification, since such a certification or the number of green buildings is not really linked strongly to Smart Governance.
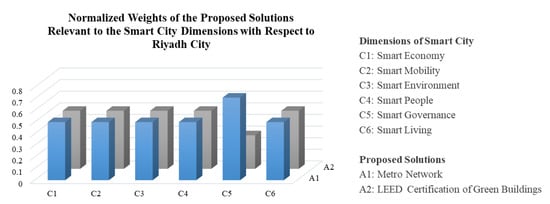
Figure 6.
Normalized weights of the proposed solutions relevant to the smart city dimensions with respect to Riyadh.
After analyzing the first branch (weights of the sustainable approach dimensions) on its own and the second branch (weights of the proposed solutions with respect to each sustainable approach dimension) on its own, another analysis could be conducted by combining both branches and calculating the overall weights of the proposed solutions. The overall weight (OW) of a solution (x) in this research project can be calculated according to Equation (6), where NCi is the normalized weight of criteria i and NSxi is the normalized weight of solution x with respect to criteria i. This overall weight represents the overall level of importance of the solution, combining both branches of the F-AHP model and thus providing a holistic insight into ranking the solutions based on their overall level of impact.
Equation (6) was applied to the project findings, and the result is presented in Table 3. As it turns out, the solution of constructing a metro station to link all of Riyadh showed a weight of approximately 53% in terms of the sustainable approach purpose, whereas constructing only LEED-certified buildings would have an overall weight of approximately 47%. Both solutions had close overall weights, with the metro solution having a slightly higher weight. As such, it could be concluded that currently the more important solution that the government should focus on is the metro network. However, this does not mean that the government should turn its back on the other solution. In fact, both solutions are extremely important for Riyadh to achieve the status of a sustainable approach. If the government has the capacity to implement both solutions simultaneously, this would be the optimum setup.
Table 3.
Final overall weight of each solution.
It should be noted that the numbers resulting from the F-AHP process (shown in Figure 5 and Figure 6, and Table 3) were relative and dimensionless rather than absolute. For example, in Table 3, one should not mistake the 0.466 overall weight of solution A2 as having a 46.6% chance of succeeding or that if such solution is implemented that it would improve the sustainable approach level of attainment by 46.6%. We should not look at the 46.6% individually, but rather with respect to the other solution, because F-AHP is all about “relative results.” Accordingly, the following is how the numbers should be interpreted: When compared to each other, A1 has a slightly higher importance than A2. The benefits of implementing solution A1 are slightly more significant than those of A2; however, this does not negate the fact that A2 on its own has significant benefits. The benefits of A2 are just seen as less significant only when compared to those of A1.
Table 4 presents how the two solutions are mapped to the six smart city dimensions.
Table 4.
Mapping the proposed solutions to the smart city dimensions.
In this research, the six dimensions for a sustainable approach were assessed directly in a qualitative manner. Deeper analysis could be made, where each criterion could be further divided into multiple constituents (or indicators). Those constituents could be a mix of qualitative and quantitative data. In fact, there are some research efforts that attempted to identify the different quantitative and qualitative constituents for the sustainable approach dimensions, such as those published by [1,20,50,51]. For example, “expenditure in research and development (R&D) as percentage of GDP” was considered by [20] to be one of the indicators of the Smart Economy dimension. Such an indicator is quantitative. An example of a qualitative indicator is the “political strategies and perspectives” as an indicator of Smart Governance, as suggested by [1]. There are two main challenges here. The first one is the difficulty in collecting some of the quantitative data. For example, “unemployment rate,” “GDP per employed person,” and “voter turnout” are relatively easy indicators to collect data for. However, indicators such as “computers in households” and “foreign language skills of citizens” are difficult to obtain. These require surveying a gigantic sample of citizens to ensure proper data reliance. The second challenge is that even if it is easy to obtain all the needed information—which is not the case—there is no consensus on the final list of indicators or the formula used to link these indicators together to come up with a unified score for sustainable methods. Each study proposes a list of indicators and a certain formula without validation. The authors did not use different indicators in this study and opted to use the six criteria of any sustainable method directly, simply because the scope of the research is not to assess the level of the city, but rather to determine the relative level of importance of these criteria and assess how the different proposed solutions could impact them. Moreover, it is worth noting that although in this project two proposed solutions were studied, the same methodology could be expanded to analyze more solutions.
In addition to the primary intellectual merit of the project, which is the analysis of Riyadh city in terms of sustainable approach dimensions and the corresponding efficiency of suggested urban solutions, this research presents a methodology that could be used by governments all over the world to analyze their cities and assess the importance of multiple development projects that can help those cities attain the status of sustainable cities.
5. Conclusions
This research is a preliminary investigation that used qualitative and quantitative approaches to rank the urbanism in Riyadh conceptualized within the concept of a smart city. First, a survey was conducted by 45 participants to determine the favorability between dimensions, and then to propose solutions and their weight on sustainable indices. The inclusion criteria to participate in this survey were having proper knowledge of smart cities through subjects in college for undergraduate students, workshops for academic staff, and fieldwork for engineers and environmental consultants. Secondly, F-AHP matrices were utilized to determine the weights of the dimensions and the suggested solutions. The studied sustainable dimensions in Riyadh were Smart Economy, Smart Mobility, Smart Environment, Smart People, Smart Governance, and Smart Living. These six criteria were leveraged to assess the performance indices of sustainable components in Riyadh, and the critical factors affecting them were identified and studied. F-AHP results about the importance of smart city criteria to the city of Riyadh were as follows:
- Smart People (C3) was the most important criteria for a smart city, with a normalized weight of 0.194.
- Smart Living (C6) and Smart Mobility (C2) were the second most important criteria for a smart city, with a normalized weight of 0.188.
- Smart Economy (C1) was the least important criteria for a smart city, with a normalized weight of 0.105.
Two solutions were also proposed and studied using F-AHP, namely, (1) the construction of a metro network to link all of Riyadh to align with the government objective for 2030, and (2) encouraging the construction of green and smart buildings through LEED certification. After the analysis, the F-AHP results about the proposed solutions relevant to the smart city dimensions were as follows:
- For Smart Governance, metro network A1 had a higher impact, with a normalized weight of 0.711, than LEED-certified green buildings A2, with a normalized weight 0.289.
- The remaining dimensions had the same impact in both A1 and A2.
- Overall, metro network A1 had a slightly higher impact, with a normalized weight of 0.534, over LEED-certified green buildings A2, with a normalized weight of 0.466.
The findings of this research are expected to partake in enhancing KSA’s performance in aspects related to sustainable smart approaches by highlighting the strengths and weaknesses of the current constituents and proposing solutions to make the studied city sustainable and smarter. There are many obstacles to achieving the sustainable smart development concept, such as a lack of information and infrastructure data, but there is a benefit in aligning with the government plan striving toward the ultimate objective of sustainable growth. For future research, more information about the city resources, public participation, weather, and so on would help increase the accuracy of the results and help provide solutions for the future of the city in every aspect of life.
This research was a preliminary investigation to assess the relative importance of the criteria used to assess the different proposed solutions for a smart city. The main limitation is that only two proposed solutions were studied, and the conducted analysis was considered qualitative in nature. Additionally, a slight difference between the minimum sample size and the number of respondents was another concern due to the lack of experts in this scope in Riyadh. Therefore, future research should focus on how to quantify the assessment criteria and provide a more in-depth analysis.
Author Contributions
Conceptualization, F.K.A. and A.R.E.Q.; methodology, A.R.E.Q., F.K.A. and I.S.A.; software, A.R.E.Q.; validation, A.R.E.Q., F.K.A. and I.S.A.; formal analysis, A.R.E.Q. and F.K.A.; investigation, A.R.E.Q., F.K.A. and I.S.A.; resources, A.R.E.Q., F.K.A.; data curation, A.R.E.Q.; writing—original draft preparation, A.R.E.Q. and F.K.A.; writing—review and editing, F.K.A. and I.S.A.; visualization, F.K.A. and I.S.A.; supervision, F.K.A.; project administration, F.K.A.; funding acquisition, F.K.A. All authors have read and agreed to the published version of the manuscript.
Funding
This research was funded by Deputyship for Research and Innovation, ‘‘Ministry of Education’’ in Saudi Arabia, project number IFKSURG-1442-008.
Institutional Review Board Statement
Not applicable.
Informed Consent Statement
Not applicable.
Acknowledgments
The authors extend their appreciation to the Deputyship for Research & Innovation, ‘‘Ministry of Education,’’ in Saudi Arabia for funding this research work through project number IFKSURG-1442-008.
Conflicts of Interest
The authors declare no conflict of interest.
References
- Lazaroiu, G.C.; Roscia, M.J.E. Definition methodology for the smart cities model. Energy 2012, 47, 326–332. [Google Scholar] [CrossRef]
- United Nations Population Division. World Urbanization Prospects: The 2007 Revision Population Database; United Nations Population Division: New York, NY, USA, 2008. [Google Scholar]
- Eger, J.M. Smart growth, smart cities, and the crisis at the pump a worldwide phenomenon. I-WAYS-J. E-Gov. Policy Regul. 2009, 32, 47–53. [Google Scholar] [CrossRef]
- Bakıcı, T.; Almirall, E.; Wareham, J. A smart city initiative: The case of Barcelona. J. Knowl. Econ. 2013, 4, 135–148. [Google Scholar] [CrossRef]
- Barrionuevo, J.M.; Berrone, P.; Ricart, J.E. Smart cities, sustainable progress. IESE Insight 2012, 14, 50–57. [Google Scholar] [CrossRef]
- Lombardi, P.; Giordano, S.; Farouh, H.; Yousef, W.J. Modelling the smart city performance. Innov. Eur. J. Soc. Sci. Res. 2012, 25, 137–149. [Google Scholar] [CrossRef]
- Suresh, S.; Renukappa, S.; Abdul-Aziz, A.-R.; Paloo, Y.; Jallow, H. Developments in the UK road transport from a smart cities perspective. Eng. Constr. Archit. Manag. 2020, 28, 845–862. [Google Scholar] [CrossRef]
- Giffinger, R.; Fertner, C.; Kramar, H.; Meijers, E. City-ranking of European medium-sized cities. Cent. Reg. Sci. Vienna UT. 2007. Available online: http://www.smartcity-ranking.eu/download/city_ranking_final.pdf (accessed on 10 January 2020).
- Giffinger, R.; Gudrun, H. Smart cities ranking: An effective instrument for the positioning of the cities? ACE Archit. City Environ. 2010, 4, 7–26. [Google Scholar]
- Nam, T.; Pardo, T.A. Smart city as urban innovation: Focusing on management, policy, and context. In Proceedings of the 5th International Conference on Theory and Practice of Electronic Governance, Tallinn, Estonia, 26–28 October 2011; pp. 185–194. [Google Scholar]
- Berardi, U. Clarifying the new interpretations of the concept of sustainable building. Sustain. Cities Soc. 2013, 8, 72–78. [Google Scholar] [CrossRef]
- Silva, B.N.; Khan, M.; Jung, C.; Seo, J.; Muhammad, D.; Han, J.; Yoon, Y.; Han, K. Urban planning and smart city decision management empowered by real-time data processing using big data analytics. Sensors 2018, 18, 2994. [Google Scholar] [CrossRef]
- Ghosh, A.; Edwards, D.J.; Hosseini, M.R. Patterns and trends in Internet of Things (IoT) research: Future applications in the construction industry. Eng. Constr. Archit. Manag. 2020, 28, 457–481. [Google Scholar] [CrossRef]
- Zanella, A.; Bui, N.; Castellani, A.; Vangelista, L.; Zorzi, M. Internet of things for smart cities. IEEE Internet Things J. 2014, 1, 22–32. [Google Scholar] [CrossRef]
- Chen, J.-H.; Ha, N.T.T.; Tai, H.-W.; Chang, C.-A. The willingness to adopt the Internet of Things (IoT) conception in Taiwan’s construction industry. J. Civ. Eng. Manag. 2020, 26, 534–550. [Google Scholar] [CrossRef]
- Sarkar, D.; Patel, H.; Dave, B. Development of integrated cloud-based Internet of Things (IoT) platform for asset management of elevated metro rail projects. Int. J. Constr. Manag. 2020, 1–10. [Google Scholar] [CrossRef]
- Deakin, M. Smart Cities: Governing, Modelling and Analysing the Transition; Routledge: London, UK, 2013. [Google Scholar]
- Akterujjaman, S.; Mulder, R.; Kievit, H. The influence of strategic orientation on co-creation in smart city projects: Enjoy the benefits of collaboration. Int. J. Constr. Manag. 2020, 1–9. [Google Scholar] [CrossRef]
- Wall, R.; Stavropoulos, S.; Edelenbos, J.; Pajević, F. Evaluating the performance of smart cities in the global economic network. In Transforming City Governments for Successful Smart Cities; Springer: Berlin, Germany, 2015; pp. 87–113. [Google Scholar]
- Benamrou, B.; Mohamed, B.; Bernoussi, A.-S.; Mustapha, O. Ranking models of smart cities. In Proceedings of the 2016 4th IEEE International Colloquium on Information Science and Technology (CiSt), Tangier-Assilah, Morocco, 24–26 October 2016; pp. 872–879. [Google Scholar]
- Zygiaris, S. Smart city reference model: Assisting planners to conceptualize the building of smart city innovation ecosystems. J. Knowl. Econ. 2013, 4, 217–231. [Google Scholar] [CrossRef]
- Ata, A.; Khan, M.A.; Abbas, S.; Ahmad, G.; Fatima, A.J. Modelling smart road traffic congestion control system using machine learning techniques. Neural Netw. World 2019, 29, 99–110. [Google Scholar] [CrossRef]
- Menouar, H.; Guvenc, I.; Akkaya, K.; Uluagac, A.S.; Kadri, A.; Tuncer, A. UAV-enabled intelligent transportation systems for the smart city: Applications and challenges. IEEE Commun. Mag. 2017, 55, 22–28. [Google Scholar] [CrossRef]
- Arribas-Bel, D.; Kourtit, K.; Nijkamp, P.J.C. Benchmarking of world cities through self-organizing maps. Cities 2013, 31, 248–257. [Google Scholar] [CrossRef]
- KSA General Authority for Statistics. Available online: www.stats.gov.sa (accessed on 18 January 2020).
- Affairs, K. Smart Cities—The Next Stage of Urbanization in KSA. Saudi Urban Forum 2018; General Authority for Statistics: Riyadh, Saudi Arabia, 2018. [Google Scholar]
- Buch, T.; Hamann, S.; Niebuhr, A.; Rossen, A. How to woo the smart ones? Evaluating the determinants that particularly attract highly qualified people to cities. J. Urban Aff. 2017, 39, 764–782. [Google Scholar] [CrossRef]
- Ramaswami, A.; Russell, A.G.; Culligan, P.J.; Sharma, K.R.; Kumar, E. Meta-principles for developing smart, sustainable, and healthy cities. Science 2016, 352, 940–943. [Google Scholar] [CrossRef]
- Caragliu, A.; Del Bo, C.; Nijkamp, P. Smart Cities in Europe; Routledge: London, UK, 2013. [Google Scholar]
- Khansari, N.; Mostashari, A.; Mansouri, M. Conceptual modeling of the impact of smart cities on household energy consumption. Procedia Comput. Sci. 2014, 28, 76–81. [Google Scholar] [CrossRef][Green Version]
- Azevedo Guedes, A.L.; Carvalho Alvarenga, J.; Dos Santos Sgarbi Goulart, M.; Rodriguez y Rodriguez, M.V.; Pereira Soares, C.A. Smart cities: The main drivers for increasing the intelligence of cities. Sustainability 2018, 10, 3121. [Google Scholar] [CrossRef]
- Tahir, Z.; Malek, J.A. Main criteria in the development of smart cities determined using analytical method. Plan. Malays. 2016, 14. [Google Scholar] [CrossRef]
- Stankovic, J.; Dzunic, M.; Džunić, Ž.; Marinkovic, S. A multi-criteria evaluation of the European cities’ smart performance: Economic, social and environmental aspects. Proc. Rij. Fac. Econ. J. Econ. Bus. 2015, 35, 519–550. [Google Scholar] [CrossRef]
- Cugurullo, F. Exposing smart cities and eco-cities: Frankenstein urbanism and the sustainability challenges of the experimental city. Environ. Plan. A Econ. Space 2018, 50, 73–92. [Google Scholar] [CrossRef]
- Sudman, S. Applied Sampling, 4th ed.; Academic Press: New York, NY, USA, 1983. [Google Scholar]
- Sheatsley, P.B. Questionnaire construction and item writing. Handb. Surv. Res. 1983, 4, 195–230. [Google Scholar]
- Fowler, F.J., Jr.; Fowler, F.J. Improving Survey Questions: Design and Evaluation; Sage: Thousand Oaks, CA, USA, 1995. [Google Scholar]
- Alreck, P.L.; Alreck, P.L.; Settle, R.B.; Robert, S. The Survey Research Handbook; McGraw-Hill: New York, NY, USA, 1995. [Google Scholar]
- Hill, R. What sample size is “enough” in internet survey research. Interpers. Comput. Technol. Electron. J. 21st Century 1998, 6, 1–12. [Google Scholar]
- Akroush, N.S.; El-Adaway, I.H. Utilizing construction leading safety indicators: Case study of tennessee. J. Manag. Eng. 2017, 33, 06017002. [Google Scholar] [CrossRef]
- Kabir, S. Basic Guidelines for Research: An Introductory Approach for All Disciplines; Book Zone Publication: Chittagong, Bangladesh, 2016; pp. 168–180. [Google Scholar]
- Jakimavičius, M.; Burinskiene, M. Assessment of Vilnius city development scenarios based on transport system modelling and multicriteria analysis. J. Civ. Eng. Manag. 2009, 15, 361–368. [Google Scholar] [CrossRef]
- Palevičius, V.; Paliulis, G.M.; Venckauskaite, J.; Vengrys, B. Evaluation of the requirement for passenger car parking spaces using multi-criteria methods. J. Civ. Eng. Manag. 2013, 19, 49–58. [Google Scholar] [CrossRef]
- Haq, A.N.; Kannan, G. Fuzzy analytical hierarchy process for evaluating and selecting a vendor in a supply chain model. Int. J. Adv. Manuf. Technol. 2006, 29, 826–835. [Google Scholar]
- Vahidi, H.; Ghazban, F.; Abdoli, M.A.; Kazemi, V.D.; Banaei, S. Fuzzy analytical hierarchy process disposal method selection for an industrial state; case study Charmshahr. Arab. J. Sci. Eng. 2014, 39, 725–735. [Google Scholar] [CrossRef]
- Al-Abadi, A.M.; Shahid, S.; Ghalib, H.B.; Handhal, A. A GIS-based integrated fuzzy logic and analytic hierarchy process model for assessing water-harvesting zones in Northeastern Maysan Governorate, Iraq. Arab. J. Sci. Eng. 2017, 42, 2487–2499. [Google Scholar] [CrossRef]
- Partovi, F.Y. Determining what to benchmark: An analytic hierarchy process approach. Int. J. Oper. Prod. Manag. 1994, 14, 25–39. [Google Scholar] [CrossRef]
- Soltani, A.; Marandi, E.Z. Hospital site selection using two-stage fuzzy multi-criteria decision making process. J. Urban Environ. Eng. 2011, 5, 32–43. [Google Scholar] [CrossRef]
- Işik, Z.; Aladağ, H. A fuzzy AHP model to assess sustainable performance of the construction industry from urban regeneration perspective. J. Civ. Eng. Manag. 2017, 23, 499–509. [Google Scholar] [CrossRef]
- Bischof, S.; Karapantelakis, A.; Nechifor, C.-S.; Sheth, A.P.; Mileo, A.; Barnaghi, P. Semantic Modelling of Smart City Data; Wright State University: Dayton, OH, USA, 2014. [Google Scholar]
- Albino, V.; Berardi, U.; Dangelico, R. Smart cities: Definitions, dimensions, performance, and initiatives. J. Urban Technol. 2015, 22, 3–21. [Google Scholar] [CrossRef]
Publisher’s Note: MDPI stays neutral with regard to jurisdictional claims in published maps and institutional affiliations. |
© 2021 by the authors. Licensee MDPI, Basel, Switzerland. This article is an open access article distributed under the terms and conditions of the Creative Commons Attribution (CC BY) license (https://creativecommons.org/licenses/by/4.0/).