Article

Construction Cost and Carbon Emission Assessment of a Highway Construction—A Case towards Sustainable Transportation

1
School of Architecture and Civil Engineering, Chengdu University, Chengdu 610106, China
2
School of Engineering, RMIT University, Melbourne, VIC 3001, Australia
3
College of Engineering and Science, Victoria University, Melbourne, VIC 3011, Australia
*
Author to whom correspondence should be addressed.
Sustainability 2021, 13(14), 7854; https://doi.org/10.3390/su13147854
Submission received: 11 May 2021 / Revised: 22 June 2021 / Accepted: 6 July 2021 / Published: 14 July 2021

Abstract

:
Due to its dynamic nature in construction, benchmarking environmental emissions of road construction projects can be a daunting task. Often stakeholders will have to prioritize the economic and environmental indicators based on the project objectives. The study presents a methodological framework to compare economic and environmental impacts to benchmark sustainable transport construction projects. Through findings, the study aims to inform focus areas and key stages of infrastructure projects to benchmark sustainable performance. Process-based emission and cost estimation models are presented with an AHP based weighting factor that enables prioritization of emissions and costs based on project scopes and objectives. Using a case study, results are represented to validate the framework and methodology. Concrete and steel are identified as the main materials that contribute to total carbon emissions, while soil and gravel are responsible for the highest costs. Electricity consumption is discovered as the major fuel type contributing to carbon emissions. Concrete and dump trucks are discovered as the top two sources of emissions and costs, respectively. Scenario analyses revealed that the choice of equipment significantly affects the project’s emissions and costs. The application of sustainable materials can significantly reduce emissions and cost. The use of the case study approach results in a lack of generalizability. However, the same methodology and process can be adopted for the sustainable benchmarking of different projects. Researchers are encouraged to investigate processes to automate sustainable benchmarking of transport infrastructure construction projects. The study is one of the first attempts to compare cost and environmental impacts using a systematic methodology of transportation infrastructure construction projects.

1. Introduction

With the introduction of smart technologies and smart cities concepts, there is rapid development across the globe in several industries, including building, manufacturing and production and information technology. In 2024, the USA is projected to be spending 107.7 bn USD for highway and street construction which will be significant growth from 2018 [1]. Despite the heavy growth in highways and roads, the sustainability of these projects is seldom considered. Effective sustainable infrastructure systems form the backbone of economic stability and effective mobility of a nation. Hence, Infrastructure development forms the foundation of the overall development of a city, region or country. Transportation infrastructure is one of the major types of infrastructure that includes but is not limited to roads, bridges, tunnels, airports and railway stations.
As compared to a decade ago, the current infrastructure designs consist of complex designs and sophisticated construction techniques, which complicate the life cycle management of the asset [2,3,4,5,6]. Typically, with the dynamic nature of construction and substantial material and equipment requirements, studies have exemplified that highway construction is responsible for significant material and energy consumption and waste generation [6,7,8,9,10,11,12,13,14]. These would contribute to several environmental emissions, such as carbon emissions, which contribute to global warming and other non-carbon emissions that contribute to other impacts, such as acidification and human toxic potentials. In addition, the downstream life-cycle stages are associated with numerous environmental burdens due to the frequency of operations and maintenance. Often these environmental impacts are subjected to public criticism, and therefore, the designers and the investors are keen on producing designs with minimum environmental impacts.
Life Cycle Assessment has been considered as one of the well-known methodologies that can analyse environmental impacts of product or process from a whole-life cycle perspective [7,15,16]. ISO 14040 and ISO 14044 are the two major international standards that describe the systematic usage and directions of undertaking a comprehensive LCA study [17,18]. Even though considering the whole life cycle is the most optimum option, several studies have considered certain life cycle stages such as cradle-to-gate to highlight the significance of short-term impacts [7,19]. Therefore, the selection of the proper system boundary according to ISO14040 and ISO14044 is a critical component in an emission study. Despite the enormous drive towards environmental savings, economic benefits remain the preliminary goal of major construction stakeholders and will continue to be one of the major driving forces of the industry. Thus, the majority of the developed countries and some of the fast-paced developing countries embrace the common issue of maintaining a balance between economic and environmental benefits of a construction project [16,20,21,22,23]. Especially for transport infrastructure projects with huge capital investments, careful planning of all life cycle stages is crucial for its successful completion and management throughout its lifecycle. Comparison of life cycle savings is crucial in order to obtain a realistic understanding of the overall benefits of the design. Several studies have highlighted that life cycle decision making would improve the focus towards system preservation and sustainability of future budgets and better management of infrastructure assets [24,25,26]. However, a handful of studies have emphasised that the preliminary designs, procurement and construction methods significantly influence the total economic and environmental benefits of a project life cycle [27,28,29,30,31]. Particularly, the construction stage and material manufacturing impacts are either ignored or approximated due to heavy cost implications associated with changing the construction practices and methods initially agreed upon during the design stage [32,33,34]. The majority of construction stage emission studies have considered material production and construction stage impacts as one because both material and construction stage sections are made during the design stage of a project [5,35,36]. Therefore, the construction stage is often referred to as both the material manufacture and construction stage. Construction contractors are often hesitant to adopt changes that could improve the environmental benefits, thereby leading to sustainability benefits. Therefore, it is essential to explore areas of improvement within the construction stage to minimize construction stage impacts without adversely compromising budgets.
In the case of stakeholders in rapidly developing countries, an optimised design plan with maximum environmental benefits would provide cutting-edge opportunities without exceeding the budget limits. Therefore, such a decision-making framework at the initial decision-making stages would highly influence the sustainable outcome of the transportation infrastructure design. Therefore, the current study aims to develop a detailed methodological framework that can inform the decision makers to optimize the cost and carbon emission savings from the construction stage of a transportation infrastructure project. A case study of a highway construction project in Guanghan City, Sichuan Province, China, to demonstrate the emission and cost comparison. Scenario analysis is also conducted to investigate the effect of various variables on the total economic and environmental impact.

2. Background

In comparison to a building, transportation infrastructure has fundamental features that can lead to different environmental impact characteristics [37,38,39]. Due to the large scale, the construction of transportation infrastructure can cause much broader influences to the whole environment, such as surface/groundwater pollution, habitat fragmentation, and soil erosion [40,41,42]. As the material consumptions such as aggregates, asphalt and other raw materials are enormous, increasing the use of recycled materials has also been researched as a widely accepted solution [43,44,45,46]. Several other studies have concentrated on sustainable materials usage in road construction projects [47,48]. These studies have largely utilised waste materials and promoted the reduction of virgin material usage in road construction. Due to its large scale, transportation infrastructure construction can also cause significant economic impacts on a country or a region’s economy [2,37,49]. These impacts include travel time/cost impacts, access impacts, spending impacts and other economic impacts. There were various methods and models proposed to evaluate its economic impacts.
Numerous studies have made attempts to estimate and compare environmental impacts associated with the construction of infrastructure projects. One study estimated the environmental impacts of a highway using a 20-year life cycle. The results indicated material usage and maintenance stages are responsible for the highest energy consumption [50]. Another study used an energy-based hybrid life cycle assessment (LCA) model to assess the environmental impacts of road construction and usage [51]. The results indicated that the construction process is initially the most important phase and needs to be thoroughly considered to benchmark the life cycle benefits. Another study developed an information management system called CO2NSTRUCT to evaluate greenhouse gas emissions (GHG) from a life cycle perspective [2]. The results indicated that earthwork during construction is responsible for the majority of the emissions. However, the study did not consider cost implications and hence did not provide feasible options to optimise both benefits. A similar study analysed GHG emissions from road construction using different staging approaches and found out minimising traffic disruption could lead to minimising GHG emissions [52]. These studies have highlighted the importance of estimating and comparing GHG emissions during the construction stage of a road infrastructure project. However, studies have seldom considered both cost and emissions to optimise the most feasible option. This task is critical as the contractors seek opportunities to minimise cost repercussions through the introduction of environmentally sustainable solutions. Maintaining a balance between cost and environmental savings is vital for promoting the uptake of sustainable practices.
Only a handful of studies have considered both costs and carbon emissions to compare the most feasible and sustainable option to benchmark construction stage environmental impacts. Integration of LCA and LCCA can provide more practical decisions making tools to promote the sustainability of transportation infrastructure projects [53]. Lee et al. [54] proposed a rating system for assessing the environmental and economic sustainability of highway designs. Their system considered energy consumption, greenhouse gas emissions and life-cycle cost. To quantify the impacts, they incorporated standardised measurement methods such as life-cycle assessment (LCA) and life-cycle cost analysis (LCCA) in the system. Another study used a multi-objective optimisation to observe the relationship between environmental impacts with time and cost associated with highway construction projects [55]. The study limited their environmental emissions scope to GHG emissions due to the unavailability of data. The results indicated a positive relationship between cost and time, while GHG emissions and cost revealed a low variation. However, the study did not observe any cost-effective emission reduction options in highway construction projects. A different study developed a sustainable pavement management plan using trade-offs such as user costs and GHG emissions [56]. The results observed a positive relationship between the costs, GHG emissions and road condition improvements. However, none of the studies conducted comparison studies at the construction stage to efficiently manage the parameters such as equipment and transportation vehicles to optimise environmental and cost benefits. Moreover, the review of previous studies highlighted the importance of comprehensive assessment, comparison and analysis of construction stage environmental impacts.
The literature review observed that majority of the research studies have considered only emissions and often only carbon emissions. Despite the importance of cost for a successful completion of a project, it is not comprehensively assessed and considered in transportation infrastructure projects. However, studies have seldom considered both carbon emissions and costs to observe the cost-efficient options to minimise environmental burdens at the construction stage of an infrastructure project. Often contractors are reluctant to change the construction practice and sequence to maximise the environmental benefits due to the associated cost implications. Therefore, comparing both environmental and economic aspects during the construction stage is critical to benchmark sustainable construction and ultimately leading to sustainable decision making. Thus, there is a contemporary requirement to analyse both cost and emissions together to clearly understand the focus areas in sustainable construction.

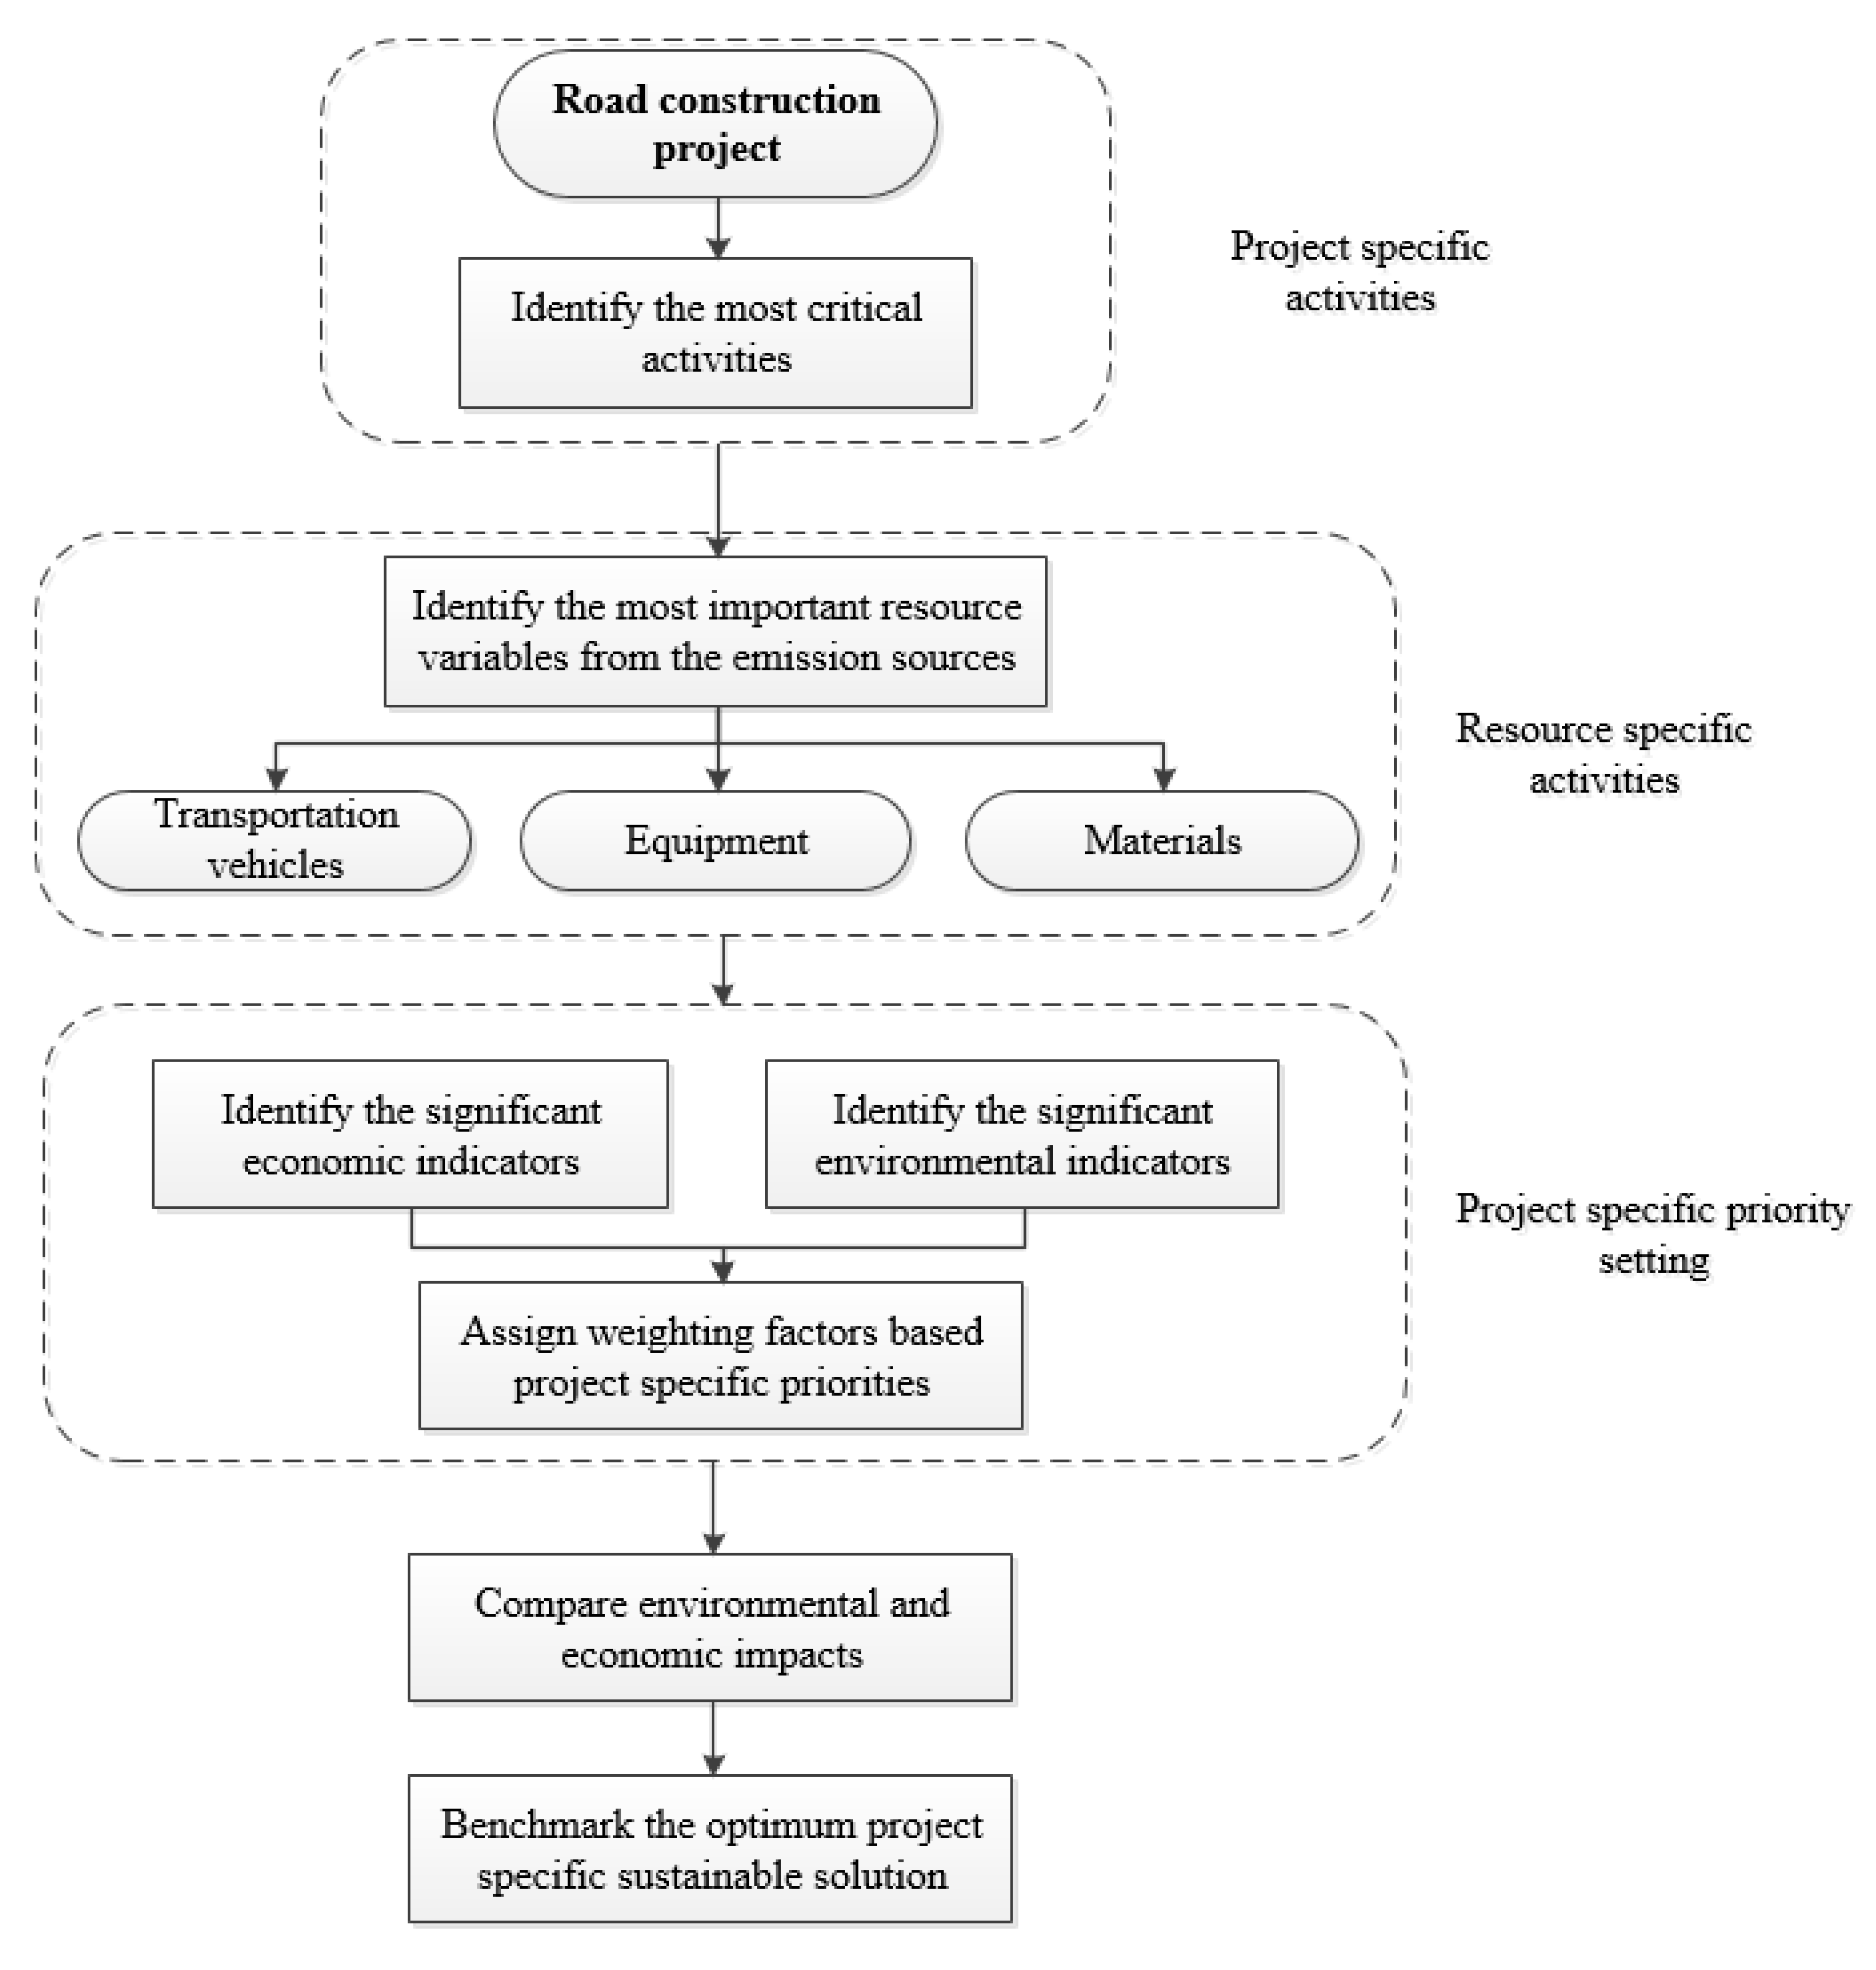
3. Development of a Methodological Framework
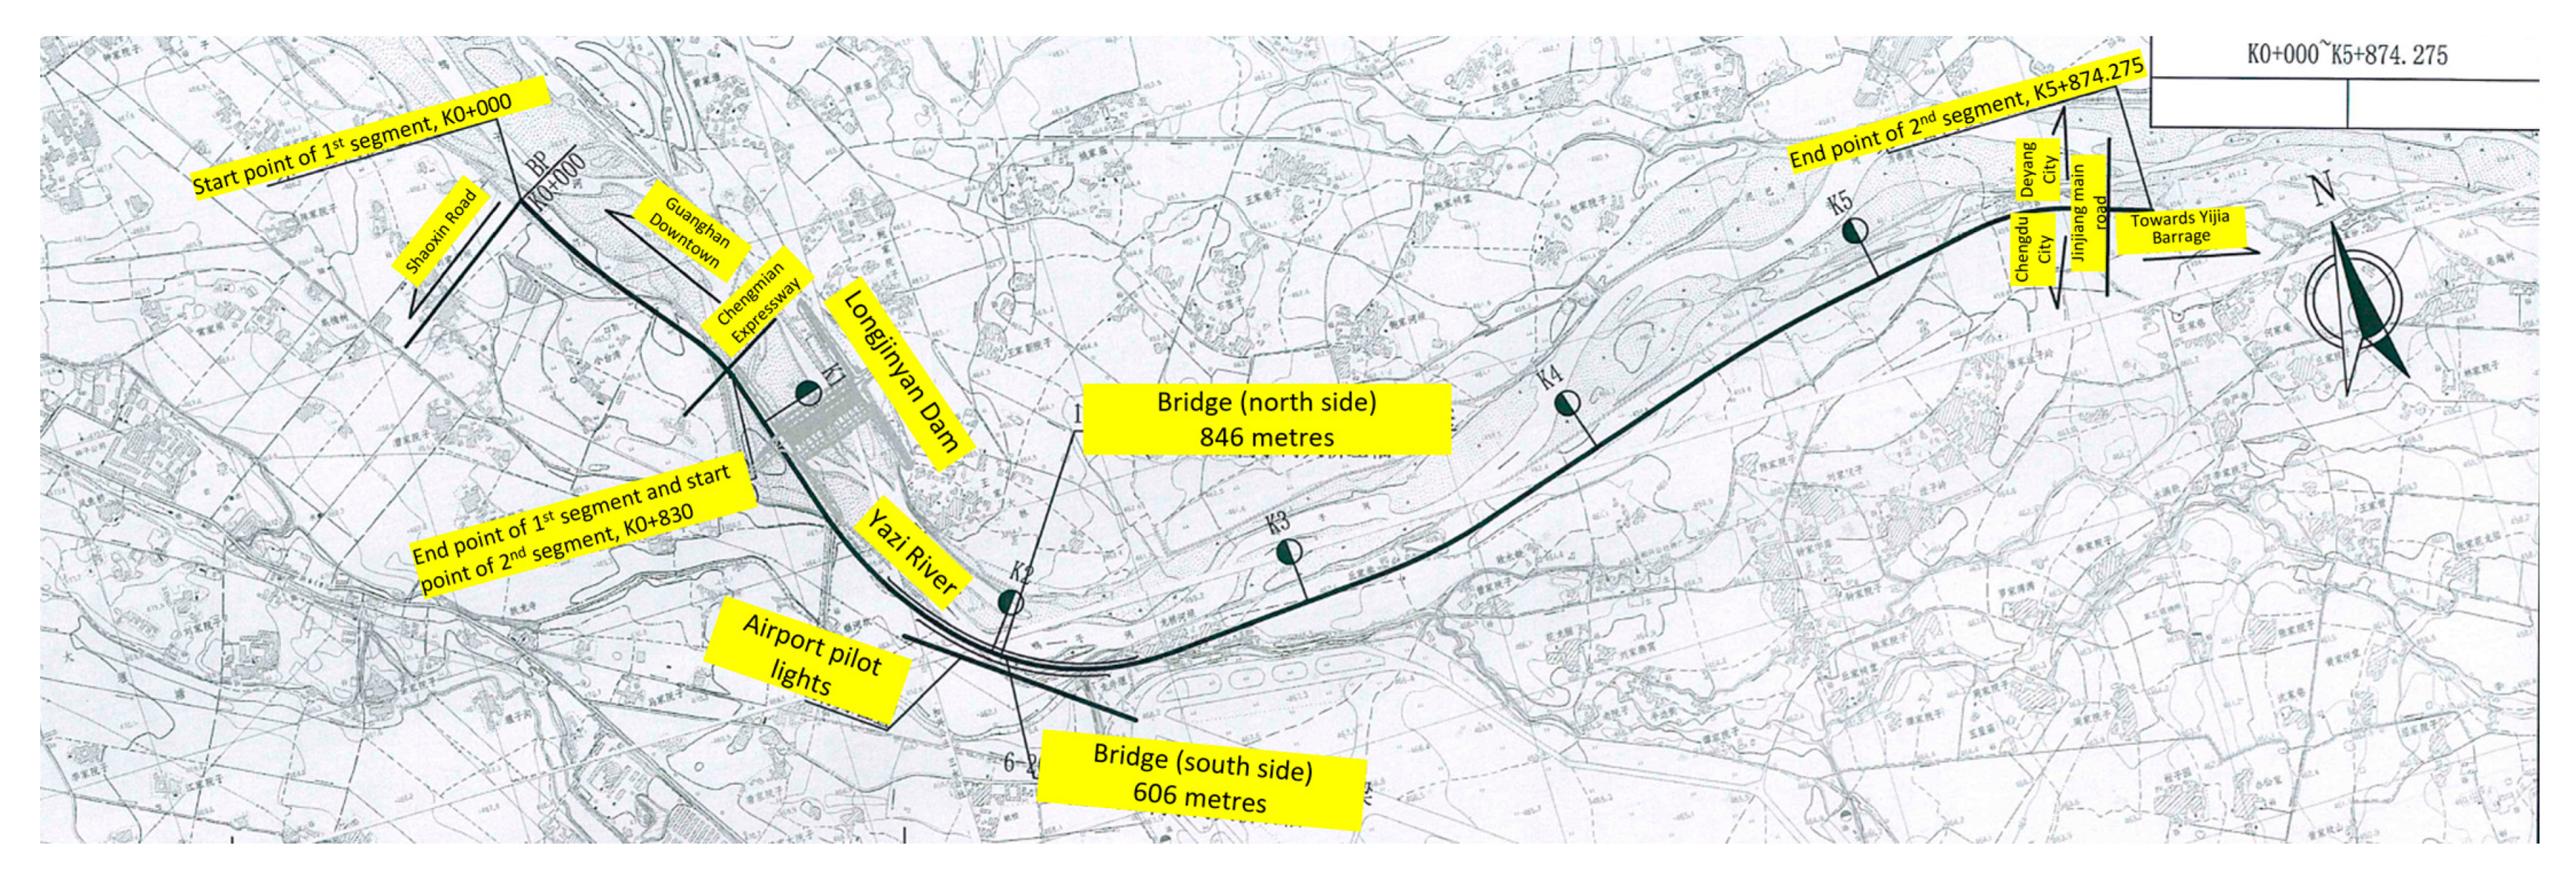
Unlike other construction projects, road construction projects are unique due to the dynamic nature of the project. As the total distance of the road increases, resource management becomes more complex, especially in areas related to material delivery and equipment transportation. In order to assess and compare carbon emissions and construction cost associated with a road construction project, the following systematic methodology is suggested as in Figure 1. The first step of the framework involves the identification of the significant construction activities and categorize the resource variables, including transportation, materials and equipment, associated with each activity to enable the life cycle assessment. The next step involves the identification of significant economic and environmental indicators based on the project objective and scope. These important indicators should be finalised based on expert independent opinions. Based on the identified indicators, the cost and environmental emissions can be determined using process-specific models. To include site and project-specific importance into the evaluation, the framework suggests the conversion of the raw results to weighted cost and emissions using case-specific weighting factors. The use of weighting factors would enable the prioritisation of each cost or emission component for each project. This is important because different projects would prioritise different costs aspects, and environmental aspects and prioritising weighting factors would allow relative significance, thus enabling effective comparison. Eventually, the results benchmarking can be achieved by investigating the effect of the different variables in the assessment. This of often undertaken through a scenario analysis or sensitivity analysis [14,30,52].

4. Case Study

The selected case study is a highway project that is located in the east suburb area of Guanghan City, Sichuan Province, China. According to the prediction of future traffic volume, 15,850 cars per day is projected, and therefore, the project is designed as a first-class road. The design speed of the road is 60 km/h. The length of the highway is around 5874 m, and the width of the carriageway is 23 m. The road consists of 4 lanes, which is 3.5 m, respectively. The pavement material is asphalt concrete. As depicted in Figure 2, this project was divided into two contract segments. With a length of 830 m, the first segment underpass the Chengmian Expressway through the existing bridge of the expressway. The second segment is around 5044 m long. The project is next to Guanghan airport. The route selection was executed based on the operation and maintenance influence of pilot lights at the airport. Thus, a part of the second segment was designed as a bridge along the riverbank of the Yazi River. The north side of the bridge is 846 m long; meanwhile, the south side is 606 m. There were seven culverts placed to drain stormwater. Prefabricated pre-stressed concrete simply supported box girder, and a T-beam girder was installed to support the deck.
The duration of the construction project was 12 months. The soil dumping site was situated at 65 m south of the K4 + 000 point of the road, and it covered an area of 22,800 square m. The bridge girder prefabrication plant was located at 820 m south of the K4 + 900 m points of the road, and it covered 23,333 square m. The cement stabilised soil mixing station was erected at 820 m south of the K4 + 700 m of the road, and it covered 10,000 m2. Other materials, such as asphalt concrete, sand, gravel, cement, asphalt etc., were transported from different local vendors. The average transportation distances of primary materials are listed in Table 1.
Based on the construction type and scope, the project is categorised into seven key stages. Analysis based on these stages would provide a better understanding of the distribution of the results and facilitate better benchmarking of cost and carbon emissions. Table 2 illustrates the total actual costs associated with each construction stage in the case study. The following section will critically investigate and compare carbon emissions and costs in each stage.

5. Research Methodology

5.1. Scope and Quantities Approach Selection

The selection of the major environmental and economic indicators is vital as it provides an important interpretation for the key stakeholder. Despite analysis of whole life cycle analysis (LCA) and life cycle cost analysis (LCCA) would be considered as a comprehensive approach, stakeholders such as contractors would be more interested in certain life cycle stages. Therefore, the identification of these key life cycle stages is important. For the current case study, the main contractor was consulted, and according to their point of view, greenhouse gas (GHG) is considered as the major environmental indicator, while construction cost is regarded as the most important economic indicator. Therefore, the scope of the study is selected to incorporate GHG emissions and construction cost as the environmental and economic indicators, respectively. However, according to the developed framework, other environmental and economic indicators throughout the project’s life cycle can be selected based on the scope and objective of the study.

5.2. System Boundary for the Study

The system boundary holds a key part of an LCA and LCCA analysis as it defines the scope of the analysis study. A complete LCA study should incorporate all the life cycle stages (cradle-to-gate) of the product or process to obtain a clear understanding of the life cycle effects [57,58]. Despite this universally accepted definition, several studies have considered cradle-to-gate system boundaries to suit the scope and objective of the study [35,59,60,61]. A building life cycle typically includes material extraction, construction, use and maintenance and end-of-life stages [62,63,64,65,66]. Subsequently, to match the objective of analysing the environmental and economic effects of highway construction, GHG emissions and construction cost from cradle-to-gate system boundary are considered for the current study. Under this system boundary, GHG emissions and costs associated with materials, construction equipment (machines), transport vehicles are considered for the current case study.

5.3. Functional Units for the Study

The functional unit is an important variable that defines the accuracy of an LCA or LCCA study [8,15,33,67]. Studies have shown that inaccurate system boundaries can lead to distorted results [15,19,32,68,69,70,71,72]. Therefore, a kilogram of emissions per length of road construction (kgemissions-eq/m) is considered for the functional unit for GHG emissions and Chinese Yuan per length of road construction (RMB/m).

5.4. Models for Carbon Emissions

5.4.1. Emissions from Materials (Em)

Embodied carbon emissions from materials can be estimated in tonsCO2-eq based on the following equation, where em,i is the carbon embodied emission factor for the ith material in kgCO2-eq/kg, Qm,i is the quantity of the ith material in kg and wm,i is the waste factor considering the waste generation during production, transportation and construction.
E m = e m , i   ×   Q m , i ( 1 + w m , i ) 1000

5.4.2. Emissions from Construction Equipment (Eeq)

Emissions from construction equipment are due to fossil fuel combustion or electricity consumption. The construction equipment idle and operation stage should be considered separately as the fuel consumption is different. Previous studies have shown that idling fuel consumptions and emission rates are different from operating levels [73]. Therefore, the following equation can be used to estimate emissions from equipment usage (Eeq) in kg-emissions-eq:
( E e q ) f f = ( e 1 e q , j × Q 1 e q , j   ×   h 1 + e 2 e q , j   ×   Q 2 e q , j   ×   h 2 ) 1000 ( E e q ) e l = ( f e q , j   ×   P 1 e q , j   ×   h 1 + P 2 e q , j   ×   e e q , j   ×   h 2 ) 1000
where ( E e q ) f f and ( E e q ) e l represent emissions due to fossil fuel and electricity, respectively. Q 1 e q , j and Q 2 e q , j are fuel consumption rates in L/h for operation and idle states, respectively. P 1 e q , j and P 2 e q , j are the power of the electric equipment in kW, respectively. e 1 e q , j and e 2 e q , j are the operation and idle emission factors for fossil fuel in kg-emissions-eq/litre.

5.4.3. Emission Due to Transportation Vehicles

Emissions from transport vehicles often depend on the travel distance and weight of the truck, including the material weight transporting. Therefore, the following equation can be used to determine the emissions from transportation vehicles (ET). wk is the total weight of the truck k including the material weight in tons, ek is the transportation emission factor for the kth vehicle kg-emissions-eq/L, ρ k is the fuel consumption rate of the kth vehicle in L/kg-km, and d is the total one-way distance travelled in km.
E T = ( w k   ×   e k   ×   d   ×   ρ k ) 1000

5.5. Models for Construction Cost Estimation

Similar to carbon emissions, cost calculation can also be divided into four major components of material, equipment, transportation and labour. These cost components include the major costs associated with the construction of the road project. The total construction cost (Ctot) is the sum of all the resource costs ( C e q and C t ) and procurement costs ( C m ) and labour costs ( C l ). These can be represented in the following equation.
C t o t = C m + C e q + C t + C l

5.6. Weighting Factor (Wi,j) Determination

Based on the location, sustainability requirements, scope and objectives of the project, the priority for economic and environmental savings might change. These priorities are often project-specific and should be based on expert opinions who are involved in the corresponding project. Therefore, applying a weighting factor would be the most prominent methodology to prioritize these project-specific objectives [16,74]. Independent expert opinions should be obtained who have extensive similar project experience during the exercise of obtaining the weighting factors. The total weighted construction cost or carbon emissions (Cw) can be highlighted in the following equation. Therefore, Cw here represents weighted construction cost calculated from total construction cost (Ctot) or the total weighted sum of emissions from materials (Em), Equipment (Eeq) and transport vehicles (ET), respectively. α a is the obtained weighting factor for ath cost component or emission component, and Ca is the corresponding cost or emission component considered.
( C w ) = α a   ×   C a
The key steps associated with the development of weighting factors for each cost and carbon emission component are based on the Analytical Hierarchy Process (AHP). AHP is an effective decision method for obtaining such weighting factors when there is no correlation between the variables [71,74,75,76]. Pairwise comparison specified in the AHP process is utilised to determine the weighting factors for each component in construction cost and carbon emission.
Step 1—Consult project-specific consultants and obtain relative significance by conducting a pairwise comparison. These project-specific consultants are independent experts who have more than 10 years of construction project experience and experience related to sustainability in construction projects. These experts are recruited based on their local experience and understanding of the sustainable priorities of similar projects. The weighting range is set from 1 to 4, where 1 represents “equally important” and 4 represents “4 times important.” This criterion is provided to maintain the maximum range for the responses. Obtain the average for each cell.
Step 2—Develop pairwise comparison matrices for both cost and carbon emissions, considering the relative significance between each variable. The dimensions of the matrix are based on the number of variables considered. For the current study, a pairwise comparison matrix for carbon emissions and construction cost is a 3 × 3 and 4 × 4 matrix. Table 3 highlights the pairwise matrix for determining the weighting factors for each variable.
Step 3—Each cell value is then divided by the column total containing the corresponding cell, and the row total for each variable is divided by the total number of variables to obtain the weighting factor for each variable.
Step 4—Once the factors are obtained, it is necessary to check for consistency of the obtained weighting factors. This is done by comparing the Consistency Index (CI) for each matrix. CI is obtained by the following formula. If the obtained CI is less than the tolerance level of 10%, then the results obtained can be deemed consistent.
CI = (∑ (column total for each variable ∗ weighting factor) − [number of variables]/[number of variables] − 1)
For the current case study,
CIcost = (4.28 − 4)/(4 − 1) = 9.33%
CIcarbon = (3.04 − 3)/(3 − 1) = 2%
Hence, the obtained weighting factors can be considered consistent as they are within the 10% tolerance limit.

6. Results and Discussion

6.1. Project-Level Carbon Emissions and Costs Comparison

The project-level carbon emissions and costs at each stage and component are listed in Table 4. The results indicated the highest cost for subgrade preparation, pavement and bridges and culverts construction. This is evident with the high material usage and equipment usage due to complex construction processes and steps involved. High material usage and excavation result in high transportation costs at the subgrade preparation stage. The highest material carbon emissions were recorded at the subgrade preparation stage (stage 2). On the other hand, the highest cost from construction equipment was recorded at the bridges and culverts construction stage (stage 4). This is due to high small diesel machine usage and expensive electric machinery usage for construction at that stage.
In contrast, the highest total carbon emissions were recorded in subgrade preparation (stage 2), bridges and culverts (stage 4) and safety facilities and pipelines installation (stage 6). Stage 6 illustrates high carbon emissions due to the high embodied carbon emission contributions from the used materials at that stage. On the contrary, carbon emissions due to construction equipment and transportation remain at a lower value at that stage.
The importance of analysing the project level can be clearly benchmarked from the results in the preceding sections. Designers and planners can concentrate heavily on optimizing stage 2 usage if they wish to minimize both carbon emissions and the cost of the project. If the objective is to benchmark and monitor carbon emissions at construction, stage 5 needs to be heavily considered, while stage 4 needs to be highlighted if the objective is to minimize the construction stage cost.

6.2. Carbon Emission and Cost Comparison from Each Component

6.2.1. Carbon Emissions and Cost from Materials

Once the project stage carbon emissions and costs are analysed, it is important to compare carbon emissions and costs at the construction activity level to identify the focus area to maximize the economic and environmental benefits. The corresponding carbon emissions and costs for different material types are listed in Table 5. The results indicate that soil and gravel are responsible for the highest cost, while steel is responsible for the highest carbon emissions as a material. In general, concrete and steel have recorded considerably high carbon emissions and costs mainly due to the high usage and high unit costs and carbon emissions. The significant material types with high costs and emissions can be identified from this comparison, and then project-level results can be compared with the stages with high results to benchmark sustainable options. Moreover, it is important to compare the possibility of the increase in cost as a result. Therefore, optimization algorithms should be introduced to benchmark both economic and environmental benefits [16]. Local availability of materials should also be considered in this case to maximize the benefits [16,31]. Cost reduction in materials can be focused on by considering optimizing the material usage for soil and gravel.

6.2.2. Carbon Emissions and Cost from Construction Equipment

Carbon emissions and cost comparisons for main equipment types are listed in Table 6. Drilling rigs account for the highest equipment cost, while small electric machines are responsible for the highest carbon emissions. Drilling rigs and rollers are the equipment types that can be focused on to minimise both carbon emissions and construction costs.
The carbon emissions for different fuel types are shown in Figure 3. Electricity is used to power some electrical equipment on-site and hence is considered a fuel type for this analysis. Surprisingly, electricity was recorded as the fuel type with the highest carbon emissions of 75% of the total. This is mainly due to the heavy usage of small electric machine usage and the high usage of huge equipment such as drilling rigs and cranes. These results indicate the necessity of improved project control and coordination to optimise machine usage and reduce idle times to achieve more cost and carbon emission benefits. Diesel is responsible for 25% of the total carbon emissions and is mainly due to the heavy fossil fuel-operated machine usage at different construction stages.

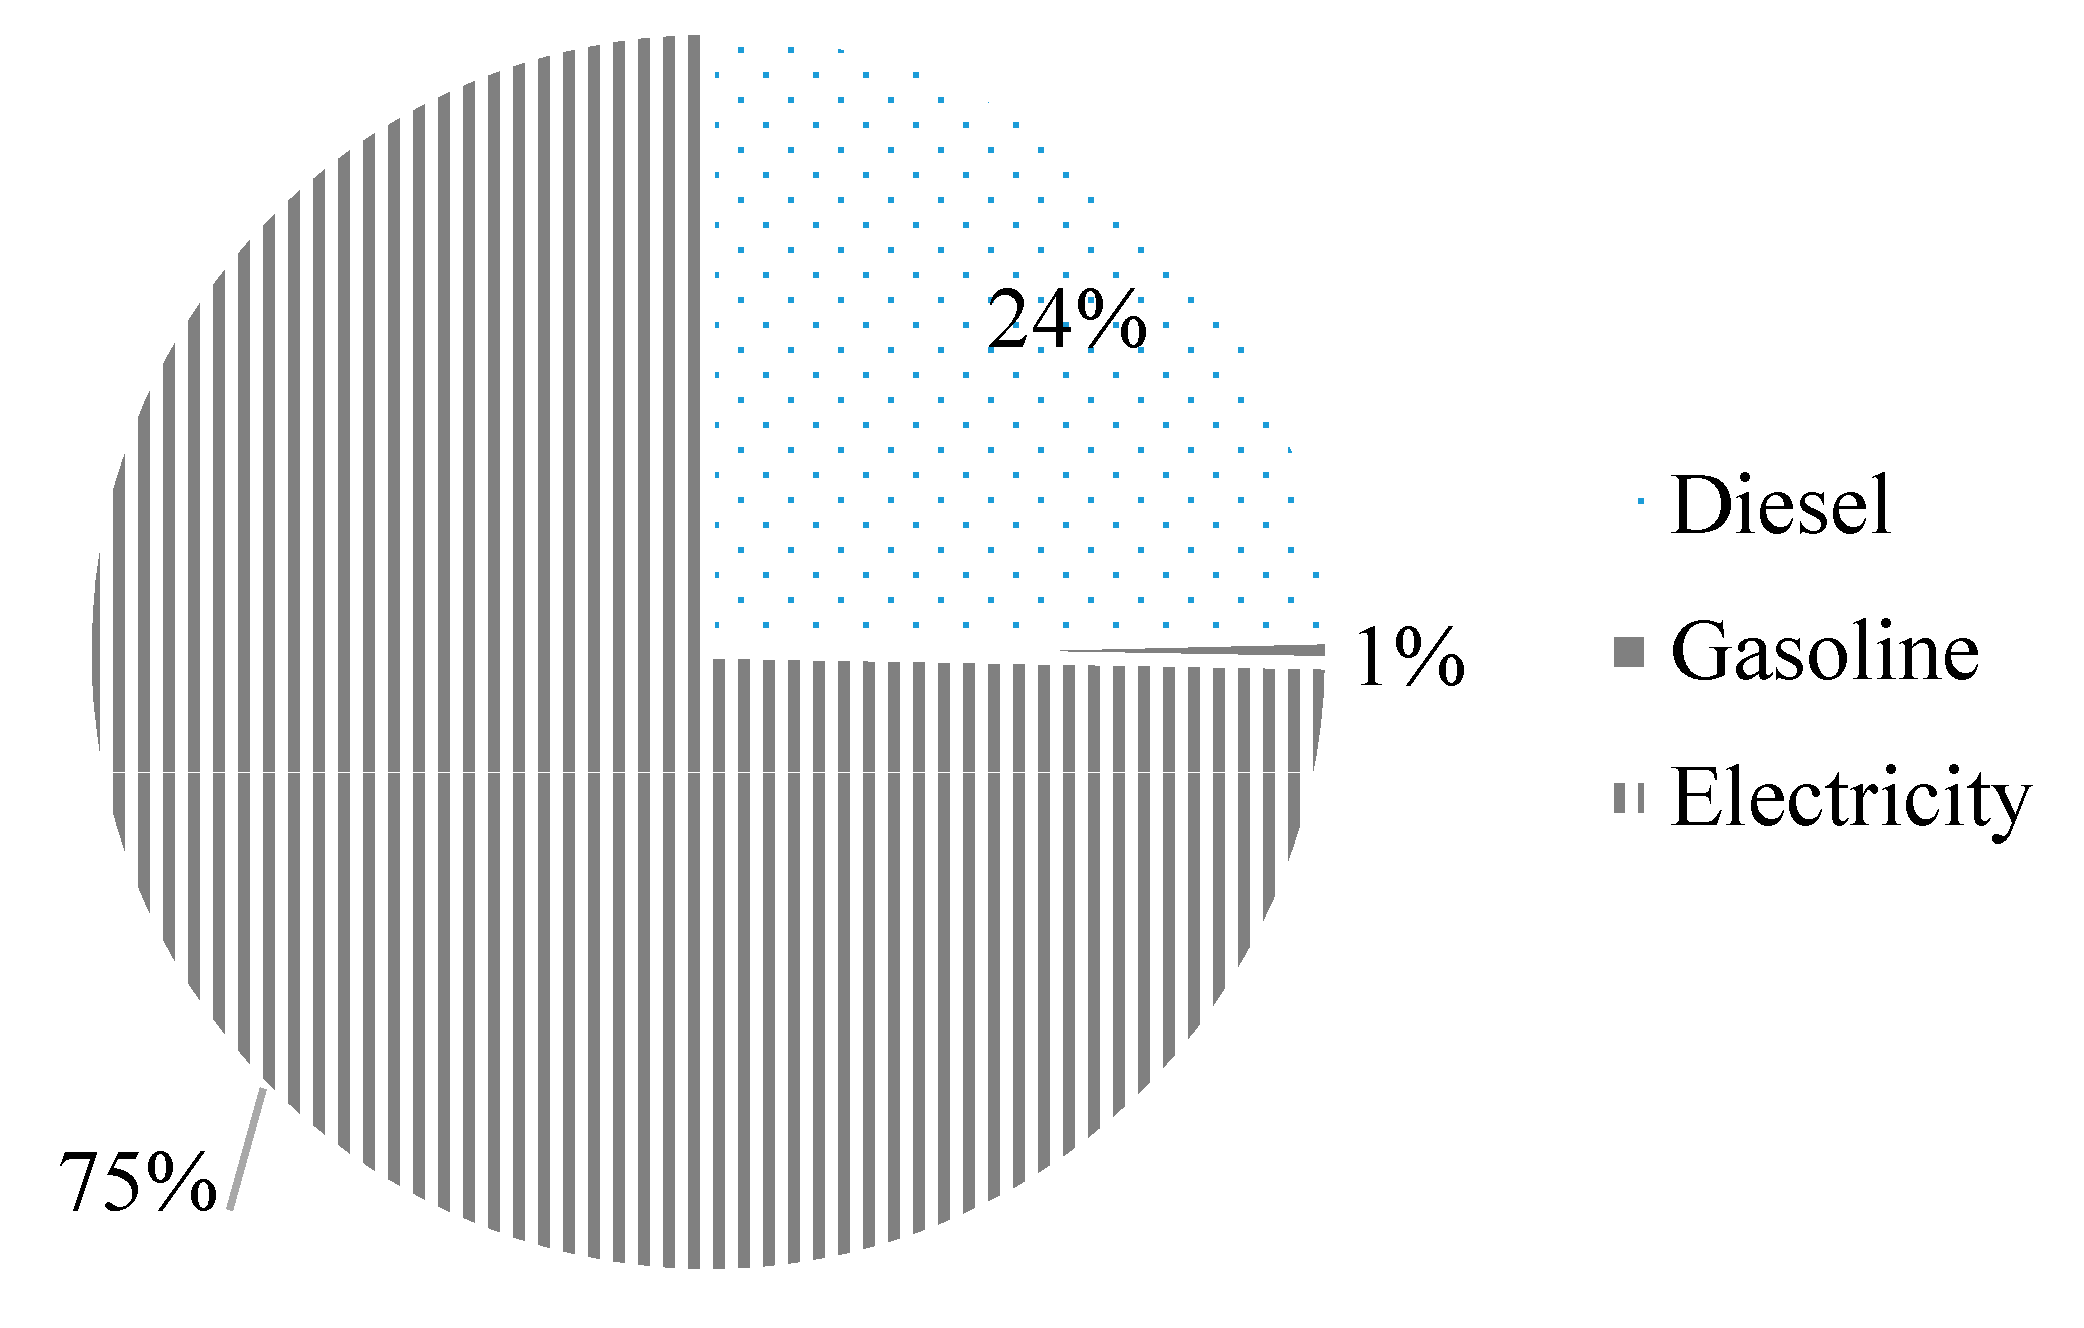
6.2.3. Carbon Emissions and Cost from Transportation Vehicles

The resulting carbon emissions and costs for different transport vehicle types are shown in Table 7. Concrete trucks contribute to the highest carbon emissions and the highest costs, respectively. In addition, 12 t dump trucks have also recorded significantly high carbon emissions and costs. This is mainly due to high soil dumping trips associated with the project. Despite the low travel distance (65 m for soil dumping and 820 m for concrete transportation), the high cost and carbon emissions indicate the focus areas in transport vehicles to improve carbon and cost savings. These effects are discussed in detail in the scenario analysis.

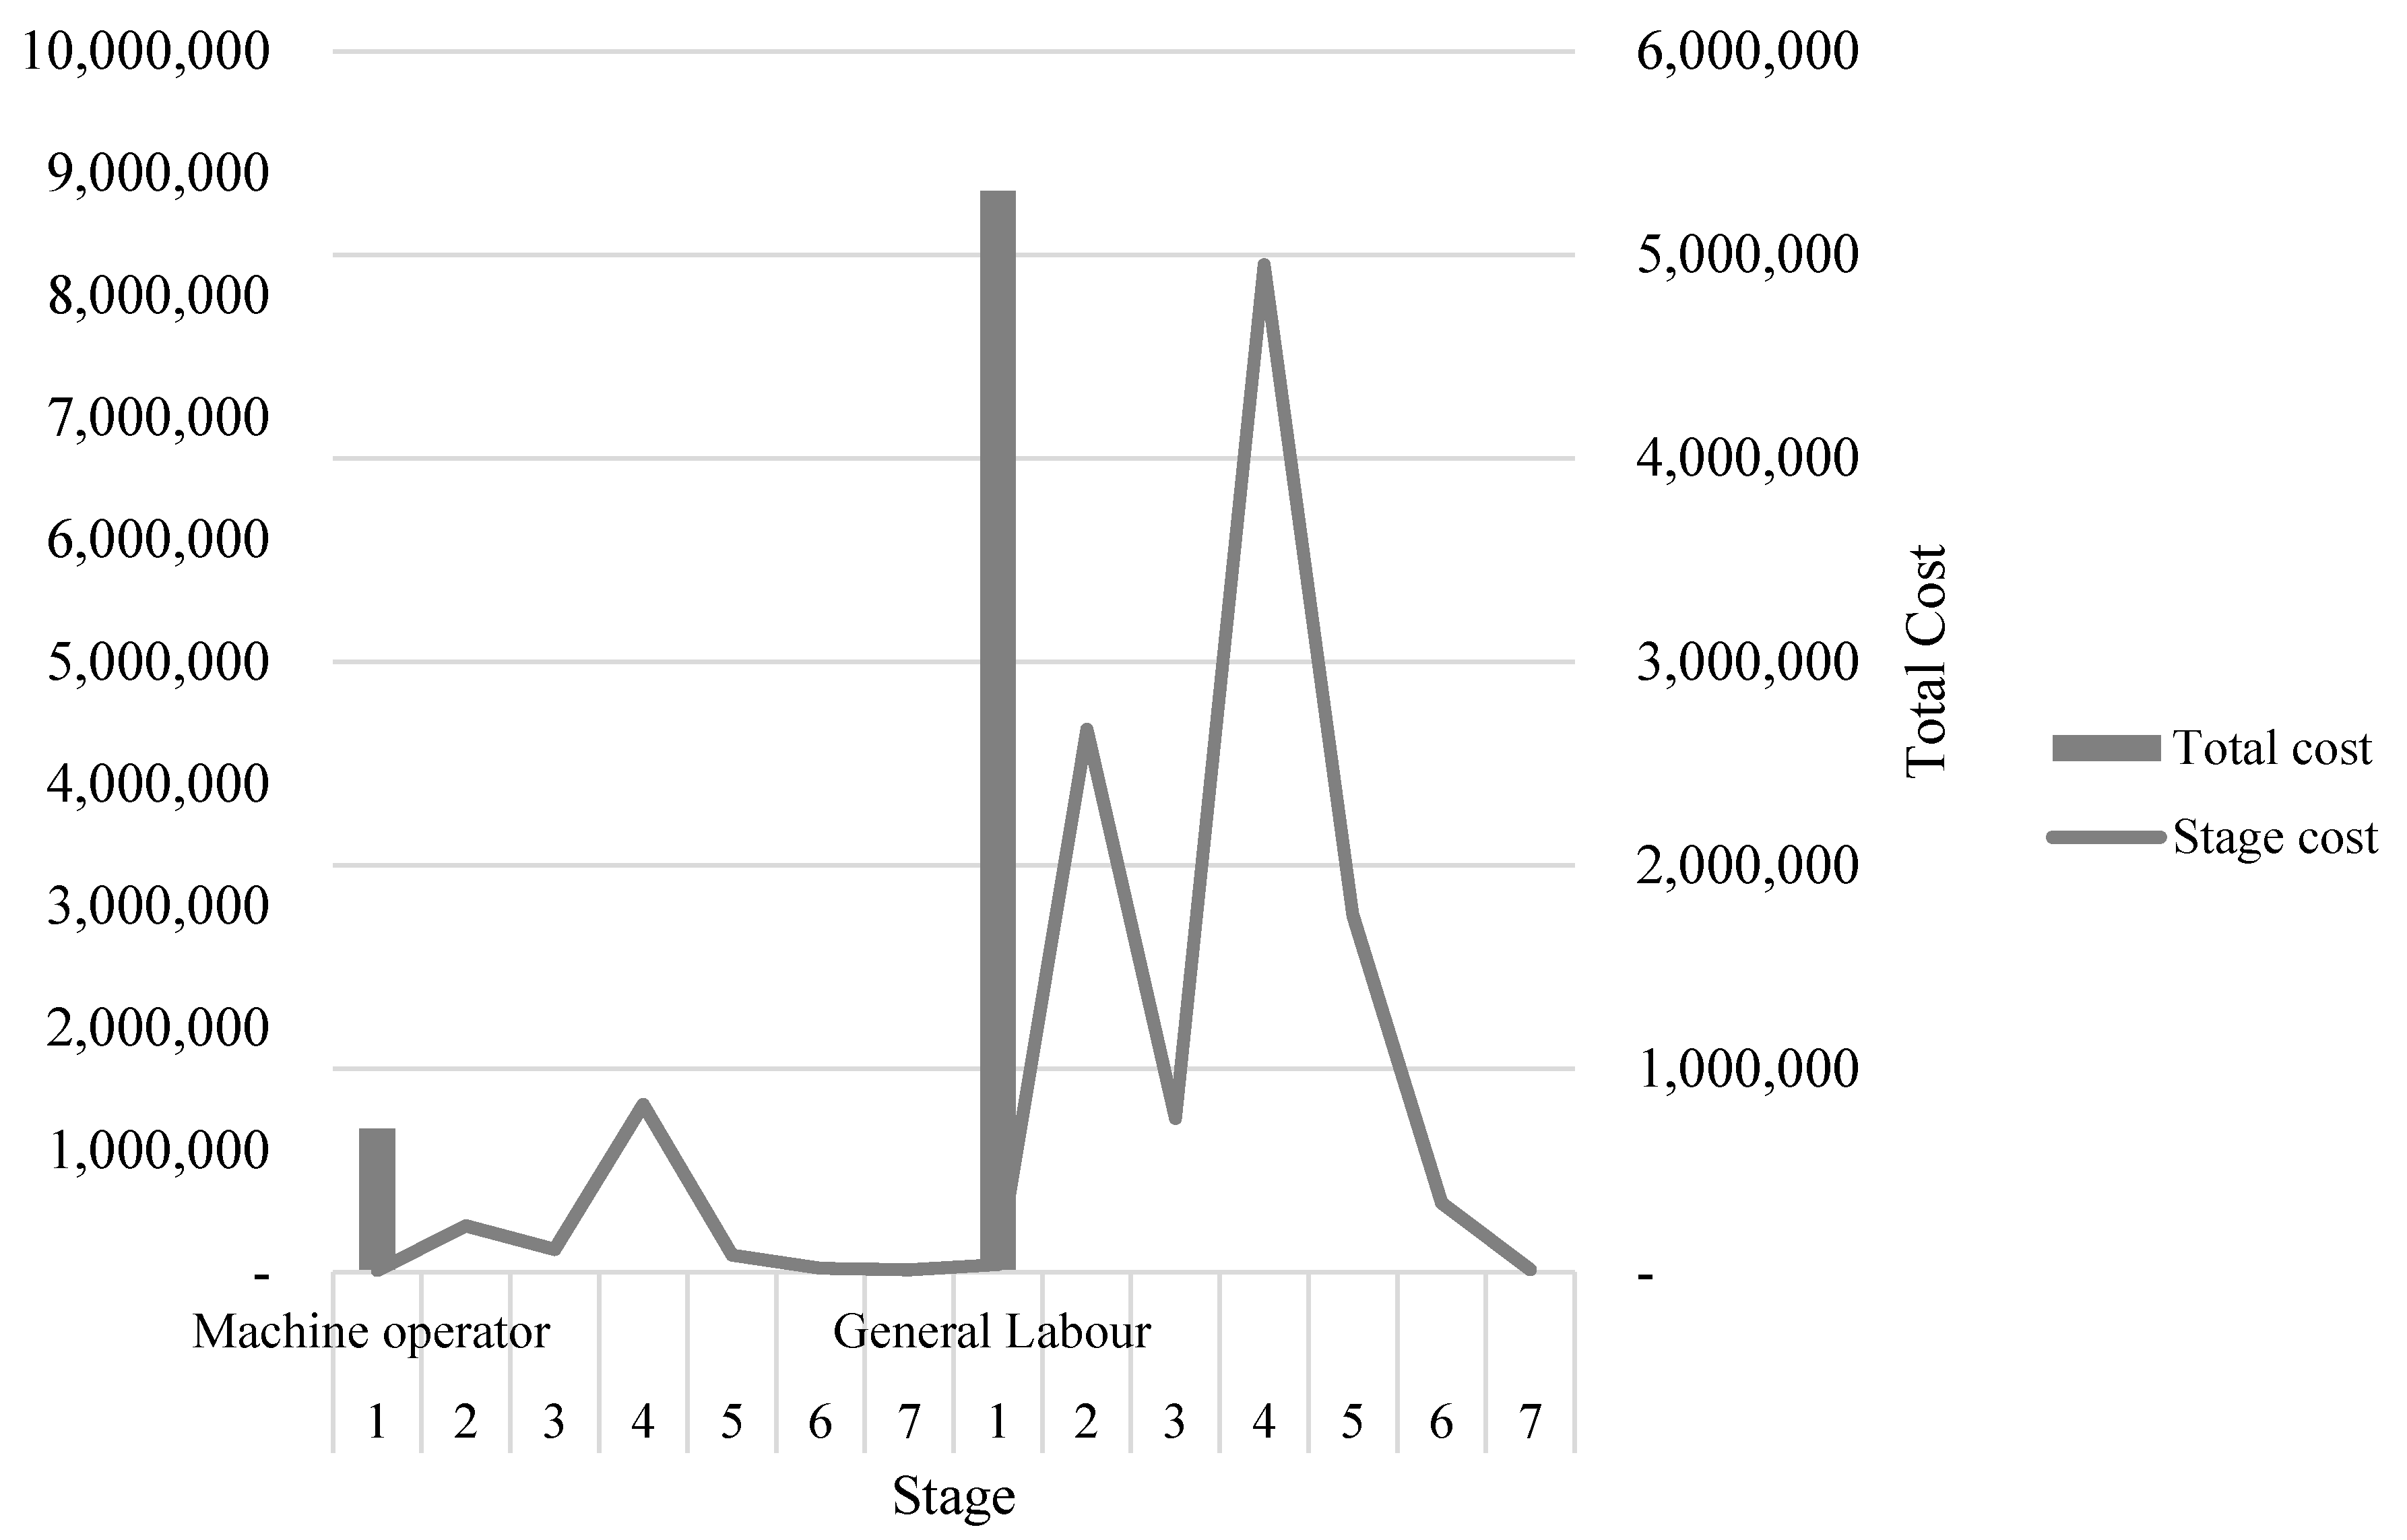
6.2.4. Cost of Labour

The cost of labour can be categorised into two main types of machine operators and general labourers based on their use. For the current case study, both machine operators and labourers were paid 43 RMB/day Figure 4 highlights the labour cost variation for general labour and machine operator at each construction stage. In the dual axis, the left axis corresponds to total cost, while the right axis corresponds to the stage cost in RMB. According to the results, machine operator cost is highest during bridges and culverts construction. This is related to the high usage of machines in handling pre-fabricated components and construction of complex components such as piles with the presence of water. Construction of bridges and culverts (Stage 4) also recorded the highest cost for general labour. In contrast, stages 2, 3 and 4 also highlighted considerably high general labour costs. This is evident as these stages represent heavy construction activities in the project.

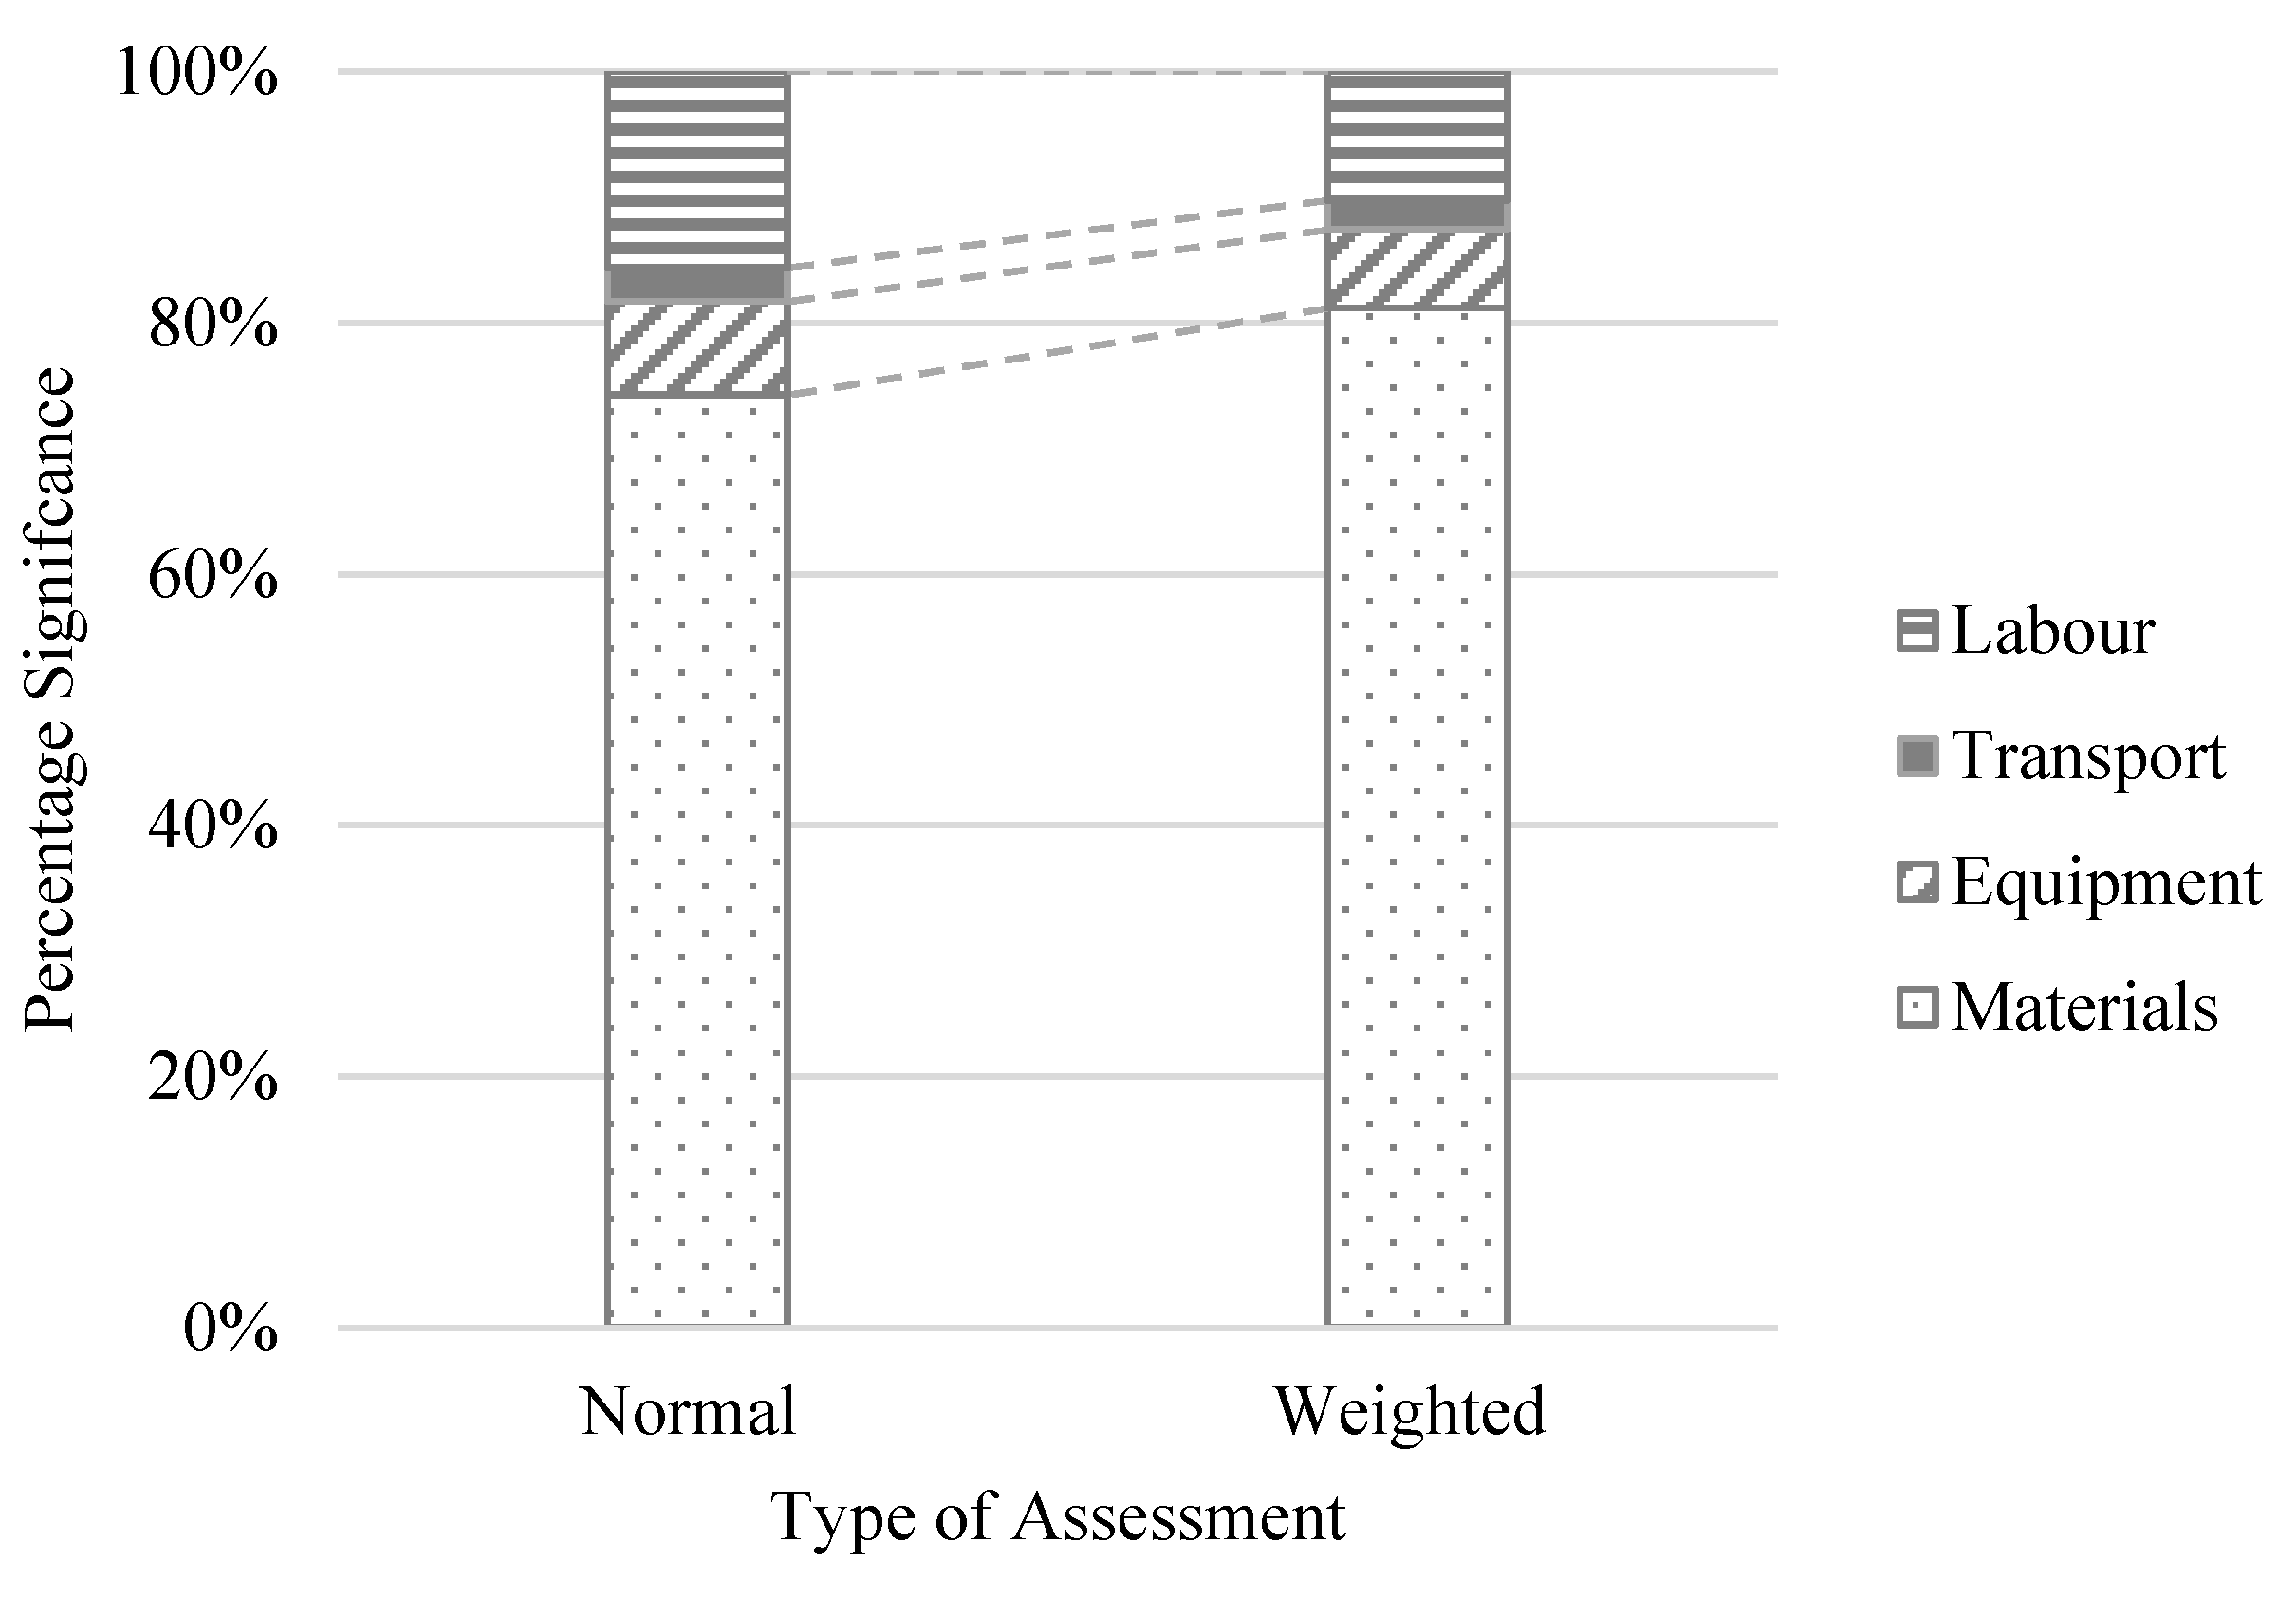
6.3. Weighted Results Comparison

The unweighted (normal) significance and weighted significance for cost and carbon emissions based on the obtained weighting factors are shown in Figure 5 and Figure 6. The results indicate that the relative significance of transportation emissions and equipment emissions increase considerably when weighted results are considered. The existing significance of 78.44% for materials reduced to 65.84%, while equipment and transportation emissions record an increase in the significance of 5.79% and 6.81%, respectively. This is mainly because the contractors and project managers are more persuaded towards controlling the on-site emissions while giving less importance to the embodied emissions from construction materials.
In contrast, the significance of the cost of materials increased by 6.94%, while equipment, transportation and labour recorded a reduction of 1.19%, 0.42% and 5.34%, respectively. This could be mainly because of the cheap labour rates and machine rates in China, which undoubtedly increases the significance of material costs. Moreover, more cost-controlling methods can be applied at both design and construction stages due to the large quantities used for construction. The weighted results provide a better understanding of the importance levels considered by different stakeholders on construction cost and carbon emissions at various construction stages.

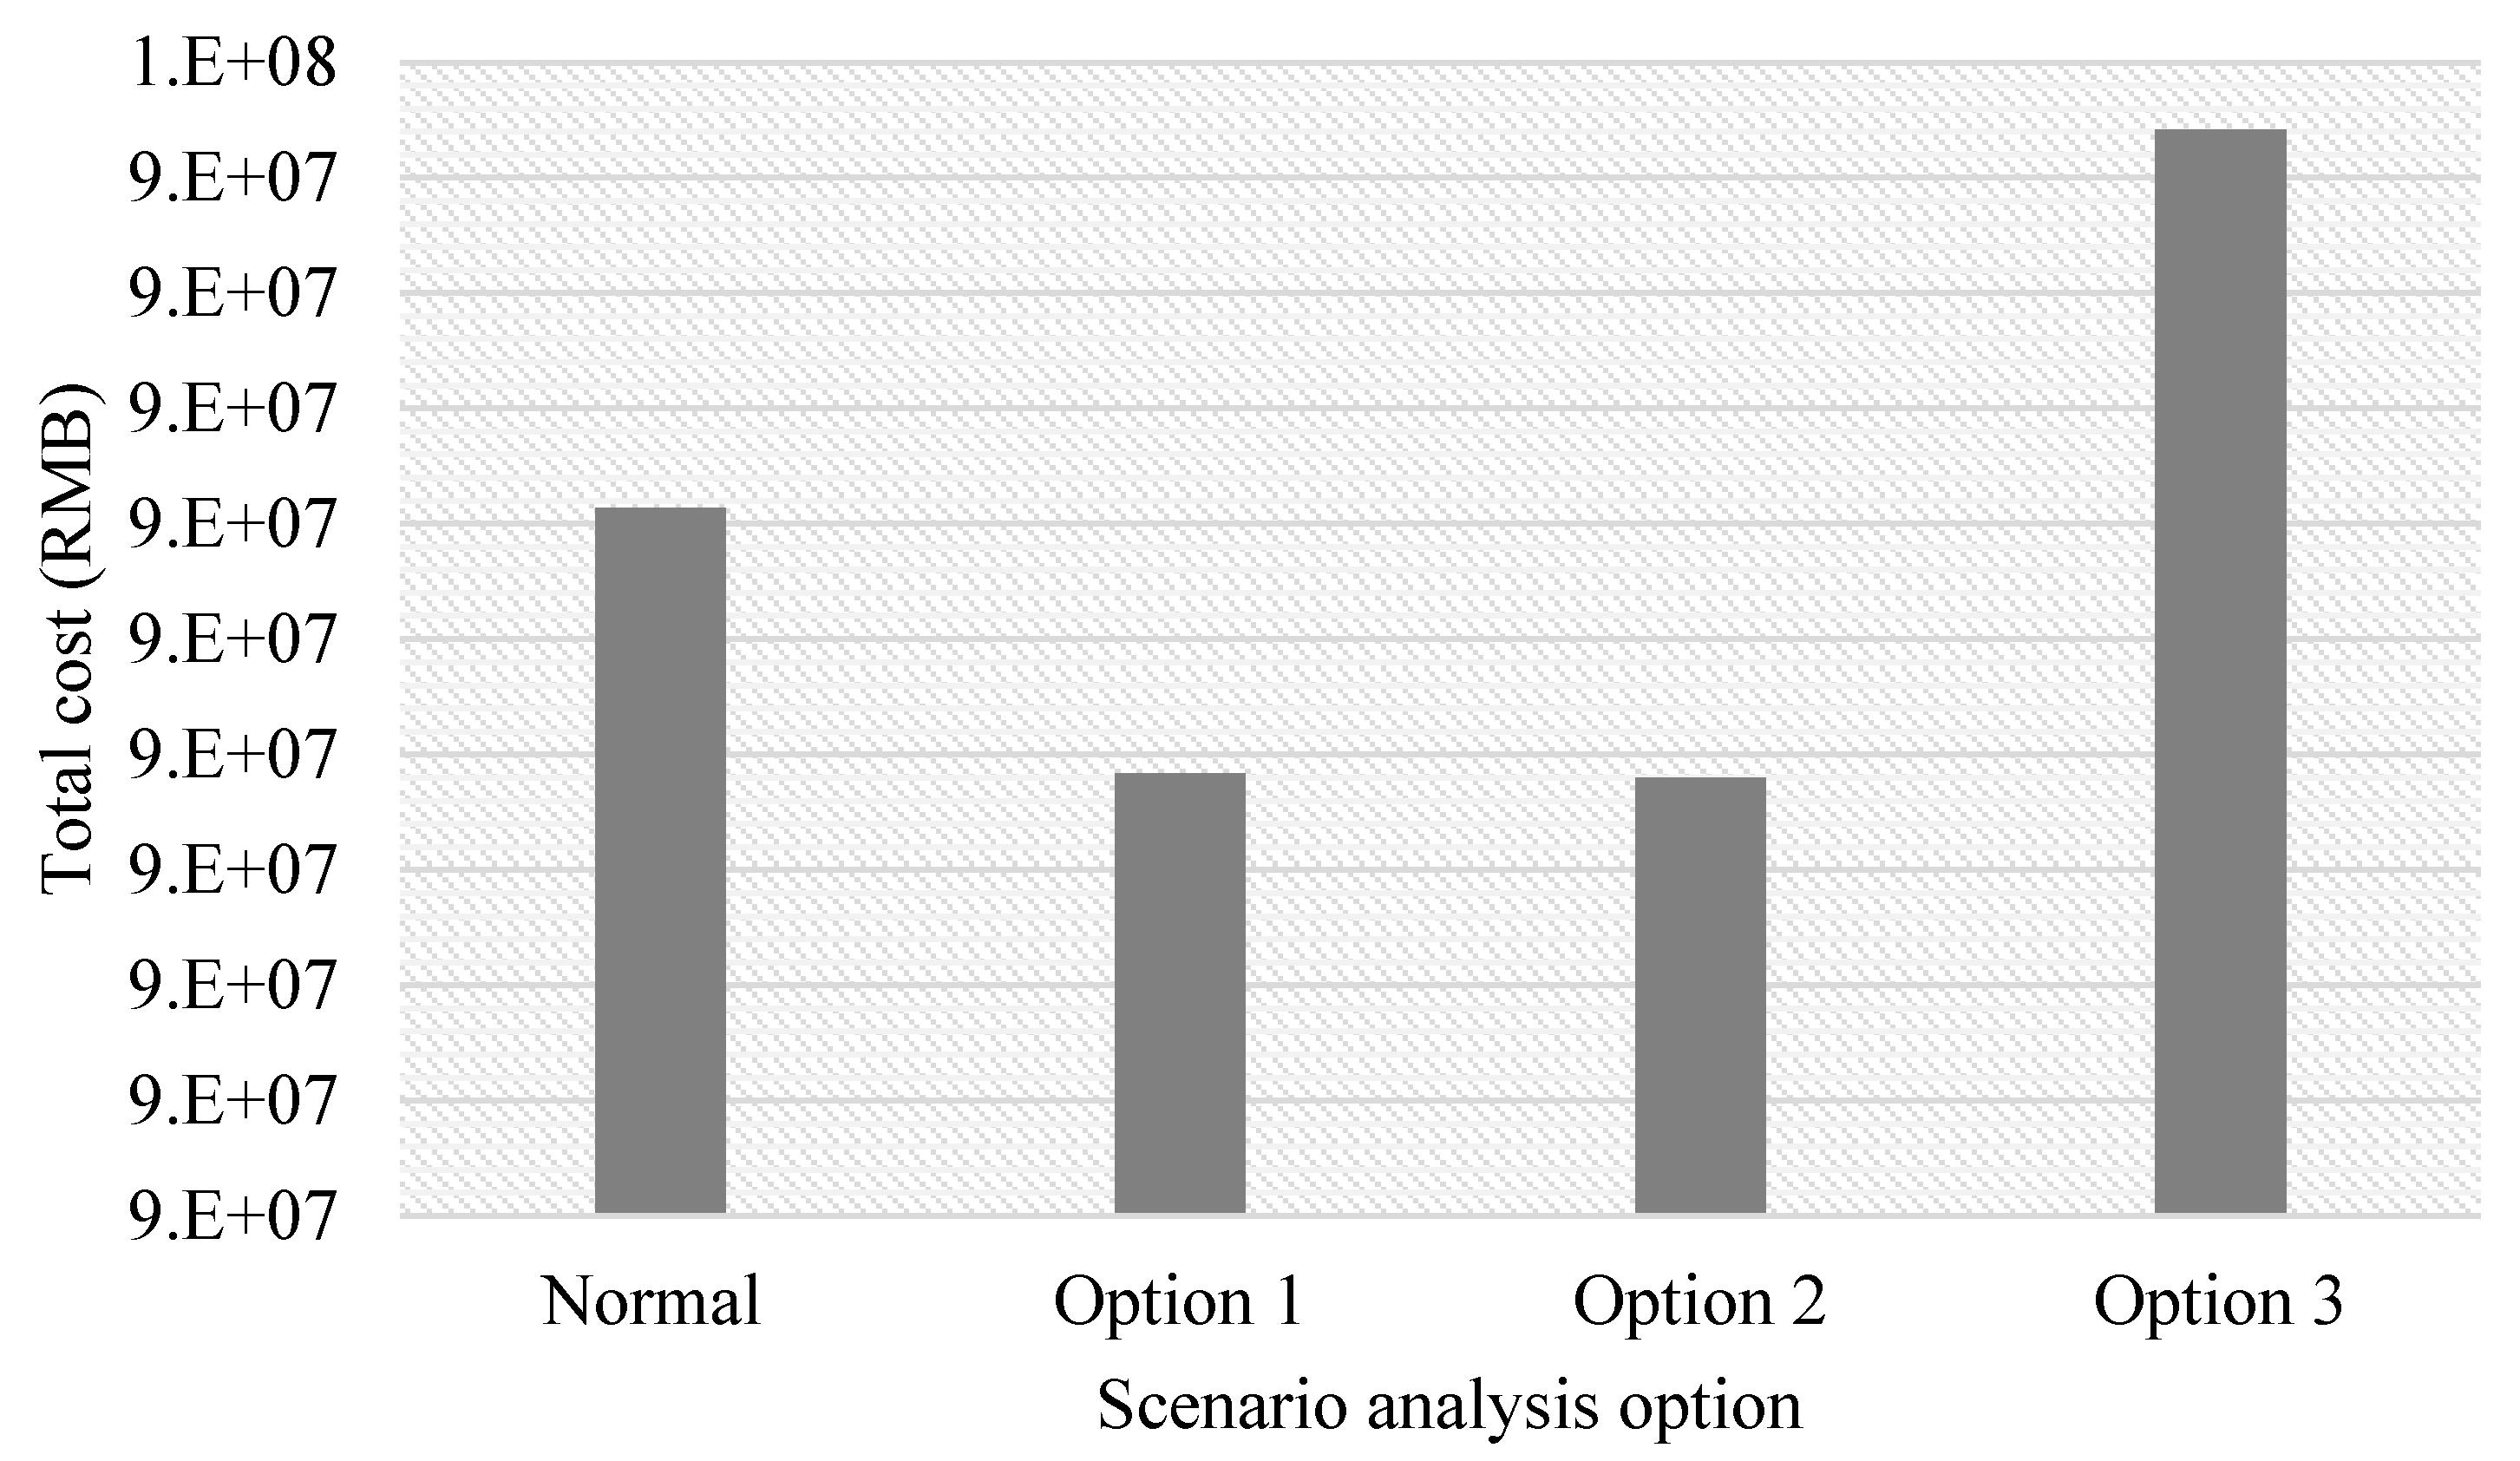
7. Scenario Analysis

7.1. Scenario 1-Effect of Vehicle/Equipment Type

The current analysis assumed 10-tonne concrete trucks for concrete transportation, and the case study has used several construction equipment types. Thus, the scenario analysis used 5-t and 15-t concrete trucks to compare the total carbon emissions and total costs. The resulting comparison is highlighted in Table 8. The results suggest that using a larger truck (15 t) would potentially reduce the total carbon emissions by 2.17%, whereas using a smaller truck of 5 t would increase the total emissions by 3.59%. This could probably be due to the large cycle of trips for delivering concrete and the fuel consumption in the trucks. However, considering the idle time and material requirements for specific jobs, the use of trucks can be different. Nevertheless, the cost for using both 5 t and 15 t is slightly higher than the 10-t trucks. However, this increase is a small percentage of 0.30% and 1.40%, respectively, as compared to the total cost of the project. Therefore, future studies on algorithm development based on the concrete requirement to optimise the cost and carbon emissions of trucks could be highly beneficial.

7.2. Scenario 2—Effect of Using Sustainable Materials

The case study used cast-in-situ concrete in the majority of the concrete applications. In order to compare the effect of carbon emissions and total cost, virgin concrete is substituted with the following sustainable materials, as shown below.
Option 1 (O1): Use of recycled coarse aggregate concrete—In this, 100% virgin coarse aggregate is replaced with recycled coarse aggregate.
Option 2 (O2): Use of 50% fly ash concrete—In this, 50% cement is replaced with fly ash as a raw material in the concrete mix. 50% of cement replacement is used because it eliminates the requirement for using heat curing.
Option 3 (O3): Use of slag as a cement replacement material—In this option, the effect of 50% cement replacement is considered with slag in concrete.
The resulting total carbon emission and cost variations are illustrated in Figure 7 and Figure 8. The results indicate around 2.5% cost reduction for option 1 and option 2, while a cost increase of 3.6% is recorded for option 3. In the case of carbon emissions, option 2 and option 3 provide a total carbon emission reduction of around 7.89%, while option 1 achieves 0.73% of carbon emission reduction. Based on this scenario analysis, option 2 is the most optimum material choice, which provides 2.5% cost reduction and 7.89% carbon emission reduction. This further justifies the importance of conducting a scenario analysis to further investigate and compare economic and environmental savings.

8. Conclusions, Recommendations and Future Research

Striking a key balance between economic and emission savings is the key to sustainable infrastructure project construction. Based on the project objectives and scope, the relative significance of economic and carbon emission benefit priorities may differ. Despite several attempts from previous studies to investigate economic and environmental benefits at the discrete level, an aggregate level comparative study that can provide informed decisions is still absent. Thus, the current study aims to present a systematic procedure that can compare and analyse carbon emissions and the cost of an infrastructure project.
A case study of the highway project, which is located in the east suburb area of the Guanghan City, Sichuan Province, China, is presented to demonstrate the carbon emissions and cost estimation and comparison process. The case study includes the construction of a four-lane highway and is around 6 km in length. The results indicate that when optimising carbon emission and project cost from project stages perspective, stage 2 needs to be heavily concentrated due to its significant contribution to both carbon emission and cost. Stage 4 worth to be highlighted when focusing on optimising cost because it accounts for the biggest part of the total project cost. Stage 6 contributes the second biggest amount of carbon emissions of the whole project due to the materials it used. Meanwhile, its cost only accounts for less than 5% of the total cost. In the further investigation on different types of material, concrete and steel were identified as the two major sources of emissions, while soil and gravel constitute the biggest amount of cost. When considering the construction equipment, electricity surprisingly contributes the highest ratio (75%) of carbon emission due to the heavy usage of small electric machines, drilling rigs and cranes. In the analysis of transportation vehicles, concrete trucks and 12 t dump trucks are recognised as the top two contributors to both carbon emissions and cost. It unveils the importance of the choice of vehicle types and the place of setting dumping places. In the labour cost part, machine operator and general labour cost are both recorded the biggest amount at stage 4. After applying the AHP method, the significance of the materials for carbon emissions is decreased by 12.6%, while the significance of transport and equipment 5.79% and 6.81%, respectively. Conversely, the significance for the cost of materials increases by 6.94%, while equipment, transportation and labour’s significance dropped 1.19%, 0.42% and 5.34%, separately. These project-specific weightings can lead to different carbon emission and cost optimisation strategies.
The case study analysis also highlighted the importance of the choice of transportation vehicles and the usage of sustainable materials. According to the scenario 1 analysis, the use of 5-tonne and 15-tonne concrete trucks to substitute 10-t trucks can cause 3.59% and–2.17% variances of total emissions while only 0.3% and 1.04% differences in total cost, respectively. Based upon the scenario 2 analysis, the use of 50% of fly ash concrete to replace normal concrete is recognised as the most optimum material choice. It is recommended to make the decision making of environmental and economic savings more executable for road construction projects by focusing on developing optimised planning tools and algorithms. The introduction of more pre-fabricated concrete components, the use of sustainable materials to replace virgin materials in concrete and steel could lead to a reduction in carbon emissions. Future studies could also focus on developing a planning tool to compare cost and carbon emissions at different construction stages based on planned timelines, construction schedules and estimates.
Any study is subjected to limitations and assumptions based on the scope and objectives of the study. One of the major limitations of the study is that the cost and carbon emission results are case-specific and lack generalisability. However, the same methodology and the framework can be used to compare different transportation projects with different priorities.

Author Contributions

Formal analysis, M.S.; Methodology, M.S.; Project administration, W.L. and G.Z.; Resources, W.L.; Supervision, G.Z.; Writing—original draft, W.L. and M.S.; Writing—review & editing, G.Z. and Y.T. All authors have read and agreed to the published version of the manuscript.

Funding

This research received no external funding.

Institutional Review Board Statement

Not applicable.

Informed Consent Statement

Not applicable.

Data Availability Statement

Not applicable.

Conflicts of Interest

The authors declare no conflict of interest.

References

  1. De Best, R. Highway Construction in the U.S.—Statistics & Facts. Available online: https://www.statista.com/topics/2148/highway-construction/ (accessed on 21 June 2021).
  2. Barandica, J.M.; Fernández-Sánchez, G.; Berzosa, Á.; Delgado, J.A.; Acosta, F.J. Applying life cycle thinking to reduce greenhouse gas emissions from road projects. J. Clean. Prod. 2013, 57, 79–91. [Google Scholar] [CrossRef]
  3. Anthonissen, J.; Van Troyen, D.; Braet, J. Using carbon dioxide emissions as a criterion to award road construction projects: A pilot case in Flanders. J. Clean. Prod. 2015, 102, 96–102. [Google Scholar] [CrossRef]
  4. Fernández-Sánchez, G.; Berzosa, Á.; Barandica, J.M.; Cornejo, E.; Serrano, J.M. Opportunities for GHG emissions reduction in road projects: A comparative evaluation of emissions scenarios using CO2NSTRUCT. J. Clean. Prod. 2015, 104, 156–167. [Google Scholar] [CrossRef]
  5. Sandanayake, M.; Kumanayake, R.; Peiris, A. Environmental impact assessments during construction stage at different geographic levels—A cradle-to-gate analysis of using sustainable concrete materials. Eng. Constr. Archit. Manag. 2021. [Google Scholar] [CrossRef]
  6. Sandanayake, M.; Zhang, G.; Setunge, S. Impediments affecting a comprehensive emission assessment at the construction stage of a building. Int. J. Constr. Manag. 2019, 1–11. [Google Scholar] [CrossRef]
  7. Luo, W.; Sandanayake, M.; Zhang, G. Direct and indirect carbon emissions in foundation construction—Two case studies of driven precast and cast-in-situ piles. J. Clean. Prod. 2019, 211, 1517–1526. [Google Scholar] [CrossRef]
  8. Sandanayake, M.; Zhang, G.; Setunge, S.; Luo, W.; Li, C.-Q. Estimation and comparison of environmental emissions and impacts at foundation and structure construction stages of a building—A case study. J. Clean. Prod. 2017, 151, 319–329. [Google Scholar] [CrossRef]
  9. Zhang, G.; Sandanayake, M.; Setunge, S.; Li, C.; Fang, J. Selection of emission factor standards for estimating emissions from diesel construction equipment in building construction in the Australian context. J. Environ. Manag. 2017, 187, 527–536. [Google Scholar] [CrossRef] [PubMed]
  10. Sandanayake, M.; Zhang, G.; Setunge, S.; Li, C.-Q.; Fang, J. Models and method for estimation and comparison of direct emissions in building construction in Australia and a case study. Energy Build. 2016, 126, 128–138. [Google Scholar] [CrossRef]
  11. Martín-Morales, M.; Zamorano, M.; Ruiz-Moyano, A.; Valverde-Espinosa, I. Characterization of recycled aggregates construction and demolition waste for concrete production following the Spanish Structural Concrete Code EHE-08. Constr. Build. Mater. 2011, 25, 742–748. [Google Scholar] [CrossRef]
  12. Jin, R.; Li, B.; Elamin, A.; Wang, S.; Tsioulou, O.; Wanatowski, D. Experimental investigation of properties of concrete containing recycled construction wastes. Int. J. Civ. Eng. 2018, 16, 1621–1633. [Google Scholar] [CrossRef] [Green Version]
  13. Ossa, A.; García, J.; Botero, E. Use of recycled construction and demolition waste (CDW) aggregates: A sustainable alternative for the pavement construction industry. J. Clean. Prod. 2016, 135, 379–386. [Google Scholar] [CrossRef]
  14. Kim, B.; Lee, H.; Park, H.; Kim, H. Greenhouse gas emissions from onsite equipment usage in road construction. J. Constr. Eng. Manag. 2012, 138, 982–990. [Google Scholar] [CrossRef]
  15. Sandanayake, M.; Zhang, G.; Setunge, S.; Thomas, C. Environmental Emissions of Construction Equipment Usage in Pile Foundation Construction Process—A Case Study. In Proceedings of the 19th International Symposium on Advancement of Construction Management and Real Estate; Shen, L., Ye, K., Mao, C., Eds.; Springer: Berlin/Heidelberg, Germany, 2015; pp. 327–339. [Google Scholar]
  16. Sandanayake, M.; Gunasekara, C.; Law, D.; Zhang, G.; Setunge, S.; Wanijuru, D. Sustainable criterion selection framework for green building materials—An optimisation based study of fly-ash Geopolymer concrete. Sustain. Mater. Technol. 2020, 25, e00178. [Google Scholar] [CrossRef]
  17. Finkbeiner, M. The new international standards for life cycle assessment: ISO 14040 and ISO 14044. Int. J. Life Cycle Assess. 2006, 11, 80–85. [Google Scholar] [CrossRef]
  18. Arvanitoyannis, I.S. ISO 14040: Life cycle assessment (LCA)–principles and guidelines. Waste Manag. Food Ind. 2008, 3, 97–132. [Google Scholar]
  19. Pujadas-Gispert, E.; Sanjuan-Delmás, D.; de la Fuente, A.; Moonen, S.P.G.; Josa, A. Environmental analysis of concrete deep foundations: Influence of prefabrication, concrete strength, and design codes. J. Clean. Prod. 2020, 244, 118751. [Google Scholar] [CrossRef]
  20. Ghisellini, P.; Ripa, M.; Ulgiati, S. Exploring environmental and economic costs and benefits of a circular economy approach to the construction and demolition sector. A literature review. J. Clean. Prod. 2018, 178, 618–643. [Google Scholar] [CrossRef]
  21. Van der Lugt, P.; Van den Dobbelsteen, A.; Janssen, J. An environmental, economic and practical assessment of bamboo as a building material for supporting structures. Constr. Build. Mater. 2006, 20, 648–656. [Google Scholar] [CrossRef]
  22. Fregonara, E.; Giordano, R.; Rolando, D.; Tulliani, J.-M. Integrating Environmental and Economic Sustainability in New Building Construction and Retrofits. J. Urban Technol. 2016, 23, 3–28. [Google Scholar] [CrossRef]
  23. Sandanayake, M.S. Models and Toolkit to Estimate and Analyse the Emissions and Environmental Impacts of Building Construction. Ph.D. Thesis, Rmit University, Melbourne, Australia, 2016. [Google Scholar]
  24. Reza, B.; Sadiq, R.; Hewage, K. Emergy-based life cycle assessment (Em-LCA) for sustainability appraisal of infrastructure systems: A case study on paved roads. Clean Technol. Environ Policy 2014, 16, 251–266. [Google Scholar] [CrossRef]
  25. Rahman, S.; Vanier, D. Life cycle cost analysis as a decision support tool for managing municipal infrastructure. In CIB 2004 Triennial Congress; National Research Council (NRC): Ottawa, ON, Canada, 2004. [Google Scholar]
  26. Kariyawasam, S.; McGovern, M.; Wilson, C. Partial information and complex development decisions: Illustrations from infrastructure projects. Environ. Impact Assess. Rev. 2019, 78, 106281. [Google Scholar] [CrossRef]
  27. Hasan, U.; Whyte, A.; Al Jassmi, H. Critical review and methodological issues in integrated life-cycle analysis on road networks. J. Clean. Prod. 2019, 206, 541–558. [Google Scholar] [CrossRef]
  28. Ruiz, A.; Guevara, J. Environmental and economic impacts of road infrastructure development: Dynamic considerations and policies. J. Manag. Eng. 2020, 36, 04020006. [Google Scholar] [CrossRef]
  29. Wang, X.; Duan, Z.; Wu, L.; Yang, D. Estimation of carbon dioxide emission in highway construction: A case study in southwest region of China. J. Clean. Prod. 2015, 103, 705–714. [Google Scholar] [CrossRef]
  30. Liu, Y.; Wang, Y.; Li, D. Estimation and uncertainty analysis on carbon dioxide emissions from construction phase of real highway projects in China. J. Clean. Prod. 2017, 144, 337–346. [Google Scholar] [CrossRef]
  31. Krantz, J.; Lu, W.; Johansson, T.; Olofsson, T. Analysis of alternative road construction staging approaches to reduce carbon dioxide emissions. J. Clean. Prod. 2017, 143, 980–988. [Google Scholar] [CrossRef]
  32. Sandanayake, M.; Zhang, G.; Setunge, S. Estimation of environmental emissions and impacts of building construction—A decision making tool for contractors. J. Build. Eng. 2019, 21, 173–185. [Google Scholar] [CrossRef]
  33. Sandanayake, M.; Luo, W.; Zhang, G. Direct and indirect impact assessment in off-site construction—A case study in China. Sustain. Cities Soc. 2019, 48, 101520. [Google Scholar] [CrossRef]
  34. Sandanayake, M.; Lokuge, W.; Zhang, G.; Setunge, S.; Thushar, Q. Greenhouse gas emissions during timber and concrete building construction —A scenario based comparative case study. Sustain. Cities Soc. 2018, 38, 91–97. [Google Scholar] [CrossRef] [Green Version]
  35. Guggemos, A.A.; Horvath, A. Decision-support tool for assessing the environmental effects of constructing commercial buildings. J. Archit. Eng. 2006, 12, 187–195. [Google Scholar] [CrossRef]
  36. Yan, H.; Shen, Q.; Fan, L.C.; Wang, Y.; Zhang, L. Greenhouse gas emissions in building construction: A case study of One Peking in Hong Kong. Build. Environ. 2010, 45, 949–955. [Google Scholar] [CrossRef] [Green Version]
  37. Wang, L.; Xue, X.; Zhao, Z.; Wang, Z. The impacts of transportation infrastructure on sustainable development: Emerging trends and challenges. Int. J. Environ. Res. Public Health 2018, 15, 1172. [Google Scholar] [CrossRef] [Green Version]
  38. Li, D.; Wang, Y.; Liu, Y.; Sun, S.; Gao, Y. Estimating life-cycle CO2 emissions of urban road corridor construction: A case study in Xi’an, China. J. Clean. Prod. 2020, 255, 120033. [Google Scholar] [CrossRef]
  39. Marzouk, M.; Abdelkader, E.M.; El-zayat, M.; Aboushady, A. Assessing environmental impact indicators in road construction projects in developing countries. Sustainability 2017, 9, 843. [Google Scholar] [CrossRef] [Green Version]
  40. Earon, R.; Olofsson, B.; Renman, G. Initial effects of a new highway section on soil and groundwater. Water Air Soil Pollut. 2012, 223, 5413–5432. [Google Scholar] [CrossRef]
  41. Vanthomme, H.; Kolowski, J.; Nzamba, B.S.; Alonso, A. Hypothesis-driven and field-validated method to prioritize fragmentation mitigation efforts in road projects. Ecol. Appl. 2015, 25, 2035–2046. [Google Scholar] [CrossRef] [PubMed]
  42. Vijay, R.; Kushwaha, V.K.; Mardikar, T.; Labhasetwar, P.K. Impact of highway construction on water bodies: A geospatial assessment. Environ. Monit. Assess. 2017, 189, 1–9. [Google Scholar] [CrossRef]
  43. Carpenter, A.C.; Gardner, K.H.; Fopiano, J.; Benson, C.H.; Edil, T.B. Life cycle based risk assessment of recycled materials in roadway construction. Waste Manag. 2007, 27, 1458–1464. [Google Scholar] [CrossRef] [PubMed]
  44. Nicuţǎ, A.M.; Frunzǎ, R. Environmental impact assessment for traditional versus recycled road asphalt mixtures. Environ. Eng. Manag. J. 2013, 12, 575–585. [Google Scholar] [CrossRef]
  45. Maghool, F.; Arulrajah, A.; Du, Y.J.; Horpibulsuk, S.; Chinkulkijniwat, A. Environmental impacts of utilizing waste steel slag aggregates as recycled road construction materials. Clean Technol. Environ. Policy 2017, 19, 949–958. [Google Scholar] [CrossRef]
  46. Pacheco-Torres, R.; Varela, F. Mechanical performance of cement-stabilised soil containing recycled glass as road base layer. Road Mater. Pavement Des. 2019, 21, 2247–2263. [Google Scholar] [CrossRef]
  47. Veropalumbo, R.; Russo, F.; Viscione, N.; Biancardo, S.A.; Oreto, C. Investigating the rheological properties of hot bituminous mastics made up using plastic waste materials as filler. Constr. Build. Mater. 2021, 270, 121394. [Google Scholar] [CrossRef]
  48. Oreto, C.; Veropalumbo, R.; Viscione, N.; Biancardo, S.A.; Russo, F. Investigating the environmental impacts and engineering performance of road asphalt pavement mixtures made up of jet grouting waste and reclaimed asphalt pavement. Environ. Res. 2021, 198, 111277. [Google Scholar] [CrossRef]
  49. Chen, J.; Zhao, F.; Liu, Z.; Ou, X.; Hao, H. Greenhouse gas emissions from road construction in China: A province-level analysis. J. Clean. Prod. 2017, 168, 1039–1047. [Google Scholar] [CrossRef]
  50. Park, K.; Hwang, Y.; Seo, S.; Seo, H. Quantitative assessment of environmental impacts on life cycle of highways. J. Constr. Eng. Manag. 2003, 129, 25–31. [Google Scholar] [CrossRef]
  51. Treloar, G.J.; Love, P.E.; Crawford, R.H. Hybrid life-cycle inventory for road construction and use. J. Constr. Eng. Manag. 2004, 130, 43–49. [Google Scholar] [CrossRef]
  52. Hanson, C.S.; Noland, R.B. Greenhouse gas emissions from road construction: An assessment of alternative staging approaches. Transp. Res. Part D Transp. Environ. 2015, 40, 97–103. [Google Scholar] [CrossRef]
  53. Norris, G.A. Integrating life cycle cost analysis and LCA. Int. J. Life Cycle Assess 2001, 6, 118–120. [Google Scholar] [CrossRef]
  54. Lee, J.; Edil, T.B.; Benson, C.H.; Tinjum, J.M. Building Environmentally and Economically Sustainable Transportation Infrastructure: Green Highway Rating System. J. Constr. Eng. Manag. 2013, 139, A4013006. [Google Scholar] [CrossRef]
  55. Ozcan-Deniz, G.; Zhu, Y. Multi-objective optimization of greenhouse gas emissions in highway construction projects. Sustain. Cities Soc. 2017, 28, 162–171. [Google Scholar] [CrossRef] [Green Version]
  56. France-Mensah, J.; O’Brien, W.J. Developing a sustainable pavement management plan: Tradeoffs in road condition, user costs, and greenhouse gas emissions. J. Manag. Eng. 2019, 35, 04019005. [Google Scholar] [CrossRef]
  57. Guo, M.; Murphy, R.J. LCA data quality: Sensitivity and uncertainty analysis. Sci. Total Environ. 2012, 435–436, 230–243. [Google Scholar] [CrossRef]
  58. Bribián, I.Z.; Uson, A.A.; Scarpellini, S. Life cycle assessment in buildings: State-of-the-art and simplified LCA methodology as a complement for building certification. Build. Environ. 2009, 44, 2510–2520. [Google Scholar] [CrossRef]
  59. Guggemos, A.A. Environmental Impacts of On-Site Construction Processes: Focus on Structural Frames; University of California, Berkeley: Berkeley, CA, USA, 2003. [Google Scholar]
  60. Guggemos, A.A.; Horvath, A. Comparison of environmental effects of steel-and concrete-framed buildings. J. Infrastruct. Syst. 2005, 11, 93–101. [Google Scholar] [CrossRef]
  61. Junnila, S.; Horvath, A.; Guggemos, A. Life-Cycle Assessment of Office Buildings in Europe and the United States. J. Infrastruct. Syst. 2006, 12, 10–17. [Google Scholar] [CrossRef]
  62. Mao, C.; Shen, Q.; Shen, L.; Tang, L. Comparative study of greenhouse gas emissions between off-site prefabrication and conventional construction methods: Two case studies of residential projects. Energy Build. 2013, 66, 165–176. [Google Scholar] [CrossRef] [Green Version]
  63. Hong, J.; Shen, G.Q.; Feng, Y.; Lau, W.S.-t.; Mao, C. Greenhouse gas emissions during the construction phase of a building: A case study in China. J. Clean. Prod. 2015, 103, 249–259. [Google Scholar] [CrossRef] [Green Version]
  64. Wu, P.; Mao, C.; Wang, J.; Song, Y.; Wang, X. A decade review of the credits obtained by LEED v2. 2 certified green building projects. Build. Environ. 2016, 102, 167–178. [Google Scholar] [CrossRef]
  65. Zuo, J.; Pullen, S.; Rameezdeen, R.; Bennetts, H.; Wang, Y.; Mao, G.; Zhou, Z.; Du, H.; Duan, H. Green building evaluation from a life-cycle perspective in Australia: A critical review. Renew. Sustain. Energy Rev. 2017, 70, 358–368. [Google Scholar] [CrossRef]
  66. Liu, G.; Chen, R.; Xu, P.; Fu, Y.; Mao, C.; Hong, J. Real-time carbon emission monitoring in prefabricated construction. Autom. Constr. 2020, 110, 102945. [Google Scholar] [CrossRef]
  67. Hossain, M.U.; Poon, C.S. Comparative LCA of wood waste management strategies generated from building construction activities. J. Clean. Prod. 2018, 177, 387–397. [Google Scholar] [CrossRef]
  68. Sandanayake, M.; Zhang, G.; Setunge, S. A comparative method of air emission impact assessment for building construction activities. Environ. Impact Assess. Rev. 2018, 68, 1–9. [Google Scholar] [CrossRef]
  69. Xing, S.; Xu, Z.; Jun, G. Inventory analysis of LCA on steel- and concrete-construction office buildings. Energy Build. 2008, 40, 1188–1193. [Google Scholar] [CrossRef]
  70. Luo, Z.; Yang, L.; Liu, J. Embodied carbon emissions of office building: A case study of China’s 78 office buildings. Build. Environ. 2016, 95, 365–371. [Google Scholar] [CrossRef] [Green Version]
  71. Li, L.; Chen, K. Quantitative assessment of carbon dioxide emissions in construction projects: A case study in Shenzhen. J. Clean. Prod. 2017, 141, 394–408. [Google Scholar] [CrossRef]
  72. Peng, C. Calculation of a building’s life cycle carbon emissions based on Ecotect and building information modeling. J. Clean. Prod. 2016, 112 Pt 1, 453–465. [Google Scholar] [CrossRef]
  73. Lewis, P.; Leming, M.; Frey, H.C.; Rasdorf, W. Assessing effects of operational efficiency on pollutant emissions of nonroad diesel construction equipment. Transp. Res. Rec. 2011, 2233, 11–18. [Google Scholar] [CrossRef]
  74. Hermann, B.; Kroeze, C.; Jawjit, W. Assessing environmental performance by combining life cycle assessment, multi-criteria analysis and environmental performance indicators. J. Clean. Prod. 2007, 15, 1787–1796. [Google Scholar] [CrossRef] [Green Version]
  75. Sandanayake, M.; Zhang, G.; Setunge, S. Environmental emissions at foundation construction stage of buildings—Two case studies. Build. Environ. 2016, 95, 189–198. [Google Scholar] [CrossRef]
  76. González, V.; Echaveguren, T. Exploring the environmental modeling of road construction operations using discrete-event simulation. Autom. Constr. 2012, 24, 100–110. [Google Scholar] [CrossRef]
Figure 1. The research methodological framework.
Sustainability 13 07854 g001
Figure 2. The route plan of the case study.
Sustainability 13 07854 g002
Figure 3. Carbon emission variation for equipment based on fuel type.
Sustainability 13 07854 g003
Figure 4. Labour Cost (RMB) vs labour type at each construction stage.
Sustainability 13 07854 g004
Figure 5. The relative significance for carbon emissions.
Sustainability 13 07854 g005
Figure 6. The relative significance for cost.
Sustainability 13 07854 g006
Figure 7. Total costs comparison for different options.
Sustainability 13 07854 g007
Figure 8. Carbon emissions comparison for different options.
Sustainability 13 07854 g008
Table 1. Average transportation distances of primary materials.
MaterialSandCoarse SandPebble and GravelBasalt GravelCementSteelAsphaltAsphalt Concrete
Average Distance (km)30303024050302040
Table 2. Each construction stage and the total cost at each stage.
Stage Description Total Amount (RMB)
1General provisions1,244,754.00
2Subgrade27,746,172.00
3Pavement18,246,957.00
4Bridges, culverts29,297,371.00
5Tunnel4,790,904.00
6Safety facilities and pre-buried pipelines9,582,793.00
7Landscaping and environmental protection224,980.00
Table 3. The matrix of weighting factors for the impact categories considered from AHP.
J = EmissionsEmEeqET-Wi,jWi,j × Total
Em1.001.831.33-0.431.00
Eeq0.561.000.67-0.231.01
ET0.781.561.00-0.341.02
Total2.344.393.00-1.003.04
J = CostCmCeqCTCLWi,jWi,j × Total
Cm1.002.001.673.70.391.08
Ceq0.51.001.53.330.261.06
CT10.721.003.670.271.20
CL0.280.310.281.000.080.95
Total2.784.034.4511.71.004.28
Table 4. The project-level cost and carbon emissions at each construction stage.
StageCost for Each Component at Each Construction Stage (in Chinese Yuan, RMB)
1234567
Material1,024,44924,478,21611,731,97718,219,1222,232,1099,079,098195,723
Equipment45,4541,235,709894,2643,984,370502,01481,769-
Transport128,798796,039491,939771,042146,49152,4414959
Labour46,053985,1735,062,9925,774,6421,841,81360,77024,295
Total1,244,75427,495,13718,181,17228,749,1764,722,4339,574,078224,980
% total1.4%30.5%20.2%31.9%5.2%10.6%0.2%
StageCarbon Emissions for Each Component at Each Construction Stage (tCO2-eq)
1234567
Material768.521,331.97444.415,547.92065.618,393.454.7
Equipment12.0696.8242.4832.61104.690.1-
Transport3262.62549.47179.71529.9382.9124.314.3
Total4043.124,578.114,866.517,910.43553.018,607.969.0
% total4.8%29.4%17.8%21.4%4.2%22.3%0.1%
Table 5. Carbon emissions and cost for different material types.
Material Type Carbon Emissions (tCO2-eq)Cost (RMB)
Concrete17,789.111,715,186
Steel22,153.915,008,296
Iron131.8253,200
Asphalt10.01,516,090
Brick6.48397
Cement4020.11,377,640
Soil and gravel4383.226,672,910
Clay140.0159,224
Glass2.25086
Paint1765.8413,696
Sand1221.8226,635
Rubber485.6362,550
Aluminium65.9240,000
Other13,430.89,013,688
Table 6. Carbon emissions and cost based on the construction equipment type.
Equipment TypeFuel TypeCarbon Emissions
(tCO2-eq)
Cost (RMB)
ExcavatorsDiesel67.5283,876
Drilling rigsElectric577.72,455,398
CranesDiesel, Gasoline and Electricity119.4580,015
Asphalt paving relatedDiesel, Gasoline and Electricity31.7209,397
GradersDiesel95.9325,614
LoadersDiesel72.1186,414
RollersDiesel243.6800,183
Road sprinklersGasoline and Electricity5.951,394
Soil mixersElectric35.4106,656
Small machinesElectric1421.71,362,969
Minor (other)Diesel68.7375,581
PumpsElectric1.26105
Table 7. Carbon emissions and cost for each transport vehicle type.
Transport VehicleCarbon Emissions (tCO2-eq)Cost (RMB)
Truck (2 t)153.358,203
Truck (4 t)70.222,960
Truck (8 t)2.9834
Truck (10 t)105.032,110
Truck (15 t)2.0713
Dump truck (12 t)4129.41,188,698
Dump truck (15 t)564.5175,602
Liquid asphalt transporter27.111,367
Concrete truck (10 t)9998.01,843,423.8
Table 8. The total emission variation based on the use of different capacity trucks.
Truck TypeTransportation Emissions
(t-CO2-eq)
% DifferenceTotal Emissions
(t-CO2-eq)
% Difference
10-t concrete truck15,043.1-83,628.2-
5-t concrete truck18,044.319.95%86,629.43.59%
15-t concrete truck13,227.0−12.07%81,812.1−2.17%
Truck TypeTransportation Cost
(RMB)
% DifferenceTotal Cost (RMB)% Difference
10-t concrete truck2,391,710-90,191,731-
5-t concrete truck2,662,48911.32%90,462,5100.30%
15-t concrete truck3,333,91139.39%91,133,9321.04%
Publisher’s Note: MDPI stays neutral with regard to jurisdictional claims in published maps and institutional affiliations.

