Article

A Data-Driven Approach to Assess the Risk of Encountering Hazardous Materials in the Building Stock Based on Environmental Inventories

1
RISE Research Institutes of Sweden, 412 58 Gothenburg, Sweden
2
Department of Building and Environmental Technology, Faculty of Engineering, Lund University, 221 00 Lund, Sweden
3
Resources, Energy and Infrastructure, KTH Royal Institute of Technology, 100 44 Stockholm, Sweden
*
Author to whom correspondence should be addressed.
Sustainability 2021, 13(14), 7836; https://doi.org/10.3390/su13147836
Submission received: 31 May 2021 / Revised: 7 July 2021 / Accepted: 10 July 2021 / Published: 13 July 2021

Abstract

:
The presence of hazardous materials hinders the circular economy in construction and demolition waste management. However, traditional environmental investigations are costly and time-consuming, and thus lead to limited adoption. To deal with these challenges, the study investigated the possibility of employing registered records as input data to achieve in situ hazardous building materials management at a large scale. Through characterizing the eligible building groups in question, the risk of unexpected cost and delay due to acute abatement could be mitigated. Merging the national building registers and the environmental inventory from renovated and demolished buildings in the City of Gothenburg, a training dataset was created for data validation and statistical operations. Four types of inventories were evaluated to identify the building groups with adequate data size and data quality. The observations’ representativeness was described by plotting the distribution of building features between the Gothenburg dataset and the training dataset. Evaluating the missing data and the positive detection rates affirmed that reports and protocols could locate hazardous materials in the building stock. The asbestos and polychlorinated biphenyl (PCB)-containing materials with high positive detection rates were highlighted and discussed. Moreover, the potential inventory types and building groups for future machine learning prediction were delineated through the cross-validation matrix. The novel study contributes to the method development for assessing the risk of residual hazardous materials in buildings.

1. Introduction

Although a series of bans for the use of hazardous materials in construction have been imposed since the 1970s, an appreciable quantity of contaminated materials remains in the existing building stocks [1]. The frequent presence of asbestos-containing materials [2,3] and PCBs (polychlorinated biphenyls)-containing components [4] is the result of mass production and adoption in the 1920s–1990s [5]. In addition to the negative concerns of human health and the environment, demolished and renovated projects become more expensive and take a longer time if hazardous materials are encountered unexpectedly. The decontamination and abatement cost account for a noticeable amount for waste disposal and working precautions’ preparation [6].
Advanced data mining and statistical learning have been accessible to emerging research fields in recent years. Information about the building stock has also been made more available, mainly through governmental open database initiatives in several different areas, i.e., investigation records, project economy, and so on [6]. These two developments dramatically improve the estimation capability for locating hazardous building materials in demolition and renovation projects. Furthermore, by coupling building stock data and hazardous product registers, predictive detection of in situ hazardous building materials is made possible [7].
The study explores and develops a data-driven approach to assess hazardous materials’ detection in the building stock. The importance of effective hazardous materials management is recognized through updating legal requirements and extending criteria for a healthy living environment in building certification [8]. By increasing the quality control and locating the potential in situ hazardous materials, a step toward the circular economy for construction and demolition waste (C&DW) can be realized [9]. For instance, mandatory pre-demolition audits (also called environmental audits or waste audits) are enforced in Austria, Bulgaria, the Czech Republic, Finland, France, Hungary, Luxembourg, The Netherlands, Romania, Spain, and Sweden, whereas optional environmental investigations have been applied to a limited extent in Belgium, Denmark, Germany, Ireland, Italy, Slovakia, and the United Kingdom for 5–10 years [10]. Advantages for pre-demolition audits include improving hazardous construction and demolition waste identification, as well as promoting resource circularity and efficient use of mixed wastes [11]. According to the breakdown of construction and demolition wastes’ generation, Sweden presents a higher percentage of hazardous wastes (13%) than the average among European Union (EU) countries (2.5%) owing to its sound separation systems as well as a long tradition of environmental legislation [9]. The use of asbestos and PCB in building materials has been prohibited since the middle of the 1970s in Sweden. Several other EU countries have also achieved advanced progress in establishing waste management systems and databases. For example, pre-demolition audits for the certain scale of the non-residential building are mandatory in Flanders [12]. With an increasing number of emerging databases and extensive documentation, the goal of tracing in situ hazardous building materials through employing data mining on registered records could be attained [13].
Built upon statistics, machine learning, and pattern recognition techniques, data mining enables automatic or semi-automatic exploration of large amounts of data to discover patterns or rules [14]. Owing to these benefits and building data availability, the potential of data-driven built environment management is shown. However, previous literature sheds light on significant challenges for practical implementation, including time-consuming pre-processing obtaining complete digital datasets [15]. Furthermore, limited information regarding the extent of the previous adoption is available, leading to a struggle in designing precautionary abatement policy and decontamination plans [6]. Several researchers attempted to detect asbestos-containing materials through developing new methodologies considering these barriers and knowledge gaps. Employing temporal descriptions of materials in an ontology-based approach; prediction of the presence of asbestos in buildings was explored by Mecharnia et al. [7]. Similarly, statistics were also employed in study inspection reports and online demolition databases to quantify the amounts and abatement costs for asbestos-containing materials in abandoned residential dwellings by Franzblau et al. [6]. Govorko et al. [2,16] developed a mobile application to investigate the types and the conditions of asbestos-containing materials in residential settings.
To realize the Construction 2020 strategy [17] and the Communication on Resource Efficiency Opportunities in the Building Sector [18], the protocols and guidelines for waste audits before demolition and renovation for buildings were established by the EU Commission [19]. The emergence of relevant tools and complementary legislation is expected to improve current practice in waste identification, source separation, and collection [11]. Although Sweden has introduced obligatory environmental audits since 1995, several practical predicaments exist for using the data, i.e., the hardcopies of environmental inventories are kept by several different authorities, a harmonized protocol at the national level is lacking, and no digital query-based database of in situ building materials is available yet [11]. This article attempts to address these challenges by developing a generalizable approach and extending the investigation scope to multiple hazardous materials in the building stock. The empirical study aims to quantify the risk of residual hazardous materials in the existing buildings and investigate the data quality and quantity of the environmental audits for advanced analysis. Through a case study in the City of Gothenburg, the potential of using environmental inventories to assess the extent of in situ hazardous materials has been explored. The first part of the research involves data assembling and validation, followed by cross-comparison and descriptive statistics of the training dataset. The study results can offer valuable insights into the frequent occurrence of hazardous materials in demolished and renovated buildings and specify building groups where occurrences are more likely. Furthermore, the pilot work lays a good foundation for the subsequent machine learning modeling to predict the presence of hazardous materials. To achieve the research objectives, three research questions are formulated as follows:
  • RQ1: What is the potential for employing environmental inventories as input data to assess the presence of hazardous materials in the building stock?
  • RQ2: How representative is the training dataset in relation to the Gothenburg building stock?
  • RQ3: How can the risk of encountering hazardous materials in the building stock be assessed?

2. Materials and Methods
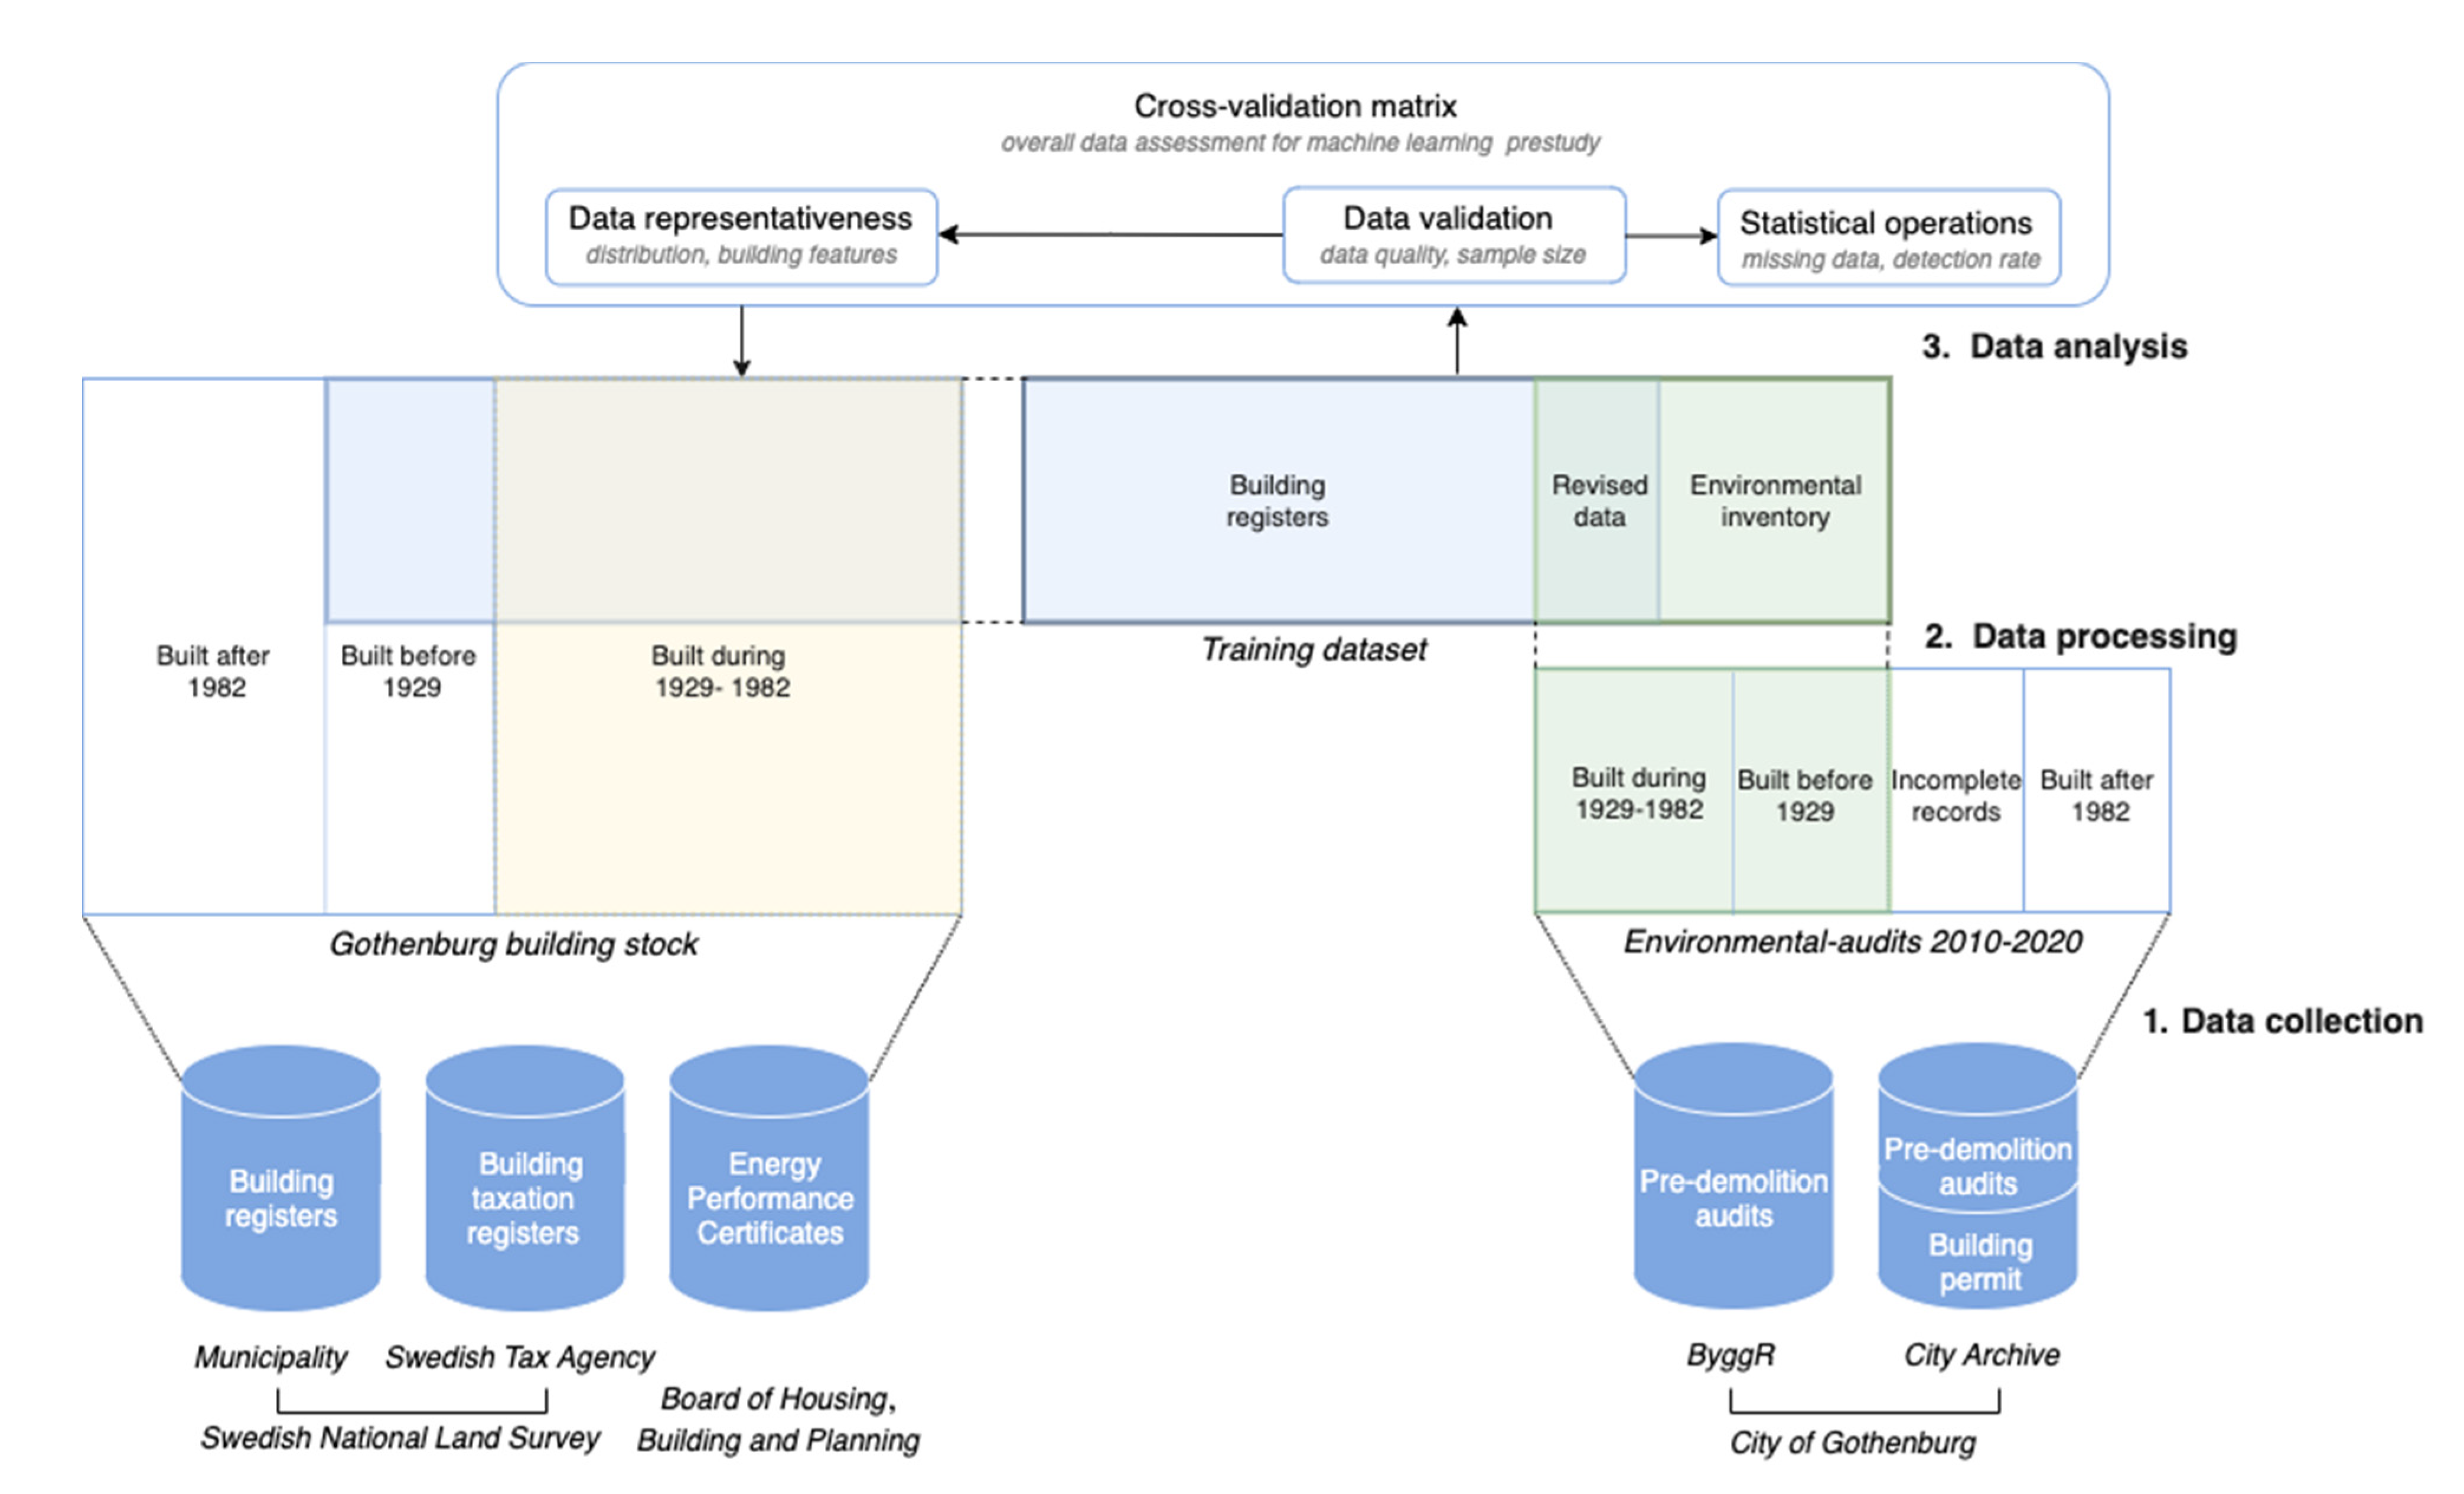
2.1. Study Design

Given that no digital pre-demolition audit dataset exists in Sweden, nor can building material records be found in the national building registers, the study proposed an innovative data coupling method by adding environmental inventories from the field study to the building information database from authorities. A similar data coupling approach has been performed by Wilk et al. [20] and Krówczyńska et al. [21] to study the spatial distribution of asbestos-cement roofing. To assess the potential of using environmental inventories for hazardous materials identification, a training dataset consisting of pre-demolition audits from demolished and renovated buildings in the City of Gothenburg constructed earlier than 1982 and national building registers at a regional scale was created. The developed training dataset compiling the registered records of the environmental investigation from the past decade can be regarded as a pioneered study of sustainable building material management. Data validation for the acquired documents becomes a fundamental step for the future machine learning study that leverages the existing data labels for predicting the potential presence of the remaining hazardous materials.
The study design illustrated in Figure 1 followed the procedure of training dataset creation, processing, and analysis. Firstly, registered-based data were collected from various databases for quality and quantity control. Then, the following data processing included data reformatting, merging, and cleaning. Finally, data analysis was performed in four parts: validating data quality and quantity, evaluating data representativeness with the Gothenburg building stock, assessing missing data and the detection records of each building subgroup, and cross-validating investigation data for risk assessment.

2.2. Data Collection

Several data collection relating tasks were performed sequentially to ensure data operationality. First and foremost, environmental inventories and national building registers were collected from different authorities. Pre-demolition audits were gathered from the Archive of the City of Gothenburg during the permit application period from 2010 to 2020. Currently, no query-based database of environmental records exists, which allows free search in the text masses. Therefore, the search process was done manually in the building permit register system using the keywords “demolition”, “renovation”, “reconstruction”, “modification”, and “alteration” in the document titles. Extensive document screening was executed to identify the projects with environmental audits in their permit decisions. Thereafter, investigation documents were requested and reformatted into a digital dataset.
Meanwhile, national building registers were received from the Swedish Cadastral and Land Registration Authority, where real estate registers from municipalities and the Swedish Tax Agency are kept. Besides, the Energy Performance Certificates were collected from the Swedish National Board of Housing, Building, and Planning. Merging these national datasets was executed with GIS Feature Manipulation Engine from Safe Software to constitute the comprehensive dataset for the research purpose. This comprehensive dataset comprised registered buildings from the three major economic regions in Sweden: Stockholm, Gothenburg, and Malmö regions. The methods for merging national datasets were developed by Johansson et al. [22] and can add additional auxiliary data for analyses. Then, the data extraction was conducted to retrieve the Gothenburg city dataset for the representativeness study concerning building characteristics. Many-to-many relationships were not included in the larger Gothenburg dataset as register data were at the property level, giving a data loss of approximately 10%. The metadata of the available Gothenburg dataset are appended in Appendix A [23]. Built upon the general building information from the national building registers and the detection records from the environmental inventories, the training dataset, a subset of the Gothenburg building stock, was created for further data processing and analysis. Many-to-many relationships were examined manually for the observed buildings in the training dataset.

2.3. Data Processing

To ensure coherent documentation of environmental inventories and improve the data readability for coding software, a standard procedure was developed and executed iteratively in creating the training dataset. The process consisted of (1) creating a dataset structure by assembling common variables across environmental inventories with the building as an observation unit; (2) checking data eligibility in terms of construction year and investigation completeness; (3) leveling data quality by clustering inventory types and investigator’s experiences, then converting the data to pre-defined data types; (4) extracting relevant building registers from the comprehensive datasets using national real estate index and harmonizing updates across datasets; (5) merging and reformatting building registers and environmental inventory to become a training dataset; and (6) revising and manipulating variables of interest through aggregating multiple records to verify data consistency for construction year, renovation year, area, and so on. The final variables of interest and their metadata in the training dataset are presented in Table 1.
Necessary data processing was executed to assure uniform data input from heterogeneous data sources. As the data update varied among different authorities, the registered data for variables of interest were compared with the inventory records to determine the actual investigated part. These registered data were used as proxies for filling missing data from the inventories. To assure data alignment for analysis, revised variables were created by prioritizing the inventory data and complementing them with the registered data. If none of the registers contained the information, the variables were labeled as NA. Moreover, irrelevant observations, such as buildings constructed after the ban of asbestos and PCB in building materials in 1982, as well as the updated registers for reconstructed buildings, were removed. The clean dataset summed up to 402 observations.
The detection results were collected from various environmental investigations and for all types of building usages. Four inventory types were identified based on the document title and the content format: report, protocol, control plan, and demolition plan. Reports contain the most thorough investigation records with test sample results. In comparison, protocols were developed by the municipality with a list of binary questions for the investigated hazardous materials and their amount. Control plans were used for small houses and simple buildings, and hazardous substances were generalized without specifying specific materials. Demolition plans are required documents for demolition permit application, and free text is used to describe the detection of hazardous substances or materials. Considering the various extent of environmental investigations, primary hazardous substances such as asbestos, PCB (polychlorinated biphenyls), CFC (chlorofluorocarbon), and mercury were included in the training dataset. The detection results were documented at two levels in a binary way: hazardous substances and hazardous building materials. Besides, specific building parameters, including construction year, renovation year, detailed usage, area, and the number of the floors, were also noted as data labels. The data quality was controlled through a cross-validation workshop with the research group and a domain expert to affirm the correct interpretation of the inventory documents.
Furthermore, building classes were created by reference to the description of the renovation or demolition permit, primary usage of the building stated in the inventory, as well as building types and building categories from the national building registers. According to the actual investigation area and the past activities, the 402 observations were categorized into ten building classes: single-family house, multifamily house, temporary dwelling, school, office, commercial building, production building, industrial building, warehouse, and other/infrastructure. Determining the building class can facilitate clustering the buildings with similar scale and construction tectonic. The categorization of the inventory types and the building classes is fundamental to structure the data subgroups for comparative analysis.

2.4. Data Analysis

Through conducting statistical operations on the 402 observations in the training dataset, data representativeness and risk assessment of encountering hazardous building materials were addressed. Python’s built-in library and interactive modules such as Pandas, Matplotlib, and Seaborn were employed for the explorative data analysis. The training dataset’s representativeness was evaluated by comparing the building parameters’ mean values with the same parameters in the Gothenburg dataset 1929–1982. Furthermore, the underlying correlations between the positive detection rates and different clustering subgroups were ascertained, i.e., inventory type, building class, construction year, and area. The descriptive statistical results provided an overall picture to assess the positive detection rates of residual hazardous materials in the building stock. To finalize the statistical results and set the scene for the future machine learning study, a cross-validation matrix evaluating the data quality and quantity was created.
Based on the cross-validation matrix, the data subgroup for each building class and investigated materials were assigned an assessment score. The assessment scores were created following (1) below. First of all, the investigation results for each building class were transformed into dummy variables, and four inventory types were given different weights based on the level of detail. The weights from high to low in decile points were assigned to the report, the protocol, the control plan, and the demolition plan, respectively. For each hazardous material in a given building class, the number of observations for various inventory types was multiplied by individual inventory weight, then the results were summed and divided by the number of observations. After evaluating the observation quality on an individual basis, a data number threshold was introduced to assess missing values for each subgroup. For example, if the data size was more than 30 observations, denoted as 1, between 15 and 30 observations were marked as 0.5, otherwise they were 0. Taking data size into account allowed assessing whether the observation number was large enough for generating useful statistical results. Cross-validating the individual observation quality and missing data in each subgroup, we can distinguish whether the detection results were reliable through adopting a data boundary. In the end, the findings were summarized and indicated the data subgroups that were found to be promising for machine learning pre-processing.
  y = ( I r × r + I p × n p + I c × n c + I d × n d ) n   K
  • y = Assessment score.
  • I = Inventory type for weighting the individual observation. I = 1 if is the report (r), I = 0.75 if is the protocol (p), I = 0.5 if is the control plan (c), and I = 0.25 if is the demolition plan (d).
  • n = Number of the observations in the studied subgroup.
  • K = Number of the observations enough for statistical operation. K = 1 if n >= 30, K = 0.5 if 15 =< n < 30, K = 0 if n < 15.

3. Results and Discussions

The results and discussions are structured in five parts: evaluating data quality and size, data representativeness, statistical operations, cross-validation matrix, and method replicability. Examining data quality and data size facilitated identifying subgroups appropriate for data analysis. By comparing the Gothenburg dataset and the training dataset, the distribution of building parameters was displayed to show data representativeness. Subsequently, the positive detection rates were highlighted with missing values for hazardous substances and materials through clustering with different parameters, such as inventory type, building class, construction year, and area. To summarize the previous analysis results and minimize the possible errors involving heterogeneous data, a cross-validation matrix was created as an indicator based on data quality and quantity for investigated materials in each building class. Finally, a short discussion regarding the method replicability to other contexts and the relation to previous research were discussed at the end of the section.

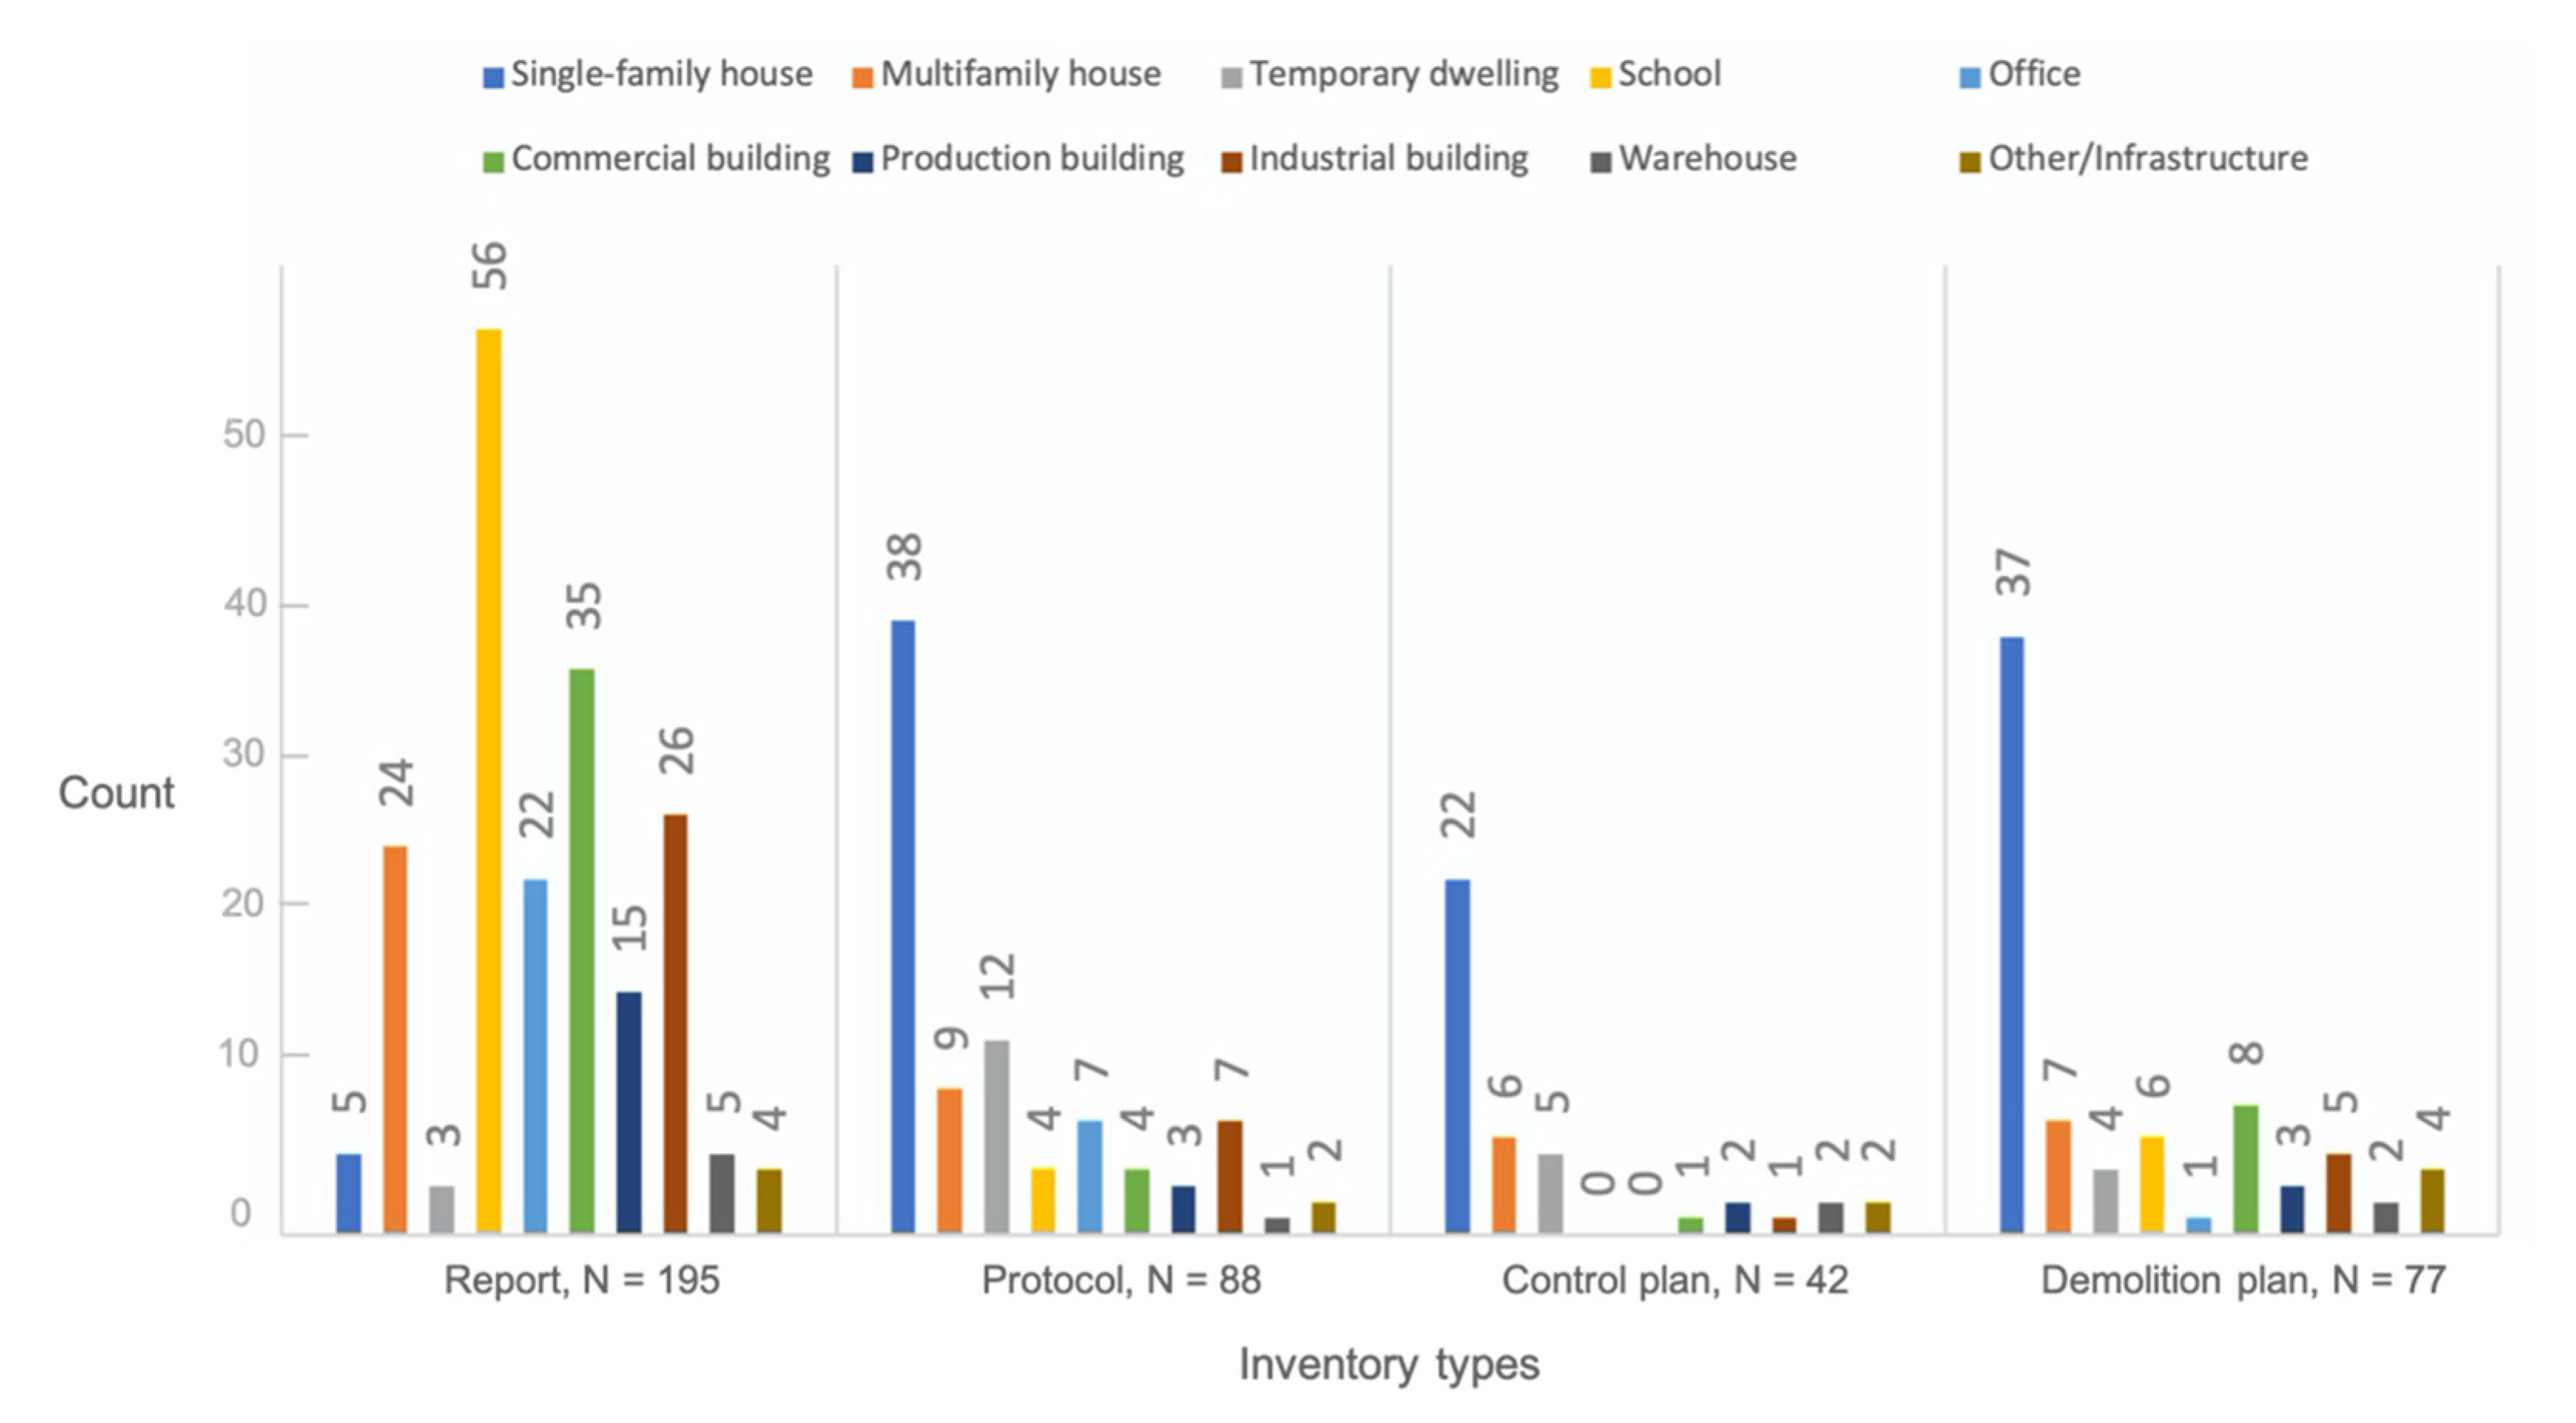
3.1. Evaluating Data Quality and Size

In Figure 2, the inventory types were ranked in descending order according to investigations’ comprehensiveness and documentation details. The high-detailed levels of environmental inventories specified the presence of hazardous substances and containing materials in semi-uniform formats, such as report and protocol, constituted 48.5% and 21.6% of the investigations, respectively. They described whether missing data is the result of investigations that have not been done or because investigation materials are not in place. Field sampling of hazardous materials was usually executed by hazardous waste experts, lowering the risk of mislabeling caused by visual distinguishment. Conversely, hazardous materials’ information is occasionally missing in simple investigations such as control plans or demolition plans. These information sources are only useful when estimating contamination at the building level. Data granularity became visible by clustering inventory types and building classes. High data granular building groups came from reports mainly by hazardous waste experts and contractors for large-scale and complex buildings. These included schools (13.9%), commercial buildings (8.7%), industrial buildings (6.5%), multifamily houses (6.0%), and offices (5.5%). Owing to the risk of polluted operations, industrial and production buildings, in most cases, require thorough environmental investigations by legislation. On the contrary, pre-demolition audits for single-family houses and temporary buildings mainly consisted of protocols, control plans, and demolition plans performed by contractors or private persons.
An overview of the experience level of the investigators across the environmental inventories helped evaluate the data source quality, as shown in Figure 3. Around 56.0% of the observations in the training dataset were performed by hazardous waste experts who are skilled in doing complicated environmental investigations. These environment consultants were primarily involved in drafting environmental reports and field sampling for the buildings obliged to pre-demolition audits. Another one-third of the observations came from contractors, such as demolition companies or waste handling companies. They are responsible for the demolition work and permit application, and thus skillful in making protocols, demolition plans, and control plans. The rest, 13.9% of the inventories, were done by private persons. They could be the building owners who only do the ocular inspections for a part of buildings. Considering the proportion of the observations carried out by hazardous waste experts or contractors, the reliability of the data is high.

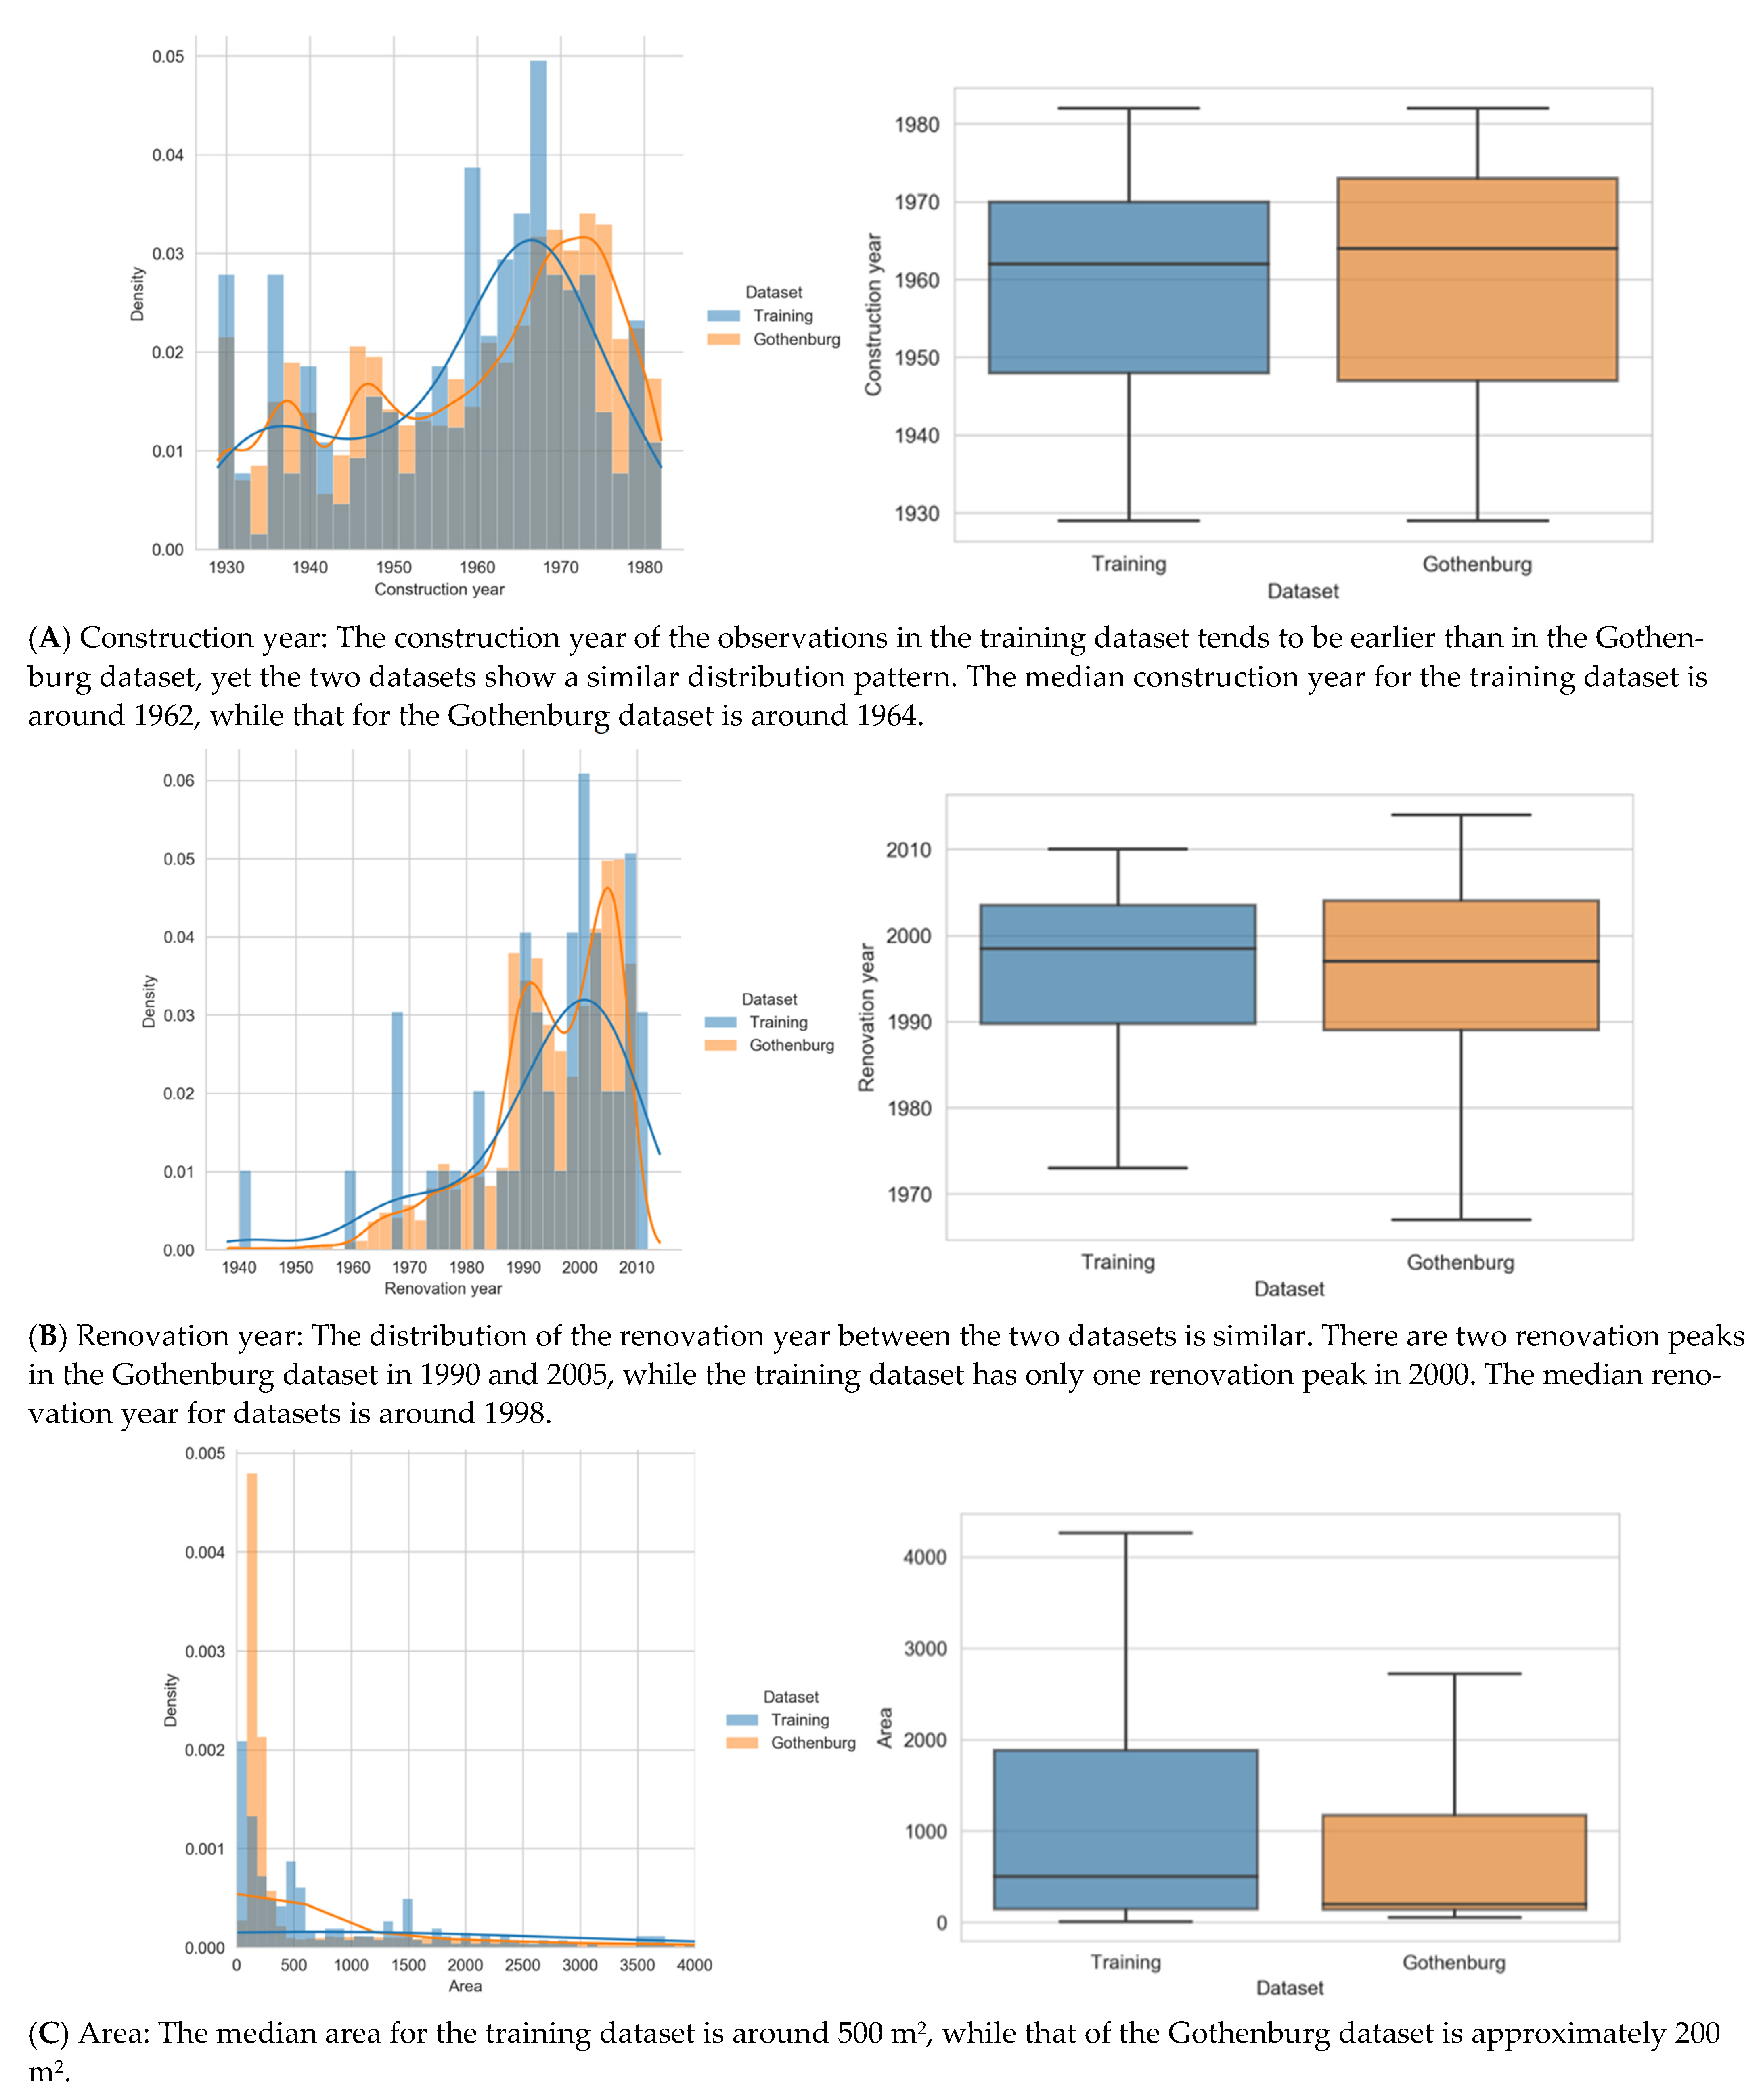
3.2. Data Representativeness

To test the feasibility of building machine learning prediction models from the training dataset for future studies, data representativeness in terms of similarity of building parameters needs to be controlled for. Representativeness of the training dataset was addressed by comparing the distribution and the building parameters with the entire building stock in the City of Gothenburg. Evaluating the variances between datasets enabled us to identify interest groups based on indicative variables, including construction year, renovation year, area range, and the number of floors. Gothenburg building stock data were retrieved from the national building registers that contained 157,301 buildings. 100,635 buildings were older than 1982, when the construction industry’s use of asbestos products was banned. Building class of the observations in the comprehensive dataset was classified according to municipality data using 1–99 indexing. Aggregation of building built before 1982 showed that most of Gothenburg’s old buildings were residential buildings. The rest were unspecified buildings, school buildings, industrial buildings, production buildings, and commercial buildings. The lack of registers for temporary buildings, offices, and warehouses may be categorized as unspecific buildings.
According to Figure 4, the training dataset (N = 336) represents around 2.2% of the Gothenburg building stock constructed from 1929 to 1982 (N = 14,996). The period was chosen for consistency as the earliest building registers traced back to 1929. The density plots were used to balance the unequal numbers of observations before comparing their distribution. Density normalization scales the bars for the individual dataset, thus the areas sum up to 1 [24]. Then, boxplots were created to illustrate the quartile of both datasets. They are used to display data variation in statistical sampling [25]. Figure 4A showed that more than half of the buildings were built between 1950 and 1970 in both datasets, corresponding to the periods of the two massive construction activities in Sweden, the People’s Home [26] and the Million Homes Programme [27] eras. A majority of the renovation activities (≥70%) in both datasets took place during 1990–2005, based on Figure 4B. According to Figure 4C, living area measurements of Gothenburg buildings were between 101 and 1000 m2, whereas the area in the training dataset was either for buildings larger than 1500 m2 or smaller than 100 m2. An interpretation is that buildings with environmental investigations are larger complicated buildings or smaller complementary buildings. Furthermore, the difference between the training dataset and the Gothenburg dataset in the number of floors indicates that low-level buildings were more commonly demolished or renovated for other use purposes, as presented in Figure 4D.
Building parameters for each building class in the Gothenburg dataset and the training dataset were compared to comprehend the building subgroups’ underlying characteristics, as presented in Table 2. The distribution of the building class was calculated by dividing the number of observations in each subgroup by the total number of observations in the dataset. Buildings in the city center are often mixed residential and commercial buildings with commercial zones on the lower floors. If these two building classes in the training dataset are summed, the amount will be comparable to the Gothenburg dataset. Moreover, school buildings were more frequently renovated with the removal of hazardous materials, resulting in more environmental inventories than other building classes. One reason for oversampling could be that multiple environmental investigations were executed for the individual buildings in the school complexes, leading to an over representative data size. The differences in the mean area and the mean floor of the school buildings could also be understood from an aggregation level perspective, where Gothenburg registers took properties into account rather than buildings. Lastly, industrial buildings and production buildings accounted for a few numbers, and the buildings in the training dataset were older than the corresponding Gothenburg subgroups. A reasonable doubt could be the concern of contaminated activities. In most cases, the City Environment Administration requested environmental audits for the industrial buildings before demolition, resulting in more environmental inventories than other building classes.

3.3. Statistical Operations

In Table 3, the positive detection rates and the amount of missing data in each inventory type were described. By reviewing the amount of missing data (Appendix B), a better understanding of the usefulness of detection results could be developed. A positive detection rate showed the detection of hazardous materials, which was calculated by dividing the number of positive results by the total number of observations, excluding the missing data. The results showed that different inventory types had their strengths in detecting hazardous substances and materials. Large numbers of missing data (≥90%) were presented in control plans and demolition plans as simple inventories lacked information about hazardous materials. They often only show the positive detection of one sought construction part; thus, these environmental inventories were mainly conducted to remove the specific asbestos-containing material. The inclusion of simple inventories into a more extensive dataset could lead to the risk of a skewed dataset. Detailed inventories, on the other hand, contained comprehensive detection records of hazardous materials. However, the detection records of certain building materials were not always available as they were not included in the protocol, such as asbestos-containing switchboards and joints, PCB-containing door closers, and cables.
Asbestos showed high positive detection rates in reports (0.84), demolition plans (0.70), and protocols (0.51), especially in pipe insulation, door or window insulation, cement panel boards, and ventilation channels. PCB generally had lower positive detection rates compared with asbestos in building materials. The results from the reports and the protocols indicated a higher risk of encountering PCB-containing joints/sealants and capacitors in fluorescent lamps/burners than other potential PCB-containing materials. Furthermore, CFC and mercury occurred frequently in buildings with positive detection rates higher than 0.50 in all inventories. CFC-containing materials were primarily located in freezers/fridges. However, the positive detection rates for building insulations and cooling units were not in agreement between reports and protocols. Investigations of CFC-containing materials in reports showed a high positive detection rate at refrigerations, whereas building insulation has a higher positive detection rate in protocols. The positive detection rate of mercury was the highest across inventory types. Mercury-containing materials were primarily found in lighting tubes. Positive detection rates of mercury-containing level monitors or sensors and thermometers were also high in reports, while investigations of protocols reported a high positive detection rate at relay or switches. The significant differences in the positive detection rates and the reported frequency across inventory types can be attributed to multiple reasons, including the building features of each subgroup’s observations, purposes for environmental audits, and investigators’ experience levels. Hence, further data clustering was performed to analyze positive detection rates and missing data in the subgroups of building classes (Table 4), construction year range (Appendix C), and area range (Appendix D).
Based on the conclusion of Figure 2, building classes with high data quality and adequate data size were selected for further data analysis. These included multifamily houses, schools, offices, commercial buildings, and industrial buildings. Table 4 describes the data size and the positive detection rate of hazardous substances and materials for each building class. A threshold value of 30 valid observations was set to enhance the certainty of the results, underlined in Table 4. Asbestos was identified predominately in multifamily houses with a positive detection rate of 0.93. In multifamily houses, asbestos-containing ventilation channels, joints, and pipe insulation were encountered. For school buildings and commercial buildings, ventilation channels contained a higher risk of asbestos. In contrast, asbestos-containing pipe insulations and door or window insulation were common in offices and industrial buildings. PCB positive detection rates were generally lower than asbestos across building classes. Office buildings had the highest PCB positive detection rate (0.70), mainly from PCB-containing joints/sealants. On the contrary, industrial buildings had an outstanding PCB detection value in capacitors in lamps/burners. For the rest of the building classes, the positive detection rates of PCB-containing joints/sealants and capacitors in lamps/burners showed similar patterns.
Concerning the exposure to environmental hazardous substances, mercury had a more frequent presence than CFC. The high positive detection rate of mercury was primarily due to the massive adoption of mercury-containing lighting tubes. Mercury-containing thermometers were also commonly used in multifamily houses and office buildings. On the other hand, CFC was found frequently in commercial buildings. CFC-containing fridges or freezers were the primary reason for high positive detection rates in multifamily houses, school buildings, commercial buildings, and industrial buildings. CFC-containing cooling unit was the main attribute in office buildings. Overall, the patterns of detecting hazardous materials in each building class appear to be reasonable considering the usage of the building and their average construction year. Our results are to some extent in agreement with the experience-based expert knowledge regarding frequent occurrences of hazardous materials in certain building classes. However, it has been challenging to cross-compare the positive detection rate of a specific building material among other building classes given varied data sizes. To determine the generalization potential of the results in relation to the regional building stock, incorporating more valid data of the studied buildings classes into the subsequent analysis will be essential.

3.4. Cross-Validation Matrix

The cross-validation matrix was developed as a tool to evaluate the results’ reliability. It helps set a boundary for hypothesis formulation by considering the data quality and quantity on hand. Table 5 presents the overall assessment scores for each building class calculated by the cross-validation matrix. The assessment score for the individual hazardous substance and material differed significantly among building class subgroups, indicating high variation of data quality and data size. The assessment score in 0 or NA implies that the investigation records had low reference values owing to their data source primarily from simple inventories or have an insufficient data size. Despite that the total data size was high, high-quality detection records from reports or protocols were few. The lack of detection records in hazardous material levels led to the high number of missing values, thus the overall assessment score ranked low. The data sizes of temporary dwellings, production buildings, warehouses, and others were inadequate or lacking investigation records for certain building materials. Hence, their assessment scores were the lowest and should be excluded in the subsequent machine learning modeling.
Based on the cross-validation matrix, a ranking coupling building class and hazardous materials in descending order, were presented in Table 6. The ranking of the cross-validation results can not only guide further data collection procedures, but also show the limitations of the current environmental audits. The school buildings reached the highest score in most hazardous substances and materials investigations, implying that their detection records were reliable. The fact may because their inventory data come mainly from reports with extensive investigation records. For commercial buildings and industrial buildings, the assessment scores on the hazardous substance level, asbestos-containing tile or clinker, and mercury-containing lighting tubes were high as well. Yet, the rest of the hazardous materials in these two groups had low scores. While PCB, PCB-containing joints, mercury, and asbestos-containing pipe insulation and tiles or clinkers had high reference values in multifamily houses, only the detection records of mercury and mercury-containing lighting tubes were high in office buildings. The fact that PCB was better surveyed in multifamily houses than other building classes could be explained by their conventional construction method of concrete elements and bricks with many sealants. Therefore, their detection results of the potential PCB-containing joints or sealants and asbestos-containing tiles or clinkers showed fewer missing values in the investigation records.

3.5. Method Replicability

Nowadays, obligatory environmental audits and open databases for building registers, the method’s key data input, are already available in many EU countries. For example, the Waste Register database in Estonia, the Integrated Waste Management System, and the Asbestos Database in Poland [10]. Thus, these countries have developed an established waste management practice and are in the position to adopt the proposed approach to estimate the residual hazardous material stock. As for the countries with the limited implementation of environmental audits concerning building size and function, as described in the introduction, it will be beneficial to create a harmonized environmental protocol for auditing hazardous materials in an online database [11]. Having a uniform digital dataset template can reduce the risk of information asymmetry and save processing time for data compiling, making data queries for environmental information much more effective.
Building registered data have become an essential source to describe building stock. However, data uncertainties are required to be addressed to assure accurate analytic results [23]. Previous efforts validated the EPC databases using stepwise regression models [23] and deploying a data quality assurance method [28]. Compared with the broad applications of EPC data [28], the environmental audits data remain relatively unexplored. Moreover, a large number of uninvestigated building components and undetermined assessment results, as well as the varied extent of environmental investigation execution between building classes, fail to be exposed. The study systematically examines the quality and content of environmental inventories, and based on that, evaluates their usability to enrich the building databases by adding specific environmental information. Referencing the EU data validation levels [29], a standard procedure to transform the field data into an organized, reliable dataset was exhibited. By showing the limitations and the possibilities of the environmental audits data, we hope to encourage more research in the application domain of safe construction and waste management.
The metabolism of the residual hazardous materials in the building stock is slow and the risk of exposure exists in every stage of the building life cycle. Previous literature showed that exceeding PCB concentration in the indoor air from volatilization during the building operation phase [30] and the airborne asbestos emission from the emergency demolitions [3] place an indispensable requirement for a long-term preventive maintenance strategy. To facilitate the abatement policy of in situ hazardous materials, extensive studies were conducted at the urban inventory level and the specific building class level. A stocks and flows model for asbestos was developed to determine common types of asbestos-containing materials [31]. Surprisingly, it was found that cement sheeting and waterpipe accounted for 90% of the asbestos consumption in Australia. Another study in the Australian residential buildings also showed high positive detection rates of asbestos backing board to the electrical meter boxes and asbestos eves [2]. Overall, asbestos-containing materials presented in 82.3% of the sampled houses. Similarly, asbestos-containing materials were found in around 95% of the abandoned residential homes in Detroit, especially in flooring, roofing, siding, and duct insulation [6]. These findings aligned with our results as the positive detection rate of asbestos in multifamily houses was 93%, and the high-risk materials were pipe insulation and cement panel board.
The investigations of building-related PCBs also showed a similar trend. An extensive survey in Switzerland verified that 48% of the buildings built between 1950 and 1980 contained PCBs [32]. In the same period, 46% of the school buildings in the USA were constructed [4]. Implementing the engineering controls to mitigate PCB diffusion from joint sealants and building caulk in American school buildings indicated a strong need for immediate actions [33,34]. In a citywide building sampling study, the positive detection rate of PCB-containing sealants was found at 14% in Toronto [30]. In particular, a high density of PCBs existed in commercial and electricity-intensive buildings [35]. Compared with brick or glass buildings, concrete buildings had a higher tendency to be contaminated by PCBs [30]. The results from our study agree with their findings. High detection rates of PCB-containing joints or sealants were noticed in concrete-built office and industrial buildings. Overall, the frequent presence of asbestos and PCB-containing materials worldwide reveals a necessity to develop an effective identification approach for general buildings. The method proposed in the study presents a data-driven solution to evaluate the risk of encountering hazardous materials in a high detail.
This study confirmed the potential to assess hazardous materials in regional building stock by using multiple registered records. Combining the environmental information from numerous registered data sources made it possible to systematically estimate the risk of hazardous substance occurrence in the building stock [20]. High data completeness of the detailed inventories, such as protocols and reports, enables a thorough analysis of hazardous material types in various building classes. Although the final output is highly dependent on data availability and quality, it is a rather cost-effective approach to trace the existing hazardous materials. In addition, the method’s generability can be replicated in other countries and help prioritize decontamination plans before demolition or extensive retrofit.

4. Conclusions

This paper studied the feasibility of tracing hazardous materials in the existing building stock based on multi-sourcing registered records. The opportunities and challenges of using environmental audits to guide the risk assessment of hazardous materials were explored. By associating national building registers and environmental inventories, a training dataset was created to verify the experienced-based expert knowledge. Around 65% of the training dataset’s observations comprised reports and protocols with high data granularity. Asbestos was the most frequently investigated substance, following by mercury, PCB, and CFC. The extent of environmental investigations of each building class varies, depending on building complexity and ownership. Most of the observations in reports were schools, commercial buildings, industrial buildings, multifamily houses, and office buildings, whereas in protocols, control plans, and demolition plans, single-family houses were most common. By validating data size and quality, building groups appropriate for the statistical operations were determined. Furthermore, comparing the distribution of building parameters between the training dataset and the Gothenburg dataset helps to understand the data representativeness, which involves the viability of constructing prediction models from the training dataset. The risk of encountering hazardous materials was assessed by evaluating the positive detection rates and the amount of missing data. Through clustering data subgroups such as inventory types, building classes, construction year, and area range, different perspectives for evaluating positive detection rates and missing data were presented. The results indicated high positive detection rates of asbestos-containing materials in multifamily buildings and prevalent PCB-containing materials in industrial buildings. High number of missing values for hazardous materials in single-family houses, production buildings, and warehouses were highlighted to improve the current environmental investigation practices.
The explorative approach of delineating quality environmental data demonstrates a general workflow for studying in situ hazardous building materials’ management. The novel method is cost-effective in identifying general occurrence patterns of hazardous building materials and can be used to complement traditional environmental investigations. The findings from the cross-validation matrix showed that the potential data subgroups for machine learning modelling were school buildings, commercial buildings, multifamily houses, and industrial buildings at hazardous substance and material levels. Future research is planned to include more observations from the abovementioned building classes to increase the prediction accuracy and conduct cross-verification when constructing machine learning models. The developed data-driven method and the structure of the training dataset proposed in the study are replicable in the countries accessible to the environmental-audit records and general building information.

Author Contributions

K.M. acquired the research fund and was responsible for project management. M.M. initiated the contact with the Gothenburg City Archives for arranging the data collection process, requested building registers from the authorities, helped structure the tables in the method and results and discussions sections, and revised the manuscript. T.J. assisted with merging building registers. P.-Y.W. screened the relevant documents, retrieved the information, compiled them into a dataset, drafted the manuscript and figures, and conducted the manuscript revision. All authors participated in cross-validation workshops, results discussion, and manuscript revision. C.S. conceived the idea of the cross-validation matrix in the results and discussions section. All authors have read and agreed to the published version of the manuscript.

Funding

This research was funded by the Swedish Foundation for Strategic Research (SSF), grant number FID18-0021.

Institutional Review Board Statement

Not applicable.

Informed Consent Statement

Not applicable.

Data Availability Statement

The environmental inventories collected in the study are confidential and regulated by the Gothenburg city archive. The national building registers acquired from different authorities were requested for the specific research purpose. Therefore, they are not available online or in the MDPI Research database.

Acknowledgments

The work is part of the research project Prediction of hazardous materials in buildings using AI and is supported by RISE Research Institutes of Sweden. Special thanks are sent to Theresa Salhammar and Anna-Sara Berg in the Gothenburg City Archives for the support of searching environmental inventories in the building permit documents.

Conflicts of Interest

The authors declare no conflict of interest.

Appendix A

The metadata of the Gothenburg dataset from Swedish EPC, Swedish Real Estate Taxation register, and Municipal cadastral register.
Table A1. Swedish Energy Performance Certificate (EPC) data overview.
Value CategoryData SpecificationMeasurement Type
1. Matching, keys, and sortingNational real estate number and index, Address, EPC index
2. Building characteristicsBuilding age
Complexity
Shared walls with other buildings
Recognition of heritage value
Scale variable [Year]
Binary [Complex, non-complex]
Ordinal [Detached, semi-attached, attached]
Nominal
3. Building usageNational registration of building usage type code.
Detailed usage of building
Nominal
Share of building used for the 12 most common types
4. Building areaHeated floor area
Floors
Stair cases
Number of apartments
Floors below ground
Heated garage space
Scale [m2]
Ordinal
Ordinal
Ordinal
Ordinal
Scale [m2]
5. HeatingEnergy usage for heating divided in 13 energy sources
Tic box for measurement type
Period of measurement
Scales [kWh/year]
Nominal [Measured, Distributed]
Interval [Year and Month]
6. Household electricity and waterCooling energy usage
Tap water heat usage
Electricity usage divided in: domestic, shared, and non-domestic usage
All measurements in the category include Scale [kWh/year] and Nominal [Measured, Distributed]
7. VentilationVentilation type
Ventilation control conducted
Nominal [Exhaust, balanced, balanced with heat exchanger, Exhaust with heat pump, natural ventilation]
Nominal [Yes, No, Partially]
8. Recommended energy usage reducing measuresTic box for 28 common energy usage reducing measures
Estimated decreased energy usage
Estimated cost per saved kWh
Nominal
Scale [kWh/year]
Scale [SEK/kWh]
Table A2. Swedish Real Estate Taxation register overview.
Value CategoryData SpecificationMeasurement Type
1. Matching, keys, and sortingCoordinates, National real estate number and index, Address
2. Building agesBuilding age
Value year (Swedish tax agency’s proxy for renovation state)
Latest renovation year
Scale variable [Year]
3. Building taxation valueBuilding taxation value
Rent level
Scale variable [SEK]
4. Building areaBuilding size (BOA)Scales [m2]
Table A3. Municipal cadastral register overview.
Value CategoryData SpecificationMeasurement Type
1. Matching, keys, and sortingCoordinates, National real estate number and index, Address
2. Building agesBuilding ageScale variable [Year]
3. Building usageSimple classification
Detailed classification
Nominal [1–7]
Nominal [1–99]
4. Building areaBuilding size (BOA)Scales [m2]
5. Building statusChanges
Demolished or burned down
Nominal [Building permit applied for, Under construction, Existing building, Changed information]
Binary
6. Legal statusLand ownership
Legal land restrictions
Binary
Binary

Appendix B

Table A4. Percentage of missing data of the hazardous materials in each building class.
Substance and MaterialClass
C1 *C2 *C3 *C4 *C5 *C6 *C7 *C8 *C9 *C10 *
N = 102N = 46N = 24N = 66N = 30N = 48N = 23N = 39N = 10N = 12
Asbestos19%4%17%5%7%2%22%5%30%33%
Pipe insulation58%30%62%36%33%44%52%46%80%58%
Valves80%63%79%82%77%81%87%79%80%100%
Door/windows insulation70%43%62%44%30%44%57%41%70%75%
Cement panel75%50%67%74%57%65%87%77%70%92%
Tile/clinker61%35%67%21%23%35%70%44%80%67%
Carpet glue68%48%67%33%57%40%83%54%80%67%
Floor mat91%54%96%27%40%44%70%67%90%75%
Ventilation channel93%65%100%44%53%54%83%67%90%83%
Switchboard97%93%100%52%83%79%91%74%100%92%
Joint99%67%100%80%67%75%91%90%90%100%
Others91%72%96%70%73%81%83%74%90%92%
PCB34%24%21%8%10%17%4%8%10%25%
Joint/sealant64%35%50%30%40%42%70%49%70%67%
Insulation windows67%63%58%41%33%46%48%54%80%67%
Capacitors in lamp/burner59%59%38%35%27%52%43%28%70%67%
Acrylic flooring64%65%54%50%60%56%74%59%80%50%
Door closer99%100%96%89%93%92%91%97%100%100%
Cable with PCB-oil99%98%100%92%83%90%100%97%100%100%
Others93%91%96%91%80%88%91%92%90%100%
CFC25%48%21%35%23%38%48%15%40%50%
Fridge/freezer44%54%42%42%63%52%52%41%70%50%
Building insulation62%70%46%53%57%58%87%62%80%67%
Cooling unit66%65%54%52%37%60%74%49%80%67%
Rolling gate98%100%96%94%97%96%96%87%90%100%
Others93%98%96%95%97%96%91%95%90%92%
Mercury26%20%12%11%0%19%13%0%10%25%
Lighting tube45%37%29%12%0%25%17%5%20%25%
Relay/switch61%67%50%59%57%77%78%69%80%67%
Level monitor/sensor71%78%54%47%50%73%83%64%80%83%
Thermometer68%61%50%45%47%69%70%67%70%75%
Thermostat70%80%54%59%57%83%87%79%80%83%
Water lock/drain line69%78%50%62%63%71%78%77%80%83%
Low energy lamp94%91%100%56%70%81%70%82%50%83%
Doorbell97%100%100%95%90%98%100%100%90%100%
Others92%91%75%67%60%81%74%64%70%83%
* Building class C1: Single-family house; C2: Multifamily house; C3: Temporary dwelling; C4: School; C5: Office; C6: Commercial building; C7: Production building; C8: Industrial building; C9: Warehouse; C10: Other/Infrastructure.

Appendix C

Table A5. The positive detection rates and missing data of hazardous materials in construction year clusters (numbers in bold contain than 30 observations).
Substance and MaterialConstruction Year Group
1930–19391940–19491950–19591960–19691970–1979
N = 41N = 37N = 43N = 112N = 69
RateNARateNARateNARateNARateNA
Asbestos0.7610%0.6614%0.8616%0.756%0.6912%
Pipe insulation0.5441%0.4749%0.7944%0.4234%0.2752%
Valves0.2571%0.3165%0.5086%0.4375%086%
Door/windows insulation0.5432%0.3157%0.7563%0.4543%0.3348%
Cement panel board0.3666%0.5068%0.5574%0.4967%0.5958%
Tile/clinker0.3254%0.2149%0.1849%0.4730%0.2645%
Carpet glue0.1961%0.1257%0.3958%0.3744%0.0355%
Floor mat0.5783%0.2162%0.3256%0.6254%0.1954%
Ventilation channel0.7076%0.4476%0.8163%0.6362%0.3761%
Switchboard0.5085%0.3384%086%0.2179%077%
Joint090%0.1784%0.2581%0.7479%0.2287%
Others1.0078%0.5781%1.0084%0.7575%0.4078%
PCB0.6120%0.4827%0.5828%0.4413%0.6314%
Joint/sealant0.1156%057%0.1158%0.2931%0.2843%
Insulation windows0.1154%0.1462%0.2460%0.1849%0.2248%
Capacitors in lamp/burner0.5934%0.5051%0.5658%0.3947%0.6836%
Acrylic flooring0.0659%059%0.1260%0.0256%0.0459%
Door closer098%1.0089%1.0088%1.0098%0.6796%
Cable with PCB-oil0.5090%097%1.0098%0.2096%0.3396%
Others0.5090%0.2589%0.3393%0.6986%096%
CFC0.7822%0.6727%0.7242%0.6828%0.6035%
Fridge/freezer0.2734%0.2146%0.3356%0.2946%0.3557%
Building insulation0.8163%0.6062%0.6365%0.6456%0.6062%
Cooling unit0.5749%0.5057%0.5063%0.2954%0.4861%
Rolling gate098%0.5089%1.0093%099%0.2594%
Others0.7590%0.3392%0.6793%0.3397%0.5097%
Mercury0.9115%0.7319%0.8333%0.789%0.9510%
Lighting tube0.8822%0.8432%0.8842%0.7921%0.9713%
Relay/switch0.4668%0.3670%0.1963%0.2260%0.2172%
Level monitor/sensor0.2763%0.1176%0.1077%0.2858%0.3870%
Thermometer0.4063%0.2073%0.2774%0.4152%0.3057%
Thermostat0.1076%0.1278%0.1179%0.1467%0.0674%
Water lock/drain line0.3363%0.1073%0.1077%0.1065%0.0572%
Low energy lamp1.0080%0.8384%1.0086%1.0084%1.0067%
Doorbell098%097%098%1.0098%099%
Others1.0085%0.7876%1.0081%0.9773%0.8778%

Appendix D

Table A6. The positive detection rates and missing data of hazardous materials in area clusters (numbers in bold contain more than 30 observations).
Substance and MaterialArea Range (m2)
–100101–10001001–20002001–30003000–
N = 74N = 143N = 52N = 24N = 67
RateNARateNARateNARateNARateNA
Asbestos0.3818%0.7312%0.824%0.874%0.857%
Pipe insulation0.0462%0.3743%0.6840%0.6442%0.7637%
Valves0.1776%0.2086%0.6473%0.2971%0.3272%
Door/windows insulation065%0.3550%0.5544%0.4250%0.7942%
Cement panel board0.2669%0.4376%0.7062%0.7863%0.5260%
Tile/clinker0.0762%0.3443%0.3940%0.4342%0.4428%
Carpet glue0.0464%0.1755%0.5042%0.2058%0.3845%
Floor mat0.6093%0.3063%0.5638%0.5058%0.4446%
Ventilation channel0.5097%0.5170%0.6748%0.6058%0.5952%
Switchboard1.0097%0.1577%085%0.2079%0.2179%
JointNA100%0.3191%0.5371%0.6788%0.3864%
Others0.2093%0.7680%0.7569%0.7583%0.7979%
PCB0.3432%0.4716%0.4319%0.7825%0.7810%
Joint/sealant058%0.1750%0.1444%0.0954%0.3727%
Insulation windows0.0462%0.1550%0.0667%0.3654%0.2643%
Capacitors in lamp/burner0.3955%0.5142%0.4360%0.6442%0.7845%
Acrylic flooring058%0.0356%0.0771%063%0.0755%
Door closerNA100%1.0098%1.0090%NA100%0.6791%
Cable with PCB-oilNA100%0.2597%094%1.0096%0.4390%
Others0.5097%0.4592%1.0098%0.5092%0.3679%
CFC0.5326%0.7126%0.7140%0.6454%0.8034%
Fridge/freezer0.4942%0.7041%0.6550%0.5663%0.7761%
Building insulation0.3055%0.2857%0.1867%0.2567%0.2767%
Cooling unit0.2059%0.3555%0.5967%0.2263%0.6652%
Rolling gateNA100%0.2097%0.5092%NA100%0.7594%
Others099%0.6294%096%1.0096%0.3396%
Mercury0.5526%0.8812%0.9317%0.9017%0.9113%
Lighting tube0.6243%0.8920%0.9135%0.8517%0.9419%
Relay/switch0.2557%0.3362%0.2562%0.1471%0.5079%
Level monitor/sensor062%0.3364%0.1473%0.2971%0.4863%
Thermometer0.0361%0.2961%0.4856%0.4058%0.5861%
Thermostat062%0.1669%077%079%0.5079%
Water lock/drain line0.1461%0.1666%079%079%0.2873%
Low energy lamp1.0099%0.9775%0.8081%1.0083%1.0073%
DoorbellNA100%0.6798%096%NA100%096%
Others0.6796%0.9475%0.9081%1.0079%0.9475%

References

  1. Wahlström, M.; Teittinen, T.; Kaartinen, T.; van Liesbet, C. Hazardous Substances in Construction Products and Materials: PARADE. Best Practices for Pre-Demolition AUDITS Ensuring High Quality RAw Materials; VTT Technical Research Centre of Finland: Esbo, Finland, 2019. [Google Scholar]
  2. Govorko, M.; Fritschi, L.; Reid, A. Using a mobile phone app to identify and assess remaining stocks of in situ asbestos in australian residential settings. Int. J. Environ. Res. Public Health 2019, 16, 4922. [Google Scholar] [CrossRef] [PubMed] [Green Version]
  3. Neitzel, R.L.; Sayler, S.K.; Demond, A.H.; d’Arcy, H.; Garabrant, D.H.; Franzblau, A. Measurement of asbestos emissions associated with demolition of abandoned residential dwellings. Sci. Total Environ. 2020, 722, 137891. [Google Scholar] [CrossRef] [PubMed]
  4. Brown, K.W.; Minegishi, T.; Cummiskey, C.C.; Fragala, M.A.; Hartman, R.; MacIntosh, D.L. PCB remediation in schools: A review. Environ. Sci. Pollut. Res. 2016, 23, 1986–1997. [Google Scholar] [CrossRef] [PubMed]
  5. Laurie Kazan-Allen Chronology of Asbestos Bans and Restrictions. Available online: http://www.ibasecretariat.org/chron_ban_list.php (accessed on 17 January 2021).
  6. Franzblau, A.; Demond, A.H.; Sayler, S.K.; D’Arcy, H.; Neitzel, R.L. Asbestos-containing materials in abandoned residential dwellings in Detroit. Sci. Total Environ. 2020, 714, 136580. [Google Scholar] [CrossRef] [PubMed]
  7. Mecharnia, T.; Khelifa, L.C.; Pernelle, N.; Hamdi, F. An approach toward a prediction of the presence of asbestos in buildings based on incomplete temporal descriptions of marketed products. In Proceedings of the 10th International Conference on Knowledge Capture, Marina Del Rey, CA, USA, 19–21 November 2019; pp. 239–242. [Google Scholar]
  8. Kim, J.T.; Yu, C.W.F. Hazardous materials in buildings. Indoor Built Environ. 2014, 23, 44–61. [Google Scholar] [CrossRef]
  9. Wahlström, M.; Bergmans, J.; Teittinen, T.; Bachér, J.; Smeets, A.; Paduart, A. Construction and Demolition Waste: Challenges and Opportunities in a Circular Economy; Eionet Report—ETC/WMGE 2020/1; European Enviroment Agency European Topic Centre on Waste and Materials in a Green Economy: Mol, Belgium, 2020. [Google Scholar]
  10. Deloitte. Study on Resource Efficient Use of Mixed Wastes, Improving Management of Construction and Demolition Waste - Final Report; Prepared for the European Commission, DG ENV, Deloitte: Nantes, France, 2017. [Google Scholar]
  11. Wahlström, M.; Zu Castell-Rüdenhausen, M.; Hradil, P.; Smith, K.H.; Oberender, A.; Ahlm, M.; Götbring, J.; Hansen, J.B. Improving Quality of Construction & Demolition Waste-Requirements for Pre-Demolition Audit; Nordic Council of Ministers: Copenhagen, Denmark, 2019. [Google Scholar]
  12. Bergmans, J.; Dierckx, P.; Broos, K. Semi-selective demolition: Current demolition practices in Flanders. In Proceedings of the HISER Conference, Delft, The Netherlands, 21–23 June 2017. [Google Scholar]
  13. Wu, P.-Y.; Mjörnell, K.; Sandels, C.; Mangold, M. Machine Learning in Hazardous Building Material Management: Research Status and Applications. Recent Prog. Mater. 2021, 3. [Google Scholar] [CrossRef]
  14. Kantardzic, M. Data Mining: Concepts, Models, Methods, and Algorithms, 3rd ed.; Wiley-IEEE Press: Hoboken, NJ, USA, 2019; ISBN 978-1-119-51604-0. [Google Scholar]
  15. Hong, T.; Wang, Z.; Luo, X.; Zhang, W. State-of-the-art on research and applications of machine learning in the building life cycle. Energy Build. 2020, 212, 109831. [Google Scholar] [CrossRef] [Green Version]
  16. Govorko, M.H.; Fritschi, L.; White, J.; Reid, A. Identifying Asbestos-Containing Materials in Homes: Design and Development of the ACM Check Mobile Phone App. JMIR Form. Res. 2017, 1, e7. [Google Scholar] [CrossRef] [Green Version]
  17. Commision, E. EUR-Lex—52012DC0433—EN—EUR-Lex. Available online: https://eur-lex.europa.eu/legal-content/EN/TXT/?uri=CELEX%3A52012DC0433 (accessed on 16 March 2021).
  18. Commision, E. Committee and the Committee of the Regions on Resource Efficiency Opportunities in the Building Sector; European Commission: Brussels, Belgium, 2014. [Google Scholar]
  19. ECORYS. EU Construction & Demolition Waste Management Protocol; European Commission: Brussels, Belgium, 2016. [Google Scholar]
  20. Wilk, E.; Krówczyńska, M.; Zagajewski, B. Modelling the spatial distribution of asbestos-cement products in Poland with the use of the random forest algorithm. Sustainability 2019, 11, 4355. [Google Scholar] [CrossRef] [Green Version]
  21. Krówczyńska, M.; Raczko, E.; Staniszewska, N.; Wilk, E. Asbestos-cement roofing identification using remote sensing and convolutional neural networks (CNNs). Remote Sens. 2020, 12, 408. [Google Scholar] [CrossRef] [Green Version]
  22. Johansson, T.; Olofsson, T.; Mangold, M. Development of an energy atlas for renovation of the multifamily building stock in Sweden. Appl. Energy 2017, 203, 723–736. [Google Scholar] [CrossRef]
  23. Mangold, M.; Österbring, M.; Wallbaum, H. Handling data uncertainties when using Swedish energy performance certificate data to describe energy usage in the building stock. Energy Build. 2015, 102, 328–336. [Google Scholar] [CrossRef] [Green Version]
  24. Visualizing Distributions of Data—Seaborn 0.11.1 Documentation. Available online: https://seaborn.pydata.org/tutorial/distributions.html (accessed on 22 June 2021).
  25. Box Plot—Wikipedia. Available online: https://en.wikipedia.org/wiki/Box_plot (accessed on 22 June 2021).
  26. Nylander, O. Svensk Bostad 1850–2000; Studentlitteratur: Lund, Sweden, 2013. [Google Scholar]
  27. Hall, T.; Vidén, S. The million homes programme: A review of the great Swedish planning project. Plan. Perspect. 2005, 20, 301–328. [Google Scholar] [CrossRef]
  28. Pasichnyi, O.; Wallin, J.; Levihn, F.; Shahrokni, H.; Kordas, O. Energy performance certificates—New opportunities for data-enabled urban energy policy instruments? Energy Policy 2019, 127, 486–499. [Google Scholar] [CrossRef]
  29. Simon, A. Definition of Validation Levels and Other Related Concepts; Eurostat: Luxembourg, 2013. [Google Scholar]
  30. Robson, M.; Melymuk, L.; Csiszar, S.A.; Giang, A.; Diamond, M.L.; Helm, P.A. Continuing sources of PCBs: The significance of building sealants. Environ. Int. 2010, 36, 506–513. [Google Scholar] [CrossRef]
  31. Donovan, S.; Pickin, J. An Australian stocks and flows model for asbestos. Waste Manag. Res. 2016, 34, 1081–1088. [Google Scholar] [CrossRef]
  32. Kohler, M.; Tremp, J.; Zennegg, M.; Seiler, C.; Minder-Kohler, S.; Beck, M.; Lienemann, P.; Wegmann, L.; Schmid, P. Joint sealants: An overlooked diffuse source of polychlorinated biphenyls in buildings. Environ. Sci. Technol. 2005, 39, 1967–1973. [Google Scholar] [CrossRef] [PubMed]
  33. MacIntosh, D.L.; Minegishi, T.; Fragala, M.A.; Allen, J.G.; Coghlan, K.M.; Stewart, J.H.; McCarthy, J.F. Mitigation of building-related polychlorinated biphenyls in indoor air of a school. Environ. Health A Glob. Access Sci. Source 2012, 11, 24. [Google Scholar] [CrossRef] [PubMed] [Green Version]
  34. Herrick, R.F.; Stewart, J.H.; Allen, J.G. Review of PCBs in US schools: A brief history, an estimate of the number of impacted schools, and an approach for evaluating indoor air samples. Environ. Sci. Pollut. Res. 2016, 23, 1975–1985. [Google Scholar] [CrossRef] [PubMed] [Green Version]
  35. Diamond, M.L.; Melymuk, L.; Csiszar, S.A.; Robson, M. Estimation of PCB stocks, emissions, and urban fate: Will our policies reduce concentrations and exposure? Environ. Sci. Technol. 2010, 44, 2777–2783. [Google Scholar] [CrossRef] [PubMed]
Figure 1. A proposed procedure for creating the training dataset comprised of (1) data collection, (2) data processing, and (3) data analysis.
Sustainability 13 07836 g001
Figure 2. Clustering the building classes according to the data sources in the training dataset through aggregating the number of inventories (N = 402).
Sustainability 13 07836 g002
Figure 3. Overview of the experience level of the environmental investigators across the source data (N = 402).
Sustainability 13 07836 g003
Figure 4. Comparison between the Gothenburg subset and the training dataset within 1929–1982 by plotting normalized density distribution (on the left) and boxplot (on the right) across (A) construction year, (B) renovation year, (C) area, and (D) the level of floors.
Sustainability 13 07836 g004aSustainability 13 07836 g004b
Table 1. Overview of metadata in the training dataset.
Variable CategoryVariable SpecificationData TypeData Source
Environmental inventories
Matching keysNational real estate indexString and numerics [index]Permit registers
AddressString
InvestigationDocument typeNominal [report, protocol, control plan, demolition plan]Environmental audits
ScopeOrdinal [entire, part]
Investigation yearScale variable [year]
InvestigatorString
DecontaminationNominal [asbestos, PCB, NA]
Hazardous substanceAsbestosNominal [positive, negative, NA]Environmental audits
PCB (polychlorinated biphenyl)Nominal [positive, negative, NA]
CFC (chlorofluorocarbon)Nominal [positive, negative, NA]
MercuryNominal [positive, negative, NA]
Hazardous materialBuilding components *Nominal [positive, negative, NA]Environmental audits
Building parameterClass String [type]Permit registers
Usage of the buildingString
Construction yearScale variable [year]
Renovation yearScale variable [year]
Renovation partString [the extent of renovation]
Building structure ** String [material]
Interior areas (BOA)Scales [m2 ]
FloorsOrdinal
National building registers
Matching keysNational real estate index String and numerics [index]Swedish Tax Agency
AddressStringBoard of Housing
Building usageClass codeNominalMunicipality
Category codeNominal
Building parameterConstruction yearScale variable [year]Swedish Tax Agency
Renovation yearScale variable [year]
ComplexityNominal [complex, non-complex]Board of Housing
Ventilation typeNominal [exhaust, balanced, balanced with heat exchanger, exhaust with heat pump, natural ventilation]
Building areaInterior areas (BOA) ***Scales [m2 ]
FloorsOrdinal
* Building components imply the building materials that contain primary or secondary contaminants. The former are made of hazardous substances and the latter contain transmitted hazardous substances through external sources. ** Building structure describes the building components, including foundation, structure, roof, and façade. *** BOA and LOA are property valuation measures of usable heated floor area for habitation and non-habitation. BOA and LOA are registered for 90% of the multifamily buildings and 74% of the single-family houses [23].
Table 2. Overview of building parameters for each building class in the Gothenburg dataset and the training dataset in 1929–1982 (numbers in bold show similar building characteristics between the two datasets).
Building ClassDatasetDistribution [%]Mean Year Built Mean Year Renovated Mean Area [m2]Mean Floor [N]
Single-family houseGothenburg 64.6%196219891712
Training 23.2%195819801291
Multifamily houseGothenburg 24.6%1953199931104
Training 12.2%1961199833244
Temporary dwellingGothenburg NANANANANA
Training 6.50%19541971451
SchoolGothenburg 2.80%1966200223522
Training 17.9%1968201014972
OfficeGothenburg NANANANANA
Training 7.70%1963199551464
Commercial buildingGothenburg 0.40%1963200666253
Training 11.6%1962200156113
Production buildingGothenburg 0.3%1968199864102
Training 5.1%1956200147283
Industrial buildingGothenburg 0.5%1964199550052
Training 11.0%1951200846802
WarehouseGothenburg NANANANANA
Training 2.7%1968NA26881
Other/InfrastructureGothenburg 1.7%1962200142623
Training 2.1%1964NA28222
Unlabeled *Gothenburg5.0%NANANANA
* The unlabeled building class implied that the buildings were assigned to “unspecific” building types in the national building registers. Thus, it is not possible to determine its building class in the study.
Table 3. Positive detection rates and missing data of hazardous materials in each environmental inventory type (numbers in bold contain more than 30 observations).
Substance and Material Inventory
Detailed Simple
ReportProtocolControl Plan Demolition Plan
N = 195N = 88N = 42N = 77
RateNARateNARateNARateNA
Asbestos0.846%0.519%0.4714%0.7027%
Pipe insulation0.5634%0.1923%0.7879%0.7590%
Valves0.4479%0.1055%NA100%0.6796%
Door/windows insulation0.5934%0.0331%NA100%0.5097%
Cement panel board0.6167%0.2248%0.6793%0.7191%
Tile/clinker0.3927%0.1720%1.0093%0.6094%
Carpet glue0.3142%0.1130%NA100%0.4094%
Floor mat0.4031%0.4392%1.0095%0.7595%
Ventilation channel0.5547%0.8393%1.0098%1.0094%
Switchboard0.1766%NA100%NA100%NA100%
Joint0.4070%NA100%NA100%NA100%
Others 0.7569%0.5093%0.2590%0.5092%
PCB0.638%0.4910%0.1926%0.5152%
Joint/sealant0.6638%0.4123%0.1874%0.5092%
Insulation windows0.2043%0.1623%0.5095%0.6796%
Capacitors in lamp/burner0.6641%0.4412%0.1179%0.8384%
Acrylic flooring0.0658%023%0.1076%097%
Door closer0.7291%NA100%NA100%NA100%
Cable with PCB-oil0.2891%NA100%NA100%NA100%
Others0.5287%097%0.3386%0.5097%
CFC0.7934%0.6012%0.6219%0.5056%
Fridge/freezer0.7950%0.3915%0.7650%0.8179%
Building insulation0.2163%0.3320%0.4076%0.3396%
Cooling unit0.5354%0.1924%0.4088%0.7595%
Rolling gate0.4092%NA98%NA100%NA100%
Others0.3694%0.6797%0.4088%0.6796%
Mercury0.9911%0.723%0.5526%0.7635%
Lighting tube0.9916%0.616%0.7455%0.9756%
Relay/switch0.1973%0.2622%0.6969%0.7191%
Level monitor/sensor0.4266%0.0423%NA100%0.6796%
Thermometer0.4559%0.0922%1.0093%0.8094%
Thermostat0.1677%0.1322%NA100%NA99%
Water lock/drain line0.0873%0.1722%NA100%0.5097%
Low energy lamp0.9767%0.8393%1.0098%1.0092%
DoorbellNA96%0.5098%NA100%1.0099%
Others0.9768%1.0088%0.5090%0.8988%
Note: Positive detection rate = Number of Positives/(Total number of observations—Number of NA).
Table 4. The positive detection rates and missing data of hazardous materials in building classes (numbers in bold contain more than 30 observations).
Substance and MaterialBuilding Class
Multifamily HouseSchoolOfficeCommercial BuildingIndustrial Building
N = 46N = 66N = 30N = 48N = 39
RateNARateNARateNA RateNA RateNA
Asbestos0.934%0.895%0.717%0.742%0.615%
Pipe insulation0.8130%0.2436%0.5533%0.5644%0.6246%
Valves0.5963%0.2582%0.1477%0.2281%0.2579%
Door/windows insulation0.6243%0.4144%0.5230%0.5644%0.5741%
Cement panel board0.7850%0.3574%0.3857%0.4765%0.3377%
Tile/clinker0.6335%0.4021%0.3923%0.2935%0.2344%
Carpet glue0.5448%0.2333%0.4657%0.1740%0.2254%
Floor mat0.7154%0.3527%0.4440%0.2644%0.5467%
Ventilation channel0.8865%0.5744%0.4353%0.6854%0.3167%
Switchboard0.3393%0.0652%0.2083%0.1079%0.5074%
Joint0.8767%0.3180%0.2067%0.1775%0.5090%
Others 0.7772%0.7070%0.6273%0.7881%0.8074%
PCB0.5724%0.618%0.7010%0.5717%0.658%
Joint/sealant0.5735%0.5930%0.7840%0.5442%0.6549%
Insulation windows0.4163%0.1841%0.2033%0.1946%0.2254%
Capacitors in lamp/burner0.5859%0.5635%0.5527%0.5252%0.8628%
Acrylic flooring0.0665%0.0650%NA60%NA56%0.0659%
Door closerNA100%0.5789%0.5093%0.7592%1.0097%
Cable with PCB-oilNA98%NA92%0.2083%0.6090%1.0097%
Others1.0091%0.5091%0.3380%0.1788%0.6792%
CFC0.6248%0.7035%0.7423%0.8338%0.7415%
Fridge/freezer0.6754%0.6842%0.4563%0.7452%0.7441%
Building insulation0.3670%0.1953%0.2357%0.3058%0.2062%
Cooling unit0.3865%0.2852%0.7437%0.4760%0.4549%
Rolling gateNA100%0.2594%NA97%NA96%0.6087%
Others1.0098%NA95%1.0097%NA96%0.5095%
Mercury0.8620%0.9811%0.900%0.9519%0.950%
Lighting tube0.7937%0.9812%0.870%1.0025%0.975%
Relay/switch0.2767%0.0459%0.4657%0.2777%0.4269%
Level monitor/sensor0.1078%0.3747%0.2750%0.3173%0.5764%
Thermometer0.5661%0.2545%0.4447%0.4769%0.3867%
Thermostat0.2280%NA59%0.3857%NA83%0.5079%
Water lock/drain line0.1078%NA62%0.3663%NA71%0.1177%
Low energy lamp1.0091%1.0056%0.8970%1.0081%1.0082%
DoorbellNA100%NA95%0.3390%NA98%NA100%
Others1.0091%1.0067%0.9260%1.0081%1.0064%
Table 5. The overview of the assessment scores for each building class based on data quality and data size (numbers in bold are higher than 80 scores).
Substance and MaterialClass
C1 *C2 *C3 *C4 *C5 *C6 * C7 * C8 *C9 *C10 *
N = 102N = 46N = 24N = 66N = 30N = 48N = 23N = 39N = 10N = 12
Asbestos557932944686408400
Pipe insulation6788099484704400
Valves36440000000NA
Door/windows insulation7546099484804600
Cement panel board34450500420000
Tile/clinker7391098489704400
Carpet glue744509804704500
Floor mat04809848500000
Ventilation channel044NA1000470000
Switchboard00NA1000000NA0
Joint050NA000000NA
Others 00048000000
PCB588432924792429000
Joint/sealant7190096474804200
Insulation windows7444097484804500
Capacitors in lamp/burner70423596464604400
Acrylic flooring714009804804200
Door closer0NA000000NANA
Cable with PCB-oil00NA000NA0NANA
Others000000000NA
CFC58393494488808500
Fridge/freezer644009504604200
Building insulation71009904804100
Cooling unit7138099484804500
Rolling gate0NA0000000NA
Others0000000000
Mercury568132969283408500
Lighting tube623934979285428600
Relay/switch6736049000000
Level monitor/sensor7400994600000
Thermometer734209746480000
Thermostat740049000000
Water lock/drain line730049000000
Low energy lamp00NA48000000
Doorbell0NANA000NANA0NA
Others00047000000
* Building class C1: single-family house; C2: multifamily house; C3: temporary dwelling; C4: school; C5: office; C6: commercial building; C7: production building; C8: industrial building; C9: warehouse; C10: other/infrastructure.
Table 6. Ranking the hazardous substance and material detection records in building class based on the cross-validation results; only the assessment scores higher than 80 were listed.
RankClassSubstance Hazardous MaterialScoreNAN
14—SchoolAsbestosVentilation channel10044%66
14—SchoolAsbestosSwitchboard10052%66
24—SchoolAsbestosPipe insulation9936%66
24—SchoolAsbestosDoor/windows insulation9944%66
24—SchoolCFCCFC—Building insulation9953%66
24—SchoolCFCCFC—Cooling unit9952%66
24—SchoolMercuryLevel monitor/sensor9947%66
34—SchoolAsbestosTile/clinker9821%66
34—SchoolAsbestosCarpet glue9833%66
34—SchoolAsbestosFloor mat9827%66
34—SchoolPCBAcrylic flooring9850%66
44—SchoolPCBInsulation windows9741%66
44—SchoolMercuryLighting tube9712%66
44—SchoolMercuryThermometer9745%66
46— Commercial buildingAsbestosTile/clinker9735%48
54—SchoolPCBJoint/sealant9630%66
54—SchoolPCBCapacitors in lamp9635%66
54—SchoolMercury 9611%66
64—SchoolCFCFridge/freezer9542%66
74—SchoolAsbestos 945%66
74—SchoolCFC 9435%66
84—SchoolPCB 928%66
86—Commercial buildingPCB 9217%48
85—OfficeMercury 920%30
85—OfficeMercuryLighting tube920%30
92—Multifamily houseAsbestosTile/clinker9135%46
108—Industrial buildingPCB 908%39
102—Multifamily housePCBJoint/sealant9035%46
116—Commercial buildingCFC 8838%48
112—Multifamily houseAsbestosPipe insulation8830%46
126—Commercial buildingAsbestos 862%48
128—Industrial buildingMercuryLighting tube865%39
138—Industrial buildingCFC 8515%39
138—Industrial buildingMercury 850%39
136—Commercial buildingMercuryLighting tube8525%48
148—Industrial buildingAsbestos 845%39
142—Multifamily housePCB 8424%46
156—Commercial buildingMercury 8319%48
162—Multifamily houseMercury 8120%46
Publisher’s Note: MDPI stays neutral with regard to jurisdictional claims in published maps and institutional affiliations.

