
Environmental Particulate Matter (PM) Exposure Assessment of Construction Activities Using Low-Cost PM Sensor and Latin Hypercubic Technique


Abstract
:1. Introduction
2. Materials and Methods
2.1. Construction Materials
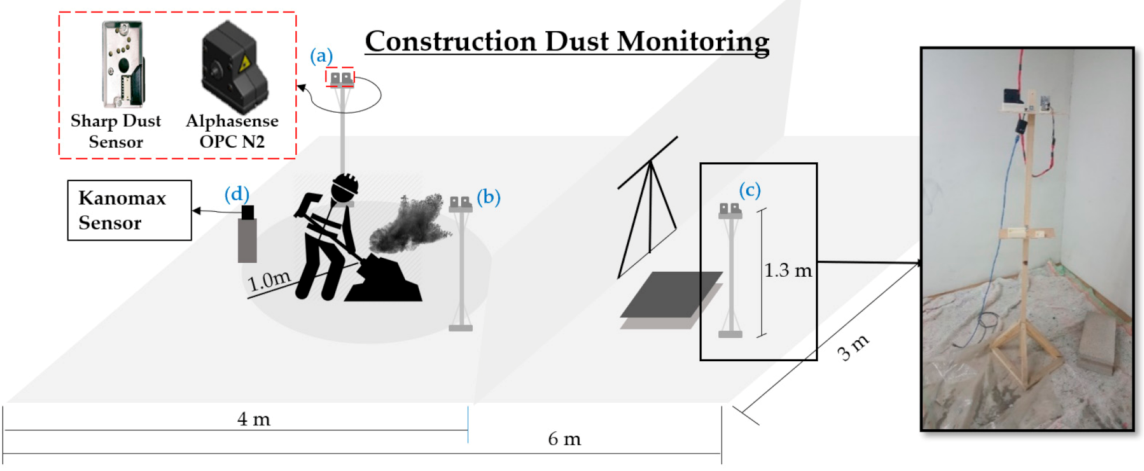
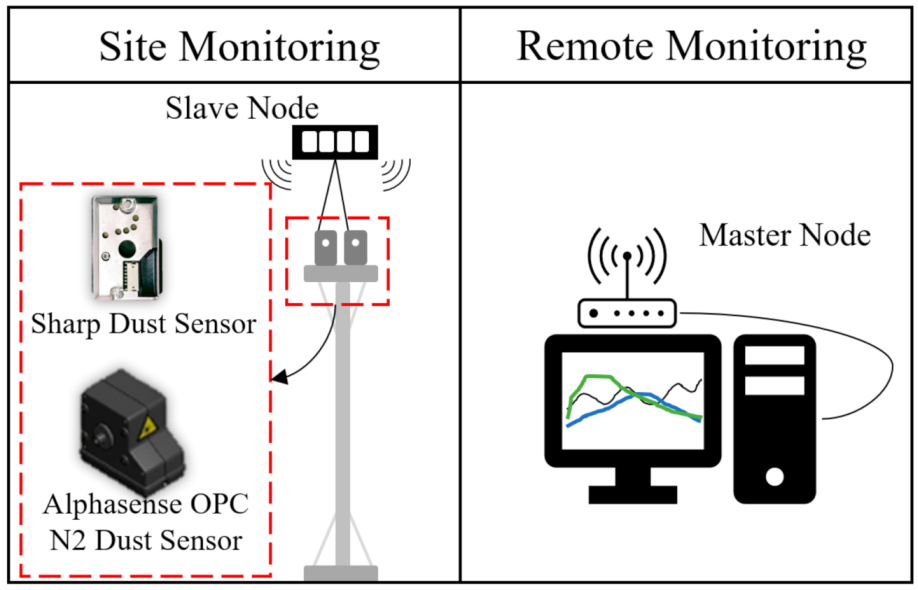
2.2. The PM Monitoring System
2.2.1. Alphasense OPC-N2 PM Sensor
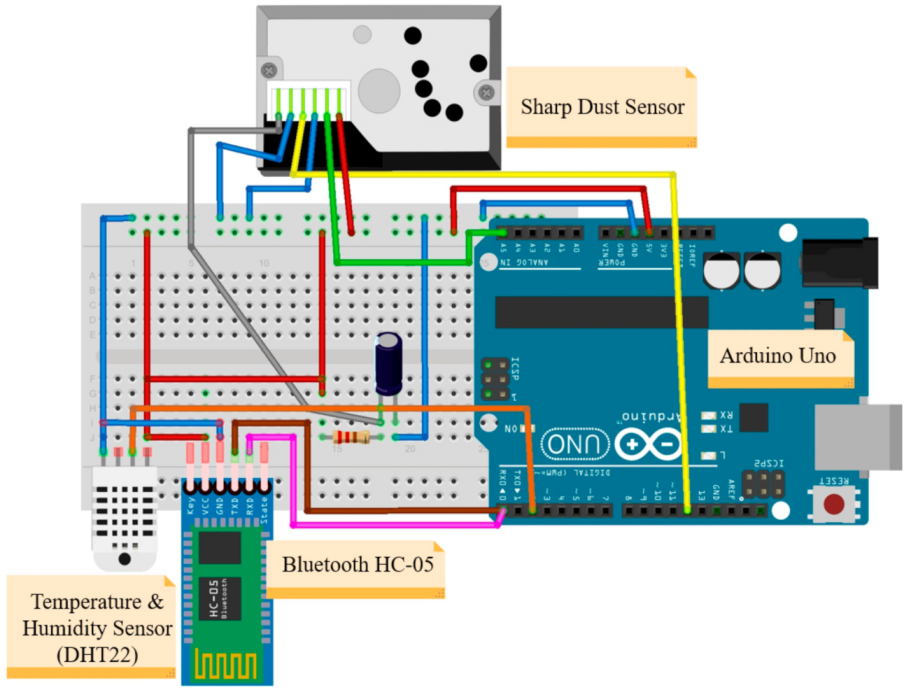
2.2.2. Sharp GP2Y1010AU0F PM Sensor
- -
- The indoor temperature and relative humidity of the workplace were measured using a DHT22 sensor. It is one-of-a-kind due to its low power consumption and ease of installation in the circuit.
- -
- The HC-05 Bluetooth module must be mounted on both the slave and master node to transmit and receive data up to 100 m, based on weather and geographic conditions.
- -
- The Arduino UNO built on the ATmega328P microcontroller was selected for the Arduino system because of its ease of use and programming libraries.
2.3. Experimental Procedures
3. Results
3.1. Calibration, and Correlation of the Low-Cost PM Sensors
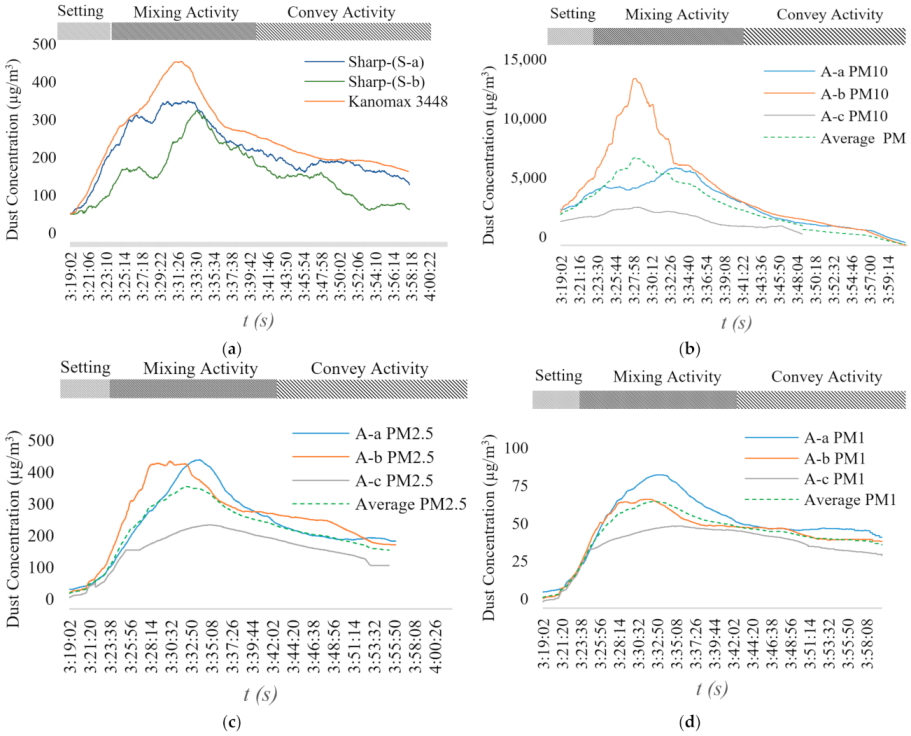
3.2. Indoor Construction Activities PM Monitoring
3.2.1. Mortar Mixing (Cement and Sand Aggregates) PM Monitoring
3.2.2. Concrete Mixing (Cement, Sand and Coarse Aggregates) PM Monitoring
3.3. Hypothetical Case Assessment
4. Discussion and Limitation
5. Conclusions and Future Outlook
5.1. Conclusions
- During the experiment, light scattering PM sensors showed a high correlation between the same sensors and benchmark.
- The PM concentration generated from the dry mortar mixing exceeded the optimal level of exposure: the average exposure levels of PM10, PM2.5 and PM1 were 3522.62, 236.46 and 47.62 µg/m3, respectively, while those for aggregate mixing of concrete were 6762.72 µg/m3, 471.30 and 59.09 µg/m3, respectively. The PM10 and PM2.5 concentrations generated by the concrete mixing were twice those from mortar mixing by volume.
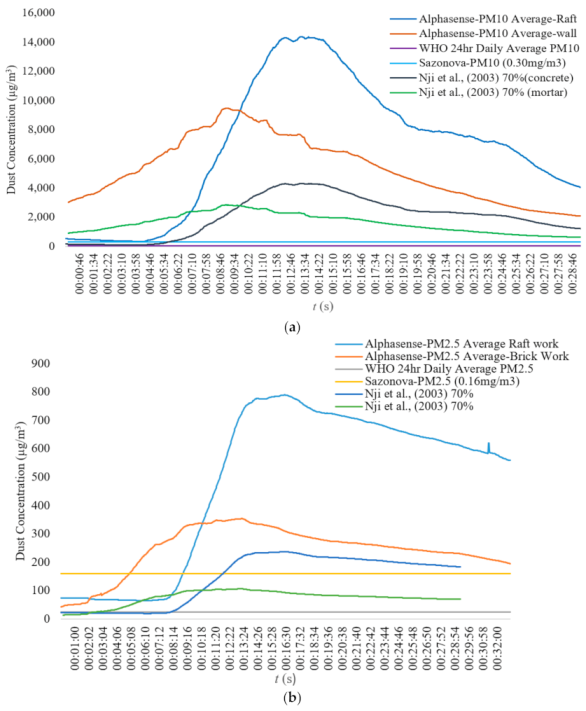
- A hypothetical case study was conducted to monitor the actual environmental PM exposure levels in a construction site. The environmental PM exposure levels calculates from the Latin Hypercubic method exceeded the WHO’s defined threshold values for the 24-h average environmental exposure levels of PM10 and PM2.5 by 70 and 9.87 times for mortar aggregate mixing and 135 and 18.84 times for concrete mixing, respectively. Likewise, the RCS exposure results for mortar and concrete mixing were twice and three times higher than the RCS permissible exposure threshold advised by the EPA.
- Deploying low-cost PM sensors without control measures utilization for indoor construction activity monitoring is not recommended.
5.2. Future Outlook
Author Contributions
Funding
Institutional Review Board Statement
Informed Consent Statement
Data Availability Statement
Conflicts of Interest
References
- Li, C.Z.; Zhao, Y.; Xu, X. Investigation of dust exposure and control practices in the construction industry: Implications for cleaner production. J. Clean. Prod. 2019, 227, 810–824. [Google Scholar] [CrossRef]
- Midwest Research Group. Estimating Particulate Matter Emission from Construction Operation: Final Report; Eastern Research Group: Lexington, MA, USA, 1999. [Google Scholar]
- Yan, H.; Ding, G.; Li, H.; Wang, Y.; Zhang, L.; Shen, Q.; Feng, K. Field Evaluation of the Dust Impacts from Construction Sites on Surrounding Areas: A City Case Study in China. Sustainability 2019, 11, 1906. [Google Scholar] [CrossRef] [Green Version]
- Nij, E.T.; Hilhorst, S.; Spee, T.; Spierings, J.; Steffens, F.; Lumens, M.; Heederik, D. Dust control measures in the construction industry. Ann. Occup. Hyg. 2003, 47, 211–218. [Google Scholar] [CrossRef] [Green Version]
- Li, J.; Li, H.; Ma, Y.; Wang, Y.; Abokifa, A.; Lu, C.; Biswas, P. Spatiotemporal distribution of indoor particulate matter concentration with a low-cost sensor network. Build. Environ. 2018, 127, 138–147. [Google Scholar] [CrossRef]
- Wallace, K.A.; Cheung, W.M. Development of a compact excavator mounted dust suppression system. J. Clean. Prod. 2013, 54, 344–352. [Google Scholar] [CrossRef] [Green Version]
- Kim, D.; Kim, J.; Seo, S. Real-Time Measurement of Indoor PM Concentrations on Daily Change of Endocrine Disruptors in Urine Samples of New Mothers. Sustainability 2020, 12, 6166. [Google Scholar] [CrossRef]
- OSHA. Crystalline Silica Exposure. Available online: https://www.osha.gov/Publications/osha3176.html (accessed on 20 February 2021).
- HSE. EH40/2005 Workplace Exposure Limits; TSO: Norwich, UK, 2018; ISBN 9780717667031. [Google Scholar]
- Morakinyo, O.M.; Adebowale, A.S.; Mokgobu, M.I.; Mukhola, M.S. Health risk of inhalation exposure to sub-10 µm particulate matter and gaseous pollutants in an urban-industrial area in South Africa: An ecological study. BMJ Open 2017, 7, e013941. [Google Scholar] [CrossRef]
- Pope, C.A., III; Dockery, D.W. Health Effects of Fine Particulate Air Pollution: Lines that Connect. J. Air Waste Manag. Assoc. 2006, 56, 709–742. [Google Scholar] [CrossRef]
- Sharma Ultrafine Dust Leading to 4.2 Million Premature Deaths Every Year, 60% of Them from Heart Attacks and Strokes | Health | Hindustan Times. Available online: https://www.hindustantimes.com/health/ultrafine-dust-leading-to-4-2-million-premature-deaths-every-year-60-of-them-from-heart-attacks-and-strokes/story-aiw2JEbi86L7ESsWMpKlNL.html (accessed on 21 March 2021).
- Peters, S.; Thomassen, Y.; Fechter-Rink, E.; Kromhout, H. Personal exposure to inhalable cement dust among construction workers. J. Environ. Monit. 2008, 11, 174–180. [Google Scholar] [CrossRef]
- Xing, J.; Ye, K.; Zuo, J.; Jiang, W. Control Dust Pollution on Construction Sites: What Governments Do in China? Sustainability 2018, 10, 2945. [Google Scholar] [CrossRef] [Green Version]
- Noh, H.-J.; Lee, S.-K.; Yu, J.-H. Identifying Effective Fugitive Dust Control Measures for Construction Projects in Korea. Sustainability 2018, 10, 1206. [Google Scholar] [CrossRef] [Green Version]
- Hall, E.S.; Kaushik, S.M.; Vanderpool, R.W.; Duvall, R.M.; Beaver, M.R.; Long, R.W.; Solomon, P.A. Integrating Sensor Monitoring Technology into the Current Air Pollution Regulatory Support Paradigm Practical Considerations. Am. J. Environ. Eng. 2014, 4, 147–154. [Google Scholar] [CrossRef]
- BSI BS EN. 12341:2014 Ambient Air. Standard Gravimetric Measurement Method for the Determination of the PM10 or PM2.5 Mass Concentration of Suspended Particulate Matter. 2014. Available online: https://ec.europa.eu/environment/air/pdf/finalwgreporten.pdf (accessed on 20 June 2021).
- EPA. Air Sensor Guidebook, Air Sensor Guidebook. Epa/600/R-14/159 2014. Available online: https://cfpub.epa.gov/si/si_public_record_report.cfm?dirEntryId=277996&simpleSearch=1&searchAll=air+sensor+guidebook (accessed on 20 June 2021).
- Sazonova, A.; Kopytenkova, O.; Staseva, E. Risk of pathologies when exposed to fine dust in the construction industry. IOP Conf. Ser. Mater. Sci. Eng. 2018, 365. [Google Scholar] [CrossRef]
- WHO. Air Quality Guidelines. Global Update Particulate Matter, Ozone, Nitrogen Dioxide and Sulfur Dioxide; WHO: Geneva, Switzerland, 2005; ISBN 92-890-1358-3. [Google Scholar]
- Australian Governments Department of Industry, Innovation, and Science. Available online: https://www.safeworkaustralia.gov.au/exposure-standards (accessed on 19 June 2021).
- European Commission. Air Quality Standards. Available online: http://ec.europa.eu/environment/air/quality/standards.htm (accessed on 21 February 2021).
- Anjum, M.S.; Ali, S.M.; Imad-Ud-Din, M.; Subhani, M.A.; Anwar, M.N.; Nizami, A.-S.; Ashraf, U.; Khokhar, M.F. An Emerged Challenge of Air Pollution and Ever-Increasing Particulate Matter in Pakistan; A Critical Review. J. Hazard. Mater. 2021, 402, 123943. [Google Scholar] [CrossRef]
- Azarmi, F.; Kumar, P.; Marsh, D.; Fuller, G. Assessment of the long-term impacts of PM10 and PM2.5 particles from construction works on surrounding areas. Environ. Sci. Process. Impacts 2015, 18, 208–221. [Google Scholar] [CrossRef] [Green Version]
- Kumar, P.; Morawska, L.; Martani, C.; Biskos, G.; Neophytou, M.K.-A.; DI Sabatino, S.; Bell, M.; Norford, L.; Britter, R. The rise of low-cost sensing for managing air pollution in cities. Environ. Int. 2015, 75, 199–205. [Google Scholar] [CrossRef] [Green Version]
- Marques, G.; Saini, J.; Dutta, M.; Singh, P.K.; Hong, W.-C. Indoor Air Quality Monitoring Systems for Enhanced Living Environments: A Review toward Sustainable Smart Cities. Sustainability 2020, 12, 4024. [Google Scholar] [CrossRef]
- Cao, J.; Chow, J.C.; Lee, F.S.; Watson, J.G. Evolution of PM2.5 Measurements and Standards in the U.S. and Future Perspectives for China. Aerosol Air Qual. Res. 2013, 13, 1197–1211. [Google Scholar] [CrossRef]
- EPA. Evaluation of Emerging Air Pollution Sensor Performance. Available online: https://www.epa.gov/air-sensor-toolbox/evaluation-emerging-air-pollution-sensor-performance (accessed on 20 January 2021).
- SCAQMD. The South Coast Air Quality Management District. Available online: http://www.aqmd.gov/aq-spec/evaluations/summary (accessed on 11 March 2021).
- CREATE Lab. Air Quality Monitor Test Results. Available online: http://explorables.cmucreatelab.org/explorables/air-quality-monitor-tests/#data (accessed on 20 February 2021).
- Volckens, J.; Quinn, C.; Leith, D.; Mehaffy, J.; Henry, C.; Miller-Lionberg, D. Development and evaluation of an ultrasonic personal aerosol sampler. Indoor Air 2016, 27, 409–416. [Google Scholar] [CrossRef]
- Patel, S.; Li, J.; Pandey, A.; Pervez, S.; Chakrabarty, R.K.; Biswas, P. Spatio-temporal measurement of indoor particulate matter concentrations using a wireless network of low-cost sensors in households using solid fuels. Environ. Res. 2017, 152, 59–65. [Google Scholar] [CrossRef] [Green Version]
- Gao, M.; Cao, J.; Seto, E. A distributed network of low-cost continuous reading sensors to measure spatiotemporal variations of PM2.5 in Xi’an, China. Environ. Pollut. 2015, 199, 56–65. [Google Scholar] [CrossRef] [Green Version]
- Han, I.; Symanski, E.; Stock, T.H. Feasibility of using low-cost portable particle monitors for measurement of fine and coarse particulate matter in urban ambient air. J. Air Waste Manag. Assoc. 2016, 67, 330–340. [Google Scholar] [CrossRef] [PubMed] [Green Version]
- Kelly, K.; Whitaker, J.; Petty, A.; Widmer, C.; Dybwad, A.; Sleeth, D.; Martin, R.; Butterfield, A. Ambient and laboratory evaluation of a low-cost particulate matter sensor. Environ. Pollut. 2017, 221, 491–500. [Google Scholar] [CrossRef] [PubMed]
- Zheng, T.; Bergin, M.H.; Johnson, K.K.; Tripathi, S.N.; Shirodkar, S.; Landis, M.S.; Sutaria, R.; Carlson, D.E. Field evaluation of low-cost particulate matter sensors in high- and low-concentration environments. Atmos. Meas. Tech. 2018, 11, 4823–4846. [Google Scholar] [CrossRef] [Green Version]
- Zhang, H.; Srinivasan, R.; Ganesan, V. Low Cost, Multi-Pollutant Sensing System Using Raspberry Pi for Indoor Air Quality Monitoring. Sustainability 2021, 13, 370. [Google Scholar] [CrossRef]
- Zuo, J.; Rameezdeen, R.; Hagger, M.; Zhou, Z.; Ding, Z. Dust pollution control on construction sites: Awareness and self-responsibility of managers. J. Clean. Prod. 2017, 166, 312–320. [Google Scholar] [CrossRef]
- Naticchia, B.; Fava, G.; Carbonari, A.; Quaquero, E. Preliminary Tests on a Wireless Sensor Network for Pervasive Dust Monitoring in Construction Sites. Open Environ. Eng. J. 2014, 7, 10–18. [Google Scholar]
- Liu, X.; Asumadu-Sakyi, A.B.; Nyarku, M.; Mazaheri, M.; Thai, P.; Morawska, L.; Jayaratne, R. Low cost sensor network for indoor air quality monitoring in residential houses: Lab and indoor tests of two PM sensors. In Proceedings of the 7th International Conference Energy Environmental Residential Buildings (ICEERB 2016), 20–24 November 2006. [Google Scholar] [CrossRef]
- Wang, Y.; Li, J.; Jing, H.; Zhang, Q.; Jiang, J.; Biswas, P. Laboratory Evaluation and Calibration of Three Low-Cost Particle Sensors for Particulate Matter Measurement. Aerosol Sci. Technol. 2015, 49, 1063–1077. [Google Scholar] [CrossRef]
- Ahmed, S.; Arocho, I. Emission of particulate matters during construction: A comparative study on a Cross Laminated Timber (CLT) and a steel building construction project. J. Build. Eng. 2019, 22, 281–294. [Google Scholar] [CrossRef]
- Hojaiji, H.; Kalantarian, H.; Bui, A.A.T.; King, C.E.; Sarrafzadeh, M. Temperature and humidity calibration of a low-cost wireless dust sensor for real-time monitoring. In Proceedings of the SAS 2017—2017 IEEE Sensors Applications Symposium, Glassboro, NJ, USA, 13–15 March 2017; Institute of Electrical and Electronics Engineers: Piscataway, NJ, USA, 2017. [Google Scholar]
- Jayaratne, R.; Liu, X.; Thai, P.; Dunbabin, M.; Morawska, L. The influence of humidity on the performance of a low-cost air particle mass sensor and the effect of atmospheric fog. Atmos. Meas. Tech. 2018, 11, 4883–4890. [Google Scholar] [CrossRef] [Green Version]
- Olivares, G.; Edwards, S. The Outdoor Dust Information Node (ODIN)—Development and performance assessment of a low cost ambient dust sensor. Atmos. Meas. Tech. Discuss. 2015, 8, 7511–7533. [Google Scholar] [CrossRef] [Green Version]
- Castell, N.; Dauge, F.R.; Schneider, P.; Vogt, M.; Lerner, U.; Fishbain, B.; Broday, D.; Bartonova, A. Can commercial low-cost sensor platforms contribute to air quality monitoring and exposure estimates? Environ. Int. 2017, 99, 293–302. [Google Scholar] [CrossRef]
- Kelleher, S.; Quinn, C.; Miller-Lionberg, D.; Volckens, J. A low-cost particulate matter (PM2.5) monitor for wildland fire smoke. Atmos. Meas. Tech. 2018, 11, 1087–1097. [Google Scholar] [CrossRef] [Green Version]
- Borrego, C.; Costa, A.m.; Ginja, J.; Amorim, M.; Coutinho, M.; Karatzas, K.; Sioumis, T.; Katsifarakis, N.; Konstantinidis, K.; De Vito, S.; et al. Assessment of air quality microsensors versus reference methods: The EuNetAir joint exercise. Atmos. Environ. 2016, 147, 246–263. [Google Scholar] [CrossRef] [Green Version]
- Alphasense. 2018. Available online: http://www.alphasense.com/WEB1213/wp-content/uploads/2018/02/OPC-N2-1.pdf (accessed on 6 July 2021).
- Sharp Corporation Application note of Sharp dust sensor GP2Y1010AU0F. 2006. Available online: http://www.sharp-world.com/products/device/lineup/data/pdf/datasheet/gp2y1010au_appl_e.pdf (accessed on 6 July 2021).
- Baron, P. Generation and Behavior of Airborne Particles (Aerosols). Natl. Inst. Occup. Saf. Health Cent. Dis. Control Prev. 2010. Available online: https://www.cdc.gov/niosh/topics/aerosols/pdfs/Aerosol_101.pdf (accessed on 6 July 2021).
- HSC. Table 1: List of approved workplace. 2005, pp. 11–29. Available online: https://www.malvernpanalytical.com/en/assets/CLS_EH40_2005_Workplace_exposure_limits_tcm50-69453.pdf (accessed on 6 July 2021).
- Stacey, P.; Thorpe, A.; Roberts, P.; Butler, O. Determination of respirable-sized crystalline silica in different ambient environments in the United Kingdom with a mobile high flow rate sampler utilising porous foams to achieve the required particle size selection. Atmos. Environ. 2018, 182, 51–57. [Google Scholar] [CrossRef]
- IFA. GESTIS International Limit Values. Available online: https://limitvalue.ifa.dguv.de/ (accessed on 1 July 2021).
- Waehrer, G.M.; Dong, X.S.; Miller, T.; Haile, E.; Men, Y. Costs of occupational injuries in construction in the United States. Accid. Anal. Prev. 2007, 39, 1258–1266. [Google Scholar] [CrossRef] [Green Version]


| Sensor | Alphasense (A-a) | Alphasense (A-b) | Alphasense (A-c) | Kanomax |
|---|---|---|---|---|
| Sharp (S-a) | 0.73 | 0.56 | 0.69 | 0.68 |
| Sharp (S-b) | 0.68 | 0.82 | 0.65 | 0.83 |
| Sharp (S-c) | - | - | - | - |
| Sensor | Activity | Number of Readings | PM10 | PM2.5 | PM1 |
|---|---|---|---|---|---|
| A-a | Mixing | 1302 | 3700.45 | 251.49 | 51.61 |
| A-b | 1273 | 4760.33 | 264.52 | 47.09 | |
| A-c | Casting | 967 | 2107.09 | 193.37 | 44.17 |
| Average | - | 3522.62 | 236.46 | 47.62 | |
| Sensor | Number of Readings | PM10 | PM2.5 | PM1 |
|---|---|---|---|---|
| A-a | 1094 | 6753.66 | 506.97 | 67.10 |
| A-b | 1141 | 7356.63 | 470.94 | 55.90 |
| A-c | 1091 | 6177.89 | 436.00 | 54.27 |
| Average | 6762.72 | 471.30 | 59.09 |
| Activity | Limit | PM10 | PM2.5 | PM1 | |
|---|---|---|---|---|---|
| Concrete Mixing | Mixing | Upper | 14,376.32 | 764.90 | 72.54 |
| Lower | 343.93 | 64.25 | 20.22 | ||
| Conveyance | Upper | 14,301.46 | 789.57 | 68.47 | |
| Lower | 4014.22 | 610.53 | 67.24 | ||
| Random Activities | Upper | 2000.00 | 50.00 | 50.21 | |
| Lower | 0.00 | 0.00 | 0 | ||
| Mortar Mixing | Mixing | Upper | 9470.79 | 353.59 | 50.87 |
| Lower | 3014.25 | 42.27 | 18.84 | ||
| Conveyance | Upper | 6732.00 | 337.28 | 47.44 | |
| Lower | 2041.18 | 225.30 | 42.65 | ||
| Random Activities | Upper | 2000.00 | 50.00 | 50 | |
| Lower | 0.00 | 0.00 | 0 | ||
| PM | Without Control Measures | With Control Measures (70% Reduction) | ||||
|---|---|---|---|---|---|---|
| Location 1 | Location 2 | Location 3 | Location 1 | Location 2 | Location 3 | |
| PM10 | 3250.65 | 2778.07 | 1787.86 | 975.20 | 833.42 | 536.36 |
| PM2.5 | 143.77 | 122.87 | 79.07 | 43.13 | 36.86 | 23.72 |
| PM1 | 32.50 | 27.78 | 17.88 | 9.75 | 8.33 | 5.36 |
| PM | Without Control Measures | With Control Measures (70% Reduction) | ||||
|---|---|---|---|---|---|---|
| Worker 1 | Worker 2 | Masan | Worker 1 | Worker 2 | Location 3 | |
| PM10 | 4931.46 | 4214.52 | 2712.30 | 1479.44 | 1264.36 | 813.69 |
| PM2.5 | 322.42 | 275.55 | 177.33 | 96.73 | 82.67 | 53.20 |
| PM1 | 32.50 | 27.78 | 17.88 | 9.75 | 8.33 | 5.36 |
| Reference | Construction Task | Level (µg/m3) | Exposure Limit | Comment |
|---|---|---|---|---|
| RCS | ||||
| [53] | Concrete Mixing | 687.27 | RCS = 0.10 PM10 level | RCS exposure is 10% of the PM10 level |
| Mortar Mixing | 533.47 | |||
| [2] | Concrete Mixing | 343.24 | RCS = 0.05 PM10 level | RCS exposure is 2.5–5% of the PM10 level |
| Mortar Mixing | 266.43 | |||
| Concrete Mixing | 171.62 | RCS = 0.025 PM10 level | ||
| Mortar Mixing | 133.21 | |||
| PM10 and PM2.5 | ||||
| [19] | Mortar Mixing | PM10 = 3522.62 | PM10 = 0.3 mg/m3 PM2.5 = 0.16 mg/m3 | PM10 dust exposure is 6.87 times PM2.5 dust exposure is 5.33 times |
| Concrete Mixing | PM10 = 6762.72 | |||
| [20] | Mortar Mixing | PM2.5 = 236.46 | PM10 = 50 µg/m3 PM2.5 = 25 µg/m3 | PM10 dust exposure for the mortar and concrete mixing is 70 and 135 times higher, respectively. |
| Concrete Mixing | PM2.5 = 471.30 | PM2.5 dust exposure for the mortar and concrete mixing is 9.87 and 18.84 times higher, respectively. | ||
Publisher’s Note: MDPI stays neutral with regard to jurisdictional claims in published maps and institutional affiliations. |
© 2021 by the authors. Licensee MDPI, Basel, Switzerland. This article is an open access article distributed under the terms and conditions of the Creative Commons Attribution (CC BY) license (https://creativecommons.org/licenses/by/4.0/).
Share and Cite
Khan, M.; Khan, N.; Skibniewski, M.J.; Park, C. Environmental Particulate Matter (PM) Exposure Assessment of Construction Activities Using Low-Cost PM Sensor and Latin Hypercubic Technique. Sustainability 2021, 13, 7797. https://doi.org/10.3390/su13147797
Khan M, Khan N, Skibniewski MJ, Park C. Environmental Particulate Matter (PM) Exposure Assessment of Construction Activities Using Low-Cost PM Sensor and Latin Hypercubic Technique. Sustainability. 2021; 13(14):7797. https://doi.org/10.3390/su13147797
Chicago/Turabian StyleKhan, Muhammad, Numan Khan, Miroslaw J. Skibniewski, and Chansik Park. 2021. "Environmental Particulate Matter (PM) Exposure Assessment of Construction Activities Using Low-Cost PM Sensor and Latin Hypercubic Technique" Sustainability 13, no. 14: 7797. https://doi.org/10.3390/su13147797
APA StyleKhan, M., Khan, N., Skibniewski, M. J., & Park, C. (2021). Environmental Particulate Matter (PM) Exposure Assessment of Construction Activities Using Low-Cost PM Sensor and Latin Hypercubic Technique. Sustainability, 13(14), 7797. https://doi.org/10.3390/su13147797