Abstract
Background: The environment can play a relevant role in performance in runners. This study aimed to verify the distribution of the best European road runners across the continent, and to investigate variables related to country representatives in the European Senior outdoor top list 2019. Methods: The sample comprised 563 European runners, aged 18–48 years, ranked in the European Senior outdoor top list 2019 for distances of 10–42 km. Country-related variables were gross domestic product (GDP), competition place, population size, and sports investment. The countries were categorized as “top ten countries” or “other countries”. Binary logistic regression was used for analysis. Results: The United Kingdom showed the highest prevalence of runners in the ranking (men—17.6%; women—23.0%), followed by Spain (male ranking—12.1%) and Germany (female ranking—8.6%). For men, sports investment (OR = 1.13; CI95% = 1.03–1.28) and country GDP (OR = 0.96; CI95% = 0.93–0.98) showed an association with the chances of the athlete to reach the Top 10 ranking, while among women, the only variable significantly related was the competition venue (OR = 3.97; CI95% = 1.40–11.23). Conclusion: As in other sports considered “non-expensive”, the economic and demographic characteristics of the place where athletes train can provide advantages in performance.
1. Introduction
Sports performance is a multifactorial trait influenced by several variables related to athletes and the environment [1]. Previous studies investigated the role of individual characteristics, such as physiological indicators [2], training commitment [3,4,5], psychological traits [6], body composition and anthropometric characteristics [7]. Furthermore, variables derived from the environments where athletes originate [8,9], namely aspects such as training structure [10], birthplace [11], family and coach support [12], and country economic indicators [13,14], have emerged as relevant predictors of athletic performance. Despite the relevance of subject-centred approaches [15,16], previous research has focused largely on aiming to understand the role of contextual variables in sports success [17,18], and results revealed that socioeconomic factors such as population size, Human Development Index, and gross domestic product seemed to be significantly associated with performance [19,20].
In this context, De Bosscher et al. [21] proposed a model where international success in sport is determined by a set of variables that can be organized into different domains, which include, for example, financial support, competition participation, access to sports facilities, and coaching development and talent identification programs. Together, these domains display complex interdependent relationships that can ultimately produce the “ideal demographic conditions”, allowing for sports initialization in different modalities and, as a consequence, the development of elite athletes [22]. For example, the Sports Policy Factors Leading to International Sporting Success project (SPLISS) [23] was developed to identify the relationship between political systems and policies that promote elite sports with international success in the field, and it was identified that countries with the largest investments in elite sport (e.g., Korea, Japan, France, Australia, and Canada) displayed the best athletic results in both summer and winter Olympic Games [13,14].
Notwithstanding the relevance of these abovementioned variables as factors of athletic and, by extension, Olympic success [20,24], there is a lack of studies exploring these relationships within individual sports [25,26], such as road running [27]. Interestingly, on the European continent, an increase in the number of running practitioners has been observed in recent years [28], but only Spain, Russia, Switzerland, and Ukraine have produced outstanding recreational runners at an international level [29]. Furthermore, when considering professional athletes, only 16 countries from the European continent had at least one athlete among the best runners worldwide between 1999–2015 in 10 km, half-marathon, marathon, and 100 km ultramarathon events [30].
The United Kingdom (UK) and Germany are the countries with the highest numbers of marathon runners in the world [29]. In addition, given that two of the “World Marathon Majors” take part in Europe, specifically in Germany and the UK, governments are motivated to invest in both mass participation and elite/high performance sports. A previous study investigating various sport policies in Europe found that approximately 90% of strategies outlined by government entities placed equal importance on mass participation and elite sports performance [31]. These strategies were found to be mutually reinforcing, as performance at international competitions was considered an effective way of developing and promoting mass participation in grassroots sports [31,32]. Although many strategies outlined in this mentioned study invested equally in both aspects of mass participation and elite sports, this model has been referred to as a “top-down” method. National governments and sporting organisations financially invest in elite high-performance sport hoping that victories will increase national pride and interest in sports among the general population, fostering higher participation in both mass and elite sports [33]. Therefore, it stands to reason that increased investment towards the success of other running events may improve overall participation and, by extension, better the conditions for athletic training. Moreover, based on results reported by Thuany et al. [27], it is also speculated that country-related variables such as population size, sports investment and gross domestic product (GDP) can be associated with runners’ distribution in the rankings.
Previous studies presented the relationship between physiological characteristics (VO2max, running economy, lactate threshold) and endurance performance [2,34]. However, since running is mainly performed in outdoor environments, differences in runners’ performances can be explained by variables related to their environment of origin. Previously, we showed that state of residence explains 3% of the performance variance among Brazilian runners, and that the existence of athletics events in their home states was positively associated with performance [35]. It highlights that the role of environmental variables in runners’ performance must be explored. Therefore, the purposes of this study were (1) to identify the distribution of the best European runners across the continent; (2) to describe the trajectories (based on their citizenship and the place where they competed) they undertook to achieve their best results, as well as countries where the best results were achieved; (3) to identify the representativeness of each country in the top 10 ranking of the modality; and (4) to investigate the relationship between country-related variables and the chances of athletes be at top 10 ranking.
2. Materials and Methods
This is an exploratory study, for which information was obtained from the European Athletes website [36]. The sample comprised 563 European runners (275 female), aged 18–48 years and 18–42 years for men and women respectively, ranked in the European Senior outdoor top list 2019 [36] in official 10 km, half-marathon and marathon events. Country-related variables were obtained from the European Union’s [37] and United Nations Program’s [38] official webpages, and comprised:
Gross domestic product (GDP)—Data were expressed continuously (in euros), and derived from the year 2019.
Competition location—This variable was obtained considering athletes’ citizenship and the place (country) where they obtained their best race time. Information was dichotomized, aiming to indicate if athletes obtained their best result in the country of their citizenship or in a foreign country.
Population size—Indicates the total population of the countries in 2019. The variable was expressed in millions.
Sports investment—The mean consumption expenditure of private households on sporting goods and services, based on the Classification of Individual Consumption According to Purpose (COICOP) [39]. Data obtained are from the year 2015, and values were expressed in thousands.
2.1. Athletic Ranking
The European Senior outdoor top list 2019 was used to categorize the athletes. Approximately 100 of the best senior European athletes, by sex, were ranked for each of the running distances (10 km, half-marathon, and marathon). Countries were then categorized as “top ten countries” (having at least one athlete among the first ten for at least one of the distances), or “other countries” (not having athletes among the first ten for any of the distances). It is important to note that all countries analyzed had at least one athlete in the top 100 list; European countries that were not represented in this list were not included in the study.
2.2. Statistical Analysis
Data were expressed as mean (with standard deviation) and median (with interquartile range) or frequency (%). The frequency of countries classified on each of the categories based on the athletic ranking was computed. Country-related variables (sports investment, total population and GDP) were tested for normality using the Kolmogorov–Smirnov test, and the Mann–Whitney U test was performed for comparison of these variables between the groups (“top ten countries” and “other countries”). Binary logistic regression was used to verify the predictors associated with the chances of countries having national runners in the European Top 10 ranking, where sports investment, total population, GDP, and competition venue (personal record obtained in citizenship country or in a foreign country) were the possible predictors. IBM SPSS Statistics (IBM Corp. Released 2016. IBM SPSS Statistics for Windows, Version 24.0. Armonk, NY: IBM Corp.) software was used for analysis. Significance was accepted at p < 0.05.
3. Results
Of the 54 European countries, 35 were represented on the European Senior outdoor top list, taking into account both sexes together. Among all runners on this list, the United Kingdom had the highest number of runners (men—17.6%; women—23.0%), followed by Spain (men—12.1%) and Germany (women—8.6%) (Figure 1). When the top 10 runners for all distances were considered, taking into account both sexes, only 14 countries had at least one athlete in this group, and the United Kingdom remained the most represented in this group (men—15.2%; women—23.3%). Furthermore, regarding competition venue, it is possible to observe that the three countries where runners performed the best were Spain, Germany, and the United Kingdom, for both sexes (changing only the order of appearance) (Figure 1).
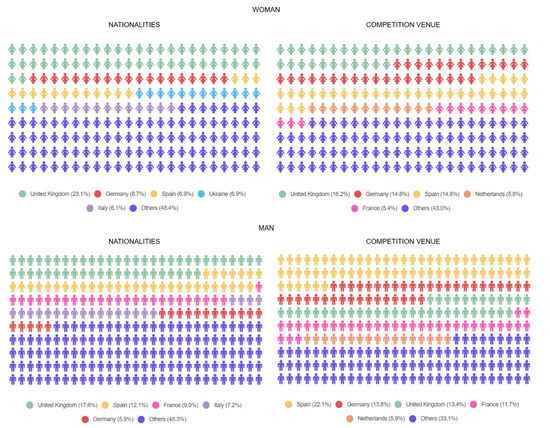
Figure 1.
Citizenship most represented in the ranking (on the left), and competition venue (on the right) for both female (on the top) and male (at the bottom) athletes of European Senior outdoor top list 2019.
For the country-related variables presented in Table 1, it is possible to observe that, for both sexes, countries with runners in the top 10 European ranking presented the highest mean and median values for GDP. However, no significant differences were observed between the top ten countries and the other countries. Regarding sports investment and total population, it was observed that top 10-ranked female athletes were more likely to be citizens of countries with the mean highest values for these variables, although these differences were not significant.

Table 1.
Descriptive information about European country variables, per group and sex.
Results of the regression analyses are presented by sex in Table 2. For men, sports investment and country GDP were associated with the athlete’s likelihood to be in the Top 10 ranking. Runners from countries with more sports investment had a 13% greater chance of being in the top 10, while increased country GDP decreased the chances of being in the top 10 (OR = 0.96; CI95% = 0.93–0.98). Among women, the only variable significantly related was the competition venue, where those who competed in the country of their citizenship were ≈4 times more likely to be in the top 10 (OR = 3.97; CI95% = 1.40–11.23).
Table 2.
Results of the binary regression for predictors of the top 10 rankings.
4. Discussion
This study aimed to investigate the distribution of the best European road runners across the continent; to describe their trajectories to achieve their best results; to identify the representation of each country in the top 10 rankings; and to investigate the relationship between country socioeconomic and social indicators and athletes’ presence in the top 10 rankings. In addition, it was hypothesized that the United Kingdom and Germany would be the countries with the highest number of athletes in the ranking. The main findings were that (1) for both sexes, the highest representation, in both total ranking and top 10 ranking, was observed for the UK; (2) runners from the UK were most likely to achieve high rankings outside their own country; (3) the competition venues where the best marks were obtained by runners were the UK, Germany, and Spain; and (4) socioeconomic variables (sports investment and GDP) and competition venue were associated with a country’s likelihood of having athletes in the top 10 ranking, for men and women respectively.
Notwithstanding the relevance of the individual predictors on sports performance [40,41], previous studies investigated the role of demographic, cultural, geographic, and economic predictors on success in international sports [14], and results indicated that larger population size, higher values on the Human Development Index, and GDP were directly associated with the number of medals won in Olympic games [20,42,43,44]. These variables express both the economic power and demographic characteristics of the countries, such as their capacity of human capital and athletic development, as well as sports investment, and they are generally used when aiming to understand the differences in results between nations at international competitions such as the Olympic Games [45].
As one of the purposes of the study was to examine the relationship between countries’ socioeconomic and social indicators and their athletic presence in the top 10 rankings, it was found that sports investment and GDP were significantly associated with the chances of countries having a male runner in the Top 10 European Senior ranking. This indicates that investment in sports at both mass participation and elite levels may improve conditions related to athletes’ training, career support for athletes, and programs for talent identification and development. Furthermore, investing in higher-level qualifications and training for coaches, increased numbers of accessible sports facilities and competitive sporting events, and scientific sports research contributes to elite level athletic success and increases the number of amateur participants in the sport, from whom it is possible to recruit professional/elite athletes [14,42,46]. For example, a possible explanation regarding the fact that the UK was the most represented in the top 10 ranking could be due to economic investments in sports development and achieving better positions in the Olympic Games, such as the World Class Performance Programme (implemented after the Atlanta 1996 Olympic Games) [47]. Furthermore, investments related to the London 2012 Summer Olympic Games may have resulted in increases in athletic performance as a result of policies and facilities developed to promote sports practice [48,49]. Regarding the relationship between GDP and the likelihood of having athletes in the ranking, it is possible that the inverse relationship found can be due to the fact that GDP measures the total resources available in the country, which is not necessarily related to their application in the sports context [50].
On the other hand, among women, the variable significantly related to their presence in the top 10 rankings was the competition venue, meaning that female runners who competed in the country of their citizenship were more likely to be among the top ten runners than those who achieved their best results in a foreign country. A plausible explanation for this association could be that found for similar results observed during the Olympic Games. The host country of the sporting event tends to present a higher likelihood of obtaining the best results, due to economic investment and public support related to athletes’ development [42,50]. Moreover, when competing in their own countries, athletes have some “advantages”, such as knowledge about the place of the competition (ground, route), adaptation to the climate and weather conditions, and crowd support, given that they are competing “at home” [51].
Furthermore, countries with a large number of running events may have policies and strategies to promote initialization and specialization in the training of runners, as well as the development of elite athletes, which is conducive to better results [14]. In addition, it is important to note that among the marathon races hosted in Europe, only those allocated in London and Berlin figure among the “six World Marathon Majors”, which may result in higher investment in running in these countries, and possibly explaining the fact that the United Kingdom and Germany are two of the three countries with the highest number of runners going there to compete, and also the places where runners most achieve their best results, which corroborates one of the study’s hypotheses.
This study had some limitations. As we used secondary information, available data were not always updated. Additionally, it was not possible to explore other country-related variables related to runners’ performance, as unfortunately, most of this information was not readily accessible. Furthermore, we did not consider possible changes in athletes’ citizenship over the years. Future studies should consider exploring other country-related variables, e.g., number of running events, running clubs (number and costs), climate/weather conditions, sports policies, and country urban design. On the other hand, it must be highlighted that we used information covering the entire European continent regarding its best runners in the year 2019, and that it was possible to map the countries where these athletes must achieve their best marks, as well as to identify country-related variables associated with athletes’ performance.
Results from the present study can be relevant in the practical context. Nations have given attention to understanding and developing public policies and strategies able to lead, in the short-, medium-, and long-term, to success in international sports. In this context, financial support and competition participation are considered two of the nine pillars of international sports success [23]. In the present study, results highlighted that these factors should be developed by countries that aim for better representation in the European rankings. Thus, alongside the relevance of investment in sports participation (increasing people’s access to the practice), countries should also invest in the development of national sports events, which may increase the chances of having successful athletes at an international level.
5. Conclusions
Among European road runners, it was observed that sports investment, GDP, and competition venue were associated with athletes’ chances to be among the best runners in the continent, based on the senior outdoor ranking. This highlights that even in sports considered “relatively inexpensive”, the economic and demographic characteristics of the places where athletes live/train can provide advantages in their performance, and this should be considered if countries aim to be well represented in international sports events, highlighting that it is not only individual characteristics that are responsible for athletes’ success.
Author Contributions
Conceptualization, M.T. and T.N.G.; methodology, M.T.; T.N.G.; formal analysis, M.T.; writing—original draft preparation, M.T. and T.N.G.; writing—review and editing, M.T.; S.P.; L.H.; J.C.S.; T.R.; B.K. and T.N.G. All authors have read and agreed to the published version of the manuscript.
Funding
This research received no external funding.
Informed Consent Statement
Consent was waived due the research concerned the use of publicly available data.
Data Availability Statement
Available online at https://www.european-athletics.org/records/season=2019/type=0/category=S/index.html, accessed on 21 May 2021 and https://ec.europa.eu/eurostat, accessed on 21 May 2021.
Conflicts of Interest
The authors declare no conflict of interest.
References
- Georgiades, E.; Klissouras, V.; Baulch, J.; Wang, G.; Pitsiladis, Y. Why nature prevails over nurture in the making of the elite athlete. BMC Genom. 2017, 18, 835. [Google Scholar] [CrossRef] [PubMed]
- Joyner, M.J. Physiological limits to endurance exercise performance: Influence of sex. J. Physiol. 2017, 595, 2949–2954. [Google Scholar] [CrossRef]
- Lee, E.J.; Snyder, E.M.; Lundstrom, C.J. Predictors of long-distance race performance in master runners. J. Hum. Sport Exerc. 2019, 15. [Google Scholar] [CrossRef]
- De Silva, P.N.; Solera, B.; Anversa, A.L.B.; de Almeida, T.L.; de Assis Manoel, F. Motivação para a prática da corrida de rua: Diferença entre atletas amadores de alta performance e atletas amadores. Phys. Educ. Sport J. 2019, 7, 21–27. [Google Scholar] [CrossRef]
- Emig, T.; Peltonen, J. Human running performance from real-world big data. Nat. Commun. 2020, 11, 4936. [Google Scholar] [CrossRef] [PubMed]
- Kavussanu, M. Sport, Exercise, and Performance Psychology: Past, present, and future. Sport Exerc. Perform. Psychol. 2017, 6, 1–5. [Google Scholar] [CrossRef]
- Nikolaidis, P.T.; Rosemann, T.J.; Knechtle, B. Skinfold Thickness Distribution in Recreational Marathon Runners. Int. J. Environ. Res. Public Health 2020, 17, 2978. [Google Scholar] [CrossRef]
- Thompson, M. Physiological and biomechanical mechanisms of distance specific human running performance. Integr. Comp. Biol. 2017, 57, 293–300. [Google Scholar] [CrossRef]
- Yan, X.; Papadimitriou, I.; Lidor, R.; Eynon, N. Nature versus Nurture in Determining Athletic Ability. Med. Sport Sci. 2016, 61, 15–28. [Google Scholar] [CrossRef]
- Casado, A.; Hanley, B.; Santos-Concejero, J.; Ruiz-Perez, L.M. World-class long-distance running performances are best predicted by volume of easy runs and deliberate practice of short-interval and tempo runs. J. Strength Cond. Res. 2019, 1–7. [Google Scholar] [CrossRef] [PubMed]
- Tozetto, A.V.B.; Rosa, R.S.; Mendes, F.G.; Galatti, L.R.; Souza, E.R.; Collet, C.; Moura, B.M.; Silva, W.R. Local de nascimento e data de nascimento de medalhistas olímpicos brasileiros. Braz. J. Kinanthropometry Hum. Perform. 2017, 19. [Google Scholar] [CrossRef][Green Version]
- Lassalle, G.; Recours, R.; Griffet, J. Role of Family Members in Sport Motivation, Involvement and Expertise of Track and Field Athletes in France. J. Comp. Fam. Stud. 2018, 49, 333–354. [Google Scholar] [CrossRef]
- Bosscher, V.D.; Shibli, S.; Westerbeek, H.; Bottenburg, M.v. Successful Elite Sport Policies: An International Comparison of the Sports Policy Factors Leading to International Sporting Success (SPLISS 2.0) in 15 Nations; Meyer & Meyer Sports: Oxford, UK, 2015; Available online: https://ussa-my.com/assets/SPLISS_report.pdf (accessed on 12 July 2021).
- Bohme, M.T.S.; Bastos, F.d.C. Esporte de Alto Rendimento: Fatores Críticos de Sucesso-Gestão-Identificação de Talentos, 1st ed.; Phorte: São Paulo, Brazil, 2016; p. 360. [Google Scholar]
- Joyner, M.J. Genetic Approaches for Sports Performance: How Far Away Are We? Sports Med. 2019, 49, 199–204. [Google Scholar] [CrossRef]
- Thuany, M.; Gomes, T.N.; Almeida, M.B. Is there any difference between “amateur” and “recreational” runners? A latent class analysis. Mot. Rio Claro 2020, 26, e10200140. [Google Scholar] [CrossRef]
- Lang, J.J.; Tremblay, M.S.; Leger, L.; Olds, T.; Tomkinson, G.R. International variability in 20 m shuttle run performance in children and youth: Who are the fittest from a 50-country comparison? A systematic literature review with pooling of aggregate results. Br. J. Sports Med. 2018, 52, 276. [Google Scholar] [CrossRef] [PubMed]
- Henriksen, K.; Stambulova, N.; Roessler, K.K. Successful talent development in track and field: Considering the role of environment. Scand. J. Med. Sci. Sports 2010, 20 (Suppl. 2), 122–132. [Google Scholar] [CrossRef] [PubMed]
- Trivedi, P.; Zimmer, D. Success at the Summer Olympics: How Much Do Economic Factors Explain? Econometrics 2014, 2, 169–202. [Google Scholar] [CrossRef]
- Santos, P.A.; Sousa, C.V.; da Silva Aguiar, S.; Knechtle, B.; Nikolaidis, P.T.; Sales, M.M.; dos Santos Rosa, T.; de Deus, L.A.; Campbell, C.S.G.; de Sousa, H.G.; et al. Human Development Index and the frequency of nations in Athletics World Rankings. Sport Sci. Health 2019, 15, 393–398. [Google Scholar] [CrossRef]
- Bosscher, V.D.; Shibli, S.; Bottenburg, M.V.; Knop, P.D.; Truyens, J. Developing a Method for Comparing the Elite Sport Systems and Policies of Nations: A Mixed Research Methods Approach. J. Sport Manag. 2010, 24, 567–600. [Google Scholar] [CrossRef]
- Costa, I.T.; Cardoso, F.S.L.; Garganta, J. O Índice de Desenvolvimento Humano e a Data de Nascimento podem condicionar a ascensão de jogadores de Futebol ao alto nível de rendimento? Mot. Rio Claro 2013, 19, 34–45. [Google Scholar] [CrossRef]
- Bosscher, V.D.; Bingham, J.; Shibli, S.; Bottenburg, M.v.; Knop, P.D. The Global Sporting Arms Race—An International Comparative Study on Sports Policy Factors Leading to International Sporting Success; Meyer & Meyer Sport: Oxford, UK, 2008. [Google Scholar]
- Grančay, M.; Dudáš, T. Olympic medals, economy, geography and politics from Sydney to Rio. Iran. Econ. Rev. 2018, 22, 409–441. [Google Scholar]
- Gomes-Sentone, R.; Lopez-Gi, J.F.; Caetano, C.I.; Cavichioll, F.R. Relationship between human development index and the sport results of Brazilian swimming athletes. J. Hum. Sport Exerc. 2019, 14, S2009–S2018. [Google Scholar] [CrossRef]
- Caetano, C.I.; Sentone, R.G.; López-Gil, J.F.; Caetano, H.B.S.; Cavichiolli, F.R. Influência do tamanho e densidade populacional no rendimento esportivo da ginástica artística brasileira. Retos Nuevas Ten-Dencias Educación Física Deporte Recreación 2020, 38, 66–70. [Google Scholar]
- Thuany, M.; Gomes, T.N.; Souza, R.F.; Almeida, M. Onde estão os melhores corredores do Brasil? Rev. Bras. Ciên. Mov. 2021, in press. [Google Scholar]
- Scheerder, J.; Breedveld, K.; Borgers, J. (Eds.) Running Across Europe: The Rise and Size of One of the Largest Sport Markets; Palgrave Macmillan: London, UK, 2015. [Google Scholar] [CrossRef]
- RunRepeat. Marathon Statistics 2019 Worldwide. Available online: https://runrepeat.com/research-marathon-performance-across-nations (accessed on 12 April 2020).
- Nikolaidis, P.T.; Onywera, V.; Knechtle, B. Running performance, nationality, sex, and age in the 10-km, half-marathon, marathon, and the 100-km ultramarathon IAAF 1999–2015. J. Strength Cond. Res. 2017, 31, 2189–2207. [Google Scholar] [CrossRef]
- Christiansen, N.V.; Kahlmeier, S.; Racioppi, F. Sport promotion policies in the European Union: Results of a contents analysis. Scand. J. Med. Sci. Sports 2014, 24, 428–438. [Google Scholar] [CrossRef] [PubMed]
- Hamalainen, R.M.; Aro, A.R.; Lau, C.J.; Rus, D.; Cori, L.; Syed, A.M.; REPOPA Consortium. Cross-sector cooperation in health-enhancing physical activity policymaking: More potential than achievements? Health Res. Policy Syst. 2016, 14, 33. [Google Scholar] [CrossRef]
- Grix, J. The impact of UK sport policy on the governance of athletics. Int. J. Sport Policy Politics 2009, 1, 31–49. [Google Scholar] [CrossRef]
- Midgley, A.W.; McNaughton, L.; Jones, A.M. Training to enhance the physiological determinants of long-distance running performance. Sports Med. 2007, 37, 857–880. [Google Scholar] [CrossRef]
- Thuany, M.; Gomes, T.N.; Hill, L.; Rosemann, T.J.; Knechtle, B.; de Almeida, M.B. Running performance variability among runners from different brazilian states: A multilevel approach. Int. J. Environ. Res. Public Health 2021, 18, 3781. [Google Scholar] [CrossRef] [PubMed]
- European Atlhetics. Senior Outdoor Top List 2019. Available online: https://www.european-athletics.org/records/season=2019/type=0/category=S/index.html (accessed on 12 July 2021).
- Euroestat. Euroestat. Available online: https://ec.europa.eu/eurostat (accessed on 12 July 2021).
- Programa das Nações Unidas para o Desenvolvimento (PNUD). Ranking IDH Global 2014. Available online: https://www.br.undp.org/content/brazil/pt/home/idh0/rankings/idh-global.html (accessed on 12 July 2021).
- Department of Economic and Social Affairs. Classification of Individual Consumption According to Purpose (COICOP) 2018; United Nations Statistics Division: New York, NY, USA, 2018. [Google Scholar]
- Boullosa, D.A.; Esteve, J.; Casado, A.; Peyré-Tartaruga, L.A.; Rosa, R.G.D.; Coso, J.D. Factors affecting training and physical performance in recreational endurance runners. Sports 2020, 8, 35. [Google Scholar] [CrossRef] [PubMed]
- Vincent, H.; Kilgore, J.; Chen, C.; Bruner, M.; Horodyski, M.; Vincent, K.R. Impact of Body Mass Index on Biomechanics of Recreational Runners. PM R 2020, 12, 1106–1112. [Google Scholar] [CrossRef]
- Jayantha, K.; Ubayachandra, E.G. Going for gold medals: Factors affecting olympic performance. Int. J. Sci. Res. Publ. 2015, 5, 1–7. [Google Scholar]
- Sumathi, V.P.; Vanitha, V.; Divyadarshini, M. GDP based medal count analysis in summer olympics games for two decades—An exploratory analysis. Int. J. Recent Technol. Eng. 2018, 7, 12–16. [Google Scholar]
- Feizabadi, M.S.; Khabiri, M.; Hamidi, M. The relationship between the success of countries at the Guangzhou 2010 Summer Asian Games and demo-economic factors. Procedia Soc. Behav. Sci. 2013, 82, 369–374. [Google Scholar]
- Marinho, A.; Cardoso, S.S.; Almeida, V.V. Avaliação da Eficiência Técnica dos Países nos Jogos Olímpicos de Pequim-2008; IPEA: Brasília, Brazil, 2009. [Google Scholar]
- Sotudeh, H.; Salesi, M.; Didegah, F.; Bazgir, B. Does Scientific Productivity Influence Athletic Performance? An Analysis of Countries’ Performances in Sciences, Sport Sciences and Olympic Games. Int. J. Inf. Sci. Manag. 2012, 10, 27–41. [Google Scholar]
- UK Sport. World Class Programme. Available online: https://www.uksport.gov.uk/our-work/world-class-programme (accessed on 11 February 2021).
- Rees, T.; Hardy, L.; Gullich, A.; Abernethy, B.; Cote, J.; Woodman, T.; Montgomery, H.; Laing, S.; Warr, C. The Great British Medalists Project: A Review of Current Knowledge on the Development of the World’s Best Sporting Talent. Sports Med. 2016, 46, 1041–1058. [Google Scholar] [CrossRef] [PubMed]
- Slater, M.J.; Barker, J.B.; Coffee, P.; Jones, M.V. Leading for gold: Social identity leadership processes at the London 2012 Olympic Games. Qual. Res. Sport Exerc. Health 2015, 7, 192–209. [Google Scholar] [CrossRef]
- Neto, E.T.O.; Bertussi, G.L. Do que é feito um país campeão? Análise empírica de determinantes sociais e econômicos para o sucesso olímpico. Nova Econ. 2015, 25, 325–342. [Google Scholar] [CrossRef][Green Version]
- Kumar, S.; Sahu, N.C.; Kumar, P. Do socioeconomic factors of a country affect its sports achievements in commonwealth games? J. Sports Econo. Manag. 2020, 9, 174–184. [Google Scholar]
Publisher’s Note: MDPI stays neutral with regard to jurisdictional claims in published maps and institutional affiliations. |
© 2021 by the authors. Licensee MDPI, Basel, Switzerland. This article is an open access article distributed under the terms and conditions of the Creative Commons Attribution (CC BY) license (https://creativecommons.org/licenses/by/4.0/).