A Simple Way to Increase the Prediction Accuracy of Hydrological Processes Using an Artificial Intelligence Model
Abstract
:1. Introduction
2. Methods and Material
2.1. Study Region and Datasets
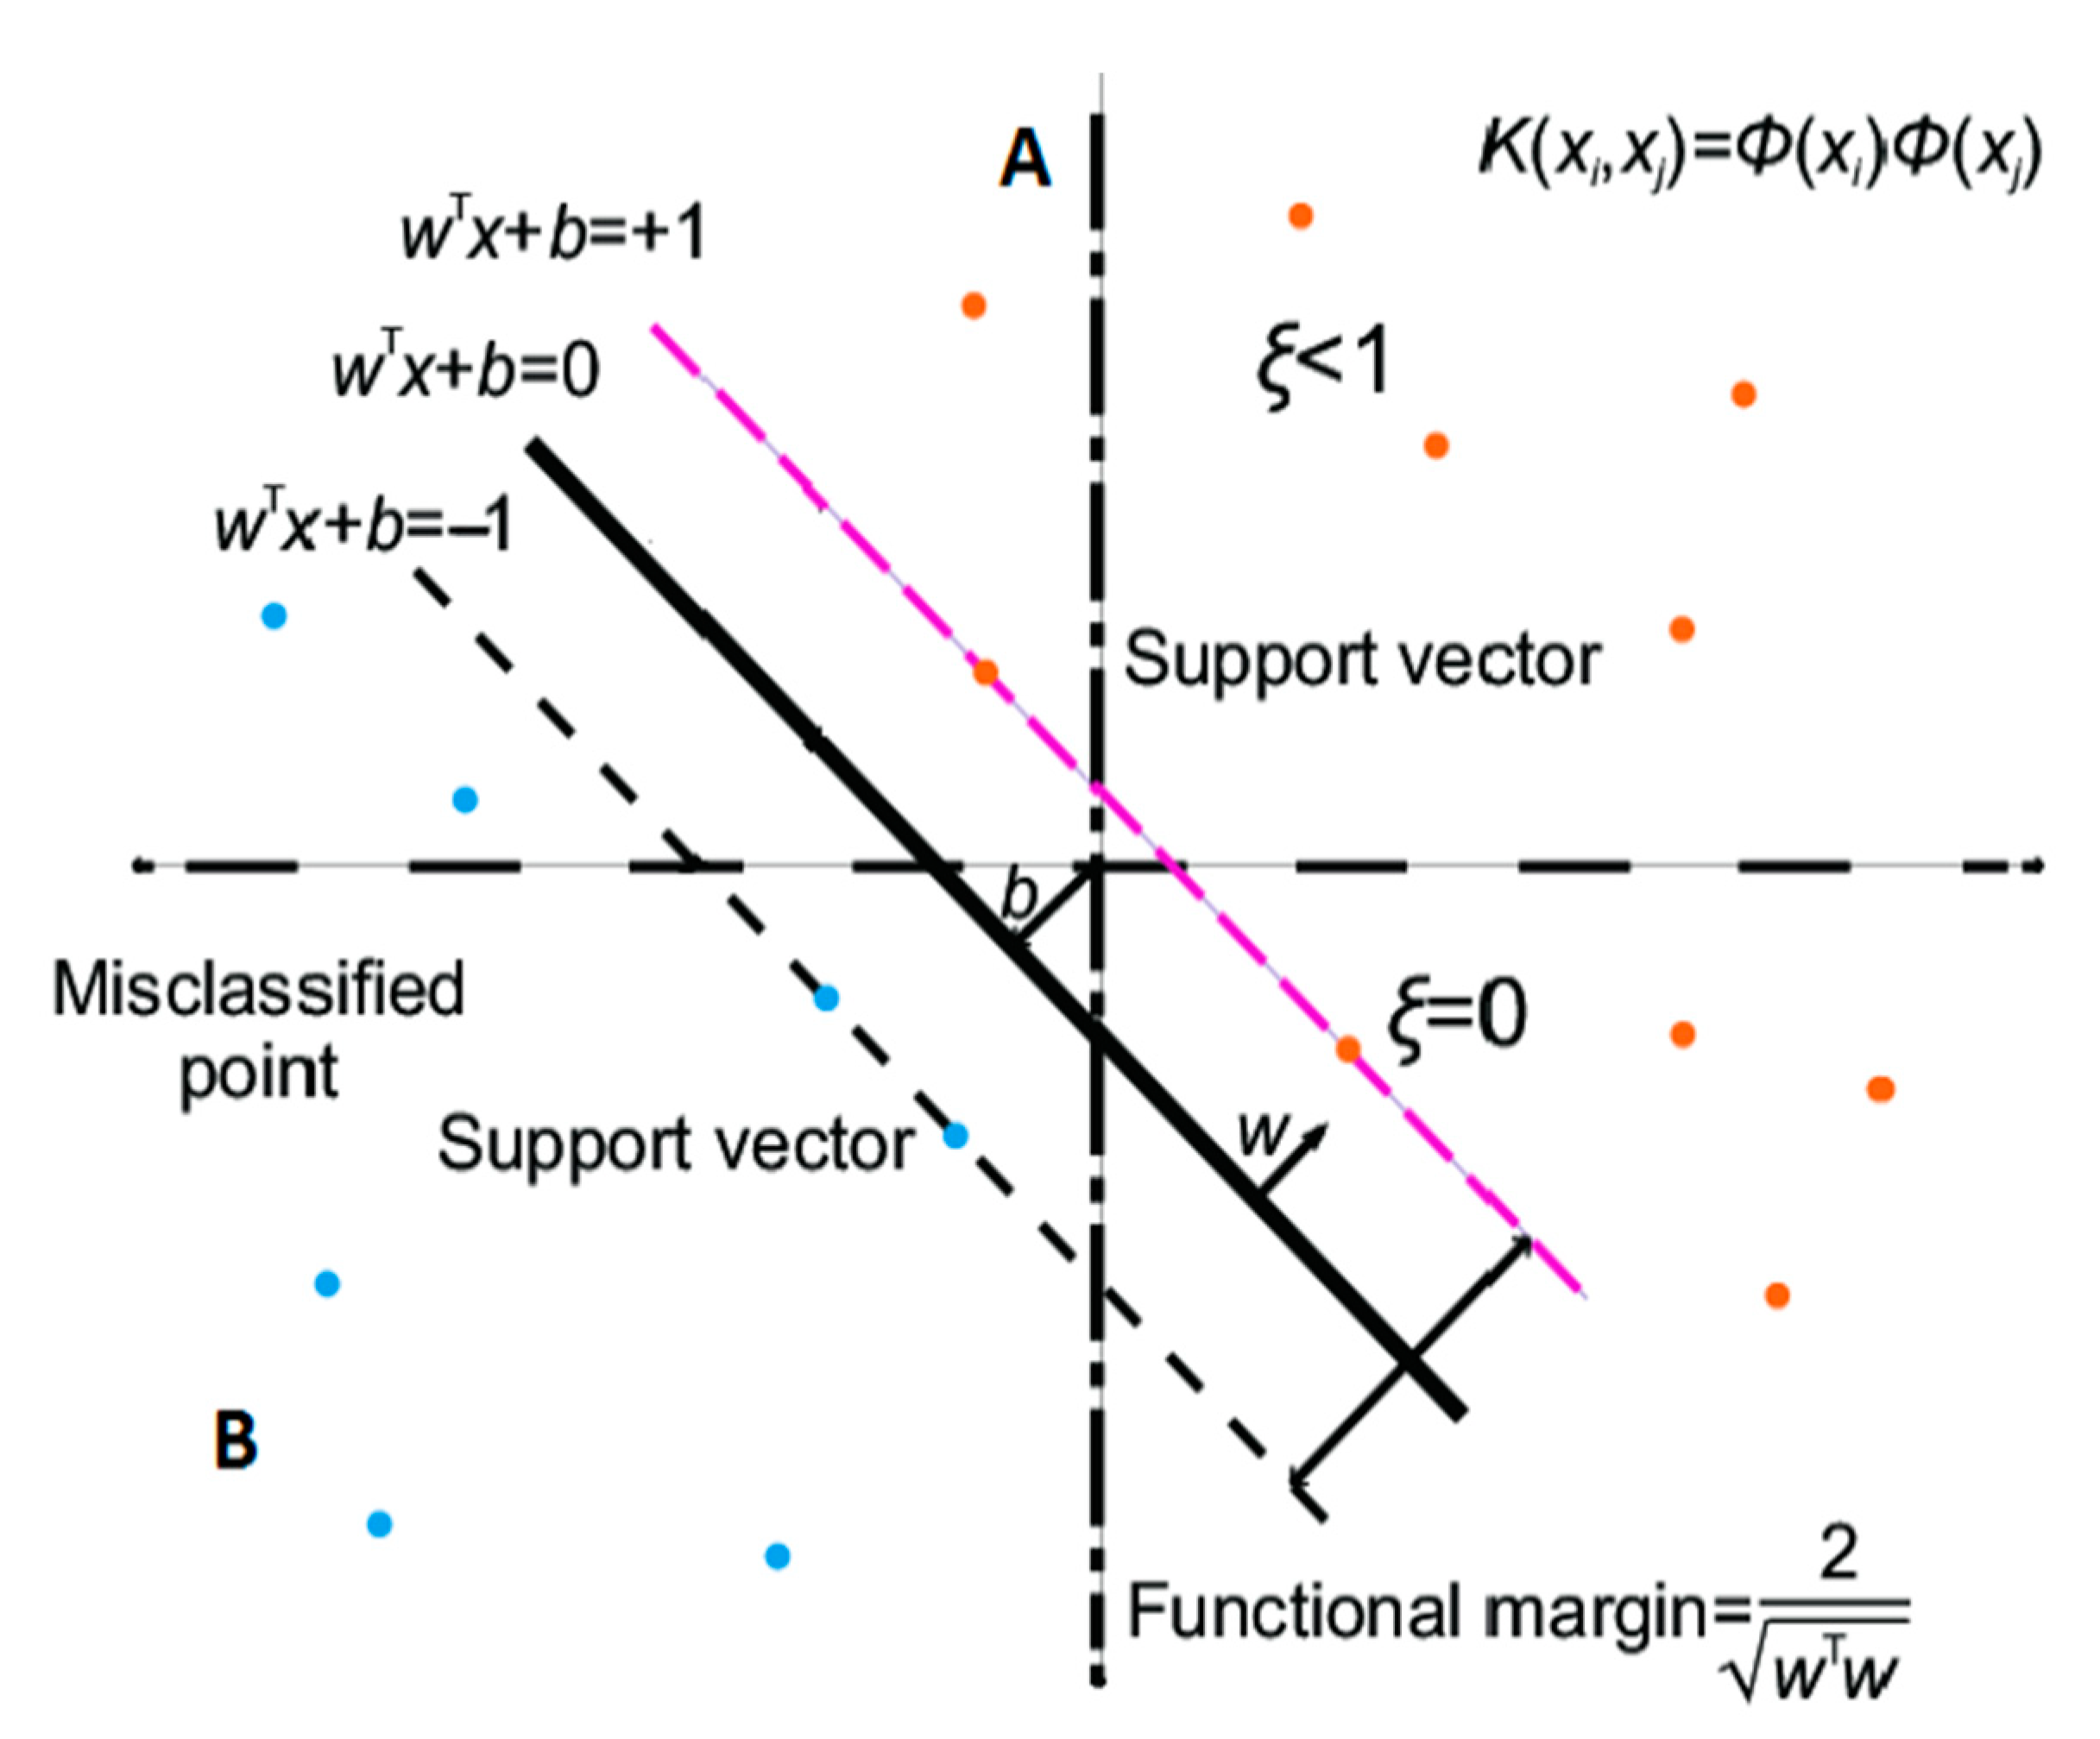
2.2. Support Vector Machine (SVM)
2.3. Model Performance Evaluation Indicators
3. Results and Discussion
3.1. Determining the Most Effective Input Compounds to Model Output Aims
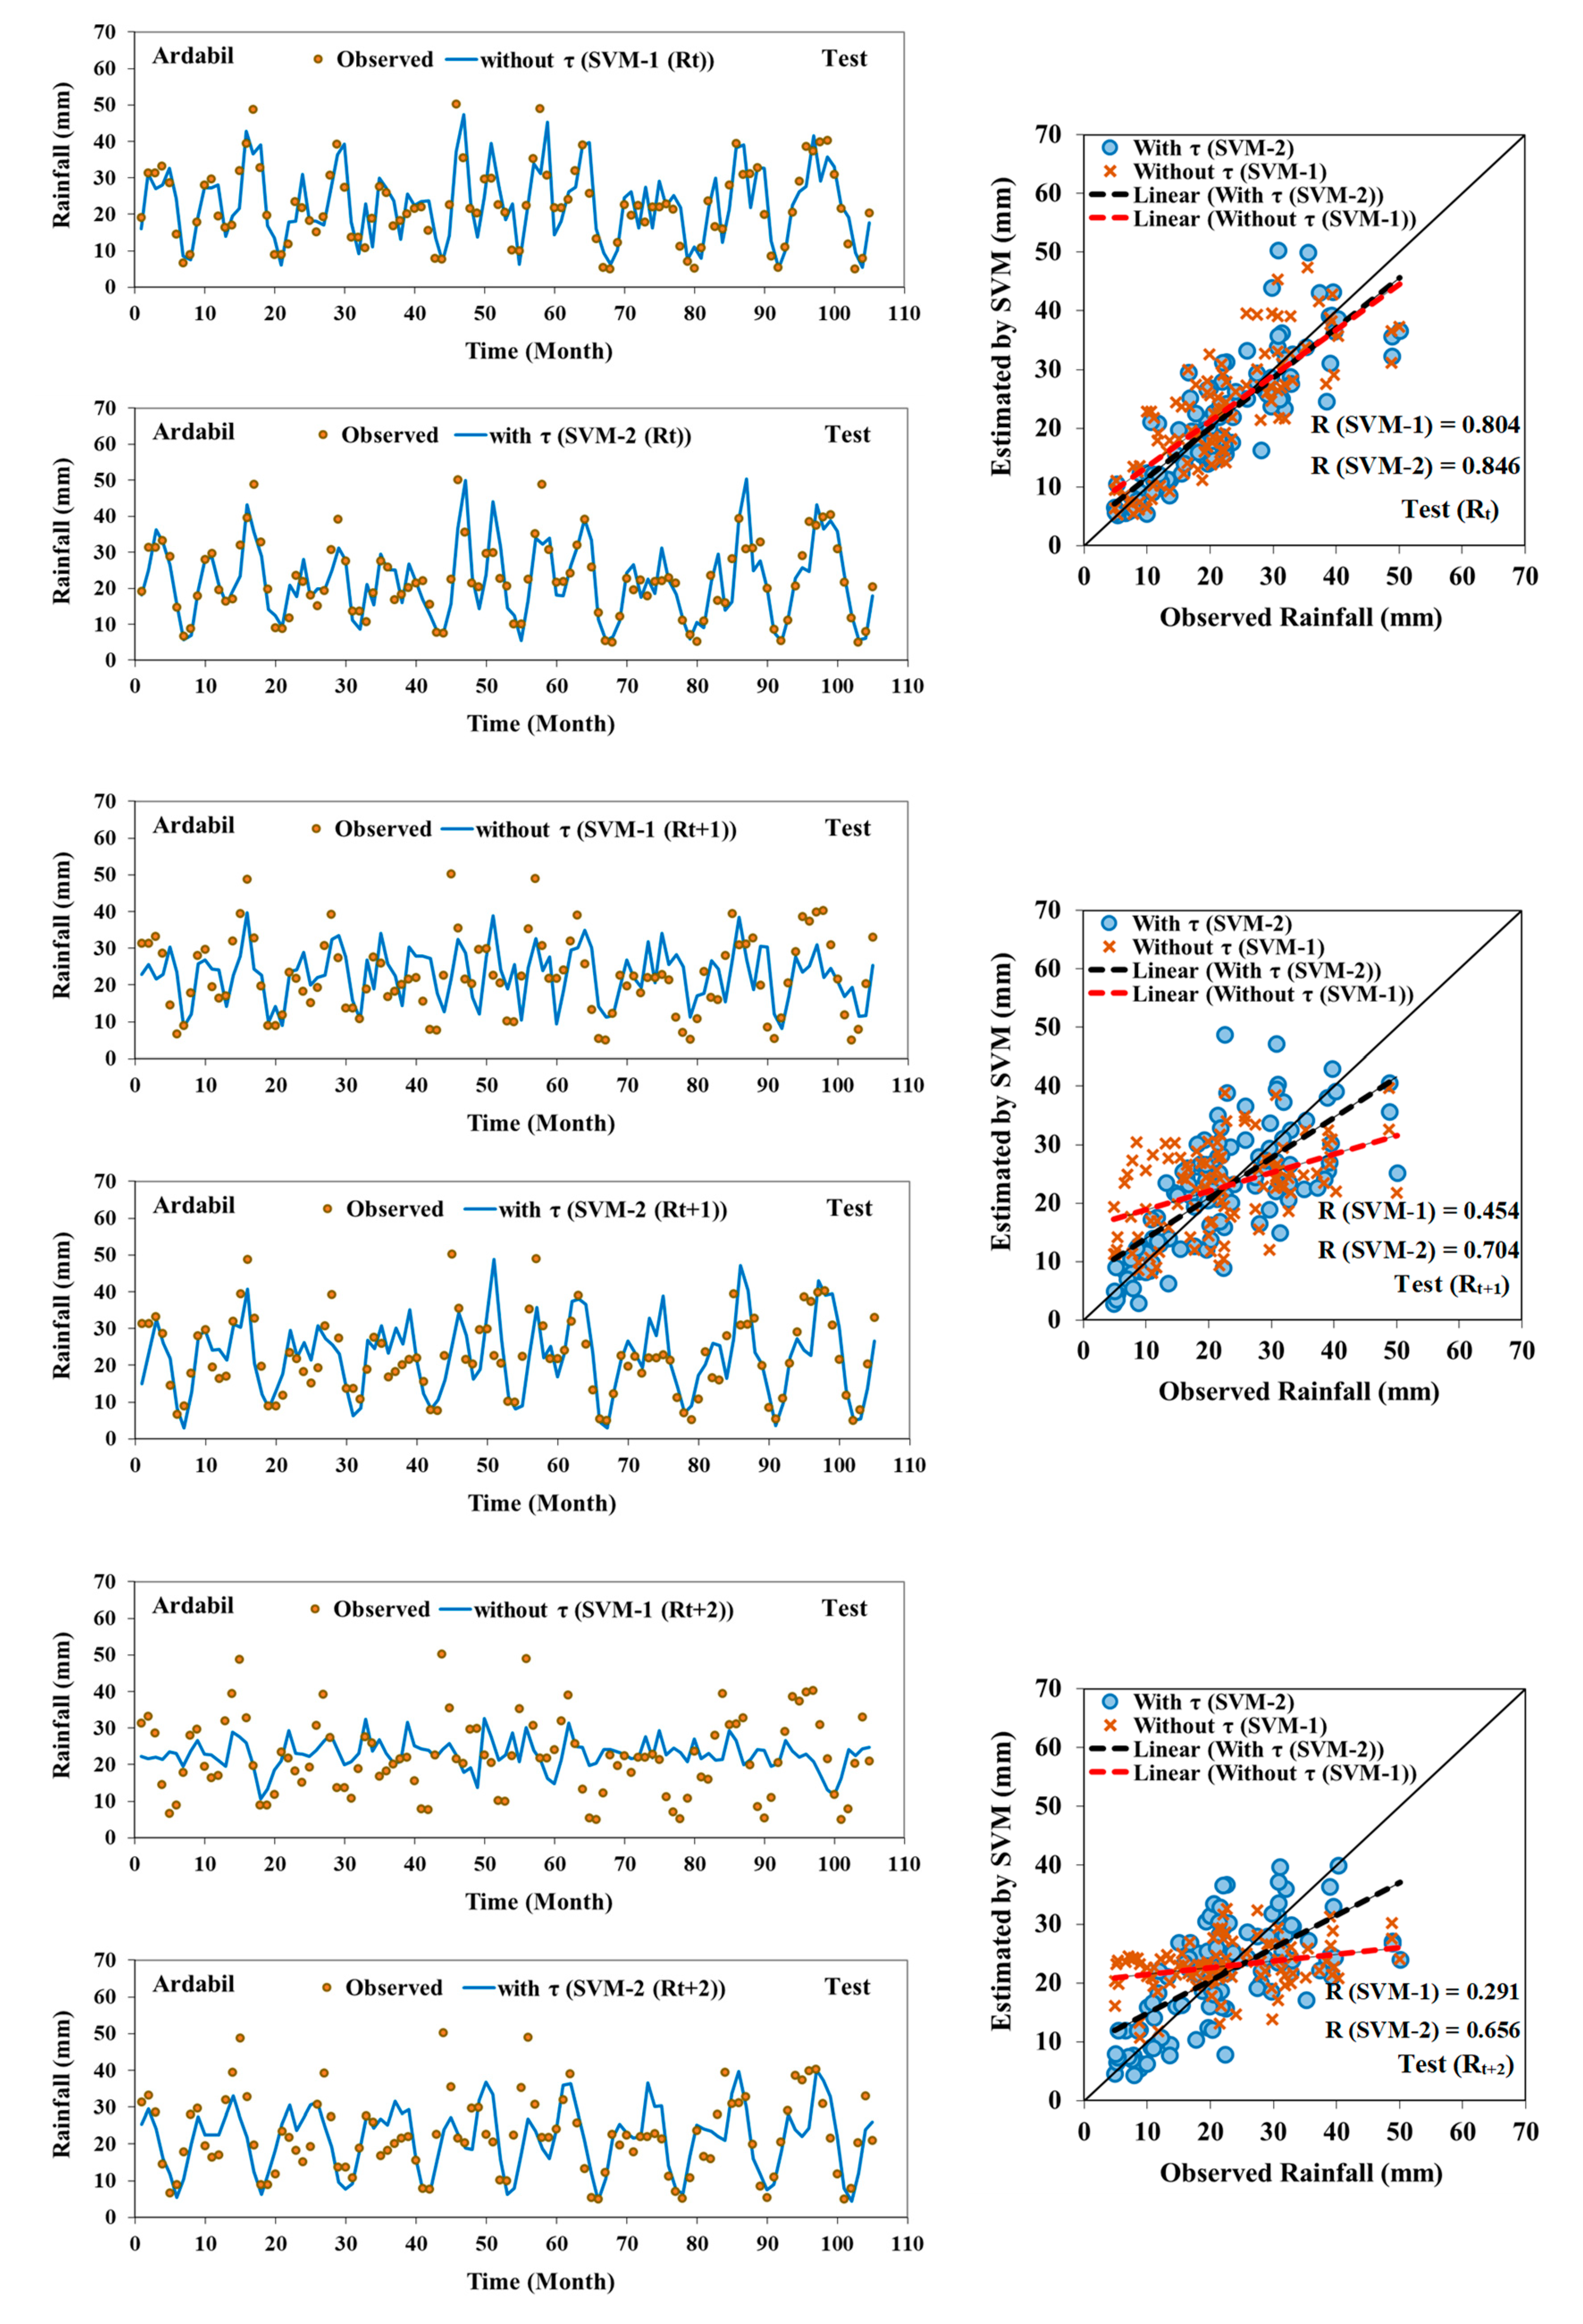
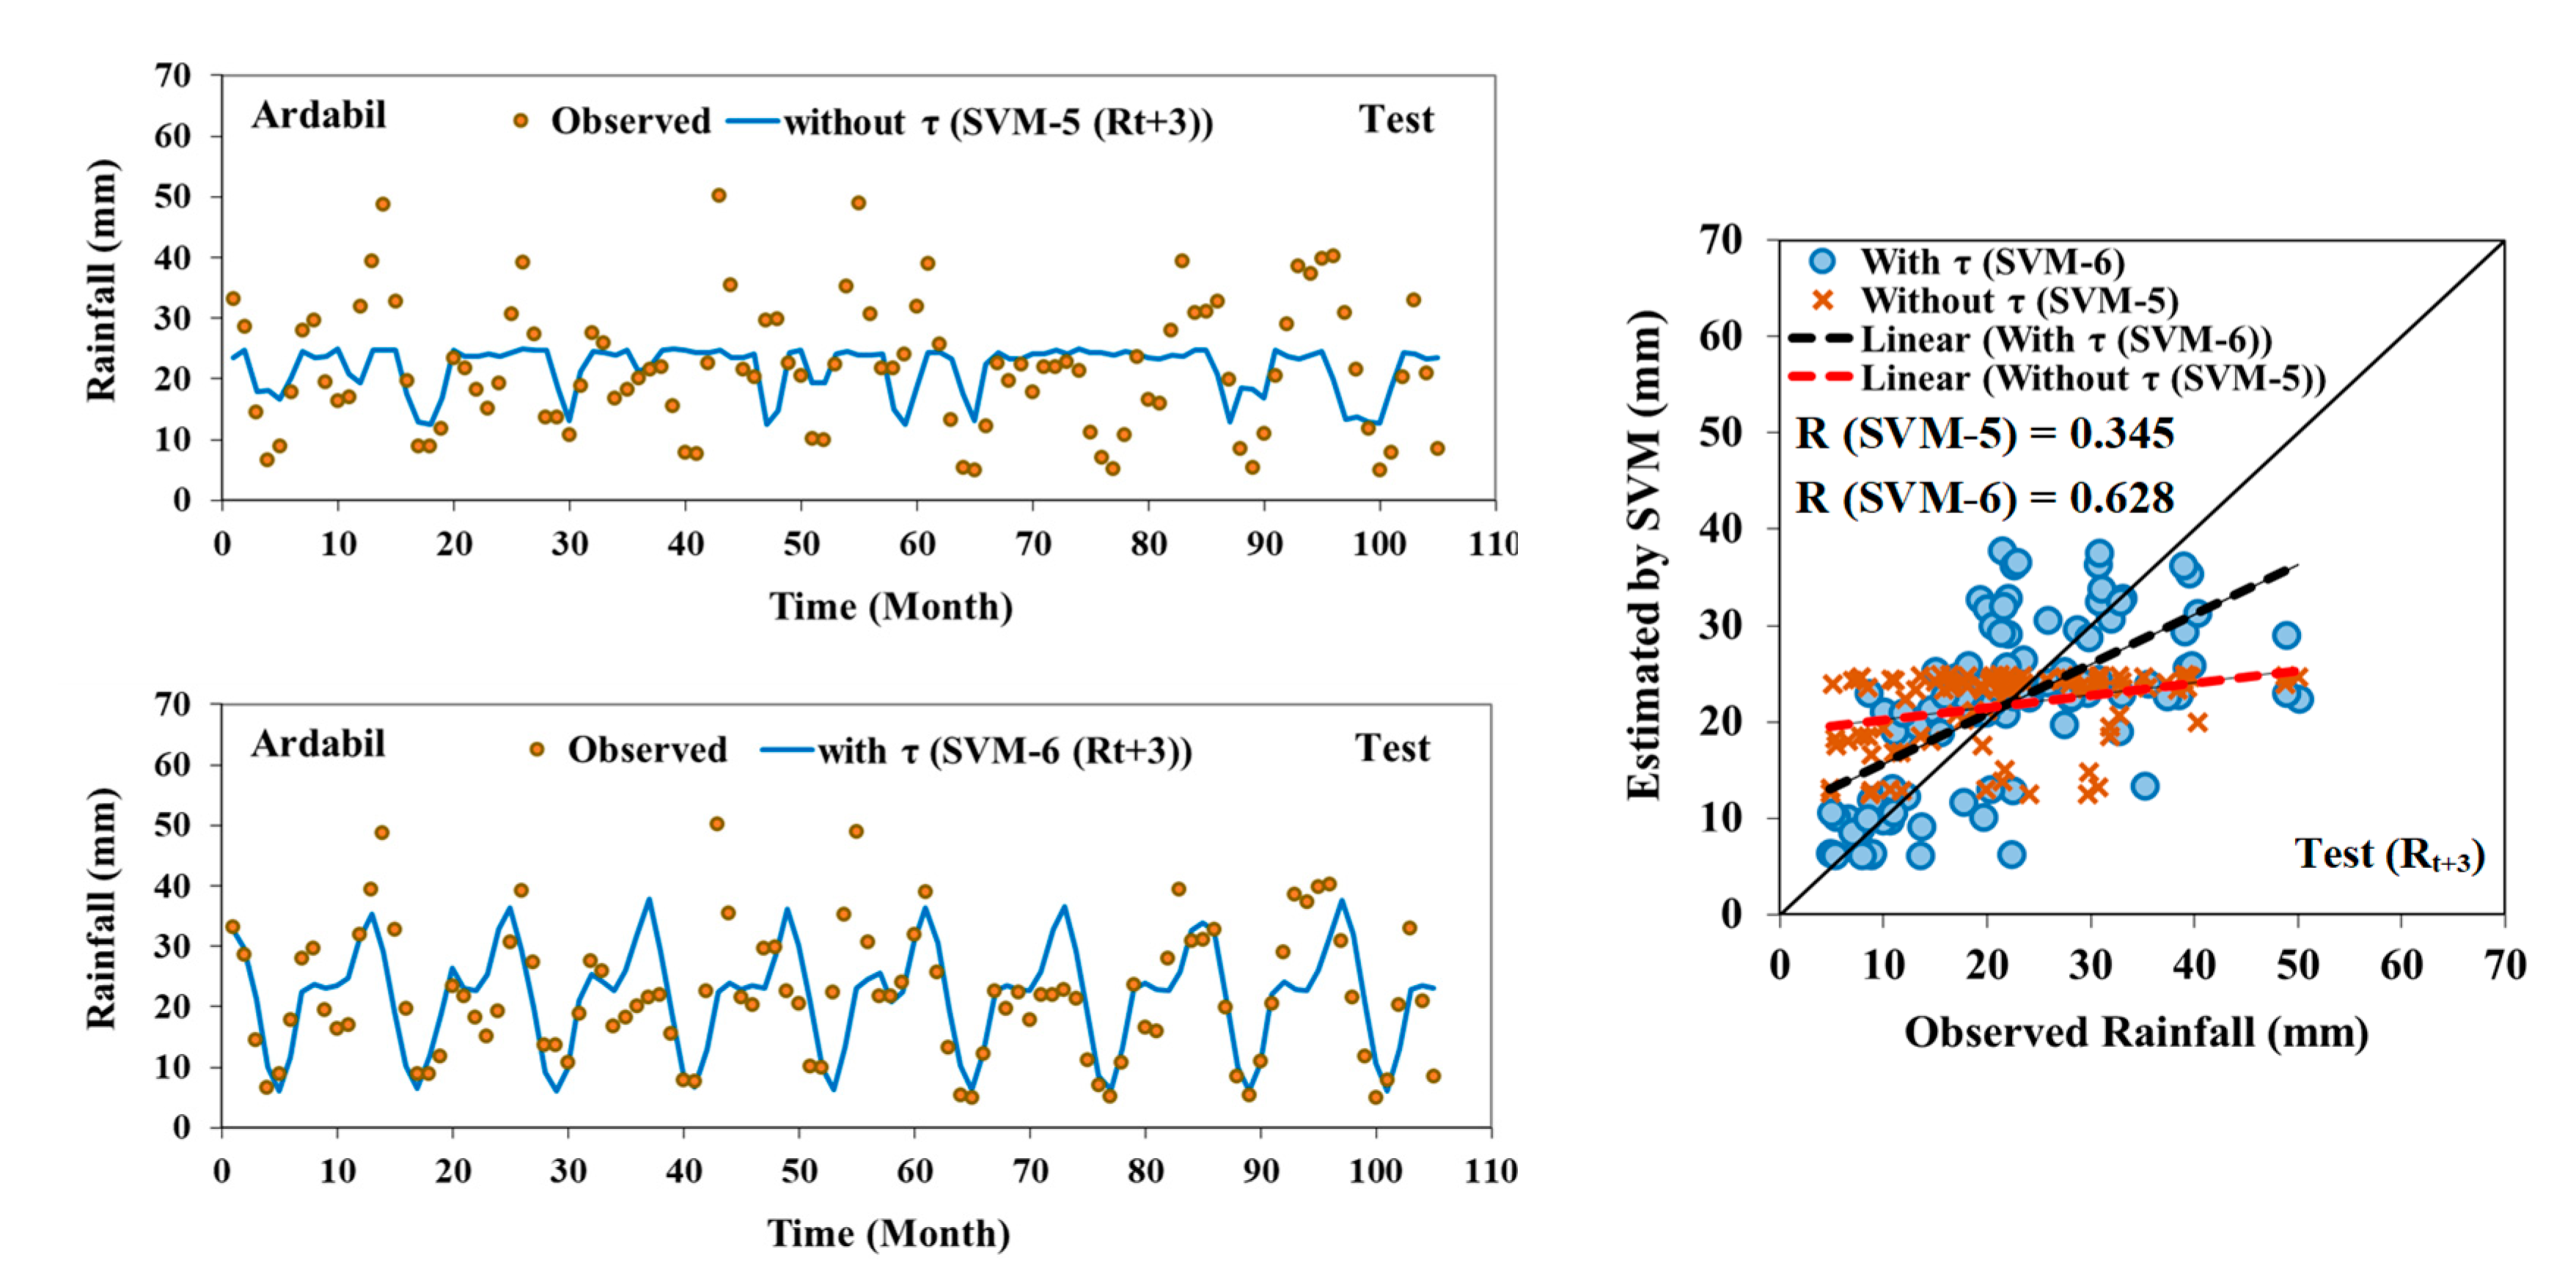
3.2. Simulation of Monthly Rainfall (R) at Ardabil Station
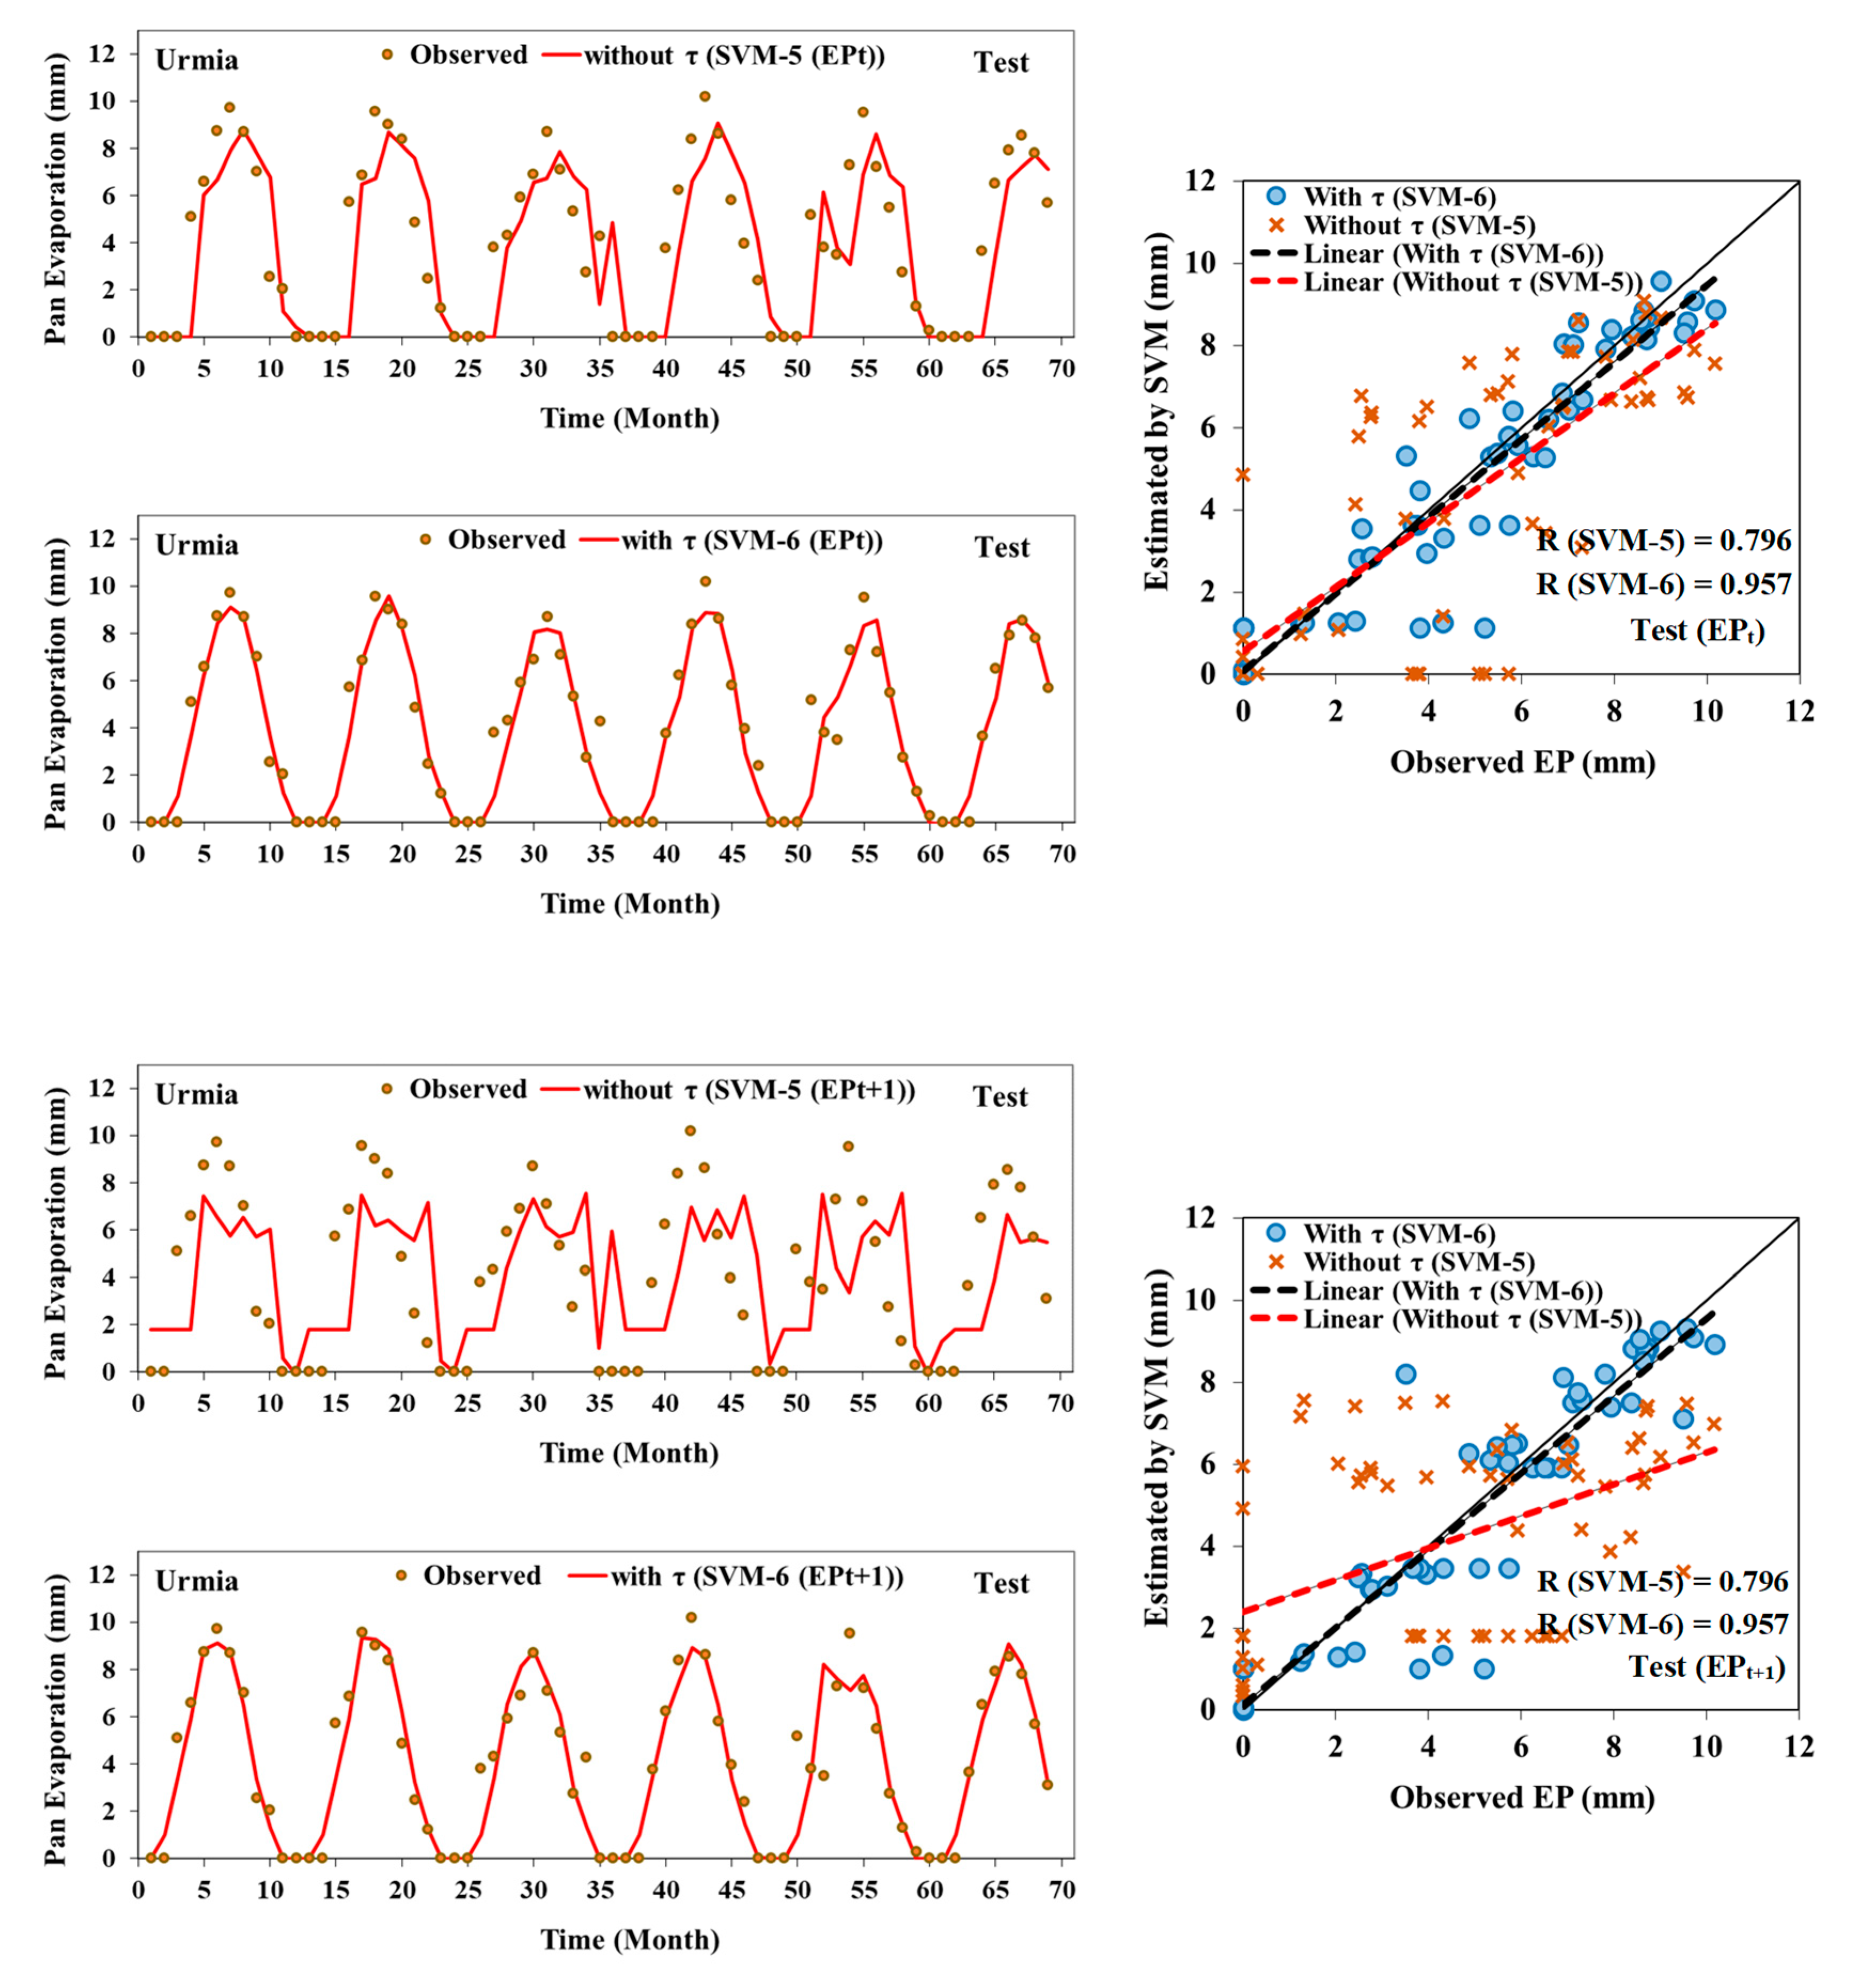
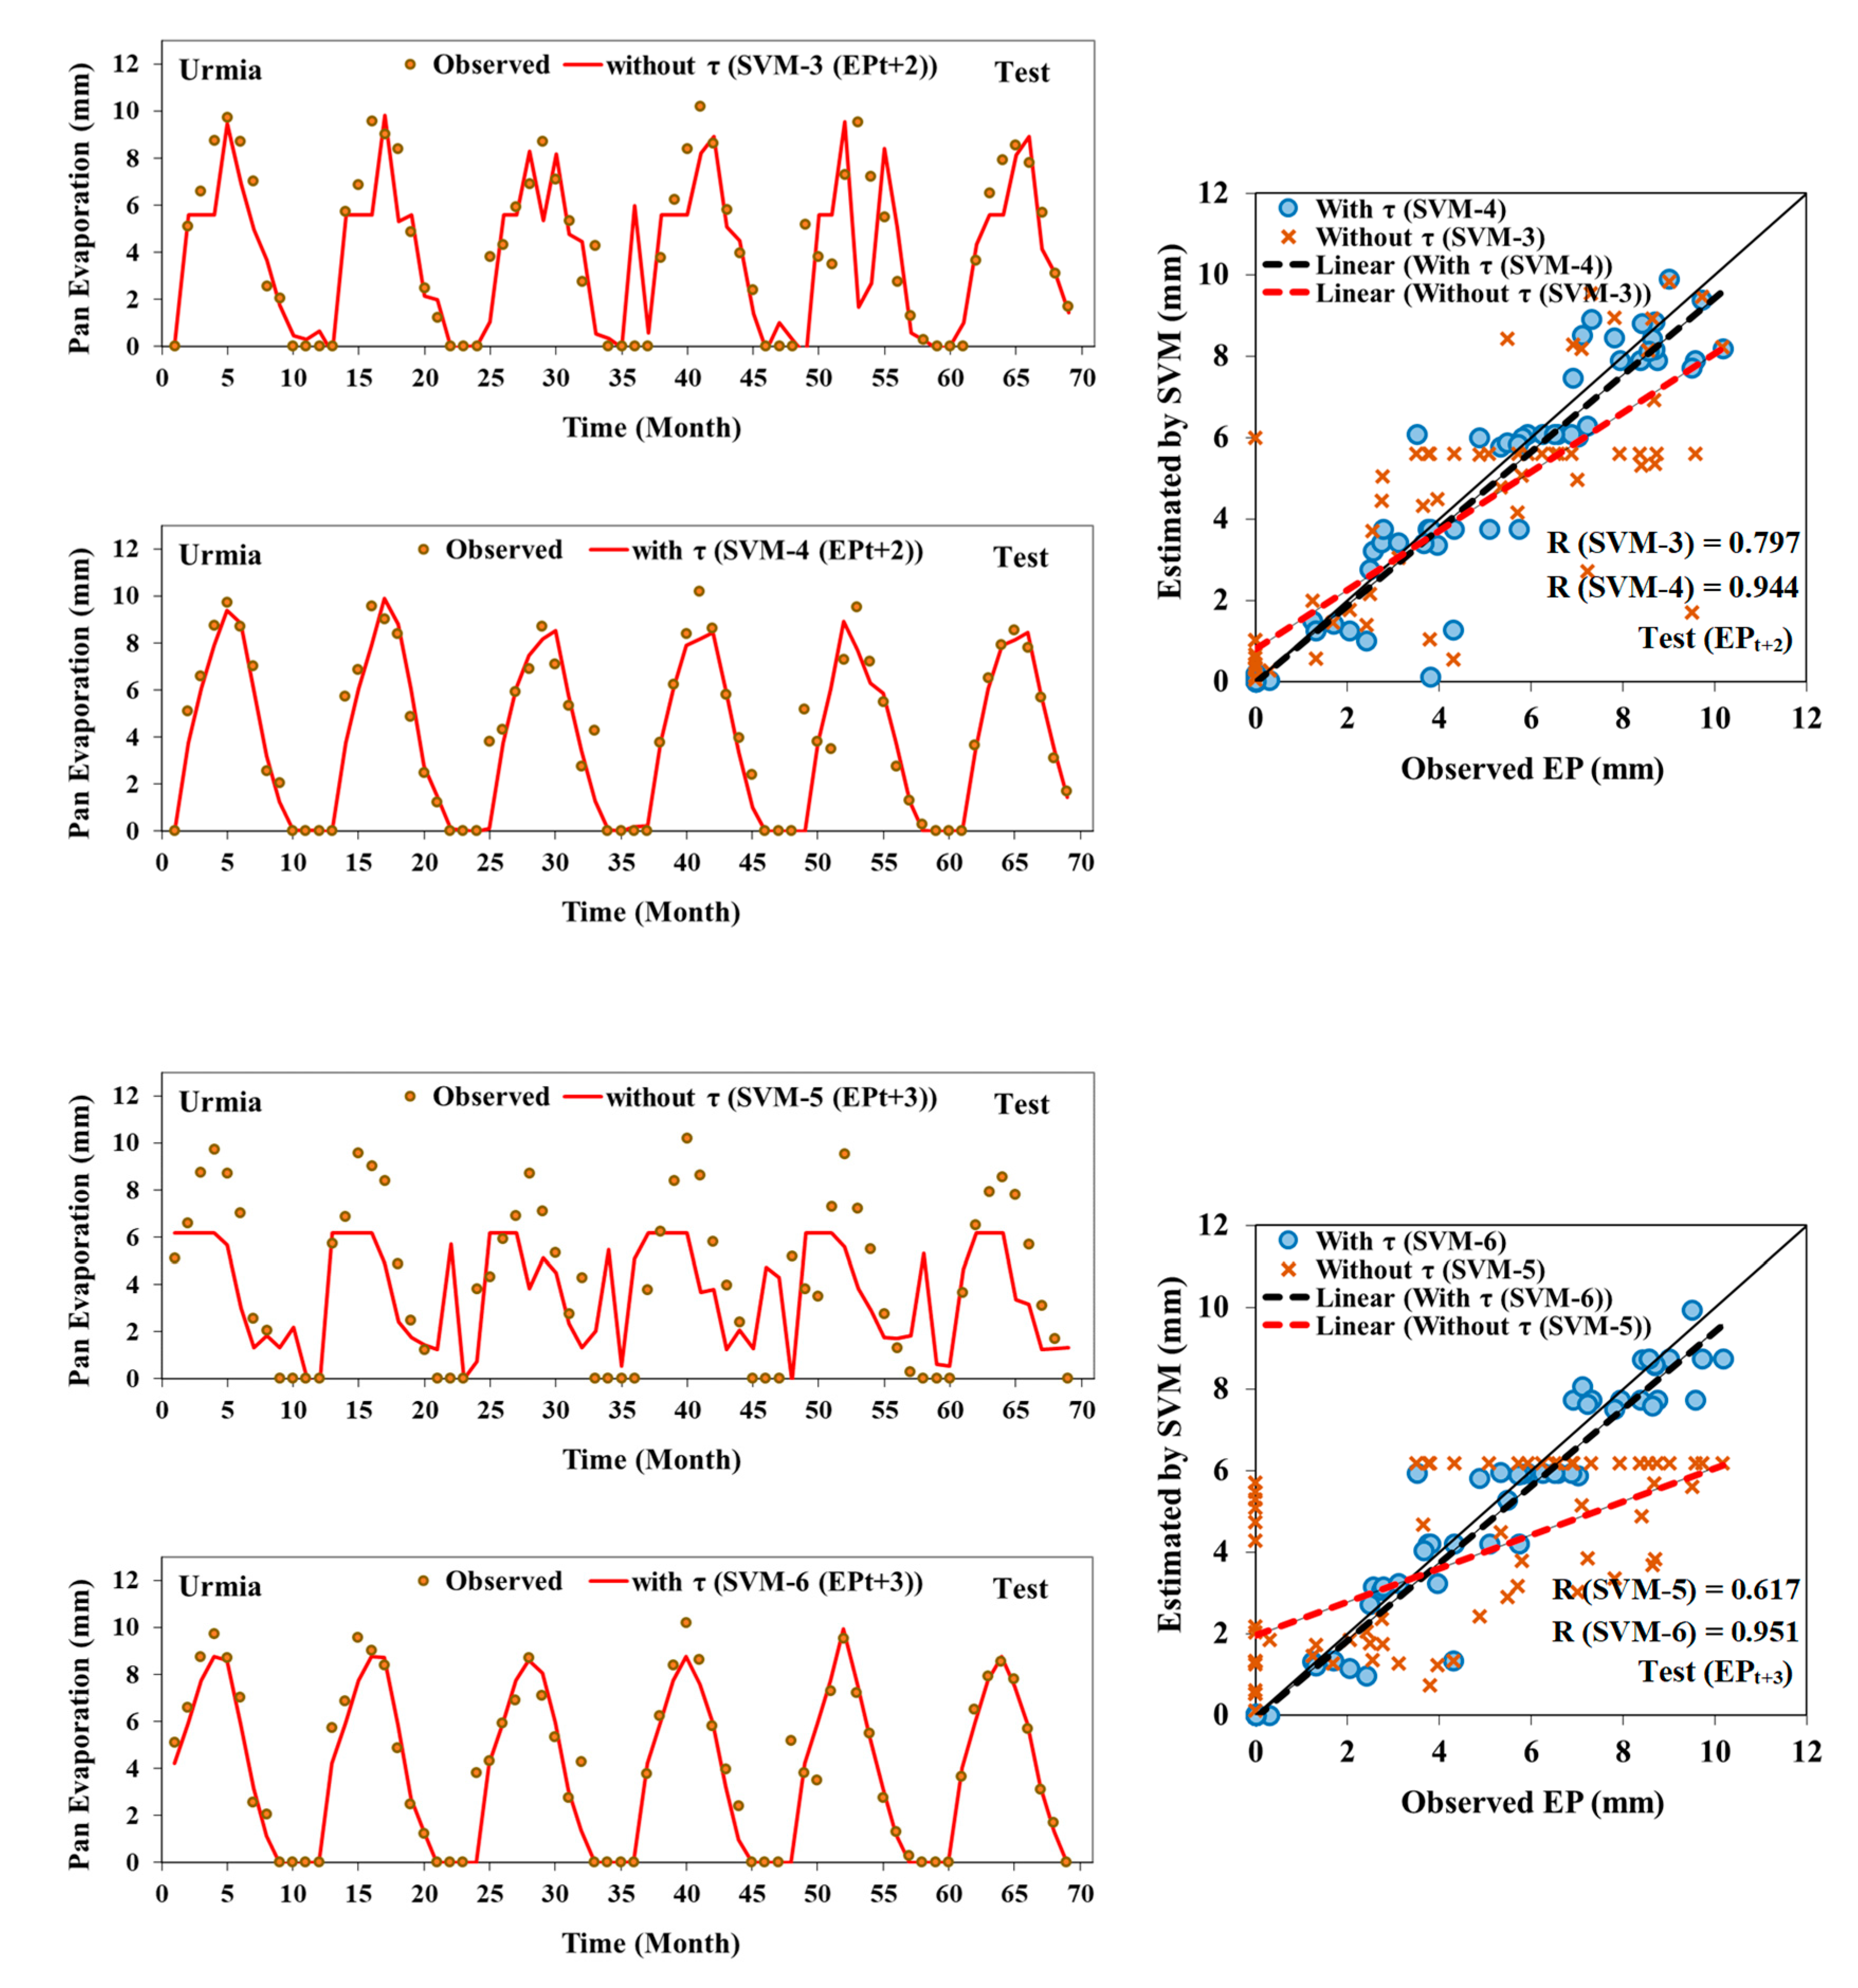
3.3. Simulation of Monthly Pan Evaporation (EP) at Urmia Station
3.4. Simulation for Months with Maximum Rainfall and Pan Evaporation
4. Conclusions
Author Contributions
Funding
Institutional Review Board Statement
Informed Consent Statement
Data Availability Statement
Conflicts of Interest
References
- McCuen, R. Vol. 3 of Hydrologic Analysis and Design; Prentice Hall: Upper Saddle River, NJ, USA, 2016. [Google Scholar]
- Daliakopoulos, I.N.; Coulibaly, P.; Tsanis, I.K. Groundwater level forecasting using artificial neural networks. J. Hydrol. 2005, 309, 229–240. [Google Scholar] [CrossRef]
- ASCE Task Committee on Application of Artificial Neural Networks in Hydrology. Artificial neural networks in hydrology. I: Preliminary concepts. J. Hydrol. Eng. 2000, 5, 115–123. [Google Scholar] [CrossRef]
- Javadi, A.A.; Al-Najjar, M.M. Finite element modeling of contaminant transport in soils including the effect of chemical reactions. J. Hazard. Mater. 2007, 143, 690–701. [Google Scholar] [CrossRef] [PubMed]
- Coppola, E.A., Jr.; Rana, A.J.; Poulton, M.M.; Szidarovszky, F.; Uhl, V.W. A neural network model for predicting aquifer water level elevations. Groundwater 2005, 43, 231–241. [Google Scholar] [CrossRef] [PubMed]
- Krishna, B.; Satyaji Rao, Y.R.; Vijaya, T. Modelling groundwater levels in an urban coastal aquifer using artificial neural networks. Hydrol. Process. Int. J. 2008, 22, 1180–1188. [Google Scholar] [CrossRef]
- Basheer, I.A.; Hajmeer, M. Artificial neural networks: Fundamentals, computing, design, and application. J. Microbiol. Methods 2000, 43, 3–31. [Google Scholar] [CrossRef]
- Chen, S.H.; Jakeman, A.J.; Norton, J.P. Artificial intelligence techniques: An introduction to their use for modelling environmental systems. Math. Comput. Simul. 2008, 78, 379–400. [Google Scholar] [CrossRef]
- Choubin, B.; Zehtabian, G.; Azareh, A.; Rafiei-Sardooi, E.; Sajedi-Hosseini, F.; Kişi, Ö. Precipitation forecasting using classification and regression trees (CART) model: A comparative study of different approaches. Environ. Earth Sci. 2018, 77, 1–13. [Google Scholar] [CrossRef]
- Diop, L.; Samadianfard, S.; Bodian, A.; Yaseen, Z.M.; Ghorbani, M.A.; Salimi, H. Annual rainfall forecasting using hybrid artificial intelligence model: Integration of multilayer perceptron with whale optimization algorithm. Water Resour. Manag. 2020, 34, 733–746. [Google Scholar] [CrossRef]
- Ghorbani, M.A.; Deo, R.C.; Yaseen, Z.M.; Kashani, M.H.; Mohammadi, B. Pan evaporation prediction using a hybrid multilayer perceptron-firefly algorithm (MLP-FFA) model: Case study in North Iran. Theor. Appl. Climatol. 2018, 133, 1119–1131. [Google Scholar] [CrossRef]
- Hadi, S.J.; Abba, S.I.; Sammen, S.S.; Salih, S.Q.; Al-Ansari, N.; Yaseen, Z.M. Non-linear input variable selection approach integrated with non-tuned data intelligence model for streamflow pattern simulation. IEEE Access 2019, 7, 141533–141548. [Google Scholar] [CrossRef]
- Sammen, S.S.; Mohamed, T.A.; Ghazali, A.H.; El-Shafie, A.H.; Sidek, L.M. Generalized regression neural network for prediction of peak outflow from dam breach. Water Resour. Manag. 2017, 31, 549–562. [Google Scholar] [CrossRef]
- Tikhamarine, Y.; Souag-Gamane, D.; Ahmed, A.N.; Sammen, S.S.; Kisi, O.; Huang, Y.F.; El-Shafie, A. Rainfall-runoff modelling using improved machine learning methods: Harris hawks optimizer vs. particle swarm optimization. J. Hydrol. 2020, 589, 125133. [Google Scholar] [CrossRef]
- Suparta, W.; Samah, A.A. Rainfall prediction by using ANFIS times series technique in South Tangerang, Indonesia. Geod. Geodyn. 2020, 11, 411–417. [Google Scholar] [CrossRef]
- Ridwan, W.M.; Sapitang, M.; Aziz, A.; Kushiar, K.F.; Ahmed, A.N.; El-Shafie, A. Rainfall forecasting model using machine learning methods: Case study Terengganu, Malaysia. Ain Shams Eng. J. 2020, 12, 1651–1663. [Google Scholar] [CrossRef]
- Yen, M.H.; Liu, D.W.; Hsin, Y.C.; Lin, C.E.; Chen, C.C. Application of the deep learning for the prediction of rainfall in Southern Taiwan. Sci. Rep. 2019, 9, 1–9. [Google Scholar] [CrossRef] [Green Version]
- Qasem, S.N.; Samadianfard, S.; Kheshtgar, S.; Jarhan, S.; Kisi, O.; Shamshirband, S.; Chau, K.W. Modeling monthly pan evaporation using wavelet support vector regression and wavelet artificial neural networks in arid and humid climates. Eng. Appl. Comput. Fluid Mech. 2019, 13, 177–187. [Google Scholar] [CrossRef] [Green Version]
- Tezel, G.; Buyukyildiz, M. Monthly evaporation forecasting using artificial neural networks and support vector machines. Theor. Appl. Climatol. 2016, 124, 69–80. [Google Scholar] [CrossRef]
- Malik, A.; Kumar, A.; Kisi, O. Daily pan evaporation estimation using heuristic methods with gamma test. J. Irrig. Drain. Eng. 2018, 144, 04018023. [Google Scholar] [CrossRef]
- Shiri, J. Evaluation of a neuro-fuzzy technique in estimating pan evaporation values in low-altitude locations. Meteorol. Appl. 2019, 26, 204–212. [Google Scholar] [CrossRef] [Green Version]
- Kisi, O.; Heddam, S. Evaporation modelling by heuristic regression approaches using only temperature data. Hydrol. Sci. J. 2019, 64, 653–672. [Google Scholar] [CrossRef]
- Moraes, R.; Valiati, J.F.; Neto, W.P. Document-level sentiment classification: An empirical comparison between SVM and ANN. Expert Syst. Appl. 2013, 40, 621–633. [Google Scholar] [CrossRef]
- Shin, K.S.; Lee, T.S.; Kim, H.J. An application of support vector machines in bankruptcy prediction model. Expert Syst. Appl. 2005, 28, 127–135. [Google Scholar] [CrossRef]
- Yoon, H.; Jun, S.C.; Hyun, Y.; Bae, G.O.; Lee, K.K. A comparative study of artificial neural networks and support vector machines for predicting groundwater levels in a coastal aquifer. J. Hydrol. 2011, 396, 128–138. [Google Scholar] [CrossRef]
- Chen, Q.; Dai, G.; Liu, H. Volume of fluid model for turbulence numerical simulation of stepped spillway overflow. J. Hydraul. Eng. 2002, 128, 683–688. [Google Scholar] [CrossRef]
- Ehteram, M.; Salih, S.Q.; Yaseen, Z.M. Efficiency evaluation of reverse osmosis desalination plant using hybridized multilayer perceptron with particle swarm optimization. Environ. Sci. Pollut. Res. 2020, 27, 1–14. [Google Scholar] [CrossRef] [PubMed]
- Han, S.; Qubo, C.; Meng, H. Parameter selection in SVM with RBF kernel function. In Proceedings of the World Automation Congress, Puerto Vallarta, Mexico, 24–28 June 2012; pp. 1–4. [Google Scholar]
- Nguyen, K.A.; Chen, W.; Lin, B.S.; Seeboonruang, U. Using Machine Learning-Based Algorithms to Analyze Erosion Rates of a Watershed in Northern Taiwan. Sustainability 2020, 12, 2022. [Google Scholar] [CrossRef] [Green Version]
- Shiru, M.S.; Shahid, S.; Park, I. Projection of Water Availability and Sustainability in Nigeria Due to Climate Change. Sustainability 2021, 13, 6284. [Google Scholar] [CrossRef]
- Yaseen, Z.M.; Al-Juboori, A.M.; Beyaztas, U.; Al-Ansari, N.; Chau, K.W.; Qi, C.; Alig, M.; Salihh, S.Q.; Shahid, S. Prediction of evaporation in arid and semi-arid regions: A comparative study using different machine learning models. Eng. Appl. Comput. Fluid Mech. 2020, 14, 70–89. [Google Scholar] [CrossRef] [Green Version]
- Yaseen, Z.M.; Sulaiman, S.O.; Deo, R.C.; Chau, K.W. An enhanced extreme learning machine model for river flow forecasting: State-of-the-art, practical applications in water resource engineering area and future research direction. J. Hydrol. 2019, 569, 387–408. [Google Scholar] [CrossRef]
- Gupta, H.V.; Kling, H.; Yilmaz, K.K.; Martinez, G.F. Decomposition of the mean squared error and NSE performance criteria: Implications for improving hydrological modelling. J. Hydrol. 2009, 377, 80–91. [Google Scholar] [CrossRef] [Green Version]
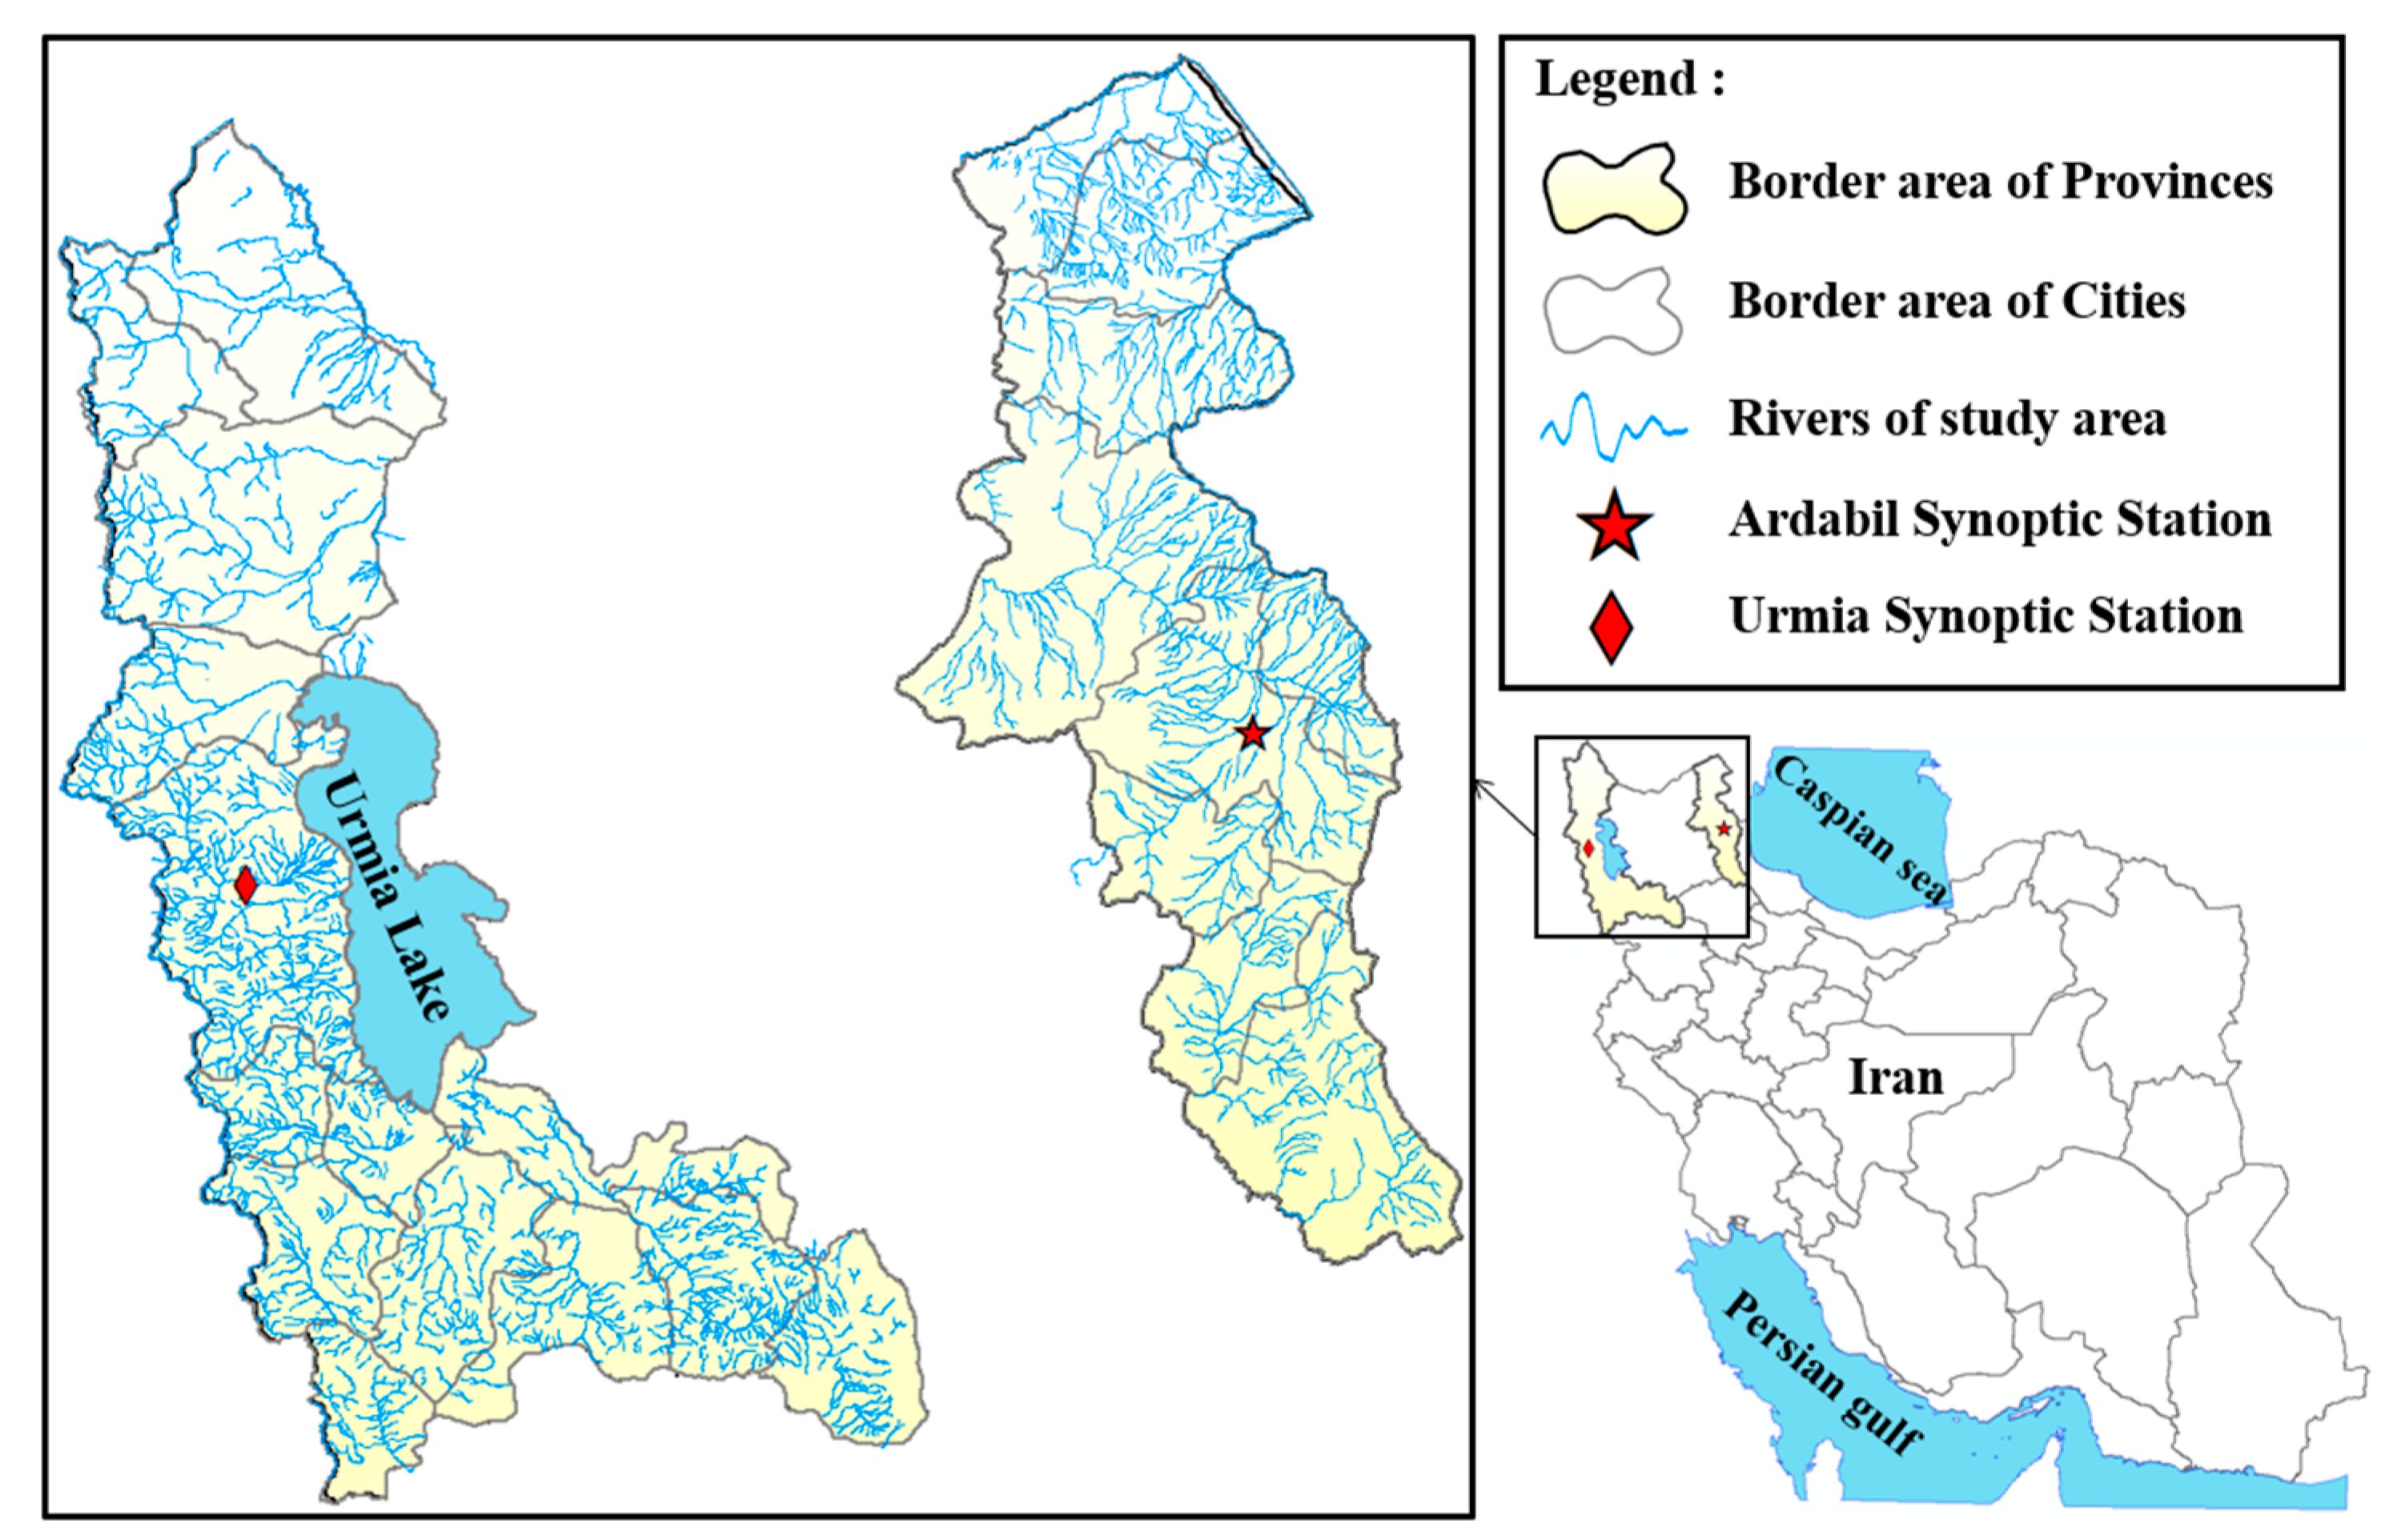
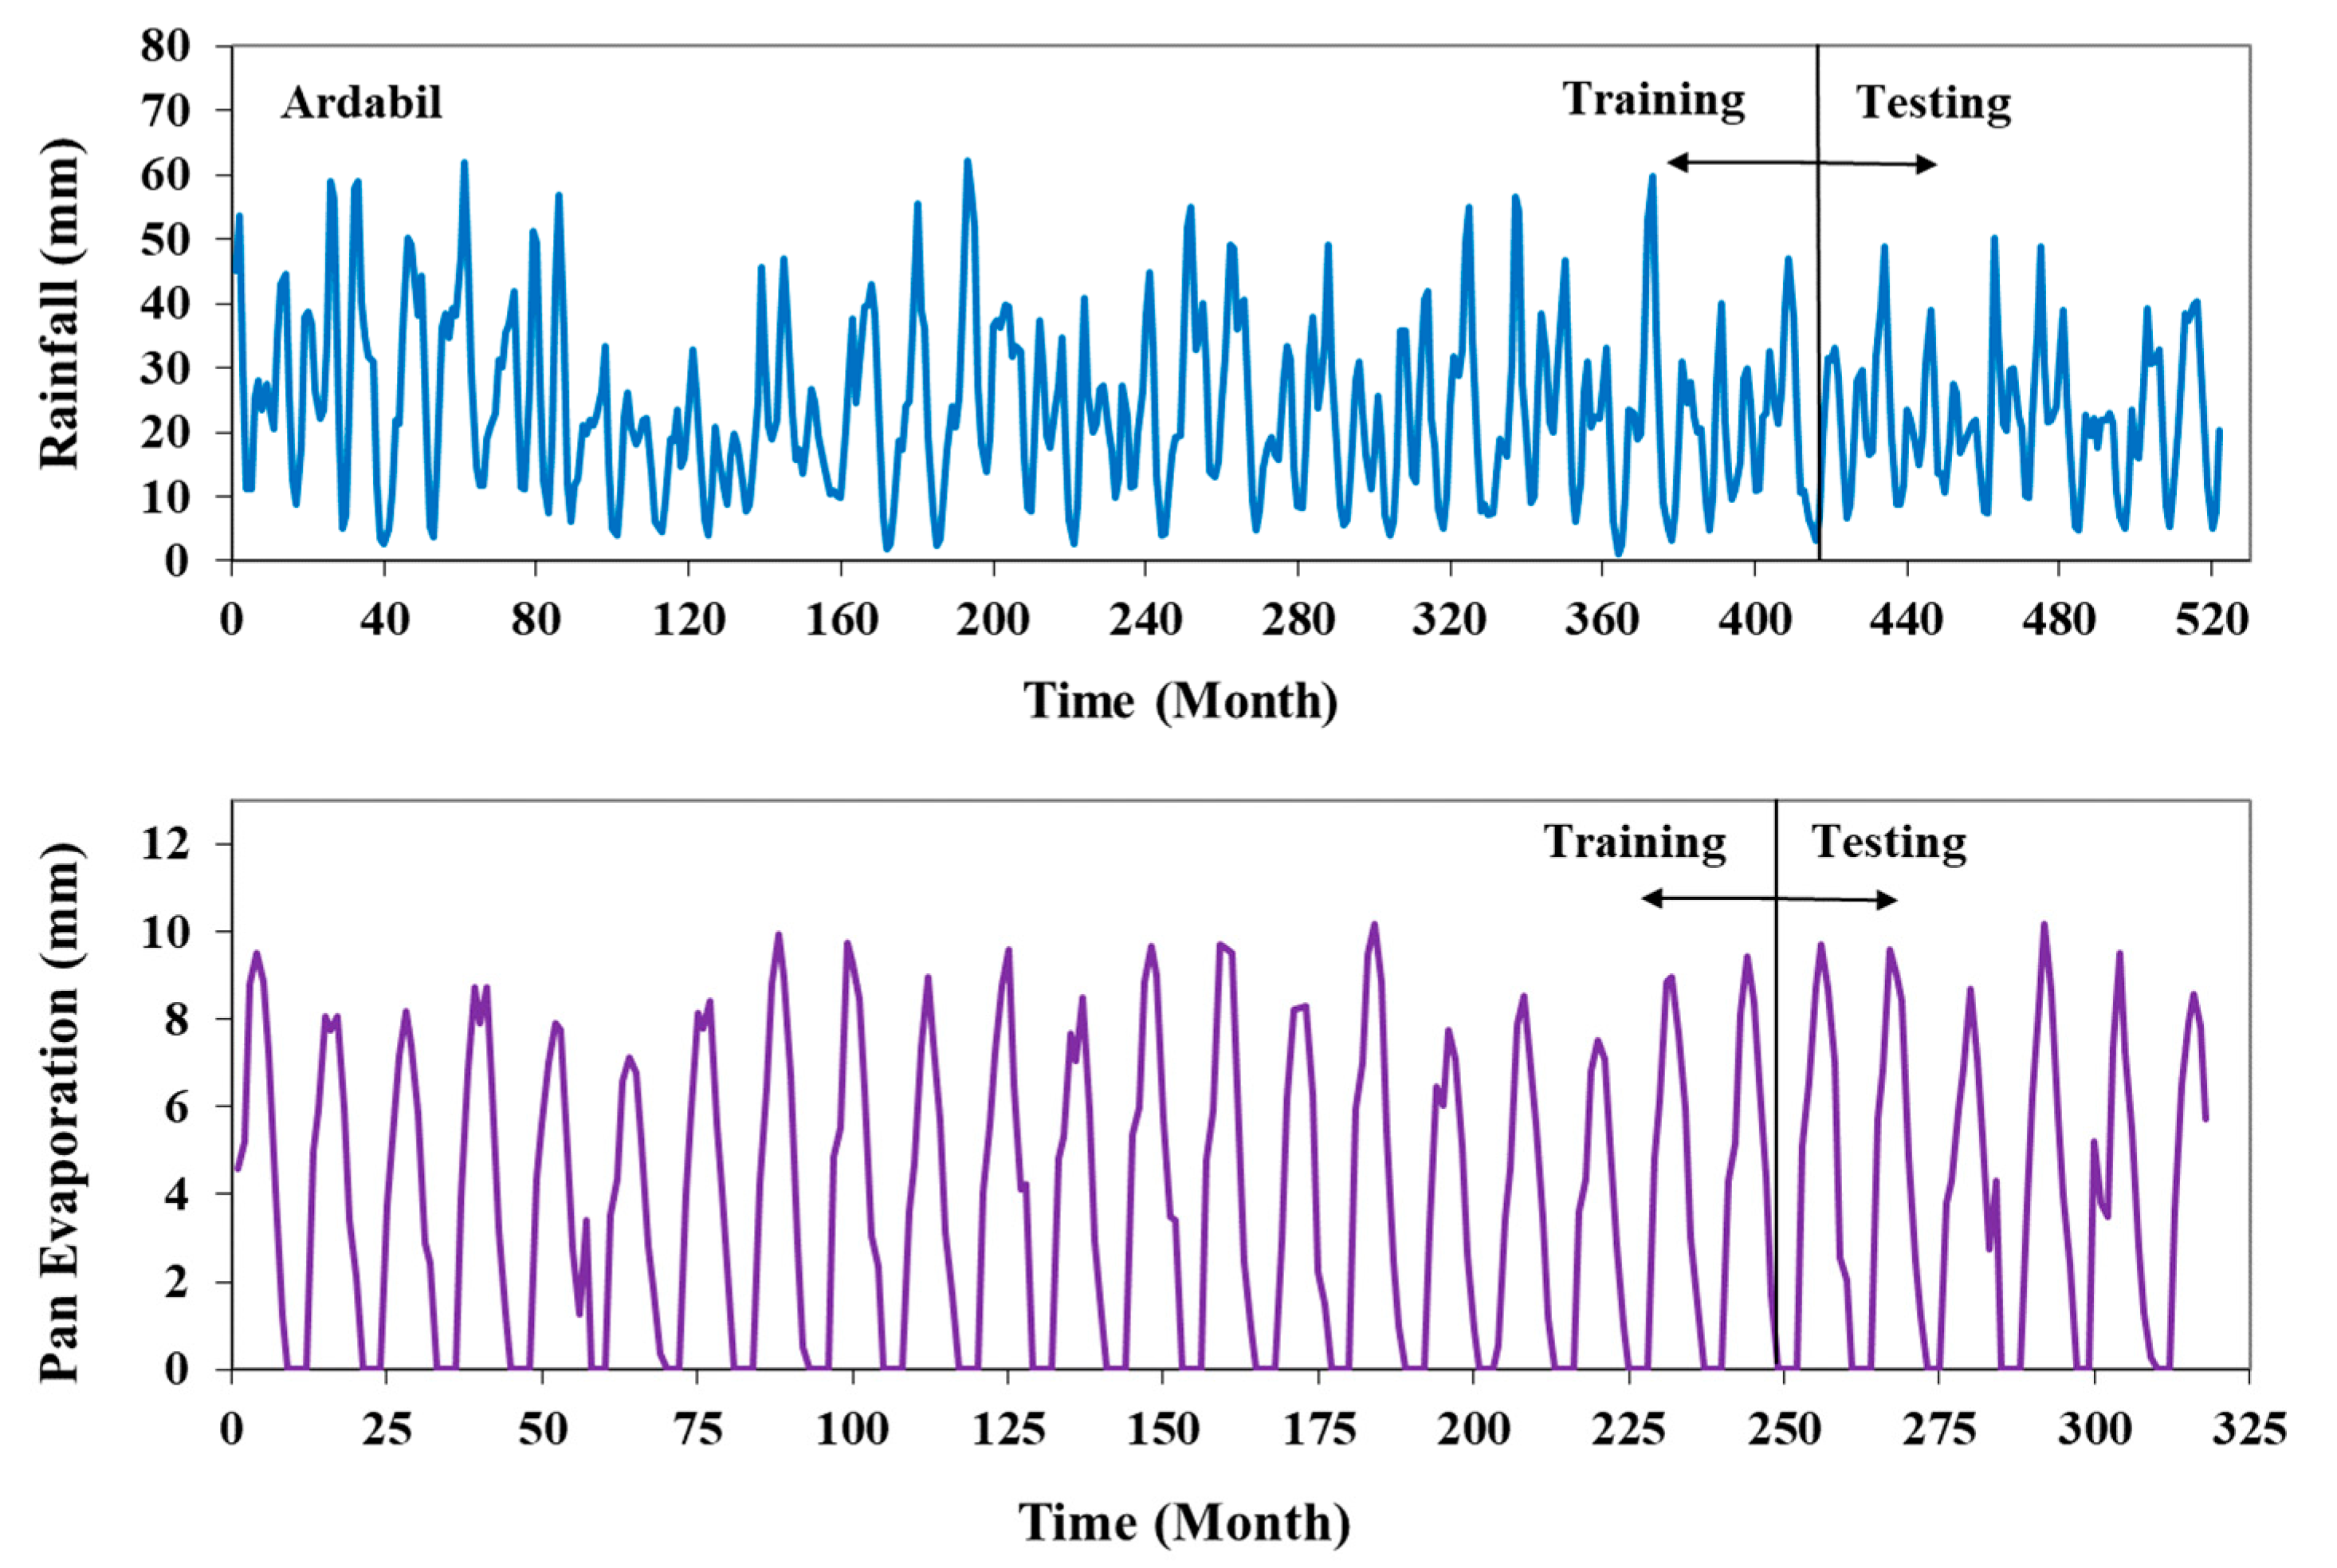
| Station | Datasets | Data No. | * Statistics | ||||
|---|---|---|---|---|---|---|---|
| Min | Max | Ave | SD | Skewness | |||
| Ardabil | Total | 519 | 1.02 | 62.25 | 23.19 | 12.92 | 0.63 |
| Training | 414 | 1.02 | 62.25 | 23.48 | 13.47 | 0.62 | |
| Testing | 105 | 4.85 | 50.07 | 22.05 | 10.47 | 0.44 | |
| Urmia | Total | 318 | 0 | 10.17 | 3.91 | 3.36 | 0.17 |
| Training | 249 | 0 | 10.16 | 3.86 | 3.36 | 0.19 | |
| Testing | 69 | 0 | 10.17 | 4.11 | 3.41 | 0.11 | |
| Function Type | Kernel Function |
|---|---|
| Polynomial kernel function | |
| Radial-based kernel function (RBF) | |
| Pearson kernel function (PUK) |
| Input Scenario | Output | Model | Training | Testing | ||||
|---|---|---|---|---|---|---|---|---|
| CC | KGE | RMSE (mm. Month−1) | CC | KGE | RMSE (mm. Month−1) | |||
| (1) Rt−1, Rt−2, Rt−3 | Rt | SVM-1 | 0.863 | 0.820 | 6.832 | 0.804 | 0.799 | 6.464 |
| * (3) Rt−1, Rt−2 | Rt | SVM-3 | 0.839 | 0.779 | 7.391 | 0.815 | 0.807 | 6.230 |
| (5) Rt−1 | Rt | SVM-5 | 0.717 | 0.609 | 9.459 | 0.666 | 0.615 | 7.912 |
| (1) Rt−1, Rt−2, Rt−3 | Rt+1 | SVM-1 | 0.580 | 0.417 | 11.061 | 0.454 | 0.377 | 9.694 |
| * (3) Rt−1, Rt−2 | Rt+1 | SVM-3 | 0.502 | 0.309 | 11.806 | 0.438 | 0.306 | 9.560 |
| (5) Rt−1 | Rt+1 | SVM-5 | 0.240 | −0.098 | 13.177 | 0.083 | −0.203 | 10.538 |
| * (1) Rt−1, Rt−2, Rt−3 | Rt+2 | SVM-1 | 0.373 | 0.120 | 12.552 | 0.291 | 0.065 | 10.067 |
| (3) Rt−1, Rt−2 | Rt+2 | SVM-3 | 0.277 | 0.025 | 13.190 | 0.274 | 0.057 | 10.120 |
| (5) Rt−1 | Rt+2 | SVM-5 | 0.152 | −0.171 | 13.417 | 0.185 | −0.151 | 10.255 |
| * (1) Rt−1, Rt−2, Rt−3 | Rt+3 | SVM-1 | 0.411 | 0.154 | 12.430 | 0.401 | 0.142 | 9.603 |
| (3) Rt−1, Rt−2 | Rt+3 | SVM-3 | 0.315 | 0.035 | 12.893 | 0.345 | 0.066 | 9.847 |
| (5) Rt−1 | Rt+3 | SVM-5 | 0.265 | 0.007 | 13.252 | 0.345 | 0.093 | 9.840 |
| Input Scenario | Output | Model | Training | Testing | ||||
|---|---|---|---|---|---|---|---|---|
| CC | KGE | RMSE (mm. Month−1) | CC | KGE | RMSE (mm. Month−1) | |||
| * (2) τ, Rt−1, Rt−2, Rt−3 | Rt | SVM-2 | 0.911 | 0.841 | 5.661 | 0.846 | 0.845 | 5.815 |
| (4) τ, Rt−1, Rt−2 | Rt | SVM-4 | 0.902 | 0.850 | 5.864 | 0.832 | 0.826 | 6.199 |
| (6) τ, Rt−1 | Rt | SVM-6 | 0.860 | 0.775 | 6.948 | 0.812 | 0.811 | 6.428 |
| * (2) τ, Rt−1, Rt−2, Rt−3 | Rt+1 | SVM-2 | 0.771 | 0.665 | 8.602 | 0.704 | 0.703 | 7.974 |
| (4) τ, Rt−1, Rt−2 | Rt+1 | SVM-4 | 0.744 | 0.639 | 9.045 | 0.709 | 0.709 | 8.013 |
| (6) τ, Rt−1 | Rt+1 | SVM-6 | 0.697 | 0.557 | 9.790 | 0.650 | 0.633 | 8.403 |
| * (2) τ, Rt−1, Rt−2, Rt−3 | Rt+2 | SVM-2 | 0.706 | 0.551 | 9.602 | 0.656 | 0.623 | 8.148 |
| (4) τ, Rt−1, Rt−2 | Rt+2 | SVM-4 | 0.668 | 0.511 | 10.111 | 0.653 | 0.628 | 8.244 |
| (6) τ, Rt−1 | Rt+2 | SVM-6 | 0.641 | 0.483 | 10.455 | 0.632 | 0.604 | 8.467 |
| (2) τ, Rt−1, Rt−2, Rt−3 | Rt+3 | SVM-2 | 0.723 | 0.579 | 9.356 | 0.616 | 0.601 | 8.739 |
| (4) τ, Rt−1, Rt−2 | Rt+3 | SVM-4 | 0.684 | 0.532 | 9.860 | 0.616 | 0.586 | 8.597 |
| * (6) τ, Rt−1 | Rt+3 | SVM-6 | 0.651 | 0.489 | 10.288 | 0.628 | 0.587 | 8.411 |
| Input Scenario | Output | Model | Training | Testing | ||||
|---|---|---|---|---|---|---|---|---|
| CC | KGE | RMSE (mm. Month−1) | CC | KGE | RMSE (mm. Month−1) | |||
| * (1) EPt−1, EPt−2, EPt−3 | EPt | SVM-1 | 0.937 | 0.902 | 1.230 | 0.889 | 0.844 | 1.666 |
| (3) EPt−1, EPt−2 | EPt | SVM-3 | 0.901 | 0.864 | 1.543 | 0.868 | 0.831 | 1.804 |
| (5) EPt−1 | EPt | SVM-5 | 0.828 | 0.818 | 1.969 | 0.796 | 0.781 | 2.175 |
| * (1) EPt−1, EPt−2, EPt−3 | EPt+1 | SVM-1 | 0.969 | 0.955 | 0.833 | 0.866 | 0.845 | 1.751 |
| (3) EPt−1, EPt−2 | EPt+1 | SVM-3 | 0.876 | 0.802 | 1.629 | 0.807 | 0.761 | 1.990 |
| (5) EPt−1 | EPt+1 | SVM-5 | 0.564 | 0.494 | 2.842 | 0.532 | 0.459 | 2.921 |
| * (1) EPt−1, EPt−2, EPt−3 | EPt+2 | SVM-1 | 0.965 | 0.946 | 0.883 | 0.888 | 0.850 | 1.603 |
| (3) EPt−1, EPt−2 | EPt+2 | SVM-3 | 0.911 | 0.861 | 1.394 | 0.797 | 0.764 | 2.072 |
| (5) EPt−1 | EPt+2 | SVM-5 | 0.421 | 0.266 | 3.106 | 0.400 | 0.250 | 3.093 |
| * (1) EPt−1, EPt−2, EPt−3 | EPt+3 | SVM-1 | 0.978 | 0.956 | 0.701 | 0.930 | 0.846 | 1.339 |
| (3) EPt−1, EPt−2 | EPt+3 | SVM-3 | 0.945 | 0.926 | 1.102 | 0.869 | 0.834 | 1.712 |
| (5) EPt−1 | EPt+3 | SVM-5 | 0.689 | 0.536 | 2.439 | 0.617 | 0.478 | 2.672 |
| Input Scenario | Output | Model | Training | Testing | ||||
|---|---|---|---|---|---|---|---|---|
| CC | KGE | RMSE (mm. Month−1) | CC | KGE | RMSE (mm. Month−1) | |||
| (2) τ, EPt−1, EPt−2, EPt−3 | EPt | SVM-2 | 0.984 | 0.969 | 0.602 | 0.940 | 0.913 | 1.205 |
| (4) τ, EPt−1, EPt−2 | EPt | SVM-4 | 0.979 | 0.970 | 0.678 | 0.951 | 0.946 | 1.065 |
| * (6) τ, EPt−1 | EPt | SVM-6 | 0.976 | 0.955 | 0.731 | 0.957 | 0.938 | 0.996 |
| (2) τ, EPt−1, EPt−2, EPt−3 | EPt+1 | SVM-2 | 0.982 | 0.976 | 0.641 | 0.920 | 0.899 | 1.370 |
| (4) τ, EPt−1, EPt−2 | EPt+1 | SVM-4 | 0.980 | 0.968 | 0.666 | 0.938 | 0.924 | 1.197 |
| * (6) τ, EPt−1 | EPt+1 | SVM-6 | 0.977 | 0.966 | 0.723 | 0.942 | 0.936 | 1.144 |
| (2) τ, Rt−1, Rt−2, Rt−3 | EPt+2 | SVM-2 | 0.982 | 0.975 | 0.649 | 0.934 | 0.893 | 1.244 |
| * (4) τ, EPt−1, EPt−2 | EPt+2 | SVM-4 | 0.980 | 0.974 | 0.676 | 0.944 | 0.919 | 1.144 |
| (6) τ, EPt−1 | EPt+2 | SVM-6 | 0.977 | 0.959 | 0.722 | 0.942 | 0.912 | 1.173 |
| (2) τ, EPt−1, EPt−2, EPt−3 | EPt+3 | SVM-2 | 0.982 | 0.978 | 0.644 | 0.945 | 0.881 | 1.167 |
| (4) τ, EPt−1, EPt−2 | EPt+3 | SVM-4 | 0.980 | 0.972 | 0.675 | 0.949 | 0.902 | 1.102 |
| * (6) τ, EPt−1 | EPt+3 | SVM-6 | 0.979 | 0.968 | 0.684 | 0.951 | 0.918 | 1.076 |
| Input Scenario | Output | Model | Training | Testing | ||||
|---|---|---|---|---|---|---|---|---|
| CC | KGE | RMSE (mm. Month−1) | CC | KGE | RMSE (mm. Month−1) | |||
| (1) Rt−1, Rt−2, Rt−3 | Rt | SVM-1 | 0.759 | 0.626 | 7.873 | 0.135 | 0.133 | 14.853 |
| (3) Rt−1, Rt−2 | Rt | SVM-3 | 0.614 | 0.540 | 9.663 | 0.002 | 0.0001 | 15.733 |
| * (5) Rt−1 | Rt | SVM-5 | 0.540 | 0.309 | 10.280 | −0.062 | −0.159 | 13.378 |
| (1) Rt−1, Rt−2, Rt−3 | Rt+1 | SVM-1 | 0.718 | 0.467 | 8.822 | −0.290 | −0.371 | 15.698 |
| (3) Rt−1, Rt−2 | Rt+1 | SVM-3 | 0.371 | 0.052 | 11.503 | −0.112 | −0.264 | 13.285 |
| * (5) Rt−1 | Rt+1 | SVM-5 | 0.179 | −0.153 | 12.096 | −0.182 | −0.443 | 11.695 |
| (1) Rt−1, Rt−2, Rt−3 | Rt+2 | SVM-1 | 0.814 | 0.606 | 7.577 | −0.353 | −0.392 | 17.562 |
| (3) Rt−1, Rt−2 | Rt+2 | SVM-3 | 0.519 | 0.263 | 10.565 | −0.207 | −0.298 | 14.177 |
| * (5) Rt−1 | Rt+2 | SVM-5 | 0.197 | −0.154 | 11.984 | −0.300 | −0.527 | 11.241 |
| (1) Rt−1, Rt−2, Rt−3 | Rt+3 | SVM-1 | 0.815 | 0.641 | 7.030 | −0.198 | −0.226 | 15.986 |
| (3) Rt−1, Rt−2 | Rt+3 | SVM-3 | 0.501 | 0.294 | 10.229 | −0.267 | −0.347 | 14.576 |
| * (5) Rt−1 | Rt+3 | SVM-5 | 0.108 | −0.240 | 11.740 | −0.378 | −0.627 | 11.990 |
| Input Scenario | Output | Model | Training | Testing | ||||
|---|---|---|---|---|---|---|---|---|
| CC | KGE | RMSE (mm. Month−1) | CC | KGE | RMSE (mm. Month−1) | |||
| (2) τ, Rt−1, Rt−2, Rt−3 | Rt | SVM-2 | 0.912 | 0.795 | 5.238 | 0.309 | 0.300 | 12.294 |
| (4) τ, Rt−1, Rt−2 | Rt | SVM-4 | 0.754 | 0.633 | 7.931 | 0.256 | 0.254 | 13.864 |
| * (6) τ, Rt−1 | Rt | SVM-6 | 0.489 | 0.209 | 10.603 | 0.160 | −0.082 | 11.394 |
| (2) τ, Rt−1, Rt−2, Rt−3 | Rt+1 | SVM-2 | 0.827 | 0.695 | 6.999 | −0.050 | −0.078 | 15.353 |
| (4) τ, Rt−1, Rt−2 | Rt+1 | SVM-4 | 0.380 | 0.157 | 11.441 | −0.203 | −0.337 | 13.524 |
| * (6) τ, Rt−1 | Rt+1 | SVM-6 | 0.293 | −0.013 | 11.783 | 0.026 | −0.177 | 11.512 |
| (2) τ, Rt−1, Rt−2, Rt−3 | Rt+2 | SVM-2 | 0.897 | 0.733 | 5.698 | 0.009 | −0.099 | 13.898 |
| (4) τ, Rt−1, Rt−2 | Rt+2 | SVM-4 | 0.649 | 0.500 | 9.506 | 0.045 | −0.007 | 14.704 |
| * (6) τ, Rt−1 | Rt+2 | SVM-6 | 0.455 | 0.256 | 10.929 | −0.020 | −0.084 | 12.816 |
| (2) τ, Rt−1, Rt−2, Rt−3 | Rt+3 | SVM-2 | 0.950 | 0.827 | 3.939 | 0.055 | −0.038 | 13.888 |
| (4) τ, Rt−1, Rt−2 | Rt+3 | SVM-4 | 0.752 | 0.526 | 8.020 | 0.063 | −0.003 | 13.175 |
| * (6) τ, Rt−1 | Rt+3 | SVM-6 | 0.484 | 0.243 | 10.448 | −0.047 | −0.215 | 11.546 |
| Input Scenario | Output | Model | Training | Testing | ||||
|---|---|---|---|---|---|---|---|---|
| CC | KGE | RMSE (mm. Month−1) | CC | KGE | RMSE (mm. Month−1) | |||
| * (1) EPt−1, EPt−2, EPt−3 | EPt | SVM-1 | 0.939 | 0.716 | 0.369 | 0.188 | 0.030 | 0.876 |
| (3) EPt−1, EPt−2 | EPt | SVM-3 | 0.928 | 0.790 | 0.337 | −0.105 | −0.131 | 1.128 |
| (5) EPt−1 | EPt | SVM-5 | 0.538 | 0.213 | 0.717 | 0.007 | −0.144 | 0.919 |
| (1) EPt−1, EPt−2, EPt−3 | EPt+1 | SVM-1 | 0.957 | 0.855 | 0.278 | −0.371 | −0.464 | 1.070 |
| (3) EPt−1, EPt−2 | EPt+1 | SVM-3 | 0.926 | 0.721 | 0.378 | −0.181 | −0.283 | 1.042 |
| * (5) EPt−1 | EPt+1 | SVM-5 | 0.469 | 0.301 | 0.788 | 0.272 | 0.088 | 0.858 |
| (1) EPt−1, EPt−2, EPt−3 | EPt+2 | SVM-1 | 0.894 | 0.697 | 0.459 | −0.612 | −0.651 | 1.115 |
| (3) EPt−1, EPt−2 | EPt+2 | SVM-3 | 0.850 | 0.603 | 0.533 | −0.366 | −0.440 | 0.981 |
| * (5) EPt−1 | EPt+2 | SVM-5 | 0.465 | 0.356 | 0.846 | 0.046 | −0.009 | 0.886 |
| (1) EPt−1, EPt−2, EPt−3 | EPt+3 | SVM-1 | 0.927 | 0.879 | 0.357 | −0.299 | −0.300 | 1.245 |
| (3) EPt−1, EPt−2 | EPt+3 | SVM-3 | 0.827 | 0.595 | 0.547 | −0.576 | −0.581 | 1.254 |
| * (5) EPt−1 | EPt+3 | SVM-5 | 0.495 | 0.296 | 0.788 | −0.212 | −0.293 | 0.930 |
| Input Scenario | Output | Model | Training | Testing | ||||
|---|---|---|---|---|---|---|---|---|
| CC | KGE | RMSE (mm. Month−1) | CC | KGE | RMSE (mm. Month−1) | |||
| (2) τ, EPt−1, EPt−2, EPt−3 | EPt | SVM-2 | 1.000 | 0.988 | 0.015 | 0.246 | 0.205 | 0.923 |
| * (4) τ, EPt−1, EPt−2 | EPt | SVM-4 | 0.982 | 0.862 | 0.195 | 0.330 | 0.236 | 0.843 |
| (6) τ, EPt−1 | EPt | SVM-6 | 0.726 | 0.550 | 0.574 | 0.148 | 0.099 | 0.986 |
| (2) τ, EPt−1, EPt−2, EPt−3 | EPt+1 | SVM-2 | 0.981 | 0.879 | 0.199 | −0.477 | −0.605 | 1.038 |
| (4) τ, EPt−1, EPt−2 | EPt+1 | SVM-4 | 0.956 | 0.789 | 0.321 | −0.486 | −0.589 | 1.098 |
| * (6) τ, EPt−1 | EPt+1 | SVM-6 | 0.690 | 0.522 | 0.640 | 0.431 | 0.237 | 0.775 |
| (2) τ, Rt−1, Rt−2, Rt−3 | EPt+2 | SVM-2 | 0.990 | 0.951 | 0.140 | 0.047 | −0.050 | 0.864 |
| (4) τ, EPt−1, EPt−2 | EPt+2 | SVM-4 | 0.857 | 0.748 | 0.485 | −0.053 | −0.217 | 0.895 |
| * (6) τ, EPt−1 | EPt+2 | SVM-6 | 0.755 | 0.646 | 0.612 | 0.480 | 0.245 | 0.787 |
| (2) τ, EPt−1, EPt−2, EPt−3 | EPt+3 | SVM-2 | 1.000 | 0.977 | 0.033 | −0.230 | −0.231 | 1.175 |
| (4) τ, EPt−1, EPt−2 | EPt+3 | SVM-4 | 0.754 | 0.637 | 0.624 | −0.457 | −0.538 | 1.076 |
| * (6) τ, EPt−1 | EPt+3 | SVM-6 | 0.636 | 0.517 | 0.735 | −0.200 | −0.258 | 1.049 |
Publisher’s Note: MDPI stays neutral with regard to jurisdictional claims in published maps and institutional affiliations. |
© 2021 by the authors. Licensee MDPI, Basel, Switzerland. This article is an open access article distributed under the terms and conditions of the Creative Commons Attribution (CC BY) license (https://creativecommons.org/licenses/by/4.0/).
Share and Cite
Meidute-Kavaliauskiene, I.; Jabehdar, M.A.; Davidavičienė, V.; Ghorbani, M.A.; Sammen, S.S. A Simple Way to Increase the Prediction Accuracy of Hydrological Processes Using an Artificial Intelligence Model. Sustainability 2021, 13, 7752. https://doi.org/10.3390/su13147752
Meidute-Kavaliauskiene I, Jabehdar MA, Davidavičienė V, Ghorbani MA, Sammen SS. A Simple Way to Increase the Prediction Accuracy of Hydrological Processes Using an Artificial Intelligence Model. Sustainability. 2021; 13(14):7752. https://doi.org/10.3390/su13147752
Chicago/Turabian StyleMeidute-Kavaliauskiene, Ieva, Milad Alizadeh Jabehdar, Vida Davidavičienė, Mohammad Ali Ghorbani, and Saad Sh. Sammen. 2021. "A Simple Way to Increase the Prediction Accuracy of Hydrological Processes Using an Artificial Intelligence Model" Sustainability 13, no. 14: 7752. https://doi.org/10.3390/su13147752
APA StyleMeidute-Kavaliauskiene, I., Jabehdar, M. A., Davidavičienė, V., Ghorbani, M. A., & Sammen, S. S. (2021). A Simple Way to Increase the Prediction Accuracy of Hydrological Processes Using an Artificial Intelligence Model. Sustainability, 13(14), 7752. https://doi.org/10.3390/su13147752


