2. Review of the Literature
There have been many studies on the dynamic interaction in zones with unsupported sleepers. However, most of them are theoretical and generally without experimental comparison and validation.
One of the earliest studies on the dynamic behaviour of railway track with unsupported sleepers is presented in [
1]. The dynamic response of railway track with a section of unsupported sleepers was examined experimentally and using a mathematical model. An extensive study on the sleeper void short- and long-term dynamic behaviour is presented in [
2]. The applied FEM simulations with the constitutive model of hypoplasticity enabled long-term dynamic settlement prediction of the development of voids between sleeper and ballast. Additionally, the influencing factors of the load level and vibrations were taken into account and the resulting phenomenological settlement equation was proposed. Another theoretical study [
3] presents an FEM modelling of the sleeper contact impact due to unsupported sleepers. The modelling simulates several hanging sleepers with a void depth of up to 1 mm. The results indicate an increase of up to 70% in the sleeper–ballast contact force at the neighbouring sleepers for a single hanging sleeper with 1 mm void. A track system model with hanging sleepers using multibody system (MBS) modelling and finite element method (FEM) techniques is presented in [
4]. The influence of the hanging sleepers was assumed in the calculation of the ballast–sleeper interaction as a bilinear function. The model simulated the impact of vibrations due to hanging sleepers on the vehicle and on the track. In [
5], the authors present a multibody vehicle–track model assembly that couples the integration of the continuous and discrete system. The model considers an uncontacted spring-damping element underneath the unsupported sleeper as well as a triangularly unsupported sleeper. The presence of a critical gap size causing the largest force was found and was estimated to be 2.5 mm for four unsupported sleepers. An experimental investigation and numerical simulations of the dynamic behaviour of unsupported sleepers are presented in [
6]. A simple method for unsupported sleeper identification using a falling weight deflectometer was proposed. The numerical simulations that were based on discrete element modelling showed different loading patterns of fully supported and unsupported sleepers. In [
7], the authors investigate the effect of unsupported sleepers on the load of wheel–rail using a numerical simulation based on a coupling dynamic model of vehicle–track. The vehicle was modelled as a multibody system, and the track was considered as a three-layer model with rails, sleepers and ballast masses. A nonlinear spring and damper were used to simulate a gap between the unsupported sleeper and the ballast mass. A detailed finite-element track model for nonperiodic and asymmetrical mechanical defects was developed in [
8]. The model takes into account the unsupported sleepers and the nonlinear multibody railroad vehicle system. The results are reported for different values of the forward velocities that show up to a 30% increase in the wheel–rail contact forces at higher speeds. In [
9], the authors present a numerical model and experimental measurements of the dynamic loads on the ballast caused by trains passing a transition zone with hanging sleepers. The results show that the forces on the ballast vary significantly both in time and space on a transition, especially with the appearance of voids under the sleepers. A parametric study comprising nonlinear dynamic analyses using an FEM model of the track with sleeper voids is presented in [
10]. Hanging sleepers were found to be strongly associated with critical situations of track degradation.
The performance assessment of a transition zone with unsupported sleepers by means of numerical analysis is shown in [
11]. The stress redistribution towards the free ends of the void zones was analysed. A critical train speed was identified for the transition zone. In [
12], the authors demonstrate the monitoring of distributed strain of rail during train passage over the bridge track with unsupported sleepers by applying a distributed optical fiber sensor. The distributed strain in the rail was measured within a length of 40.26 m and with a spatial resolution of 31.1 cm. The study could identify the location of the excessive strain due to an influence of unsupported sleepers on the girders of the bridge. In [
13], the authors investigate the response of rails due to unsupported sleepers and insulated rail joints using an elastic–plastic FEM framework. The findings show the high sensitivity of plastic flow and rail material fatigue to the value of rail deflection.
Experimental investigation of the train-induced ground vibration at a test site with under-ballast plates is presented in [
14]. Hammer excitations of the soil and the tracks, as well as train passages, indicated the presence of many voids between the sleepers and the ballast. A vehicle–track coupled dynamic model for heavy-haul freights with double suspension systems was built in [
15], considering hanging sleepers. The results show that unsupported sleepers influence the aggravation of the wheel–rail interaction and affect the dynamic characteristics of the adjacent track structure with normal sleepers. The influence of the magnitude of the applied falling weight deflectometer (FWD) load on the measured track support stiffness was studied in [
16]. The FWD tests were conducted on full-scale ballasted track models consisting of seven sleepers. It was shown that the track support stiffness measured by FWD is decreased due to the hanging sleepers. The effects of hanging sleepers and locally deteriorated substructures are investigated in [
17]. Two numerical solutions were used for the simulation of track–substructure–ground response: the frequency-domain solution using a combination of beam elements for the track and an FEM model. The track vibrations were simulated and compared with other studies. The effects of the gap beneath the unsupported sleeper and the track support stiffness on increasing the sleeper displacement and track support force were studied in [
18] using MBS and FEM numerical simulations. A series of regression equations were derived for the peak particle velocity in the surrounding environment of the railway track and the sleeper support stiffness for unsupported sleepers and fully supported ones.
An influence of the number and the distribution of unsupported sleepers in the longitudinal direction on track structure was studied in [
19] using numerical simulations. Dynamic responses of track structures were analysed in cases of normal sleeper, single unsupported sleeper, two continuous unsupported sleepers and two interval unsupported sleepers. The results show that the track response of two continuous unsupported sleepers is significantly greater than that of the other two conditions. A vehicle–track coupled dynamics model that takes into account the differential ballast settlements and unsupported sleepers is presented in [
20]. The research approach was based on an iterative method for acquiring the mapping relationship between the ballast settlement and the deflection of rail and sleepers. The results indicate that the superstructure settles along with the ballast bed and sleepers are likely to become unsupported when the settlement amplitude is large or when the settlement wavelength is small. In [
21], the authors present a track modelling approach based on a wave analysis technique for multicoupled periodic structures. The approach efficiently models a track with varying characteristics in the longitudinal direction and predicts railway-induced vibration due to parametric excitation. A case study is presented investigating a track with a transition zone with unsupported sleepers between ballasted and slab track.
A 1:5 scale laboratory model together with a numerical simulation model were used to study the dynamic behaviour of unsupported sleepers in [
22]. Both experimental and simulation results show the increase in the dynamic interaction caused by the hanging sleepers. In [
23], the authors demonstrate analytical and finite-element solutions to the problem of a vibrating beam, fully or partly supported by an elastic foundation. The influence of the foundation stiffness and rail pad stiffness on the sleeper bending-mode eigenfrequencies was studied. A 3D numerical model of track was applied in [
24] to study the impact of unsupported sleepers on the dynamic behaviour of railway track. The model assumed the pre-stressing forces, variations of the sleeper cross-section along its length, losing or recovering contact between the sleeper and the ballast layer. An experimental model validation for the case of the void-free sleeper support was shown. An investigation of the effects of various train bogie patterns on the performance of ballasted railway tracks with unsupported sleepers is presented in [
25] using a coupled 1D track model with an MBS vehicle model. The turnout dynamic phenomena of unsupported sleepers were studied using a 3D FEM model in [
26]. Various support conditions, velocities and positions of unsupported bearers for fibre-reinforced foamed urethane bearers were studied. The results show good performance of the bearers. A 3D coupled vehicle and ballasted track interaction model development is presented in [
27]. The vehicle was modelled as a multi-rigid-body system, and the track–subgrade interaction was modelled by 1D finite element method. The model was applied for the simulation of the soil elasticity unevenness and the contact break due to hanging sleepers. Moreover, the discrete element method was introduced to model the railway ballast layer. In [
28], the authors present a computation scheme of the moving element method for the analysis of high-speed train–track dynamics. This numerical approach is presented as more accurate and efficient than the standard FEM in dealing with various train–track dynamic problems. The research results show that the highest maximum rail–wheel contact force is observed to occur when the two unsupported sleepers are spaced apart by three to five fully supported sleepers. An approach of a distributed model of the support for 2D simulations that uses Timoshenko beam element over an elastic foundation is shown in [
29]. The model, compared to the standard model with the 4-degree Timoshenko element, was analytically appended with an additional degree of freedom of the vertical displacement. The improvement enhanced the temporal response, avoided rail stiffening, corrected the overestimation of the contact force and reduced the computational costs.
An experimental investigation on the trackside estimating the sleeper support conditions is presented in [
30]. The method is based on the inertial measurements on sleepers and the microtremor analysis to identity hanging sleepers. The interpretation of the relation between the longitudinal level and sampled microtremor data is presented. An application of onboard inertial measurements from in-service trains for the identification of the sleeper support conditions is proposed in [
31]. The GPS location measurements and car body vertical accelerations were considered in a multiresolution analysis and state machine design methodology for identification of the void zones. A diagnostic of the unsupported sleepers in transition zones using the photogrammetric method is presented in [
32,
33,
34]. The authors of [
32] present the results of a field monitoring study of a railway bridge transition with void defects using the measurement of both track displacements using digital image correlation and distributed rail strains using a Rayleigh-based fibre optic analyser. The measurements of rail–sleeper gaps were used to obtain a first-order estimate of the shape of the differential track settlement profile. A similar photogrammetric method is presented in the experimental analysis of [
33] that was implemented in three transition zones in various conditions. It was found that the dynamic profile of the rail displacements has a good correlation with the track condition based on comparing the multiple-point displacements in the approaching zones in different conditions. An application of 3D DIC and pattern projection is proposed in [
34] to assess the deformation of railway sleepers using onboard measurements. The full-field displacement and the crosstie’s shape were measured. A resolution of approximately 5 microns was estimated to measure the relative tie deflections, both inside and outside the rail area. The time resolution was 100 frames per second. However, the study used high-speed cameras with a low time sampling rate that could not fully reflect the dynamic interaction in void zones.
An analysis of the influence of parametric, periodic and random excitations such as wheel defects, hanging sleepers and other periodic effects on the car–rail oscillatory system is presented in [
35]. Experimental data on vibration parameters were determined using four inertial measurement units (IMUs) installed on the axle boxes of the car running trolley wheel pairs. The signal spectra were analysed in relation to the defects.
A flexible track model in a multibody dynamics program was developed in [
36] to simulate the influence of unsupported sleepers on ride comfort index. A field test on void zones was performed using LVDT sensors. Findings indicate that in the case of a single unsupported sleeper through the track, the ride comfort index increased by 100% after increasing the train speed from 30 to 110 km/h. Field measurement tests and three-dimensional numerical analysis were conducted in [
37] for pre-stressed concrete sleepers laid with different support. The experimental results show that the bending moment was increased more than three times due to the support conditions of the pre-stressed concrete sleepers and the rail roughness. Results of the numerical analyses show that the bending moment was increased more than 2 times because of the unsupported sleepers, and the tensile stress of the pre-stressed concrete sleeper exceeded 3 N/mm
2 when the rail roughness was approximately 2 mm or more. The effect of unsupported sleepers on dynamic characteristics of ballast beds was studied using the DEM of a ballast bed in [
38]. The influence of unsupported sleepers and their number on the dynamic response of the ballast bed was analysed. The results show that the unsupported sleeper will redistribute the contact forces of ballast particles so that the number of strong force chains in the ballast will decrease, and the number of strong force chains in the adjacent ballast sleepers will increase.
Measurement of distributed rail strains on the track with unsupported sleepers using DIC and fiber optic sensing is presented in [
39]. The measured rail strains were used to determine the rail shear forces and further load–deflection relationships for individual sleepers. In [
40,
41], a parallel cosimulation method is introduced to study vehicle–track dynamic interactions and their application for modelling the vehicle dynamics on a track with sleeper voids. The presented model is more than ten times faster than the conventional model. The results show that the vertical rail deflections, wheel-rail contact forces and vehicle suspension forces are evidently larger for unsupported sleepers. A signal processing technique for evaluation of sleeper pseudodeflection is presented in [
42] to determine the dynamic deflection of a railroad sleeper. The technique is based on a coupled measurement of acceleration and strain on the concrete sleeper. The developed method can be used for diagnostics of track support stiffness and identification of sleeper voids. An experimental investigation of track dynamic behaviour in a void zone is presented in [
43]. It was found experimentally that the dynamic impact in time shifts before the wheel reaches the impact zone. The numerical modelling confirmed and explained the phenomenon. Additionally, a simple method for the local track stiffness identification was proposed. An approach for trackside and onboard sleeper void identification and classification is proposed in [
44]. The basic idea of the study lies in the special pattern of dynamic impact in the void zone. The approach is based on machine learning methods that are improved by mechanical models. The data for the statistical models were acquired using DIC trackside measurements. Other recent techniques for the sleeper support condition estimation are based on structural health monitoring (SHM) technologies such as smart or self-sensing sleepers, as shown in [
45,
46]. The information is collected using embedded fiber Bragg grating sensing for tension measurements or acceleration sensors. The algorithms are developed to identify the condition indicators from raw measurements.
The literature review presents a wide range of studies on numerical simulation of track and vehicle dynamic interaction considering unsupported sleepers. The numerical simulation is produced with help of models of different complexity, ranging from simple beam models to detailed 3D FEM ones. However, most models serve as a simple imitation of experimental measurements without deep analysis of the interaction mechanics. The present experimental studies are not so numerous as the experimental ones and are limited to certain cases, mostly used in transition zones. Most models have pure experimental validation of the effects of the dynamic behaviour in the zone of unsupported sleepers. Therefore, deep analysis of numerical simulation of track and vehicle dynamic interaction considering unsupported sleepers is necessary to reveal the intrinsic reasons of the mechanical processes and the reason chain up to the root causes of long-term behaviour.
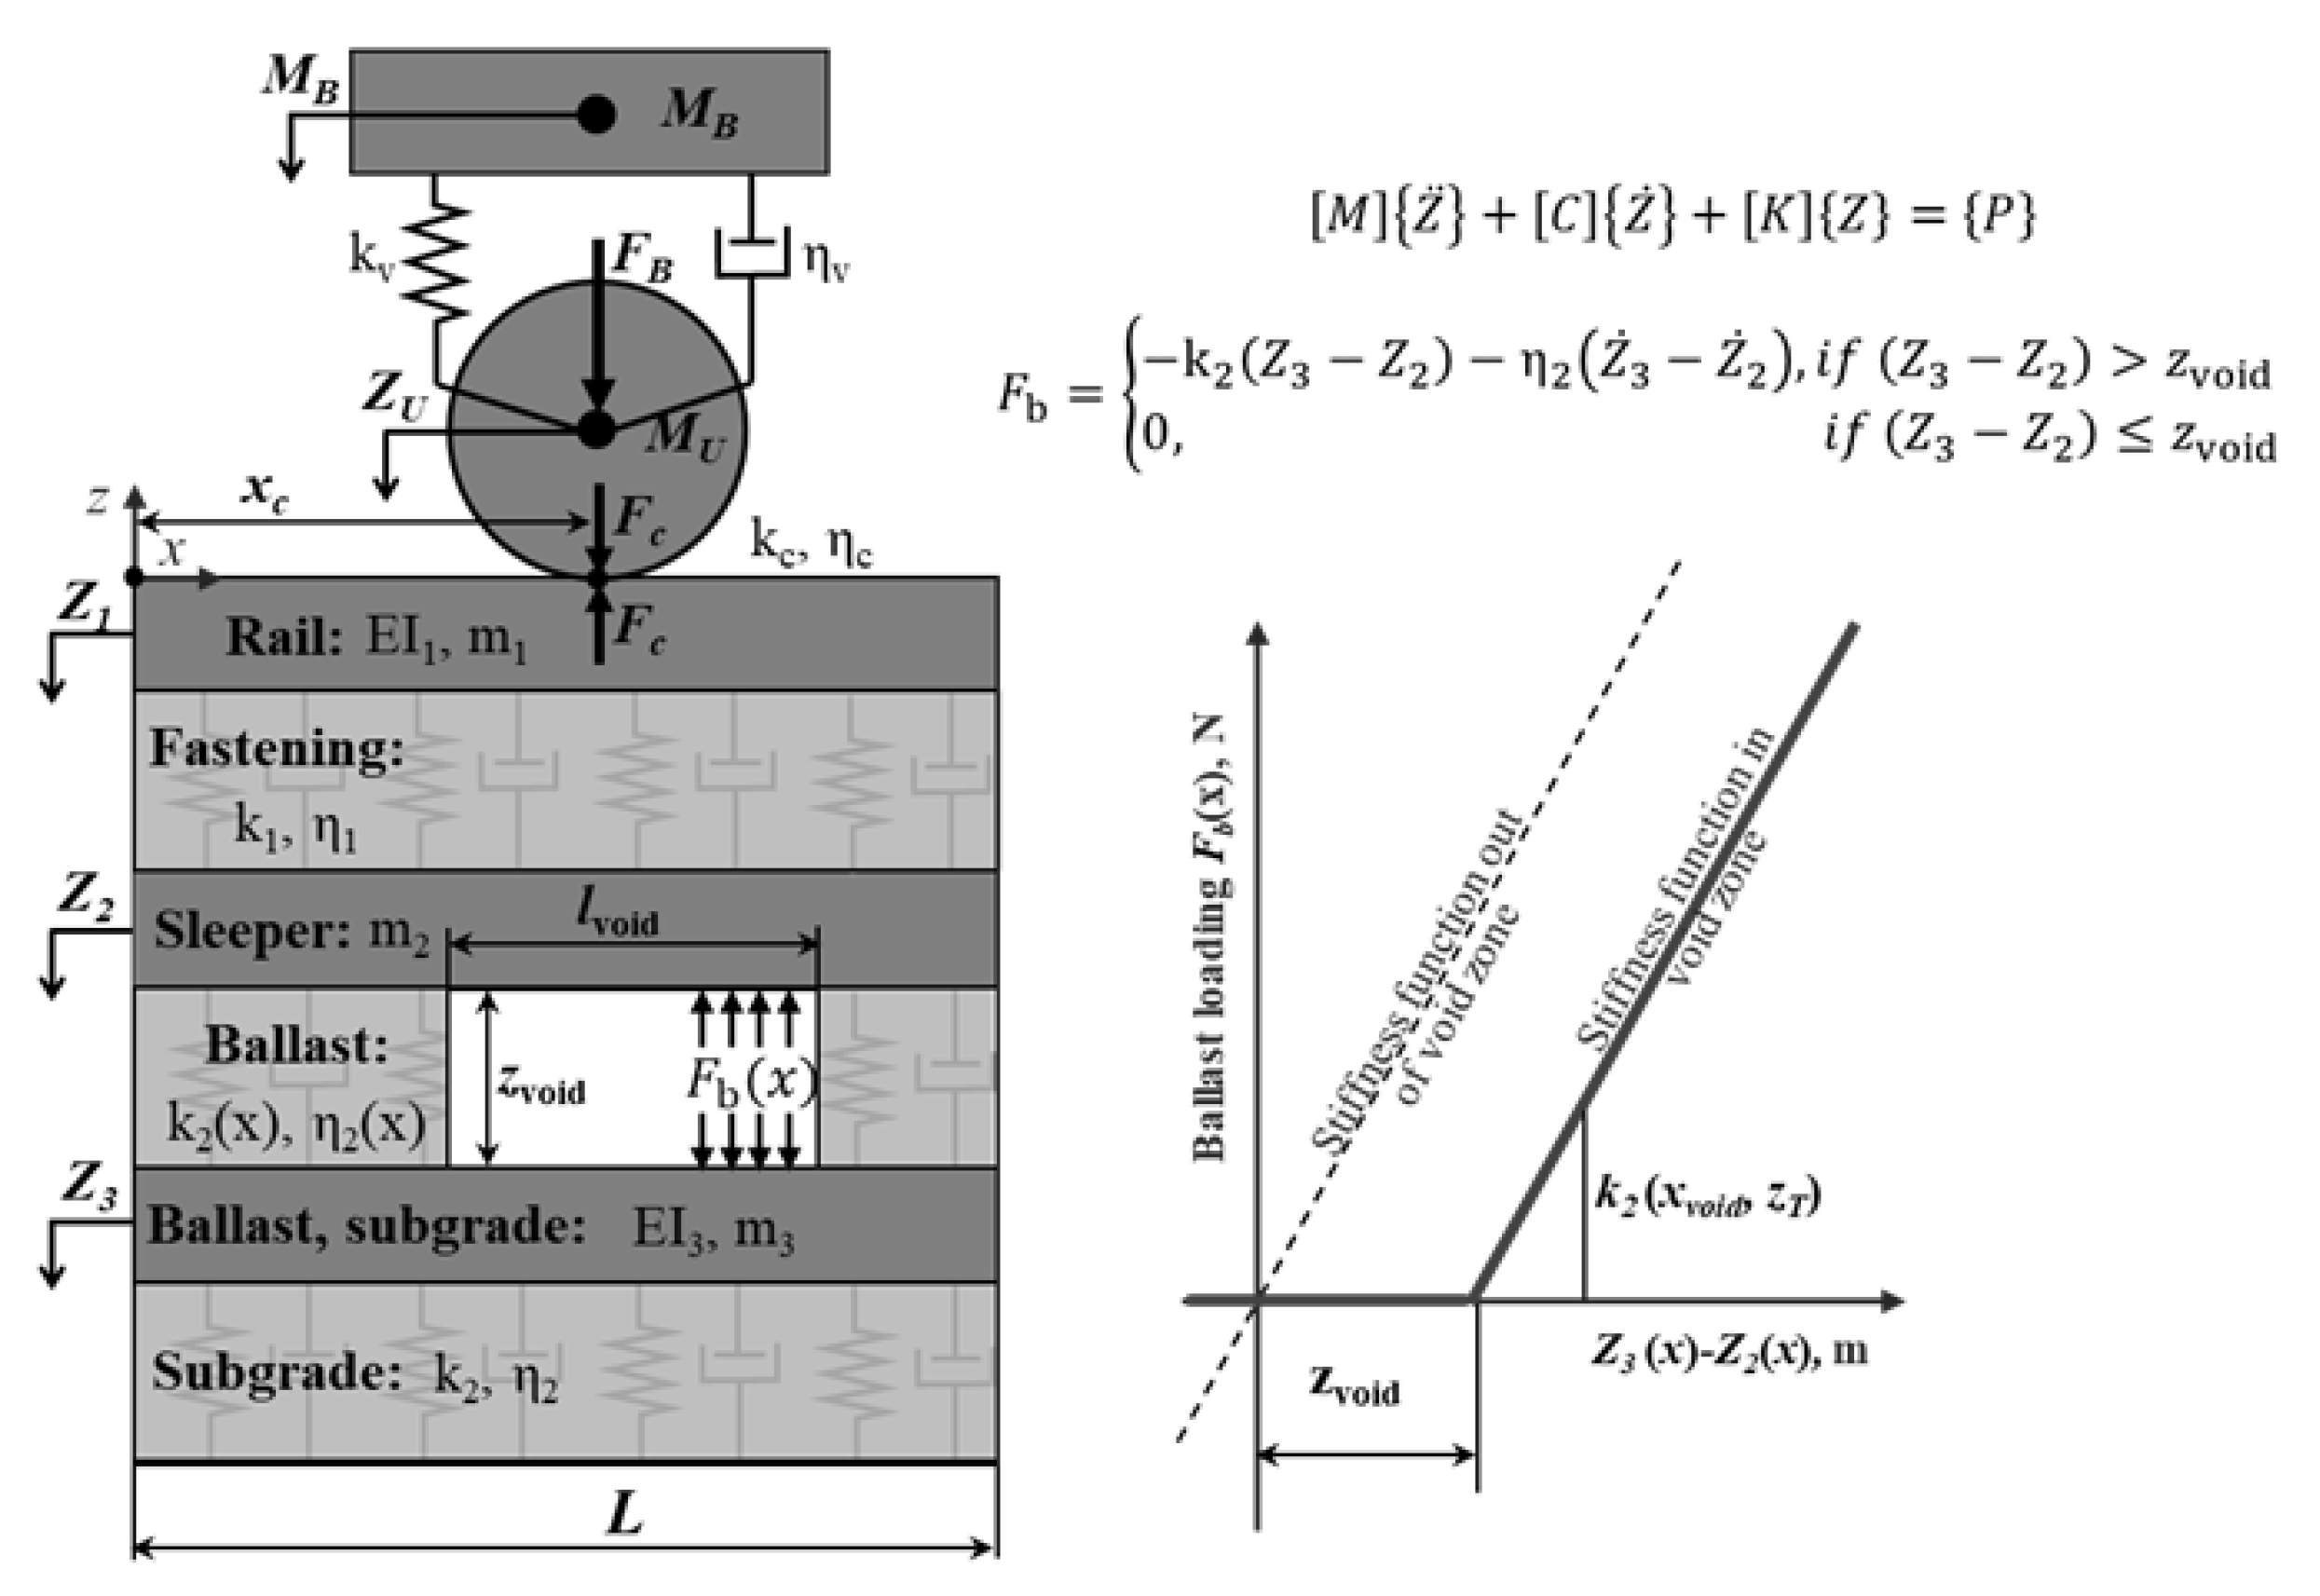
4. Numerical Simulation of the Dynamic Impact
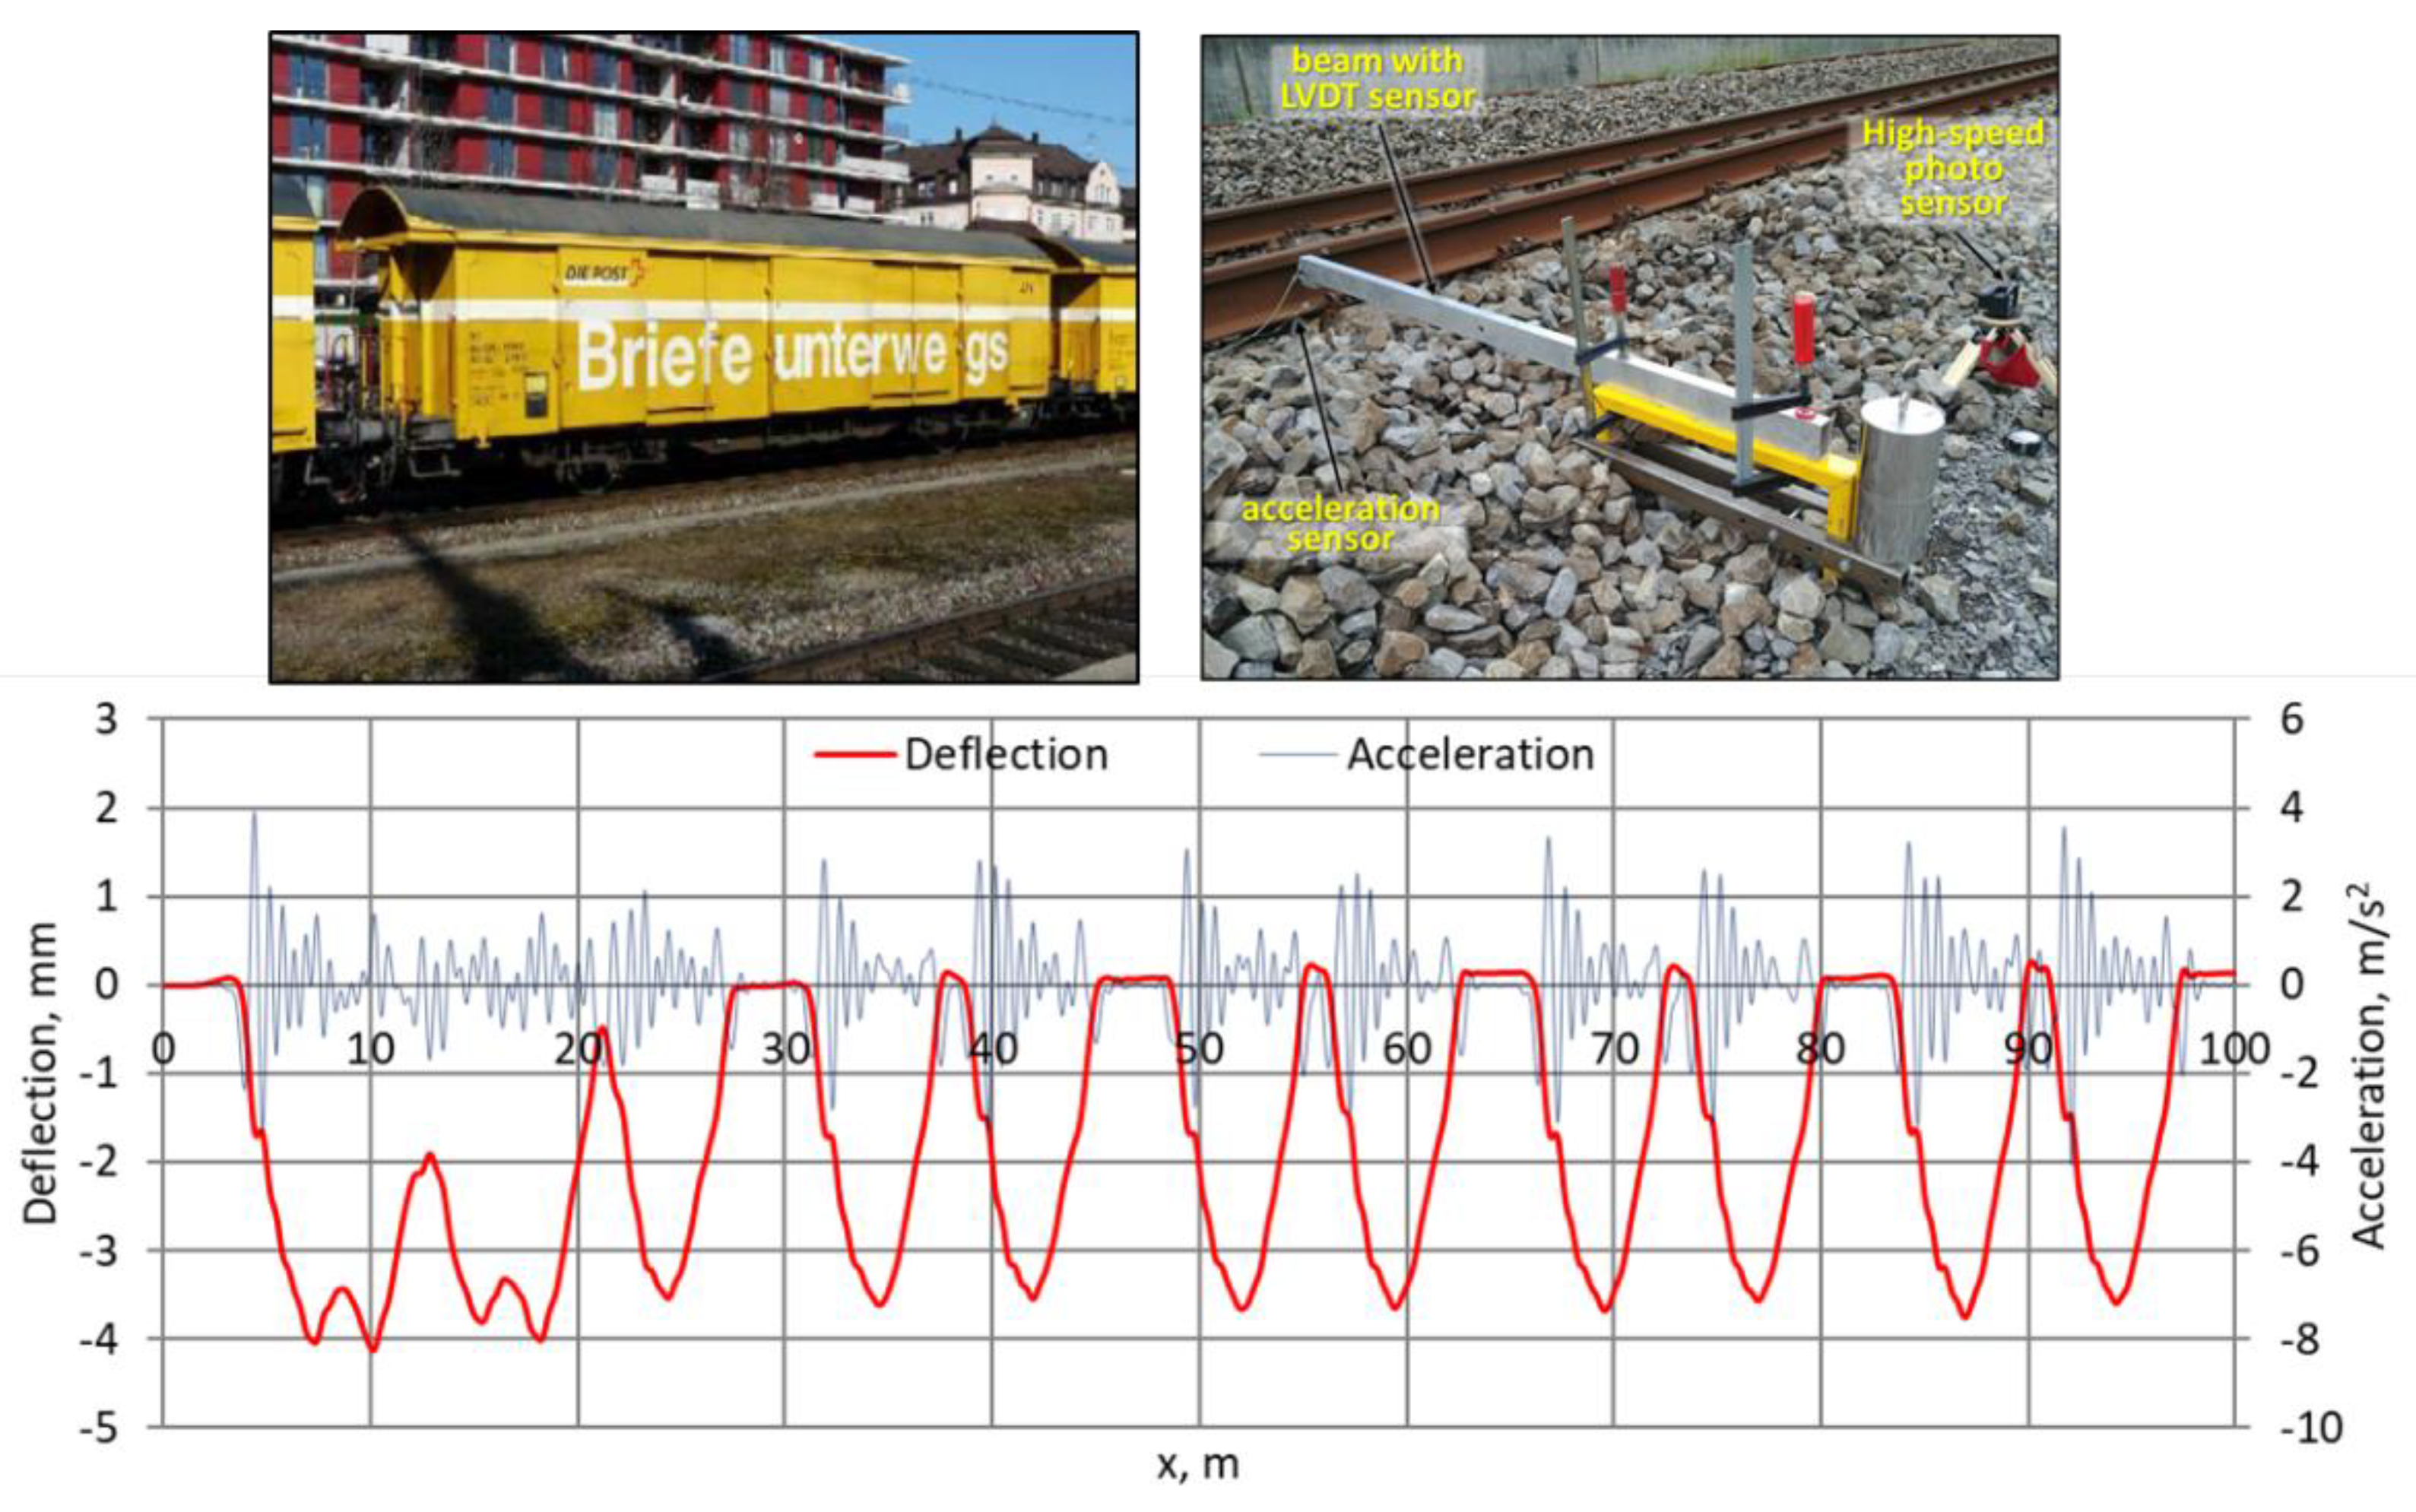
Numerical modelling is applied to explore the dynamic behaviour observed from experimental measurements (
Figure 3 and
Figure 4). The modelling is based on a three-Euler–Bernoulli-beam model that is coupled with a two-mass vehicle model (
Figure 5). The beams include the bending stiffness and masses. The beams are connected by continual layers that include the elasticity and damping and correspond to track elements: a rail, a sleeper with fastening and a ballast layer with a ballast bed. The void is taken into account with help of the elasticity
and damping
properties of the layer between the second and the third beam over the void length
. The properties are bilinear functions that provide the same elastic and damping parameters as in the outside zones after void closing. A more detailed description of the model is presented in [
44], where the patterns of rail deflection and accelerations in the void zones are studied. The model parameters in the present study are selected to correspond to the post train from the experimental measurements. The track parameters are as follows: rail meter mass 60 kg/m, rail bending stiffness 6.4 MN·m
2, fastening foundation coefficient 200 MN/m
2, fastening damping 185 kN·s/m
2, sleeper meter mass 300 kg/m, sleeper layer bending stiffness 0.01 MN·m
2, sleeper–ballast foundation coefficient 600 MN/m
2, sleeper–ballast damping 75 kN·s/m
2, ballast meter mass 500 kg/m, ballast–subgrade foundation coefficient 200 MN/m
2 and ballast–subgrade damping 680 kN·s/m
2. The vehicle parameters are as follows: car body mass for 1 wheel 7000 kg, unsprung wheel mass 400 kg, contact stiffness 2400 MN/m, contact damping 155 kNs/m, suspension stiffness
= 0.6 MN/m and suspension damping 25 kNs/m.
The present study, different from the previous studies [
13,
44], is focused on the research of the sleeper–ballast interaction. The model parameters are fitted to the experimental measurement (
Figure 4). However, not all parameters can be simply fitted; the void depth distribution along the track is not known as well as the sensor position relative to the void wave. Therefore, the void depth is considered as constant over the void length. However, to produce the plausible loading distribution, both rectangular sides of the void wave are smoothed by a flattened sine function. Since the longitudinal location of the experimentally measured rail deflections (
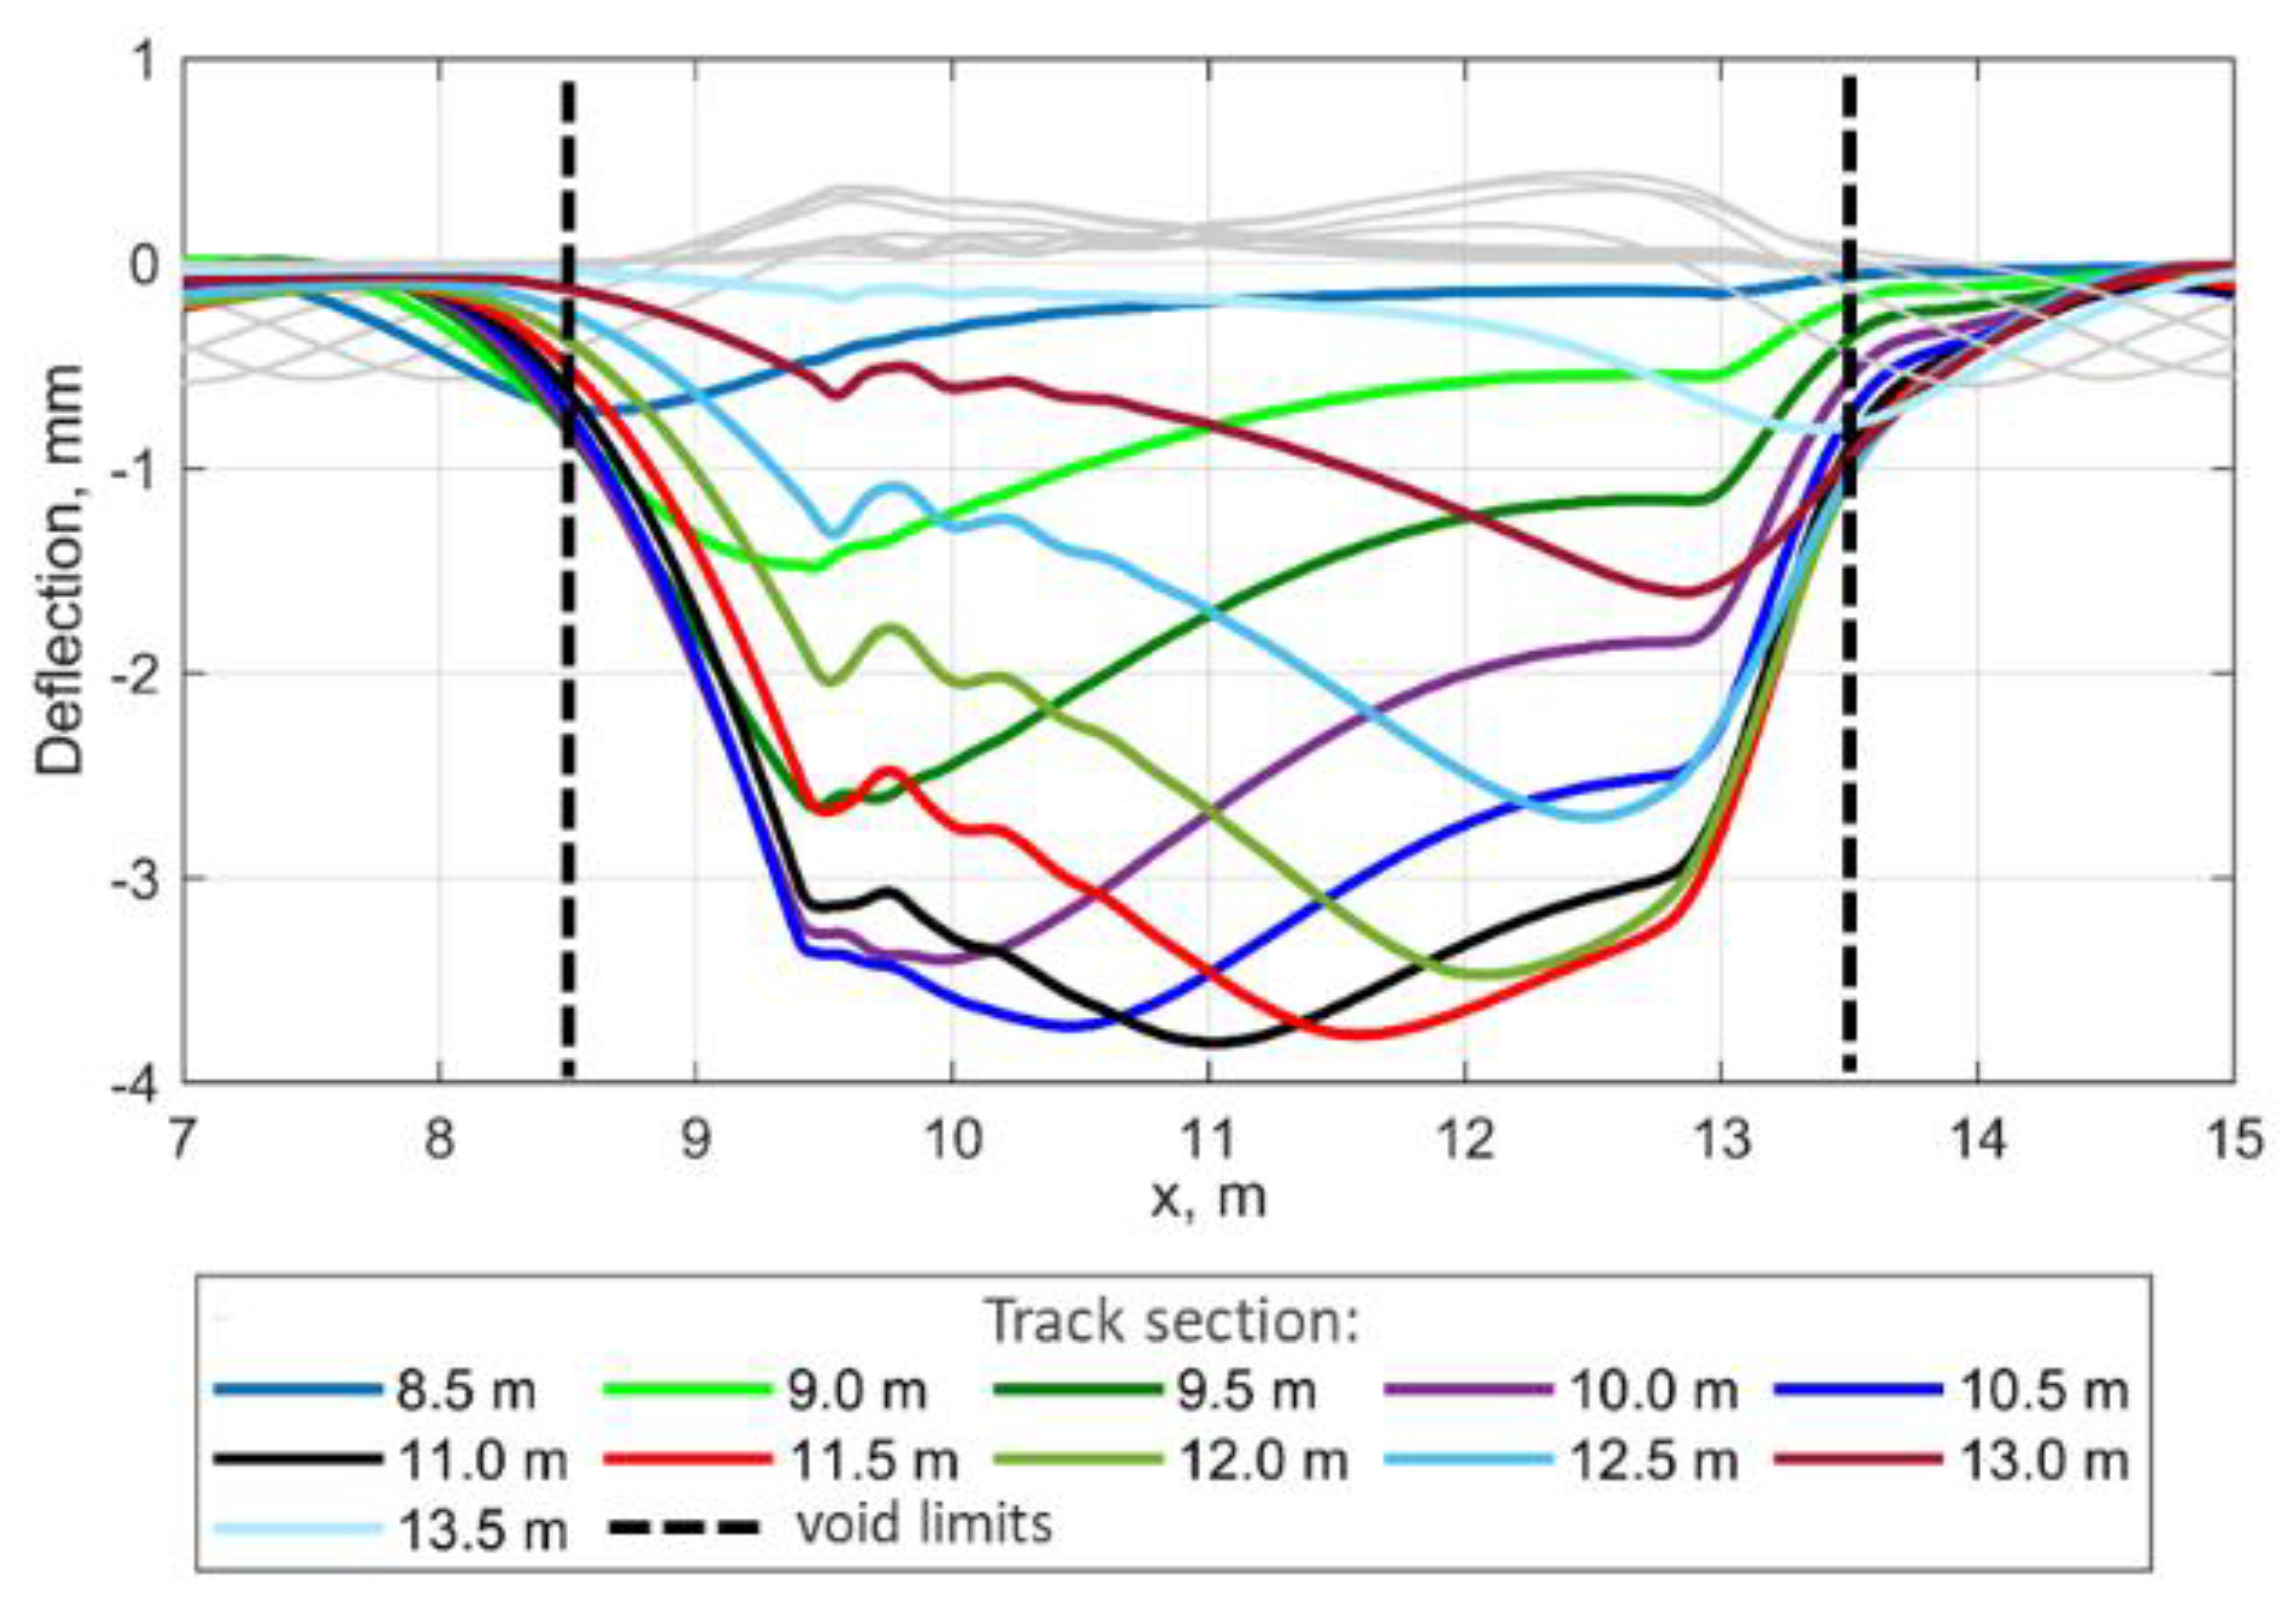
Figure 4) is not known, multiple rail deflections are simulated with the step of 0.5 m along the rail. The rail deflection simulation in
Figure 6 shows similar deflections to the experimentally measured ones. The impact zone can be obviously recognised on the left side of the deflection line. The impact zone is differently shifted relative to the maximal deflection point depending on the track section. The right side of the deflection line also has a local disturbance zone due to void opening. Despite the similarities of the experimental and simulated results, there are differences in the overall deflection line. They are explained by nonconstant void distribution along the track in the experimental case. The present paper aims to study the mechanism of the void impact appearance; therefore, the constant void depth is assumed. The void depth distribution identification is a separate complicated problem that will be studied in future research.
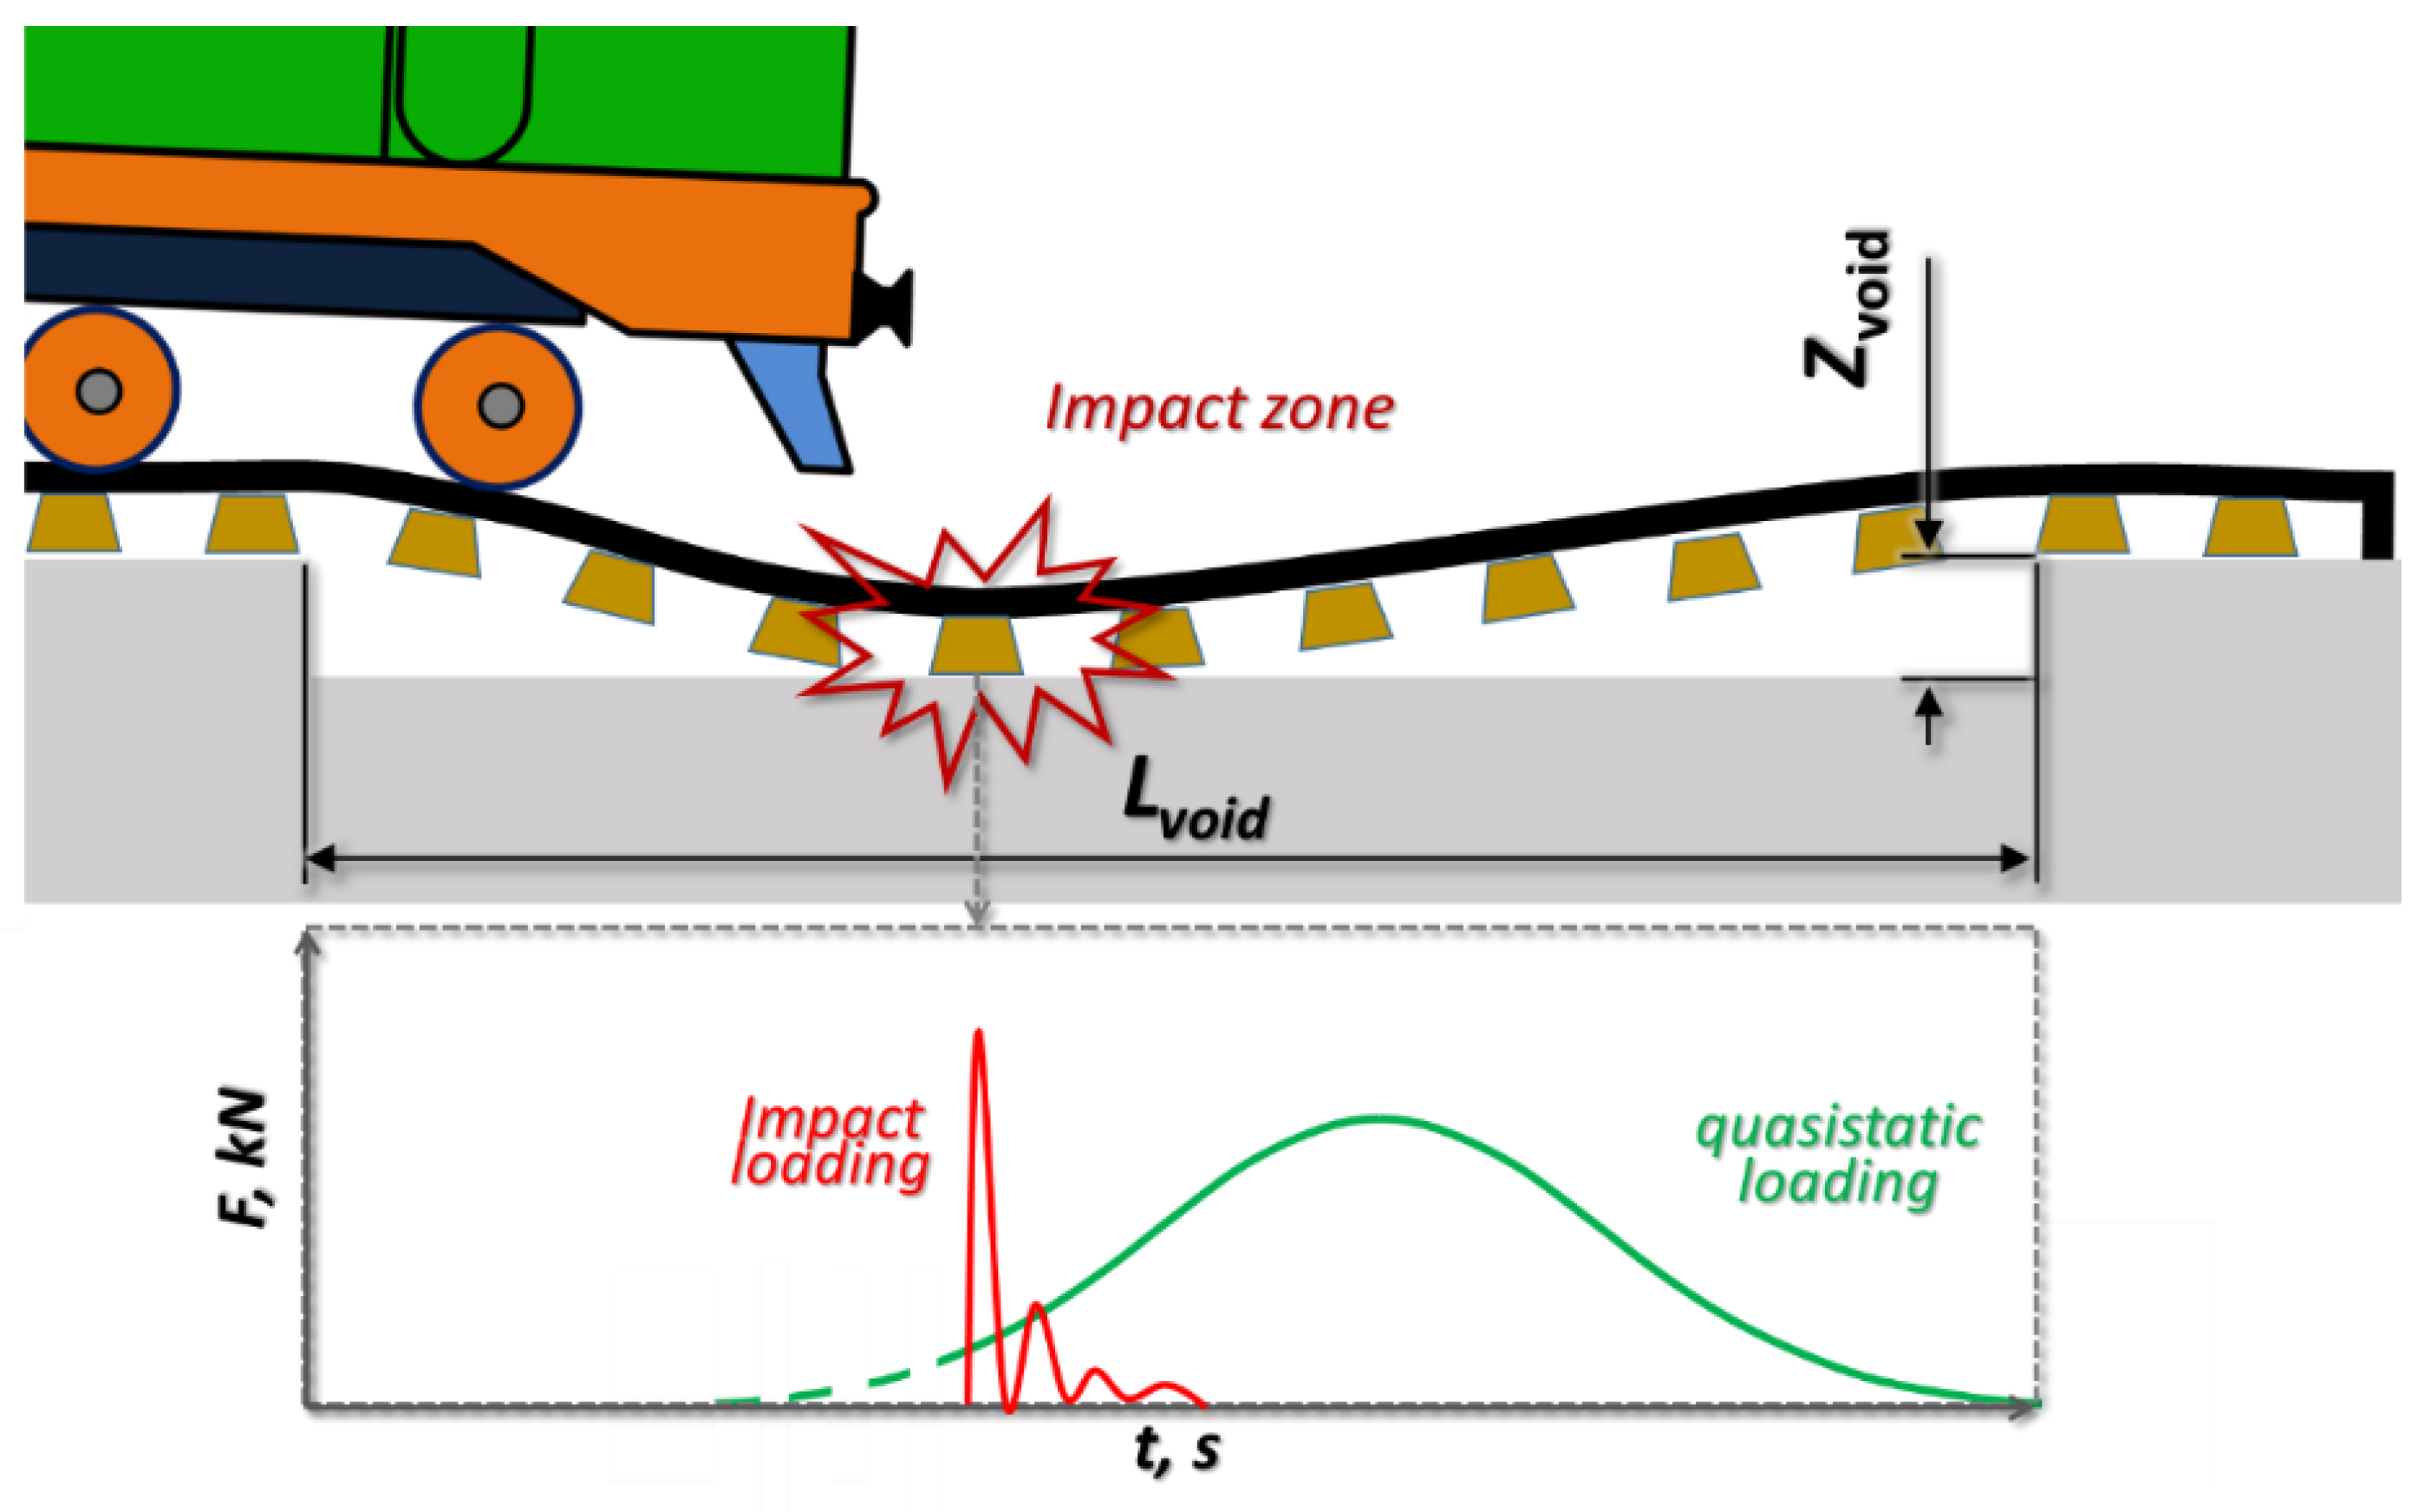
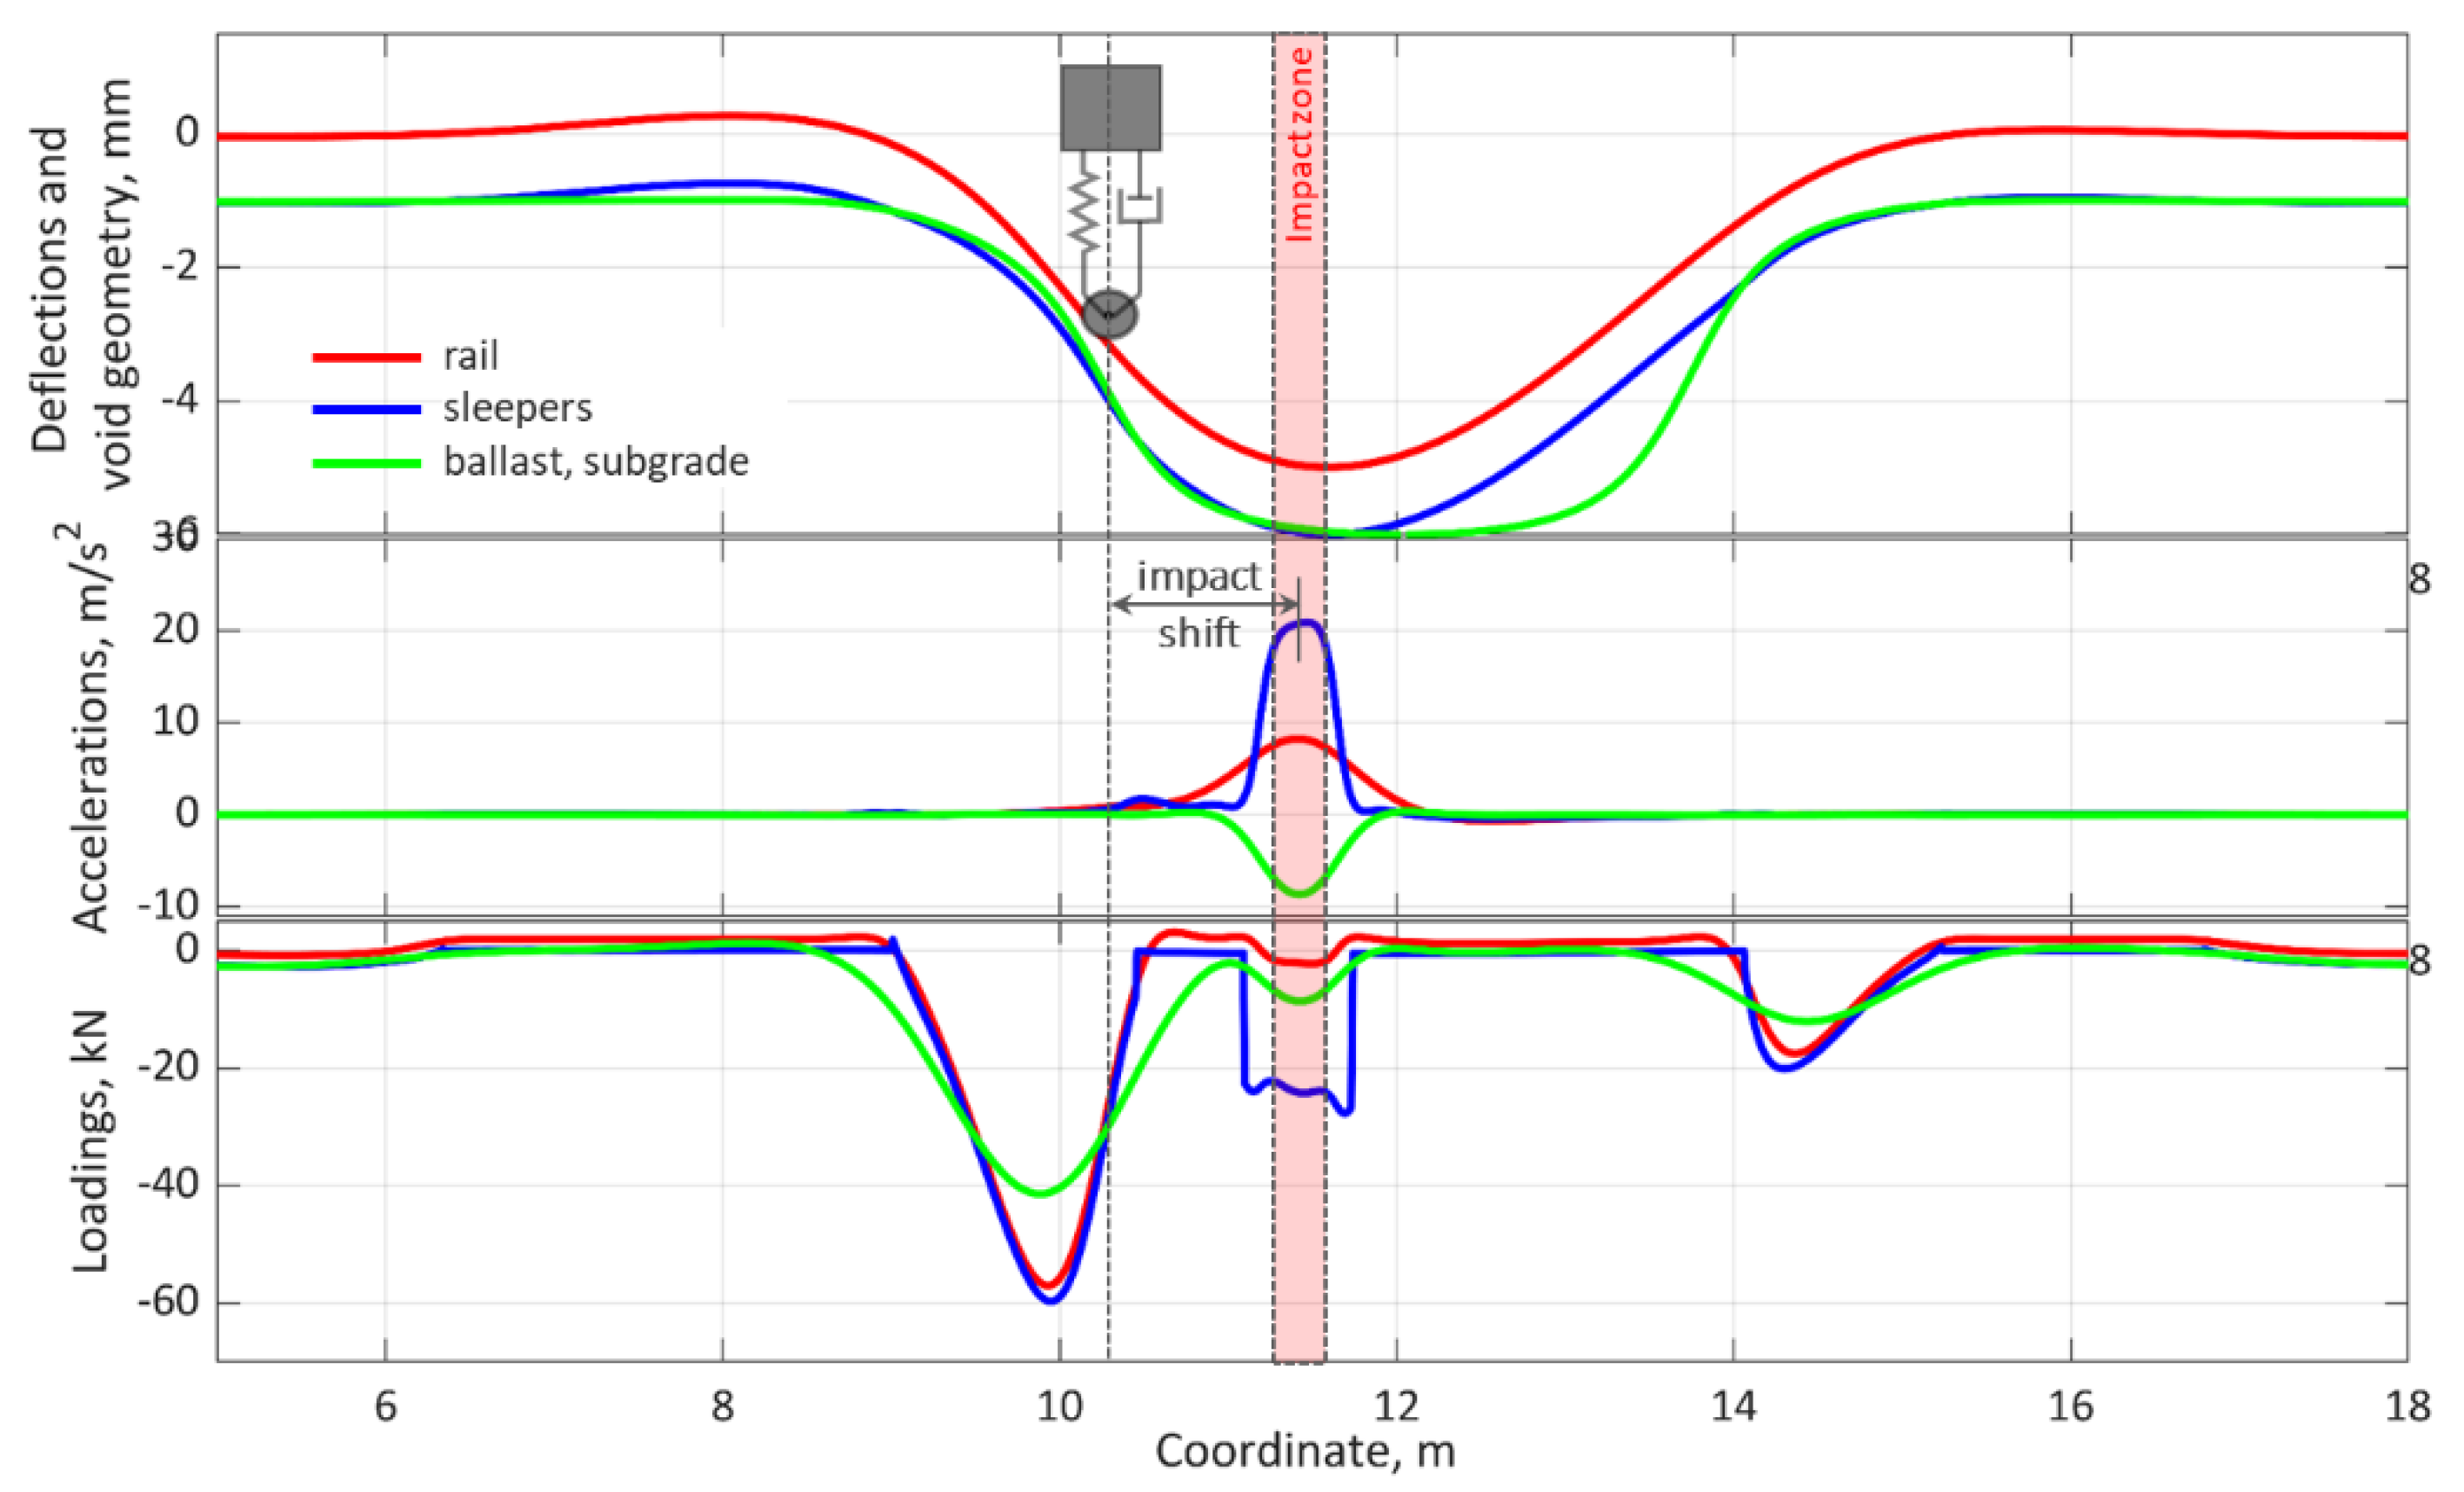
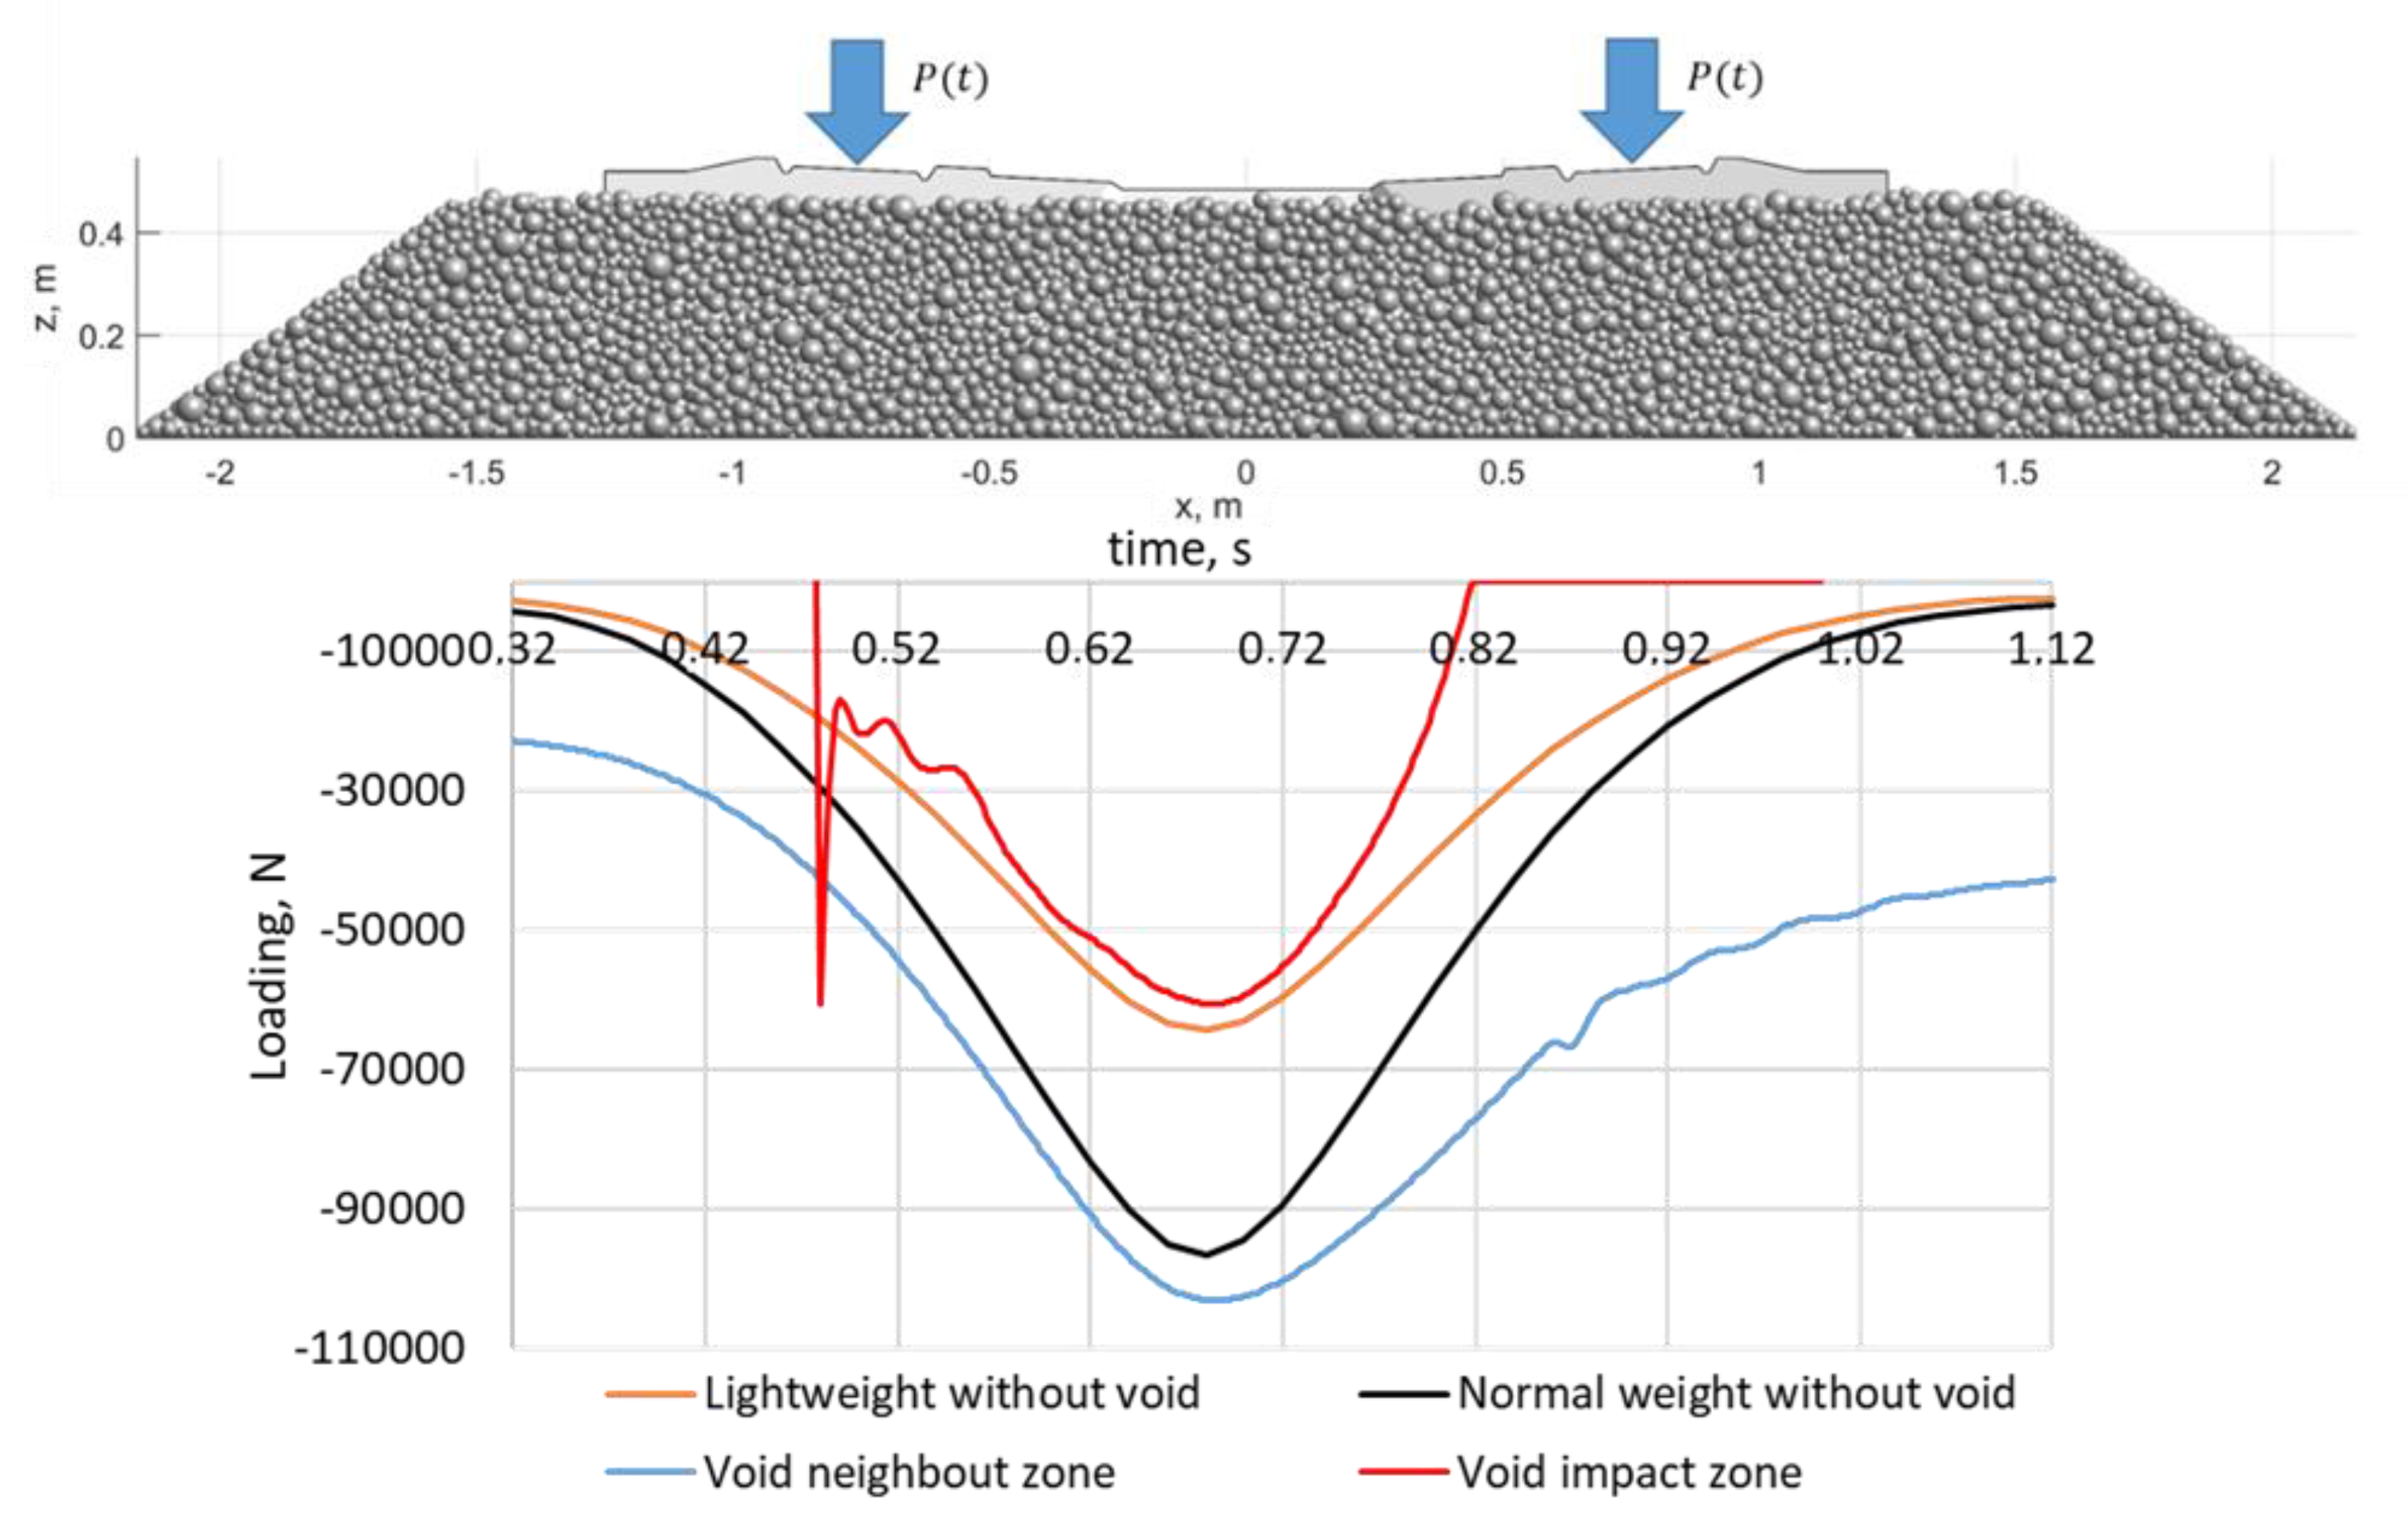
Figure 7 presents the track beam deflections, accelerations and loadings during the impact moment while the void is partially closed. It can be noted that the wheel position is shifted relative to the impact location. The sleeper acceleration in the impact point is more than 2 times higher than that of the rails. The loading diagram (
Figure 7, bottom) shows the quasistatic loading distribution on both sides of the void zone and the dynamic loading in the impact point.
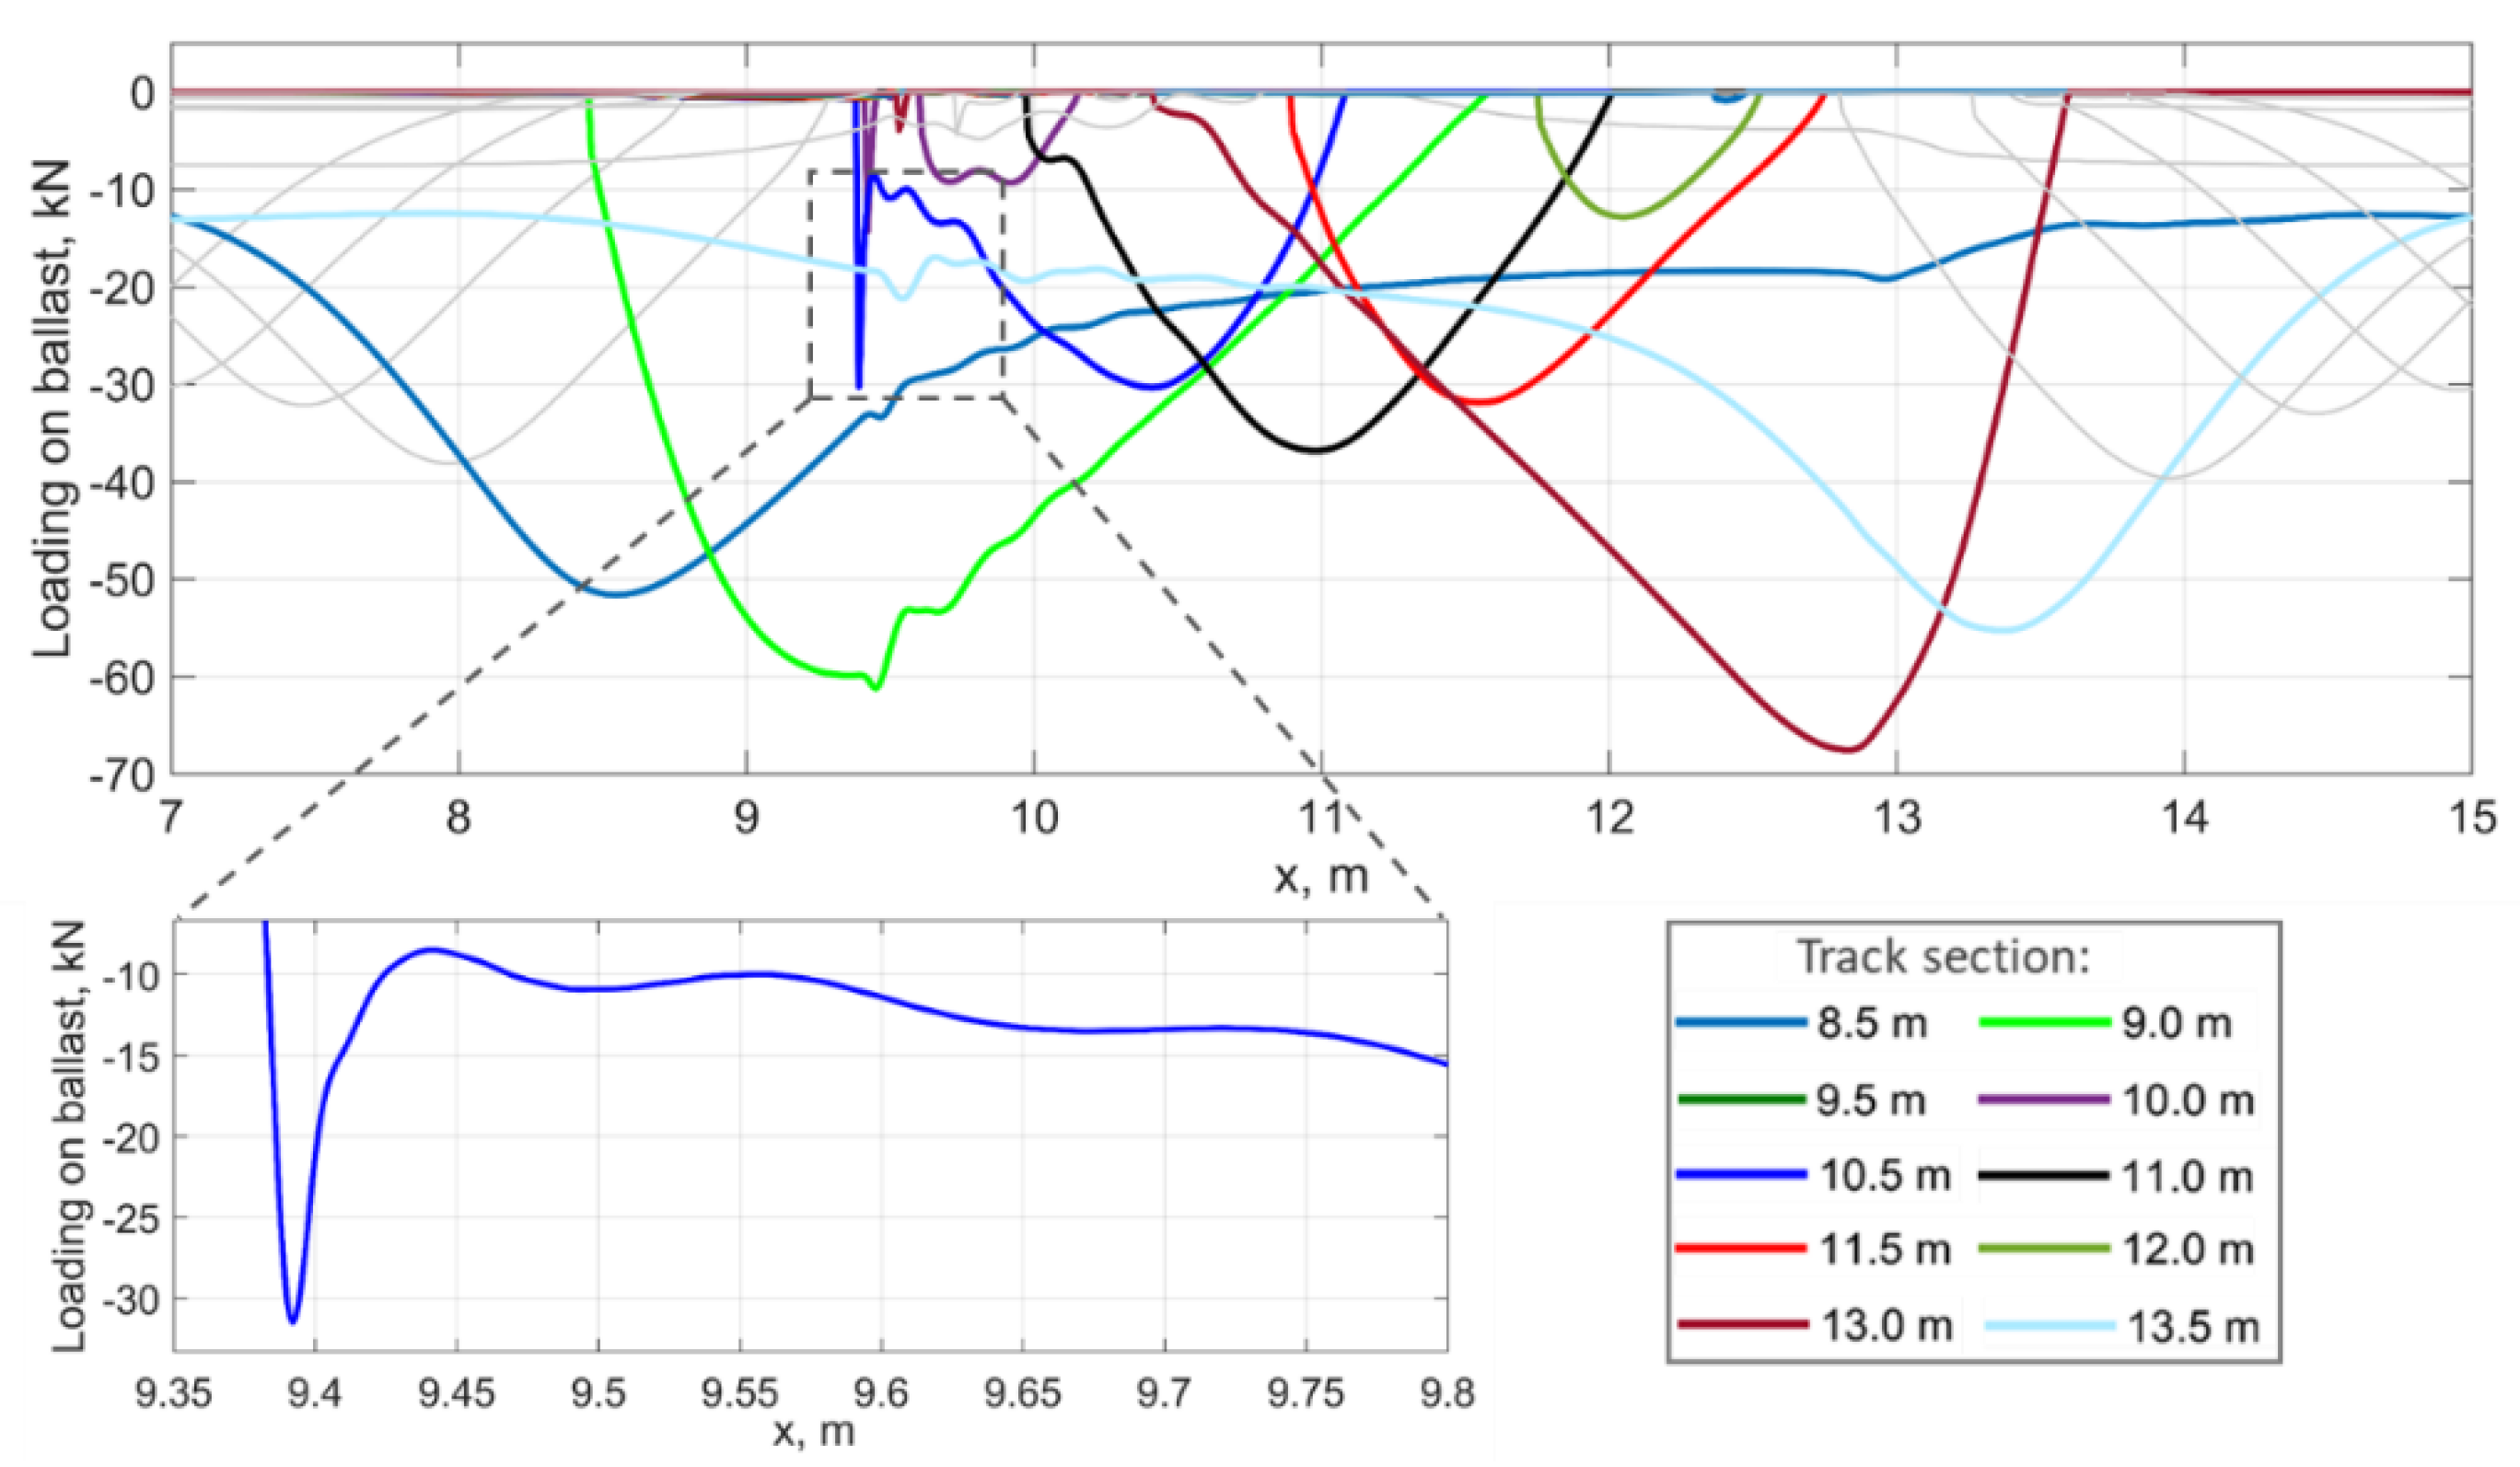
The loadings of the ballast layer in the sections along the track that approximately correspond to the locations of the sleepers in the void zone are presented in
Figure 8. Notable is the impact loading in the 10.5 m section that is depicted in the bottom diagram. The loading consists of the short impact part with about 30 kN maximal value and the following quasistatic part with about the same maximal value. Before the impact, the ballast was fully unloaded. The ballast loadings on other sections have a less notable impact part but a very distinct quasistatic one. The sections neighbouring the void zone at 9.5 m and 13.5 m are more loaded than the ballast outside the void zone but also have high initial preloading. The absence of the preloading is the shared loading property in the track sections inside the void zone.
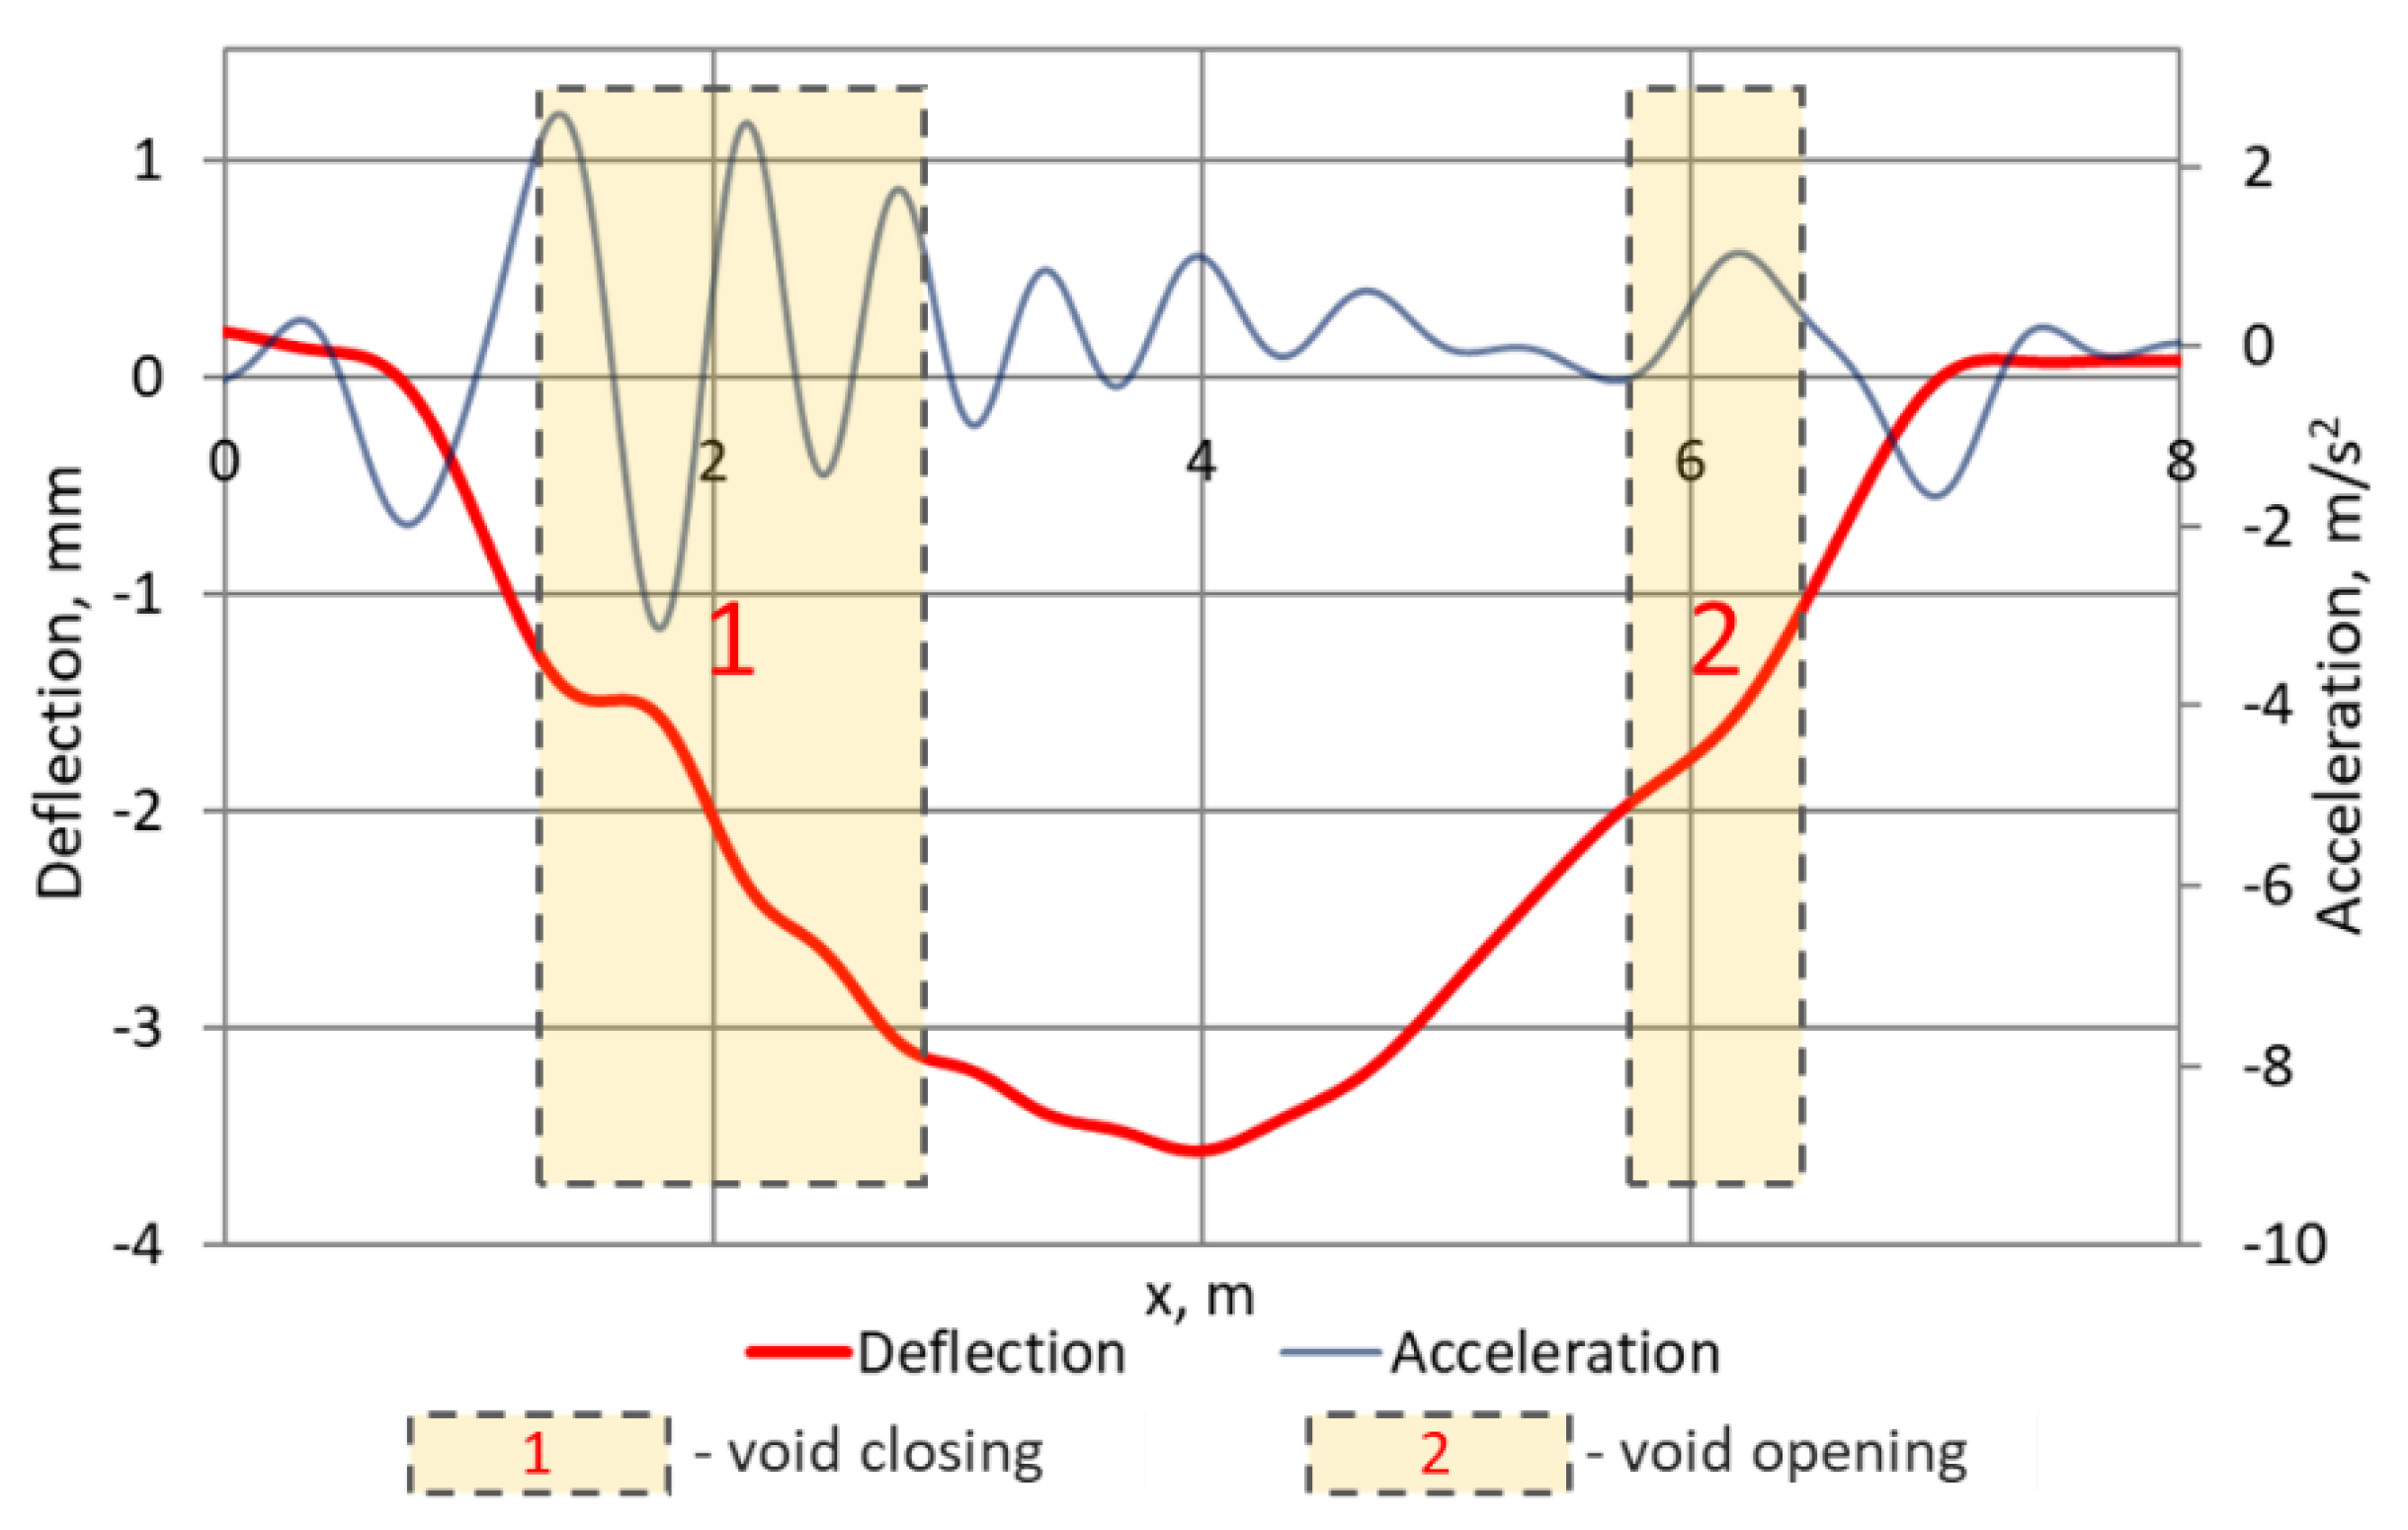
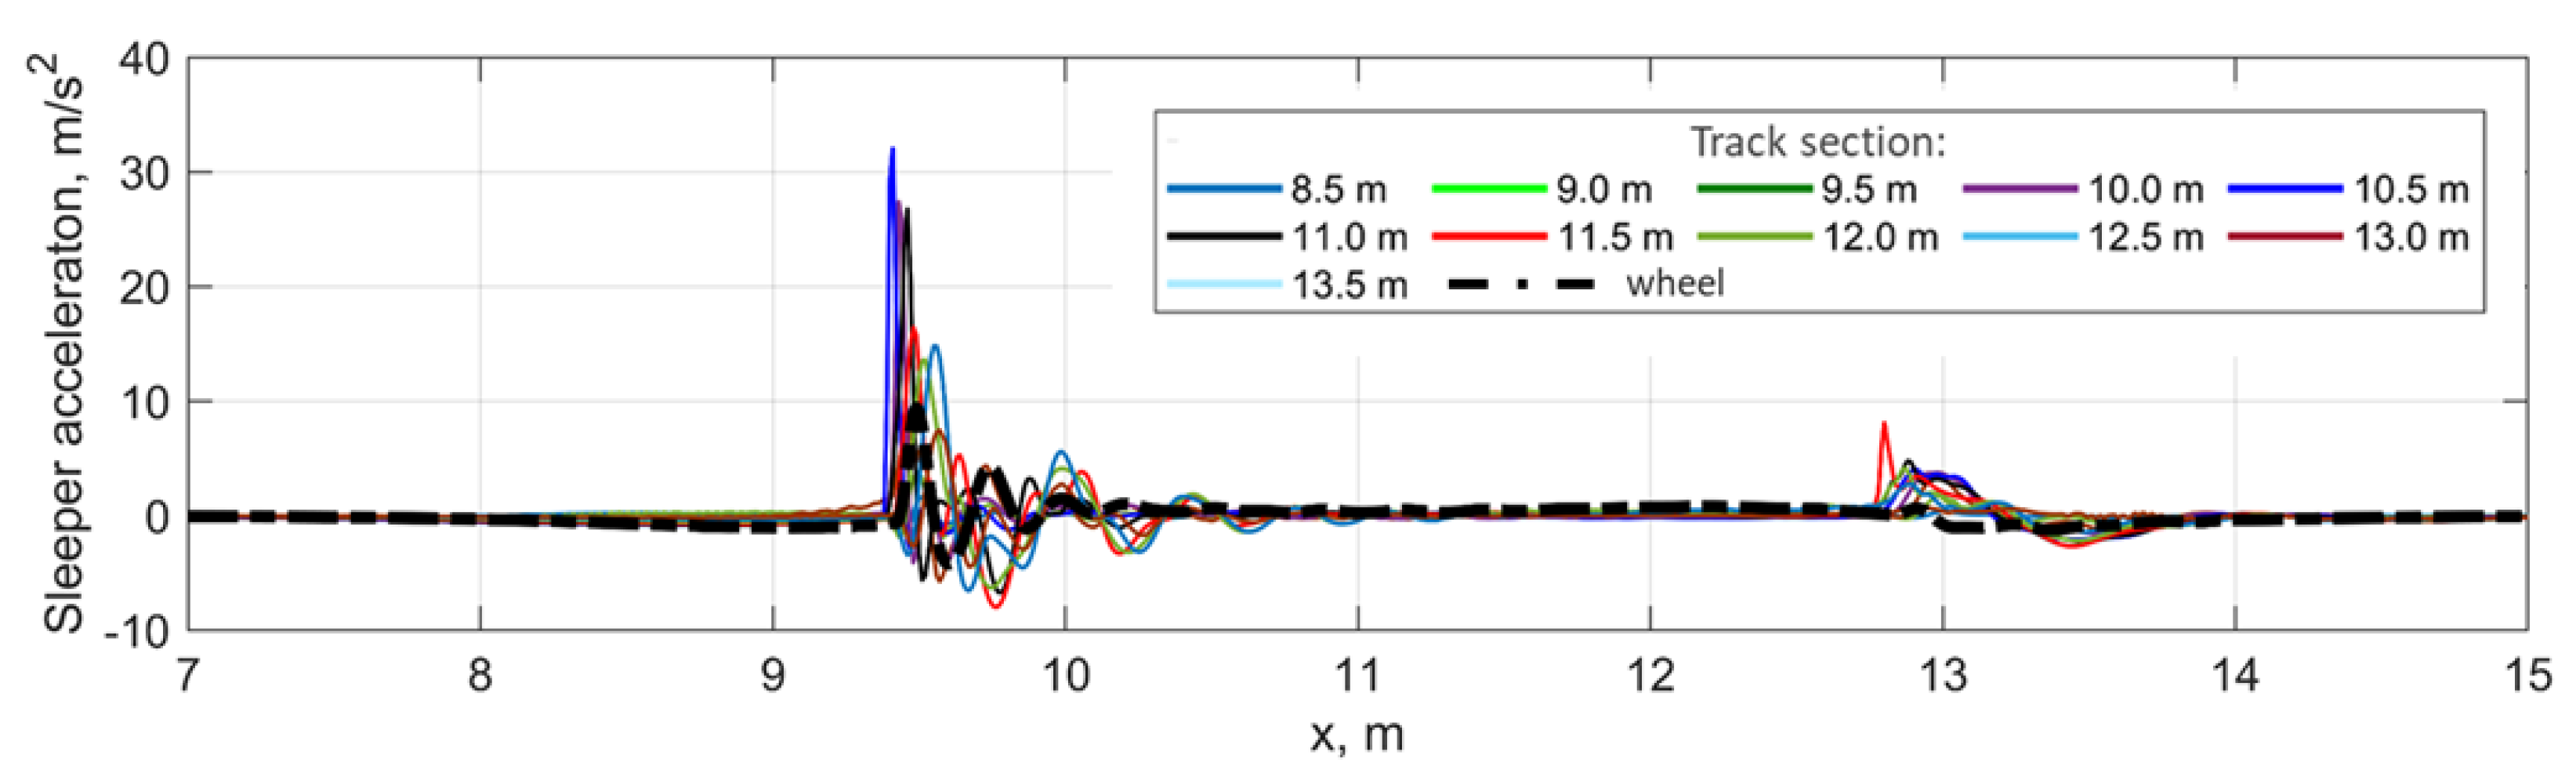
The sleeper and wheel acceleration are presented in
Figure 9. While the sleeper accelerations reach 30 m/s
2, the maximal wheel acceleration is about 10 m/s
2. Two acceleration zones are visible; one represents the void closing, and the other represents the void opening. The maximal wheel acceleration is shifted in time relative to the maximal acceleration of the sleepers.
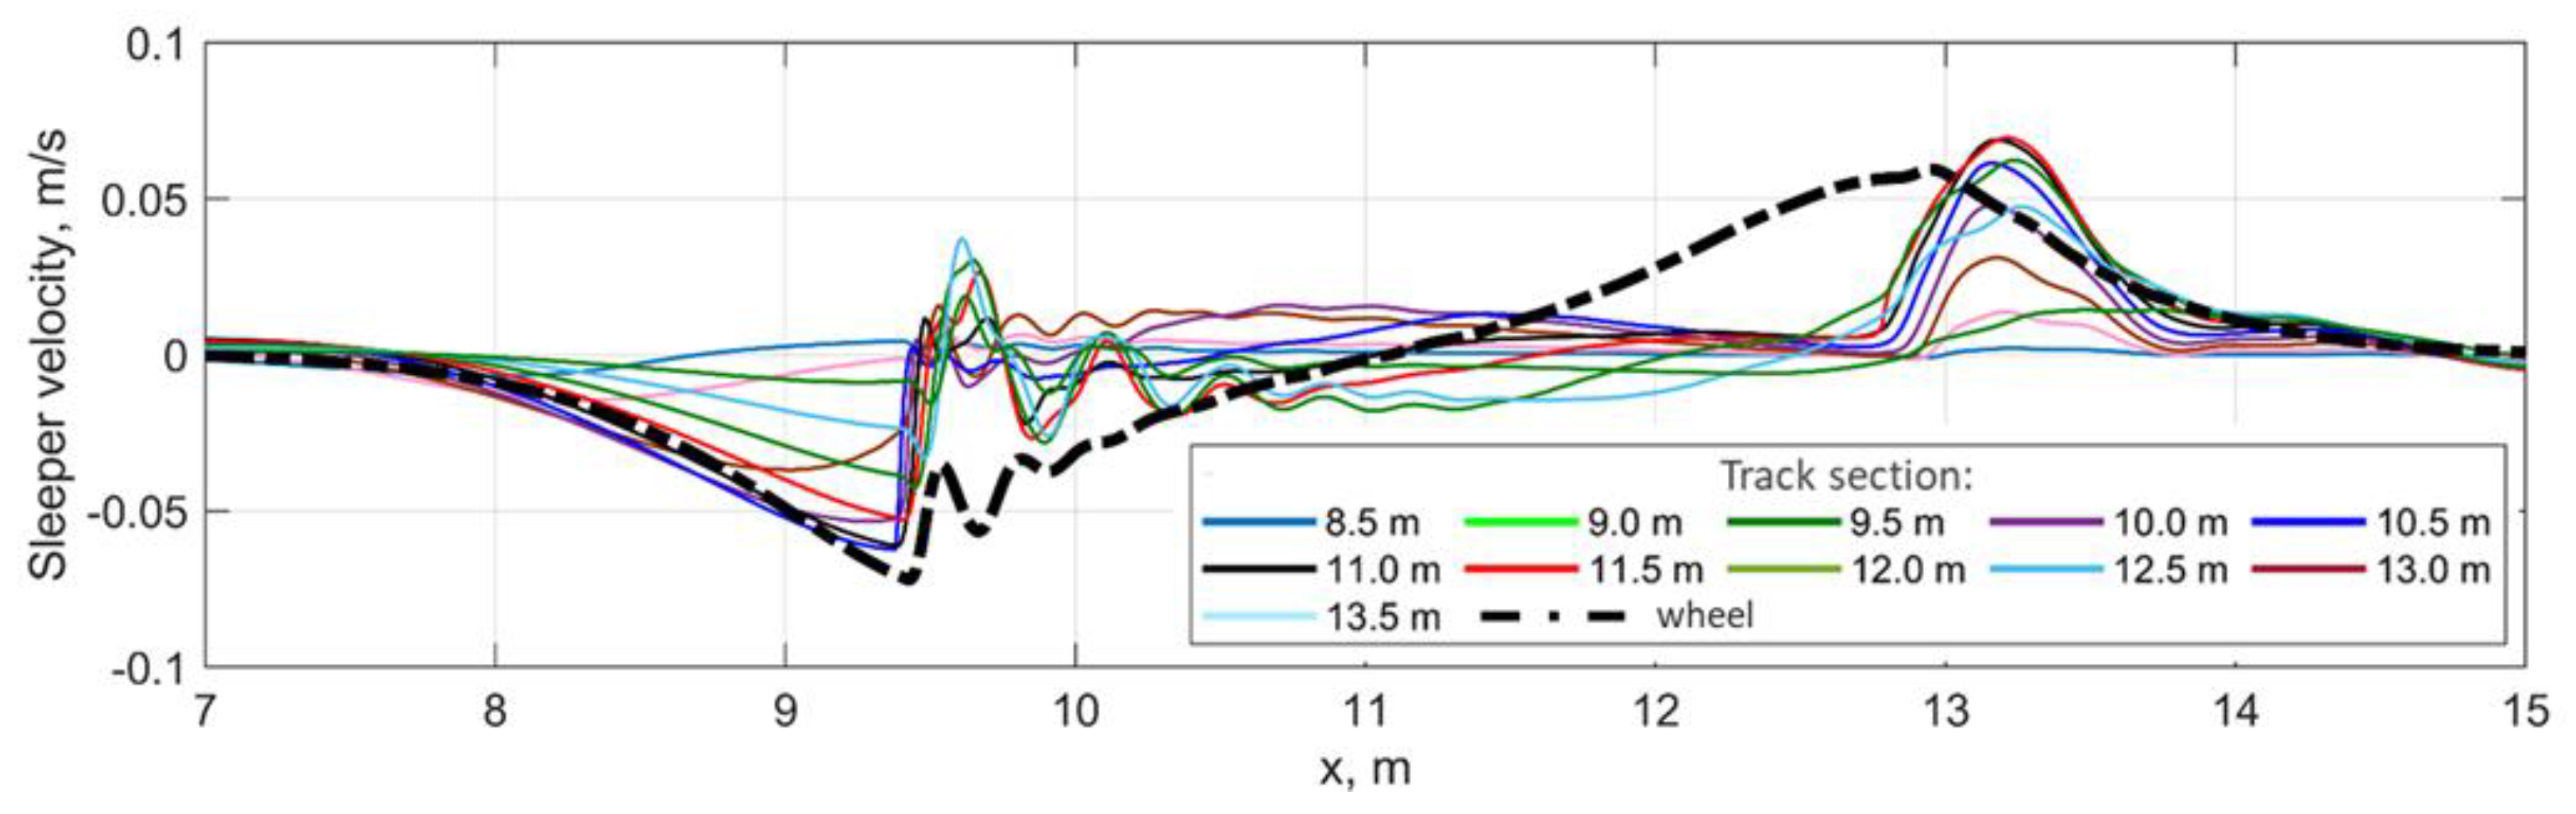
In addition to the accelerations, the vertical velocities of the wheel and the sleepers are other important parameters that can explain the mechanism of the void impact. The diagram of the wheel and sleeper velocities is presented in
Figure 10. The diagram shows that the wheel and the sleepers in the void zone move together with the same vertical velocity until the impact time. After that, the sleepers quickly decrease in velocity and the wheel velocity gradually changes to the reverse.
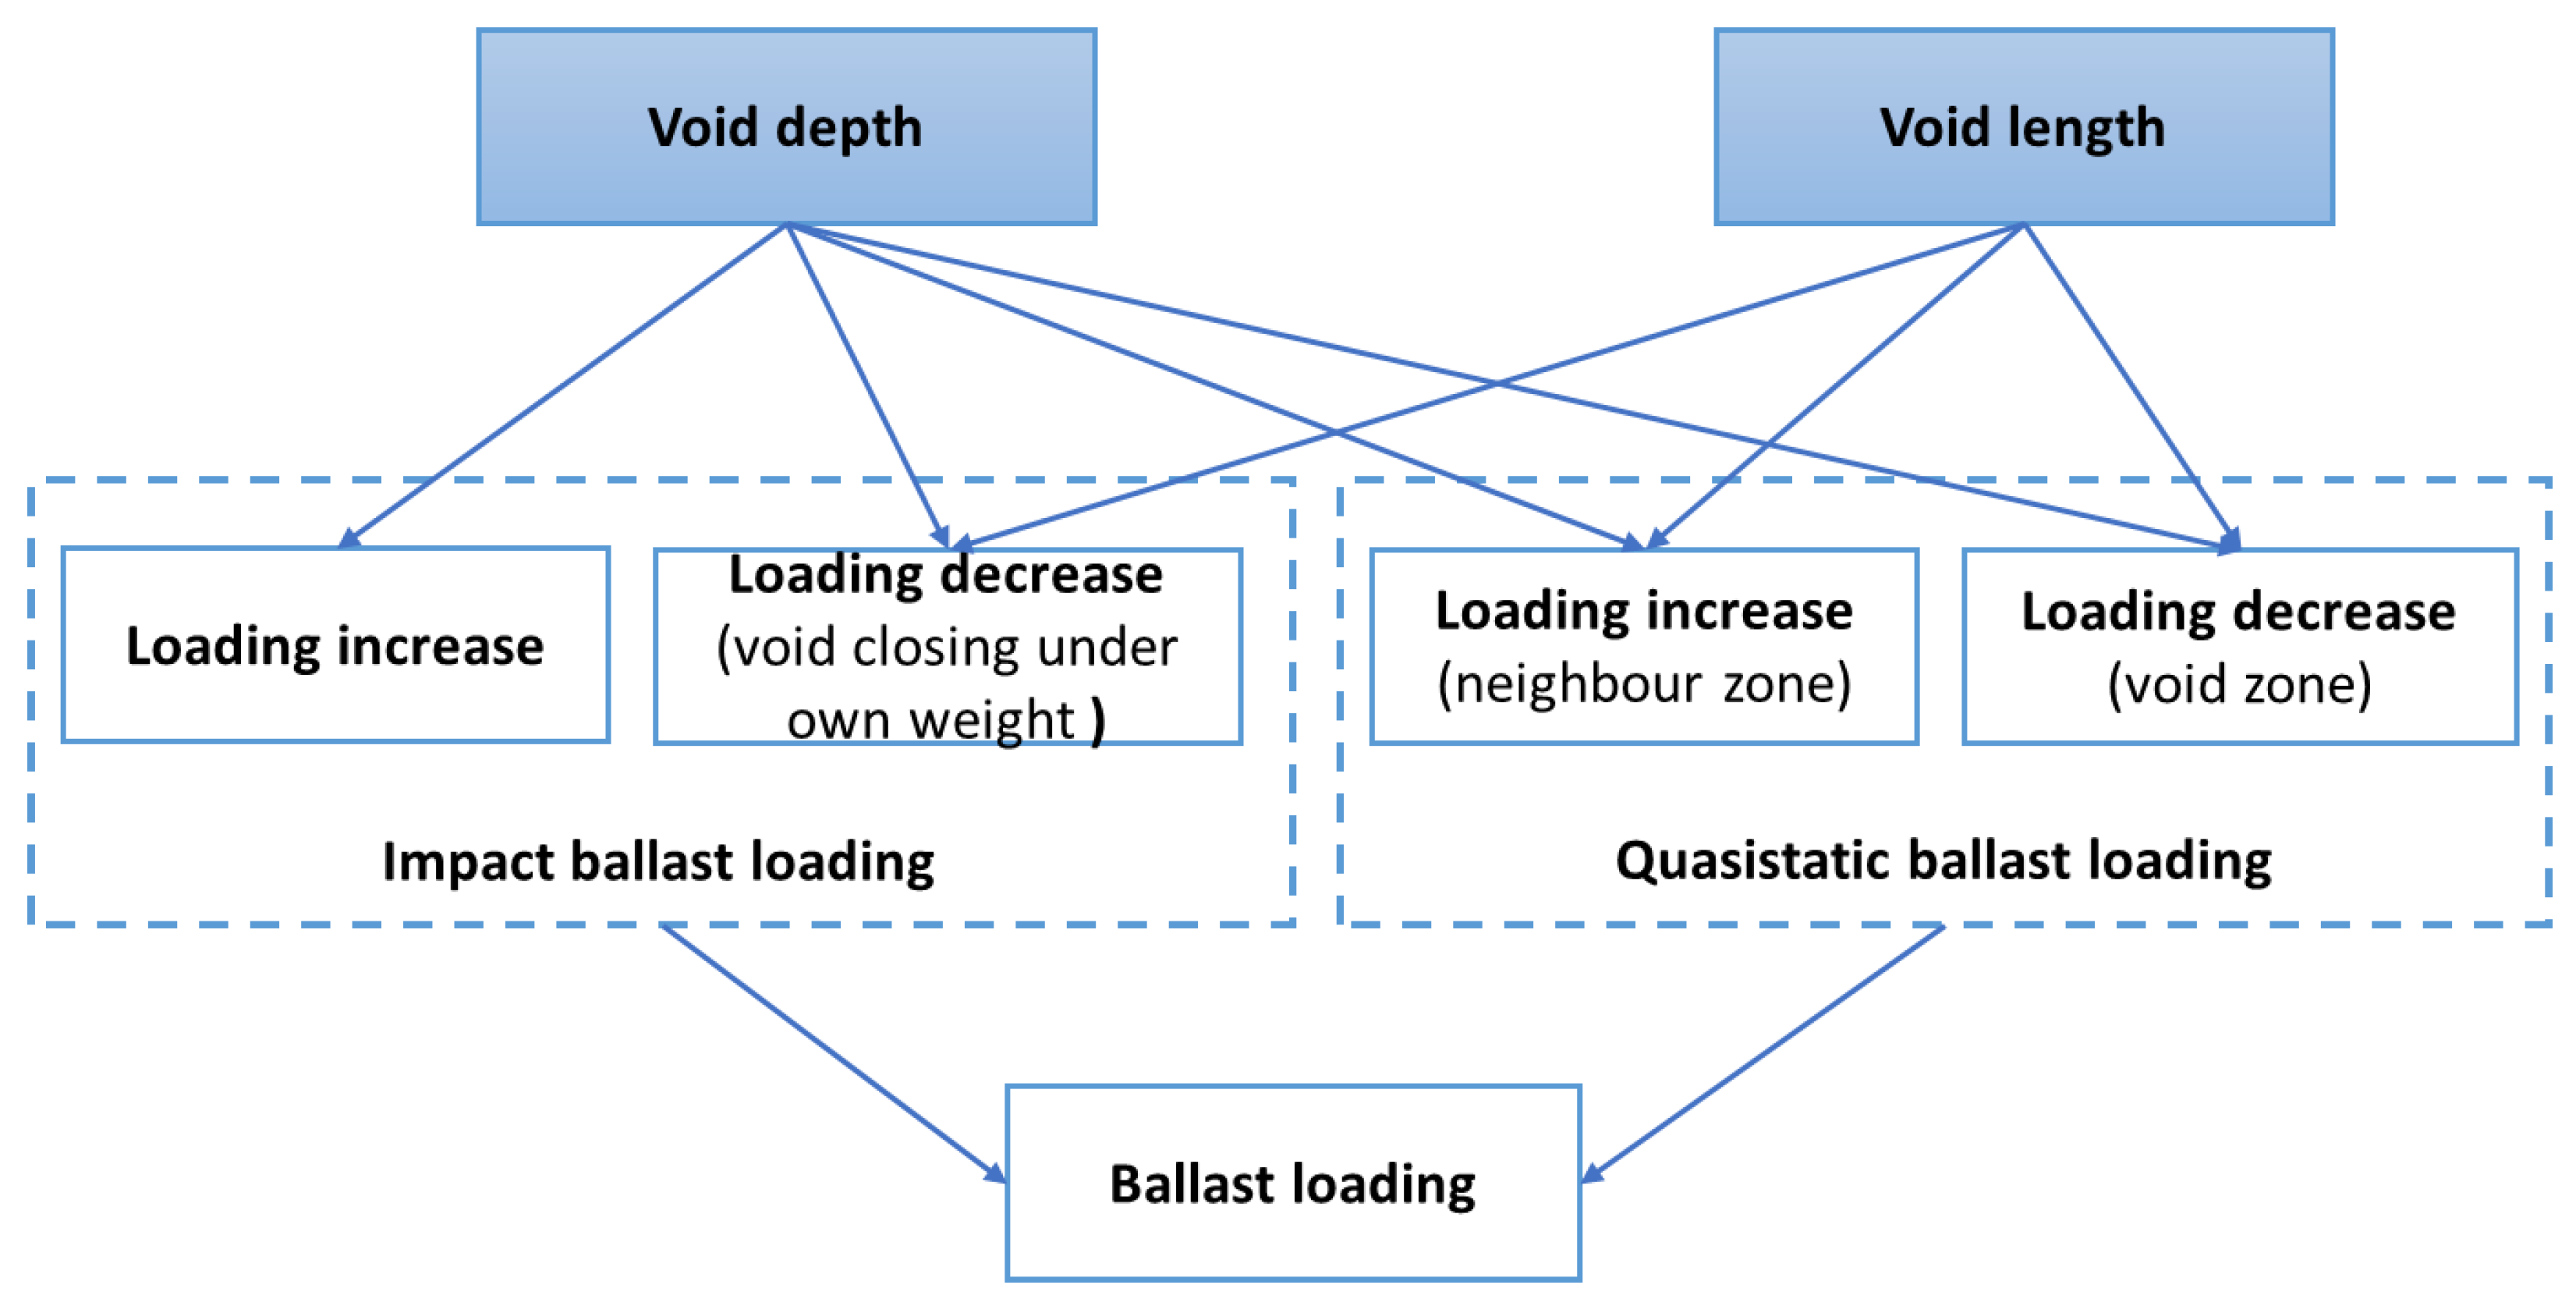
5. Analysis of the Influence of the Sleeper and Void Size on Impact Loading, Acceleration and Velocity
Different from a geometrical irregularity, the influence of the void depth on the dynamic interaction is ambiguous; i.e., the loadings increase until some depth and then should decrease until full unloading. The same is valid for the void length: for the short voids, the deflections and thus the impacts decrease. The aim of the section is a quantitative study of relations between the void sizes and the parameters of the dynamic interaction. The following parameters are analysed: wheel and sleeper maximal accelerations, sleeper impact velocity, impact loading and quasistatic (QS) loadings. The QS loadings are considered in the void zone and outside the void zone. Additionally, the impact shift, or the distance between the maximal impact time and that of QS loading from the same track location, is considered. The calculation cases are named with the labels LxVx denoting the theoretical length
L and depth
V. The actual void sizes result after the gravitational loading, and therefore the values are 25–50% lower than the labelled ones. Thereby, the calculation cases for the short voids are limited to those where the void is closed and the dynamic impact appears. The same is considered for the long void zones where the void is closed under the own weight of the sleepers and rails. The results of the variate calculations are presented in
Table 1.
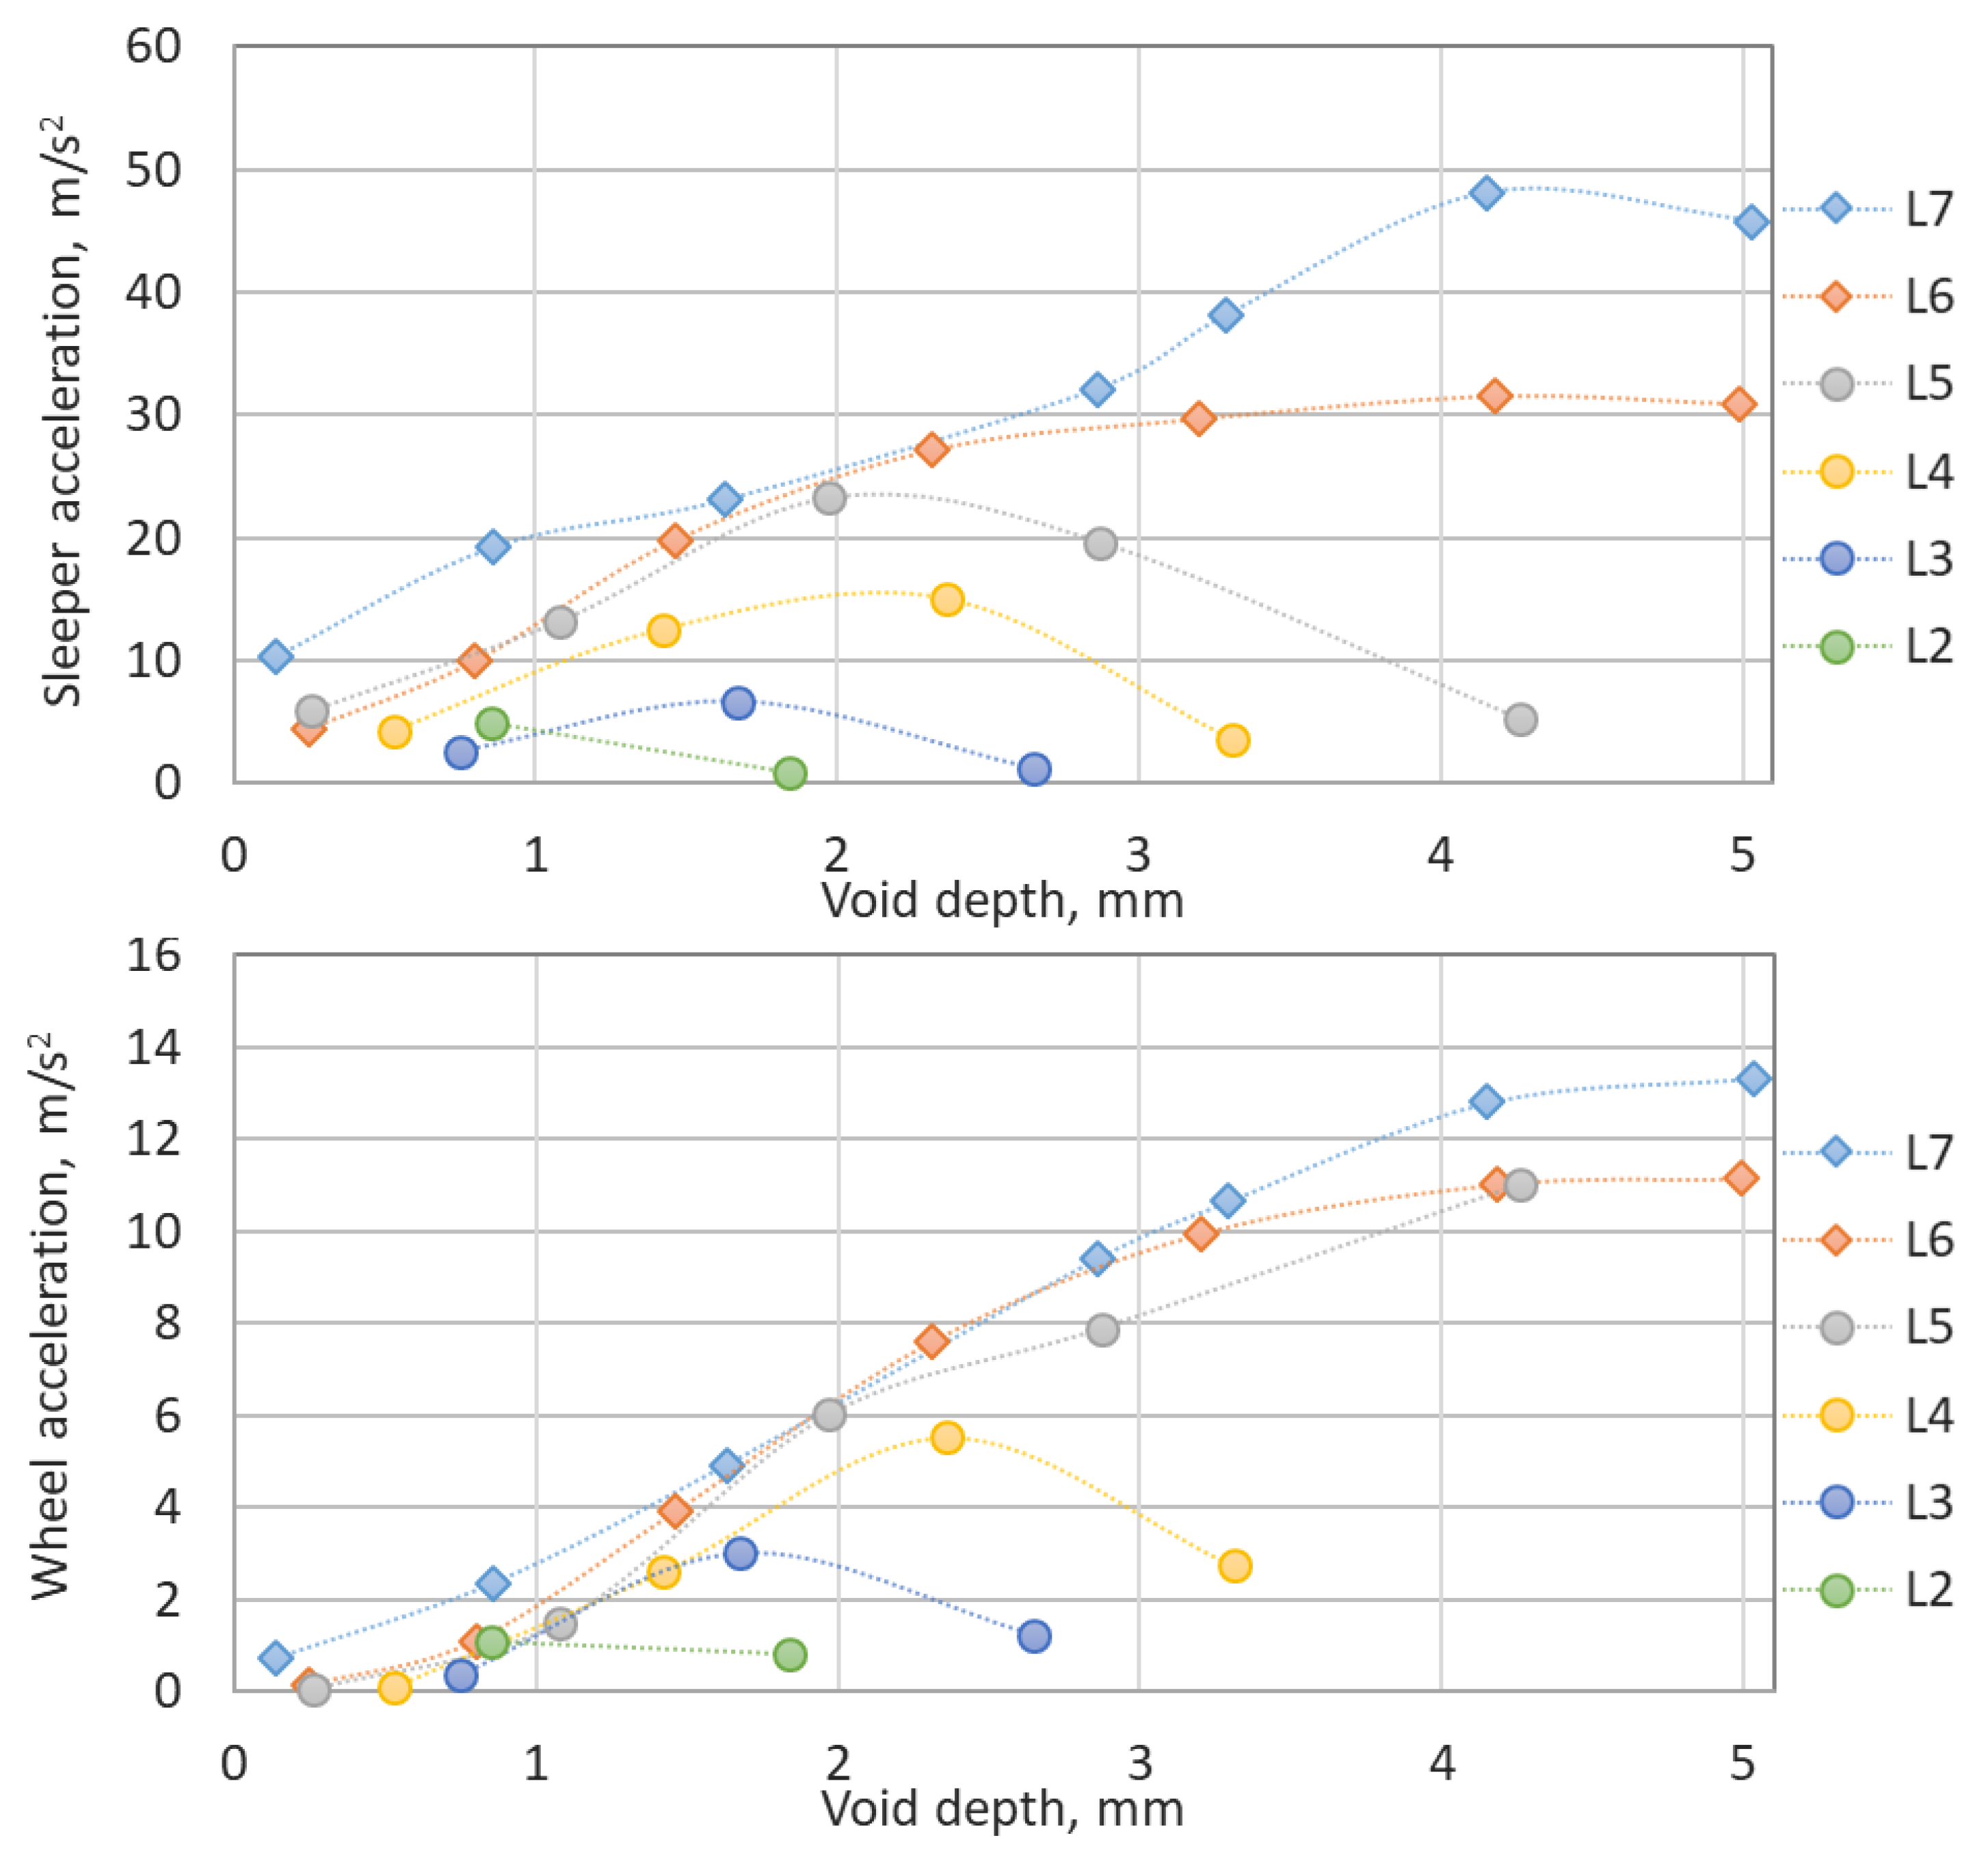
The diagrams of the maximal wheel and sleeper accelerations for all length cases are presented in
Figure 11. Remarkably, the sleeper acceleration is almost 4 times higher than the wheel acceleration. A further notable property of both acceleration processes is the gradual stabilization of the accelerations with the increased void depth. Moreover, the acceleration decreases for the short void cases L2–L5 with the increase in the void depth. The long void cases L6–L7 show almost no change in the accelerations for more than 4 mm void depth.
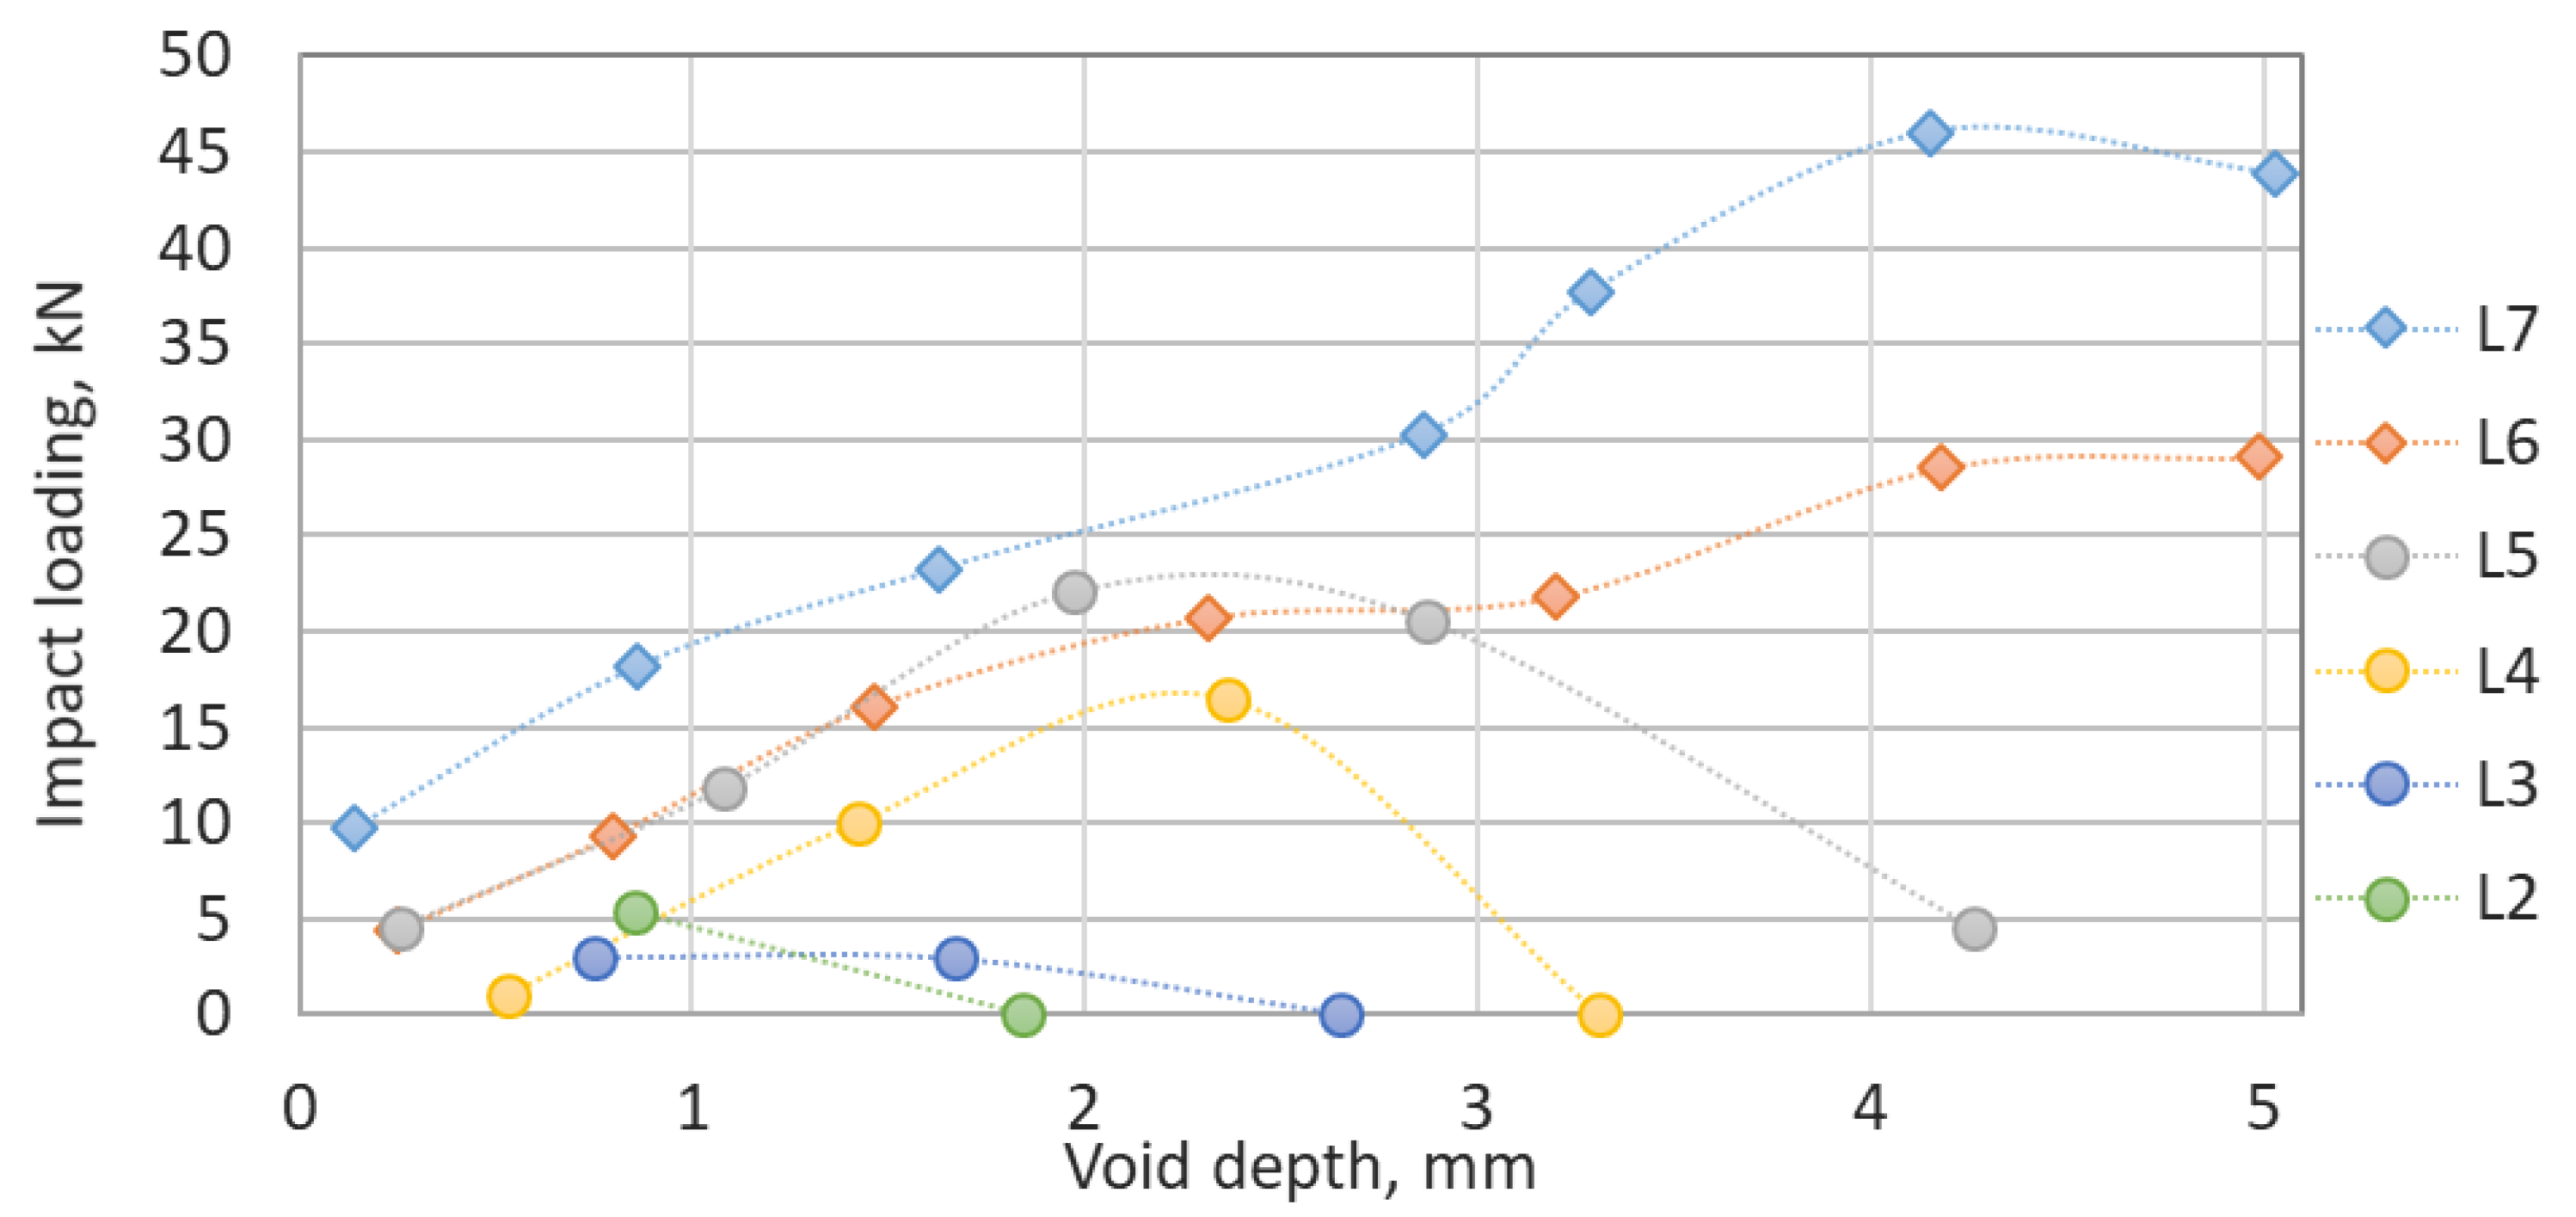
The ballast impact loading process that is presented in
Figure 12 is similar to the sleeper acceleration one (
Figure 11). However, the impact loading is absent for the cases L2–L4 and high depth. Both the diagram of the impact accelerations and the diagram of the loadings have some nonmonotonous parts that can be explained with the selected track longitudinal sectioning of each 0.5 m. The short impact time could cause the maximal impact position to be located within the selected raster. The maximal impact loading is for the case L7v7 that corresponds to the void length of 4.7 m and the depth of 4.2 mm.
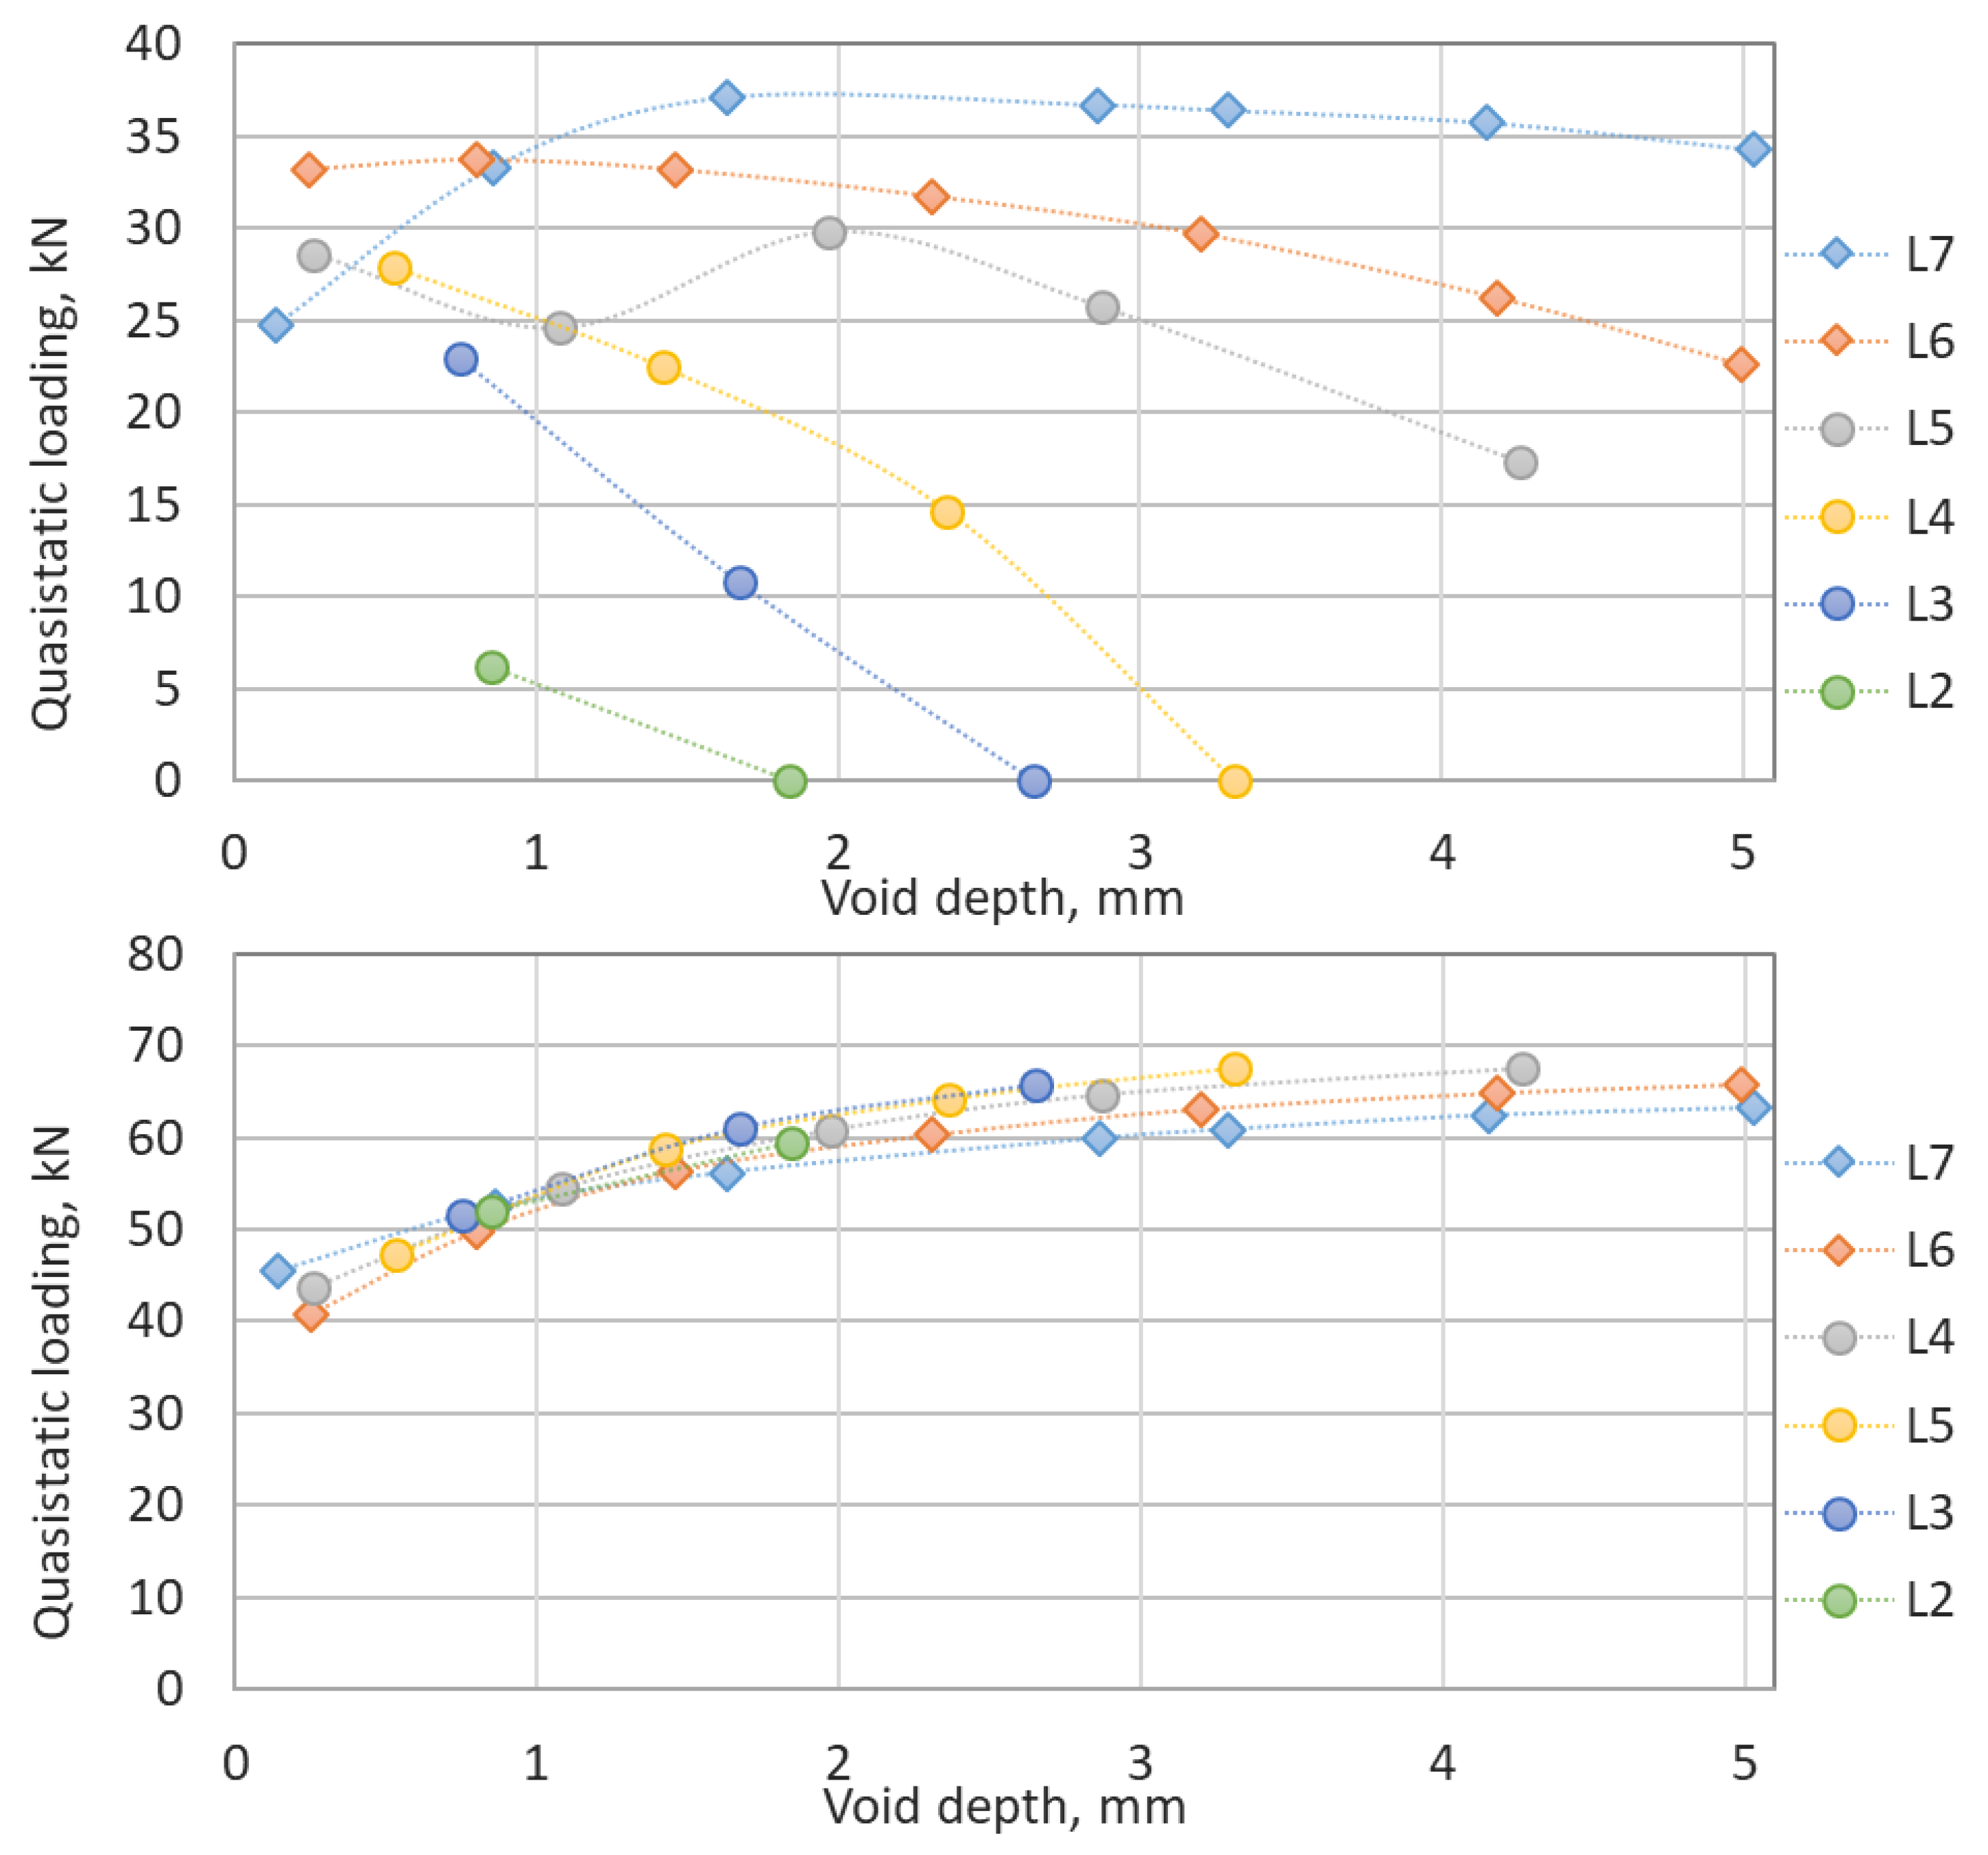
The analysis of the quasistatic loadings inside the void zone and outside of it is presented in
Figure 13. The quasistatic loadings outside the void zone (
Figure 13, bottom) present clear relation to the void depth—the loadings increase up to 17 kN while the void depth grows up to about 2 mm. The influence of the void length is minor. However, the short void cases with the highest void depth generally cause higher load distribution on the void ends.
The quasistatic loadings inside the void zone present an ambiguous relation to the void sizes. The sleeper loading for the long void zone L7 is about the same as for the track without voids. However, in the case of the short void zones L2-L3, the quasistatic loading decreases rapidly while the void depth increases. The quasistatic loadings inside the void zone are absent for the void lengths less than 3 m with depths greater than 3.3 mm
6. Analytic Explanation of the Void Impact Mechanism
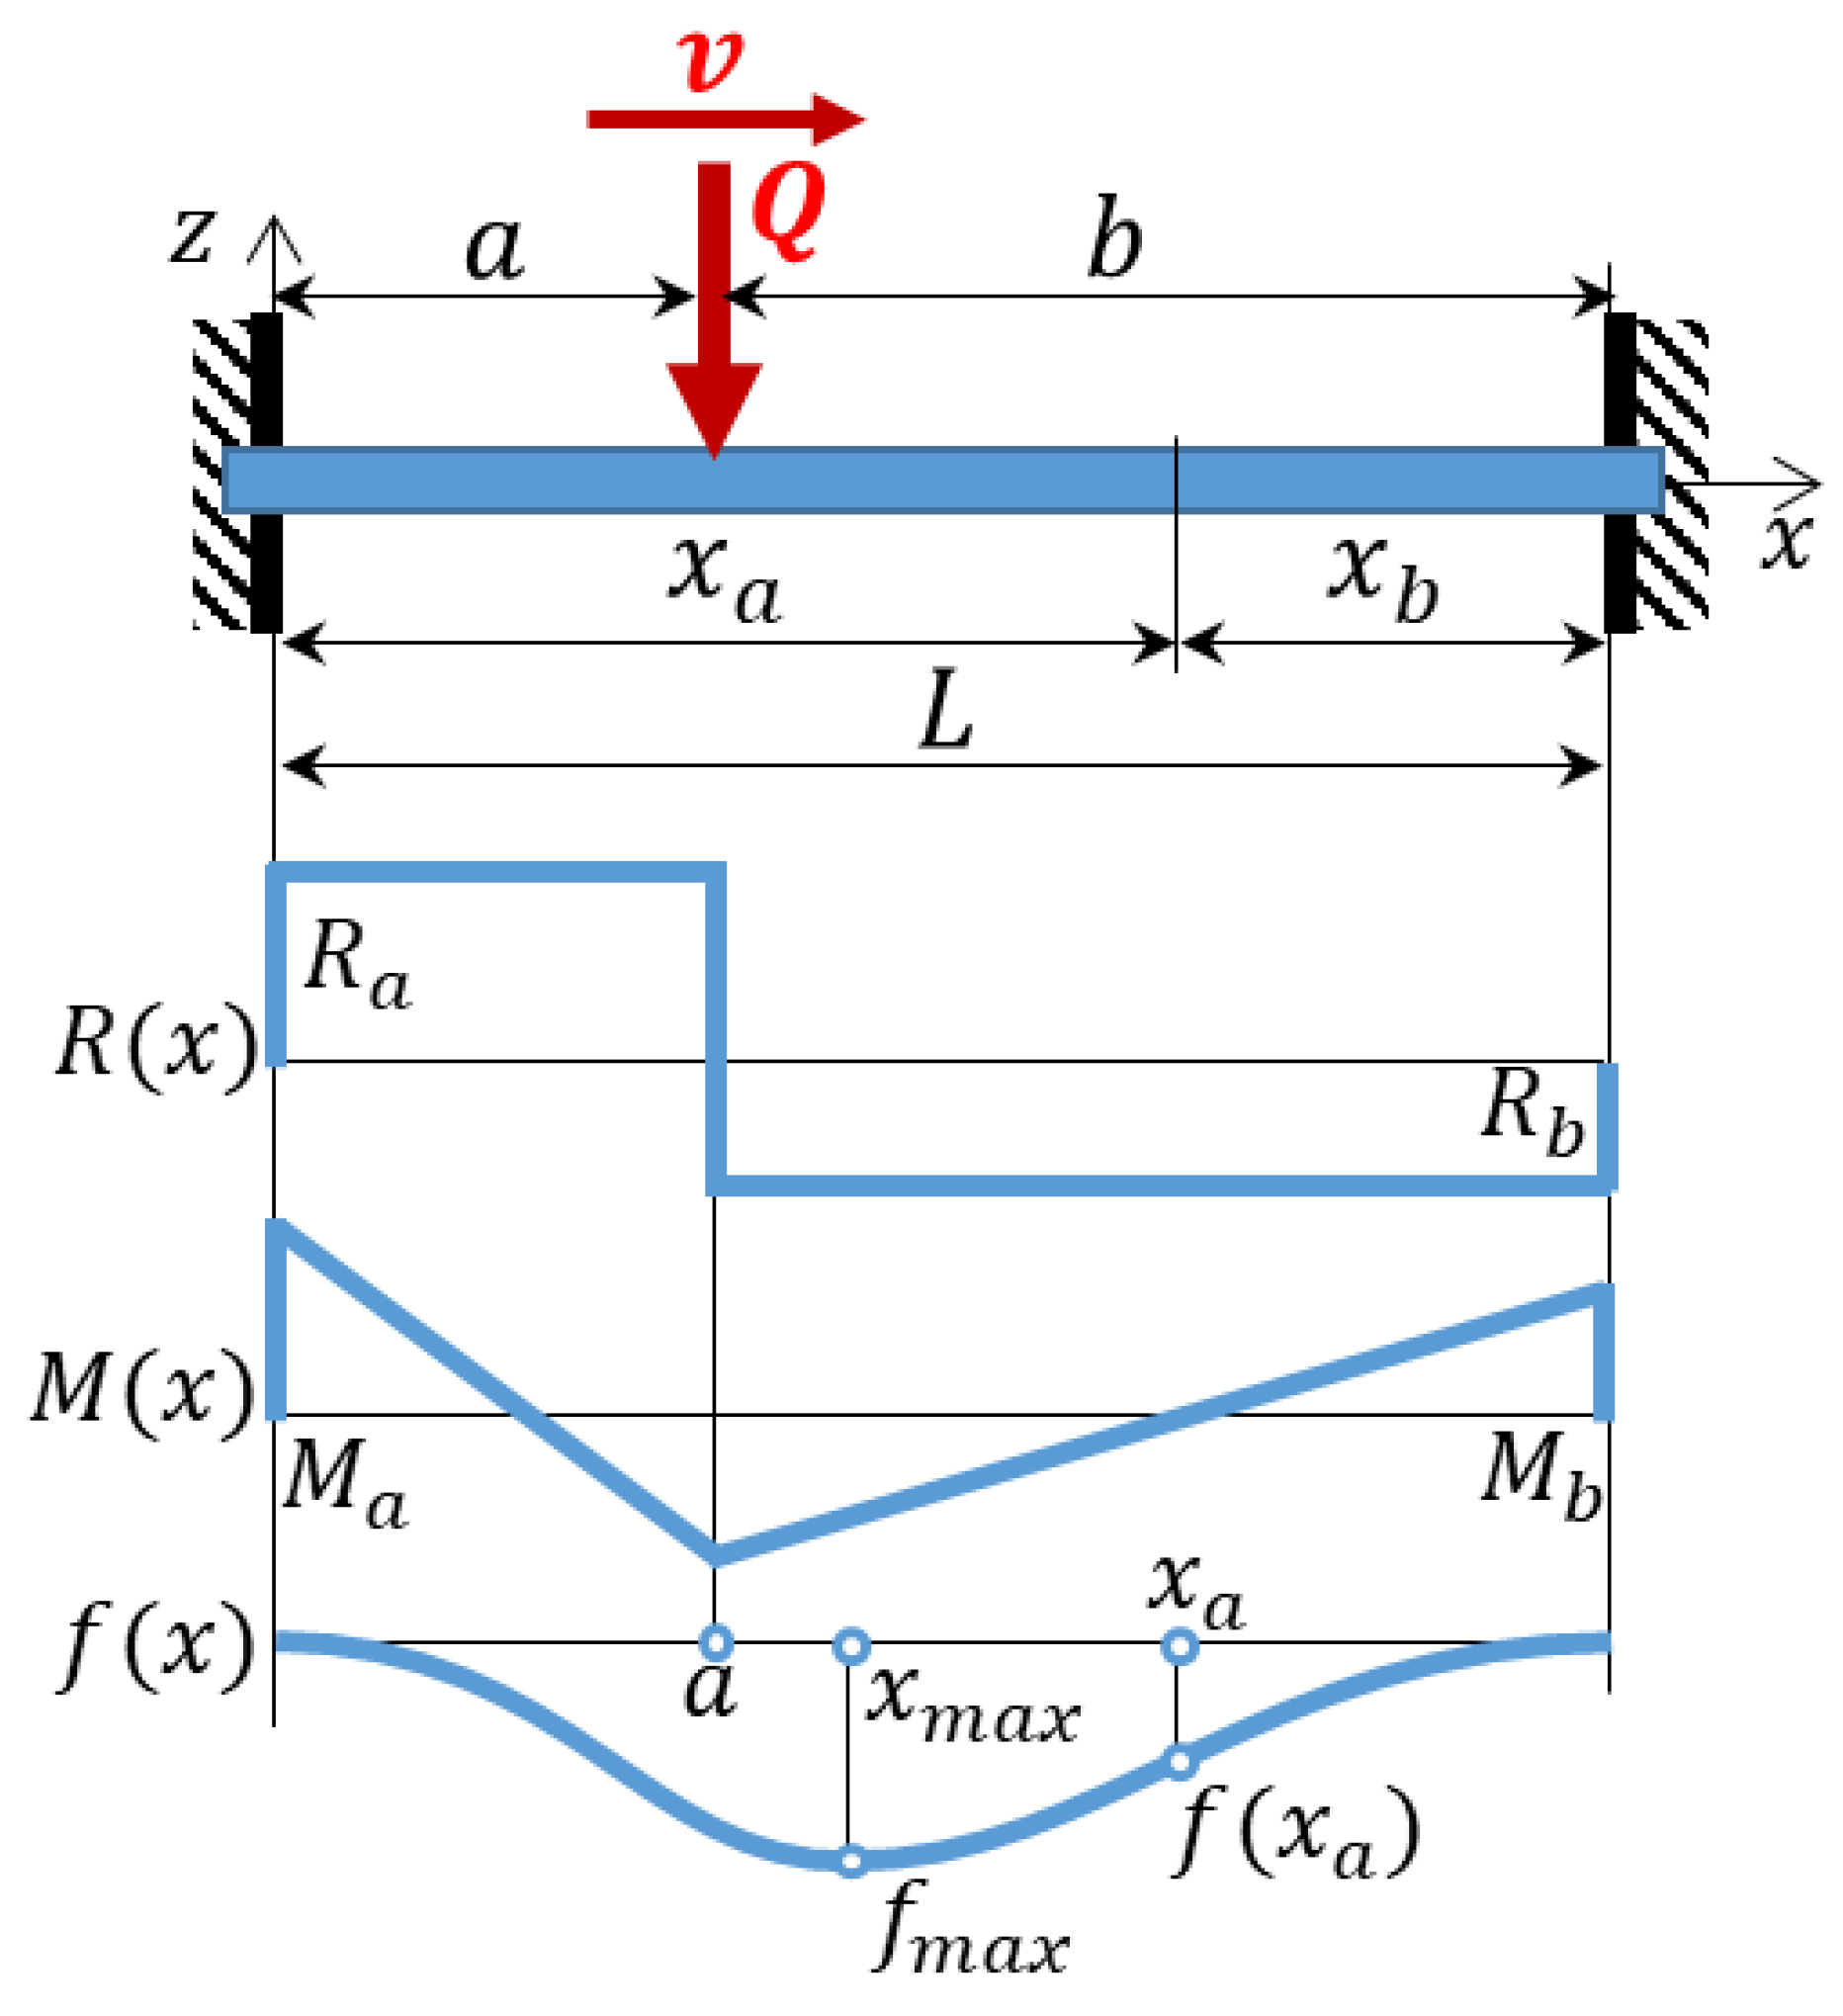
The analysis of modelling results in the previous section has shown that the dynamics due to the wheel passing the void zone is relatively low compared to that in the sleeper–ballast contact. Additionally, different from the geometrical irregularities, there is some void depth with the maximal impact interaction. Thus, the main reason for the impact interaction is not the wheel–track oscillations due to the appearing irregularity. A void impact explanation due to quasistatic void closure is proved in the study. The impact velocity is derived from a simple clamped beam elastic line with moving point loading of the wheel that is presented in
Figure 14. The diagrams present the shear loadings, moment and beam deflections. The maximal deflection of the beam
has the coordinate
while the point loading
coordinate is
.
The governing equations that correspond to
Figure 14 are presented by Formulas (1–6) [
48,
49]. The loading reactions
and
in the clamp points are determined using the following equations:
where
Q is point loading;
and
b are coordinates of the point loading from both beam sides;
is beam length.
The clamp moments reactions
and
are determined as follows:
The elastic beam deflections in the range from the clamps
and
to the impact point location are determined by the following formulas:
where
is bending stiffness.
Additionally, a clamped beam deflection due to own weight is taken into account using the formula
where
is the distributed loading of own weight of the sleepers and rails.
The maximal beam deflection is found using Formula (6) of the right side of the beam, assuming that the loading position is located on the left side. The corresponding equation without own weight deflection is as follows:
The solution and simplification of the equation deliver the coordinates of the impact point and the maximal deflection depending on the loading position
:
The resulting Equations (9) and (10) are simple, but they do not take into account the variable beam deflection
due to own weight. The analytical solution of Equation (8) with the own weight part is possible; however, it is complicated and is not plausible for the aim of analytics. An assumption that the weight deflection is constant, equal to its maximal value and not dependent on the variable
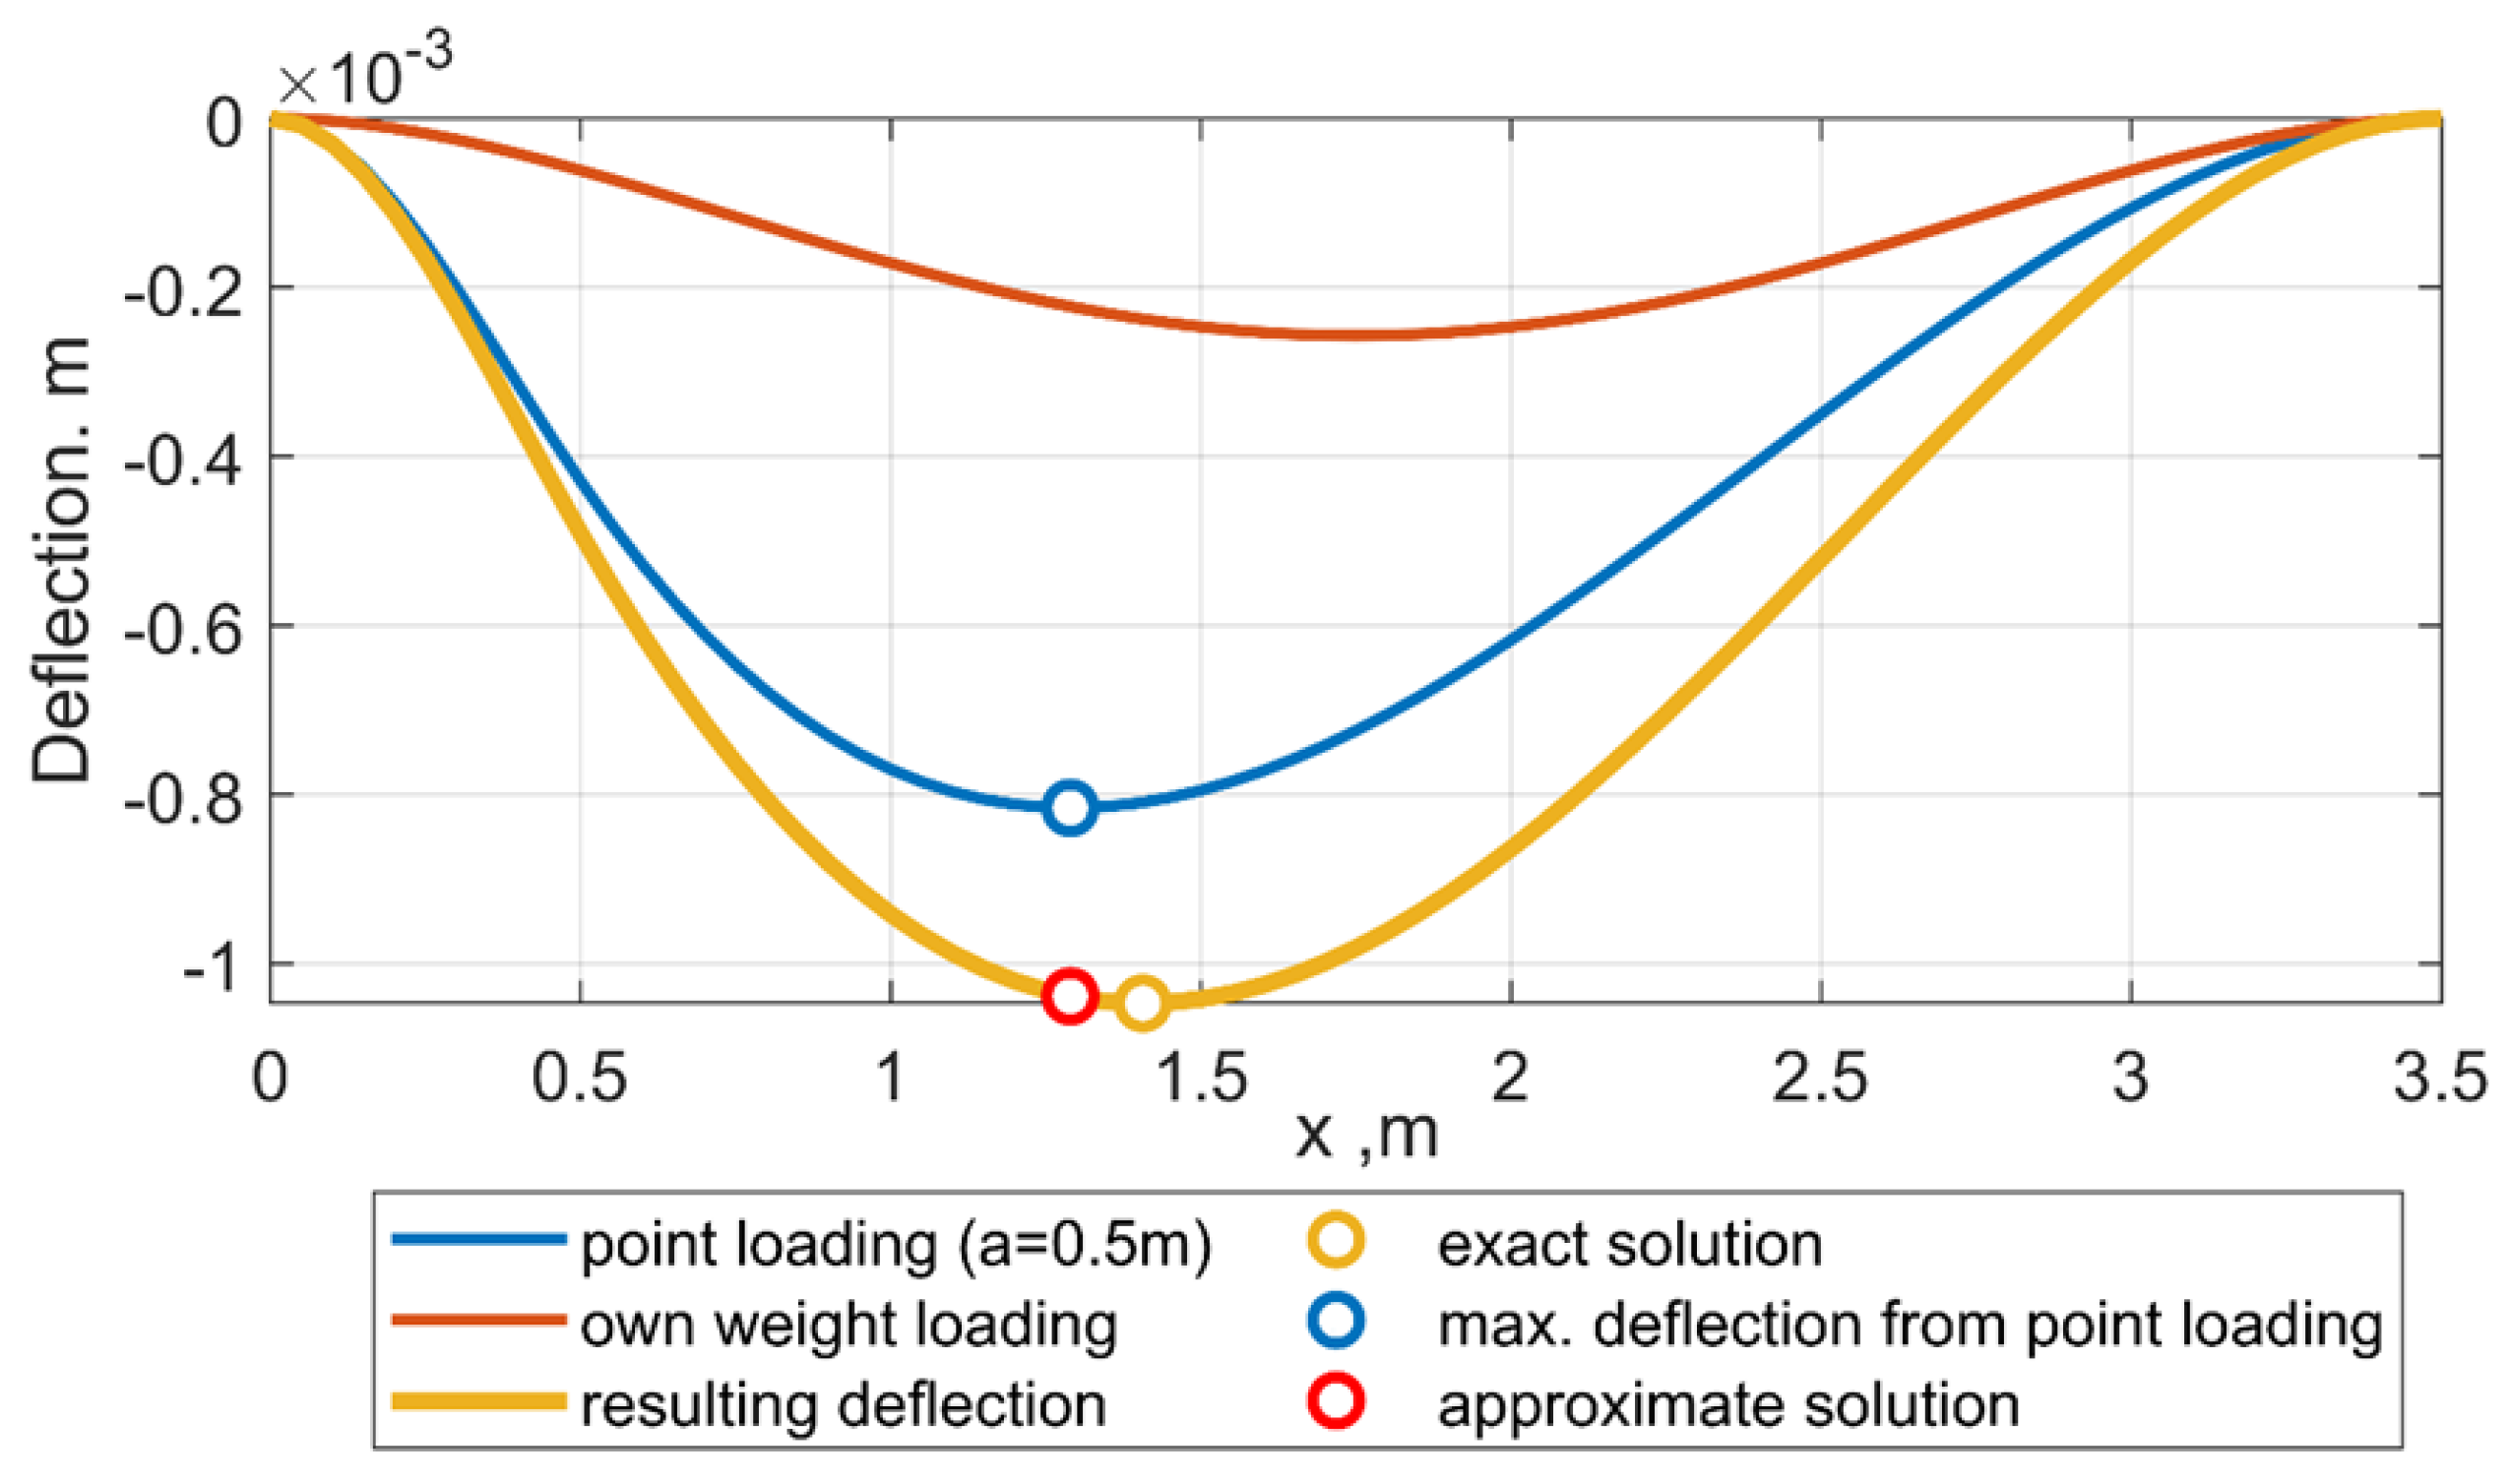
provides an approximate solution that is exact enough for practical calculations.
Figure 15 shows the comparison of the exact and approximate solutions. The deviation of the maximal value coordinate is about 8%, but the deviation of the maximal values is less than 1%.
The derived Formula (10) explains the relation of the maximal beam deflection to the loading position. However, to determine the impact velocity for known void depth, the wheel position identification
that corresponds to void depth
is necessary. Thus, the equation for the solution is
The exact solution of Equation (1) is not possible due to the derivation of the fifth-degree polynomials. However, assuming that the wheel position
is usually up to 0.6 m, a simplified analytic relation can be found that provides less than 5% error compared to the exact solution:
The vertical impact velocity of the beam is determined assuming the constant velocity of the loading point
along the beam and differentiation of the Equation (10):
The resulting formula of impact velocity depending on the wheel position and its velocity is as follows:
The analysis of the equation shows that the impact velocity depends linearly on the wheel velocity, different from the geometrical irregularities where the relation is quadratic. Additionally, it can explain why the low-speed trains also cause significant impacts in the void zones. The relation of the impact velocity to the wheel loading is linear. However, the loading includes both static and dynamic parts that for short irregularities would cause the dynamic effects.
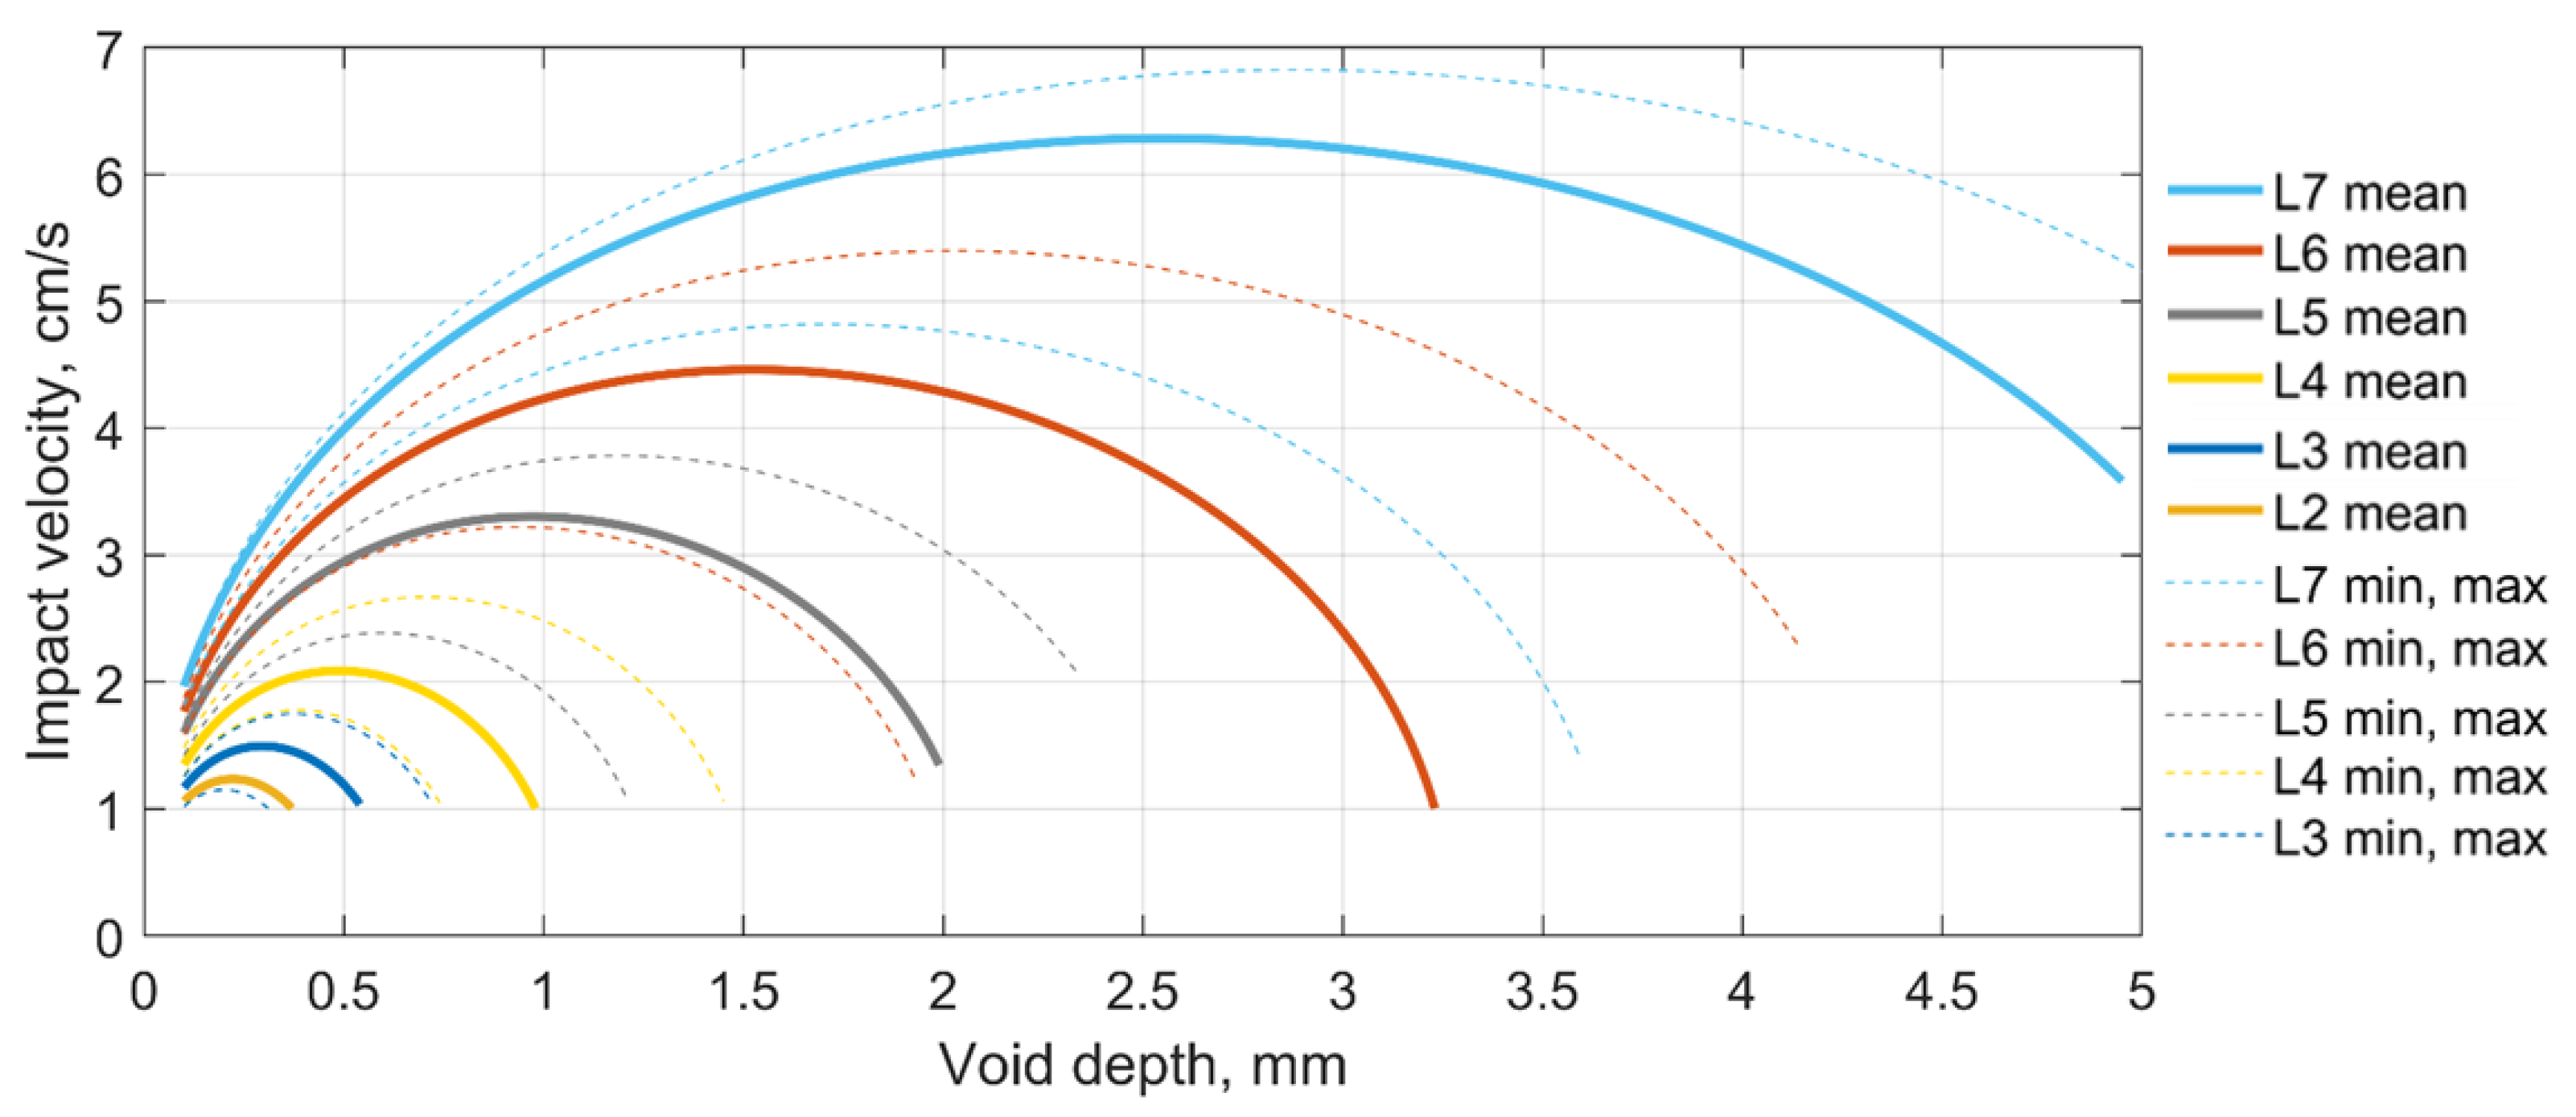
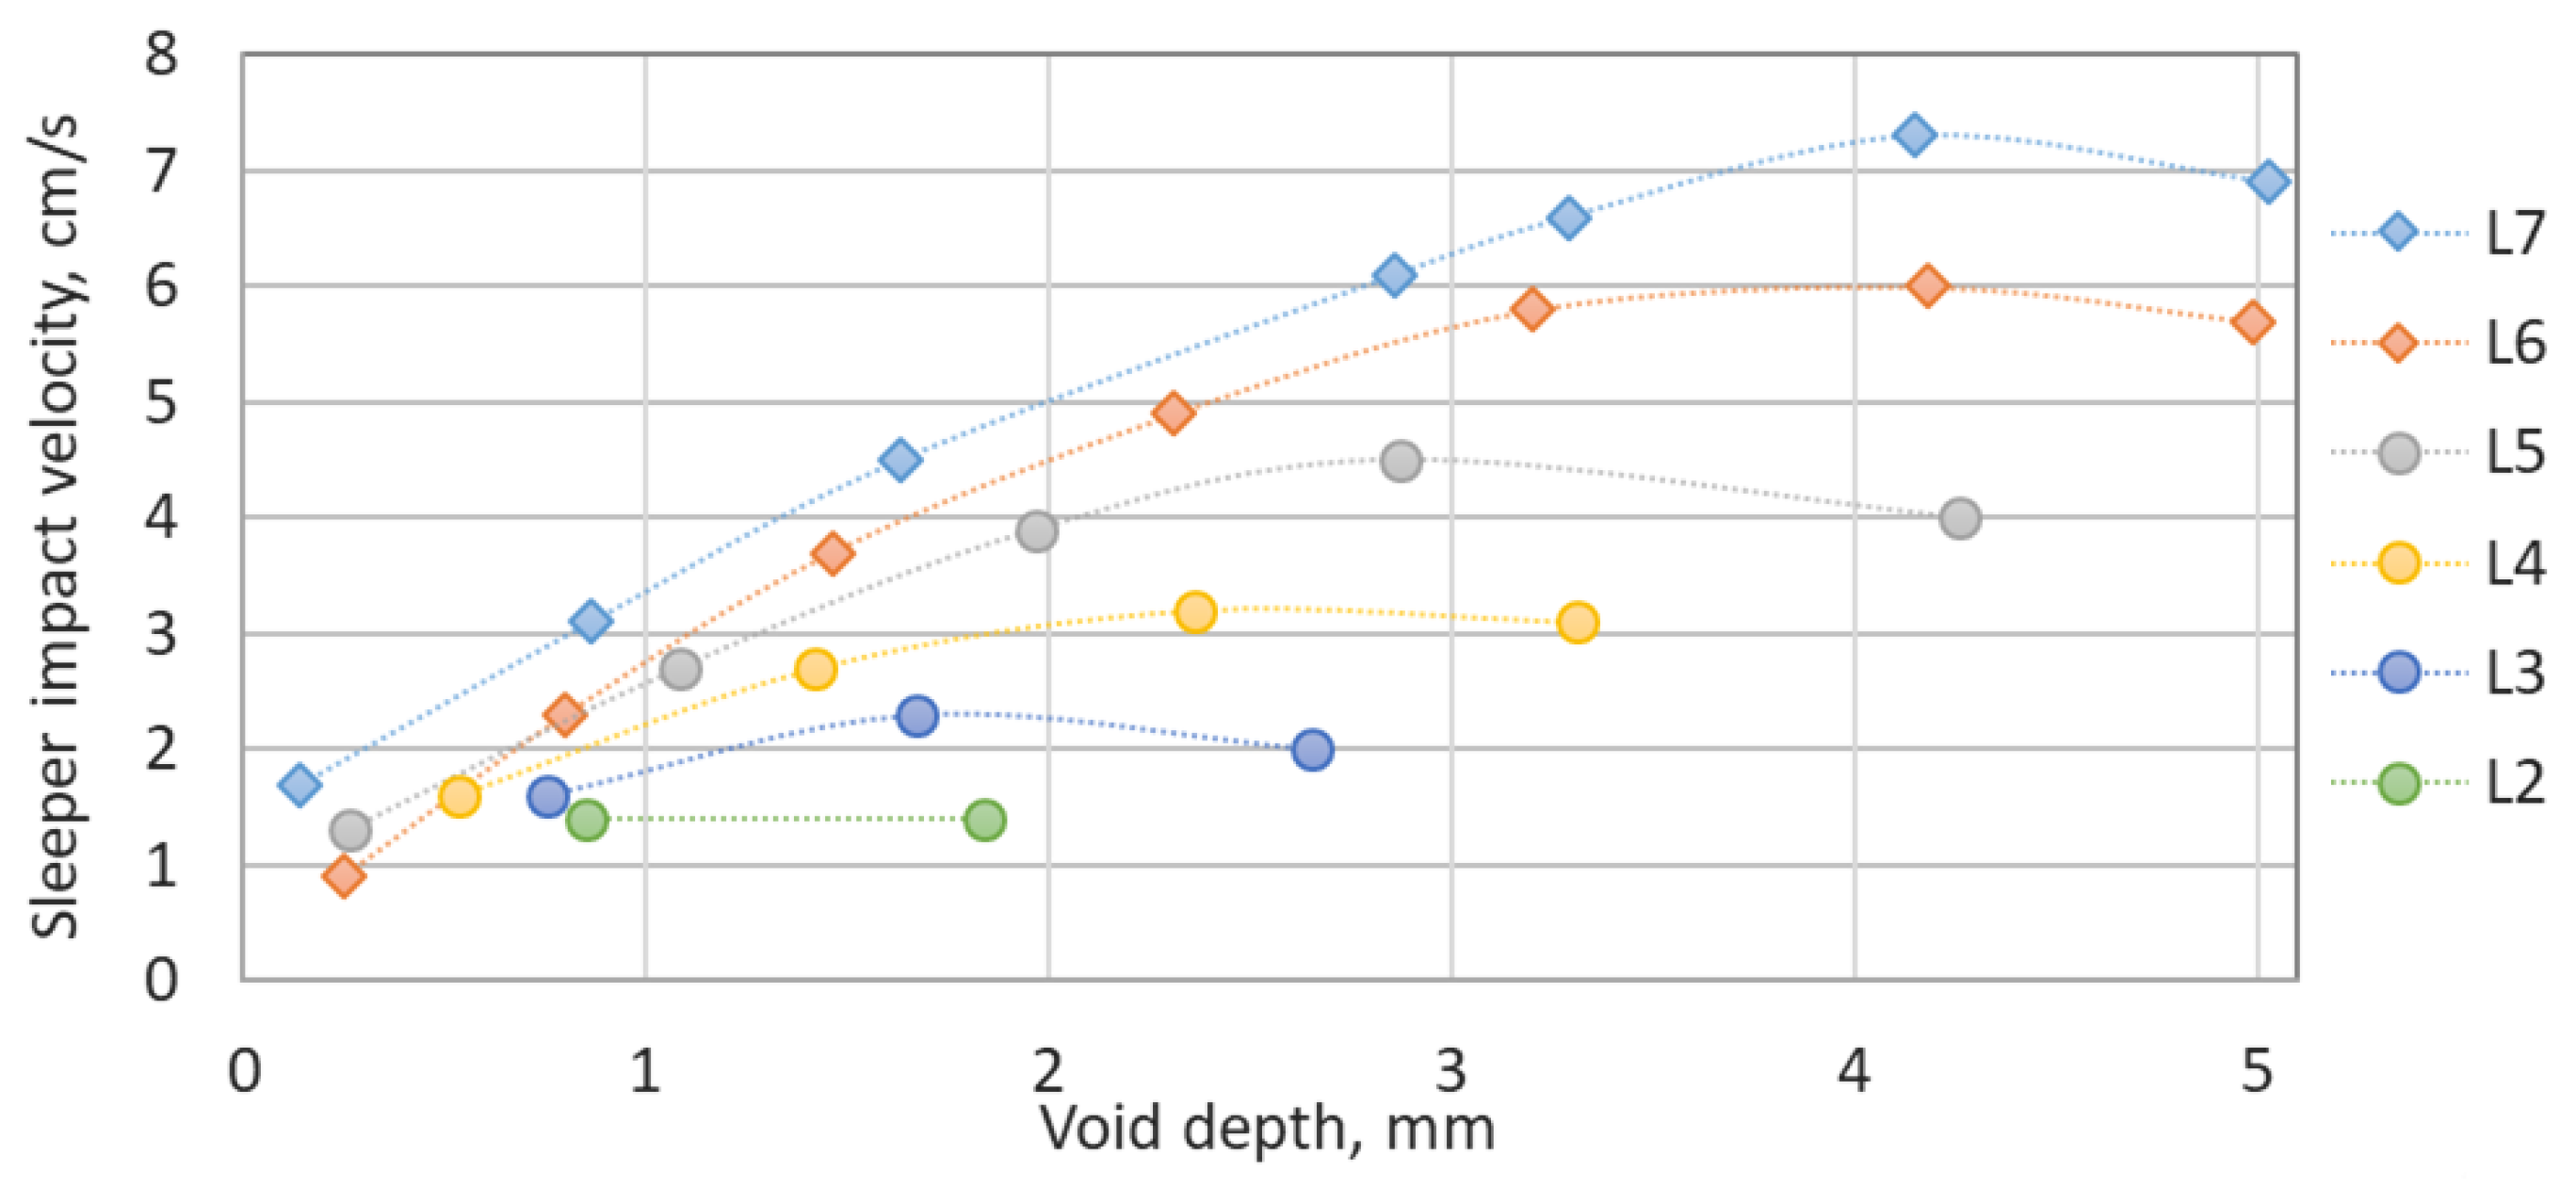
The relation of the impact velocity to the void depth is explained by Formulas (12) and (15) together. However, the influence is complicated and not clear. The diagram in
Figure 16 shows the relation of the impact velocity to the void depth for different void length cases. The beam bending stiffness and the loading are the same as for the simulation in
Section 2. The void mean lengths and their minimal and maximal values are taken from
Table 1 to provide a better comparison to the simulation results. The diagram shows that there is a maximal impact velocity for the certain void depth and for each void length. The maximal impact velocity is up to 7 cm/s for the case L7.
The results are compared with the simulated sleeper impact velocity relation to the depth that is presented in
Figure 17. The diagrams in both figures present the similarities: the impact velocity is in about the same range, and the maximal impact velocities are observed. However, the maxima are shifted to the right side. The explanation of the difference is that both diagrams cannot be directly compared. Each void depth point in the diagram in
Figure 17 corresponds to a different void length from
Table 1, whereas the lines in the diagram in
Figure 16 have a constant void length, and a higher void length usually results in higher impact velocity. Moreover, high void sizes cause the growing dynamic effect of wheel and rail interaction.
7. Estimation of Residual Settlement Intensity of the Ballast Layer in the Void Zone
The aim of this section is an estimation of the long-term influences of the ballast loading in the void zone that are described by a settlement intensity of the residual deformations. The intensity is defined as the linear accumulation of the vertical residual deformations per million loading cycles. The DEM is widely used to study ballasted railway tracks [
50,
51,
52,
53,
54,
55,
56]. Jing et al. [
57] used the DEM to simulate the hanging sleeper dynamic characteristics of the ballast bed, and the ballast particle breakage under dynamic cyclic loads was investigated. Thus, the estimation in this study is produced using a DEM algorithm to simulate residual settlements of one sleeper in a ballast box (
Figure 18, top) under the dynamic loadings of the different cases. The sleeper geometry corresponds to the B70 sleeper. The particle form is simple balls with the standard size distribution of 22.5–63 mm. The model mechanical parameters were derived through the calibration of the model to the accurate model with natural form particles [
58,
59]. Thus, the used model is a dimensionally reduced one having the advantage of quick simulation, which is important for the simulation of the settlement accumulation requiring many loading cycles to receive the definite settlement intensities. The number of particles is 29,788. The particle material properties are the following: static friction 0.56, dynamic friction 0.54, restitution coefficient 0.72, bulk density 1700 kg/m3, Young’s modulus 50 GPa, Poisson ratio 0.3 and rolling resistance 0.38. The sleeper and the subgrade properties are the following: static friction 0.56, dynamic friction 0.54, restitution coefficient 0.72, density 2650 kg/m3, Young’s modulus 20 GPa and Poisson ratio 0.3. The rolling resistance model corresponds to the elastic–plastic approach [
60] that takes into account rolling radii, the tangential stiffness, rolling resistance coefficient, etc. The tangential force model is a simple elastic Coulomb model. The normal force model is a linear hysteresis one.
Four different cases of the ballast dynamic are considered: normal-weight wagon (100 kN/wheel) for the track without void and lightweight wagon for the track without void, pre-stress and quasistatic loading in the neighbour zones and high impact inside the void. The first loading cycles for the DEM simulation are presented in
Figure 18 (bottom). The impact loading case in the void zone (red line) consists of the short time impact and long quasistatic part without the own weight pre-stress. The neighbour to the void zone (blue line) is characterised by high pre-stress and higher ballast loading than in case of normal-weight car on the track without void.
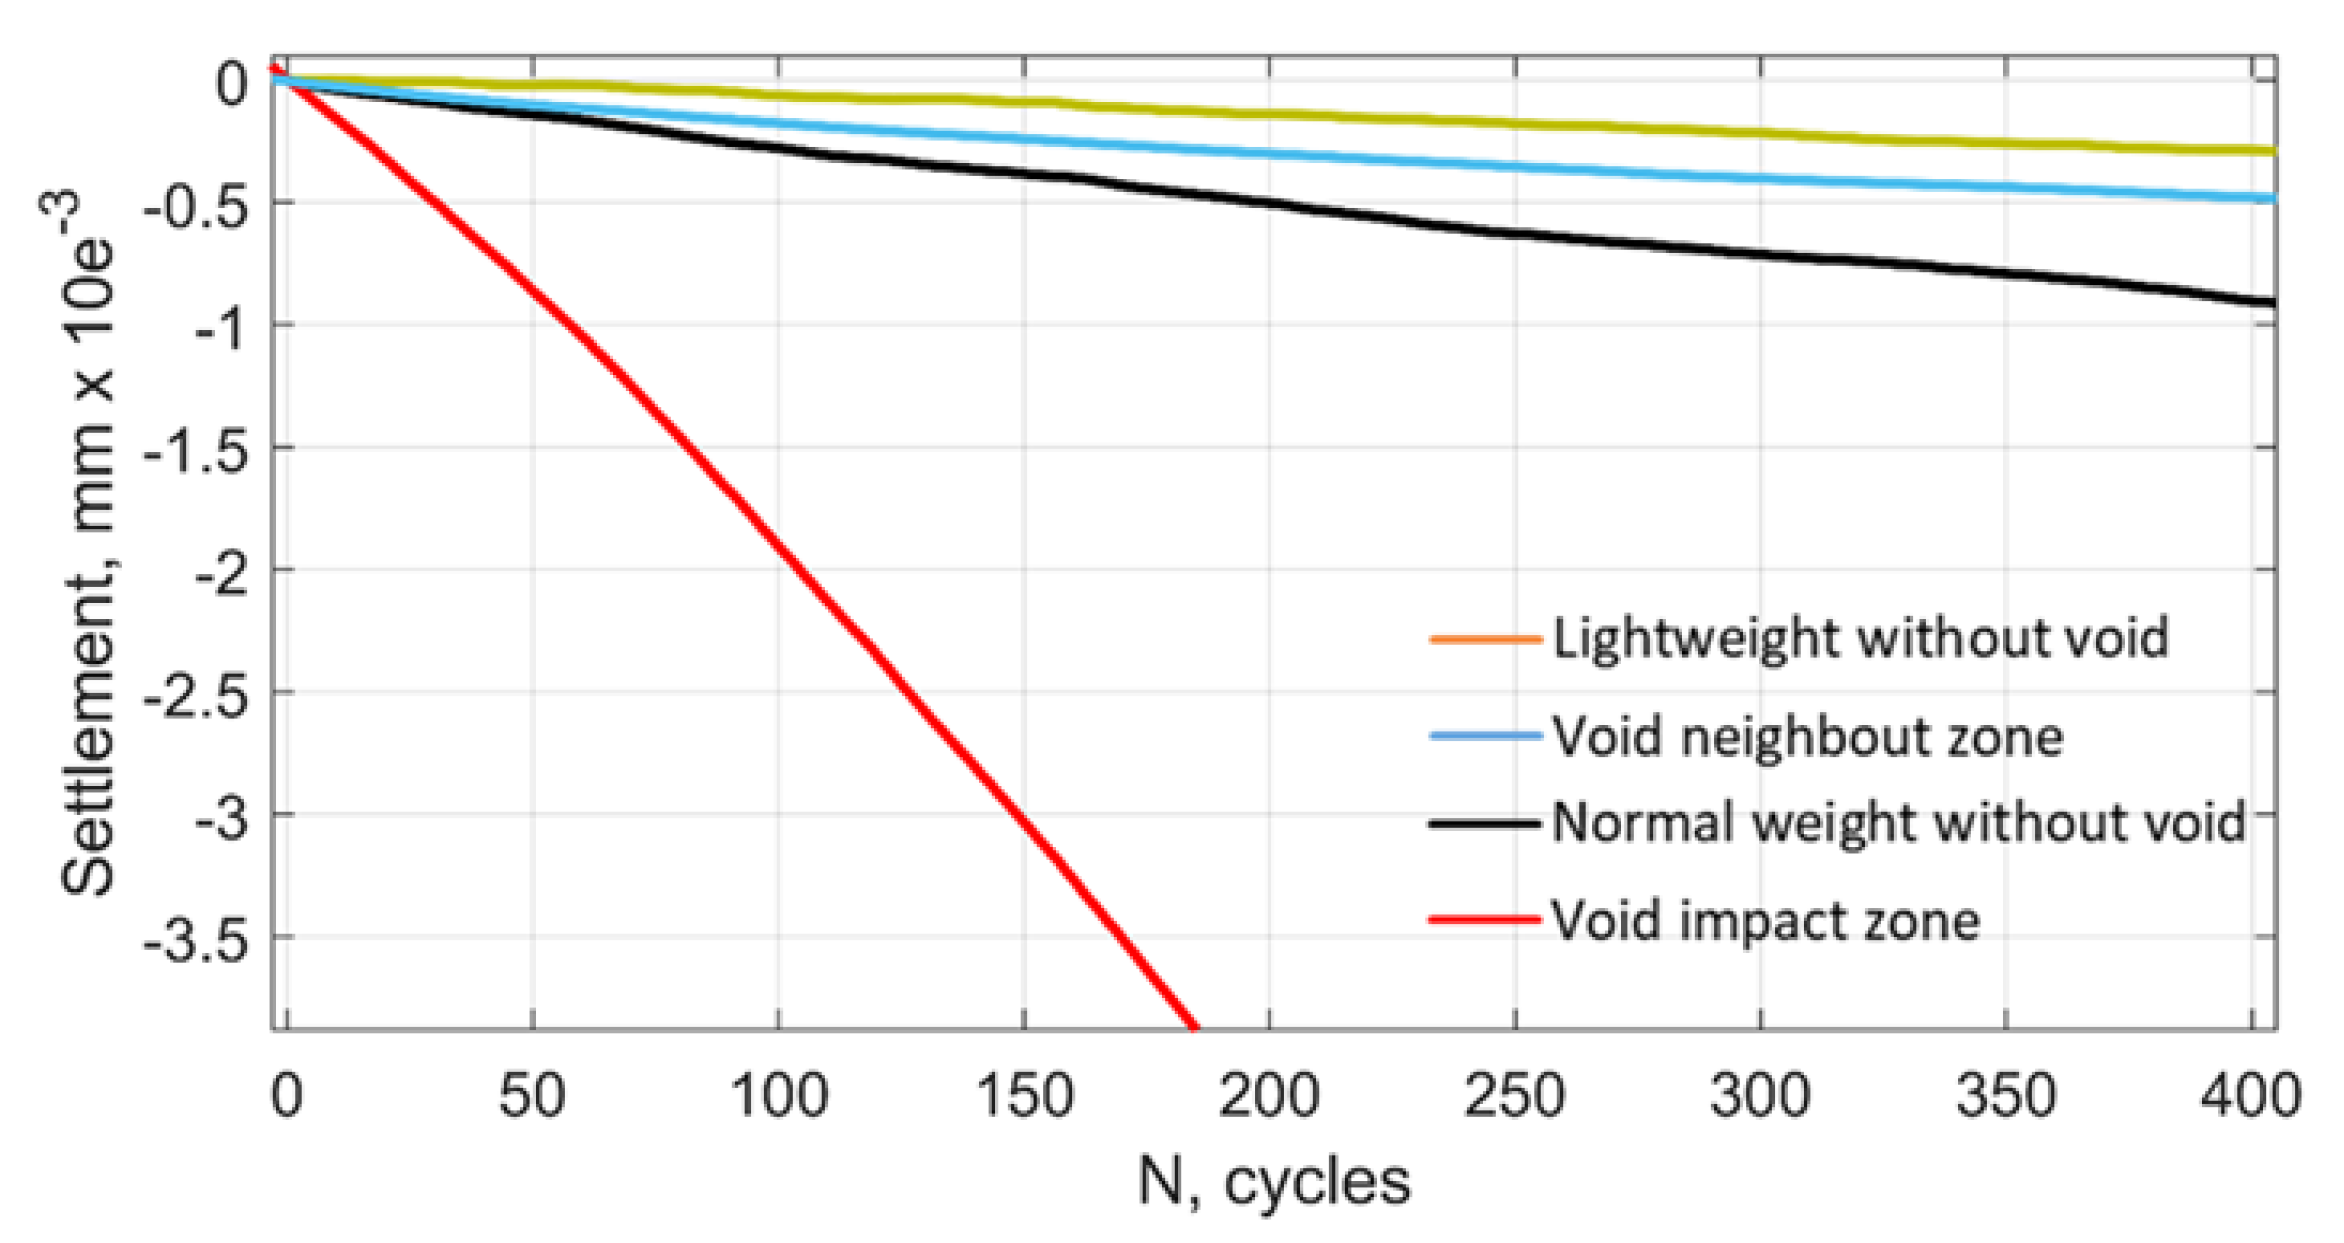
Before the modelling, the model particles were fully stabilised to provide possibly low nonstationary initial settlement. However, all simulation results had some accelerated initial settlements. Therefore, the modelling was produced in 600 loading cycles, but for the end linear part with 400 cycles was used for the analysis. The residual settlements are estimated using the upper envelope line of the sleeper deflections that corresponds to the ballast unloaded state. The results of the residual settlements for the loading cycles are presented in
Figure 19. The results show that the settlement intensity is about 0.72 mm/Mio axles for the lightweight trains and the track without voids and 2.27 mm/Mio axles for the normal-weight car. Thus, the settlement intensity increases more than 3 times upon the increase in the maximal loading of about 57%. The result does not contradict the relative empirical estimations of the ORE C161 [
61] and the AASHO Road Test that is used in some studies [
62] in railway research applications. Moreover, the results have a good agreement with the experimental studies [
63,
64].
The loading case for the lightweight rolling stock and the pre-stressed ballast on both sides of the void zone (
Figure 19, blue) shows a settlement intensity similar to that for case of the loading without void. However, the line has a long initial stabilisation phase, which usually appears because of a sudden increase in the loading. The similar intensity can be explained by the similar amplitude of the dynamic part of the loading. The settlement line for the void impact zone is quite outstanding from the other settlement cases. The settlement intensity is more than 8 times higher than for the normal-weight case despite lower loading maxima. Moreover, the settlement intensity seems to have some acceleration of the intensity. The previous studies on the influence of the dynamic loadings [
2,
65] show a wide range of the possible intensities with the maximal ones much higher than the present settlement intensity. However, the real cause of the intensity increase is not obvious due to the unknown influence of the full unloading state. The influence of both factors is the aim of further studies.
To explain the quick ballast settlements, the intermediate reasons are considered based on the analysis of the internal processes in the ballast layer, namely loading distribution from the sleeper to the subgrade.
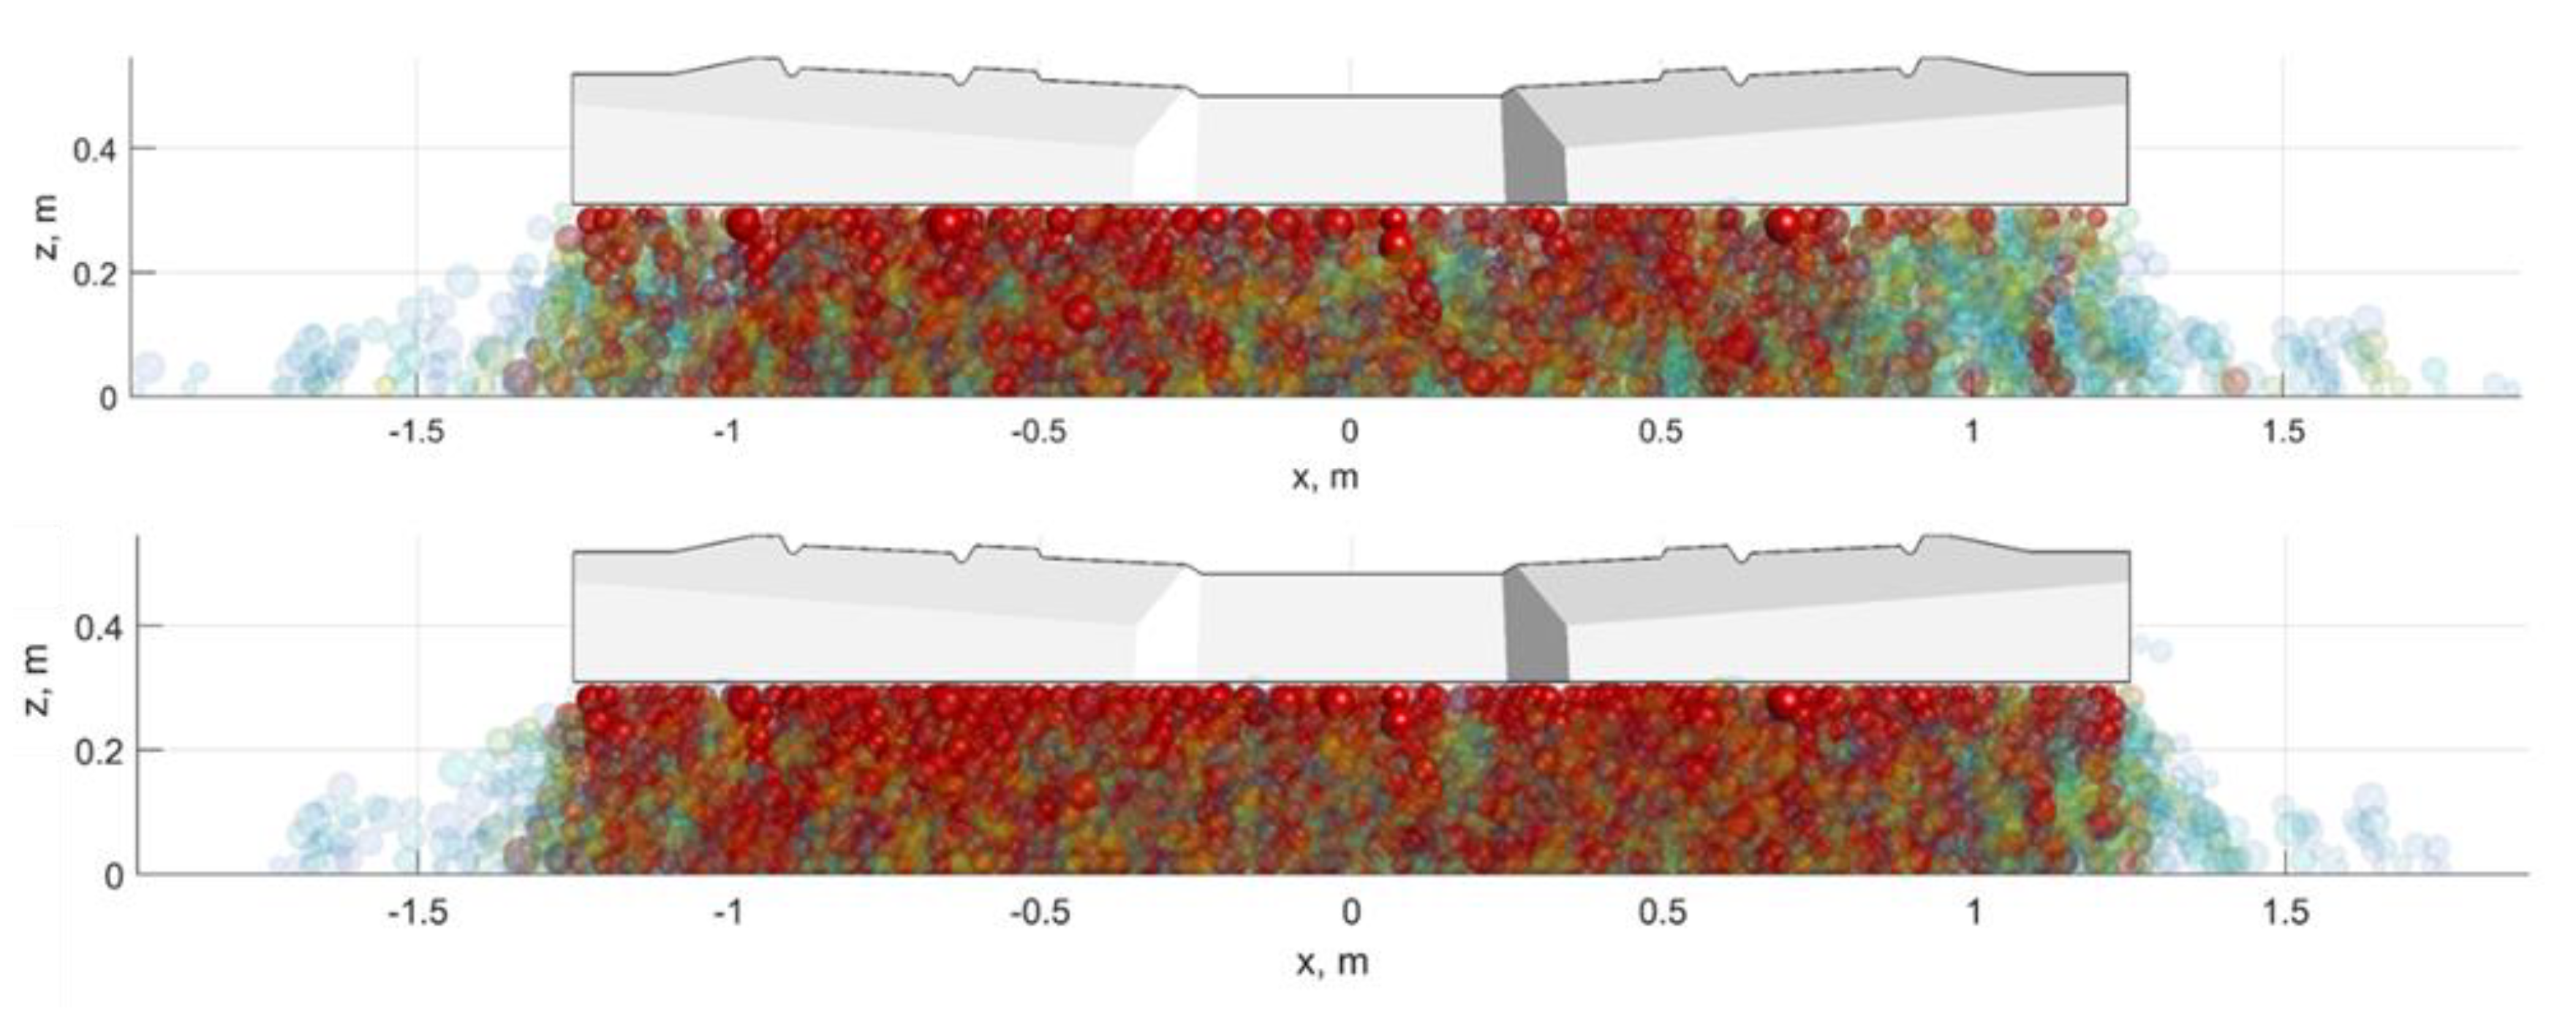
Figure 20 presents the maximal normal loading distribution in the ballast particles for one moment after full load cycles for two cases: the impact loading (
Figure 20, top) and the high pre-stressed state of the neighbour zone (
Figure 20, bottom). The particles are visualised in both transparency and colour from blue to red depending on the acting normal force. The particles with the normal force less than 5% of the maximal value are not visualised. The red zones of the particles could be interpreted as a good loading transmission from the sleeper to the subgrade. The normal force distribution for the impact case presents clear differences from the normal case under the sleeper ends: the number of high-loaded particles for the impact case is lower.
An analysis of the loading distribution along the sleeper is performed to produce a quantified estimation of the loading transmission from the sleeper to the subgrade.
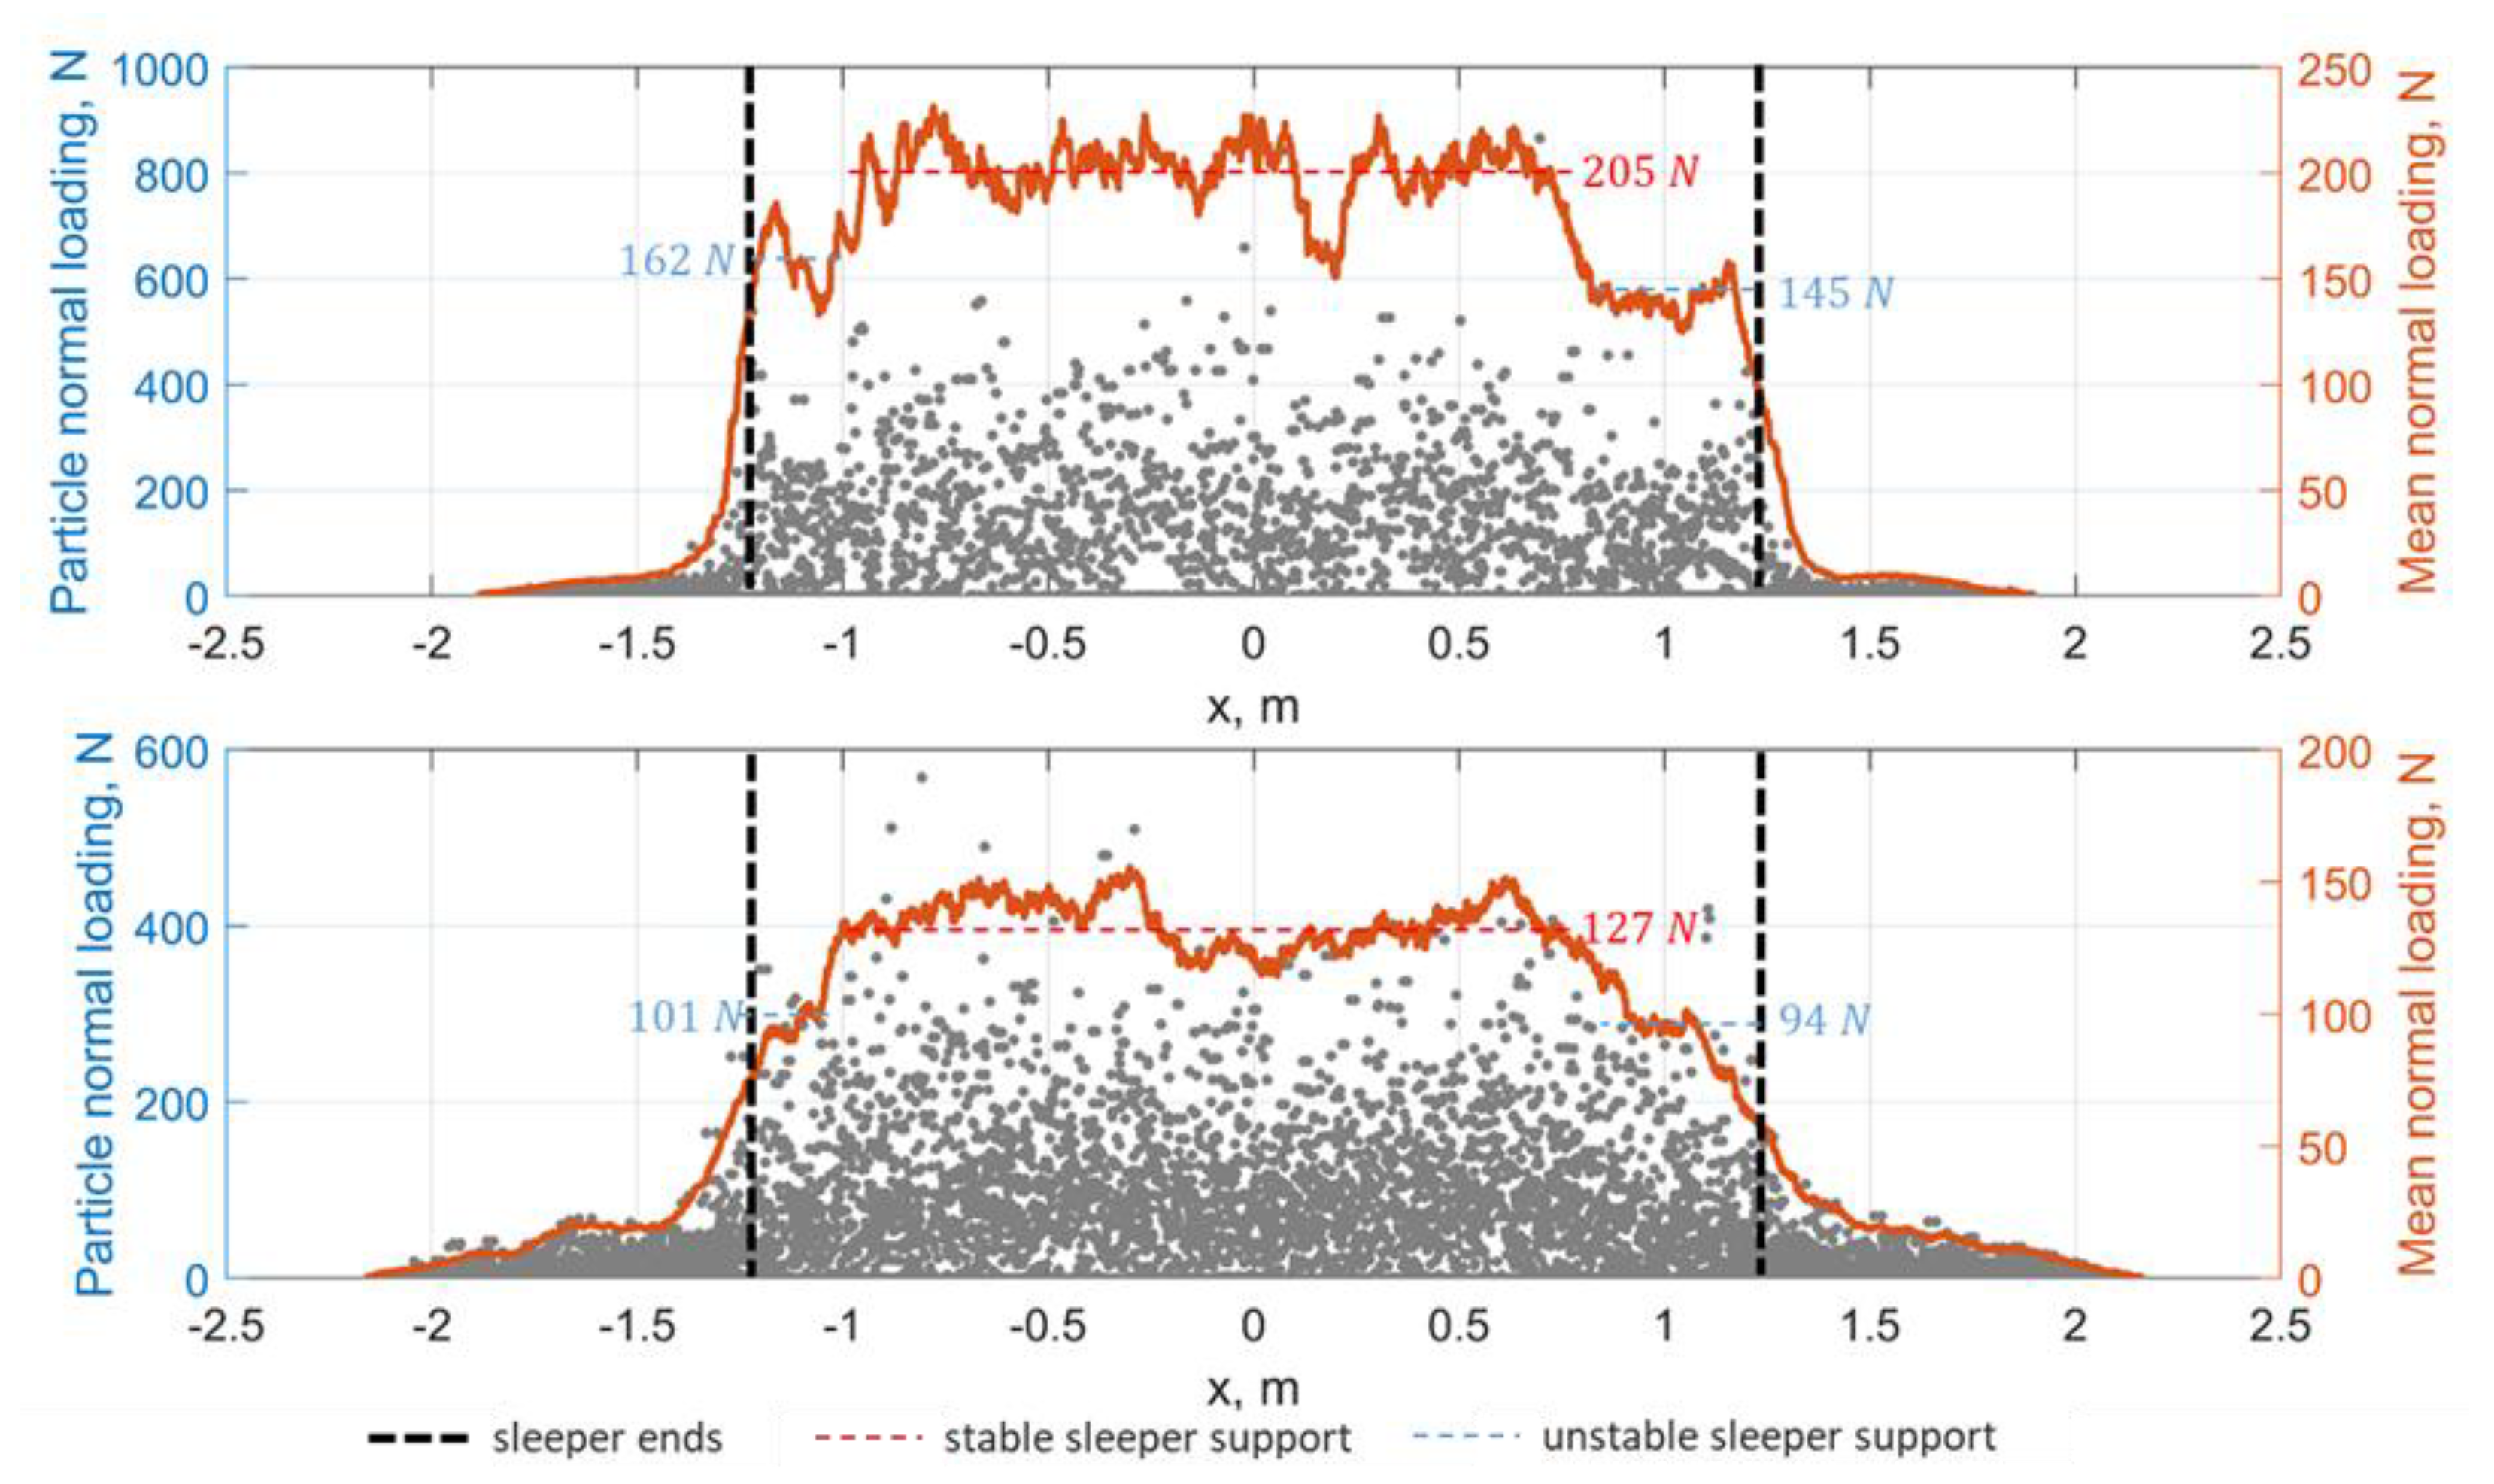
Figure 21 presents the normal loading distribution in the particles and its mean value along the sleeper x-axis for the zones under the sleeper (top) and under the ballast bed (bottom) after the quasistatic cycles. The mean normal loading diagrams are characterised by three zones:
The well-supported mean part of the sleeper with the mean loading of about 205 N/particle under the sleeper and about 127 N/particle over the subgrade;
The sleeper sides 0.25–0.5 m with the particle loading breakdown to 145–162 N/particle under the sleeper and about 94–101 N/particle over the subgrade;
Zones outside the sleeper that carry not more than 10% of the loading.
The loading breakdown under the sleeper ends is about 30% lower than that on the stable zone. The property of the ballast layer to carry, transmit and distribute the loading from the sleeper to the subgrade can be estimated with the particle loading ratio in the stable zones under the sleeper and under the ballast bed. The parameter loading transmission is 1.61 for the cyclic loading case with low settlement intensity.
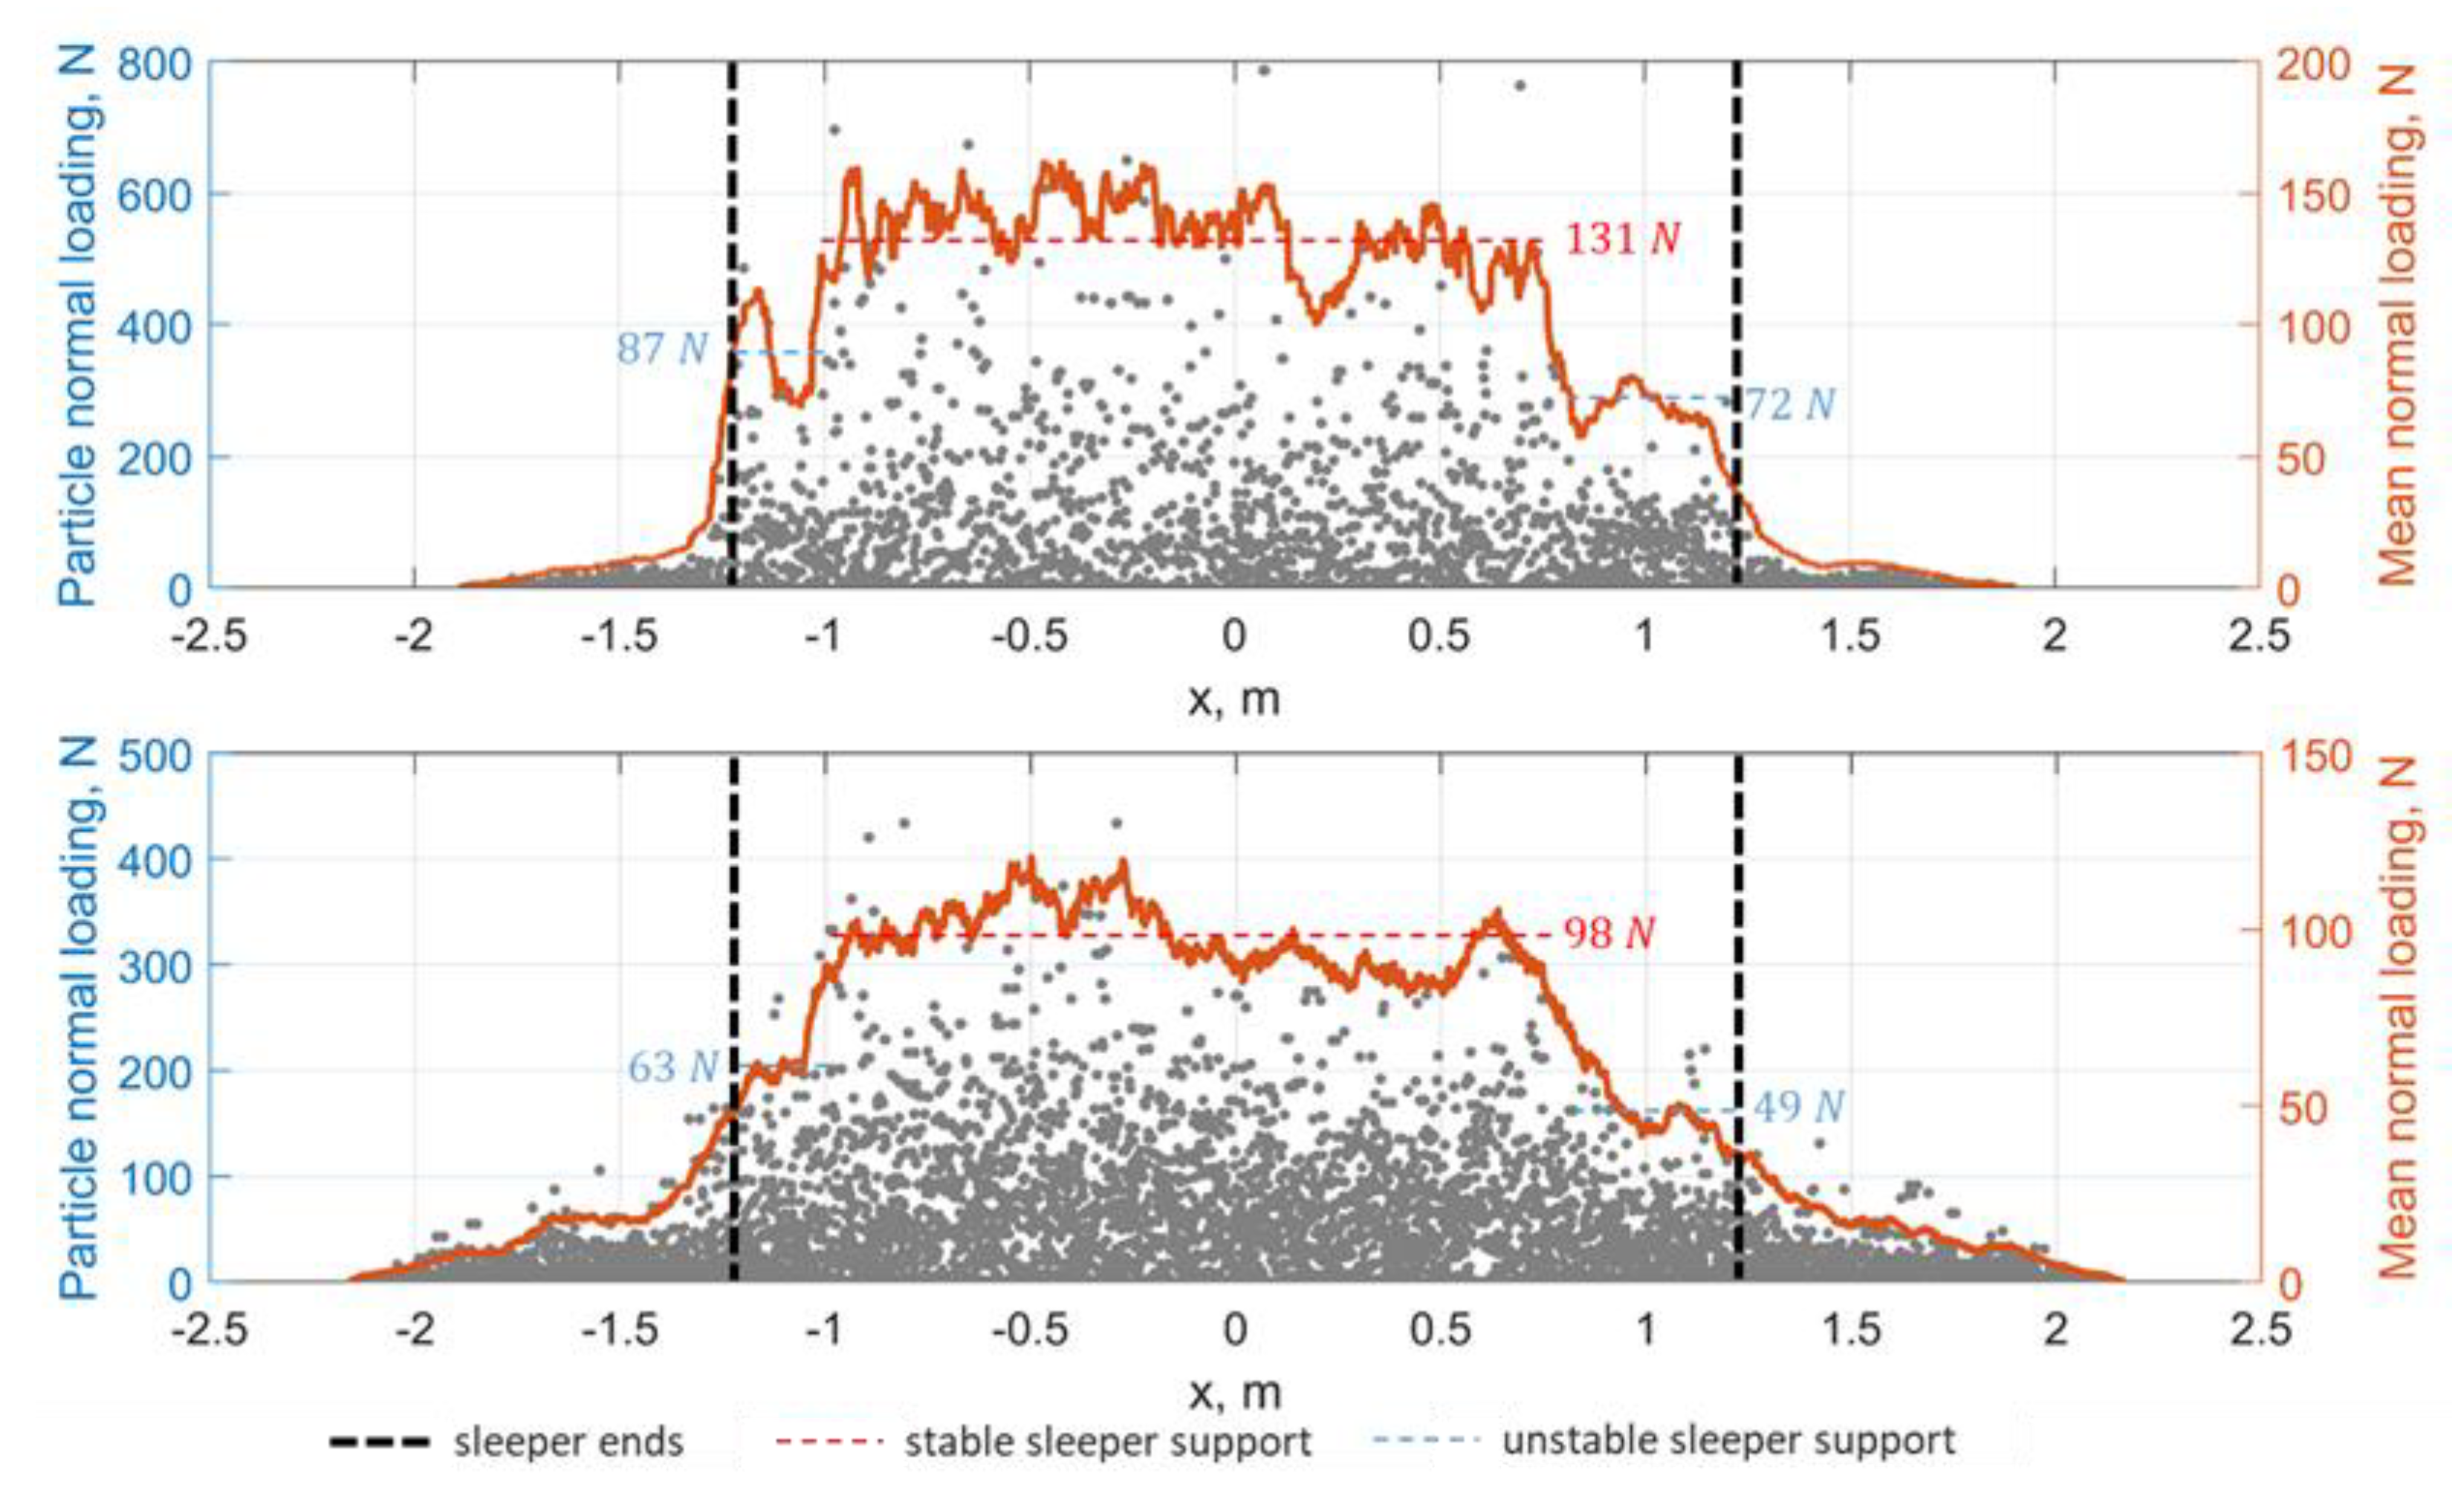
The analysis of the particle loading distribution for the impact case in
Figure 22 shows the different distributions in response to the quasistatic cyclic loading. Notable are the breakdown zones under the sleeper ends with the mean particle loadings 72–87 N/particle under the sleeper and 49–63 N/particle under the ballast bed. Thus, the loading breakdown is up to 50%. The parameter loading transmission is 1.33 for the impact loading case with the high settlement intensity. The parameters of the loading transmission can be interpreted as the angle of pressure distribution as was done in the other studies [
64,
66]. The angle of pressure distribution for the cyclic loading can be estimated as about 22°, and for the impact case—about 9°.
8. Discussion
The phenomenon of the intensive development of the unsupported sleeper zones has been known for a long time. However, the geometrical irregularity and wheel–track dynamic interaction are usually considered to be the reasons for the intensive settlement development. Most of the present theoretical studies, despite the complex models used, simply imitate the experimental measurements and do not consider the internal reasons for the dynamic interaction. The experimental studies usually do not analyse the dynamic impact in the ballast–sleeper contact.
The present experimental measurements and the simple numerical modelling of the dynamic interaction indicate the presence of the ballast impact even for low-velocity lightweight vehicles. Both results show that the impact occurs not directly under the wheel but before it with some time shift. Moreover, some minor dynamic interactions occur during the wheel leaving the void zone. Thereby, the wheel dynamic interaction is more than 50% lower than that of the sleeper. Thus, the main reason for the impact is the void closing.
The simulated loading patterns of the ballast present quite different processes for the different locations of the void zone. The loading in the impact location consists of the short impact, the following quasistatic part and the full unloading before the impact. On the other hand, the zones neighbouring to the void zone are characterised by a high pre-stress of the ballast and up to 2 times higher loading amplitudes compared to the track without void. The other zones in the void have low impact and a lower quasistatic load depending on the void sizes.
The study of void size influence on the dynamic interaction shows ambiguous relations. Different from a geometrical irregularity, the influence of the void depth on the dynamic interaction is such that the loadings increase until some depth and then should decrease until full unloading. Thus, the maximal impact values are present for some void depth.
The numerical simulation provides only an approximate imitation of the experimental measurement. It cannot explain the mechanism or the complex interrelations between the influencing factors and the impact loading. A simple analytical explanation is proposed by using the clamped beam as the basic model. The equation found for the sleeper impact velocity shows that it depends linearly on the train speed. It can explain why the low velocities cause high impacts. Thus, the dominating reason for the impact is not the wheel–track interaction but the rail quasistatic deflection rate. However, for high velocities, the resulting dynamic interaction could be a combination of both effects.
The DEM simulation of sleeper settlement under the main ballast loading patterns in the void zone shows almost no increase in the settlement intensity for the pre-stressed ballast despite the 30% increase in the maximal loadings. However, the impact loading case caused more than 8 times higher settlement intensity. The influence of the pre-stress and impact factors is the aim of further studies.
Thus, the phenomenon of settlement intensity increase for the case of impact loading has a relation to the property of the pressure distribution of the ballast layer and, first of all, the pressure breakdown zones under the sleeper ends. The growing zones can be explained by the reduction in the horizontal particle support of the ballast bed sides due to particle flow. The investigation of the further reason chain up to the root causes is the aim of further research.


