Article

Modeling the Compaction Characteristics of Fine-Grained Soils Blended with Tire-Derived Aggregates

1
School of Engineering, IT and Physical Sciences, Federation University, Churchill, VIC 3842, Australia
2
School of Engineering and Technology, Central Queensland University, Melbourne, VIC 3000, Australia
3
Department of Civil, Structural and Environmental Engineering, Trinity College Dublin, D02 PN40 Dublin, Ireland
*
Author to whom correspondence should be addressed.
Sustainability 2021, 13(14), 7737; https://doi.org/10.3390/su13147737
Submission received: 9 June 2021 / Revised: 7 July 2021 / Accepted: 8 July 2021 / Published: 11 July 2021

Abstract

:
This study aims at modeling the compaction characteristics of fine-grained soils blended with sand-sized (0.075–4.75 mm) recycled tire-derived aggregates (TDAs). Model development and calibration were performed using a large and diverse database of 100 soil–TDA compaction tests (with the TDA-to-soil dry mass ratio ≤ 30%) assembled from the literature. Following a comprehensive statistical analysis, it is demonstrated that the optimum moisture content (OMC) and maximum dry unit weight (MDUW) for soil–TDA blends (across different soil types, TDA particle sizes and compaction energy levels) can be expressed as universal power functions of the OMC and MDUW of the unamended soil, along with the soil to soil–TDA specific gravity ratio. Employing the Bland–Altman analysis, the 95% upper and lower (water content) agreement limits between the predicted and measured OMC values were, respectively, obtained as +1.09% and −1.23%, both of which can be considered negligible for practical applications. For the MDUW predictions, these limits were calculated as +0.67 and −0.71 kN/m3, which (like the OMC) can be deemed acceptable for prediction purposes. Having established the OMC and MDUW of the unamended fine-grained soil, the empirical models proposed in this study offer a practical procedure towards predicting the compaction characteristics of the soil–TDA blends without the hurdles of performing separate laboratory compaction tests, and thus can be employed in practice for preliminary design assessments and/or soil–TDA optimization studies.

1. Introduction

Lately, many developed and developing countries have initiated the transition to ‘sustainable infrastructure’, a concept that (among other things) encourages the replacement of natural quarry-based aggregates with recycled solid waste materials. End-of-life tires (ELTs) from the automotive industry are among the largest and most problematic global waste streams, prompting recycled tire-derived aggregates (TDAs) to become one of the most targeted materials for civil engineering applications. Because of their physical and mechanical attributes, particularly in terms of their relatively low density, high energy absorption capacity, resilience and low water adsorption–retention potential, granulated TDA-based products (e.g., crumbs, buffings and fibers) have been well established as effective soil-blending agents for the development of high-performance (and sustainable) geomaterials for a variety of practical geotechnical applications, such as soil stabilization, highway embankment and pavement constructions, as well as for bridge abutment and retaining wall backfills [1,2,3,4,5]. Further, Shahrokhi-Shahraki et al. [6] investigated the use of pulverized waste tire, either on its own or mixed with soil (well-graded sand), to act as an adsorptive fill material, demonstrating adsorption of organic/inorganic contaminants, namely benzene, toluene, ethylbenzene and xylene (BTEX) components, and two heavy metal ions (Pb2+ and Cu2+).
Research on soil–TDA mixtures dates back to the early 1990s, where theoretical concepts governing the mechanical performance of this (then-emerging) geomaterial were first put into perspective. Earlier investigations were mainly focused on coarse-grained soils (mainly sands), demonstrating that the granular soil–TDA blend, resembling a rigid–soft matrix, can be optimized in terms of the TDA content and its particle geometry (i.e., its mean particle size and shape) to achieve any desired balance between the strength/stiffness and deformability parameters of the TDA-based blend [7,8,9,10,11,12,13]. These early investigations unanimously concluded that the addition of TDA to coarse-grained soils leads to notable reductions in the soils’ mobilized strength and stiffness while enhancing their ductility characteristics, which was mainly ascribed to the lower stiffness (and higher deformability) of the soft TDA particles compared with that of the rigid soil grains. Furthermore, depending on the TDA content and its mean particle size (in relation to the rigid soil grains), the stress–strain response of a granular soil–TDA blend can fall into one of three behavioral categories [12,13]: (i) rigid-dominant; (ii) rigid–soft transitional; and (iii) soft-dominant. The transitional behavior (by definition) resembles a perfect balance between the blend’s strength/stiffness and ductility/toughness—a review of the research literature indicates that the transitional behavior is often encountered at a volumetric TDA content (commonly defined as the ‘TDA-to-granular soil + TDA’ volume ratio) of 30–50% [14].
Later studies followed suit, confirming the suitability of TDA-based products, particularly when paired with chemical binders, as effective blending agents for compacted fine-grained soils (including expansive clays) capable of promoting improved shear strength performance, reduced swell–shrink (and hence desiccation-induced cracking) potential and improved damping [15,16,17,18,19,20,21,22]. In terms of shear strength, for instance, these studies concluded that the addition of TDA at low TDA-to-fine-grained soil mass ratios (mainly less than 10%) often produces relatively small improvements, attributed to ‘arching’ between the TDA particles within the soil–TDA agglomerations [19,22] and induced ‘inter-particle friction’ generated at the soil–TDA interfaces [16]. These studies also demonstrate that higher TDA contents tend to cause serious concerns for undrained strength and stiffness, largely due to the relatively lower stiffness (and higher deformability) of the soil–TDA agglomerations compared to individual soil agglomerations containing no TDA [17,19]. Accordingly, for projects where the strength and stiffness are of primary importance, the compacted fine-grained soil–TDA blend requires stabilization by means of conventional cementitious (e.g., Portland cement and quick lime [15,18]) or polymer (e.g., polyacrylamide and sodium alginate [22,23]) binders.
Like natural (unamended) fine-grained soils, an essential step towards the production and placement of suitable soil–TDA earth fills is compaction. The governing variables which control the compactability of TDA-blended fine-grained soils have been well documented in the research literature. It is generally accepted that the addition of TDA to fine-grained soils leads to notable reductions in the optimum moisture content (OMC) and the corresponding maximum dry unit weight (MDUW), mainly attributed to the TDA material’s hydrophobic character (water adsorption being mainly less than 4%), relatively lower density and higher energy absorption capacity compared with that of the soil solids [24,25,26]. The OMC and MDUW parameters are commonly measured by standardized laboratory compaction tests which, though straightforward in terms of execution, are fairly labor-intensive and highly time-consuming. Accordingly, several attempts have been made to devise empirical-type correlations for indirect estimation of the OMC and MDUW of unamended fine-grained soils, all of which employ the soil consistency (Atterberg) limits as the primary predictors [27,28,29,30,31,32,33]. Common TDA-based products (e.g., crumbs, buffings and fibers) used in conjunction with fine-grained soils are mainly similar in size to predominantly medium–coarse sand (0.425–4.75 mm); as such, the soil consistency limit tests would not be applicable to most soil–TDA blends. This implies that the many well-established empirical correlations reported for indirect estimation of the OMC and MDUW of unamended fine-grained soils cannot be extended to soil–TDA blends; this limitation highlighting the need to develop an entirely new modeling framework.
A review of the research literature indicates that no modeling framework exists for the compaction characteristics of fine-grained soil–TDA blends. Accordingly, this study aims at establishing practical empirical models for indirect estimation of the OMC and MDUW of TDA-blended fine-grained soils. Model development and calibration are carried out using a large and diverse database of 100 soil–TDA compaction tests assembled from the research literature. The empirical models proposed in this study offer a practical procedure towards predicting the compaction characteristics of soil–TDA blends without the hurdles of performing separate laboratory compaction tests, and thus can be used for preliminary design assessments and/or soil–TDA optimization studies.

2. Database of Soil–TDA Compaction Tests

Given that empirical models/correlations are purely data-driven, their predictive capability is highly dependent on the database from which they are developed. Accordingly, to establish practical empirical models for the OMC and MDUW of soil–TDA blends, a large and diverse database of 100 soil–TDA compaction tests was gathered from the authors’ previous publications [19,22,23,34,35] as well as other recent literature sources [15,16,17,36,37,38,39]. Detailed descriptions of the assembled database are presented in Table 1 and Table 2. The compiled database consisted of 21 datasets (designated as D1–D21), each defined as a collection of standard or modified (heavy) Proctor compaction tests for a given fine-grained soil mixed with a particular TDA material (constant particle size/shape) at varying TDA contents (denoted as fT and defined as the TDA-to-soil dry mass ratio, here expressed as a percentage value).
As demonstrated in Table 1, the 21 datasets included a total of sixteen fine-grained soils (designated as S1–S16), covering reasonably wide ranges of surface texture, plasticity and mineralogical properties—that is, fclay = 37–70%, LL = 34.2−84.3% and A = PI/fclay = 0.15–1.30 (where fclay, LL, PI and A denote clay content, liquid limit, plasticity index and activity index, respectively). In terms of classification, the database soils consisted of three silts and thirteen clays with the following USCS frequencies, as per BS 5930 [40]: ML = 1; MH = 1; MV = 1; CI = 4; CH = 6; and CV = 3. Referring to Table 2; the compiled database covers all major types of commercially available poorly-graded sand-sized (i.e., SP classification) TDA products (e.g., powder, crumbs and buffings), with the TDA mean particle size (or D50) ranging between 0.46 and 3.34 mm. Furthermore, in terms of mix design, the TDA content varied between 2.5% and 30% (the latter considered to be the highest possible whilst still maintaining mixture homogeneity), and each of the 21 datasets, in addition to the unamended soil (fT = 0), included a minimum of three compaction test data for three different TDA contents. It should be mentioned that the experimental OMC values ranged between 12.4% and 28.0% water content, with the complete results of the compaction tests presented in Figure A1 of the Appendix A.

3. Governing Mechanisms Controlling the Compactability of Soil–TDA Blends

It is generally accepted that the addition of (and content increase in) TDA, with constant particle size/shape, leads to a ‘leftward–downward’ translation of the soil compaction curve (for a given compactive effort), causing notable reductions in the OMC and MDUW parameters [24,25,26]. The TDA material’s lower specific gravity (or density) compared with that of the soil solids has been reported to be the primary factor responsible for decreasing the MDUW [15]. For the compiled soil–TDA database used in this investigation (see Table 1 and Table 2), the TDA-to-soil specific gravity ratio (i.e., G s T / G s S ) was found to range between 0.31 and 0.44. Moreover, some researchers have postulated that, because of their high energy absorption capacity (attributed to their high elasticity), the compacted TDA particles may progressively recover their initial uncompacted shapes through a so-called ‘elastic-rebound’ recovery mechanism, thereby offsetting the efficiency of the imparted compactive effort, also contributing towards decreasing the MDUW [17,34,41]. The reductions reported for the OMC have been mainly ascribed to the TDA material’s hydrophobic character and hence its lower water adsorption–retention capacity (being mainly less than 4%) compared with that of the fine soil particles, particularly clays [16]. It should be mentioned that, while the reported results for the MDUW are fairly consistent, a limited number of studies have reported either negligible or increasing trends for the OMC with respect to increasing the TDA content [42,43,44]. These unexpected trends may be attributed to TDA segregation (and hence TDA clustering) effects caused by inadequate soil–TDA mixing during sample preparation for the compaction test [19,39]. As such, in compiling our database for the present investigation, it was decided to include only those datasets which are consistent with the more unanimous ‘OMC-decreasing’ trend.
It is well accepted that the MDUW and OMC for unamended fine-grained soils (irrespective of compactive effort) are strongly correlated, following a unique ‘path of optimums’ somewhat parallel to the standard zero-air-voids (ZAV) saturation line (commonly obtained for a typical specific gravity of 2.65 for the soil solids) [27,29,31]. For instance, in their investigation, Gurtug and Sridharan [27] reported the following ‘path of optimums’ relationships based on a database of 181 compaction tests (with OMC water contents ranging wopt = 7.4–49.0%) involving a variety of ‘unamended’ fine-grained soils tested at four different compaction energy levels (i.e., reduced, standard, reduced modified and modified Proctor): (i) γdmax = −0.28 wopt + 22.26 (with R2 = 0.941); and (ii) γdmax = 23.68 exp[ −0.018 wopt] (with R2 = 0.960), where γdmax is the deduced MDUW value. Figure 1a illustrates the variations of MDUW against OMC for the compiled database of 100 soil–TDA compaction tests (data values presented in Figure A1). As is evident from this figure, the data points are significantly scattered, indicating that the MDUW and OMC are poorly correlated for the investigated soil–TDA blends. For unamended fine-grained soils, an increase in the coarse fraction (>75 μm) leads to an ‘upward–leftward’ translation of the compaction curve, with the optimum (peak) point translating along the previously described universal ‘path of optimums’. For soil–TDA blends, however, an increase in TDA content (0.075–4.75 mm particle size range), which is essentially similar to increasing the soil coarse fraction, results in a ‘downward–leftward’ translation of the optimum point, implying that soil–TDA blends do not conform to the general ‘path of optimums’ correlation framework. This discrepancy can be attributed to the significant mismatch in density (and hence specific gravity) between the soil solids and TDA particles, allowing one to postulate that the lower MDUW values obtained for soil–TDA blends may not necessarily reflect their lower compactability potential. To achieve a more familiar visualization of the compaction characteristics of soil–TDA blends, consistent with the traditional soil compaction framework (for unamended soils), the conventional OMC and MDUW parameters, wopt and γdmax, should be ‘normalized’ as follows [19]:
w opt * = w opt G s ST G s S
γ dmax * = γ dmax G s S G s ST
where w opt * and γ dmax * = normalized OMC and MDUW parameters, respectively; and G s S and G s ST = specific gravity of soil solids (values presented in Table 1) and soil–TDA mixture (values presented in Table A1 of the Appendix A), respectively.
It should be mentioned that the soil–TDA mixture specific gravity G s ST , which decreases with increasing the TDA content (i.e., G s ST   ~  fT−1, as demonstrated in Table A1), was obtained as follows [34,45]:
G s ST = G s S G s T M S + M T G s S M T + G s T M S = G s S G s T 1 + f T G s S f T + G s T
where G s T = specific gravity of TDA particles (values presented in Table 2); MS and MT = mass of oven-dried soil and TDA, respectively; and fT = TDA content, defined as the TDA-to-soil dry mass ratio (or MT/MS).
Figure 1b illustrates the variations of γ dmax * against w opt * for the compiled database. As is evident from this figure, the normalized MDUW and OMC, in addition to showcasing a strong correlation, conform to the general ‘path of optimums’ framework described earlier for unamended fine-grained soils. As a typical example, exponential-fitting of the normalized compaction data resulted in γ dmax * = 23.44 exp[ −0.017 w opt * ] (with R2 = 0.818) for fT ≤ 30%, which is essentially identical to γdmaxwopt relationships previously reported for unamended fine-grained soils by Gurtug and Sridharan [27] and Sivrikaya et al. [29].

4. Results and Discussion

4.1. Modeling Premise

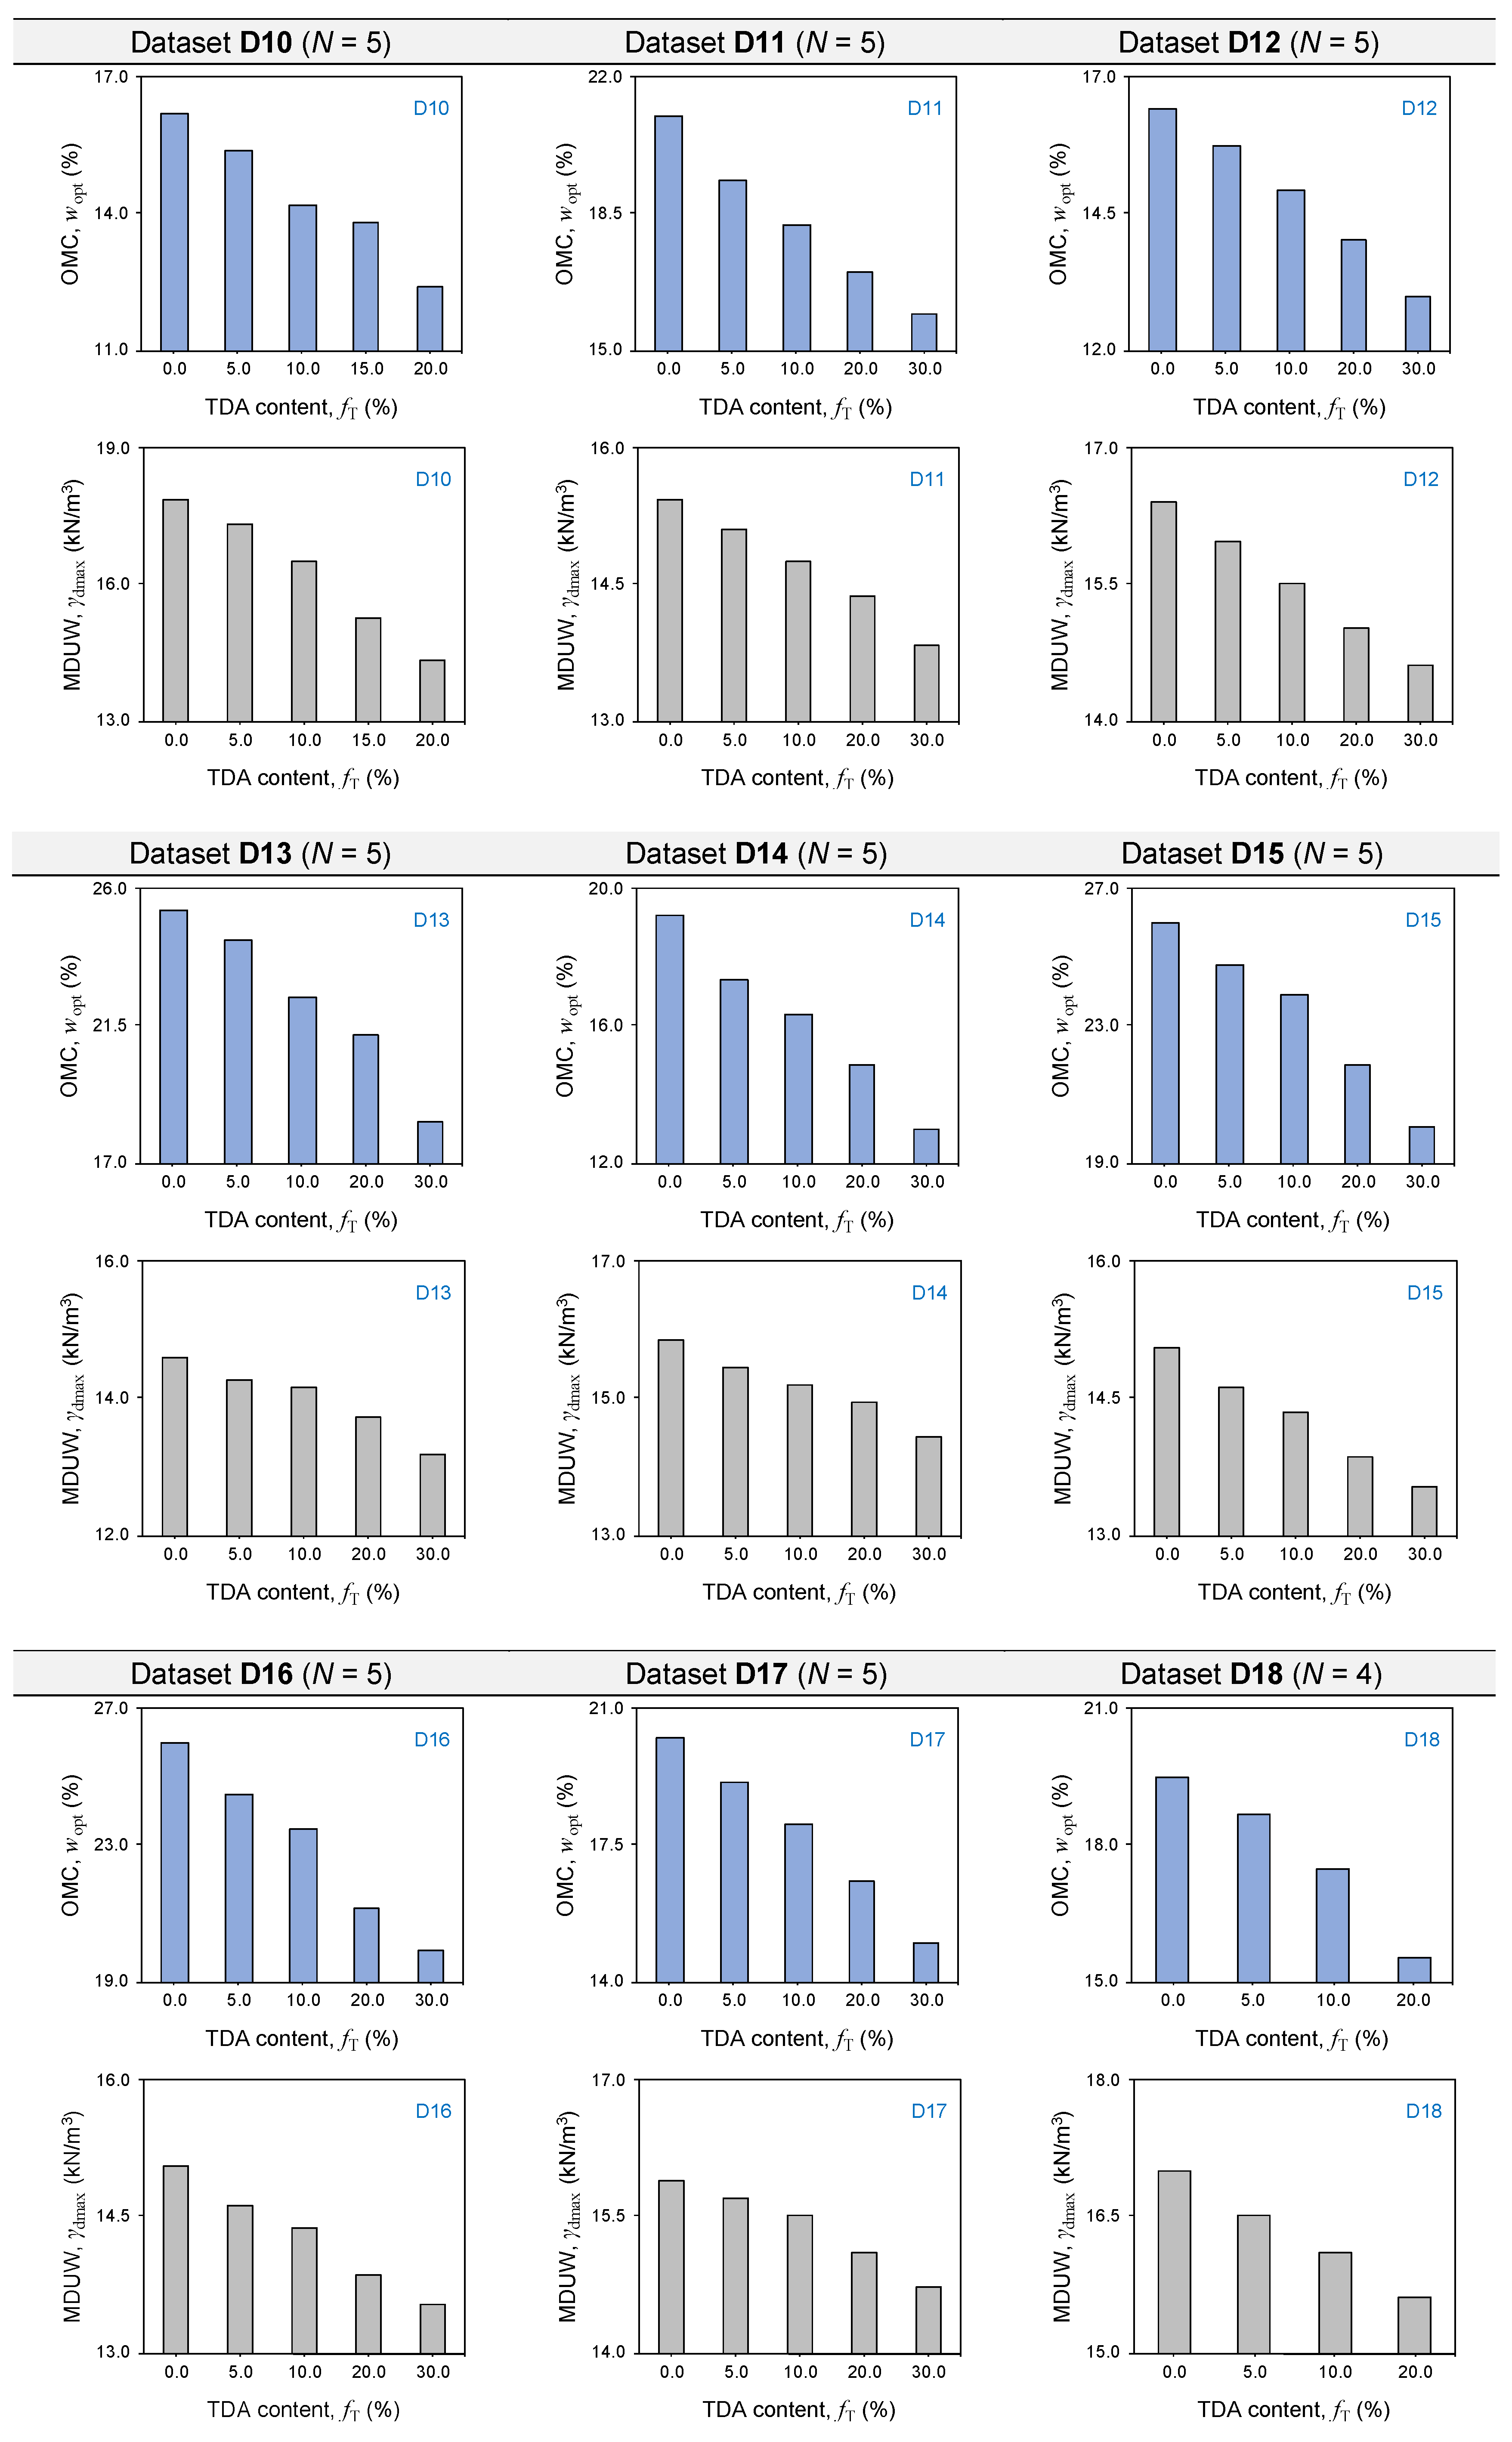
Following a comprehensive trial-and-error investigation employing the 21 soil–TDA compaction datasets (see Table A1 and Figure A1), it was observed that, for a given fine-grained soil mixed with a particular TDA material (constant particle size/shape), the conventional OMC and MDUW parameters (for the standard or modified Proctor energy level) can be expressed as follows:
w opt ST = w opt S G s S G s ST β M
γ dmax ST = γ dmax S G s S G s ST β D
where w opt ST and γ dmax ST = conventional OMC and MDUW for the soil–TDA mixture, respectively; w opt S and γ dmax S = intercept parameters for fT = 0 (in % and kN/m3, respectively); and βM and βD = reduction rate parameters (both < 0).
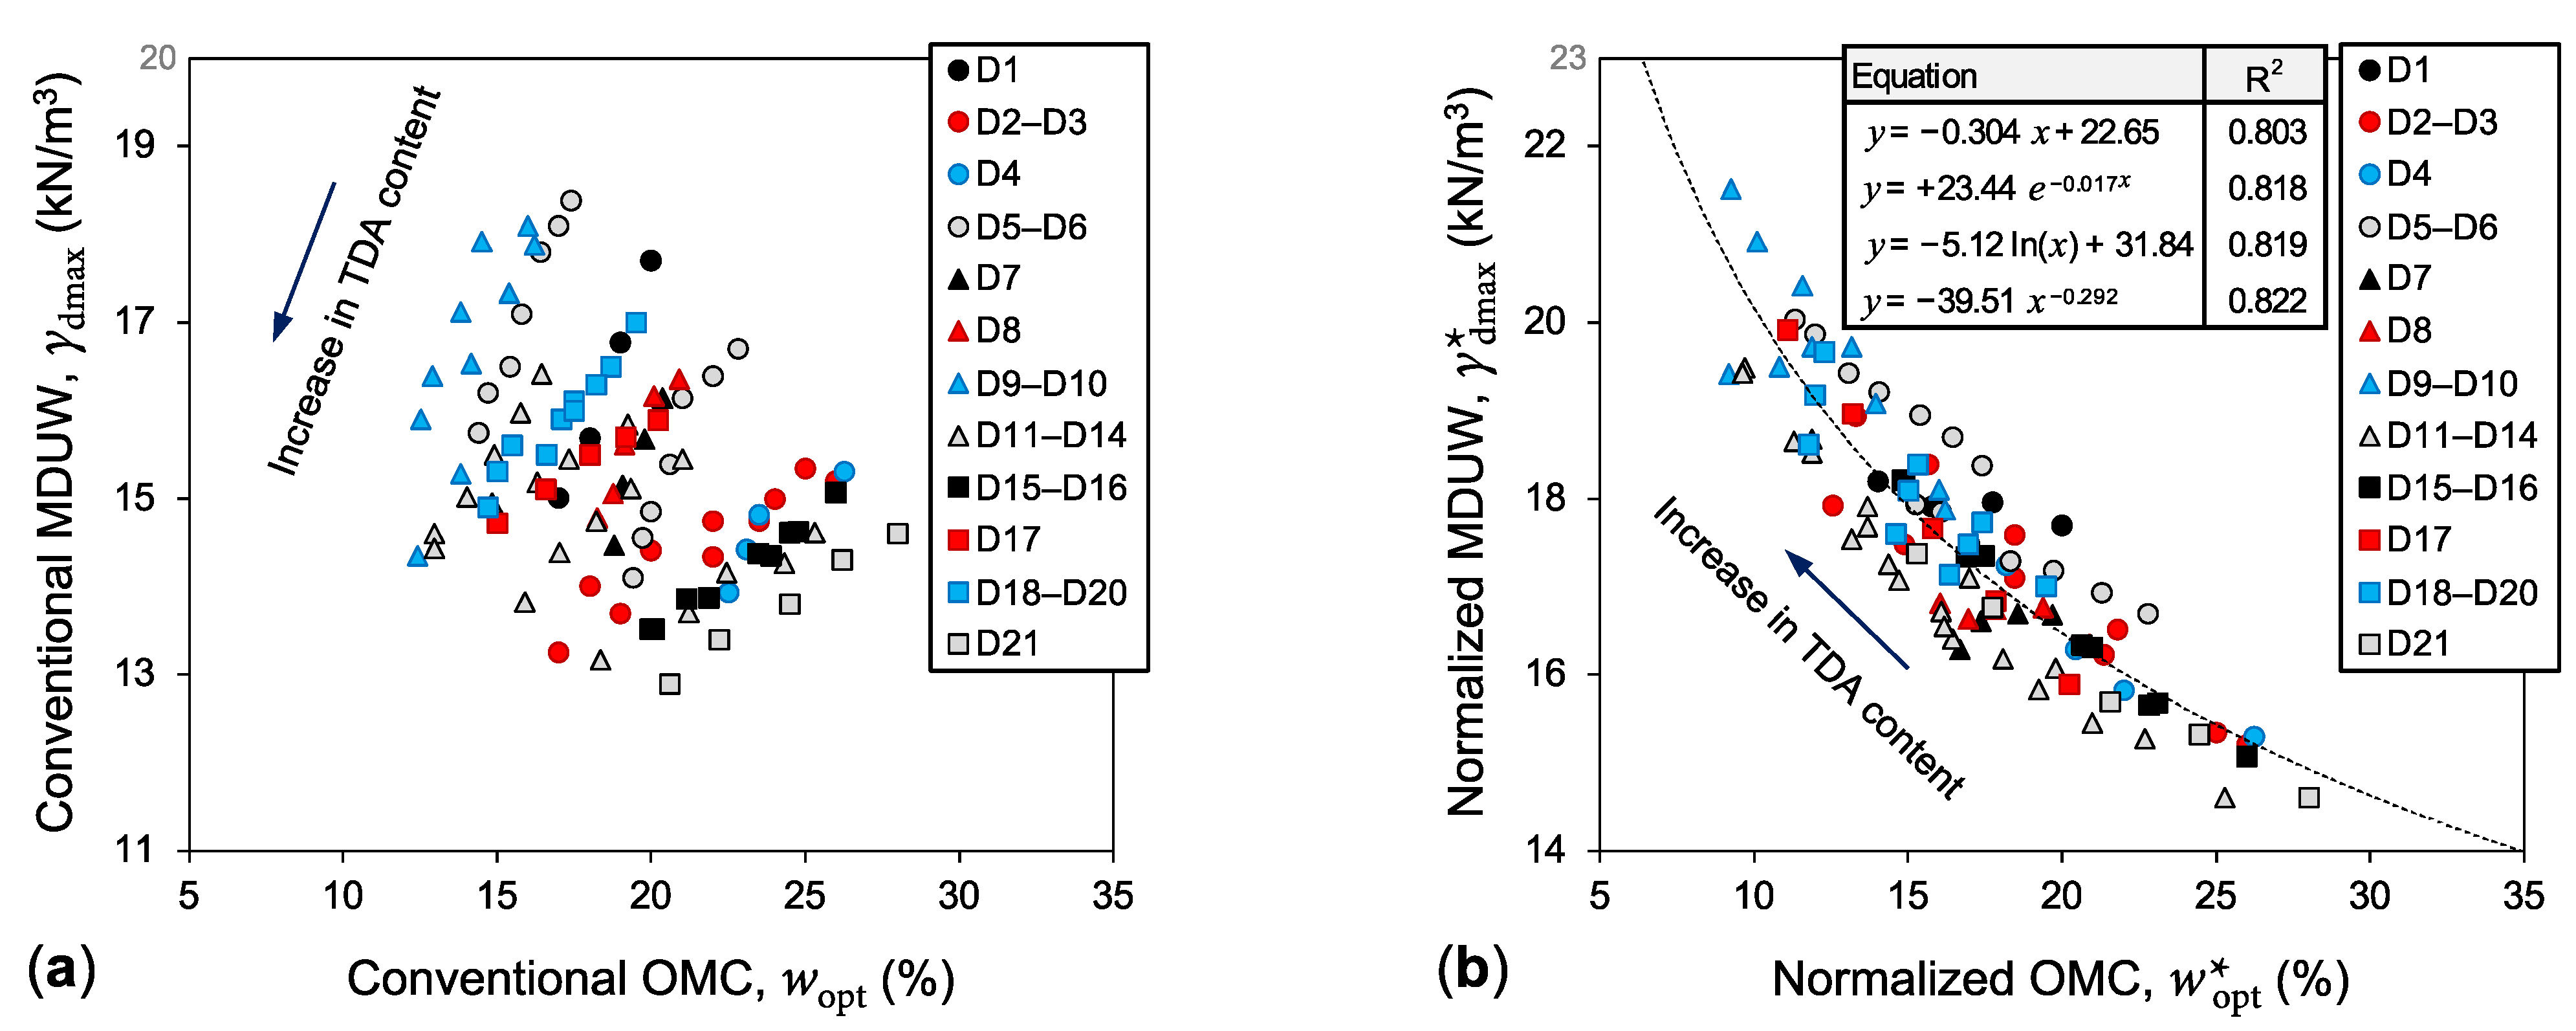
The dependent/input variable G s S / G s ST selected for model development captures the combined effects of TDA content and TDA specific gravity; the latter well-established to vary (i.e., 0.85–1.14 for the present investigation, as outlined in Table 2) depending on the source-tire composition, the adopted tire recycling process, and the TDA particle size/shape [24,26]. The intercept parameters w opt S and γ dmax S represent the OMC and MDUW of the unamended soil, since setting fT = 0 in Equation (3) results in G s ST = G s S . Note that these intercept parameters can be either fixed based on measured values or set as independent fitting parameters. Further, since the soil–TDA mixture specific gravity decreases with increasing the TDA content (i.e., G s ST   ~  fT−1 and hence G s S / G s ST   ~  fT; see Table A1), the parameters βM and βD (which are both negative) represent the rates of reduction in the OMC and MDUW, respectively, in relation to increasing the TDA content.
It should be mentioned that the trial-and-error investigation performed by the authors and leading to the proposal of Equations (4) and (5) involved applying various functional expressions (i.e., linear, logarithmic, polynomial, exponential and power) to the 21 soil–TDA compaction datasets and then cross-checking their predictive performances using routine fit-measure indices; namely, the mean absolute percentage error (MAPE) and the normalized root-mean-squared error (NRMSE), which were calculated as follows [46]:
MAPE = 1 N n = 1 N y n y ^ n y n × 100 %
NRMSE = RMSE y n ¯ × 100 %
RMSE = 1 N n = 1 N y n y ^ n 2
where RMSE = root-mean-squared error (in the same unit as OMC or MDUW); yn = measured variable (OMC or MDUW); y ^ n = predicted variable (OMC or MDUW); y n ¯ = arithmetic mean of yn data; and N = number of observations (or compaction tests) in each dataset, as reported in Table 1.
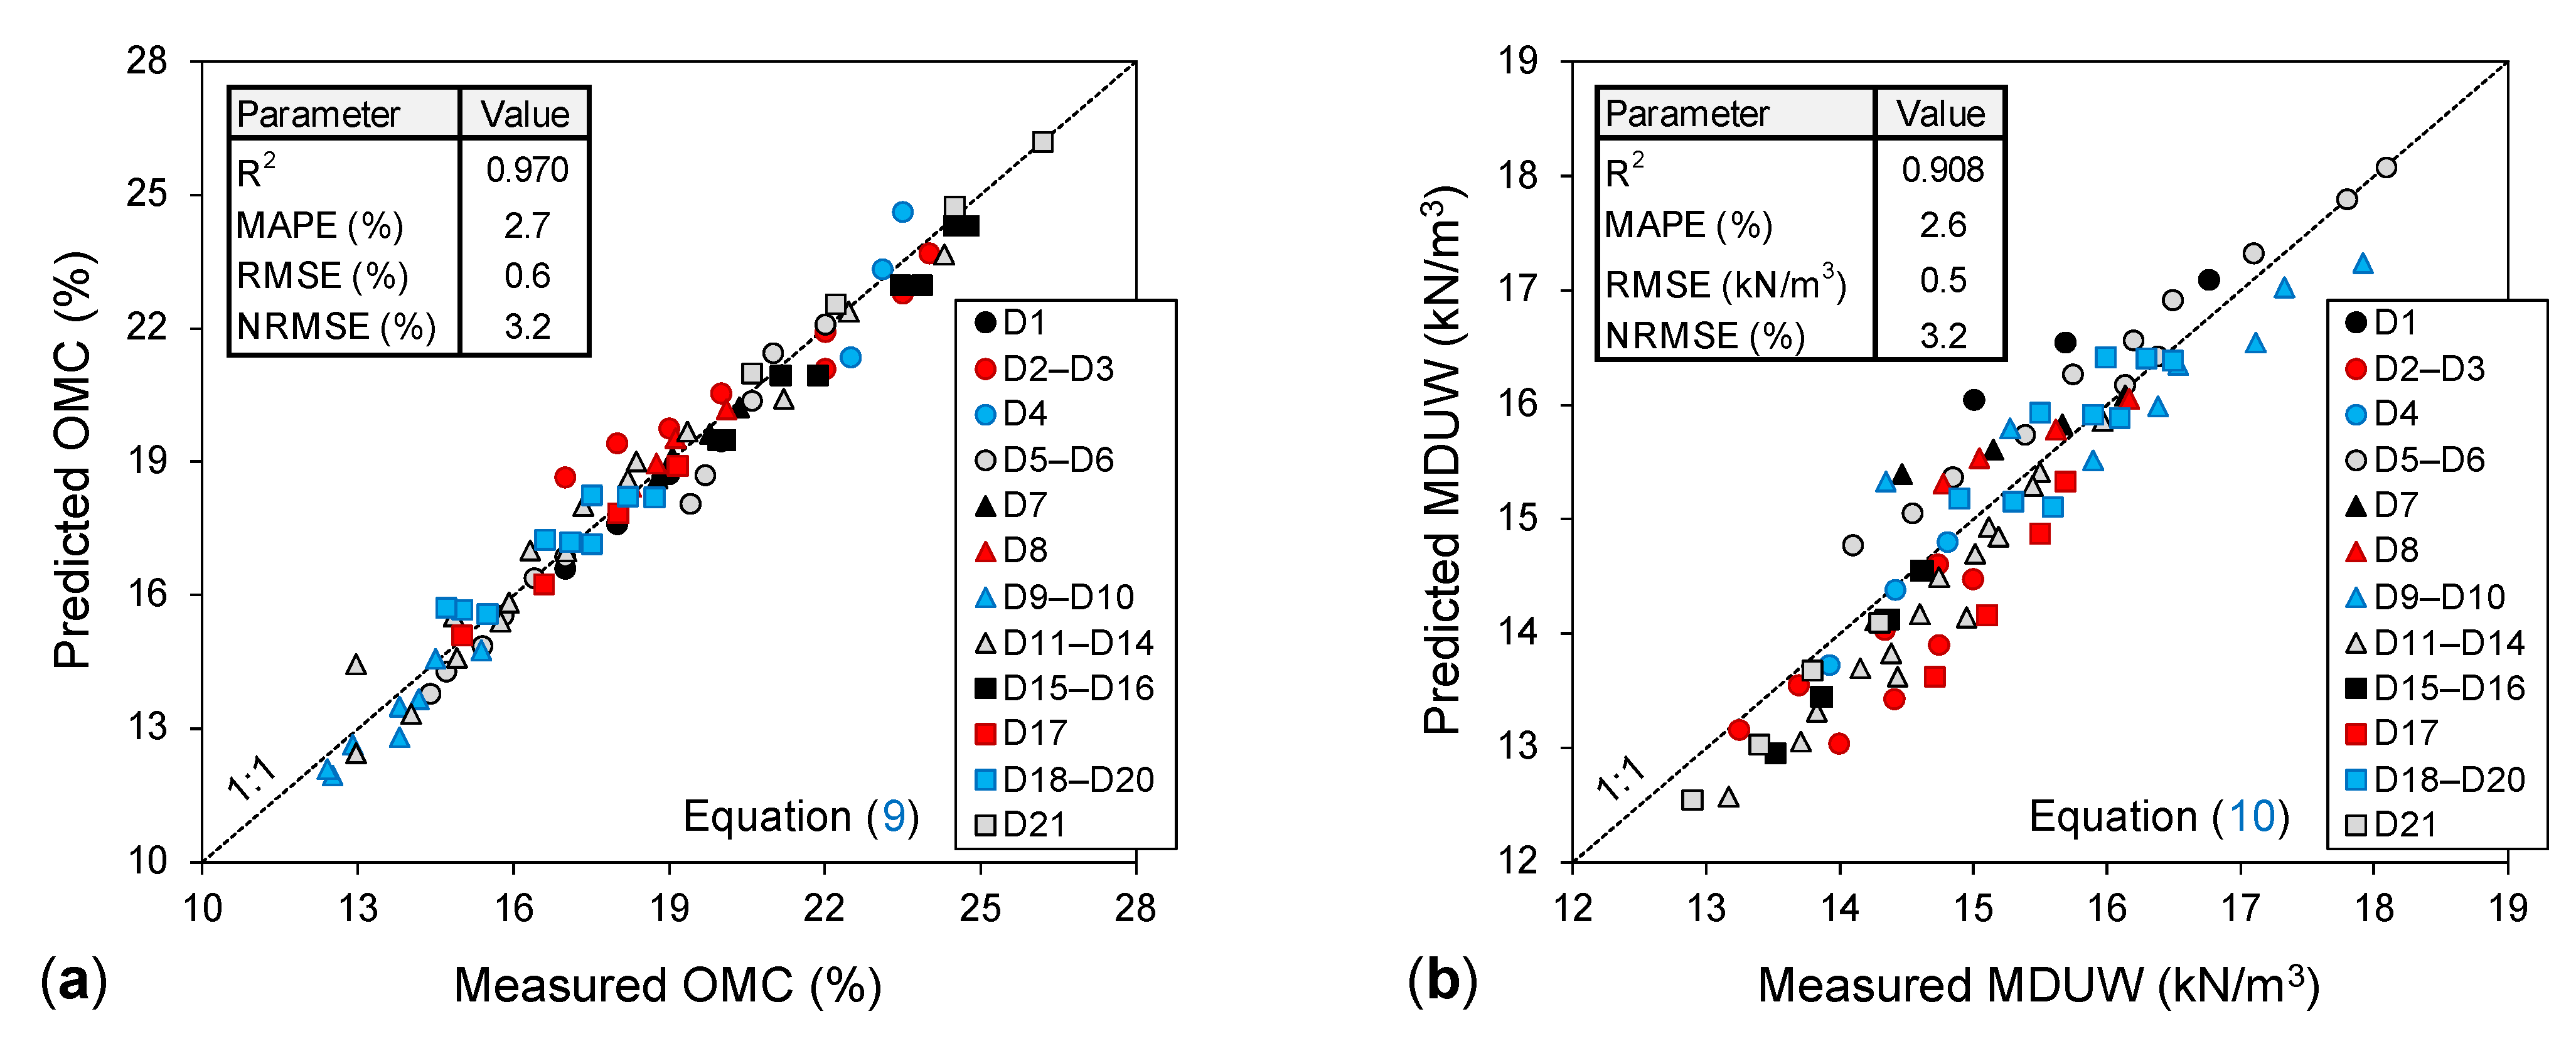
The regression analysis outputs with respect to Equations (4) and (5) (with w opt S and γ dmax S set as independent fitting parameters) are presented in Table 3 and Table 4, respectively. Judging by the high R2 (with median values of 0.989 and 0.987 for the OMC and MDUW predictions, respectively) and the low MAPE or NRMSE (unanimously less than 4%) values, the functional expressions proposed in Equations (4) and (5) can be deemed acceptable. Quite clearly, to employ Equations (4) and (5) for routine prediction purposes, the fitting parameters βM and βD should be calibrated. In view of their definitions, the intercept parameters w opt S and γ dmax S can be simply fixed based on the measured OMC and MDUW of the unamended soil (fT = 0). Provided that the reduction rate parameters βM and βD can be practically calibrated without the need for obtaining any specific soil–TDA compaction test data, it would follow that, having established the OMC and MDUW of an unamended fine-grained soil (along with the soil and TDA specific gravities; the latter often provided by the TDA manufacturer), one can predict the OMC and MDUW of the same soil mixed with any specified TDA content. The following sections describe practical calibration frameworks for obtaining βM and βD.

4.2. Predictive Models Employing Mean Reduction Rate Parameters

Figure 2a,b illustrates the variations of βM and βD for the 21 soil–TDA compaction datasets, respectively. In terms of absolute magnitude, βM was found to be consistently greater than its βD counterpart, indicating that the rate of OMC reduction with respect to increasing TDA content is greater than that of the MDUW. Judging by the low standard deviation (SD) for βM and βD (computed as 0.187 and 0.218, respectively), as well as the relatively small vertical distance between their upper and lower variation boundaries (see ‘UB’ and ‘LB’ in Figure 2), it may be possible to achieve reliable OMC and MDUW predictions (across different fine-grained soil types, TDA particle sizes/shapes and compaction energy levels) by adopting mean values for the βM and βD parameters. To examine this hypothesis, the arithmetic means for the 21 βM and βD values were calculated (i.e., β M ¯ = −0.967 and β D ¯ = −0.509, as outlined in Figure 2), and appointed to Equations (4) and (5), resulting in the following new relationships:
w opt ST = w opt S G s S G s ST 0.967
γ dmax ST = γ dmax S G s S G s ST 0.509
Scatter plots illustrating the variations of predicted (by Equations (9) and (10)) against measured OMC and MDUW values are presented in Figure 3a,b, respectively. As is evident from these figures, the predicted and measured values, particularly for the OMC, are strongly correlated with each other. The R2, MAPE and NRMSE associated with these predictions were, respectively, calculated as 0.970, 2.7% and 3.2% for the OMC, and 0.908, 2.6% and 3.2% for the MDUW.
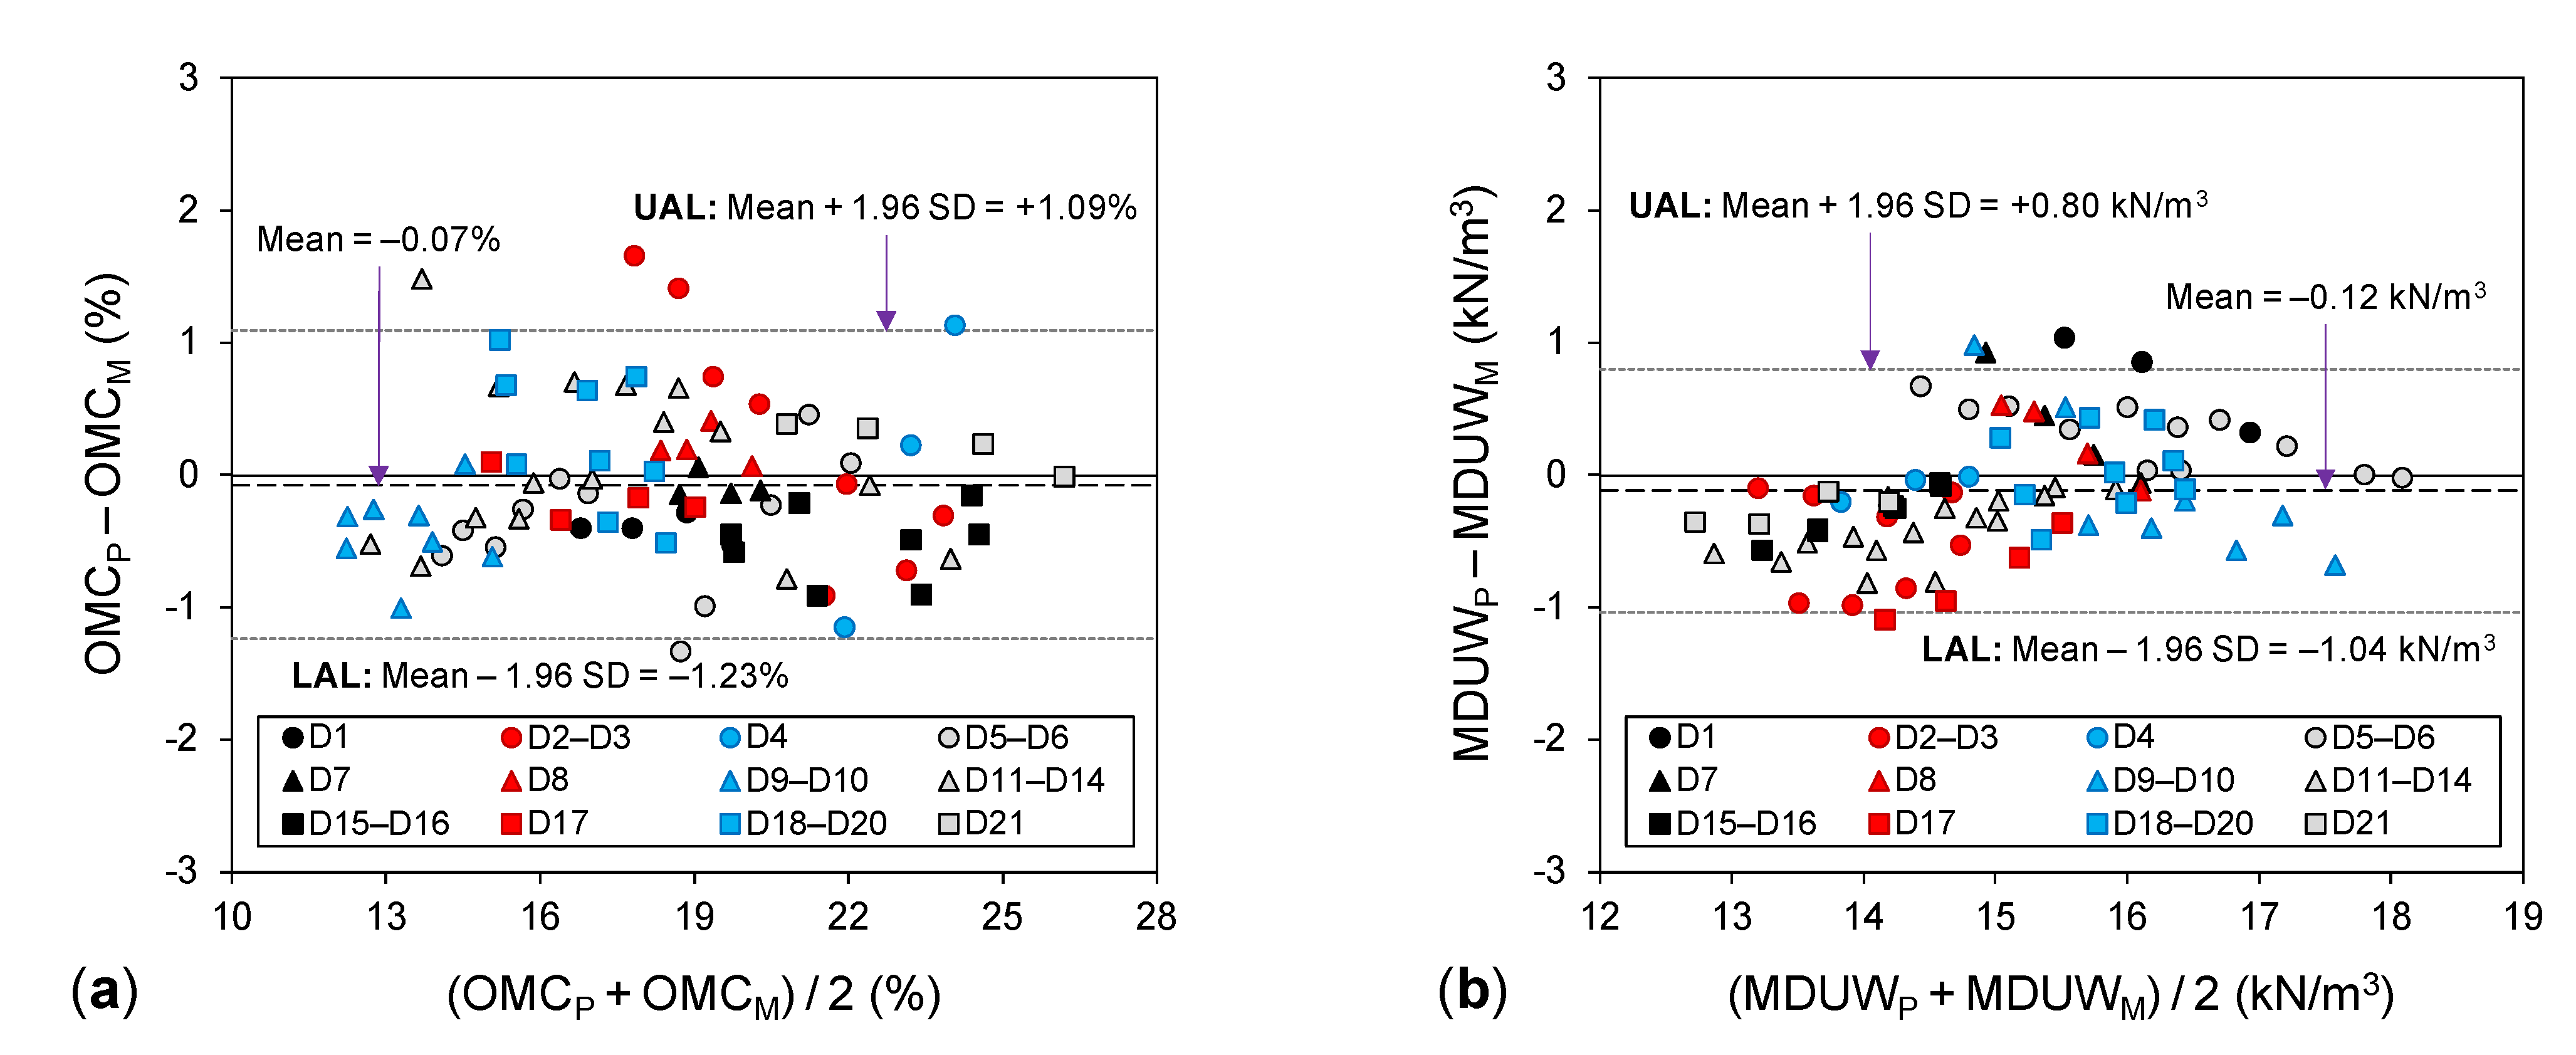
The excellent graphical correlation (high R2), together with the low MAPE or NRMSE values, obtained for Equations (9) and (10) would normally lead to corroborating their predictive capability. However, a critical examination of the prediction residuals should also be performed to better perceive the true implications of these predictions for routine geotechnical engineering applications [47]. This can be achieved by quantifying and critically examining the statistical ‘limits of agreement’ between the predicted and measured values, which was conducted using the Bland–Altman (BA) analysis [48]. The BA analysis involves developing a scatter plot with the y-axis representing the difference between the two compared variables (e.g., OMCP − OMCM, where the subscripts ‘P’ and ‘M’ denote predicted and measured variables, respectively) and the x-axis showing the average of these variables (e.g., [OMCP + OMCM]/2). The 95% upper and lower agreement limits with respect to the BA plot can be, respectively, quantified as UAL = Mean + 1.96 × SD and LAL = Mean − 1.96 × SD (where ‘Mean’ and ‘SD’ are the arithmetic mean and standard deviation of the y-axis data, respectively).
BA plots for the OMC and MDUW predictions (Equations (9) and (10)) are presented in Figure 4a,b, respectively. The mean of differences between OMCP and OMCM was found to be −0.07%, indicating that the OMC predictions were on average 0.07% (water content) lower than their measured counterparts. The 95% agreement limits between OMCP and OMCM were calculated as UAL = +1.09% and LAL = −1.23%, implying that 95% of the predictions made by Equation (9) are associated with errors ranging between these two water content limits, both of which can be considered negligible for practical applications. As for the MDUW (see Figure 4b), the mean of differences, UAL and LAL were obtained as −0.12, +0.80 and −1.04 kN/m3, respectively. Taking into account the nature of the MDUW parameter and its variations across different fine-grained soil types and also with standard and modified compaction energy levels (these variations being relatively smaller compared with that of the OMC [27,31,33]), the errors associated with Equation (10), though practically acceptable, may require further improvement. Alternatively, having predicted the OMC by Equation (9), the corresponding MDUW can be estimated with more accuracy through a practical single-point compaction test (performed at the predicted OMC).

4.3. Prediction Models Employing Empirical Reduction Rate Parameters

The authors postulate that the reduction rate parameters βM and βD may be systematically related to basic soil properties (namely those listed in Table 1). Accordingly, attempts were made to explore the existence of potential links/correlations between these fitting parameters and other parameters reflective of the soil gradation, plasticity and mineralogy. Following a comprehensive statistical analysis of the data, no meaningful correlation was found for βM. However, it was observed that |βD| systematically decreases with increasing the soil activity index (i.e., |βD| ~  
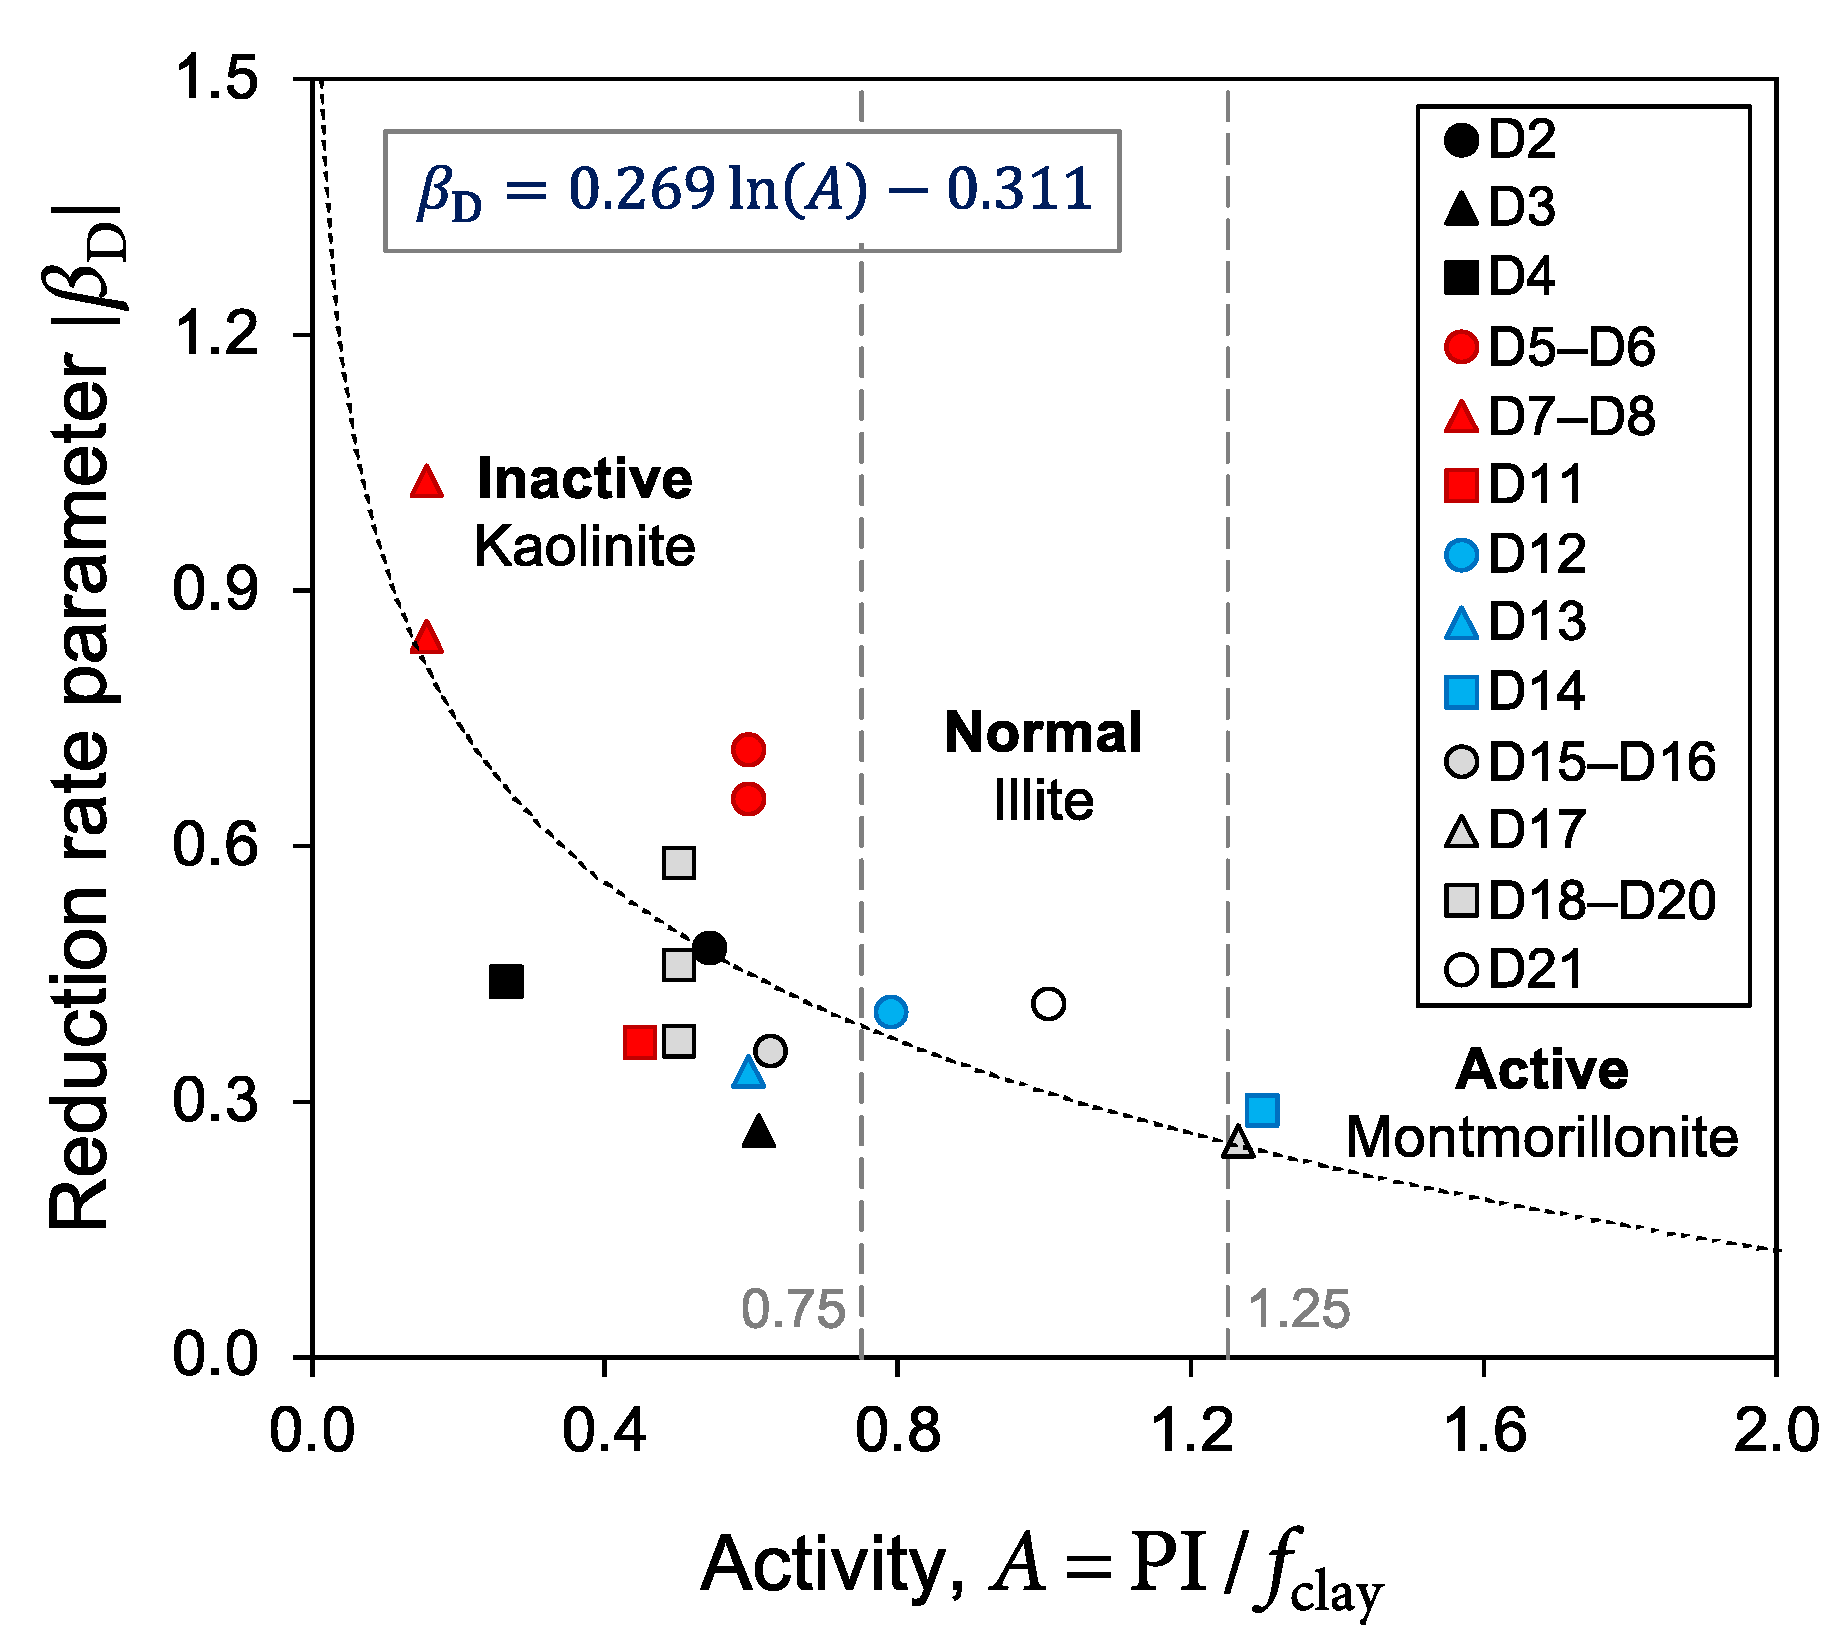
A−1). In other words, as the soil’s principal clay mineral becomes more active (e.g., kaolinite to montmorillonite), the rate of reduction in the MDUW (with respect to increasing TDA content) decreases. Figure 5 illustrates the variations of |βD| against the activity index for the compiled database (excluding datasets D1, D9 and D10 for which the clay contents were not reported). As demonstrated in this figure, βD can be expressed as follows (for fT ≤ 30%):
β D = 0.269 ln PI f clay 0.311
Accordingly, substituting Equation (11) into Equation (5) leads to the following new relationship for the MDUW:
γ dmax ST = γ dmax S G s S G s ST 0.269 ln PI f clay 0.311
Figure 6a illustrates the variations of predicted (by Equation (12)) against measured MDUW values for the compiled database. The R2, MAPE and NRMSE for these new predictions were calculated as 0.936, 1.8% and 2.3%, respectively; corroborating the predictive capability of the newly proposed Equation (12). The 95% upper and lower agreement limits, as shown in Figure 6b, were obtained as UAL = +0.67 kN/m3 and LAL = −0.71 kN/m3, indicating that 95% of the MDUW predictions are associated with errors ranging between these two small unit weight limits. Note that Equations (10) and (12) were developed based on different dataset sizes (i.e., 21 and 18 datasets, respectively); as such, their predictive performances cannot be directly compared. However, a reliable comparison can be performed if the R2, MAPE, NRMSE, UAL and LAL parameters for Equation (10) are recalculated based on the same 18 datasets (i.e., D2–D8 and D11–D21) used for the development of Equation (12). The outcome of this recalculation was R2 = 0.920, MAPE = 2.5%, NRMSE = 3.1%, UAL = +0.69 kN/m3 and LAL = −1.0 kN/m3, which appear to work (slightly) in favor of the more elaborate Equation (12). Even so, for prediction purposes, this performance improvement may not be sufficient to justify the use of Equation (12) over the more practical Equation (10); the latter making MDUW predictions without the need for PI and fclay measurements.
In addition to fundamental soil properties, the authors speculated that βM and βD may also be related to other variables, such as the TDA mean particle size (or D50) and the imparted compaction energy level. Even though the compiled database did not permit a critical investigation of these variables to be performed (i.e., since only a small number of the database soils included compaction results for varying D50 and/or compaction energy levels), it is considered that both D50 and compaction energy would likely have minor effects on βM and βD. As mentioned in Section 4.1, for predominantly sand-sized TDA materials (0.075–4.75 mm), changes in the TDA mean particle size is normally reflected in the TDA specific gravity [24,26]. In other words, the dependent/input variable G s S / G s ST not only captures the combined effects of TDA content and TDA density, but it is also expected to account, at least in part, for changes in the TDA mean particle size. Moreover, a review of the admittedly limited literature (including those listed in Table 1 and Table 2) indicates that, for TDA materials (i.e., powder, crumbs and buffings) having the same specific gravity but different D50 values, the variations in OMC and MDUW across the two TDA sizes are relatively small.
The elastic-rebound recovery exhibited by TDA particles in compacted soil–TDA mixtures has been reported to increase with increasing the compactive effort. In other words, the higher the imparted compaction energy level (from standard to modified Proctor), the lower the compaction efficiency of the soil–TDA matrix [25,41]. This may explain the limited soil–TDA compaction data reported for the modified (heavy) Proctor energy level (accounting for only four of the twenty-one cases listed in Table 1 and Table 2). In view of this mechanism, it is speculated that the beneficial effects of compaction energy increase (from standard to modified Proctor) would likely be offset by the TDA material’s increased energy dissipation potential, allowing one to postulate that the reduction rate parameters, particularly βD, may not be significantly influenced by compactive effort. As such, the modeling framework proposed in this investigation allocates similar OMC and MDUW reduction rates for standard and modified compaction energy levels. Given that the bulk of the compiled database used for model development consisted of standard Proctor compaction data (17 datasets out of 21 examined), the predictions made for modified Proctor should be taken with some caution. Nevertheless, a systematically controlled test program involving a variety of TDA particle sizes and a range of compaction energy levels should be performed with the dual aims of checking the above postulations and potentially developing improved empirical correlations for the reduction rate parameters βM and βD.

5. Summary and Conclusions

This study aimed at modeling the compaction characteristics of fine-grained soils blended with sand-sized TDA products (e.g., powder, crumbs and buffings). Model development and calibration were carried out using a large and diverse database of 100 soil–TDA compaction tests (with fT ≤ 30%) assembled from the literature. Following a comprehensive statistical analysis of the data, the following general and fundamental conclusions can be drawn from this study:
  • Irrespective of the imparted compaction energy level (from standard to modified Proctor), the addition of (and content increase in) TDA leads to notable reductions in the OMC and MDUW parameters, both following exponentially decreasing trends with respect to increasing TDA content.
  • The OMC and MDUW for soil–TDA blends (across different fine-grained soil types, TDA particle sizes and compaction energy levels) can be expressed as universal power functions of the OMC and MDUW of the unamended soil, together with the soil to soil–TDA specific gravity ratio; the latter capable of capturing the combined effects of TDA content and its lower density.
  • Making use of the Bland–Altman analysis, the 95% upper and lower (water content) agreement limits between the predicted and measured OMC values were, respectively, obtained as +1.09% and −1.23%, both of which can be considered negligible for practical applications. For the MDUW predictions, these limits were calculated as +0.80 and −1.04 kN/m3 and, employing a more elaborate correlation that also considers the soil activity, as +0.67 and −0.71 kN/m3, which (like the OMC) can be deemed acceptable for prediction purposes. Accordingly, having established the OMC and MDUW of the unamended fine-grained soil, the various empirical models proposed in this study offer a practical procedure towards predicting the compaction characteristics of the soil–TDA blends without the hurdles of performing separate laboratory compaction tests, and thus can be used for preliminary design assessments and/or soil–TDA optimization studies.
Further investigations are warranted regarding the possible application of the new modeling framework developed for fine-grained soil–TDA blends in predicting the compaction characteristics of fine-grained soils when mixed with other recycled solid waste and/or virgin materials.

Author Contributions

Conceptualization, A.S. and M.A.; methodology, A.S. and M.A.; validation, A.S., M.A. and B.C.O.; formal analysis, A.S. and M.A.; investigation, A.S. and M.A.; writing—original draft preparation, A.S. and M.A.; writing—review and editing, A.S. and B.C.O.; visualization, A.S. and M.A.; supervision, A.S.; funding acquisition, B.C.O. All authors have read and agreed to the published version of the manuscript.

Funding

This research received no external funding.

Data Availability Statement

This study has not generated new experimental data.

Acknowledgments

Special thanks go to Mark B. Jaksa of the University of Adelaide for valuable suggestions to the authors.

Conflicts of Interest

The authors declare no conflict of interest.

Abbreviations

BABland–Altman (analysis/plot)
BSBritish Standard
BTEXBenzene, Toluene, Ethylbenzene and Xylene
CHClay with high plasticity
CIClay with intermediate plasticity
CVClay with very high plasticity
ELTEnd-of-life tire
LBLower (variation) boundary
MDUWMaximum dry unit weight
MHSilt with high plasticity
MLSilt with low plasticity
MVSilt with very high plasticity
OMCOptimum moisture content
SPPoorly-graded (sand)
TDATire-derived aggregate
UBUpper (variation) boundary
USCSUnified Soil Classification System
ZAVZero-air-voids

Notations

ASoil activity index
CCCoefficient of curvature
CUCoefficient of uniformity
D50TDA mean particle size (mm)
fclayClay (<2 μm) content (%)
ffinesFines (<75 μm) content (%)
fTTDA content (i.e., TDA-to-soil dry mass ratio) (%)
G s S Specific gravity of soil solids
G s T Specific gravity of TDA particles
G s ST Specific gravity of soil–TDA mixture
LALLower (statistical) agreement limit (same unit as OMC or MDUW)
LLLiquid limit (%)
MAPEMean absolute percentage error (%)
MDUWMMeasured MDUW (kN/m3)
MDUWPPredicted MDUW (kN/m3)
MSMass of oven-dried soil (g)
MTMass of TDA (g)
nIndex of summation
NNumber of observations (or compaction tests)
NRMSENormalized root-mean-squared error (%)
OMCMMeasured OMC (%)
OMCPPredicted OMC (%)
PIPlasticity index (%)
R2Coefficient of determination
RMSERoot-mean-squared error (same unit as OMC or MDUW)
SDStandard deviation (same unit as OMC or MDUW)
UALUpper (statistical) agreement limit (same unit as OMC or MDUW)
woptConventional OMC (%)
w opt * Normalized OMC (%)
w opt S OMC of unamended soil (%)
w opt ST OMC of soil–TDA mixture (%)
ynMeasured variable (OMC or MDUW)
y n ¯ Arithmetic mean of yn data
y ^ n Predicted variable (OMC or MDUW)
βDReduction rate parameter for increasing TDA content (MDUW model)
βMReduction rate parameter for increasing TDA content (OMC model)
γdmaxConventional MDUW (kN/m3)
γ dmax * Normalized MDUW (kN/m3)
γ dmax S MDUW of unamended soil (kN/m3)
γ dmax ST MDUW of soil–TDA mixture (kN/m3)

Appendix A

The specific gravity values of the fine-grained soil–TDA mixtures—that is, G s ST calculated by Equation (3)—for the compiled database are presented in Table A1.
Table A1. Specific gravity values of the fine-grained soil–TDA mixtures for the compiled database.
Test IDDatasetSourceSoil ID G s S G s T fT (%) G s ST G s S / G s ST
T1D1Cabalar et al. [15]S12.611.0802.611
T25.32.441.070
T311.12.291.140
T417.62.151.214
T5D2Prasad et al. [36]S22.650.8502.651
T65.02.411.100
T710.02.221.194
T815.02.081.274
T920.01.961.352
T10D3Prasad et al. [36]S32.650.8502.651
T115.02.411.100
T1210.02.221.194
T1315.02.081.274
T1420.01.961.352
T15D4Ramirez et al. [37]S42.721.1202.721
T165.02.551.067
T1710.02.411.129
T1820.02.201.236
T19D5Signes et al. [16]S52.691.1402.691
T202.52.601.035
T215.02.531.063
T2210.02.391.126
T2315.02.281.180
T2420.02.191.228
T2525.02.111.275
T26D6Signes et al. [16]S52.691.1402.691
T272.52.601.035
T285.02.531.063
T2910.02.391.126
T3015.02.281.180
T3120.02.191.228
T3225.02.111.275
T33D7Yadav and Tiwari [43]S62.691.1302.691
T342.52.601.035
T355.02.521.067
T367.52.451.098
T3710.02.391.126
T33D8Yadav and Tiwari [38]S62.691.0702.691
T382.52.591.039
T395.02.511.072
T407.52.431.107
T4110.02.361.140
T42D9Ravichandran et al. [39]S72.650.8502.651
T435.02.411.100
T4410.02.221.194
T4515.02.081.274
T4620.01.961.352
T47D10Ravichandran et al. [39]S82.650.8502.651
T485.02.411.100
T4910.02.221.194
T5015.02.081.274
T5120.01.961.352
T52D11Soltani et al. [34]S92.691.0902.691
T535.02.511.072
T5410.02.371.135
T5520.02.161.245
T5630.02.011.338
T57D12Soltani et al. [34]S102.671.0902.671
T585.02.501.068
T5910.02.361.131
T6020.02.151.242
T6130.02.001.335
T62D13Soltani et al. [34]S112.711.0902.711
T635.02.531.071
T6410.02.391.134
T6520.02.171.249
T6630.02.021.342
T67D14Soltani et al. [34]S122.721.0902.721
T685.02.541.071
T6910.02.391.138
T7020.02.181.248
T7130.02.021.347
T72D15Soltani et al. [35]S132.731.0902.731
T735.02.551.071
T7410.02.401.138
T7520.02.181.252
T7630.02.031.345
T72D16Soltani et al. [35]S132.731.0902.731
T775.02.551.071
T7810.02.401.138
T7920.02.181.252
T8030.02.031.345
T81D17Soltani et al. [23]S142.761.0902.761
T825.02.571.074
T8310.02.421.140
T8420.02.201.255
T8530.02.041.353
T86D18Soltani et al. [19]S152.771.0802.771
T875.02.581.074
T8810.02.431.140
T8920.02.201.259
T86D19Soltani et al. [19]S152.771.1002.771
T905.02.581.074
T9110.02.431.140
T9220.02.211.253
T86D20Soltani et al. [19]S152.771.1102.771
T935.02.591.069
T9410.02.441.135
T9520.02.221.248
T96D21Soltani et al. [22]S162.731.0902.731
T975.02.551.071
T9810.02.401.138
T9920.02.181.252
T10030.02.031.345
Note: fT = TDA content (i.e., TDA-to-soil dry mass ratio, here expressed as a percentage value); G s S and G s T = specific gravity of soil solids and TDA particles, respectively; and G s ST = specific gravity of soil–TDA mixture (Equation (3)).
Figure A1 illustrates the variations of the conventional OMC and MDUW parameters, wopt and γdmax, against TDA content fT for the 21 fine-grained soil–TDA compaction datasets.
Figure A1. Variations of the conventional OMC and MDUW against TDA content for the 21 soil–TDA compaction datasets.
Sustainability 13 07737 g0a1aSustainability 13 07737 g0a1bSustainability 13 07737 g0a1c

References

  1. Humphrey, D.; Blumenthal, M. The use of tire-derived aggregate in road construction applications. In Green Streets and Highways 2010: An Interactive Conference on the State of the Art and How to Achieve Sustainable Outcomes; Weinstein, N., Ed.; ASCE: Reston, VA, USA, 2010; pp. 299–313. [Google Scholar] [CrossRef]
  2. Reddy, S.B.; Krishna, A.M. Recycled tire chips mixed with sand as lightweight backfill material in retaining wall applications: An experimental investigation. Int. J. Geosynth. Gr. Eng. 2015, 1, 31. [Google Scholar] [CrossRef] [Green Version]
  3. Li, L.; Xiao, H.; Ferreira, P.; Cui, X. Study of a small scale tyre-reinforced embankment. Geotext. Geomembr. 2016, 44, 201–208. [Google Scholar] [CrossRef]
  4. Khatami, H.; Deng, A.; Jaksa, M. Passive arching in rubberized sand backfills. Can. Geotech. J. 2020, 57, 549–567. [Google Scholar] [CrossRef]
  5. Raeesi, R.; Soltani, A.; King, R.; Disfani, M.M. Field performance monitoring of waste tire-based permeable pavements. Transp. Geotech. 2020, 24, 100384. [Google Scholar] [CrossRef]
  6. Shahrokhi-Shahraki, R.; Kwon, P.S.; Park, J.; O’Kelly, B.C.; Rezania, S. BTEX and heavy metals removal using pulverized waste tires in engineered fill materials. Chemosphere 2020, 242, 125281. [Google Scholar] [CrossRef] [PubMed]
  7. Edil, T.; Bosscher, P. Engineering properties of tire chips and soil mixtures. Geotech. Test. J. 1994, 17, 453–464. [Google Scholar] [CrossRef]
  8. Foose, G.J.; Benson, C.H.; Bosscher, P.J. Sand reinforced with shredded waste tires. J. Geotech. Eng. 1996, 122, 760–767. [Google Scholar] [CrossRef]
  9. Al-Tabbaa, A.; Blackwell, O.; Porter, S.A. An investigation into the geotechnical properties of soil–tyre mixtures. Environ. Technol. 1997, 18, 855–860. [Google Scholar] [CrossRef]
  10. Lee, J.H.; Salgado, R.; Bernal, A.; Lovell, C.W. Shredded tires and rubber–sand as lightweight backfill. J. Geotech. Geoenviron. Eng. 1999, 125, 132–141. [Google Scholar] [CrossRef]
  11. Zornberg, J.G.; Cabral, A.R.; Viratjandr, C. Behaviour of tire shred–sand mixtures. Can. Geotech. J. 2004, 41, 227–241. [Google Scholar] [CrossRef]
  12. Lee, J.S.; Dodds, J.; Santamarina, J.C. Behavior of rigid–soft particle mixtures. J. Mater. Civ. Eng. 2007, 19, 179–184. [Google Scholar] [CrossRef] [Green Version]
  13. Kim, H.K.; Santamarina, J.C. Sand–rubber mixtures (large rubber chips). Can. Geotech. J. 2008, 45, 1457–1466. [Google Scholar] [CrossRef] [Green Version]
  14. Mohammadinia, A.; Disfani, M.M.; Narsilio, G.A.; Aye, L. Mechanical behaviour and load bearing mechanism of high porosity permeable pavements utilizing recycled tire aggregates. Constr. Build. Mater. 2018, 168, 794–804. [Google Scholar] [CrossRef]
  15. Cabalar, A.F.; Karabash, Z.; Mustafa, W.S. Stabilising a clay using tyre buffings and lime. Road Mater. Pavement Des. 2014, 15, 872–891. [Google Scholar] [CrossRef]
  16. Signes, C.H.; Garzón-Roca, J.; Fernández, P.M.; de la Torre, M.E.G.; Franco, R.I. Swelling potential reduction of Spanish argillaceous marlstone Facies Tap soil through the addition of crumb rubber particles from scrap tyres. Appl. Clay Sci. 2016, 132–133, 768–773. [Google Scholar] [CrossRef]
  17. Yadav, J.S.; Tiwari, S.K. Effect of waste rubber fibres on the geotechnical properties of clay stabilized with cement. Appl. Clay Sci. 2017, 149, 97–110. [Google Scholar] [CrossRef]
  18. Bekhiti, M.; Trouzine, H.; Rabehi, M. Influence of waste tire rubber fibers on swelling behavior, unconfined compressive strength and ductility of cement stabilized bentonite clay soil. Constr. Build. Mater. 2019, 208, 304–313. [Google Scholar] [CrossRef]
  19. Soltani, A.; Taheri, A.; Deng, A.; O’Kelly, B.C. Improved geotechnical behavior of an expansive soil amended with tire-derived aggregates having different gradations. Minerals 2020, 10, 923. [Google Scholar] [CrossRef]
  20. Akbarimehr, D.; Fakharian, K. Dynamic shear modulus and damping ratio of clay mixed with waste rubber using cyclic triaxial apparatus. Soil Dyn. Earthq. Eng. 2021, 140, 106435. [Google Scholar] [CrossRef]
  21. Ghadr, S.; Samadzadeh, A.; Bahadori, H.; O’Kelly, B.C.; Assadi-Langroudi, A. Liquefaction resistance of silty sand with ground rubber additive. Int. J. Geomech. 2021, 21, 04021076. [Google Scholar] [CrossRef]
  22. Soltani, A.; Raeesi, R.; Taheri, A.; Deng, A.; Mirzababaei, M. Improved shear strength performance of compacted rubberized clays treated with sodium alginate biopolymer. Polymers 2021, 13, 764. [Google Scholar] [CrossRef]
  23. Soltani, A.; Deng, A.; Taheri, A.; O’Kelly, B.C. Engineering reactive clay systems by ground rubber replacement and polyacrylamide treatment. Polymers 2019, 11, 1675. [Google Scholar] [CrossRef] [Green Version]
  24. Yadav, J.S.; Tiwari, S.K. The impact of end-of-life tires on the mechanical properties of fine-grained soil: A review. Environ. Dev. Sustain. 2019, 21, 485–568. [Google Scholar] [CrossRef]
  25. Yang, Z.; Zhang, Q.; Shi, W.; Lv, J.; Lu, Z.; Ling, X. Advances in properties of rubber reinforced soil. Adv. Civ. Eng. 2020, 2020, 6629757. [Google Scholar] [CrossRef]
  26. Mistry, M.K.; Shukla, S.J.; Solanki, C.H. Reuse of waste tyre products as a soil reinforcing material: A critical review. Environ. Sci. Pollut. Res. 2021, 28, 24940–24971. [Google Scholar] [CrossRef]
  27. Gurtug, Y.; Sridharan, A. Compaction behaviour and prediction of its characteristics of fine grained soils with particular reference to compaction energy. Soils Found. 2004, 44, 27–36. [Google Scholar] [CrossRef] [Green Version]
  28. Horpibulsuk, S.; Katkan, W.; Apichatvullop, A. An approach for assessment of compaction curves of fine grained soils at various energies using a one point test. Soils Found. 2008, 48, 115–125. [Google Scholar] [CrossRef] [Green Version]
  29. Sivrikaya, O.; Togrol, E.; Kayadelen, C. Estimating compaction behavior of fine-grained soils based on compaction energy. Can. Geotech. J. 2008, 45, 877–887. [Google Scholar] [CrossRef]
  30. Pillai, G.A.S.; Vinod, P.P. Re-examination of compaction parameters of fine-grained soils. Proc. Inst. Civ. Eng. Gr. Improv. 2016, 169, 157–166. [Google Scholar] [CrossRef]
  31. Spagnoli, G.; Shimobe, S. An overview on the compaction characteristics of soils by laboratory tests. Eng. Geol. 2020, 278, 105830. [Google Scholar] [CrossRef]
  32. Di Matteo, L.; Spagnoli, G. Predicting compaction properties of soils at different compaction efforts. Proc. Inst. Civ. Eng. Geotech. Eng. 2021, in press. [Google Scholar] [CrossRef]
  33. Shivaprakash, S.H.; Sridharan, A. Correlation of compaction characteristics of standard and reduced Proctor tests. Proc. Inst. Civ. Eng. Geotech. Eng. 2021, 174, 170–180. [Google Scholar] [CrossRef]
  34. Soltani, A.; Deng, A.; Taheri, A.; Sridharan, A. Consistency limits and compaction characteristics of clay soils containing rubber waste. Proc. Inst. Civ. Eng. Geotech. Eng. 2019, 172, 174–188. [Google Scholar] [CrossRef] [Green Version]
  35. Soltani, A.; Deng, A.; Taheri, A.; Sridharan, A. Swell–shrink–consolidation behavior of rubber-reinforced expansive soils. Geotech. Test. J. 2019, 42, 761–788. [Google Scholar] [CrossRef]
  36. Prasad, A.S.; Ravichandran, P.T.; Annadurai, R.; Rajkumar, P.R.K. Study on effect of crumb rubber on behavior of soil. Int. J. Geomatics Geosci. 2014, 4, 579–584. [Google Scholar]
  37. Ramirez, G.G.D.; Casagrande, M.D.T.; Folle, D.; Pereira, A.; Paulon, V.A. Behavior of granular rubber waste tire reinforced soil for application in geosynthetic reinforced soil wall. Rev. IBRACON Estrut. Mater. 2015, 8, 567–576. [Google Scholar] [CrossRef]
  38. Yadav, J.S.; Tiwari, S.K. A study on the potential utilization of crumb rubber in cement treated soft clay. J. Build. Eng. 2017, 9, 177–191. [Google Scholar] [CrossRef]
  39. Ravichandran, P.T.; Priyanga, G.; Krishnan, K.D.; Rajkumar, P.R.K. Compaction behavior of rubberized soil. In Proceedings of the International Conference on Intelligent Computing and Applications—Advances in Intelligent Systems and Computing, Velammal Engineering College, Chennai, India, 2–3 February 2018; Bhaskar, M., Dash, S., Das, S., Panigrahi, B., Eds.; Springer: Singapore, 2019; Volume 846, pp. 129–134. [Google Scholar] [CrossRef]
  40. BS 5930. Code of Practice for Ground Investigations; British Standards Institution (BSI): London, UK, 2015; ISBN 9780539081350. [Google Scholar]
  41. Özkul, Z.H.; Baykal, G. The influence of energy level on the effectiveness of compaction of clays with rubber fiber added. In Proceedings of the Transportation Research Board 86th Annual Meeting, Washington, DC, USA, 21–25 January 2007; Transportation Research Board (TRB): Washington, DC, USA, 2007; Paper No. 07-1685. [Google Scholar]
  42. Al-Tabbaa, A.; Aravinthan, T. Natural clay–shredded tire mixtures as landfill barrier materials. Waste Manag. 1998, 18, 9–16. [Google Scholar] [CrossRef]
  43. Priyadarshee, A.; Gupta, D.; Kumar, V.; Sharma, V. Comparative study on performance of tire crumbles with fly ash and kaolin clay. Int. J. Geosynth. Gr. Eng. 2015, 1, 38. [Google Scholar] [CrossRef] [Green Version]
  44. Akbarimehr, D.; Eslami, A.; Aflaki, E. Geotechnical behaviour of clay soil mixed with rubber waste. J. Clean. Prod. 2020, 271, 122632. [Google Scholar] [CrossRef]
  45. Trouzine, H.; Bekhiti, M.; Asroun, A. Effects of scrap tyre rubber fibre on swelling behaviour of two clayey soils in Algeria. Geosynth. Int. 2012, 19, 124–132. [Google Scholar] [CrossRef]
  46. Soltani, A.; O’Kelly, B.C. Discussion of “The flow index of clays and its relationship with some basic geotechnical properties” by G. Spagnoli, M. Feinendegen, L. Di Matteo, and D. A. Rubinos, published in Geotechnical Testing Journal 42, no. 6 (2019): 1685–1700. Geotech. Test. J. 2021, 44, 216–219. [Google Scholar] [CrossRef]
  47. Soltani, A.; O’Kelly, B.C. Reappraisal of the ASTM/AASHTO standard rolling device method for plastic limit determination of fine-grained soils. Geosciences 2021, 11, 247. [Google Scholar] [CrossRef]
  48. Bland, J.M.; Altman, D.G. Measuring agreement in method comparison studies. Stat. Methods Med. Res. 1999, 8, 135–160. [Google Scholar] [CrossRef]
Figure 1. Variations of MDUW against OMC for the compiled database of 100 soil–TDA compaction tests: (a) Conventional definition; and (b) Normalized definition according to Equations (1) and (2).
Sustainability 13 07737 g001
Figure 2. Variations of (a) βM and (b) βD for the 21 soil–TDA compaction datasets investigated. Note: UB and LB denote the upper and lower variation boundaries, respectively.
Sustainability 13 07737 g002
Figure 3. Variations of predicted against measured compaction parameters for the 21 soil–TDA compaction datasets: (a) OMC (Equation (9)); and (b) MDUW (Equation (10)).
Sustainability 13 07737 g003
Figure 4. Bland–Altman plots for the (a) OMC and (b) MDUW predictions (made by Equations (9) and (10), respectively). Note: UAL and LAL denote the 95% upper and lower agreement limits, respectively.
Sustainability 13 07737 g004
Figure 5. Variations of |βD| against the activity index for the compiled database of soil–TDA compaction tests (excluding datasets D1, D9 and D10 for which the soil activity index could not be calculated due to non-reporting of their clay contents).
Sustainability 13 07737 g005
Figure 6. MDUW predictions made by Equation (12) (excluding datasets D1, D9 and D10): (a) Variations against measured MDUW; and (b) Bland–Altman plot. Note: UAL and LAL denote the 95% upper and lower agreement limits, respectively.
Sustainability 13 07737 g006
Table 1. Soil properties for the compiled database of soil–TDA compaction tests.
DatasetSourceCompaction Energy LevelNSoil ID G s S LL (%)PI (%)ffines (%)fclay (%)ASoil USCS
D1[15]Modified Proctor4S12.6149.526.2---CI
D2[36]Standard Proctor5S22.6574.038.097.070.00.54MV
D3[36]Standard Proctor5S32.6556.036.094.059.00.61CH
D4[37]Standard Proctor4S42.7253.014.063.652.80.27MH
D5[16]Standard Proctor7S52.6952.228.196.447.20.60CH
D6[16]Modified Proctor7S52.6952.228.196.447.20.60CH
D7[38]Modified Proctor5S62.6934.29.492.260.70.15ML
D8[17]Modified Proctor5S62.6934.29.492.260.70.15ML
D9[39]Standard Proctor5S72.6552.031.062.0--CH
D10[39]Standard Proctor5S82.6560.038.054.0--CH
D11[34]Standard Proctor5S92.6944.221.999.049.00.45CI
D12[34]Standard Proctor5S102.6747.229.269.037.00.79CI
D13[34]Standard Proctor5S112.7159.531.699.053.00.60CH
D14[34]Standard Proctor5S122.7277.657.080.044.01.30CV
D15[35]Standard Proctor5S132.7359.632.399.151.70.62CH
D16[35]Standard Proctor5S132.7359.632.399.151.70.62CH
D17[23]Standard Proctor5S142.7678.454.278.043.01.26CV
D18[19]Standard Proctor4S152.7743.621.580.043.00.50CI
D19[19]Standard Proctor4S152.7743.621.580.043.00.50CI
D20[19]Standard Proctor4S152.7743.621.580.043.00.50CI
D21[22]Standard Proctor5S162.7384.352.399.052.01.01CV
Note: N = number of compaction tests; G s S = specific gravity of soil solids (in the absence of a reliable value, the typical representative specific gravity of 2.65 was considered); LL = liquid limit; PI = plasticity index; ffines = fines content (<75 μm); fclay = clay content (<2 μm); A = activity index (calculated as A = PI/fclay); and USCS = Unified Soil Classification System, as per BS 5930 [40].
Table 2. TDA properties for the compiled database of soil–TDA compaction tests.
DatasetSourceNSoil IDTDA Type G s T D50 (mm)CUCCTDA USCSTDA Content fT (%)
D1[15]4S1Tire buffings1.082.362.390.94SP0, 5.3, 11.1, 17.6
D2[36]5S2Crumb rubber (425–600 μm)0.85---SP0, 5, 10, 15, 20
D3[36]5S3Crumb rubber (425–600 μm)0.85---SP0, 5, 10, 15, 20
D4[37]4S4Granular rubber1.121.042.551.08SP0, 5, 10, 20
D5[16]7S5Rubber powder (0.075–2 mm)1.14---SP0, 2.5, 5, 10, 15, 20, 25
D6[16]7S5Rubber powder (0.075–2 mm)1.14---SP0, 2.5, 5, 10, 15, 20, 25
D7[38]5S6Crumb rubber1.131.542.201.31SP0, 2.5, 5, 7.5, 10
D8[17]5S6Rubber fiber1.071.642.951.27SP0, 2.5, 5, 7.5, 10
D9[39]5S7Crumb rubber (75–425 μm)0.85---SP0, 5, 10, 15, 20
D10[39]5S8Crumb rubber (75–425 μm)0.85---SP0, 5, 10, 15, 20
D11[34]5S9Ground rubber1.090.482.831.19SP0, 5, 10, 20, 30
D12[34]5S10Ground rubber1.090.482.831.19SP0, 5, 10, 20, 30
D13[34]5S11Ground rubber1.090.482.831.19SP0, 5, 10, 20, 30
D14[34]5S12Ground rubber1.090.482.831.19SP0, 5, 10, 20, 30
D15[35]5S13Rubber crumbs1.090.482.831.19SP0, 5, 10, 20, 30
D16[35]5S13Rubber buffings1.091.581.561.03SP0, 5, 10, 20, 30
D17[23]5S14Ground rubber1.090.482.831.19SP0, 5, 10, 20, 30
D18[19]4S15TDA–Fine1.080.463.061.23SP0, 5, 10, 20
D19[19]4S15TDA–Medium1.101.671.851.09SP0, 5, 10, 20
D20[19]4S15TDA–Coarse1.113.341.891.10SP0, 5, 10, 20
D21[22]5S16Ground rubber1.090.463.061.23SP0, 5, 10, 20, 30
Note: N = number of compaction tests; G s T = specific gravity of TDA particles; D50 = mean TDA particle size; CU and CC = coefficients of uniformity and curvature, respectively; fT = TDA-to-soil dry mass ratio, here expressed as a percentage value; and USCS = Unified Soil Classification System, as per BS 5930 [40].
Table 3. Summary of the regression analysis outputs with respect to Equation (4) (OMC model).
DatasetN w opt S ( % ) βMR2MAPE (%)NRMSE (%)
D1420.06−0.8420.9970.320.32
D2525.99−1.2750.9313.193.77
D3526.56−1.2020.9771.881.97
D4425.45−0.6680.9042.542.72
D5722.37−0.6390.9441.101.33
D6717.37−0.7880.9930.470.53
D7520.93−0.9440.9890.380.42
D8520.83−1.0570.9850.480.59
D9515.87−0.8170.9910.800.85
D10516.44−0.8390.9521.741.93
D11520.74−0.9250.9900.871.02
D12516.53−0.8130.9920.660.70
D13525.74−1.0460.9562.052.22
D14519.17−1.2630.9871.211.40
D15526.28−0.8620.9870.931.04
D16526.08−0.9050.9960.450.57
D17520.41−0.9760.9920.840.90
D18419.80−1.0090.9771.311.36
D19419.65−1.1630.9930.780.81
D20419.34−1.2410.9920.740.93
D21528.04−1.0380.9990.190.23
Note: N = number of compaction tests; R2 = coefficient of determination; MAPE = mean absolute percentage error (Equation (6)); NRMSE = normalized root-mean-squared error (Equation (7)); w opt S = OMC intercept parameter; and βM = OMC reduction rate parameter for increasing TDA content.
Table 4. Summary of the regression analysis outputs with respect to Equation (5) (MDUW model).
DatasetN γ dmax S   ( kN / m 3 ) βDR2MAPE (%)NRMSE (%)
D1417.72−0.8740.9960.350.39
D2515.42−0.4810.9840.510.65
D3515.32−0.2650.9370.690.73
D4415.27−0.4400.9950.230.24
D5716.76−0.7140.9960.340.40
D6718.46−0.6550.9960.290.35
D7516.56−1.0300.9441.011.05
D8516.49−0.8460.9660.620.74
D9518.38−0.4540.9421.081.24
D10518.29−0.7340.9381.792.05
D11515.48−0.3680.9870.360.42
D12516.38−0.4040.9960.210.27
D13514.66−0.3360.9680.610.64
D14515.81−0.2900.9760.420.48
D15515.04−0.3600.9980.130.16
D16515.03−0.3590.9970.180.22
D17515.96−0.2540.9840.330.35
D18416.96−0.3710.9950.210.22
D19416.92−0.4600.9890.390.41
D20416.82−0.5800.9640.910.93
D21514.63−0.4150.9900.410.44
Note: N = number of compaction tests; R2 = coefficient of determination; MAPE = mean absolute percentage error (Equation (6)); NRMSE = normalized root-mean-squared error (Equation (7)); γ dmax S = MDUW intercept parameter; and βD = MDUW reduction rate parameter for increasing TDA content.
Publisher’s Note: MDPI stays neutral with regard to jurisdictional claims in published maps and institutional affiliations.

