
Internet of Things (IoT) as Sustainable Development Goals (SDG) Enabling Technology towards Smart Readiness Indicators (SRI) for University Buildings

 ,
,  ,
,  ,
,
Abstract
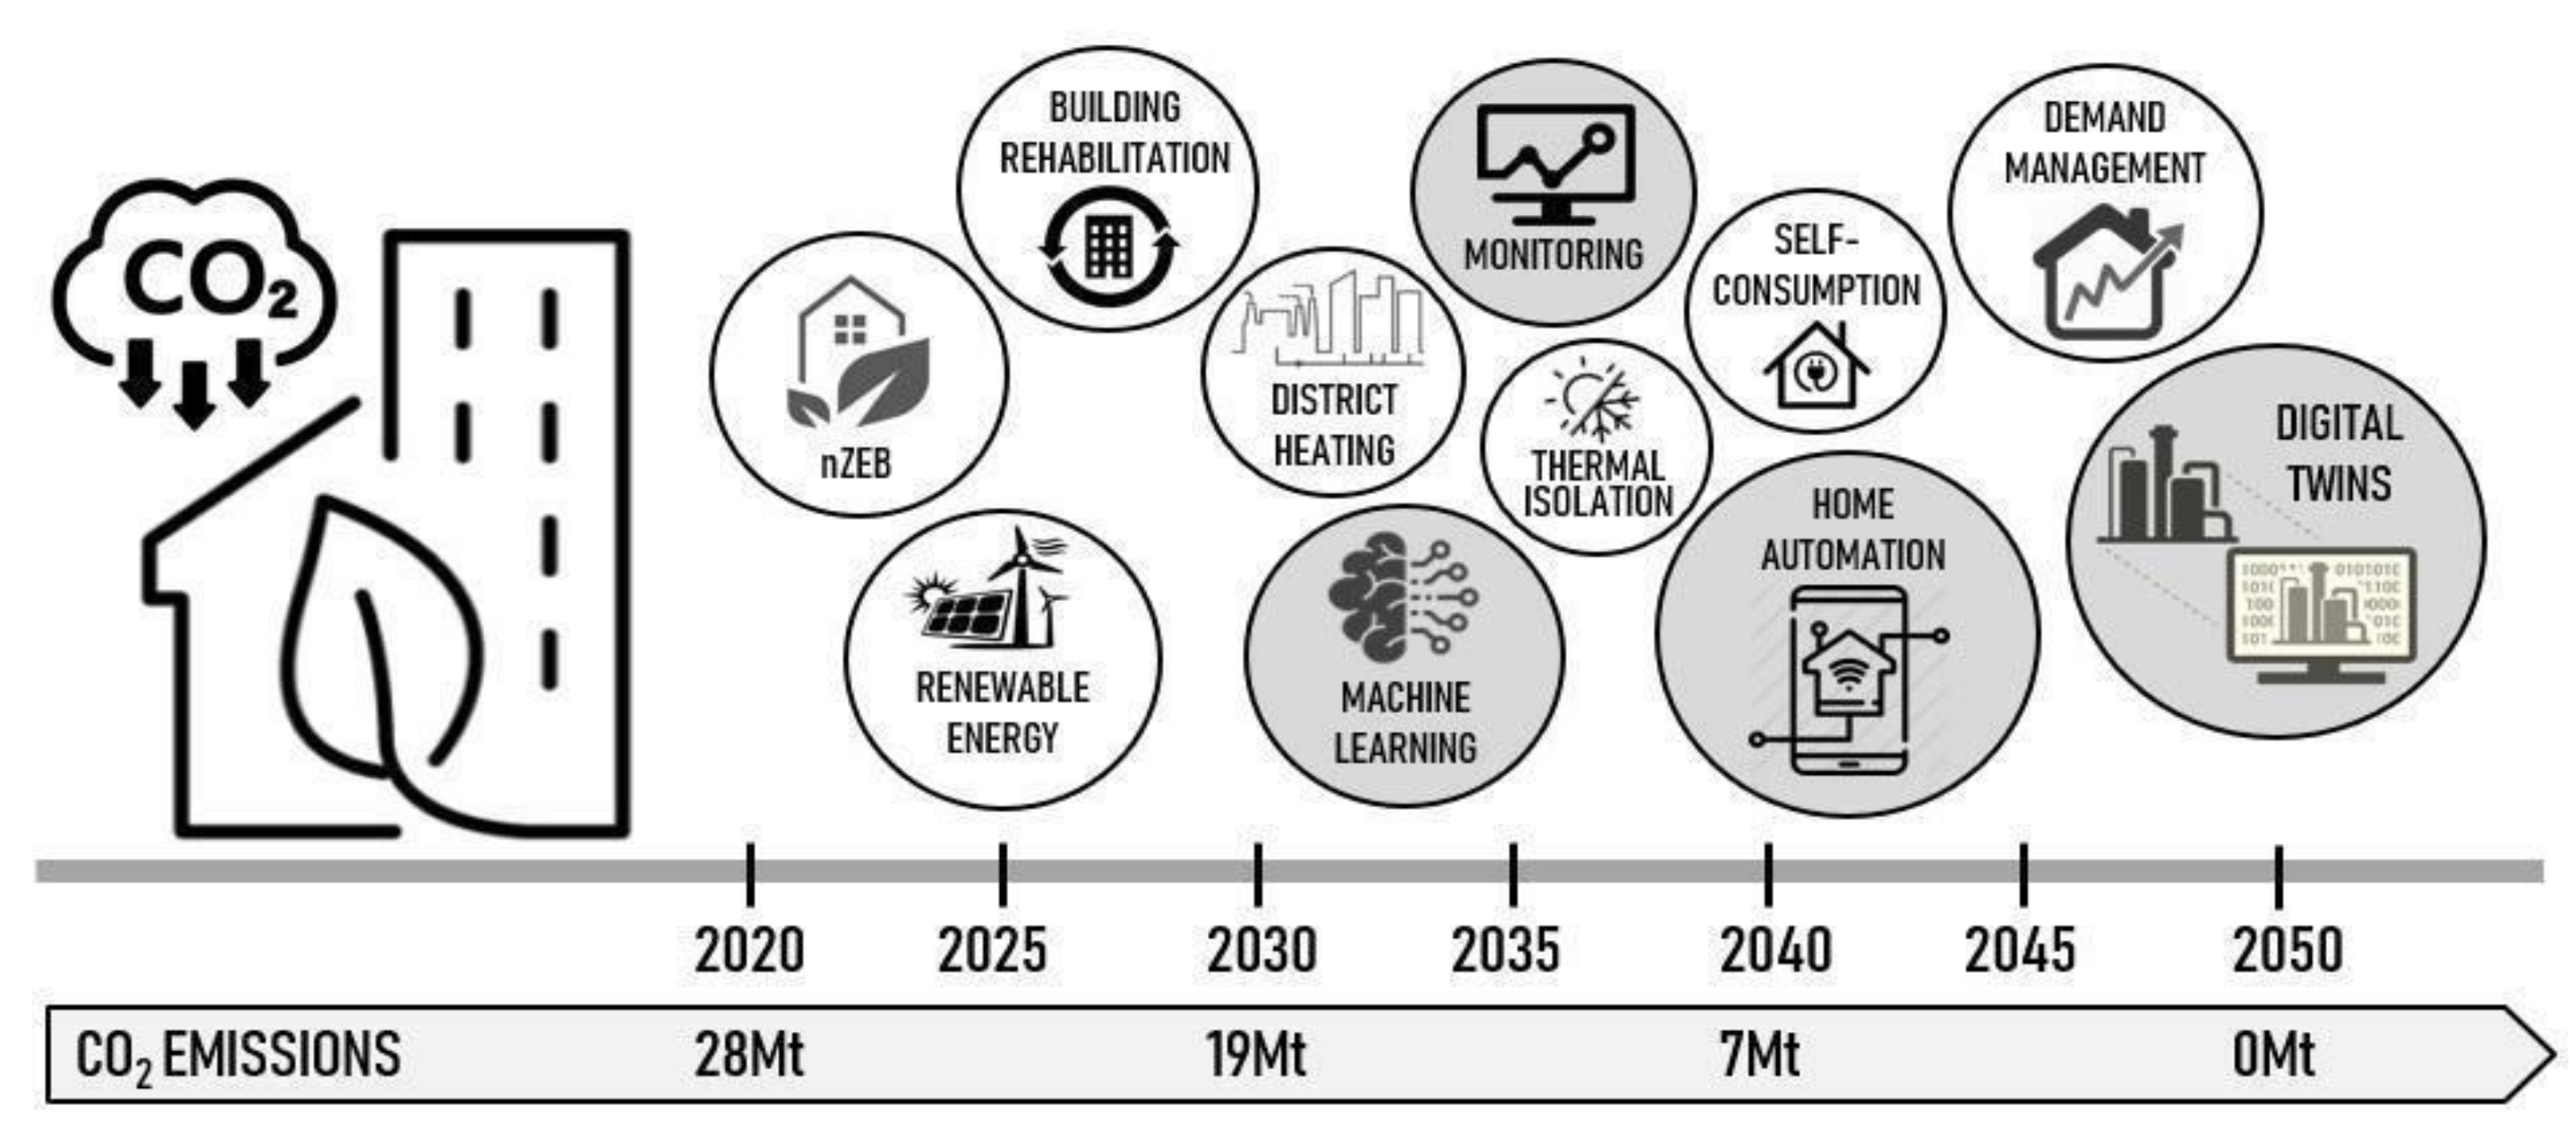
:1. Introduction
2. Materials and Methods
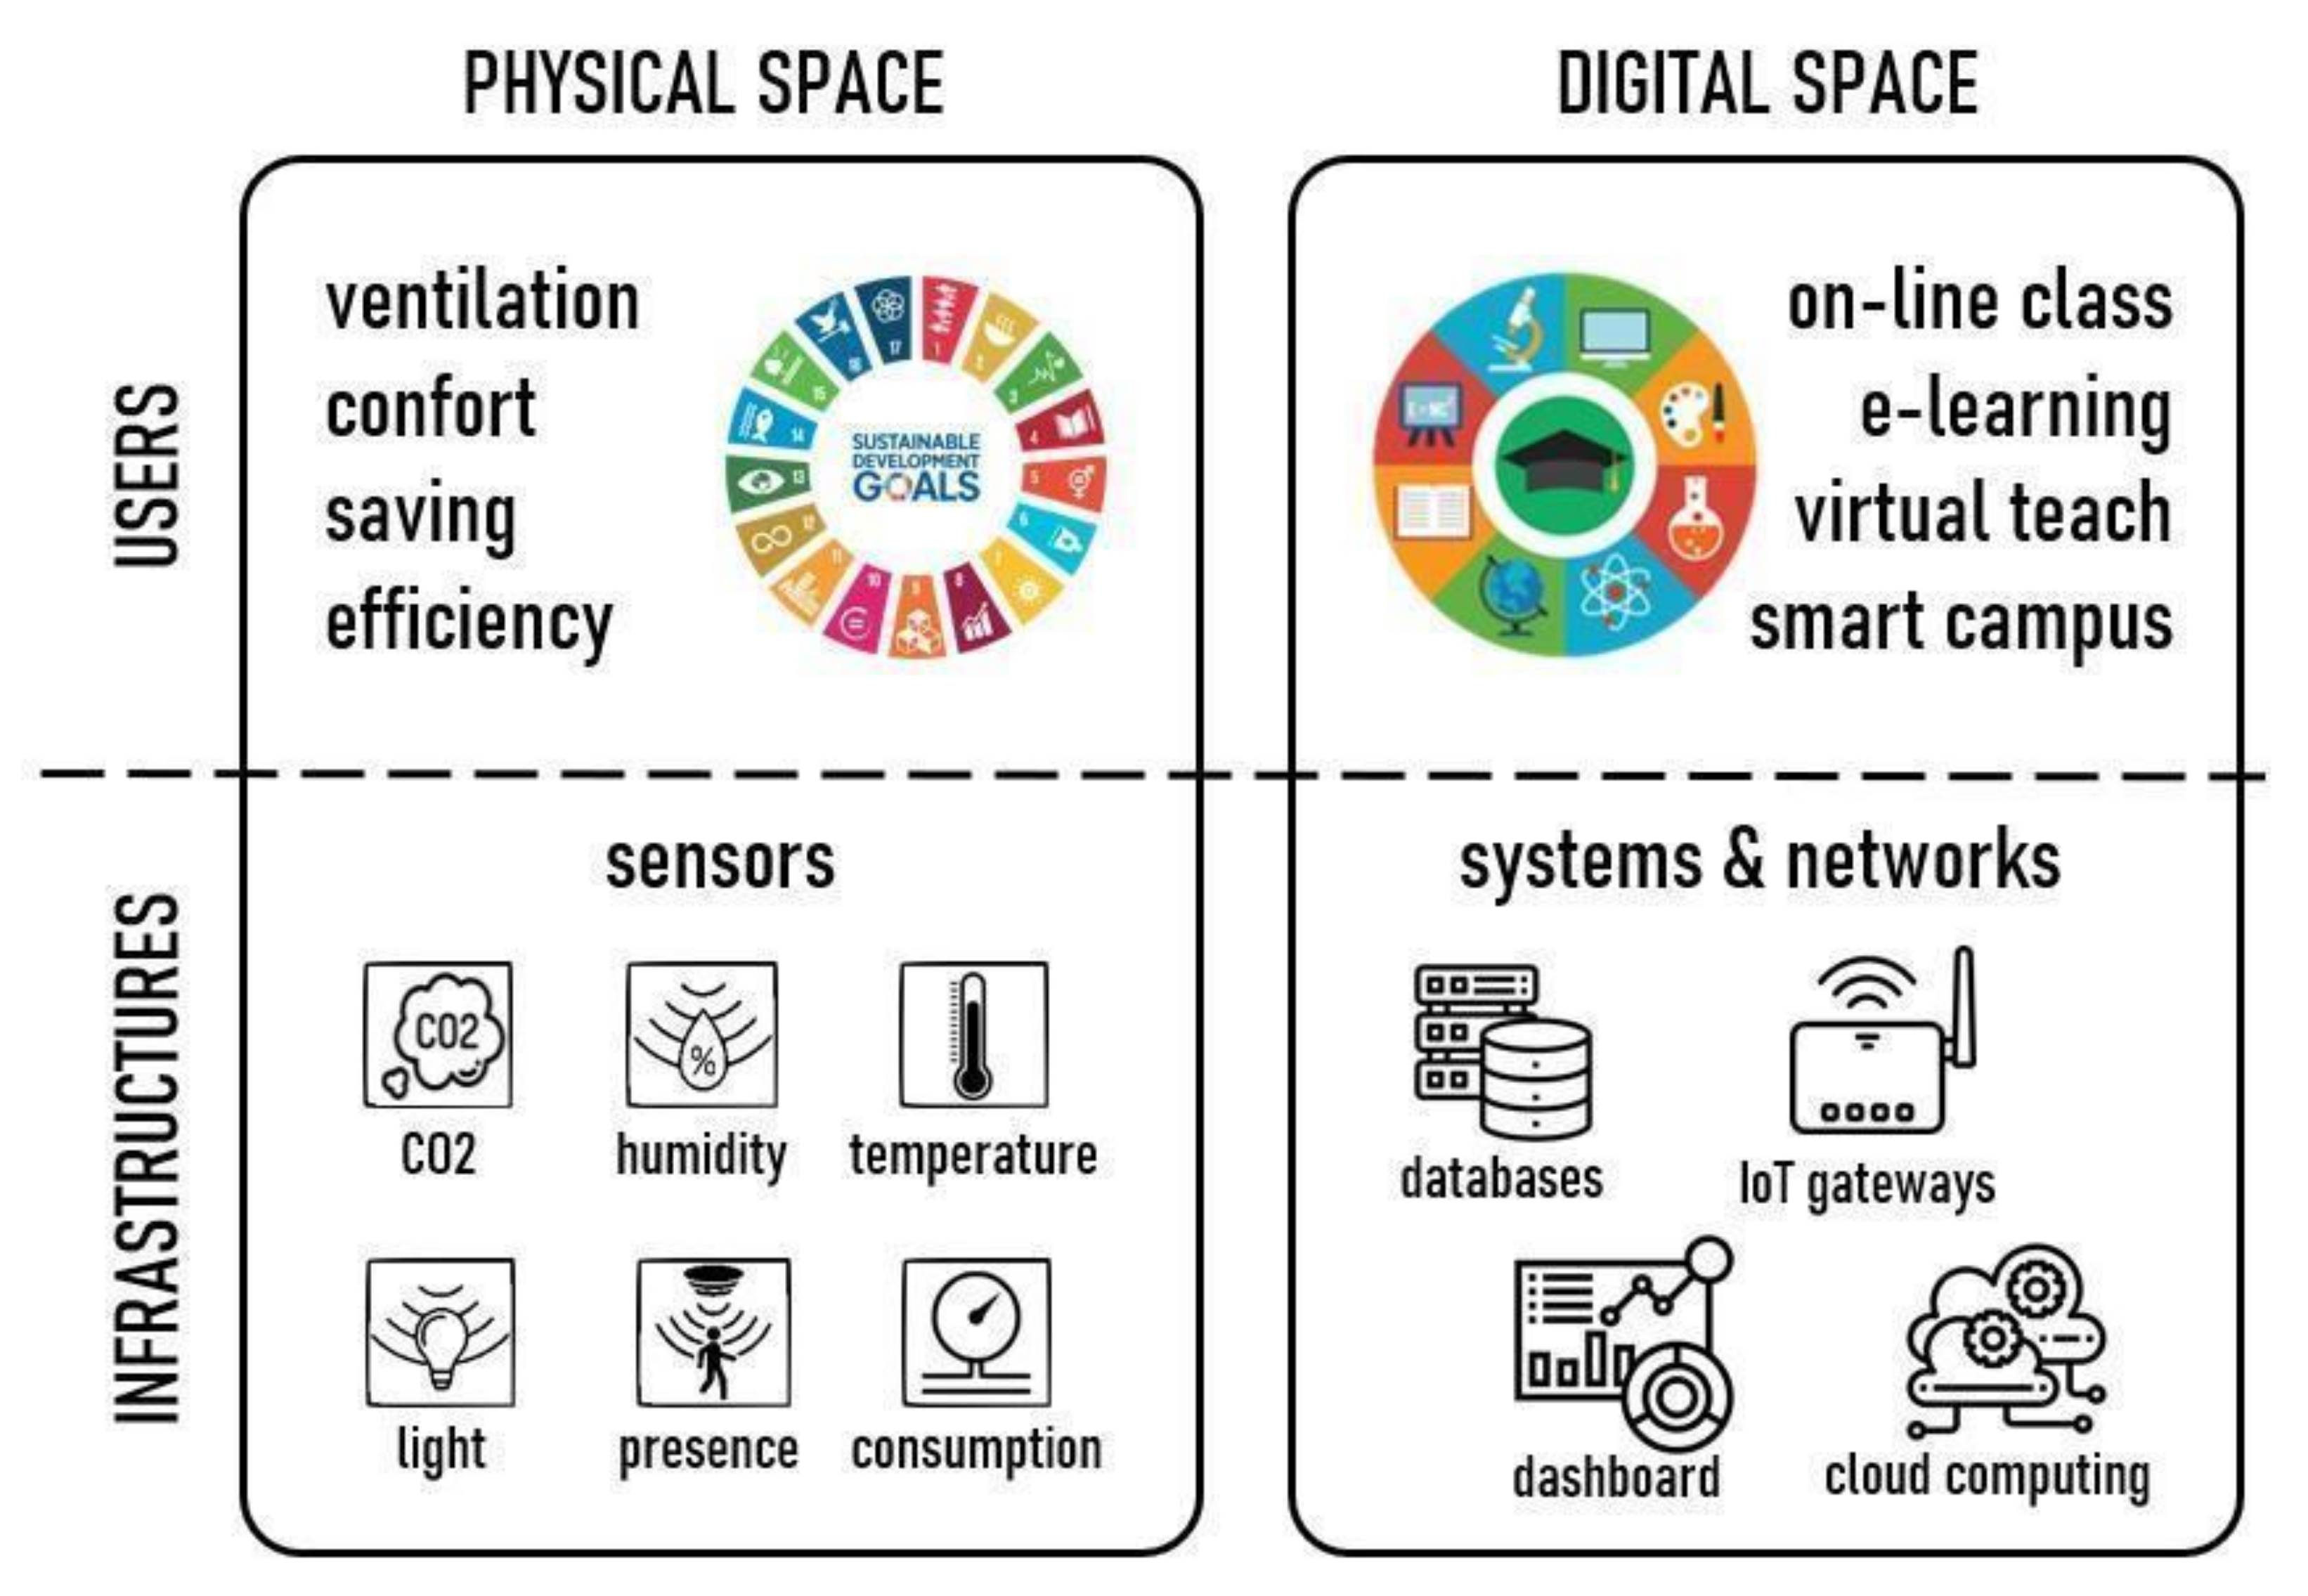
2.1. Conceptual Spaces
2.1.1. Physical Space
- Parameterise, characterise and model each one space, studying its status and behaviour for different uses and external conditions.
- Monitor energy consumption, weather variables, installation performance, etc. to move towards smart buildings.
- Incorporate renewable energies and visualise their utilisation, production, consumption, efficiency, savings, etc.
- Follow up indoor thermal conditions, indoor air quality, occupancy levels, etc.
- Assess and extrapolate the obtained results to added-value SDG-aligned services, such as smart use, energy efficiency and rehabilitation, and predictive and adaptive maintenance.
- Improve DCV, as smart ventilation strategy, based on the patterns obtained from the measured data (CO2, humidity, temperature, etc.).
- Produce renewable (photovoltaic) energy from the smart and digital infrastructures.
- Transform traditional spaces into green and environmentally sustainable spaces for digital education.
- Facilitate the decision-making processes for the smart use of every space.
2.1.2. Digital Space
- A unified and friendly environment to easily access a virtual and customised classroom, teaching-learning contents, university management, etc.
- Open tools to improve consolidated environments.
- Visibility of class offerings, including their methodologies and transdisciplinary learning, to enable students to choose their own curricula.
- Transparency of the quality teaching offerings, facilitating the integration and access of incoming students regarding their interests, training objectives, etc.
- An active, adaptive and transparent environment for university management, using metrics and quality results.
- Digital twins as virtual support to show available services in a unified and harmonised way to the university community.
- Integration of all digital spaces (classrooms, offices, laboratories, webinars, etc.) to interconnect users (students, teachers and university staff) with academic and management activities.
- Access, in a continuous, adaptive, transparent and user-friendly way, to heterogeneous services classes, practices, jobs, projects, tutorials, evaluation, reservations, notices and messaging, through open and geopositioned data.
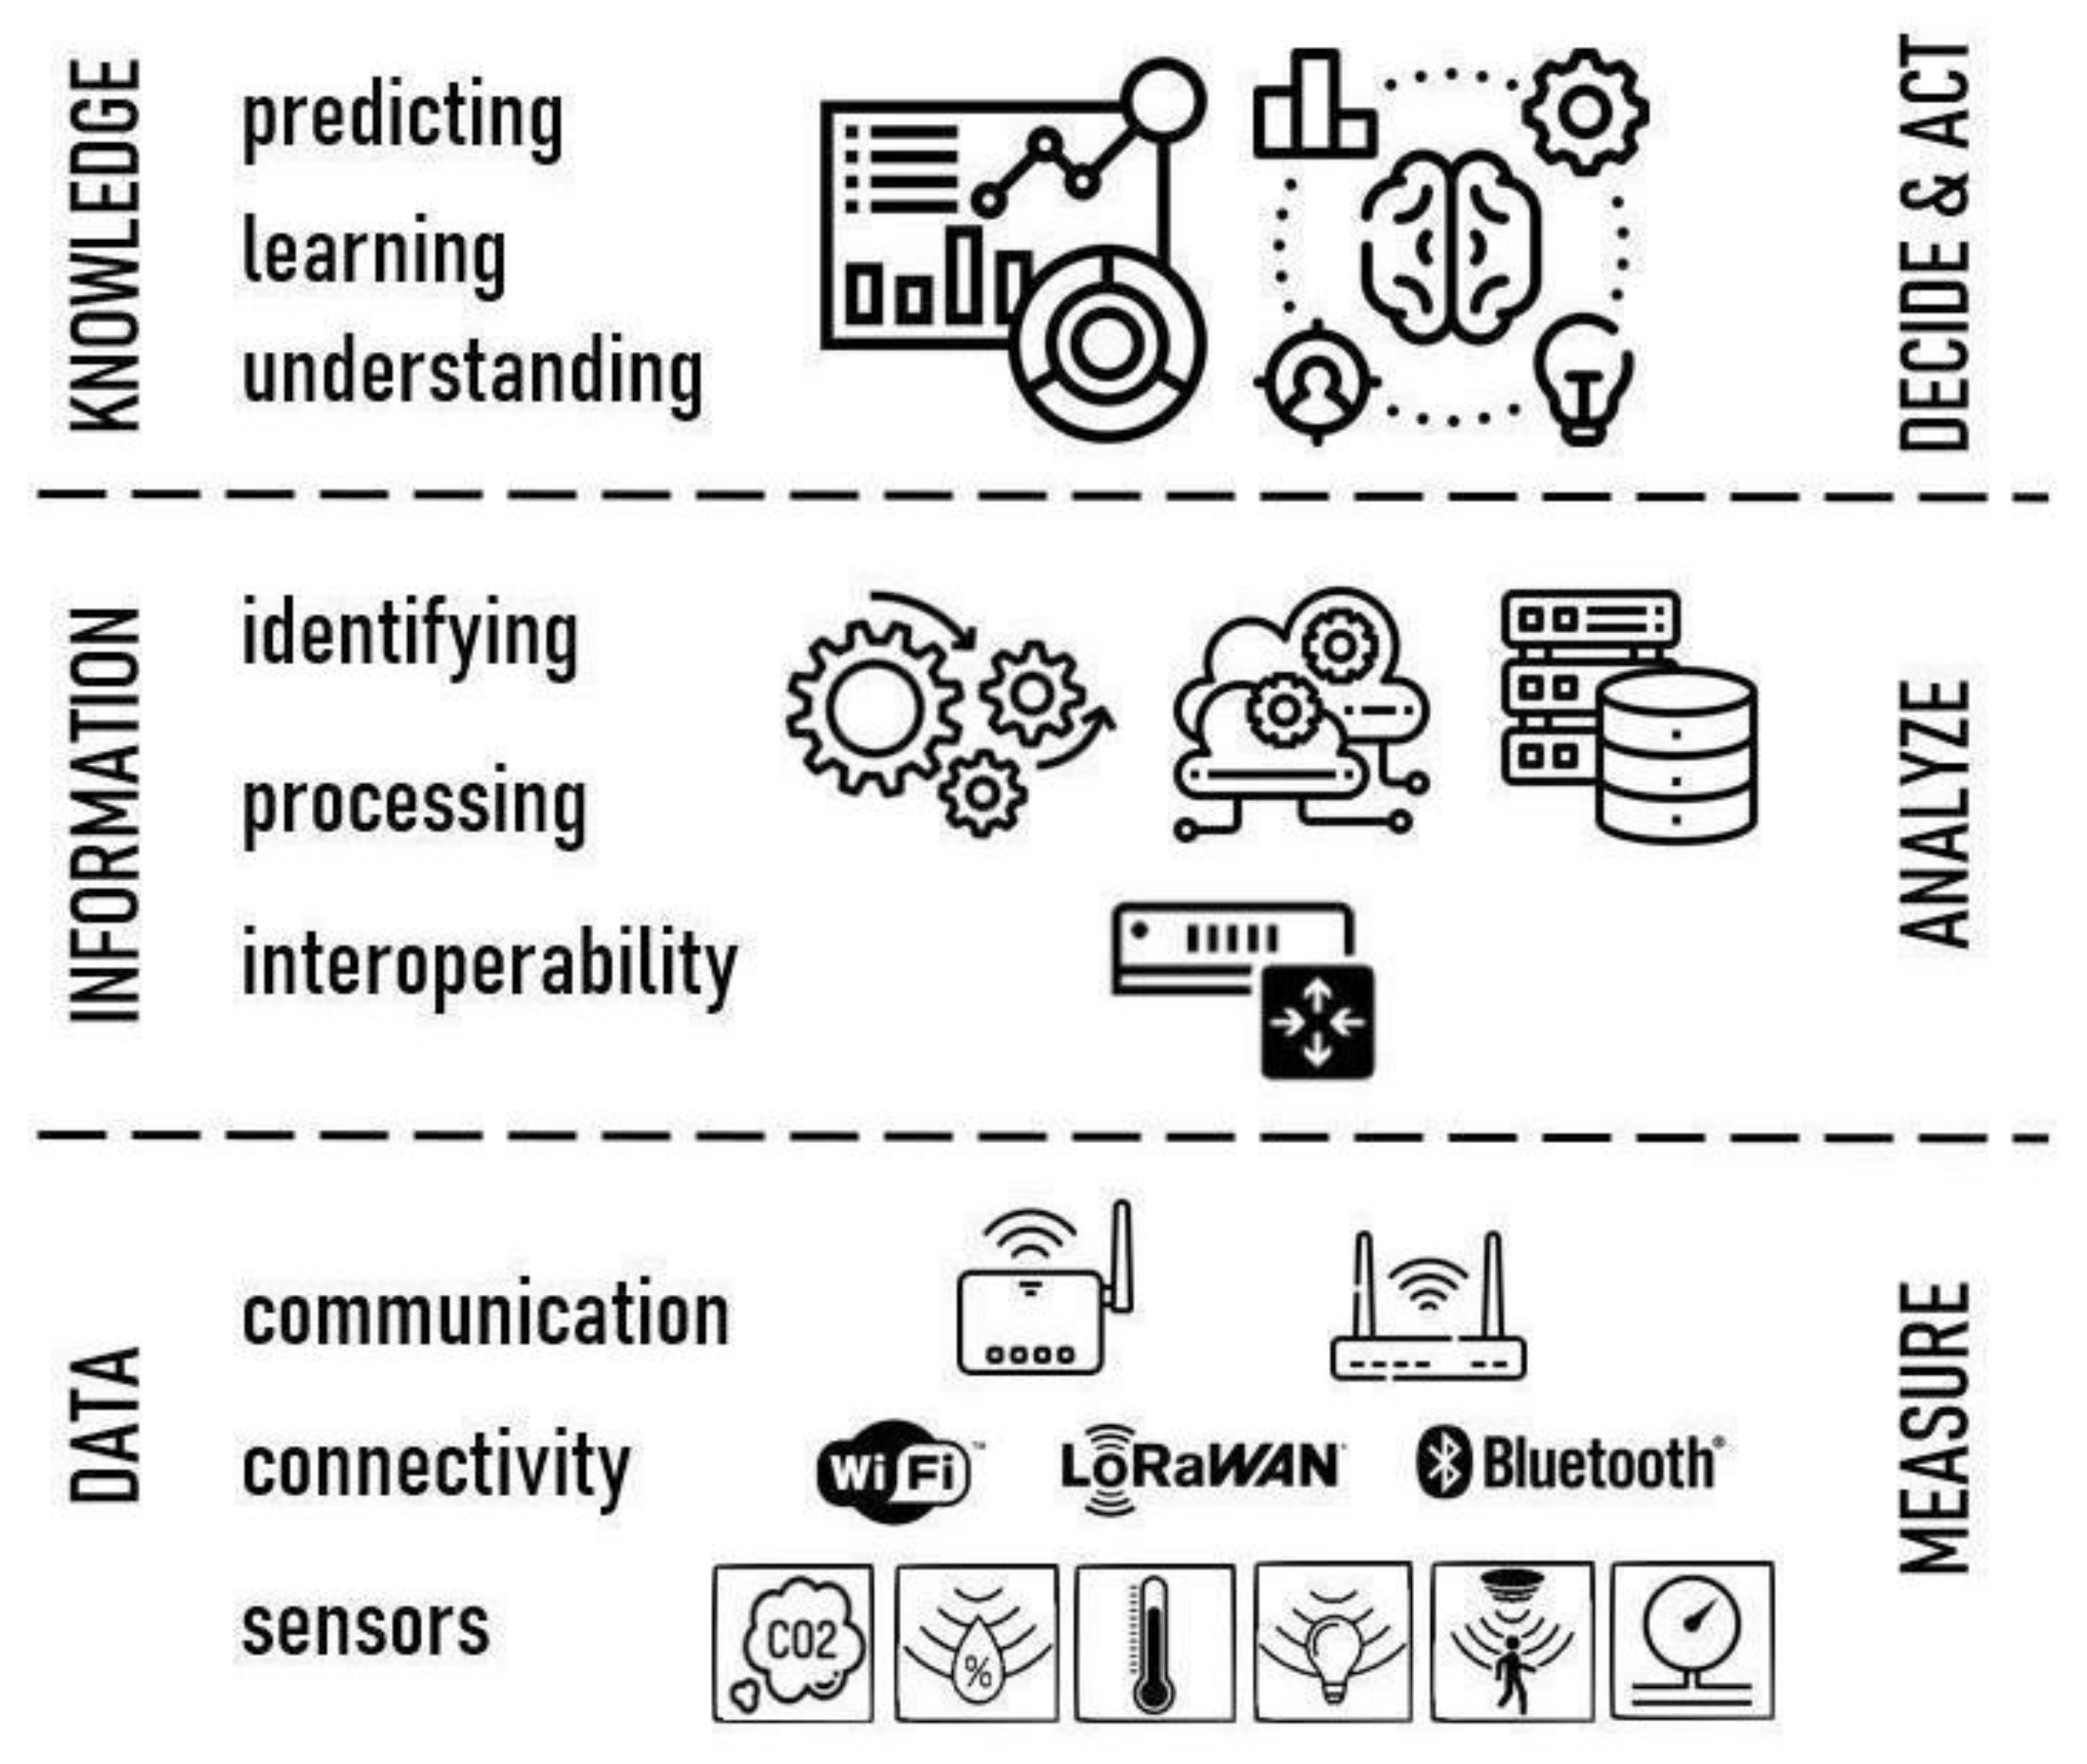
2.2. IoT Three-Level Model
2.2.1. Data Level
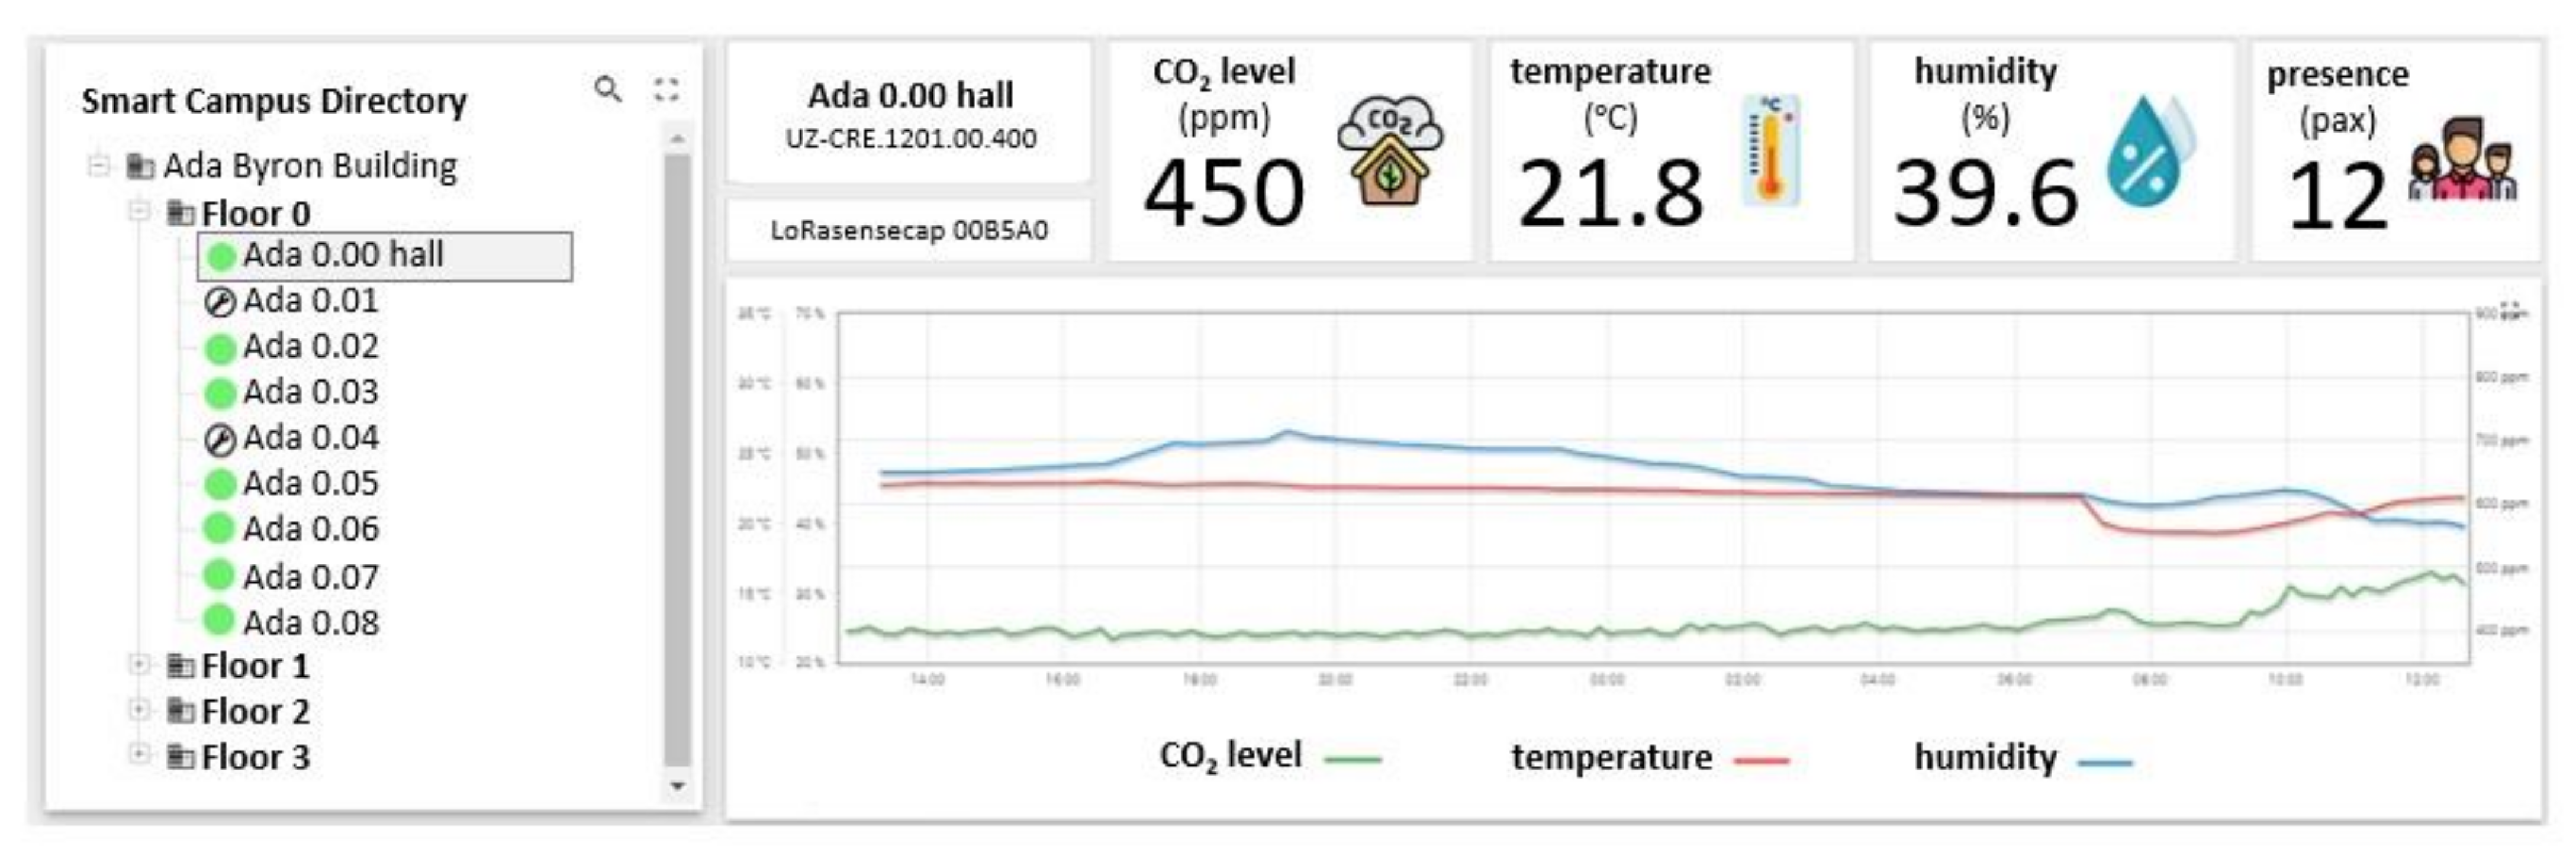
- CO2, lighting levels, temperature and humidity in different locations of the university buildings, e.g., corridors, offices, classrooms, restaurants and libraries, to assess thermal comfort and air quality conditions and determine when to use air conditioning systems or natural ventilation (opening windows, ventilation systems, etc.).
- Number/presence of people in the different rooms, obtained by different Quick Response (QR) code verification systems and mobile devices monitoring.
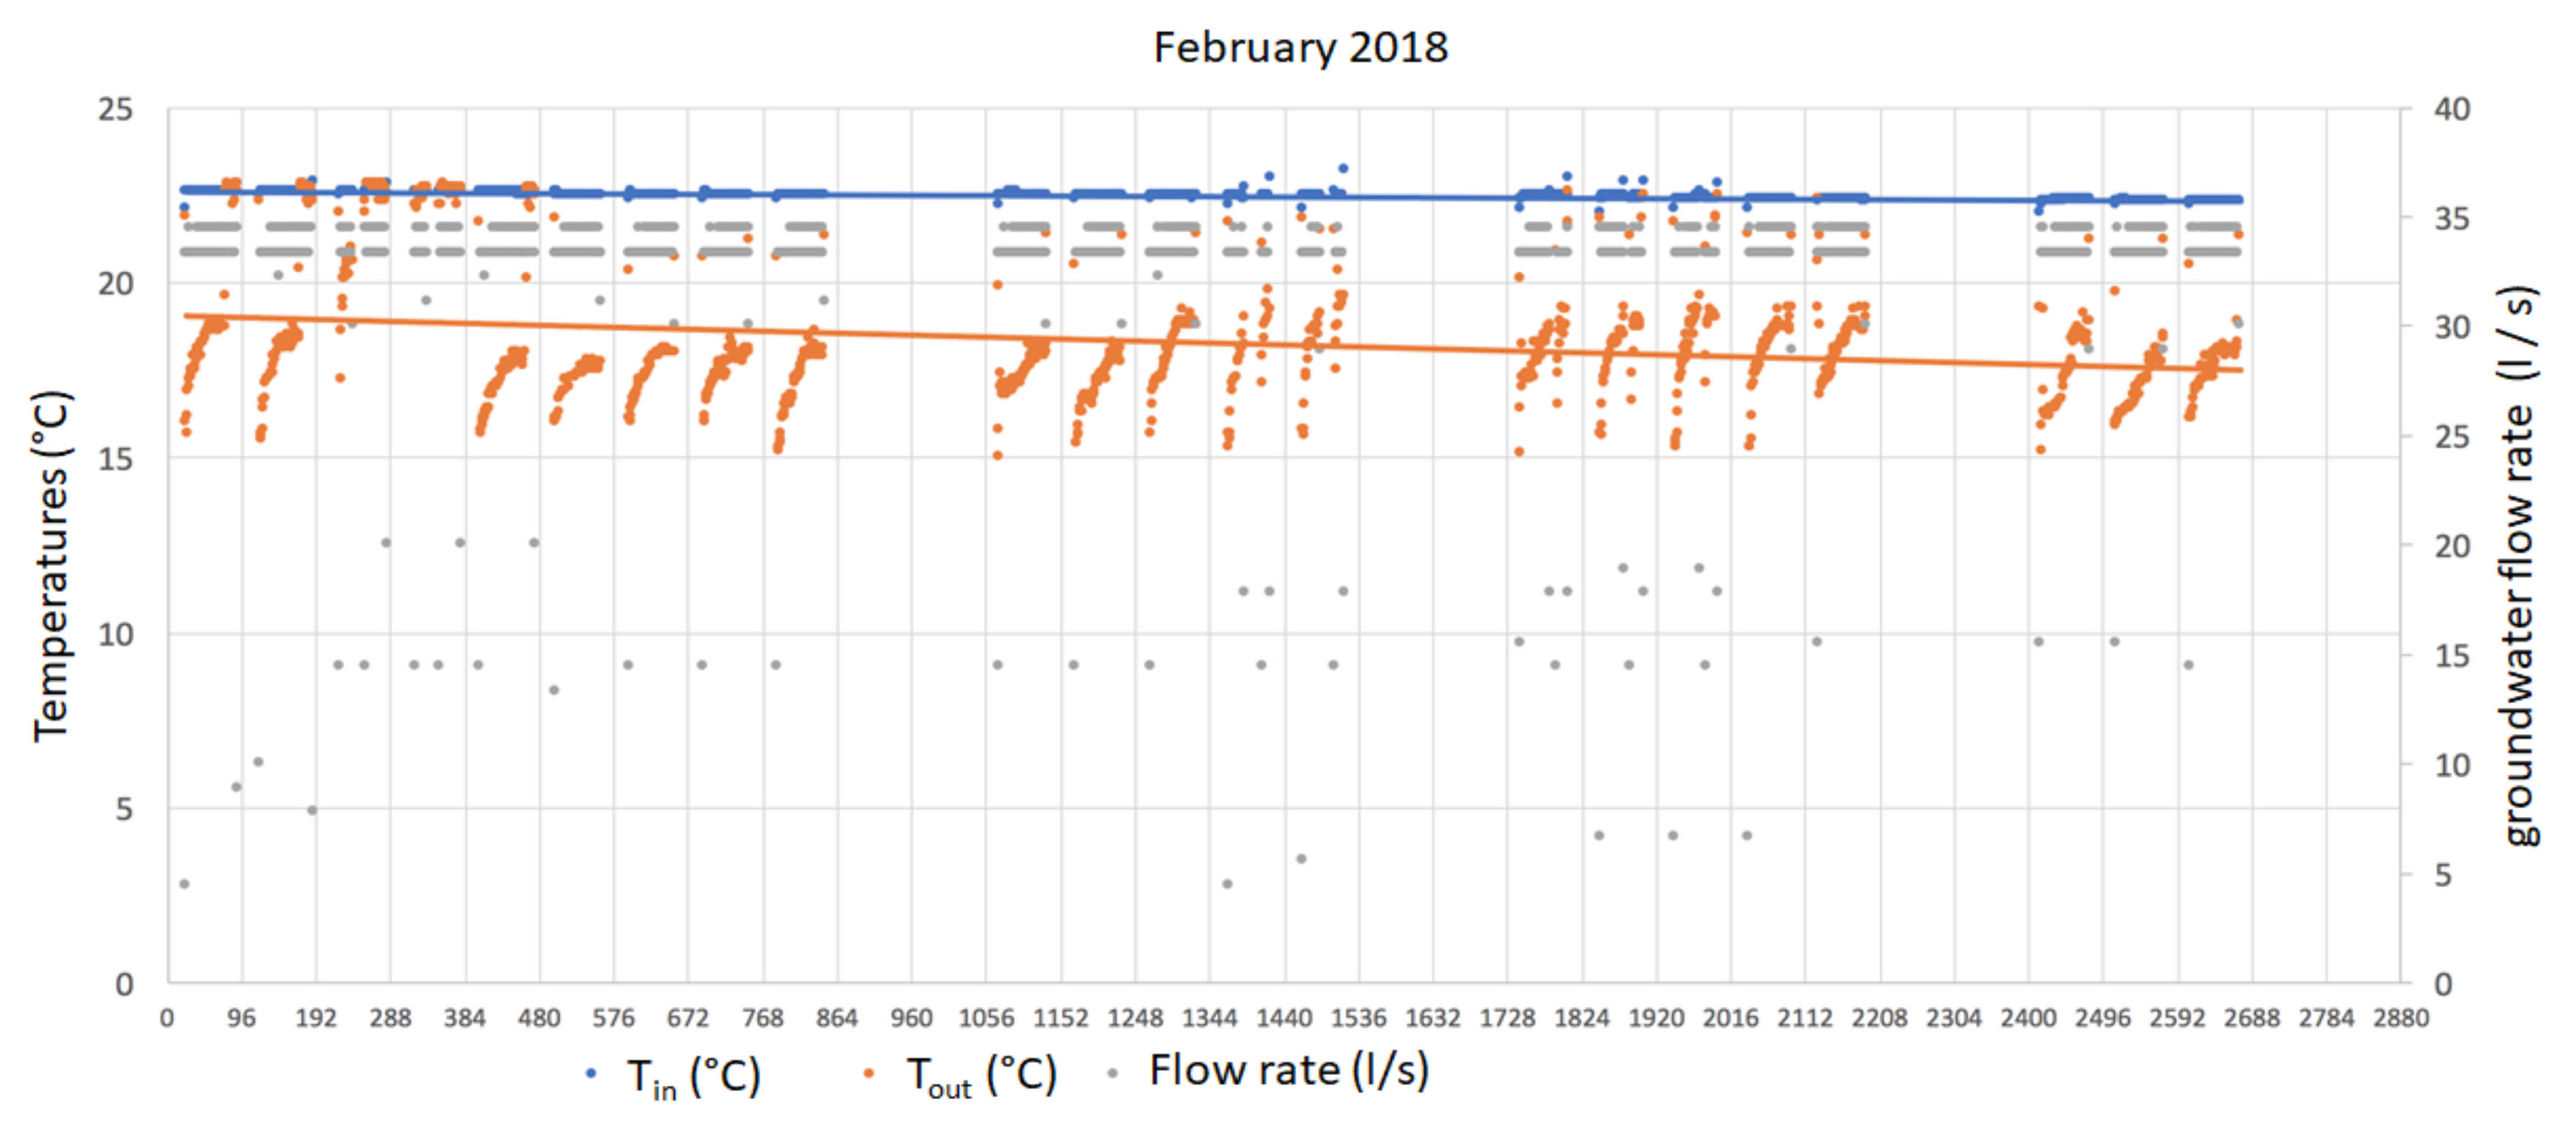
- Real-time electricity consumption, identifying unforeseen consumption, detecting unwanted ignitions, analysing specific information through Supervisory Control and Data Acquisition (SCADA) systems, such as temperatures in the heat-transfer fluids in supply and return.
- Electricity generation levels of the photovoltaic panels in order to analyse the efficiency of the renewable energies.
- Timetables and other parameters related to the mobility of the people in the university buildings, such as heat maps and access frequencies.
2.2.2. Information Level
2.2.3. Knowledge Level
- Services to detect inadequate operations in the facilities, such as malfunctioning systems, equipment that should be turned off at certain time slots, lower than expected performance, and high energy consumption.
- Predictive services with multiple applications, such as those able to predict the real performance of the facilities under specific circumstances and comfort parameters for users. For this purpose, learning how the non-residential buildings work in real scenarios is required. Thus, monitoring and acquiring historical data of the buildings and their context is key, e.g., data concerning the energy consumption of heaters and pumps, thermal inertias, and parameters about the passive behaviour of different rooms and buildings.
- Prescriptive or recommendation services that support suitable data-driven decision-making. For example, knowledge about the behaviour of Heating, Ventilating and Air Conditioning (HVAC) can help determine the timetable to switch the facilities and equipment of the buildings on/off. As another example, Model Predictive Control (MPC) supports an automatic and efficient control of the facilities (under a series of registry inputs) by considering the predictions obtained with the models.
3. Results
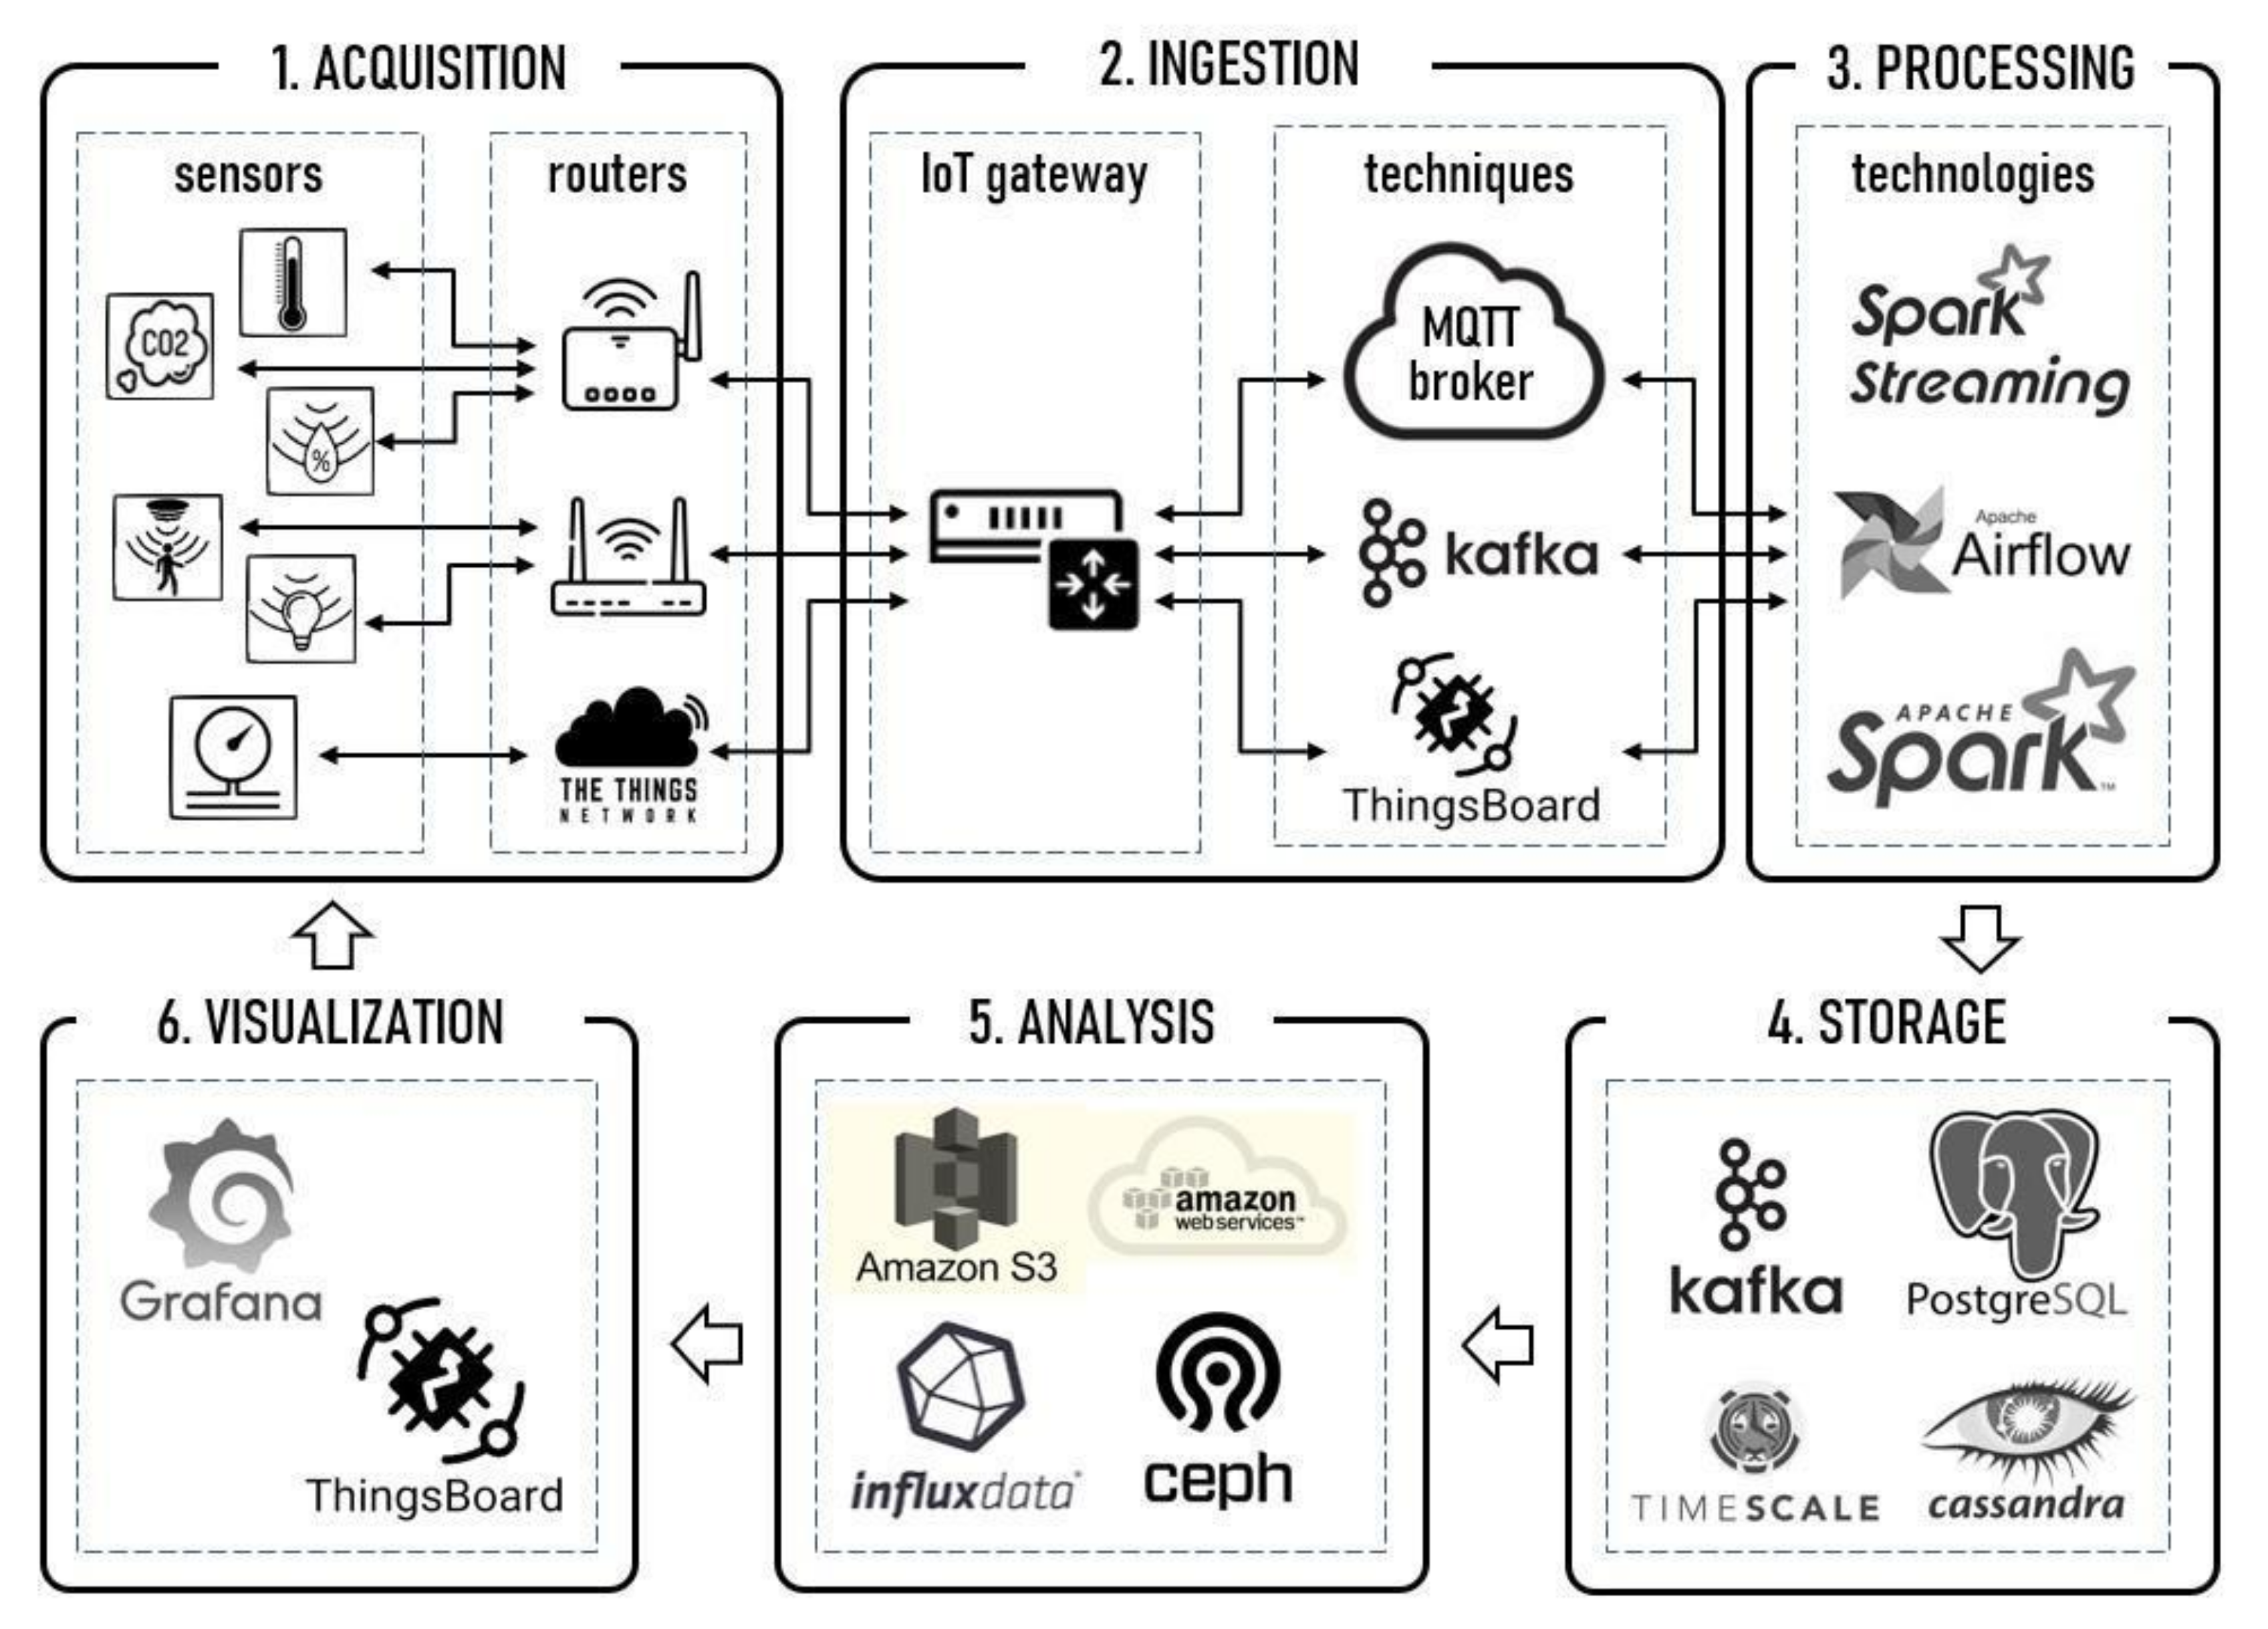
3.1. Architecture
- Acquisition. The first step is the origin of the data: where it is generated, at what speed, with what quality, etc. Firstly, the acquisition layer solves the heterogeneity of sensors, brands, models, manufacturers, etc. Secondly, this layer harmonises the connectivity problem between heterogeneous technologies, protocols, interconnection devices, etc. that will communicate in an interoperable way with the IoT gateway at the next layer.
- Ingestion. The ingestion layer is responsible for the data through the IoT gateway. It can include a wide variety of techniques, such as publication, subscription, batch processes and continuous flows. For this work, the proposed ingestion layer consisted of an IoT messaging server (MQTT broker), an event platform (Kafka) and a device management application (ThingsBoard). Thus, ingestion works through components specifically created for data collection with non-native sources or with indirect or restricted access.
- Processing. After the ingestion layer, the processing layer allows data transforming, if necessary, for later storage. Data processing can be implemented by batch or flow processing. Multiple technologies can perform this task, each with a specific purpose. Some technologies used in this project (all open-sourced) were Spark Streaming (for real-time, scalable data processing), Airflow (to manage, monitor and plan workflows) and Spark (as a clustered computing framework for distributed data processing).
- Storage. Generated data needs a medium storage, for subsequent consultation and analysis. To handle a large dataset, distributed storage systems, object repositories or specific storage technologies, such as graph and time-series databases, are required. Because of the data heterogeneity, this work used various storage technologies, including Kafka (as a distributed storage for raw data), PostgreSQL (as an object-oriented relational database management system), TimeScaleDB (as an optimised database for storing data as time series) and Cassandra (as a distributed storage, specific for time series). Thanks to this versatility, a broad integration of systems and services was achieved, along with the scalability, availability and reliability of the entire IoT ecosystem.
- Analysis. Many technologies exist for the extraction of characteristics, analysis and experimentation with the stored data. Because the tools are open-source, using standard formats and protocols, the architecture is flexible enough to apply different technologies depending on the analysis objective. This project, specifically for the heterogeneous features of the collected data, combined several big data analysis technologies, including Amazon Web Services (as tools and services set for cloud computing), Amazon S3 (as a specific service for secure objects management in the cloud), Ceph (as an open analysis system, defined by software, specific for large amounts of distributed data) and influxdb (as a reliable management system to visualise data time series, specific for IoT), among others.
- Visualisation. Finally, the visualisation layer is compatible with various display technologies, panels, browsers, etc. For this work, two environments were integrated: ThingsBoard (for short-term monitoring and control) and Grafana (for structured information from different data sources).
3.2. Infrastructures and Users
- Directorate and research—responsible for long term vision, coordination and system design.
- IT and IoT units—responsible for computer networks, servers and IoT infrastructure implementation.
- Technical, security, green office units—responsible for building subsystems (lighting, HVAC, alarms, etc.)
- Maintenance and concierge—responsible for daily operation, data monitoring and problem solving.
- Students and university staff—main users of the system as data consumers and generators.
3.3. Success Stories as a Proof-of-Concept of a Smart Campus
4. Discussion
5. Conclusions
Author Contributions
Funding
Data Availability Statement
Acknowledgments
Conflicts of Interest
References
- European Court of Auditors (ECA). Special Report. Energy Efficiency in Buildings: More Emphasis on Profitability. 2020. Available online: https://www.eca.europa.eu/Lists/ECADocuments/SR20_11/SR_Energy_efficiency_in_buildings_ES.pdf (accessed on 7 July 2021).
- EU Council. Executive Conclusions. Building a Sustainable Europe by 2030. Progress Thus Far and Next Steps. 2019. Available online: https://www.consilium.europa.eu/media/41693/se-st14835-en19.pdf (accessed on 7 July 2021).
- European Commission. A Renovation Wave for Europe. 2020. Available online: https://ec.europa.eu/energy/topics/energy-efficiency/energy-efficient-buildings/renovation-wave_en (accessed on 7 July 2021).
- European Commission. A European Green Deal. Striving to Be the First Climate-Neutral Continent. 2020. Available online: https://ec.europa.eu/info/strategy/priorities-2019-2024/european-green-deal_en (accessed on 7 July 2021).
- European Union Law. European Climate Law. Proposal for a Regulation of the European Parliament and of the Council Establishing the Framework for Achieving Climate Neutrality and Amending Regulation. 2018. Available online: https://eur-lex.europa.eu/legal-content/EN/TXT/?qid=1588581905912&uri=CELEX:52020PC0080 (accessed on 7 July 2021).
- Assaf, L. Audit procedures for the evaluation of lighting installations in non-residential buildings. In Efficient Lighting Initiative (ELI) Global Environmental Facility—IFC World Bank, EDESUR, National University of Tucumán. 2011. Chapter 16, 35p. Available online: https://www.researchgate.net/publication/317084293_Procedimiento_de_Auditorias_para_la_Evaluacion_de_Instalaciones_de_Iluminacion_de_Edificios_no_Residenciales (accessed on 7 July 2021).
- Spanish Government. Long-Term Strategy for Energy Rehabilitation in Building Sector (ERESEE). 2020. Available online: https://www.mitma.gob.es/el-ministerio/planes-estrategicos/estrategia-a-largo-plazo-para-la-rehabilitacion-energetica-en-el-sector-de-la-edificacion-en-espana (accessed on 7 July 2021).
- Dave, E. Internet of Things, How the Next Evolution of the Internet Is Changing Everything. Cisco Internet Business Solutions Group (IBSG). 2011. Available online: https://www.cisco.com/c/dam/en_us/about/ac79/docs/innov/IoT_IBSG_0411FINAL.pdf (accessed on 7 July 2021).
- Atzori, L.; Iera, A.; Morabito, G. The Internet of Things: A survey. Comput. Netw. 2010, 54, 2787–2805. [Google Scholar] [CrossRef]
- Says, G. 6.4 Billion Connected Things Will Be in Use in 2016, up 30 Percent from 2015. Gartner Inc. 2015. Available online: http://www.gartner.com/newsroom/id/3165317 (accessed on 7 July 2021).
- Ashraf, Q.M.; Yusoff, M.I.M.; Azman, A.A.; Nor, N.M.; Fuzi, N.A.A.; Saharedan, M.S.; Omar, N.A. Energy monitoring prototype for IoT. In Proceedings of the IEEE World Forum on Internet of Things, Milan, Italy, 14–16 December 2015; pp. 1–5, ISBN 978-1-5090-0366-2. [Google Scholar]
- Schelter, S.; Lange, D.; Schmidt, P.; Celikel, M.; Biessmann, F.; Grafberger, A. Automating Large-Scale Data Quality Verification. VLDB Endow. 2018, 11, 1781–1794. [Google Scholar] [CrossRef] [Green Version]
- UNESCO. Recommendation on Open Science. 2021. Available online: https://en.unesco.org/science-sustainable-future/open-science/recommendation (accessed on 7 July 2021).
- Durier, F.; Carrié, R.; Sherman, M. Whats Is Smart Ventilation? Air Infiltration and Ventilation Centre, AIVC VIP 38. 2018. Available online: https://www.aivc.org/resource/vip-38-what-smart-ventilation (accessed on 7 July 2021).
- Pantazaras, A.; Lee, S.E.; Santamouris, M.; Yang, J. Predicting the CO2 levels in buildings using deterministic and identified models. Energy Build. 2016, 127, 774–785. [Google Scholar] [CrossRef]
- Spanish Government. Report on Prospective and Future Evolution of Air Conditioning and ACS Systems in Tertiary Buildings. 2019. Available online: https://www.mitma.gob.es/el-ministerio/planes-estrategicos/estrategia-a-largo-plazo-para-la-rehabilitacion-energetica-en-el-sector-de-la-edificacion-en-espana (accessed on 7 July 2021).
- Tang, S.; Shelden, D.R.; Eastman, C.M.; Pishdad-Bozorgi, P.; Gao, X. A review of building information modeling (BIM) and the Internet of Things (IoT) devices integration: Present status and future trends. Autom. Constr. 2019, 101, 127–139. [Google Scholar] [CrossRef]
- Lawal, K.; Rafsanjani, H.N. Trends, benefits, risks, and challenges of IoT implementation in residential and commercial buildings. Energy Built Environ. 2021, in press. [Google Scholar] [CrossRef]
- Pocero, L.; Amaxilatis, D.; Mylonas, G.; Chatzigiannakis, I. Open source IoT meter devices for smart and energy-efficient school buildings. HardwareX 2017, 1, 54–67. [Google Scholar] [CrossRef]
- Poongothai, M.; Subramanian, P.M.; Rajeswari, A. Design and Implementation of IoT Based Smart Laboratory. In Proceedings of the International Conference on Industrial Engineering and Applications (ICIEA), Singapore, 26–28 April 2018; pp. 169–173. [Google Scholar] [CrossRef]
- European Commission. Energy Performance of Buildings Directive. 2018. Available online: https://ec.europa.eu/energy/topics/energy-efficiency/energy-efficient-buildings/energy-performance-buildings-directive_en (accessed on 7 July 2021).
- European Commission. Smart Readiness Indicator (SRI) for Buildings. 2018. Available online: https://smartreadinessindicator.eu/ (accessed on 7 July 2021).
- European Commission. Outcomes of the First Technical Study about SRI. 2018. Available online: https://smartreadinessindicator.eu/1st-technical-study-outcome (accessed on 7 July 2021).
- Ramezani, B.; da Silva, M.G.; Simões, N. Application of smart readiness indicator for Mediterranean buildings in retrofitting actions. Energy Build. 2021, in press. [Google Scholar] [CrossRef]
- Blanco, T.; Marco, A.; Casas, R. Online social networks as a tool to support people with special needs. Comput. Commun. 2016, 73, 315–331. [Google Scholar] [CrossRef]
- Blanco, T.; Casas, R.; López-Pérez, J.M. Common Understanding Area (CUA): An x-disciplinary design tool for technological innovation. In Proceedings of the Technologies Applied to Electronics Teaching Conference (IEEE TAEE), La Laguna, Spain, 20–22 June 2018; pp. 1–8. [Google Scholar]
- Stickdorn, M.; Schneider, J. This Is Service Design Thinking: Basics, Tools, Cases; Wiley: Hoboken, NJ, USA, 2011. [Google Scholar]
- Testo 480 Certified Calibration Device. 2021. Available online: https://www.testo.com/es-ES/instrumento-multi-parametro-testo-480/p/0563-4800 (accessed on 7 July 2021).
- Yao, Y.; Shekhar, D.K. State of the art review on model predictive control (MPC) in Heating Ventilation and Air-conditioning (HVAC) field. Build. Environ. 2021, 200, 107952. [Google Scholar] [CrossRef]
- Adelantado, F.; Vilajosana, X.; Tuset-Peiro, P.; Martinez, B.; Melia-Segui, J.; Watteyne, T. Understanding the Limits of LoRaWAN. IEEE Commun. Mag. 2017, 55, 34–40. [Google Scholar] [CrossRef] [Green Version]
- Air-Quality Parameters. Product Catalogue for Digital Industries and Smart Infrastructure. 2021. Available online: https://mall.industry.siemens.com/mall/en/WW/Catalog/Products/10274404# (accessed on 7 July 2021).
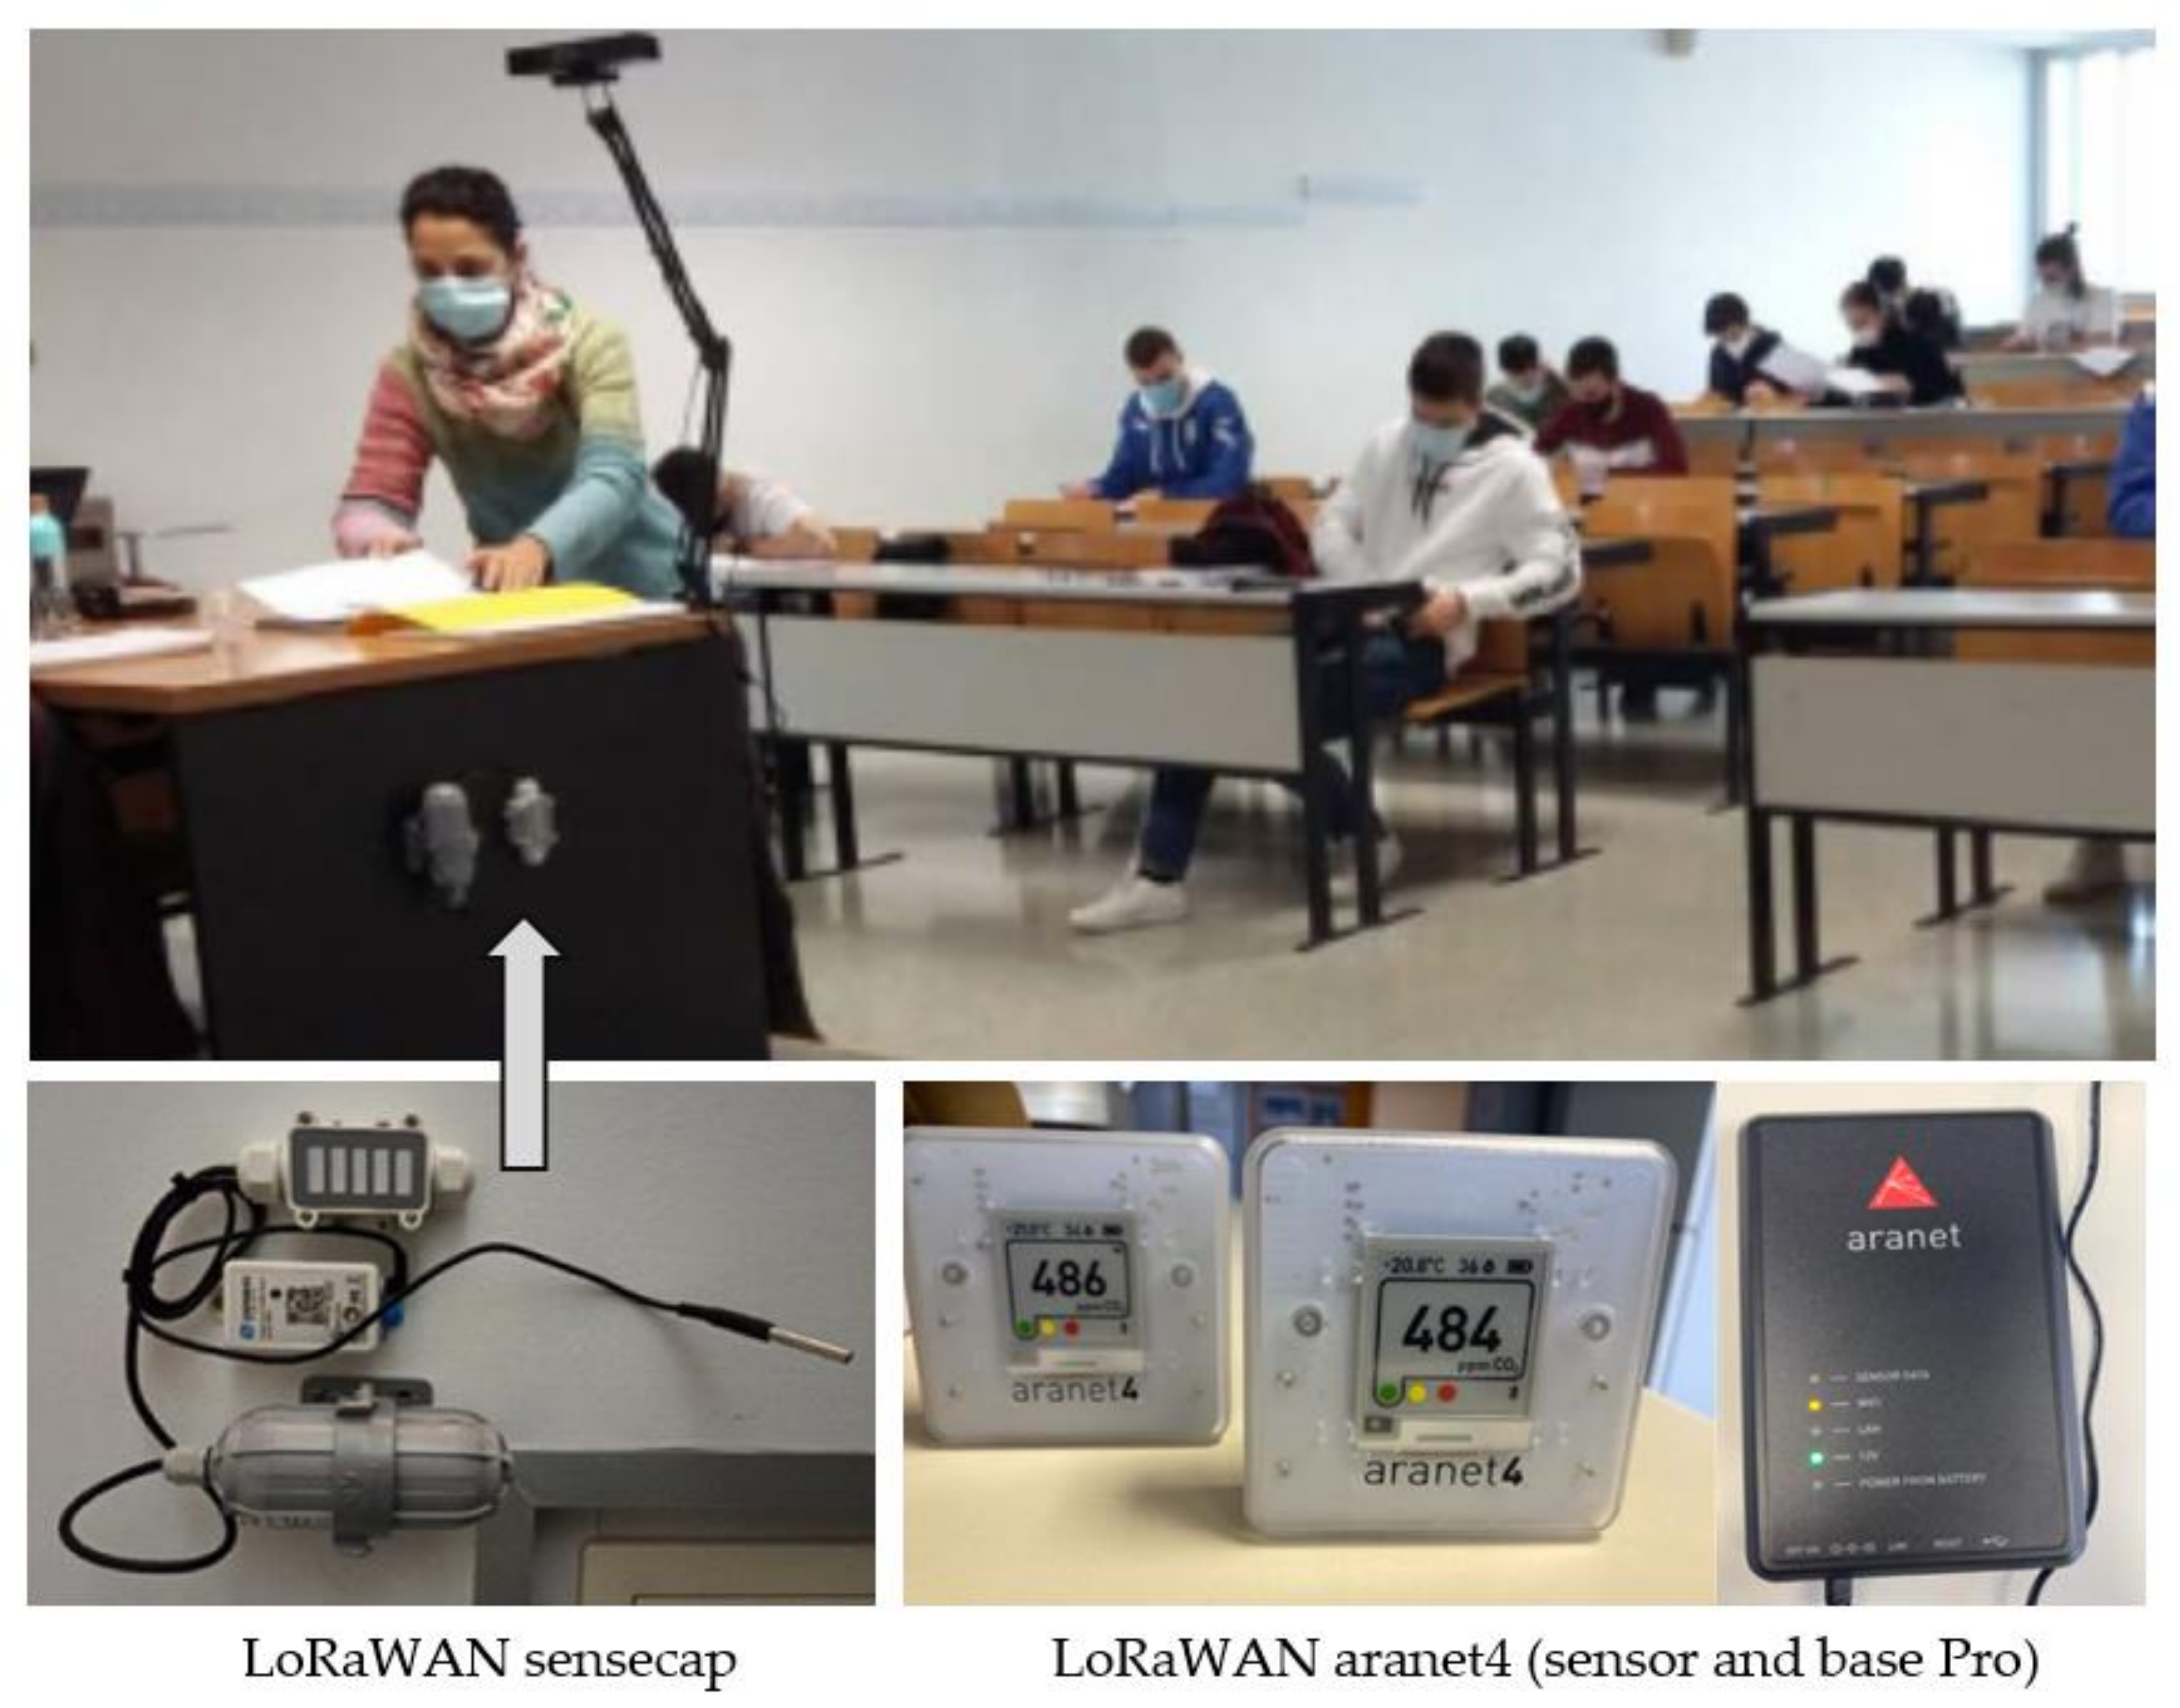
- SenseCAP Wireless CO2 Sensor LoRaWAN AU915 MHz. Features, System Architecture and Product Details. 2021. Available online: https://www.seeedstudio.com/SenseCAP-LoRaWAN-CO2-Sensor-LoRaWAN-AU915-p-4975.html (accessed on 7 July 2021).
- Aranet 4 Pro. Specifications and Technical Documentation. 2021. Available online: https://aranet.com/product/aranet4-sensor/ (accessed on 7 July 2021).
- ISO 50001:2018 Standard. Energy Management Systems. Requirements with Guidance for Use. 2018. Available online: https://www.iso.org/obp/ui/es/#iso:std:iso:50001:ed-2:v1:es (accessed on 7 July 2021).
- Siemens PAC3200 Power Meter. Functional Features. 2021. Available online: https://www.siemens.com/download?BTLV_50409 (accessed on 7 July 2021).
- Spanish Government. Technical Building Code (CTE). 2017. Available online: https://www.codigotecnico.org/DocumentosCTE/AhorroEnergia.html (accessed on 7 July 2021).
- IDEA Study. Sectorial Energy Monitoring. Educational Centers: Universities. 2012. Available online: https://www.idae.es/uploads/documentos/documentos_IDAE_Memoria_Anual_2012_08fa77c5.pdf (accessed on 7 July 2021).


| Set-Up | Sensor Cost (€) | Connectivity Cost (€) | Indoor Range (m) | Disadvantages | Advantages |
|---|---|---|---|---|---|
| wired sensor wired gateway | 10–25 | 150–250 | 100–250 | installation | low cost reliability |
| wired sensor wireless gateway | 10–25 | 150–250 | 15–40 | connectivity | low cost high adaptability |
| LoRaWAN sensor commercial solutions | 250–400 | 450–900 | 1000–1500 | high cost low adaptability | good scalability |
| LoRaWAN sensor open IoT network | 250–400 | 250–400 | 1000–1500 | medium cost | good scalability high adaptability |
Publisher’s Note: MDPI stays neutral with regard to jurisdictional claims in published maps and institutional affiliations. |
© 2021 by the authors. Licensee MDPI, Basel, Switzerland. This article is an open access article distributed under the terms and conditions of the Creative Commons Attribution (CC BY) license (https://creativecommons.org/licenses/by/4.0/).
Share and Cite
Martínez, I.; Zalba, B.; Trillo-Lado, R.; Blanco, T.; Cambra, D.; Casas, R. Internet of Things (IoT) as Sustainable Development Goals (SDG) Enabling Technology towards Smart Readiness Indicators (SRI) for University Buildings. Sustainability 2021, 13, 7647. https://doi.org/10.3390/su13147647
Martínez I, Zalba B, Trillo-Lado R, Blanco T, Cambra D, Casas R. Internet of Things (IoT) as Sustainable Development Goals (SDG) Enabling Technology towards Smart Readiness Indicators (SRI) for University Buildings. Sustainability. 2021; 13(14):7647. https://doi.org/10.3390/su13147647
Chicago/Turabian StyleMartínez, Ignacio, Belén Zalba, Raquel Trillo-Lado, Teresa Blanco, David Cambra, and Roberto Casas. 2021. "Internet of Things (IoT) as Sustainable Development Goals (SDG) Enabling Technology towards Smart Readiness Indicators (SRI) for University Buildings" Sustainability 13, no. 14: 7647. https://doi.org/10.3390/su13147647
APA StyleMartínez, I., Zalba, B., Trillo-Lado, R., Blanco, T., Cambra, D., & Casas, R. (2021). Internet of Things (IoT) as Sustainable Development Goals (SDG) Enabling Technology towards Smart Readiness Indicators (SRI) for University Buildings. Sustainability, 13(14), 7647. https://doi.org/10.3390/su13147647