
Water Footprint Assessment of Food Loss and Waste Management Strategies in Spanish Regions


 ,
,  and
and 
Abstract
:1. Introduction
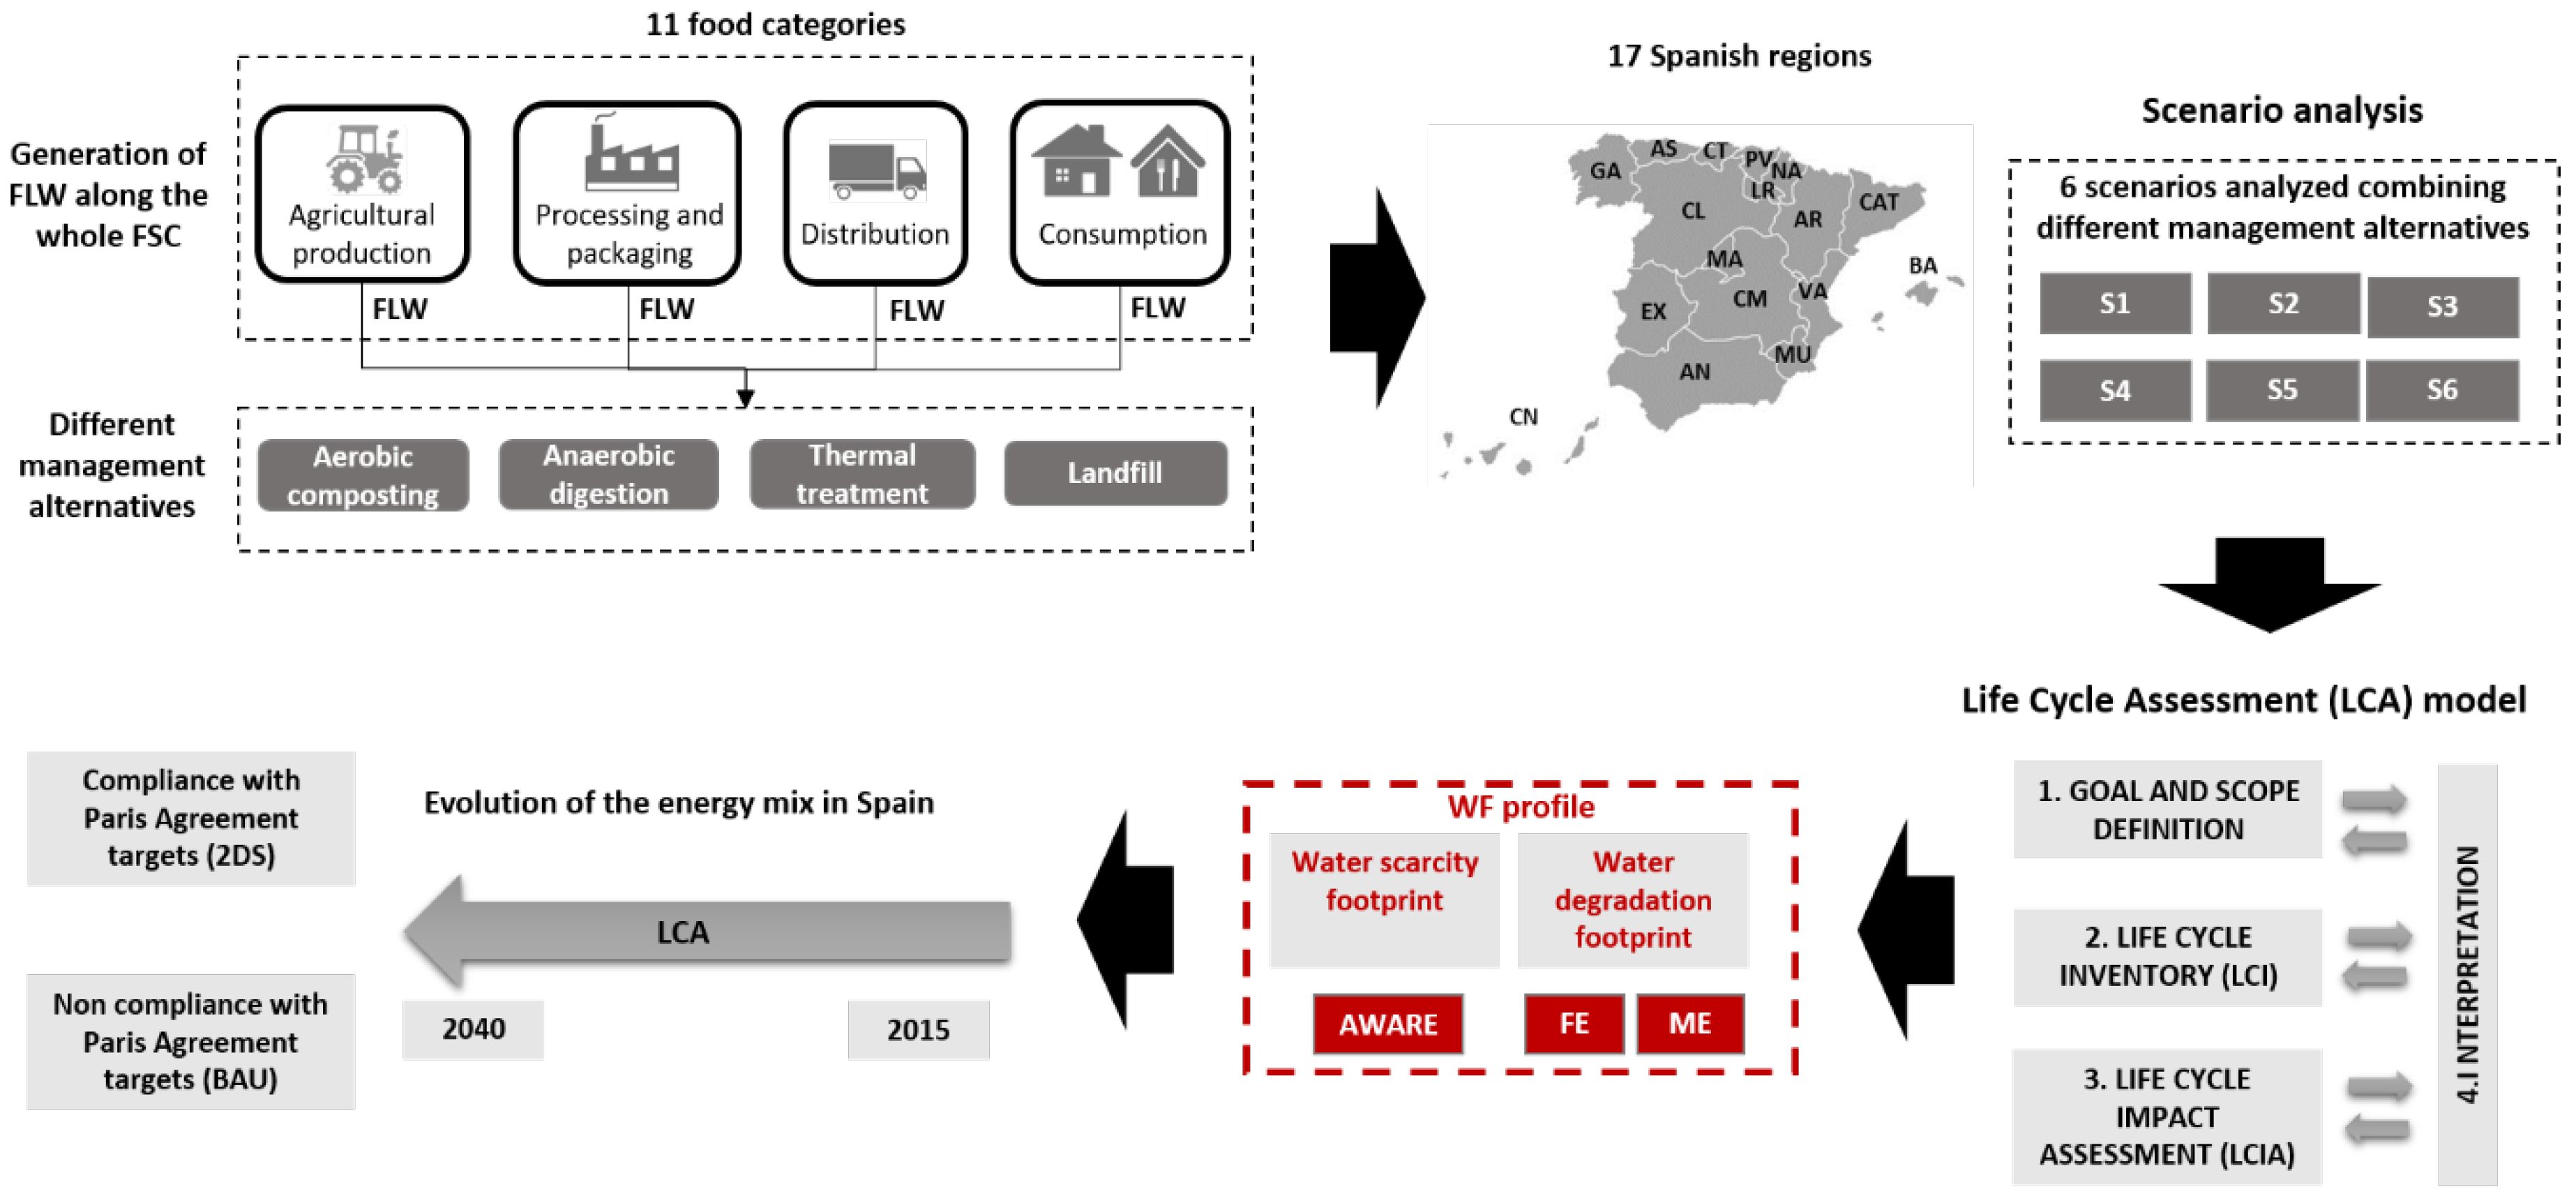
2. Methods
2.1. Goal, Function, and Functional Unit Definition
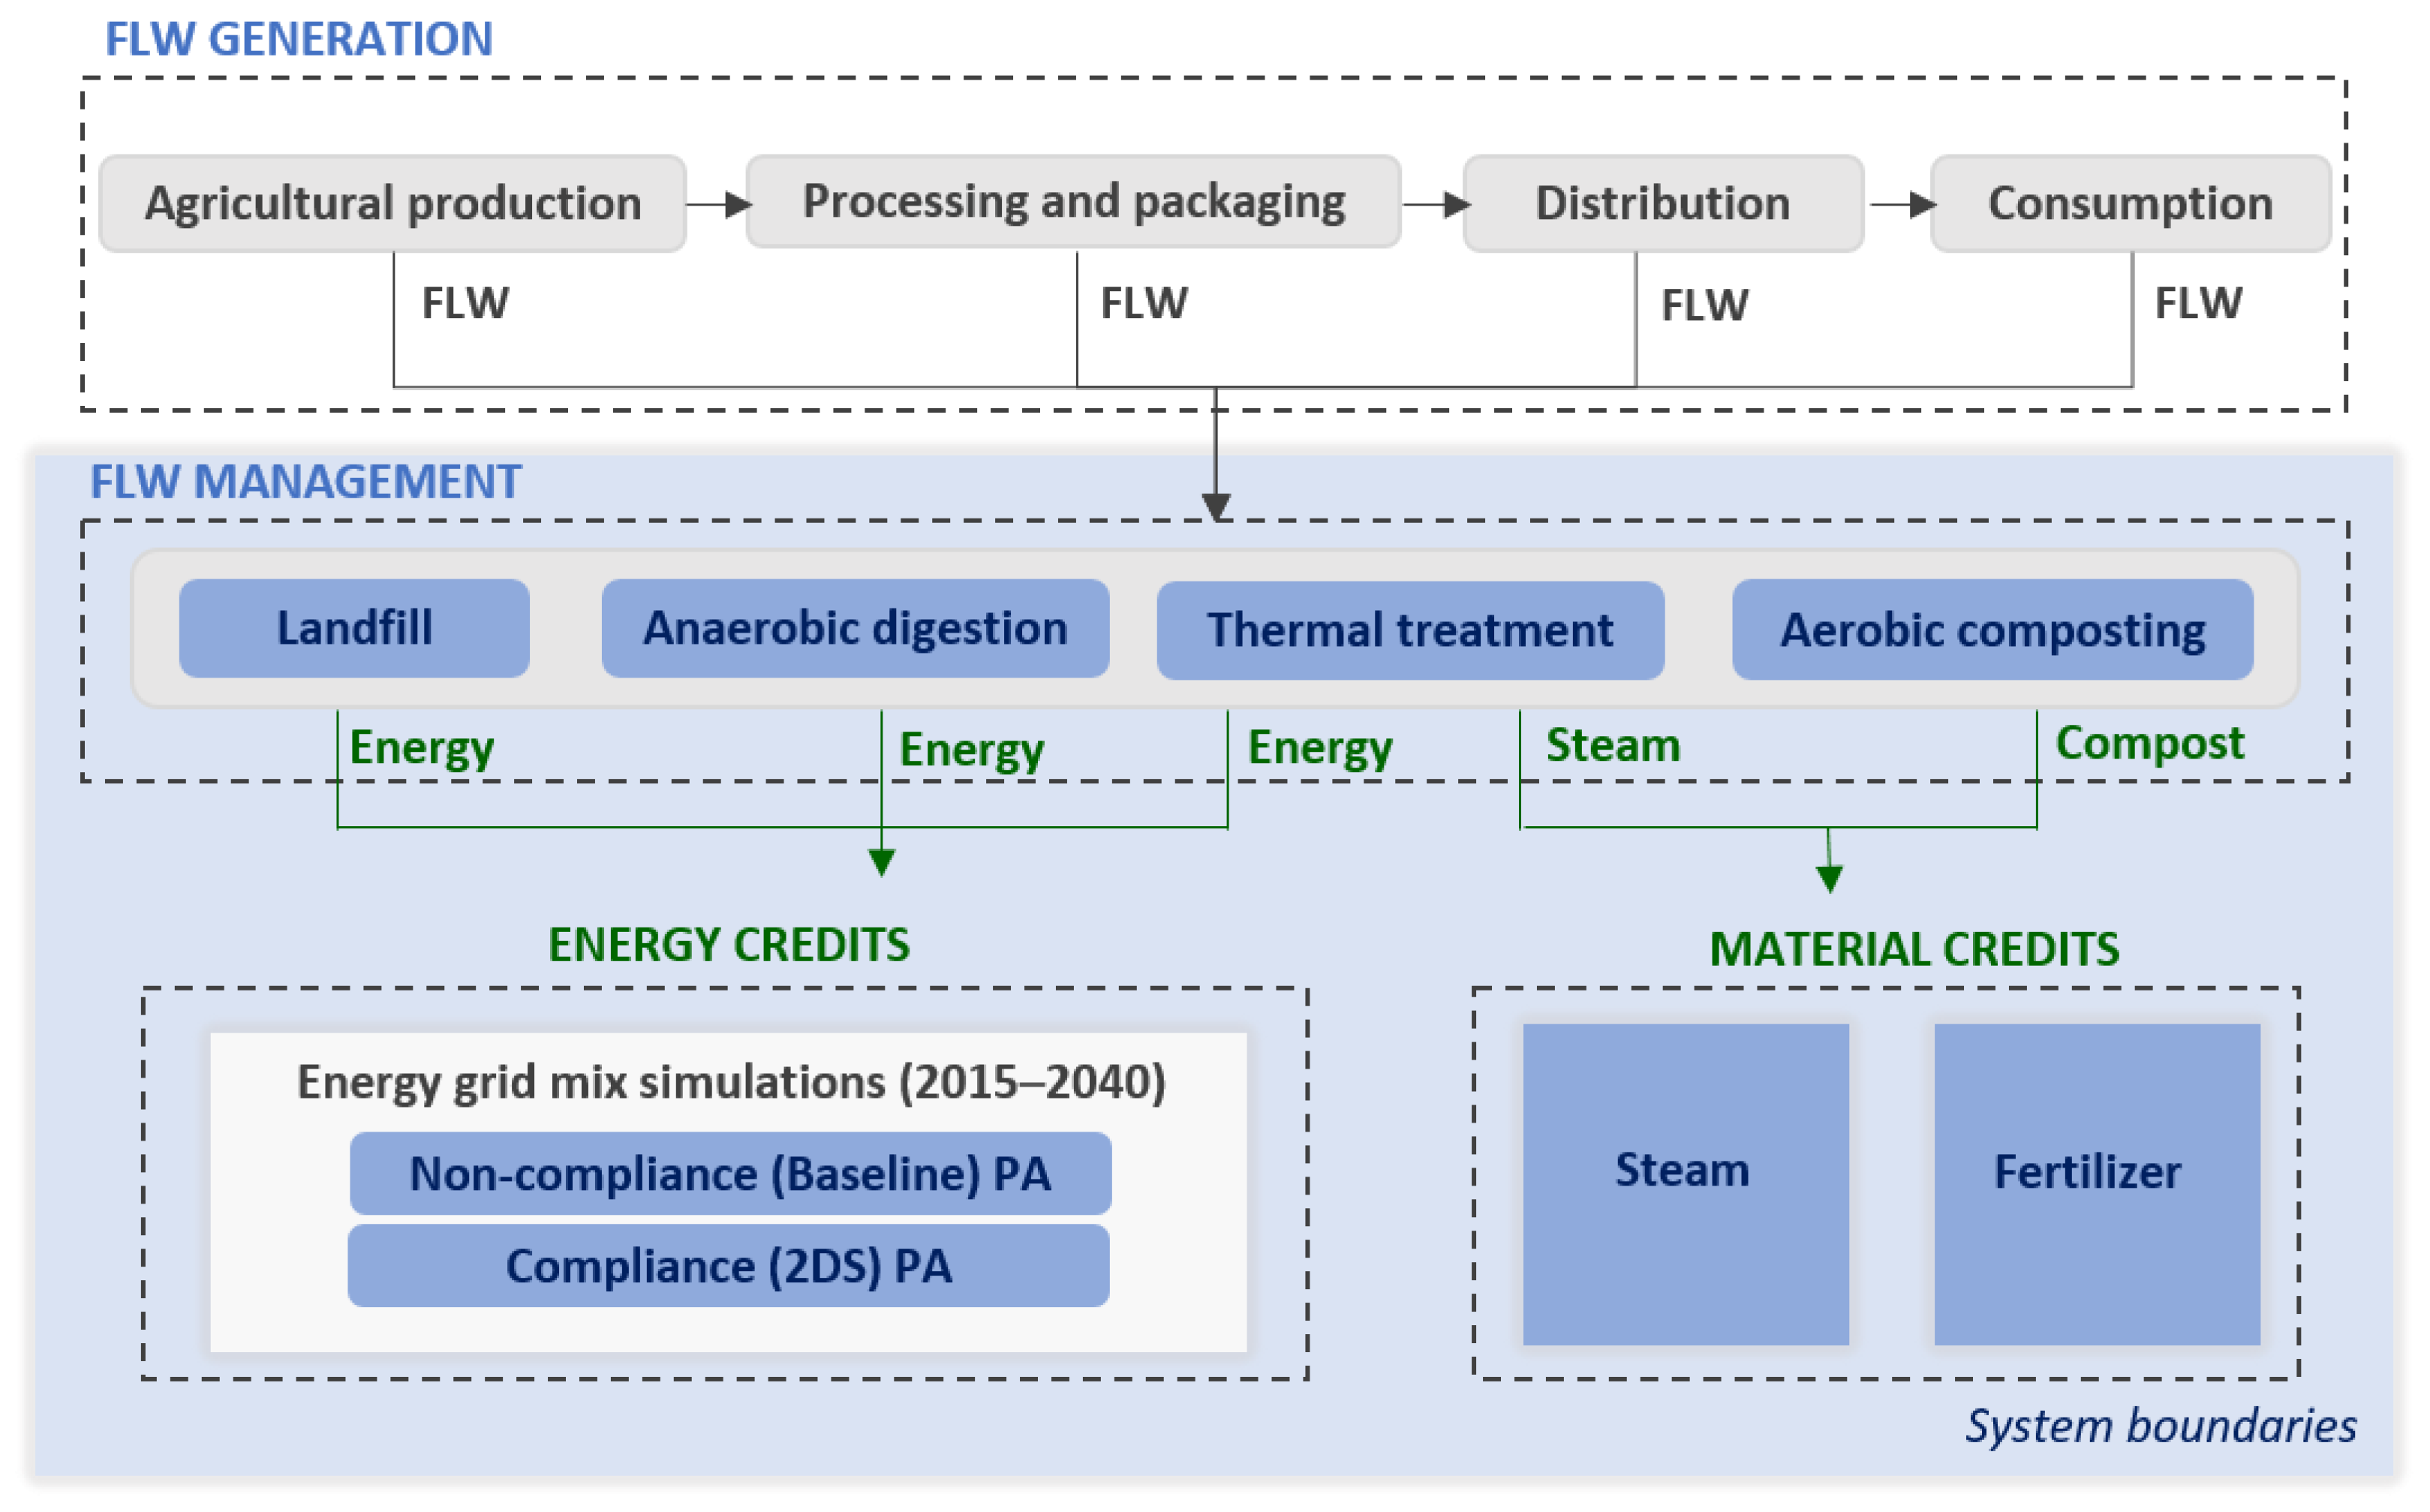
2.2. System Boundaries
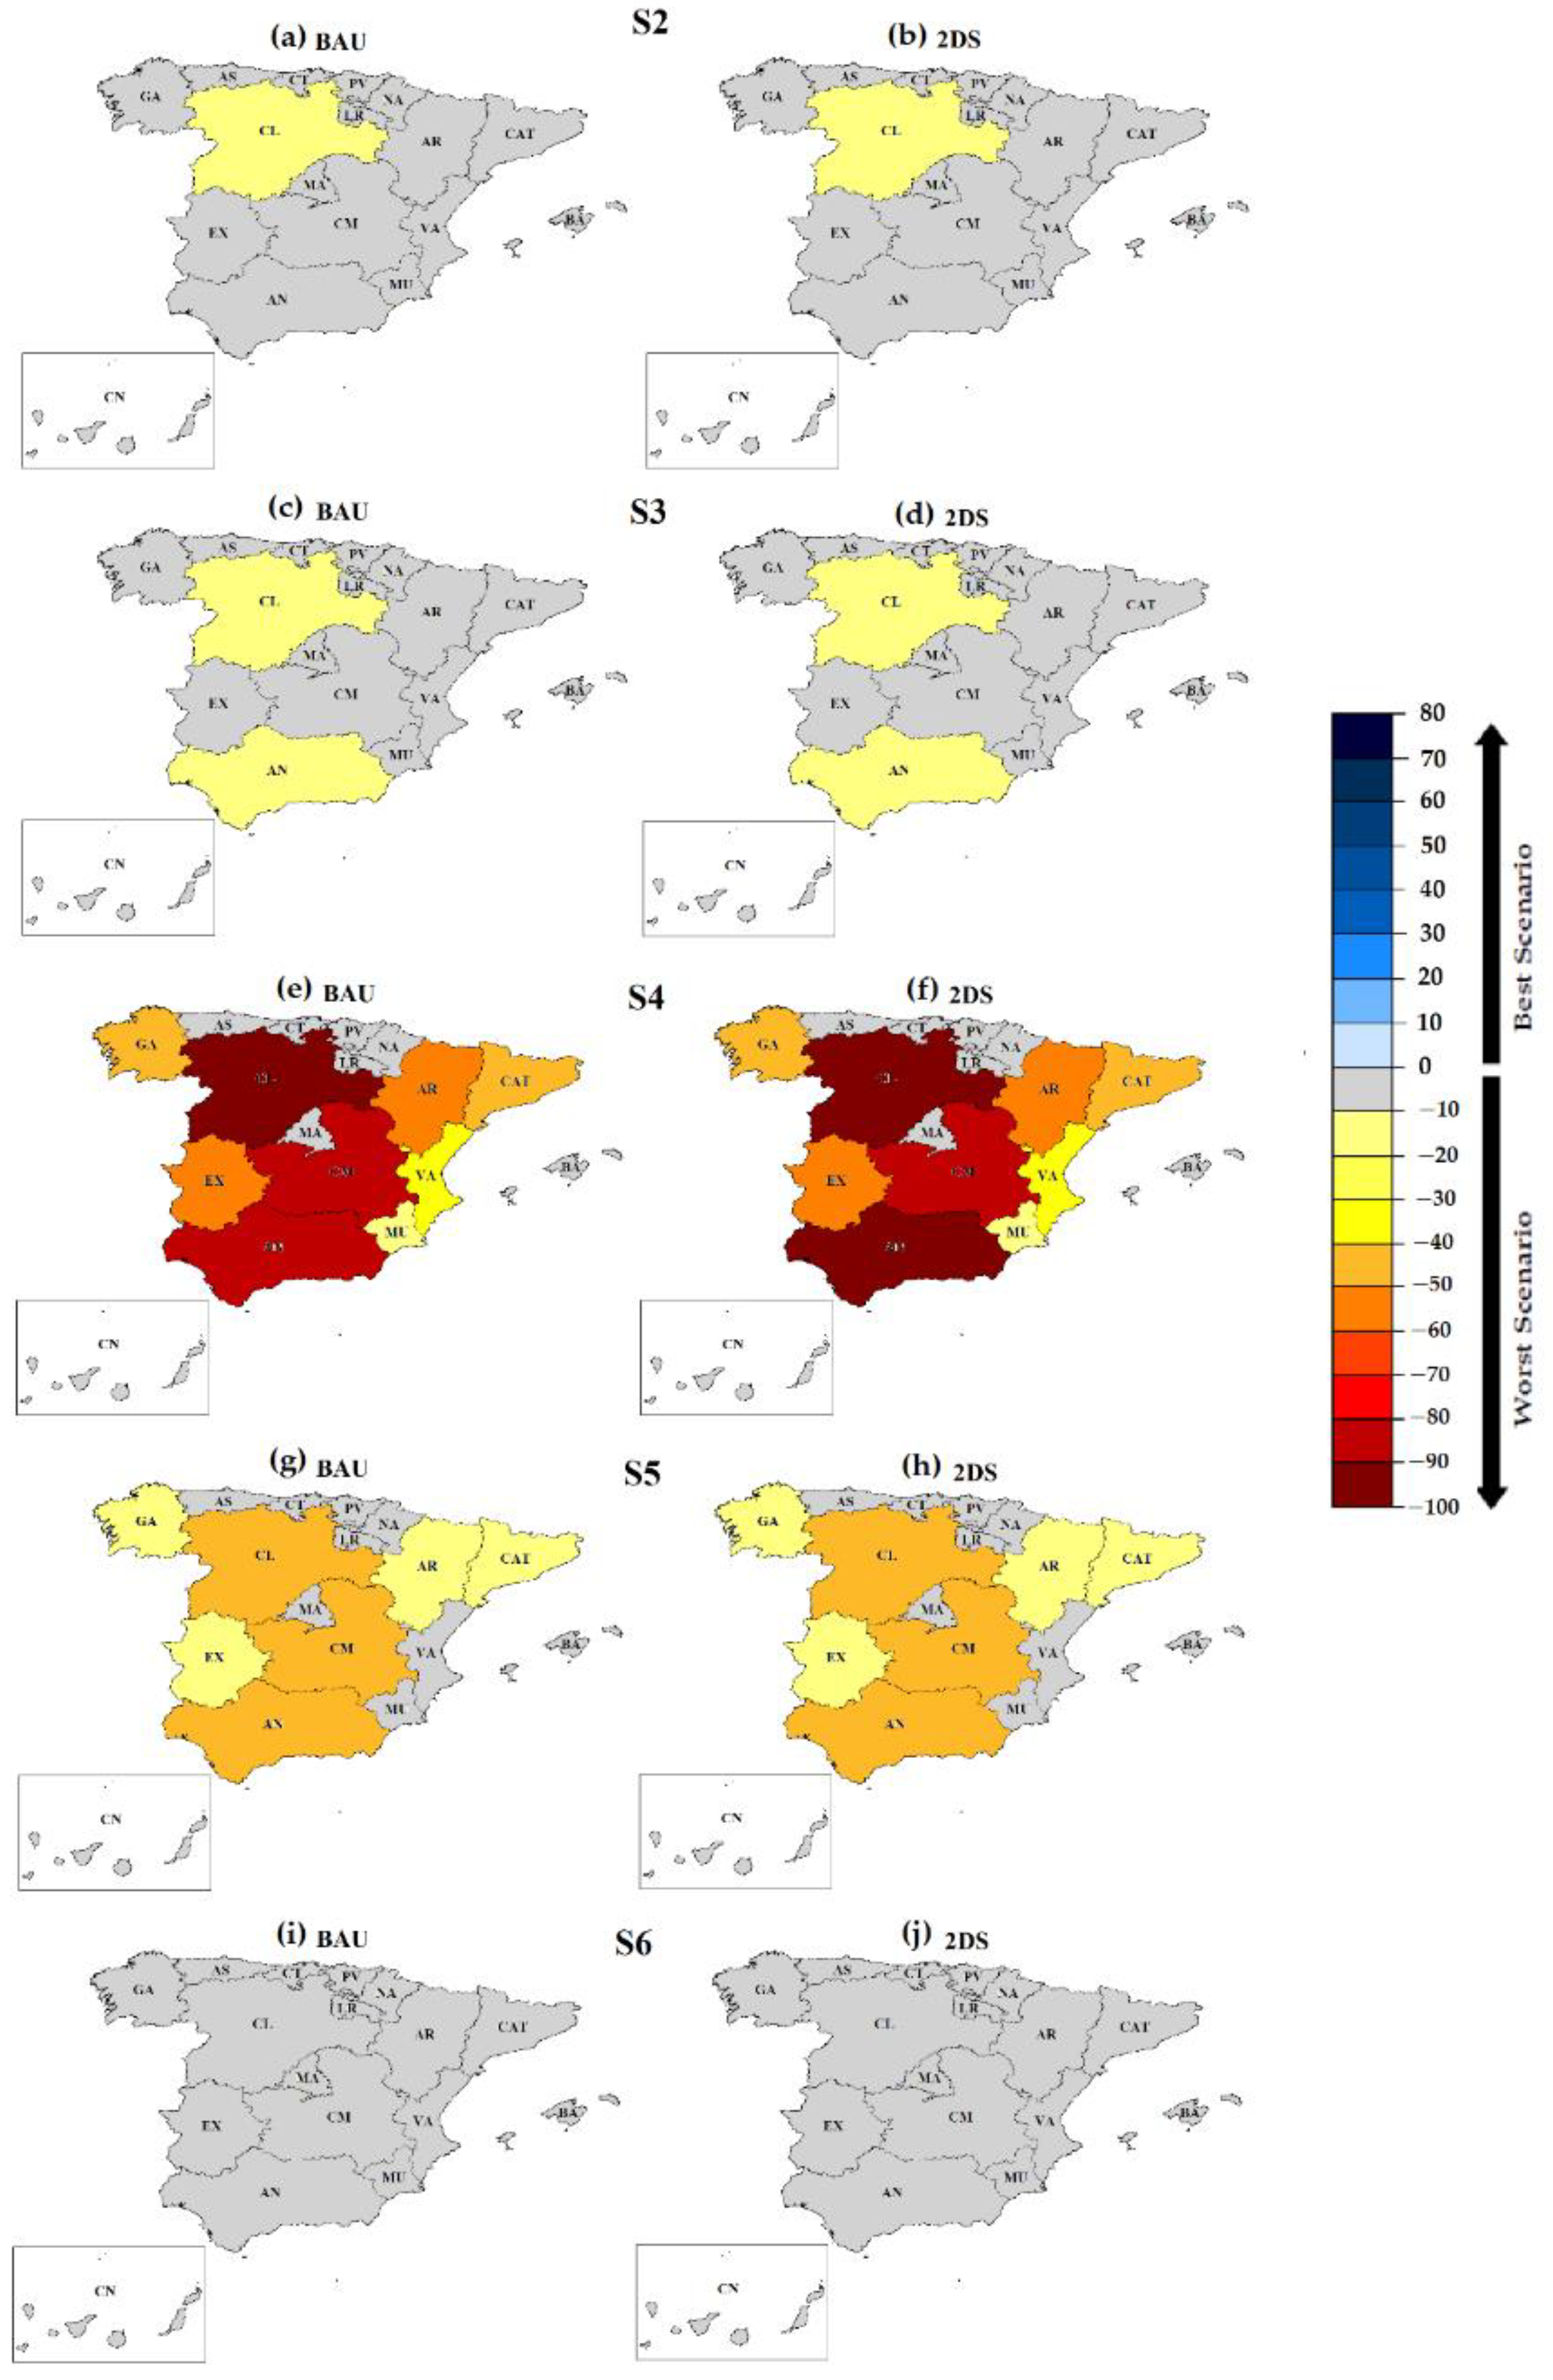
2.3. Description of Scenarios under Study
2.4. Life Cycle Model
- The modeling of the AC system was developed using the professional database of the GaBi software [41]. The input considered 35% content of food and kitchen waste, and a mixture of biodegradable garden and park waste. In addition, this system included a mechanical separation unit, for which energy is required for the selective collection fraction [42].
- For the biodegradable portion of municipal solid waste, the thermal treatment collected from the GaBi database was assumed [41]. The modeling of a single portion involves energy generation and credits, attributed to the biodegradable fraction. The plant is composed of an incineration line that consists of a steam generator and a grate. The latter is used in 80% of the Spanish plants, becoming one of the most common technologies [44]. From one metric ton of waste, 1277 MJ of steam is produced, 495 MJ of energy, 220 kg of bottom ash, and 42 kg of slurries, filter cake, and boiler ash.
- The landfill model was based on the process for municipal household waste from the database of GaBi [41]. This system includes biogas recovery (with biogas and leachate management and deposition), diesel for the compactor, and sealing materials, for instance, mineral coating or clay. In agreement with the model, electricity is produced from 17% of the biogas through its collection, treatment, and burn. The 62% of the remaining gas is let out to the air, and the 21% is flared. A 50/50 ratio of transpiration/runoff and a lifetime of 100 years were considered for the landfill, as well as a net energy production of 0.0942 MJ per kg of municipal FLW [41].
Life-Cycle Inventory
2.5. Water Footprint Profile
2.6. Limitations and Assumptions of the Study
3. Results and Discussion
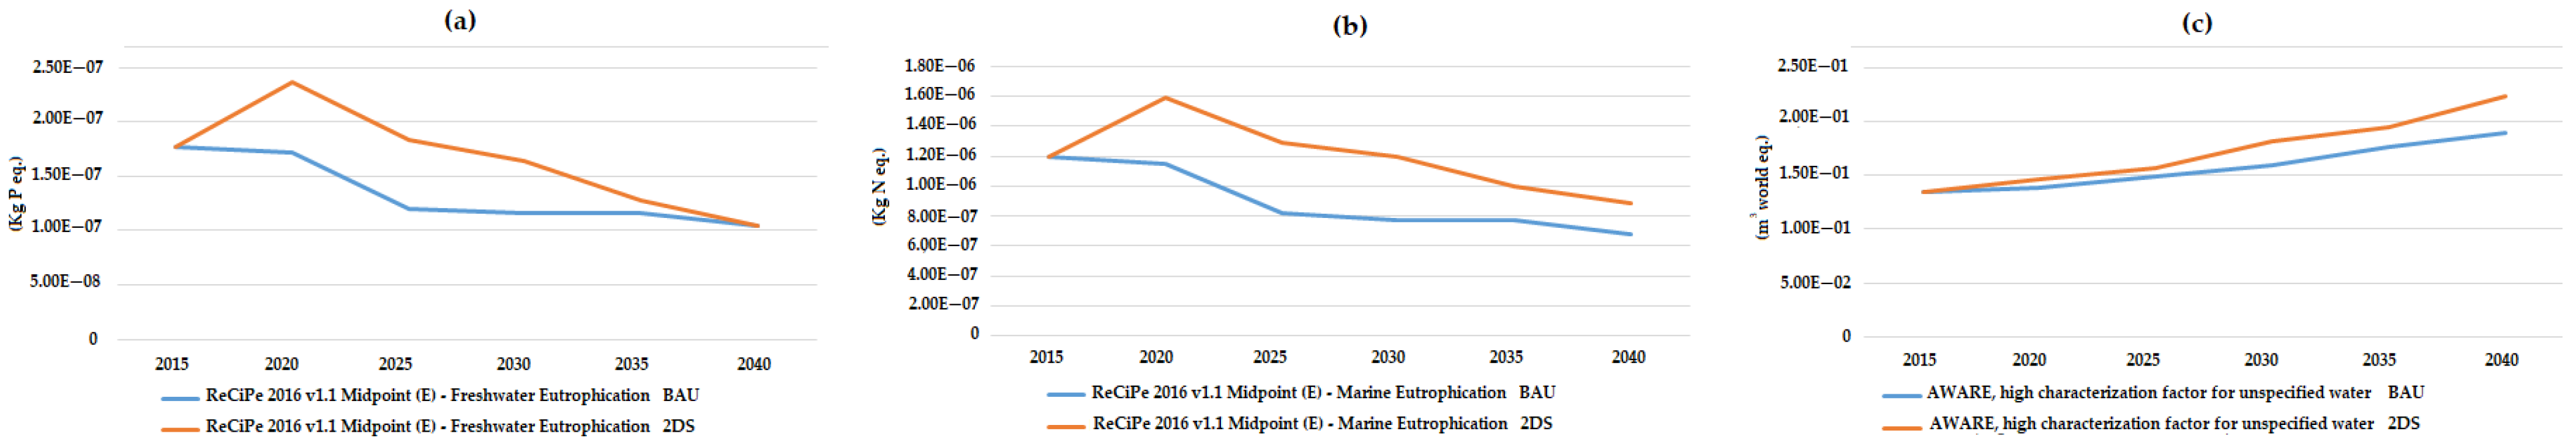
3.1. Water Scarcity Footprint
3.2. Water Degradation Footprint
3.3. Comparison with Previous Studies
4. Conclusions
Author Contributions
Funding
Acknowledgments
Conflicts of Interest
References
- Ridoutt, B.G.; Juliano, P.; Sanguansri, P.; Sellahewa, J. The water footprint of food waste: Case study of fresh mango in Australia. J. Clean. Prod. 2010, 18, 1714–1721. [Google Scholar] [CrossRef]
- Shukla, P.R.; Skea, J.; Buendia, E.C.; Masson-Delmotte, V.; Pörtner, H.O.; Roberts, D.C.; Zhai, P.; Slade, R.; Connors, S.; van Diemen, R.; et al. (Eds.) Technical summary. In Climate Change and Land: An IPCC Special Report on Climate Change, Desertification, Land Degradation, Sustainable Land Management, Food Security, and Greenhouse Gas Fluxes in Terrestrial Ecosystems; IPCC: Geneva, Switzerland, 2019. [Google Scholar]
- Aivazidou, E.; Tsolakis, N.; Iakovou, E.; Vlachos, D. The emerging role of water footprint in supply chain management: A critical literature synthesis and a hierarchical decision-making framework. J. Clean. Prod. 2016, 137, 1018–1037. [Google Scholar] [CrossRef] [Green Version]
- Quinteiro, P.; Dias, A.C.; Pina, L.; Neto, B.; Ridoutt, B.G.; Arroja, L. Addressing the freshwater use of a Portuguese wine (“vino verde”) using different LCA methods. J. Clean Prod. 2014, 68, 46–55. [Google Scholar] [CrossRef]
- Hoekstra, A.Y.; Hung, P.Q. Virtual Water Trade: A Quantification of Virtual Water Flows between Nations in Relation to International Crop Trade; Value of Water Research Report Series No. 11; UNESCO-IHE: Delft, The Netherlands, 2002. [Google Scholar]
- Chapagain, A.K.; Hoekstra, A.Y. Water Footprints of Nations; Value of Water Research Report Series No.16; UNESCO-IHE: Delft, The Netherlands, 2004. [Google Scholar]
- Chapagain, A.K.; Hoekstra, A.Y.; Savenije, H.H.G.; Gautam, R. The water footprint of cotton consumption: An assessment of the impact of worldwide consumption of cotton products on the water resources in the cotton producing countries. Ecol. Econ. 2006, 60, 186–203. [Google Scholar] [CrossRef]
- Hoekstra, A.Y.; Chapagain, A.K.; Aldaya, M.M.; Mekonnen, M.M. The Water Footprint Assessment Manual: Setting the Global Standard; Earthscan: London, UK, 2011. [Google Scholar]
- Chapagain, A.; James, K. Accounting for the impact of food waste on water resources and climate change. In Food Industry Wastes; Elsevier: Amsterdam, The Netherlands, 2013; pp. 217–236. [Google Scholar]
- ISO 14046, Environmental Management—Water Footprint—Principles, Requirements and Guidelines; International Organization for Standardization: Geneva, Switzerland, 2014.
- Boulay, A.M.; Bare, J.; Benini, L.; Berger, M.; Lathuillière, M.J.; Manzardo, A.; Margni, M.; Motoshita, M.; Núñez, M.; Pastor, A.V.; et al. The WULCA consensus for water scarcity footprints: Assessing impacts of water consumption based on the available water remaining (AWARE). Int. J. LCA 2018, 23, 368–378. [Google Scholar] [CrossRef] [Green Version]
- Bizarro, D.; Bunden, J.; Ciroth, A. AWARE, Regionalized LCIA in openLCA. 2018. Available online: https://www.openlca.org/wp-content/uploads/2018/04/Documentation_AWARE_20180411.pdf (accessed on 19 February 2021).
- Blas, A.; Garrido, A.; Willaarts, B. Food consumption and waste in Spanish households: Water implications within and beyond national borders. Ecol. Indic. 2018, 89, 290–300. [Google Scholar] [CrossRef]
- Caldeira, C.; Quinteiro, P.; Castanheira, E.; Boulay, A.M.; Dias, A.C.; Arroja, L.; Freire, F. Water footprint profile of crop-based vegetable oils and waste cooking oil: Comparing two water scarcity footprint methods. J. Clean Prod. 2018, 195, 1190–1202. [Google Scholar] [CrossRef]
- Bong, P.X.H.; Malek, M.A.; Noor, Z.Z. A review on water footprint assessment and Water-Food-Energy Nexus for electronic and food products. Int. J. Eng. Technol. 2018, 7, 48. [Google Scholar] [CrossRef]
- Mekonnen, M.M.; Gebens-Leenes, W. The Water Footprint of Global Food Production. Water 2020, 12, 2696. [Google Scholar] [CrossRef]
- Ridoutt, B.G.; Eady, S.J.; Sellahewa, J.; Simons, L.; Bektash, R. Water footprinting at the product brand level: Case study and future challenges. Clean. Prod. 2009, 17, 1228–1235. [Google Scholar] [CrossRef]
- Milà i Canals, L.; Chapagain, A.; Orr, S.; Chenoweth, J.; Anton, A.; Clift, R. Assessing freshwater use impacts in LCA, part 2: Case study of broccoli production in the UK and Spain. Int. J. Life Cycle Assess. 2010, 15, 598–607. [Google Scholar] [CrossRef] [Green Version]
- Frischknecht, R.; Steiner, R.; Braunschweig, A.; Egli, N.; Hildesheimer, G. Swiss ecological scarcity method: The new version. In Proceedings of the 7th International Conference on EcoBalance, Tsukuba, Japan, 25–27 November 2006. [Google Scholar]
- Kounina, A.; Margni, M.; Bayart, J.; Boulay, A.-M.; Berger, M.; Bulle, C.; Frischknecht, R.; Koehler, A.; Milà i Canals, L.; Motoshita, M.; et al. Review of methods addressing freshwater use in life cycle inventory and impact assessment. Int. J. Life Cycle Assess. 2013, 18, 707–721. [Google Scholar] [CrossRef] [Green Version]
- WFN. Water Footprint—Product Gallery. Water Footprint Network. 2010. Available online: http://www.waterfootprint.org (accessed on 15 March 2021).
- Karandish, F.; Hoekstra, A.Y.; Hogeboom, R.J. Reducing food waste and changing cropping patterns to reduce water consumption and pollution in cereal production in Iran. J. Hydrol. 2020, 586, 124881. [Google Scholar] [CrossRef]
- López-Gunn, E.; Willaarts, B.; Dumont, A.; Niemeyer, I.; Martínez-Santos, P. The concept of water and food security in Spain. In Water, Agriculture and the Environment in Spain: Can We Square the Circle? CRC Press: Boca Raton, FL, USA, 2012; pp. 21–34. [Google Scholar]
- Duarte, R.; Pinilla, V.; Serrano, A. The water footprint of the Spanish agricultural sector: 1860–2010. Ecol. Econ. 2014, 108, 200–207. [Google Scholar] [CrossRef]
- Villanueva-Rey, P.; Quinteiro PVázquez-Rowe, I.; Rafael, S.; Arroja, L.; Moreira, M.T.; Feijoo, G.; Dias, A.C. Assessing water footprint in a wine appellation: A case study for Ribeiro in Galicia, Spain. J. Clean. Prod. 2018, 172, 2097–2107. [Google Scholar] [CrossRef]
- Vanham, D.; Hoekstra, A.Y.; Bidoglio, G. Potential water saving through changes in European diets. Environ. Int. 2013, 61, 45–56. [Google Scholar] [CrossRef]
- Gustavsson, J.; Cederberg, C.; Sonesson, U.; Van Otterdijk, R.; Meybeck, A. Global Food Losses and Food Waste; Extent, Causes and Prevention. 2011. Available online: http://www.fao.org/sustainable-food-valuechains/library/detalles/es/c/266053/ (accessed on 19 November 2020).
- Zero Waste Scotland. The Water and Carbon Footprint of Household Food and Drink Waste in the UK: A Summary for Scotland. 2011. Available online: https://www.wrap.org.uk/sites/files/wrap/Water_and_Carbon_Footprint_Report_Scottish_Summary.pdf (accessed on 19 November 2020).
- Spanish Ministry for the Ecological Transition and the Demographic Challenge (MITECO). PEMAR, Plan Estatal Marco de Gestión de Residuos (2016–2022). 2015. Available online: https://www.miteco.gob.es/es/calidad-y-evaluacion-ambiental/planes-y-estrategias/pemaraprobado6noviembrecondae_tcm30-170428.pdf (accessed on 19 November 2020). (In Spanish).
- Hoehn, D.; Laso, J.; Cristóbal, J.; Ruiz-Salmón, I.; Butnar, I.; Borrion, A.; Bala, A.; Fullana-i-Palmer, P.; Vázquez-Rowe, I.; Aldaco, R.; et al. Regionalized strategies for food loss and waste management in Spain under a life cycle thinking approach. Foods 2020, 9, 1765. [Google Scholar] [CrossRef] [PubMed]
- Anandarajah, G.; Pye, S.; Ushner, W.; Kesicki, F.; Mcglade, C. TIAM-UCL Global Model Documentation, Working Paper, REF UKERC/WP7ESY/2011/001; University College of London: London, UK, 2011. [Google Scholar]
- FAO. Definitional Framework of Food Loss, Working Paper. 2014. Available online: http://www.fao.org/fileadmin/user_upload/save-food/PDF/FLW_Definition_and_Scope_2014.pdf (accessed on 19 November 2020).
- Garcia-Herrero, I.; Hoehn, D.; Margallo, M.; Laso, J.; Bala, A.; Batle-Bayer, L.; Fullana, P.; Vazquez-Rowe, I.; Gonzalez, M.J.; Durá, M.J.; et al. On the estimation of potential food waste reduction to support sustainable production and consumption policies. Food Policy 2018, 80, 24–38. [Google Scholar] [CrossRef]
- CONAMA. Congreso Nacional del Medio Ambiente, Estudio de la Situación Actual de las Plantas de Tratamiento Mecánico-Biológico en España. 2014. Available online: http://www.conama.org/conama/download/files/conama2014/CT%202014/1896711843.pdf (accessed on 19 November 2020). (In Spanish).
- Deutsches Biomasserforschungzentrum. Anlagebestand Biogas und Biomethan—Biogaserzeugung und—Nutzung in Deutschland, 30. 2017. Available online: https://www.dbfz.de/fileadmin/user_upload/Referenzen/DBFZ_Reports/DBFZ_Report_30.pdf (accessed on 19 November 2020). (In German).
- Bang-Jensen, M.; Moller, J.; Scheutz, C. Comparison of the organic waste management systems in the Danish-German border region using life cycle assessment (LCA). Waste Manag. 2016, 49, 491–504. [Google Scholar] [CrossRef]
- Vision 2020: UK Roadmap to Zero Food Waste to Landfill. 2013. Available online: https://storage.googleapis.com/www.bioregional.com/downloads/Vision-2020-UK-roadmap-to-zerofood-waste-to-landfill_Vision-2020_2013.pdf (accessed on 19 November 2020).
- Instituto para la Diversificación y Ahorro de la Energía. Borrador del Plan Nacional Integrado de Energía y Clima 2021–2030. Available online: https://ec.europa.eu/energy/sites/ener/files/documents/spain_draftnecp.pdf (accessed on 17 November 2020). (In Spanish).
- EC. European Commission, Council Directive 1999/31/EC. 1999. Available online: https://eur-lex.europa.eu/legal-content/EN/TXT/PDF/?uri=CELEX:31999L0031&from=EN (accessed on 19 November 2020).
- Ecoinvent. Ecoinvent v3 Database, Ecoinvdent Centre. 2016. Available online: http://www.ecoinvent.org/ (accessed on 19 November 2020).
- GaBi 9.2: Software-System and Databases for Life Cycle Engineering; Sphera: Stuttgart-Echterdingen, Germany, 2019.
- Cimpan, C.; Wenzel, H. Energy implications of mechanical and mechanical–biological treatment compared to direct waste-to-energy. Waste Manag. 2013, 33, 1648–1658. [Google Scholar] [CrossRef]
- Junta de Andalucía. 2011. Available online: https://www.agenciaandaluzadelaenergia.es/sites/default/files/documentos/estudio_basico_del_biogas_0.pdf (accessed on 19 November 2020).
- Margallo, M.; Aldaco, R.; Irabien, A.; Carrillo, V.; Fischer, M.; Bala, A.; Fullana, P. Life cycle assessment modelling of waste-to-energy incineration in Spain and Portugal. Waste Manag. Res. 2014, 32, 492–499. [Google Scholar] [CrossRef] [PubMed]
- ISO 14044: Environmental Management-Life Cycle Assessment—Requirements and Management; International Standards Organization: Geneva, Switzerland, 2006.
- Mekonnen, M.M.; Gerbens-Leenes, P.W.; Hoekstra, A.Y. The consumptive water footprint of electricity and heat: A global assessment. Environ. Sci. Water Res. Technol. 2015, 1, 285–297. [Google Scholar] [CrossRef]
- Spanish Ministry of Agriculture, Fisheries and Food (MAPA). Encuesta sobre Superficies y Rendimientos de Cultivos. 2019. Available online: https://www.mapa.gob.es/es/estadistica/temas/estadisticas-agrarias/boletin2019_tcm30-536911.pdf (accessed on 19 November 2020). (In Spanish).
- Spanish Ministry of Agriculture, Fisheries and Food (MAPA). Informe Anual Industria (2015–2016). 2017. Available online: https://www.mapa.gob.es/es/alimentacion/temas/industria-agroalimentaria/_informeanualindustria2015-2016_ok_tcm30-380020.pdf (accessed on 19 November 2020). (In Spanish).
- Instituto Nacional de Estadística. Población por Comunidades Autónomas. 2015. Available online: https://www.ine.es/jaxiT3/Tabla.htm?t=2915&L=0 (accessed on 19 November 2020). (In Spanish).
- Instituto Nacional de Estadística. Estadística de Movimientos Turísticos en Fronteras (FRONTUR). 2016. Available online: https://ine.es/daco/daco42/frontur/frontur1215.pdf (accessed on 19 November 2020). (In Spanish).
- Goedkoop, M.J.; Heijungs, R.; Huijbregts, M.; De Schryver, A.; Struijs, J.; Van Zelm, R. ReCiPe 2008—A Life Cycle Impact Assessment Method Which Comprises Harmonised Category Indicators at the Midpoint and the Endpoint Level, 1st ed.; Report I: Characterisation; National Institute for Public Health and the Environment: Research Triangle Park, NC, USA, 2009.
- Arcadis Project Number—11/004759, Version C, Assessment of the Options to Improve the Management of Biowaste in the European Union—Final Report, European Commission DG Environment. 2010. Available online: https://ec.europa.eu/environment/waste/compost/pdf/ia_biowaste%20-%20final%20report.pdf (accessed on 19 November 2020).
- Vázquez-Rowe, I.; Ziegler-Rodríguez, K.; Margallo, M.; Kahhat, R.; Aldaco, R. Climate action and food security: Strategies to reduce GHG emissions from food loss and waste in emerging economies. Resour. Conserv. Recycl. 2021, 170, 105562. [Google Scholar] [CrossRef]
- Bernstad Saraiva, A.; Souza, R.G.; Valle, R.A.B. Comparative lifecycle assessment of alternatives for waste management in Rio de Janeiro—Investigating the influence of an attributional or consequential approach. Waste Manag. 2017, 68, 701–710. [Google Scholar] [CrossRef] [PubMed] [Green Version]
- World Bank Group. What aWaste 2.0, A Global Snapshot of Solid Waste Management to 2050. 2018. Available online: https://openknowledge.worldbank.org/handle/10986/30317 (accessed on 19 November 2020).
- European Commission. Commission Delegated Decision (EU) 2019/1597. 2019. Available online: https://eur-lex.europa.eu/legal-content/EN/TXT/PDF/?uri=CELEX:32019D1597&from=GA (accessed on 19 November 2020).
- Lundie, S.; Peters, G.M. Life cycle assessment of food waste management options. J. Clean. Prod. 2005, 13, 275–286. [Google Scholar] [CrossRef]
- Sonesson, B.; Björklund, A.; Carlsson, M.; Dalermo, M. Environmental and economic analysis of management systems for biodegradable waste. Resour. Conserv. Recycl. 2000, 28, 29–53. [Google Scholar] [CrossRef]
- Björklund, A.; Dalermo, M.; Sonesson, U. Evaluating a municipal waste management plan using OWARE. J. Clean. Prod. 1999, 7, 271–280. [Google Scholar] [CrossRef]


| Scenarios | AD | AC | Landfill | Thermal Treatment |
|---|---|---|---|---|
| S1 | Depending on each region (see Table 2) | |||
| S2 | 20.0% | 75.0% | 2.5% | 2.5% |
| S3 | 75.0% | 20.0% | 2.5% | 2.5% |
| S4 | 3.3% | 3.3% | 3.3% | 90.0% |
| S5 | 33.3% | 33.3% | 33.3% | |
| S6 | 50.0% | 50.0% | ||
| Region | Landfill | Thermal treatment | AD | AC |
|---|---|---|---|---|
| AN | 93.8% | 2.3% | 3.9% | |
| AR | 62.0% | 3.0% | ||
| AS | 92.1% | 7.9% | ||
| BA | 18.9% | 72.7% | 5.1% | 3.3% |
| CAT | 49.4% | 18.4% | 15.7% | 16.5% |
| CL | 56.4% | 43.6% | ||
| CM | 100.0% | |||
| CN | 95.7% | 4.3% | ||
| CT | 35.1% | 64.9% | ||
| EX | 100.0% | |||
| GA | 33.6% | 50.6% | 14.9% | 0.9% |
| LR | 35.1% | 64.9% | ||
| MA | 63.4% | 10.6% | 25.5% | 0.5% |
| MU | 100.0% | |||
| NA | 61.4% | 26.6% | 12.1% | |
| PV | 65.9% | 25.3% | 6.7% | 2.1% |
| VA | 75.9% | 21.6% | 2.5% | |
| SP | 68.8% | 11.9% | 14.9% | 4.5% |
| Impact Category | Landfill | Thermal Treatment | AD | AC | ||
|---|---|---|---|---|---|---|
| Incineration | Process Steam | Composting | Ammonium Sulphate | |||
| Freshwater Eutrophication (kg P eq.) | 3.00 × 10⁻³ | 6.25 × 10⁻⁶ | −2.02 × 10⁻⁶ | 2.00 × 10⁻⁴ | 4.75 × 10⁻⁵ | −5.78 × 10⁻⁵ |
| Marine Eutrophication (kg N eq.) | 7.70 × 10⁻³ | 1.00 × 10⁻³ | −2.52 × 10⁻⁵ | 1.76 × 10⁻⁵ | 2.00 × 10⁻⁴ | −2.80 × 10⁻³ |
| AWARE (m3 world eq.) | 3.14 | 254.41 | −13.40 | 9.15 × 10⁻² | 23.67 | 2.33 |
Publisher’s Note: MDPI stays neutral with regard to jurisdictional claims in published maps and institutional affiliations. |
© 2021 by the authors. Licensee MDPI, Basel, Switzerland. This article is an open access article distributed under the terms and conditions of the Creative Commons Attribution (CC BY) license (https://creativecommons.org/licenses/by/4.0/).
Share and Cite
Hoehn, D.; Margallo, M.; Laso, J.; Ruiz-Salmón, I.; Fernández-Ríos, A.; Campos, C.; Vázquez-Rowe, I.; Aldaco, R.; Quinteiro, P. Water Footprint Assessment of Food Loss and Waste Management Strategies in Spanish Regions. Sustainability 2021, 13, 7538. https://doi.org/10.3390/su13147538
Hoehn D, Margallo M, Laso J, Ruiz-Salmón I, Fernández-Ríos A, Campos C, Vázquez-Rowe I, Aldaco R, Quinteiro P. Water Footprint Assessment of Food Loss and Waste Management Strategies in Spanish Regions. Sustainability. 2021; 13(14):7538. https://doi.org/10.3390/su13147538
Chicago/Turabian StyleHoehn, Daniel, María Margallo, Jara Laso, Israel Ruiz-Salmón, Ana Fernández-Ríos, Cristina Campos, Ian Vázquez-Rowe, Rubén Aldaco, and Paula Quinteiro. 2021. "Water Footprint Assessment of Food Loss and Waste Management Strategies in Spanish Regions" Sustainability 13, no. 14: 7538. https://doi.org/10.3390/su13147538
APA StyleHoehn, D., Margallo, M., Laso, J., Ruiz-Salmón, I., Fernández-Ríos, A., Campos, C., Vázquez-Rowe, I., Aldaco, R., & Quinteiro, P. (2021). Water Footprint Assessment of Food Loss and Waste Management Strategies in Spanish Regions. Sustainability, 13(14), 7538. https://doi.org/10.3390/su13147538