1. Introduction
With its vast territory and large population, the Asia-Pacific region astonishes the world with its swift economic growth and tremendous development potential through active regional cooperation. The region is recognized as the most powerful engine of the world economy, playing an essential role in the global network with vigorous vitality. However, its rapid economic growth has also produced excessive consumption of energy and resources, pollution and damage to the ecological environment, and severe inequality of social opportunities. Its traditionally industrialized growth model is unbelievably far from being sustainable. Many countries and regions now confront complex economic transformation and upgrading tasks because of insufficient force to drive endogenous growth and the pressure to make structural adjustments. Most of the in-region countries are facing the challenge of the middle-income trap. The colossal Asia-Pacific region accommodates the world’s first- and second-largest economies and a large body of densely populated developing countries and emerging markets. Whether the region can achieve a green sustainable development path would critically affect the world’s economic development.
In order to sustain economic growth with improved social well-being and environmental benefit, it is essential to transform traditional sloppy growth into inclusive green development. This has become the joint development and cooperation demand and development responsibility for the Asia-Pacific-region countries. To do so, we need to assess the present development situations of the countries carefully, scrutinizing the factors of whether and how much the countries adhere to the people-oriented development and achieve coordination and balance in the relationships between people and nature, economy and society, government and market, and countries and regions. This study builds an inclusive green growth assessment system concentrating on economic prosperity, social inclusion, resource conservation, and environmental livability. The study aims to help understand the level of inclusive green development in the region and assist in enforcing more effective policies for the region’s sustainable development.
However, there is no clear definition of inclusive green growth or a method to evaluate its core content. Relevant research is also much inadequate for the Asia-Pacific region. To solve these problems, we have reformulated and enhanced the meaning of inclusive green growth and dedicated to establishing a scientific, concise, and sustainable index system for inclusive green growth in the Asia-Pacific region. Furthermore, by comparing the mainstream assessment methods, we contribute a believably more suitable method to assess the issue, providing a comprehensive portrayal of the levels of inclusive green growth in each Asia-Pacific country. The study enables us to explore sustainable, inclusive green development paths fitting for different countries.
Inclusive green development is a new category arising from the synthesis of inclusive growth and green development. Upon understanding the two synthesized components, we can accurately grasp the connotation and extension of inclusive green development. Green development is today’s world development trend, bearing vital theoretical and practical significance in promoting a sustainable environment [
1]. However, no universal definition is acknowledgeable for green development. Similar concepts such as “green economy” and “green growth” are interchangeably utilized as the equivalent connotations in the reports of various international organizations, with only minor differences in semantic expressions. Nonetheless, they all emphasize promoting economic growth and rational utilization of natural capital and environmental resources. They advocate to prevent and reduce waste pollutions and create chances to improve overall social welfare by building a green economy, making it possible to step towards sustainable development [
2].
The idea of a green economy first appeared in 1989 in the British environmental economist Pearce’s Blueprint for a Green Economy [
3]. It seeks to achieve a sustainable society through a green economy from environmental economics perspectives. In fact, “green growth”, which is widely promoted globally, is closely related to sustainable development, with the United Nations (UN), the OECD, the World Bank (WB), and other international organizations as the leading advocates. In 2005, UNESCAP provided the first explanation of what the green economy means [
4]. In 2009, OECD formally defined green growth as the pursuit of economic growth and development while preventing costly environmental damage, climate change, loss of biodiversity, and unsustainable use of natural resources [
5]. In 2011, UNEP incorporates social equity beyond the pursuit of economic development, formulizing green development as the improvement of human well-being and social equity while significantly reducing environmental risks and ecological scarcity [
6]. In 2012, the World Bank reiterated green growth as growth that effectively uses natural resources and clean energy for minimizing pollution and environmental impacts and increasing resilience of the society to natural disasters [
7]. In the same year, OECD concluded the purpose of national strategies and programs of green growth. Its goal is to motivate businesses and consumers to undertake more environment-friendly activities, facilitate the smooth and equitable reallocation of jobs, capital, and technologies, and provide proper incentive and support in the context of developing ecological innovations [
8]. Despite the overlap of these interchangeable concepts and definitions, all of them reflect the ultimate goal of achieving a green sustainable society in the end.
In 2007, the Asian Development Bank proposed a parallel concept, inclusive growth in its publicized study of “The New Asia, The New Asian Development Bank”. The concept designates a form of sustainable development that continuously creates and expands economic opportunities while ensuring that members of society have an equal right to share in the benefits of growth. The concept has two core points: first, raising the level of per capita income as a basis for creating and expanding economic opportunities [
9]; second, assuring to consider and incorporate the distributional efficiency of economic growth. Only when economic growth is equitably distributed can social sustainability be fundamentally secured. Various international organizations have also proposed different indicator systems for assessing and measuring inclusive growth (
Table 1).
The connotation of inclusive green growth is precisely the coupling of the two development concepts of inclusive growth and green development. The concept of “inclusive green growth” was first introduced at Rio+20 in 2012 to integrate the interests and concerns of industrialized countries with those of developing countries to achieve a joint green economy and inclusive growth. In the same year, the World Bank (WB) stated that in order to meet the urgent survival and development needs of the world’s poor, economies must maintain rapid growth. However, the growth without green and inclusive qualities is inevitably unsustainable in the long run. Therefore, inclusive growth must be green, and green growth must be inclusive [
7]. In September 2015, the United Nations Sustainable Development Summit adopted the programmatic document “Changing Our World—2030 Agenda for Sustainable Development”. With the new UN Sustainable Development Goals announcement, inclusive green growth has become a new trend and central theme in global environmental and development fields. Many countries have thus commenced incorporating the new concept and thus developing new core strategies with “inclusive green growth” [
13]. Promoting inclusive green growth can, in the short term, rapidly boost employment and revitalize the economy, as well as effectively adjust the economic structure and rationalize the relationship among resources, environment, and economic growth. It is more conducive to sustainable and extensive growth in the long term, minimizing the recurrence of social and economic crises and driving coordinated and sustainable development achievable in the true sense [
14].
Inclusive green growth as a comparatively new concept in recent years still lacks adequate integrated research, even though scholars have sought to study the green development of various countries from the lens of inclusive green growth. Ojha et al. (2020) employed a dynamic CGE modeling tool to show to what extent a balance among greening, growth, and inclusiveness can be attained [
15]. Sun et al. (2020) evaluated an inclusive green growth model for China [
16]. Berkhout et al. (2017) focused on agriculture and rural development for achieving Inclusive Green Growth [
17]. Mukonza et al. (2020) centered on topics relating to Governing Inclusive Green Growth in Africa (GIGGA) and mapped academic literature based on geographical biases and topical gaps [
18]. Li et al. (2014) further summarized green development as two dimensions: sustainable development of economy and society and sustainable development of resources and environment [
19]. The research objects and focused fields of these studies are, however, relatively narrow and constrained. This paper otherwise seeks to establish an integrative assessment framework for the Asia-Pacific region in a broader scope. It can be seen that the connotation of inclusive green growth integrates the conceptual kernels of inclusive growth and green development. It aims to pursue an innovative development model that integrates economic, ecological, and social benefits while emphasizing and reconciling fairness, sustainability, and development. In other words, inclusive green growth reconciles economic growth, social inclusion, resource conservation, and environmental friendliness. It is an advanced connotation for achieving coordinated economic, social, and environmental targets.
The existing research in green development assessment mainly focuses on the following aspects: first, green accounting evaluation. It refers to the integrated accounting system of resources, environment, and economy established by incorporating resource and environmental factors into national economic statistics. Green accounting formulizes the accounting data and the results of economic activities considering resource-consuming costs and environmental losses, targeting to measure the changes in real societal wealth and the states of resource uses and the environment. Early collaboration between the United Nations Statistical Office and the World Bank served to integrate environmental issues into the System of National Economic Accounts (SNA). The effort installed the System of Integrated Environmental-Economic Accounting (SEEA), which serves as a guiding model for countries to conduct comparable environmental and economic accountings. Two specific green accounting approaches are commonly practical: the natural resource and value volume accounting approaches. Green gross domestic product (GGDP) accounting is one of the important parts of green accounting evaluation. For instance, Xu (2015) carried out Green GDP accounting and variance analysis of resource-based cities of China [
20]. Rasmussen (2021) analyzed barriers and opportunities in developing and implementing a Green GDP [
21]. Chen (2021) proposed a comprehensive eco-efficiency framework based on energy theory, green gross domestic product (GGDP) and data envelopment analysis (DEA) to get a thorough assessment of regional sustainability [
22]. Another important part is the measurement of total factor productivity and green efficiency. This type of study takes into account resource and environmental factors, treating resources as inputs like labor and capital, and environmental pollutant emissions as undesired outputs, according to Chen (2010) [
23], Wang et al. (2010) [
24], Huang et al. (2015) [
25], Wang et al. (2018) [
26], He et al. (2021) [
27], Vlontzos et al. (2014) [
28], Fang et al. (2019) [
29], etc.
Second, green economy evaluation. In 2009, the Organization for Economic Cooperation (OECD) advocated a green growth strategy with a comprehensive framework to integrate economic, environmental, and social indicators for guiding countries to address environmental pollution, hazardous damages, and climate change in economic development [
30]. This indicator system has been widely experimented with by many countries such as Korea [
31], the Netherlands [
32], the Czech Republic [
33], and Mexico [
34]. Many international organizations have devoted themselves to constructing green growth evaluation index systems from varying perspectives (
Table 2). Despite the technical emphases in their constructs, they generally suggest reconciling the economic, social, and environmental interests to reduce environmental pressure and harmonize economic growth with sustainable resource and environmental governance.
Third, green index evaluation. Two versions of the green index are commonly influential. One comes from American scholars Hall and Kerr’s green index evaluation system in 1991, integrating the green state and green policy notations [
39]. The other is the consumer environmental protection “Green Index” jointly issued by National Geographic and Canada’s GlobeScan in 2008. Regarding the green index, especially the Green Development Index, relevant scholars have done extensive research on different regions, fields, and perspectives. For example, Lin et al. (2019) adopted the super-efficient non-radial DEA model to measure the green index of economic development of each region in China to measure the degree of resource consumption and environmental pollution in the process of economic development of a region [
40]. Yuan et al. (2020) proposes an evaluation framework with two composite indices from two perspectives. One is the Green Industry Performance (GIPer) index to assess the current performance, and the other is Green Industry Progress (GIPro) index to reflect the historical effort in green transformation [
41].
This paper makes the following contributions by sorting out relevant studies on inclusive green growth: Firstly, theory and framework innovation. For inclusive growth, most indicators lay more emphasis merely on economic growth and its distribution issue. As per green development, more concern places on accounting for resources and the environment independently. Inadequate is the integrative research to fuse the set of resources, environment, economic development, and social well-being to deliver a holistic assessment of inclusive green development. For addressing the issue, this paper constructs a comprehensive evaluation index system revealing the relationship between nature, economy, and society. It measures the level of inclusive green growth in the Asia-Pacific region by redefining and enriching the connotation of inclusive green growth and integrating the rationality and availability of indicators. Secondly, the analytical method is more robust. Some commonly adopted assessment approaches, such as hierarchical analysis, expert assignment method, or average weighting method, bear more subjective, leading the results to be sensitive and arbitrary to subjective judgment and parameter weight twisting. For avoiding subjectiveness and arbitrariness, objective assessment approaches, such as principal component analysis, factor analysis, and entropy weighting, are generally preferable. In order to deliver more informative measurements, this paper adopts the factor analysis method, supplemented by the entropy and clustering methods, to measure the level of inclusive green growth in the Asia-Pacific region. The assessment result is again cross-verified by comparing the supplementary results to make the assessment more robust. However, this paper differs from other studies using factor analysis in indicator construction. Besides summarizing the overall level and ranking of inclusive green growth of the countries in the Asia-Pacific region, we deliver more holistic measurements by ranking each country or region in four distinct dimensions: economic prosperity, social inclusion, resource utilization, and environmental sustainability. Such investigation affords us more profound insights into the factors affecting the level of inclusive green growth.
Fourth, policy innovation. Through a comprehensive three-dimensional analysis of the evaluation results, the study provides pragmatical policy suggestions on exploring and promoting the pathway and practice to reinforce inclusive green growth in the Asia-Pacific region underneath the international context.
2. Methods and Data
2.1. Construction of Inclusive Green Growth Indicator System in Asia-Pacific
The Asia-Pacific region holds a large number of countries, and each country has a different geographical location, resource endowment, and economic development status. This paper, following the principles of internal logic, data availability, systematization, and representativeness, attempts to construct an inclusive green growth indicator system for the Asia-Pacific region by combining the characteristics of Asia-Pacific countries and the connotation of inclusive green growth (
Table 3). Integrating the four dimensions of economic prosperity, social inclusion, resource utilization, and environmental sustainability (
Figure 1), the indicator system builds upon 10 primary indicators and 26 secondary indicators, aiming to comprehensively, concisely, and accurately assess the level of inclusive green growth in the Asia-Pacific region.
Economic prosperity reflects the economic quality of inclusive green growth, i.e., the basis of the economic growth and its degree of economic stability. Economic prosperity is an obvious goal and a primary criterion for inclusive green growth [
42]. It is important to emphasize not only what economic outcomes to achieve, e.g., the scale of economic development and the steady growth of income and welfare, but also the economic dynamics that create the wealth. So economic prosperity is identifiable explicitly in three aspects: economic growth level, economic development potential, and economic stability. The level of economic growth can be measured by GDP per capita, annual GDP growth rate, and total import and export. Economic development potential is mainly determinable by the country’s R&D effort to provide scientific and technological support for economic development. Further, it is associated with the urbanization rate, which represents the proportion of the population with economic vitality and provides the backbone for modern economic development. The stability of the economy is measurable by the inflation rate. A too high or too low inflation rate can cause economic turmoil, while a moderate rate could stabilize economic growth.
Social inclusion reflects the social progress in inclusive green growth, i.e., social equity, stability, and happiness of inclusive green growth. Social inclusion is a unique connotation with inclusive growth. It emphasizes the importance of fair opportunities and rights for different groups beyond mere economic development, which guarantees sustainable social development. Humans are also a creative resource, whose creativity is a wealth that society must develop. It requires society to provide sufficient essential welfare goods and services so that everyone can have fair and convenient access to fundamental rights to education, health, medical care, and social security, promoting people’s welfare universally. Specifically, the degree of social inclusion is expressible from three perspectives: education and employment, medical and health care, and infrastructure level. The school enrollment rate, school failure rate, and adult literacy rate altogether measure the equity of education and employment opportunities. Higher school enrollment and adult literacy rates designate a more equitable distribution of educational resources. Lower unemployment rates infer more job opportunities. The education and employment indicator serves as a reliable measure for an inclusive society.
Health care is measured by doctor density, life expectancy at birth, infant mortality rate, and population aging rate. The higher the density of doctors, the higher the life expectancy at birth, and the lower the infant mortality rate, the more equitable the distribution of medical resources. The higher the population aging rate, the more significant the aging characteristics of the population structure, and the heavier the medical burden. The level of infrastructure can be measured by the electricity rate. The higher the electricity rate, the more widespread the country’s electricity network, and the more robust the infrastructure.
Resource utilization reflects the essential resource dynamics of inclusive green growth, i.e., the primary resource endowment and energy consumption of inclusive green growth. Improving resource utilization is vital for inclusive green growth, which points out the adjustment path for inclusive green growth in the future. Developed countries often no longer rely on resource endowment to enhance competitiveness. However, easy access to natural resources is still the basis for ensuring development, which, to a large extent, affects the country’s competitive advantage and comparative advantage.
Energy consumption is vital for economic development and meanwhile may produce a considerable impact on the environment. Energy consumption includes the energy consumption per unit of GDP, the percentage of renewable energy consumption, and per capita energy supply, reflecting the structure and efficiency of energy use. Measuring other resource endowments consists of four indicators: per capita arable land area retention, forest coverage, land yield efficiency, and per capita renewable freshwater resources. The indicators represent the endowment levels of arable land resources, forest resources, land resources, and freshwater resources, reflecting the abundance and sustainability of natural resources.
Environmental sustainability reflects the environmental conditions underlying inclusive green growth, i.e., the environmental carrying capacity and environmental protection underlying inclusive green growth. A healthy ecological environment is a prerequisite for inclusive green growth and is crucial for the country to provide policy support. With the development of the economy and society, human activities have brought tremendous pressure to the natural ecological environment. However, at the same time, human beings realize that to obtain sustainable development, we must respect nature, protect nature, and reasonably develop and use natural resources. Specifically, the health of the ecological environment is measurable in two dimensions: environmental pressure and environmental protection. Environmental pressure is identifiable via per capita CO2 emissions, average annual exposure to PM2.5, and per capita net ecological footprint index. Precisely, per capita CO2 emissions reflect the impact of human activities on climate, average annual exposure to PM2.5 reflects the level of air pollution, and per capita net ecological footprint index reflects the pressure on the ecological environment caused by human activities. Environmental protection is explainable by the percentage of the population using safely managed sanitation facilities and the percentage of the population using safely managed drinking water services. The level of investment for environmental protection can be indirectly reflected by the cleanliness of sanitation facilities and drinking water.
2.2. Data Sources and Research Methods
The breadth and typicality of the sample for the assessment of inclusive green growth in the Asia-Pacific region are related to the accuracy and reference value of the research findings. Considering the influence and popularity of the countries, the availability, accuracy, and standardization of statistical data, and the breadth of the sample size, we ultimately select 37 countries in the Asia-Pacific region for the study (
Table 4). The sample covers the vast majority of developed and developing countries in the Asia-Pacific region, which better represent the development levels of different countries in the Asia-Pacific region.
There are many countries in the Asia-Pacific region with extremely uneven economic and social development. The statistical systems of some countries are still imperfect, and historical data are missing. By integrating the latest official data of various indicators of Asia-Pacific countries, this study finally selects the data of relevant indicators of each country in the Asia-Pacific region in 2017. The data come from the World Bank database, World Statistical Yearbook 2020, PEW Charitable Trusts, and other international institutions. The missing part of data is collected from national statistical yearbooks and the official websites of national statistical departments. The official data works as a uniform caliber to ensure data comparability.
The index system established in this paper contains several evaluation indicators, which are not comparable directly due to each indicator’s distinct attributes and scales. Therefore, we need to convert the raw data to be dimensionless to make the indicators positive and standardized on a comparable scale. The indicators are classified into positive and negative: the larger the positive indicator, the more favorable to the inclusive green growth of the country and region; the smaller the negative indicator, the more favorable to the inclusive green growth of the country and region [
43]. The treatment formula is as follows.
where
is the score value of indicator
j in country
i, and
is the maximum value under indicator
j, the
is the minimum value under indicator
j, and
xij is the original value of indicator
j in country
i.
Among the evaluation methods of index systems, there are mainly subjective and objective assignment methods, including hierarchical analysis (AHP), data envelopment analysis (DEA), factor analysis, principal component analysis, entropy method, and other measurement methods. Different methods are suitable for evaluating different effects, and the choice relies on the distinctness of the research problem. The hierarchical analysis is a subjective assignment method, which requires expert scoring and is subjective and arbitrary. The data envelopment analysis is an evaluation method to study the relative effectiveness of production decision units of the same type. Neither of these two methods applies to the situation of this paper with multiple variables and large samples. Scoring and ranking the inclusive green growth levels of Asia-Pacific countries in this study requires careful consideration of multiple dimensions and indicators, involving data from 26 indicators of 37 countries, with many variables. The possible correlation between many variables also increases the complexity of the problem analysis, while blindly reducing the indicators will lose relevant information and affect the conclusion. Based on this fact, to make the results more robust and the research results more informative, this paper finally chooses to evaluate inclusive green growth in the Asia-Pacific region objectively, mainly by factor analysis method, supplemented by cluster analysis method and entropy weight method.
3. Assessment Results
3.1. Factor Analysis
Factor analysis is a classical multivariate statistical analysis technique, which transforms indicator variables with strong correlation into fewer uncorrelated indicator variables for dimensionality reduction. The basic principle is to study the correlation between a set of indicators, synthesize them into a few comprehensive common factors, and represent the original variables by these comprehensive factors in a linear model. The method replaces more original indicators with fewer composite indicators, which can effectively solve the problem of information overlap among indicators and simplify the structure of the indicator system with better objectivity. The evaluation and analysis process is as follows.
First, applicability test: KMO and Bartlett’s sphericity test. The KMO (Kaiser–Meyer–Olkin) test analyzes the correlation between variables by comparing the simple correlation coefficient and the partial correlation coefficient. According to the KMO test, KMO values between 0.5 and 1.0 are suitable for principal component analysis [
44]. The original hypothesis is that “the variables are independent of each other” if the result rejects the original hypothesis, it means that the correlation between the variables is high and suitable for factor analysis. The applicability test was performed on the available data, and the probability of significance of Bartlett’s sphericity test chi-square statistic was 0.000, which is significant at the 1% level. The KMO value was 0.641, indicating that it is suitable for factor analysis (
Table 5).
Second, extraction of common factors: eigenvalues and cumulative contribution rates. In order to better explain the main factors, the maximum variance method was utilized to perform orthogonal rotation [
45], with a maximum number of 25 iterations to obtain the feature roots, variance contribution rate, and the cumulative variance contribution rate of each dimension (
Table 6). According to the criterion of feature root greater than 1.0, we extract seven common factors with eigenvalues greater than 1.0. The selected seven factors cumulatively explain 79.061% of the total data variance, which can adequately characterize the comprehensive information of the selected sample. The seven principal factors are denoted as F
1, F
2, F
3, F
4, F
5, F
6, and F
7.
Third, factor loading matrix.
Table 7 shows a table of the loading values of the factors after rotation, reflecting the effects on the original variables.
The results show that several variables are highly correlated with the seven selected principal factors. As principal factors are perfectly independent of each other with no multicollinearity by theory, the seven selected factors can be used in subsequent data processing and analysis. By observing the factor loading matrix, we can detect that the first principal component F1 is explainable by indicators such as urbanization rate, energy supply per capita, school enrollment rate, infant mortality rate, doctor density, and adult literacy rate. The factor loadings all exceed 0.8, indicating that the first principal component mainly measures the social inclusion degree of the country. Therefore, the first principal component can be named as the social inclusion factor. The second principal component F2 fits to explain the inflation and unemployment rates, reflecting economic and social stability, which can be deemed the social stability factor. The third principal component F3 fits to explain the total import and export, the share of R&D expenditure in GDP, and the per capita arable land area retention, which can be summarized as the economic prosperity factor. The fourth principal component F4 is suitable for explaining the per capita renewable inland freshwater resources and the per capita net ecological footprint index, reflecting the carrying capacity of resources and the environment for human activities. It can be named as the resources and environment carrying capacity factor. The fifth principal component F5 is proper for explaining the annual growth rate of GDP and GDP unit energy consumption, reflecting the energy dependence of economic growth. It is named the energy dependence factor. The sixth principal component F6 can explain the forest cover, PM2.5, and the percentage of the population using safely managed drinking-water services, named the environmental sustainability factor. The seventh principal component F7 helps explain the GDP per capita, land output efficiency, which represents the output value per unit area, and the output value per capita. It can be named the economic development potential factor.
Fourth, evaluation model construction. Factor scores are calculated by using the contribution weight of each factor relative to the cumulative variance as the weight to derive the composite score F for each country. Based on the weights, the study constructs a comprehensive evaluation model for the indicator system of inclusive green growth level in the Asia-Pacific region, which is as follows:
The values of λ were obtained by normalizing the variance contribution of the seven common factors, i.e., we have λ
1 = 0.410, λ
2 = 0.135, λ
3 = 0.119, λ
4 = 0.095, λ
5 = 0.088, λ
6 = 0.083, λ
7 = 0.070, which were derived as weights:
where F
1, F
2, F
3, F
4, F
5, F
6, and F
7 were calculated according to the principal component loadings of the factor scores coefficient matrix table in
Table 8.
The F
1–F
7 equations expanded according to the specific values in
Table 4 are as follows:
The composite score F for the level of inclusive green growth in the Asia-Pacific region is calculated based on Equations (3)–(9) and represented on the map (
Figure 2).
The inclusive green growth scores of the Asia-Pacific countries assessed generally show a spatial pattern that fully developed countries score the highest, higher-income developing countries score in the middle, and lower-income developing countries score the lowest. Generally, the countries in East Asia, Oceania, and North America have higher levels of inclusive green growth. Precisely, the developed economies such as Canada, the United States, Australia, and New Zealand have outstanding performance in economic prosperity, social inclusion, resource utilization, and environmental sustainability, taking the top four positions in the overall ranking of inclusive green growth. Higher-income developing countries such as China, Malaysia, Thailand, and Peru rank in the middle. The other lower-income developing countries, such as the Federated States of Micronesia, Tuvalu, Nauru, and Timor-Leste, have a lower overall ranking. The heterogeneity in the scores is mainly attributable to the distinctive economies that vary in economic aggregation, innovation capacity, and social inclusiveness over a large realm [
46]. The in-region countries also significantly differ in land area, natural resource endowment, and ecological environment carrying capacity, leading to the differentiated distribution of the inclusive green growth levels.
The same steps can apply to calculating the inclusive green growth level scores under the four dimensions. Finally, the scores are ranked from highest to lowest. The specific ranking results are presented in
Table 9.
Combining the individual rankings of each country in the Asia-Pacific region with the overall ranking in
Table 8, we can compare the scores of each country in the Asia-Pacific region in each dimension and the position of each dimension score in the whole Asia-Pacific region. Thus, we can distinguish the strengths and weaknesses of each economy.
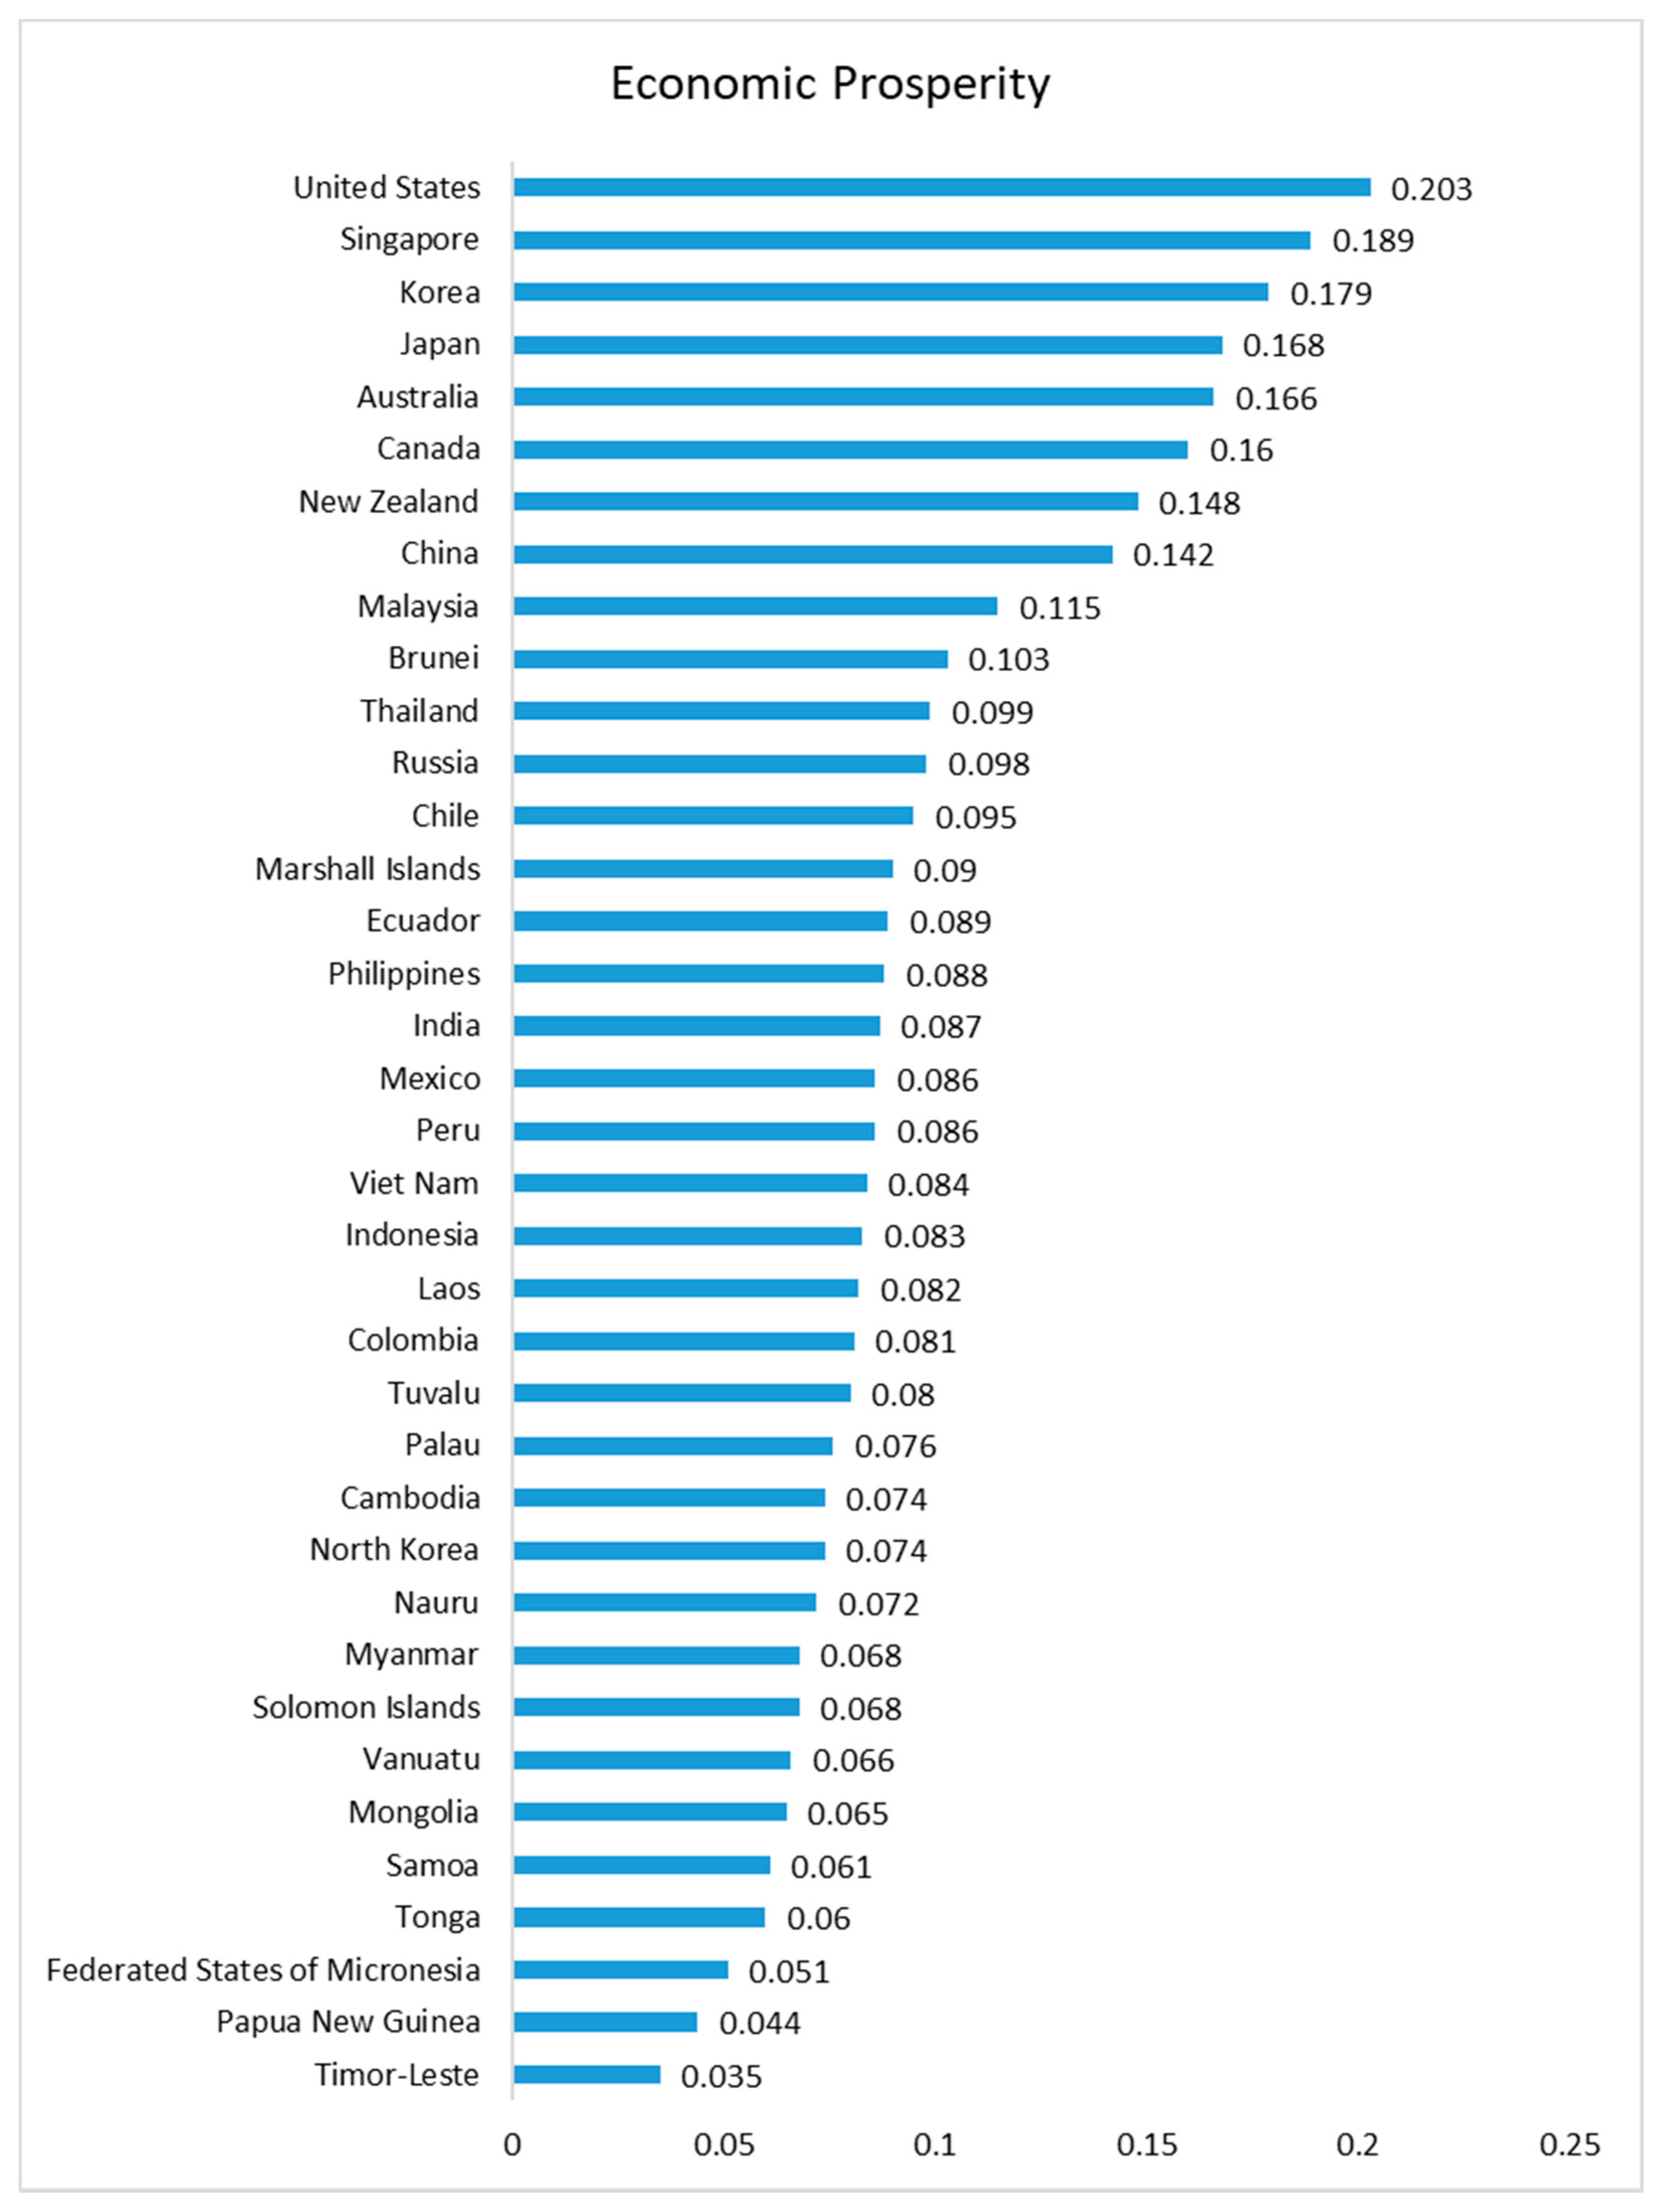
In terms of economic prosperity (
Figure 3), developed countries such as the United States, South Korea, Singapore, Japan, Australia, and Canada dominate the ranking. These countries also stand out and rank high in overall inclusive green growth, thus showing that their economic development levels contribute closely to their inclusive green growth. In contrast, Papua New Guinea, Federated States of Micronesia, and Timor-Leste, which ranked low, performed poorly in GDP per capita, R&D investment as a share of GDP, and import/export trade. They rank low in economic development. As a result, their final overall inclusive green growth scores rank low. For these low-income developing countries, it needs to closely capture the opportunities to actively integrate into the economic and trade cooperation around the Asia-Pacific region, and at the same time, increase R&D investment to promote their technological competitiveness and synergistic inclusive green development levels. Colombia, Chile, India, Indonesia, Peru, and Laos rank in the middle of economic prosperity. Although these higher-income developing countries benefit from a comparatively high annual GDP growth, their comparatively low R&D investment ratio may affect economic prosperity in the long run if the situation persists.
In terms of social inclusion (
Figure 4), Japan scores the highest, followed by Australia, New Zealand, Canada, and South Korea. These developed economies are capable of providing adequate infrastructure, equal access to education, and equitable access to health care for people at different income tiers. Brunei, the top-ranked country in the overall ranking, has a relatively poor performance in social inclusion, scoring in the middle of the Asia Pacific region. The bottom three countries in the social inclusion category are Tuvalu, Papua New Guinea, and Nauru. These three countries suffer from low school enrollment and high unemployment rates, resulting in their poor performance and ability to promote equity in educational opportunities and social progress for protecting people’s livelihoods. Indonesia, Peru, Vietnam, and Malaysia perform averagely in the ranking of social inclusion. These countries perform well in school enrollment, unemployment, and electricity access but poorly in health care, indicating uneven development in the social inclusion domain.
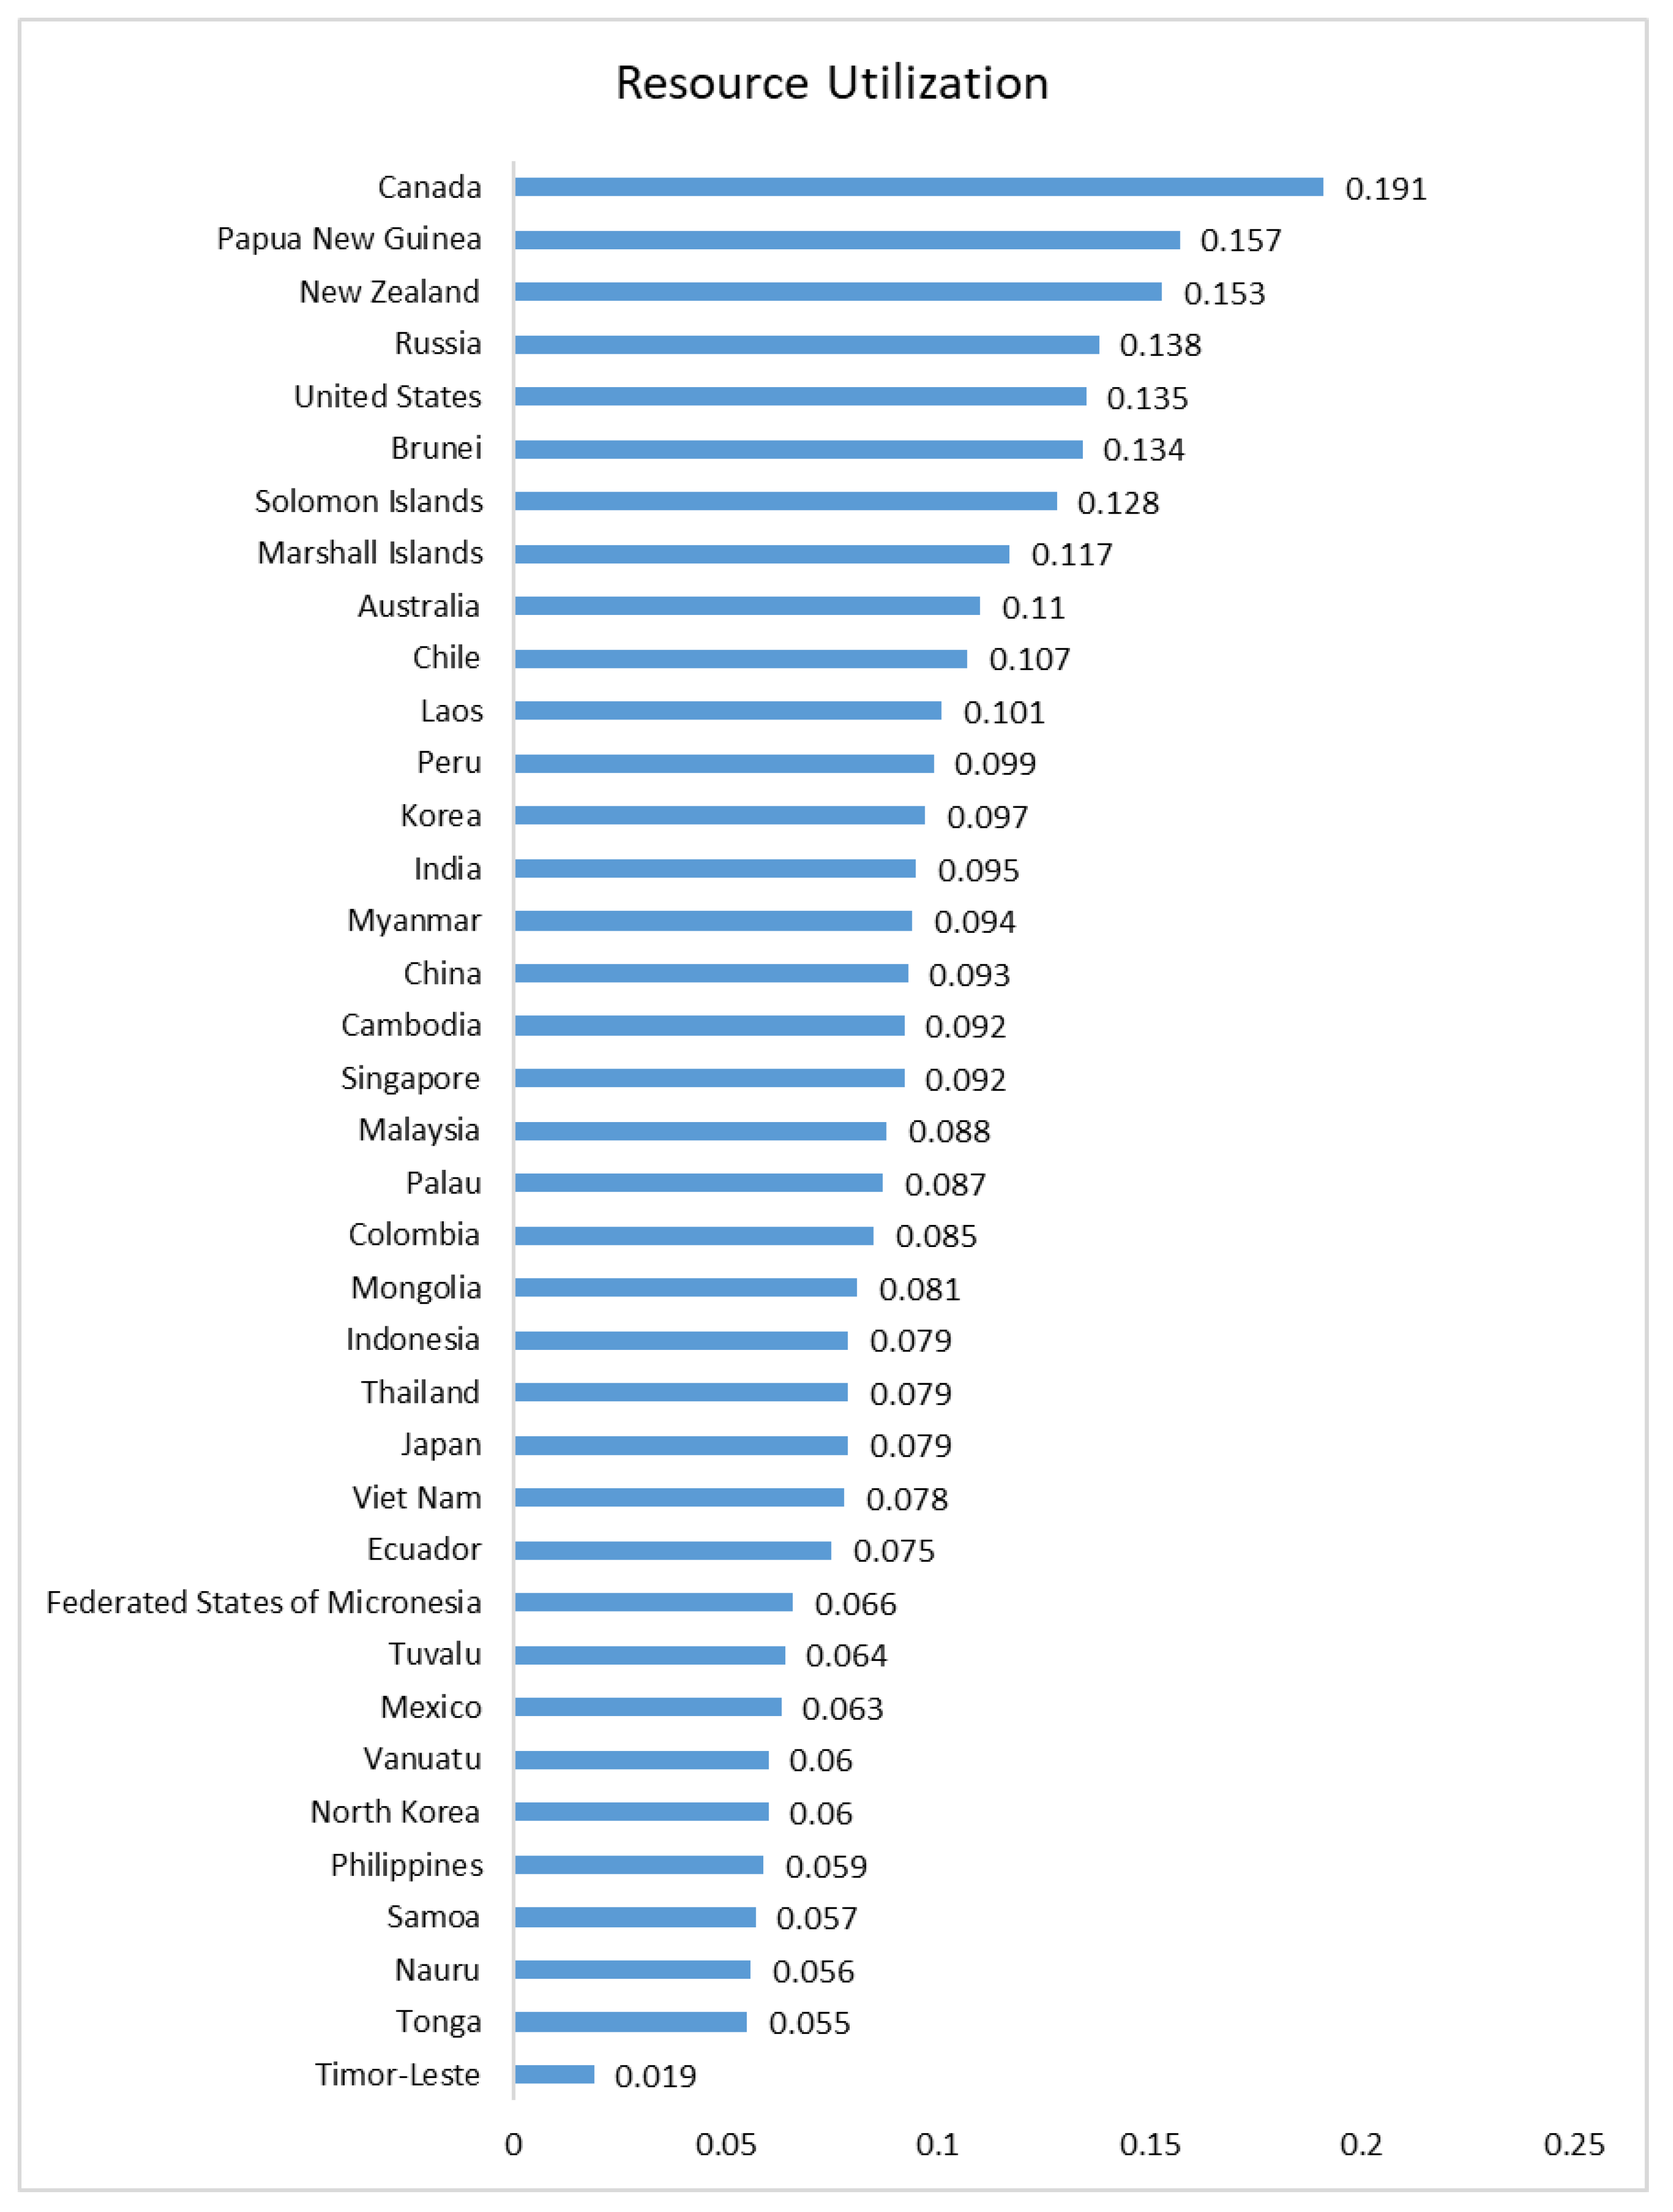
Regarding resource utilization (
Figure 5), the top-ranked countries, Canada, New Zealand, the United States, and Russia, are all relatively well endowed with natural resources. Resource abundance and diversity help these countries develop the economy with much less concern on resource constraint and shortage. Moreover, these countries can generally utilize resources more efficiently due to their high technological ability. However, Korea, Japan, and Singapore, also as developed economies, have relatively scarce natural resources. In contrast, the energy consumption per unit of GDP in these economies is high. The ratio of renewable energy use to total energy use is low, indicating that their energy structures are not optimal and their resource utilization efficiency still needs to improve. Also ranking higher are Papua New Guinea at second place, the Marshall Islands at eighth, and the Solomon Islands at seventh. These island countries rank better in resource use. However, other fellow island countries, Nauru, Samoa, and Timor-Leste, rank low in resource use due to their inefficient resource use with high per capita energy consumption. Mongolia, Ecuador, Malaysia, and Thailand rank in the middle of the resource use dimension. However, a common problem in these countries is the low share of renewable energy consumption, which may hinder their green development level in the future.
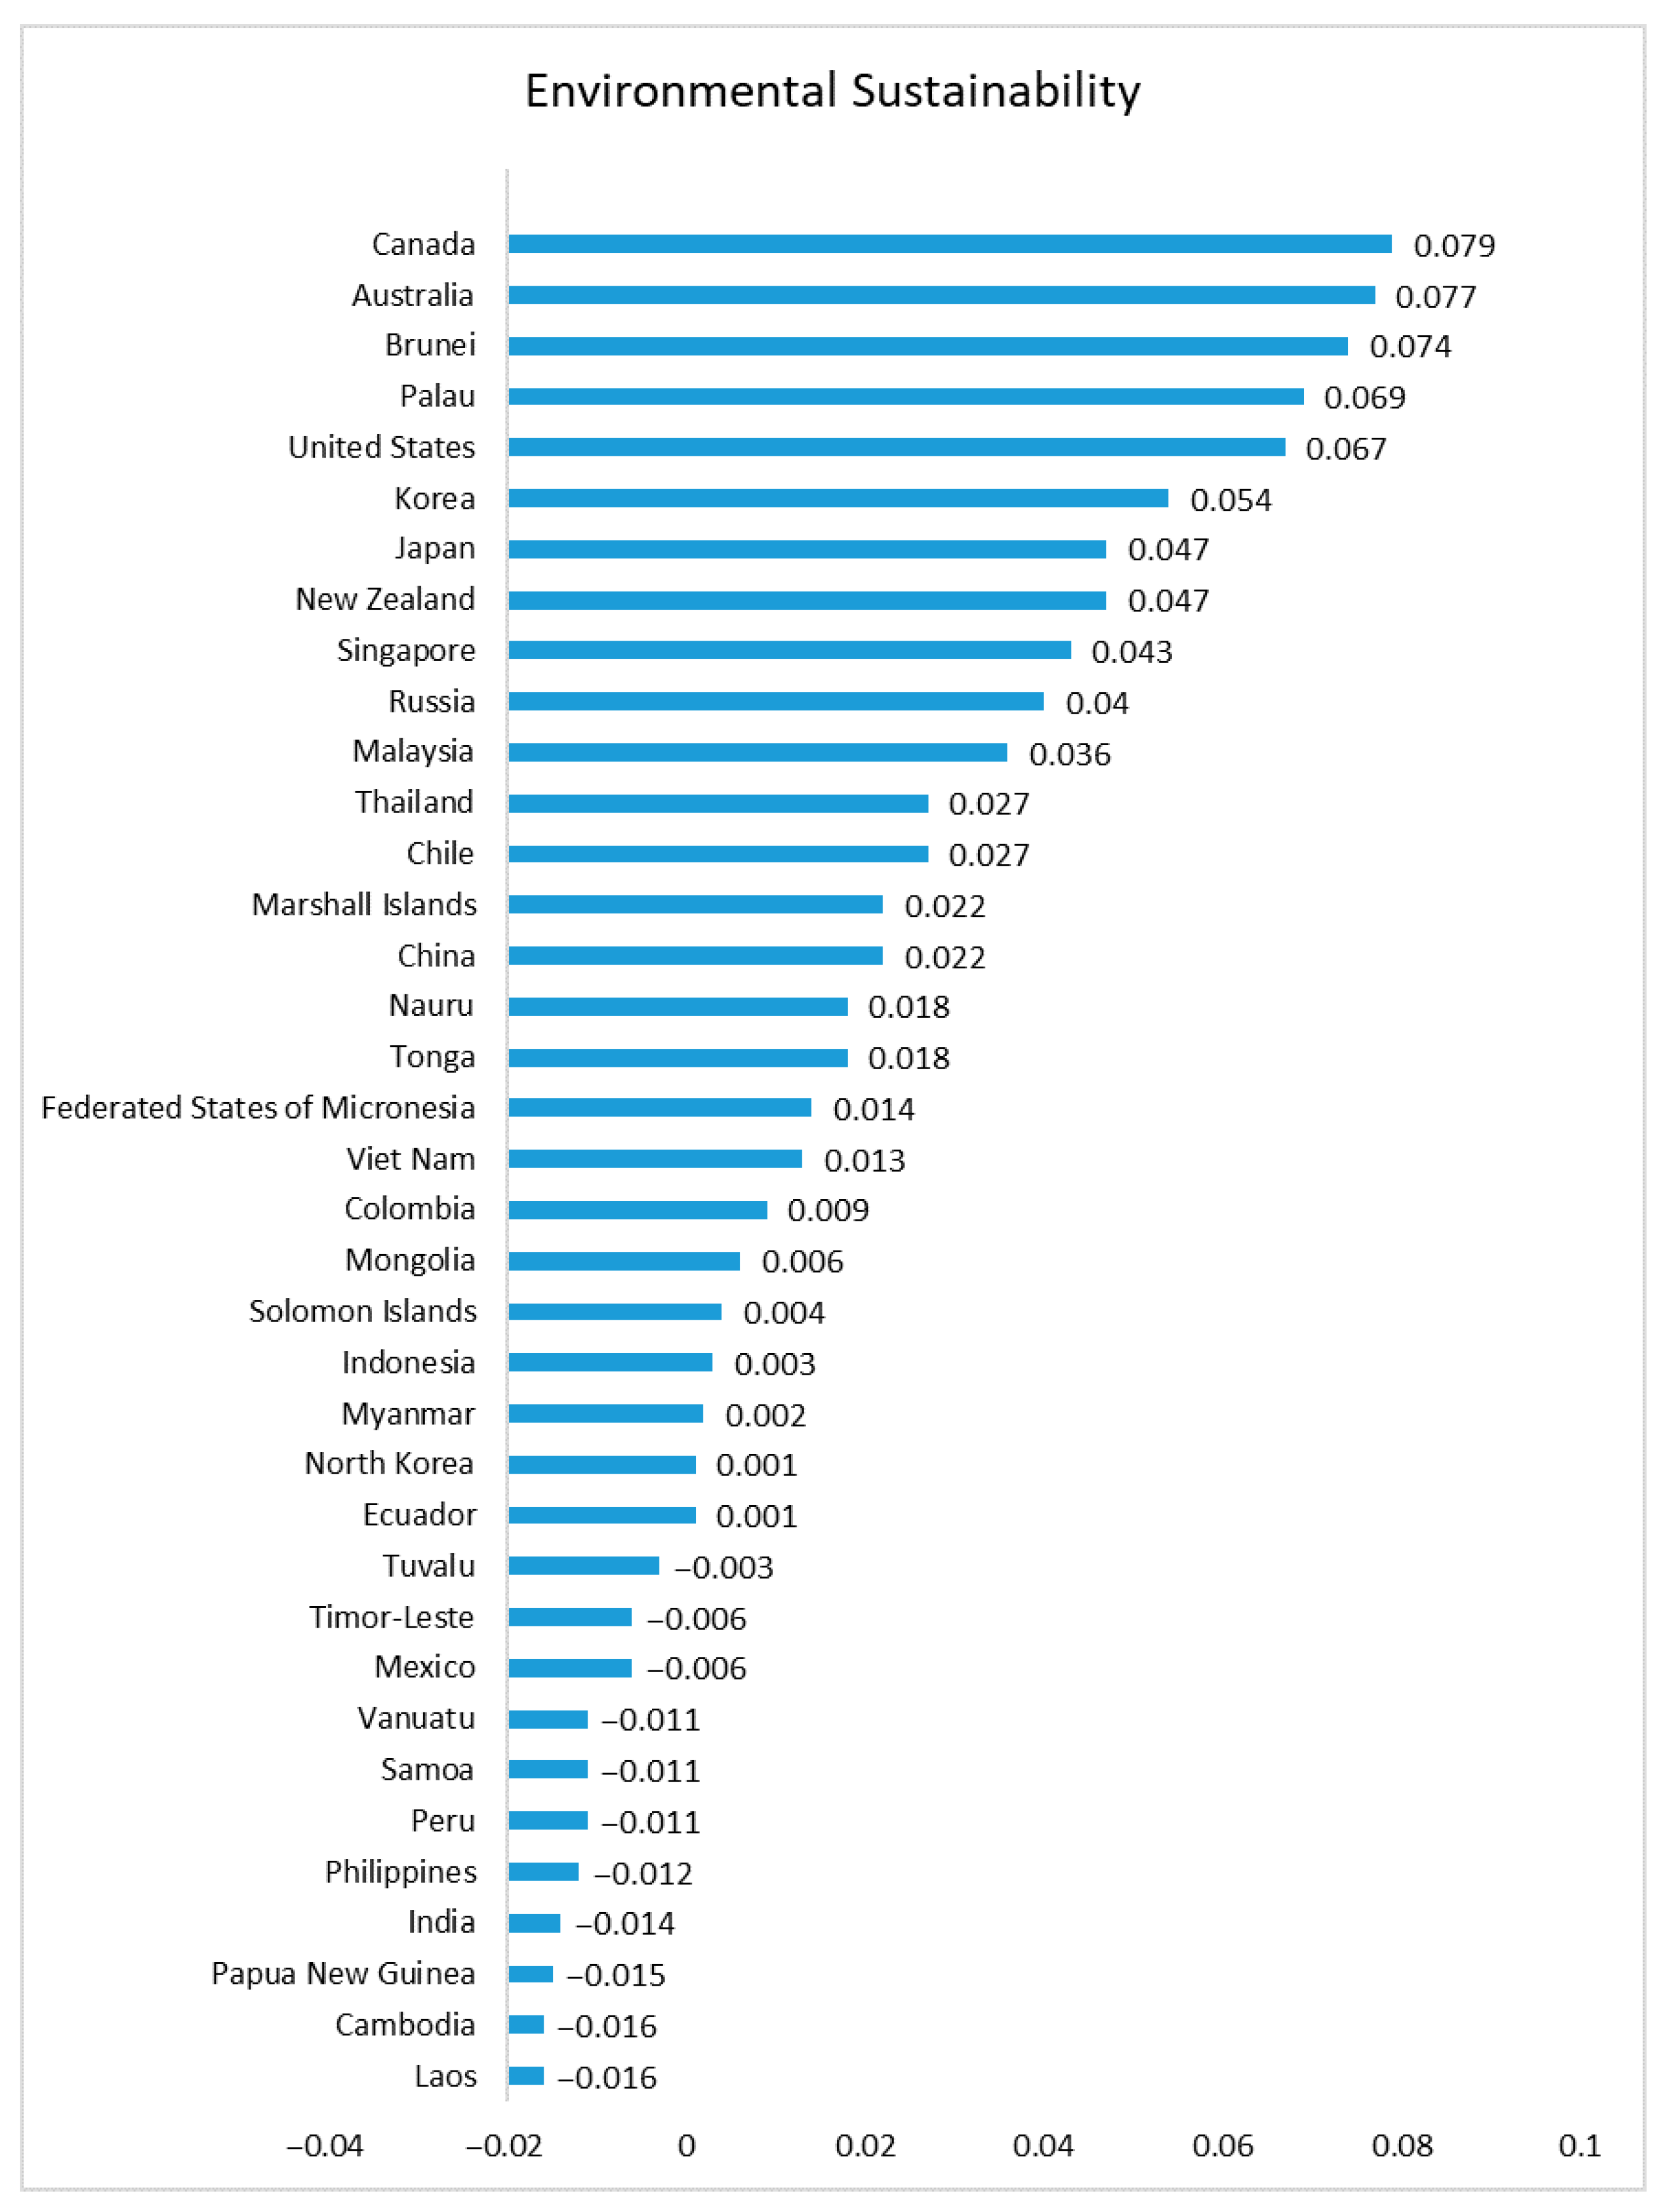
In terms of environmental sustainability (
Figure 6), Canada, Australia, and the United States continue to rank highly and perform well, leading the Asia-Pacific region. China, which has performed relatively well in economic development, has not done well in environmental protection. It again evidences that China’s economic growth has accompanied a sloppy approach to energy use and a greater degree of damage to the ecological environment. China needs to cope with resource utilization and environmental protection problems, accelerate green transformation, and move forward to high-quality economic development with high-level ecological protection. The country needs to pay close attention to reducing energy consumption and CO
2 emissions per unit of GDP, making economic growth reconciled with inclusive green development. The bottom three countries in environmental sustainability are Papua New Guinea, Laos, and Cambodia, which should pay attention to protecting the environment while developing their economies and avoiding the old path of pollution before treatment. Malaysia, Indonesia, Ecuador, Mongolia, and Tonga rank in the average place of the environmental sustainability dimension, but the low net ecological footprint per capita of Malaysia, Indonesia, and Tonga pull down their scores in the environmental sustainability area. The per capita ecological footprint of these countries has exceeded their ecological carrying capacity, which will affect environmental sustainability and is not conducive to an increased level of inclusive green growth.
The in-region countries’ inclusive green growth levels vary notably, mainly due to their uneven levels in economic and social development. In terms of countries, relatively developed countries have higher levels of inclusive green growth, while developing countries have lower levels of inclusive green growth. In terms of different areas of inclusive green growth levels, Asia-Pacific countries score relatively high in economic prosperity and resource use. However, Korea, Japan, and Singapore rank lower in resource use than other countries. The Asia-Pacific countries as a whole perform relatively poorly in the areas of social inclusion and environmental sustainability, with highly uneven development among countries [
47]. The Asia-Pacific region should invest more in social welfare and give people equal access to social security. In addition to economic activities, Asia-Pacific countries should also consider the impact on the environment to promote the region’s overall inclusive and green development.
3.2. Entropy Weight Method
The entropy weighting method can assign weight more objectively. It determines the weight of indicators by the influence of the relative change degree among indicators on the whole, and the indicators with large relative change degree have larger weight correspondingly. The specific calculation process of entropy weighting method is as follows.
First, standardization of raw data.
The normalized formula for the positive indicator is = .
The normalized formula for the inverse indicator is = .
Second, calculate the weight of the jth indicator for the ith country .
Third, calculate the entropy value of the jth indicator where k > 0, let k = 1/lnm, then 0 ≤ ≤ 1.
Fourth, calculate the information utility value of the jth indicator =1 − .
The magnitude of the information utility value affects the weight assigned to the indicator. A larger information utility value means that the higher the contribution of the indicator to the final composite evaluation results, the higher the final weight will be.
Fifth, normalize the coefficient of variation and calculate the weight of indicator j·.
Sixth, comprehensive evaluation F = Σ.
Generally speaking, if a country has a larger composite assessment value F, the higher the level of inclusive green growth in that country; conversely, the lower the level of inclusive green growth.
Based on the above steps, the composite score and ranking of Asia-Pacific countries’ inclusive green growth level under the entropy weighting method are calculated and compared with the composite score and ranking under factor analysis (
Figure 7).
By cross-comparing the score ranking by factor analysis with entropy weighting, we find that Southeast Asian countries such as Singapore, India, and Vietnam increased notably in their ranks. The ranking discrepancy is because the entropy weighting method gives a much larger weight to the indicator of land output efficiency. In contrast, the countries with low land output efficiency, such as Australia, New Zealand, and Japan, generally decreased in ranking. The ranked inclusive green growth levels of the remaining countries are consistent with the factor analysis method. The remaining countries’ ranking of inclusive green growth level is consistent with the factor analysis method, proving the credibility of the ranking results to a certain extent. The minor differences in the rankings are mainly due to the different accounting mechanisms of the two methods, which lead to the different weights. It also shows that according to the index system designed in this paper, the error by the entropy method is more considerable than factor analysis due to its excessive weighting on individual indicators. Our conclusions of this paper are analyzed and summarized on the results of factor analysis.
3.3. Cluster Analysis
Cluster analysis is also one of the multivariate statistical analysis methods, a method of classifying samples based on multiple indicators. The main clustering methods are systematic clustering, dynamic clustering, fuzzy clustering, etc. According to the classification objects, there are variable clustering (R-type clustering) and sample clustering (Q-type clustering), and the essence is to aggregate the closest objects into one class according to the degree of closeness between variables or samples [
48]. The systematic clustering method is one of the most applied methods in practice, classifying sample points into fewer homogenous categories.
In this paper, the systematic clustering method applies to clustering the levels of inclusive green growth in 37 Asia-Pacific countries and regions. The central idea of the systematic clustering method is first to define the distance between samples and the distance between classes. Initially, n samples are treated as n classes; then, two classes with similar distances are synthesized into a new class. The distances between the new and other classes are calculated, and then the classes are merged according to the minimum distance criterion. Repeat the above steps until all samples are grouped into one class. Finally, the clustering process is drawn in a lineage diagram, and a clustering diagram can be obtained. According to the clustering diagram, the number of clusters of samples is determined according to the actual needs, and the final clustering results are obtained [
49]. Using the scores of 37 countries in the Asia Pacific on economic prosperity, social inclusion, resource use, environmental sustainability, and the composite score for cluster analysis, a cluster dendrogram is obtained (
Figure 8).
According to the clustering diagram, the inclusive green growth levels of 37 countries in the Asia Pacific roughly aggregate into three categories: the first category is developed countries, including Canada, the United States, New Zealand, Australia, Japan, Singapore, and South Korea. These seven countries rank substantially higher in inclusive green growth than other Asia Pacific countries or regions, sitting in the top seven of the Asia Pacific inclusive green growth indicator system scores. The second category is higher-income developing countries (except Russia), including Russia, Brunei, Malaysia, Thailand, China, Chile, and Palau, lower only than the developed countries in the first category and belonging to the category of countries with a satisfactory inclusive green growth level. The third category is other developing countries, forming the main body of countries in the region that rank at the bottom category in the indicator system. The clustering chart demonstrates that the inclusive green growth level in the Asia-Pacific region roughly shows a distorted pattern. A small number of developed countries take leadership in the measurement, and a large body of developing countries follow. The three echelons of inclusive green growth shown in the cluster diagram match well with the three echelons of economic development.
4. Conclusions and Discussion
The Asia-Pacific region, commonly recognized as the most powerful engine of the world economy, plays a vital role in global environmental protection and sustainable development, meriting consistent concerns and profound studies for this area. Existing studies are mostly either focused on specific cleaner production technology [
50] (Charmondusit et al., 2016), industry [
15,
17] (Ojha, 2020; Berkhout, 2017), individual countries [
16,
18] (Sun et al., 2020; Cooperet et al., 2020), or more concentrated on the sole green growth dimension to assess the green development levels of Asian cities without explicitly incorporating the social inclusiveness component [
51]. The integrated study that stitches the inclusive growth and green growth for the broader entire region is still scarce.
This paper otherwise contributes a comprehensive indicator evaluation system to assess the inclusive green growth levels of the Asia-Pacific countries. Based on the classical literature review and the data publicly available for official institutions, we choose to analyze the levels of inclusive green growth of 37 countries in the Asia-Pacific region. The indicator system integrates the four dimensions of economic prosperity, social inclusion, resource utilization, and environmental sustainability and utilizes factor analysis to quantitatively measure the respective scores of the dimensions, complementary with the entropy weighting method for cross-validation. We rank the dimensional scores and derive an aggregate score for each in-region country to represent their overall inclusive green development levels. The main conclusions are as follows.
4.1. Main Conclusions
First, unbalanced inclusive green growth in Asia-Pacific countries is apparent, mainly manifested in two aspects: overall unbalance and internal unbalance. Overall, Asia-Pacific countries’ inclusive green growth levels are remarkably distinct. Countries in East Asia, Oceania, and North America, represented by Japan, Australia, the United States, and Canada, hold higher levels of inclusive green growth. In contrast, countries in Southeast Asia, such as Timor-Leste, Vanuatu, Tuvalu, and the Federated States of Micronesia, stay at a lower level of inclusive green growth. Some countries present uneven characteristics in diverse domains regarding their within-nation performance, creating large variations in dimensional rankings, implying no balanced development attained in general.
Second, the region’s inclusive green growth level bears a close correlation with the economic development level. The cluster analysis results show that the levels of inclusive green growth in the Asia-Pacific countries can roughly group into three echelons: developed countries, higher-income developing countries, and lower-income developing countries, which are also precisely the three echelons of economic development level. The overall pattern manifests a dichotomy: a leading group with a small number of developed countries taking leadership in inclusive green development, followed by a large body of developing countries with lower inclusive green growth levels.
It is evident that a country’s economic development level can largely influence the inclusive green growth level of the country. The latent heterogeneity in varying countries’ inclusive green growth levels is highly associated with their distinctive social and economic development stages. Economic prosperity largely determines how largely and equitably the country can allocate its wealth and resources to its residents, affecting society’s overall well-being and human equity. However, developing and developed countries are subject to entirely different problems and circumstances. Developed countries might well continue on sustainability-based green growth. For developing countries, poverty and inequality would be vital challenges that need to cope with in their growth processes while avoiding possible social shocks and environmental problems caused by uncontrolled growth [
52]. Such heterogeneity would lead to different perspectives and paths to address the growth versus environment paradox for the in-region countries. Developed countries have generally stepped into the post-industrial era. Economic prosperity enables these countries to allocate more social wealth, resources, and goods and services to their residents and allow more capital and technology invested in environmental protection and social welfare improvement, further stimulating social inclusiveness and economic growth. Such a positively stimulating cycle helps amplify the outcomes of balanced, inclusive green growth in all four dimensions: economy, society, resources, and environment. That is why developed countries tend to perform well in social inclusion, resource use, and environmental sustainability, leading to further balanced, inclusive development.
Rapidly growing developing countries benefiting from their rapid economic growth could allocate more social wealth and resources over various people. As a result, their general inclusive green growth levels have been vastly improved compared to history. However, the most eminent would be the challenge to promote their production efficiency and technology to build up a more resource-efficient and energy-saving production system to promote the inclusive green development level consistently.
Backward developing countries suffer from the tardiness of economic development, short of sufficient economic support to realize the positive cycle of inclusive green growth. Their overall inclusive green growth still stays at a bottom level in all aspects of the economy, society, resources, and environment. For example, countries such as Timor-Leste, Vanuatu, Tuvalu, and the Federated States of Micronesia in Southeast Asia have a low level of economic prosperity. Even though endowed with quality resources and environmental conditions, it is difficult for them to convert the gifts to social and economic values because of the technological backwardness, leading to a low level of inclusive green development. However, the Asia-Pacific cooperation brings about a great opportunity to these backward countries, allowing plugging their economies into the sizeable regional market to promote their overall development level.
The uneven and unbalanced development happens in some countries in various aspects, revealing the necessity of these countries to adjust their resource utilization and energy consumption structure to achieve a better level of inclusive green growth. Some examples are Korea, Japan, Singapore, and Thailand, whose overall rankings are 5, 6, 7, and 13 respectively, but their resource utilization rankings are 13, 23, 17, and 25. This evidences these countries being inefficient in resource utilization, especially in energy consumption. Meanwhile, some countries perform considerably better in one aspect than others, for example, Palau ranks 25th, 22nd, and 20th in economic, social, and resources, but 4th in environmental sustainability, and the Solomon Islands ranks 29th, 26th, and 22nd in economic, social, and resources, but 7th in resource use. These countries have the excellent resource and environmental endowments. Nevertheless, often due to their low economic and technology levels, they suffer a low inclusive green development level in general.
4.2. Policy Implication
The first implication is to pay attention to science and technology innovation to improve the vitality and potential of economic development. Inclusive green growth in Asia-Pacific countries requires a material foundation of affluence, both in terms of the fruits of affluence and the means to create it. Although traditional economic development may bring environmental pollution to some extent, economic development does not necessarily mean deterioration of resources and the environment. If economic development is appropriate, it is often easier to increase investment in environmental protection and environmental management. That is, green growth can be promoted via innovations in energy generation through environment-friendly technologies [
53,
54]. Meanwhile, along with the rise of new industries such as information technology and the Internet, lightly polluting or even non-polluting industries are becoming an important driving force for economic development in the Asia-Pacific region. Empirical findings also indicate that lowering the composite risk index, undertaking a transition to renewable energy, and enhancing environmentally related technological innovations help reduce CO
2 emissions for the RCEP countries in the long run [
55]. Therefore, Asia-Pacific countries should attach great importance to the value of innovation, focus on enhancing the role of the scientific community and NGOs, and strengthen the research of scientific research institutions, universities, and academic groups on green development issues. They also need to actively play to the advantages of NGOs in identifying ecological dangers and evaluating environmental impacts to provide intellectual guarantee for green development jointly, and encourage comprehensive innovation with technological innovation as the core, including product innovation, industry innovation, model innovation, system innovation, etc. Through innovation, they can form a driving mechanism to promote efficient and stable economic growth, get rid of the economy’s dependence on high emissions, high resource consumption, and environmental damage, promote innovation-driven green growth, and obtain innovation synergy to realize economies of scale. Through innovation, we will lead the zeitgeist of economic and social development, improve the vitality and potential of economic development, maintain a country’s sustainable competitiveness, and share the fruits of green development.
Second, it is important to follow a people-oriented philosophy and promote social development inclusiveness. Asia-Pacific countries should take adequate measures to promote the sharing of educational resources and achieve equality of educational opportunities. Developed countries, led by Japan, Canada, Korea, and the United States, should assist countries with relatively low development levels in educational resources and jointly promote equity in educational resources. APEC has set inclusive, sustainable, innovative, and secure growth as its goal, especially in the last five years. It advocates building an inclusive economy and a better world as the central theme of regional development. The in-region countries need to consistently explore the practical model to develop rural areas through industrial trade, as well as reduce poverty and achieve inclusive growth. In addition, more educational opportunities need to be given to women and indigenous people who are underrepresented in trade, to promote inclusive growth. Other countries in the Asia-Pacific region should also strengthen communication and cooperation with each other to try more and better ways to reduce the probability of inequality [
56]. In addition, Asia-Pacific countries should promote regional integration reforms, lower market access barriers, enhance trade liberalization, drive the economic development of countries with relatively low development levels, and promote employment and equal opportunities. The recently established RCEP involves many countries in the Asia-Pacific region. In the case of RCEP, one of the objectives of its agreement is to devote to lowering barriers, strengthening cooperation among SMEs in economic and technological fields, and providing capacity building and technical assistance to developing and least developed member countries. Therefore, RCEP member countries should actively promote the co-build and development of the agreement to create more equitable employment and the business environment. This is to improve infrastructure construction, increase the penetration rate of essential equipment, and guarantee the living standard.
Third, policies must improve the efficiency of resource utilization and promoting energy transition in Asia-Pacific countries. Asia-Pacific countries should focus on the green transformation of development methods, upgrade technology, and improve energy utilization. Through the APEC cooperation, the in-region countries need to improve the efficiency of energy use; expand the use of renewable energy; reduce waste pollution; create more opportunities for individuals, enterprises, and communities; promote green synergistic development; and play an active role for promoting energy efficiency by strengthening low-carbon and green technologies. Other countries in the Asia-Pacific region, especially the developing countries, should also actively learn and implement energy policies suitable for their national conditions. On the one hand, they should improve resource utilization efficiency and change the way of resource utilization to reduce energy consumption per unit of GDP, increase the proportion of renewable energy use, and achieve sustainable economic development.
On the other hand, it should pay attention to the planning and protection of natural resources, reduce pollution levels, improve air quality, and achieve intergenerational equity based on rational exploitation of natural resources. In terms of environmental protection, APEC economies have attached great importance to biodiversity and climate change in recent years and have taken various measures to reduce the damage to the environment and the impact on climate change to protect the earth’s ecological environment and reduce carbon dioxide emissions, and have achieved vibrant research results. The APEC economies should also strengthen cooperation between countries in ecological civilization construction, focusing on establishing a coordination mechanism for ecological and environmental protection in the Asia-Pacific region. The countries need to coordinate environmental elements such as mountains, seas, forests, and water, taking into account the specificities of each country’s situation while considering the typical requirements for ecological and environmental protection to solve challenging environmental problems.
Fourth is to strengthen green development cooperation and form a strong synergy for the development of the Asia-Pacific region. On the whole, the level of inclusive green growth in the Asia-Pacific region is divided into three echelons. The level of inclusive green growth in developed countries is much higher than that of developing countries. For this uneven development trend, if we want to enhance the inclusiveness of green development, we should develop different paths of inclusive green growth according to the development status of different countries. Developing countries are still in the primary stage of economic development, facing the similar population, resource, and environmental problems and challenges. They should strengthen South–South cooperation, joint self-improvement, and continuously expand the pace of opening up. For the leading developed countries, it is crucial to clarify the “common but differentiated” responsibilities. Inclusive green growth is not a point-in-time issue but rather a chronological issue that combines history, reality, and the future. Historically, unequal international economic relations have created an uneven development hierarchy, with developing countries being passive recipients of international economic and technological conditions rather than leaders and influencers. Under such circumstances, developing countries often lie downstream of the industrial chain and become direct victims of resource and environmental damage. In contrast, developed countries have entered the post-industrial era. They should consider the characteristics of developing countries when reducing their high energy consumption and pollution. It requires making a difference in the assumption of responsibilities, especially in development goals, paths, and progress arrangements, giving developing countries more room for maneuver and development space. It is necessary to actively provide assistance to developing countries, strengthen North–South cooperation, and help developing countries promote green transformation in resource environmental protection, green economic development, and urban governance to achieve a win–win situation in a mutually beneficial manner.
Under the background of continuous advancement of globalization and modern economy, society, and science and technology, Asia-Pacific countries constitute a unified and open giant system. The higher the overall national development level, the stronger the interaction between countries. The transformation from a single country to a cluster of countries and a regional circle is an inevitable law of national development. The green development of the Asia-Pacific region in the future is no longer the green development of a single country, but the green development of the whole region, a green development system with a reasonable layout, close connection, and clear division of labor composed of countries of different scales and development levels in a specific spatial scope. Therefore, the Asia Pacific region should coordinate resource allocation, optimize the layout and improve the structure in a broader space to form a regional green development network with overall evolution, reasonable division of labor, and linkage and collaboration. Therefore, the path of inclusive green development in the Asia-Pacific region explored in this paper is: to improve the green governance system of Asia-Pacific countries with the theme of open communication and cooperative governance; to clarify the “common but differentiated” responsibilities to enhance the green development capacity of developing countries; to form a community consensus of destiny and to build a green development support system in the Asia-Pacific region. The countries shall jointly build a future-oriented Asia-Pacific green development partnership, create an open Asia-Pacific economic market, and form a strong synergy for inclusive green growth in the Asia-Pacific region. It calls for building a modern country with economic prosperity, social inclusion, resource conservation, and environmental livability, jointly promoting inclusive green development in the Asia-Pacific region and even globally.


