Article

Tourism as a Key for Regional Revitalization?: A Quantitative Evaluation of Tourism Zone Development in Japan

1
Institute of Construction and Environmental Engineering, Seoul National University, Seoul 08826, Korea
2
Department of Urban Planning, Keimyung University, Daegu 42601, Korea
*
Author to whom correspondence should be addressed.
Sustainability 2021, 13(13), 7478; https://doi.org/10.3390/su13137478
Submission received: 22 May 2021 / Revised: 9 June 2021 / Accepted: 29 June 2021 / Published: 5 July 2021
(This article belongs to the Special Issue Urban and Regional Planning and Sustainable Cultural Tourism)

Abstract

:
Since the dawn of the 21st century, Japan has switched its national industry strategy from traditional industries—manufacturing and trading—toward tourism. Regional revitalization is a particularly important issue in Japan, and by uniting regions as an integrated tourism zone, the government expects an increase in visits to tourism zones. This study quantitatively evaluates whether the regions that contain a tourism zone experience a significant increase in visitors by using a quasi-experimental pretest–posttest control group design. Additionally, it examines the effects of subsidies through regression modeling. The results indicated that the tourism zones that were comprised of a narrow region in the same prefectures experienced a significant increase in visitors. The subsidy on information transmission, measures for the secondary traffic, and space formation had a significant positive impact on the increase in visitors to these tourism zones. Implications on tourism policies, urban and regional development, and community development can be obtained through this study.

1. Introduction

According to the World Travel and Tourism Council’s report from 2019 [1], the tourism industry is the second-fastest growing sector in the world. The tourism sector contributed to 4.4% of the GDP, 6.9% of the employment, and 21.5% of the service-related exports of OECD countries in 2020 [2]. Since the tourism sector’s contribution to GDP and employment has been increasing, many countries have been promoting tourism as a key industry and have revised their tourism law and suggested new tourism policies with the expectation of overcoming the economic recession [3]. Regardless of the fluctuating characteristics of the tourism industry [4], many countries consider it an agile and accessible solution for the new service economy, given the weakening of many other aspects of the economy [5].
Japan is plagued by a significant population decline, aging society, and long-term national debt that was equivalent to 236.57% of its GDP in 2018 [6]. In its search for countermeasures, the Japanese government identified tourism as one of the keys to solving the nation’s economic issues and opted to enhance its importance as a national strategy [7]. A “tourism nation” is one that seeks to strengthen its economy through tourism [8,9,10,11]. By labeling itself as a “tourism nation,” Japan has displayed its intent to reorient its economy toward tourism from manufacturing and trading, which have been the critical basis of its economy for last decades. The Tourism Nation Promotion Basic Law was completely revised in 43 years, as the Japanese government positioned tourism as one of the pillars of its national policy [10,11,12]. Among the various proposed policies, the Tourism Zone Development Act served as a comprehensive and systemic tool for enabling the realization of Japan’s aim of becoming a tourism nation [10].
The purpose of this study is to measure the effectiveness of the tourism zone development policy, which was promoted to facilitate regional revitalization. Through a quasi-experimental pretest–posttest control group design and regression modeling, this study identifies and examines the impact of the tourism zone development policy and identifies the characteristics of the tourism zones that were most significantly affected by it. This study will conduct an empirical examination based on nation-wide quantitative data.

2. Background Study

2.1. Tourism Nation and Tourism Zone Development

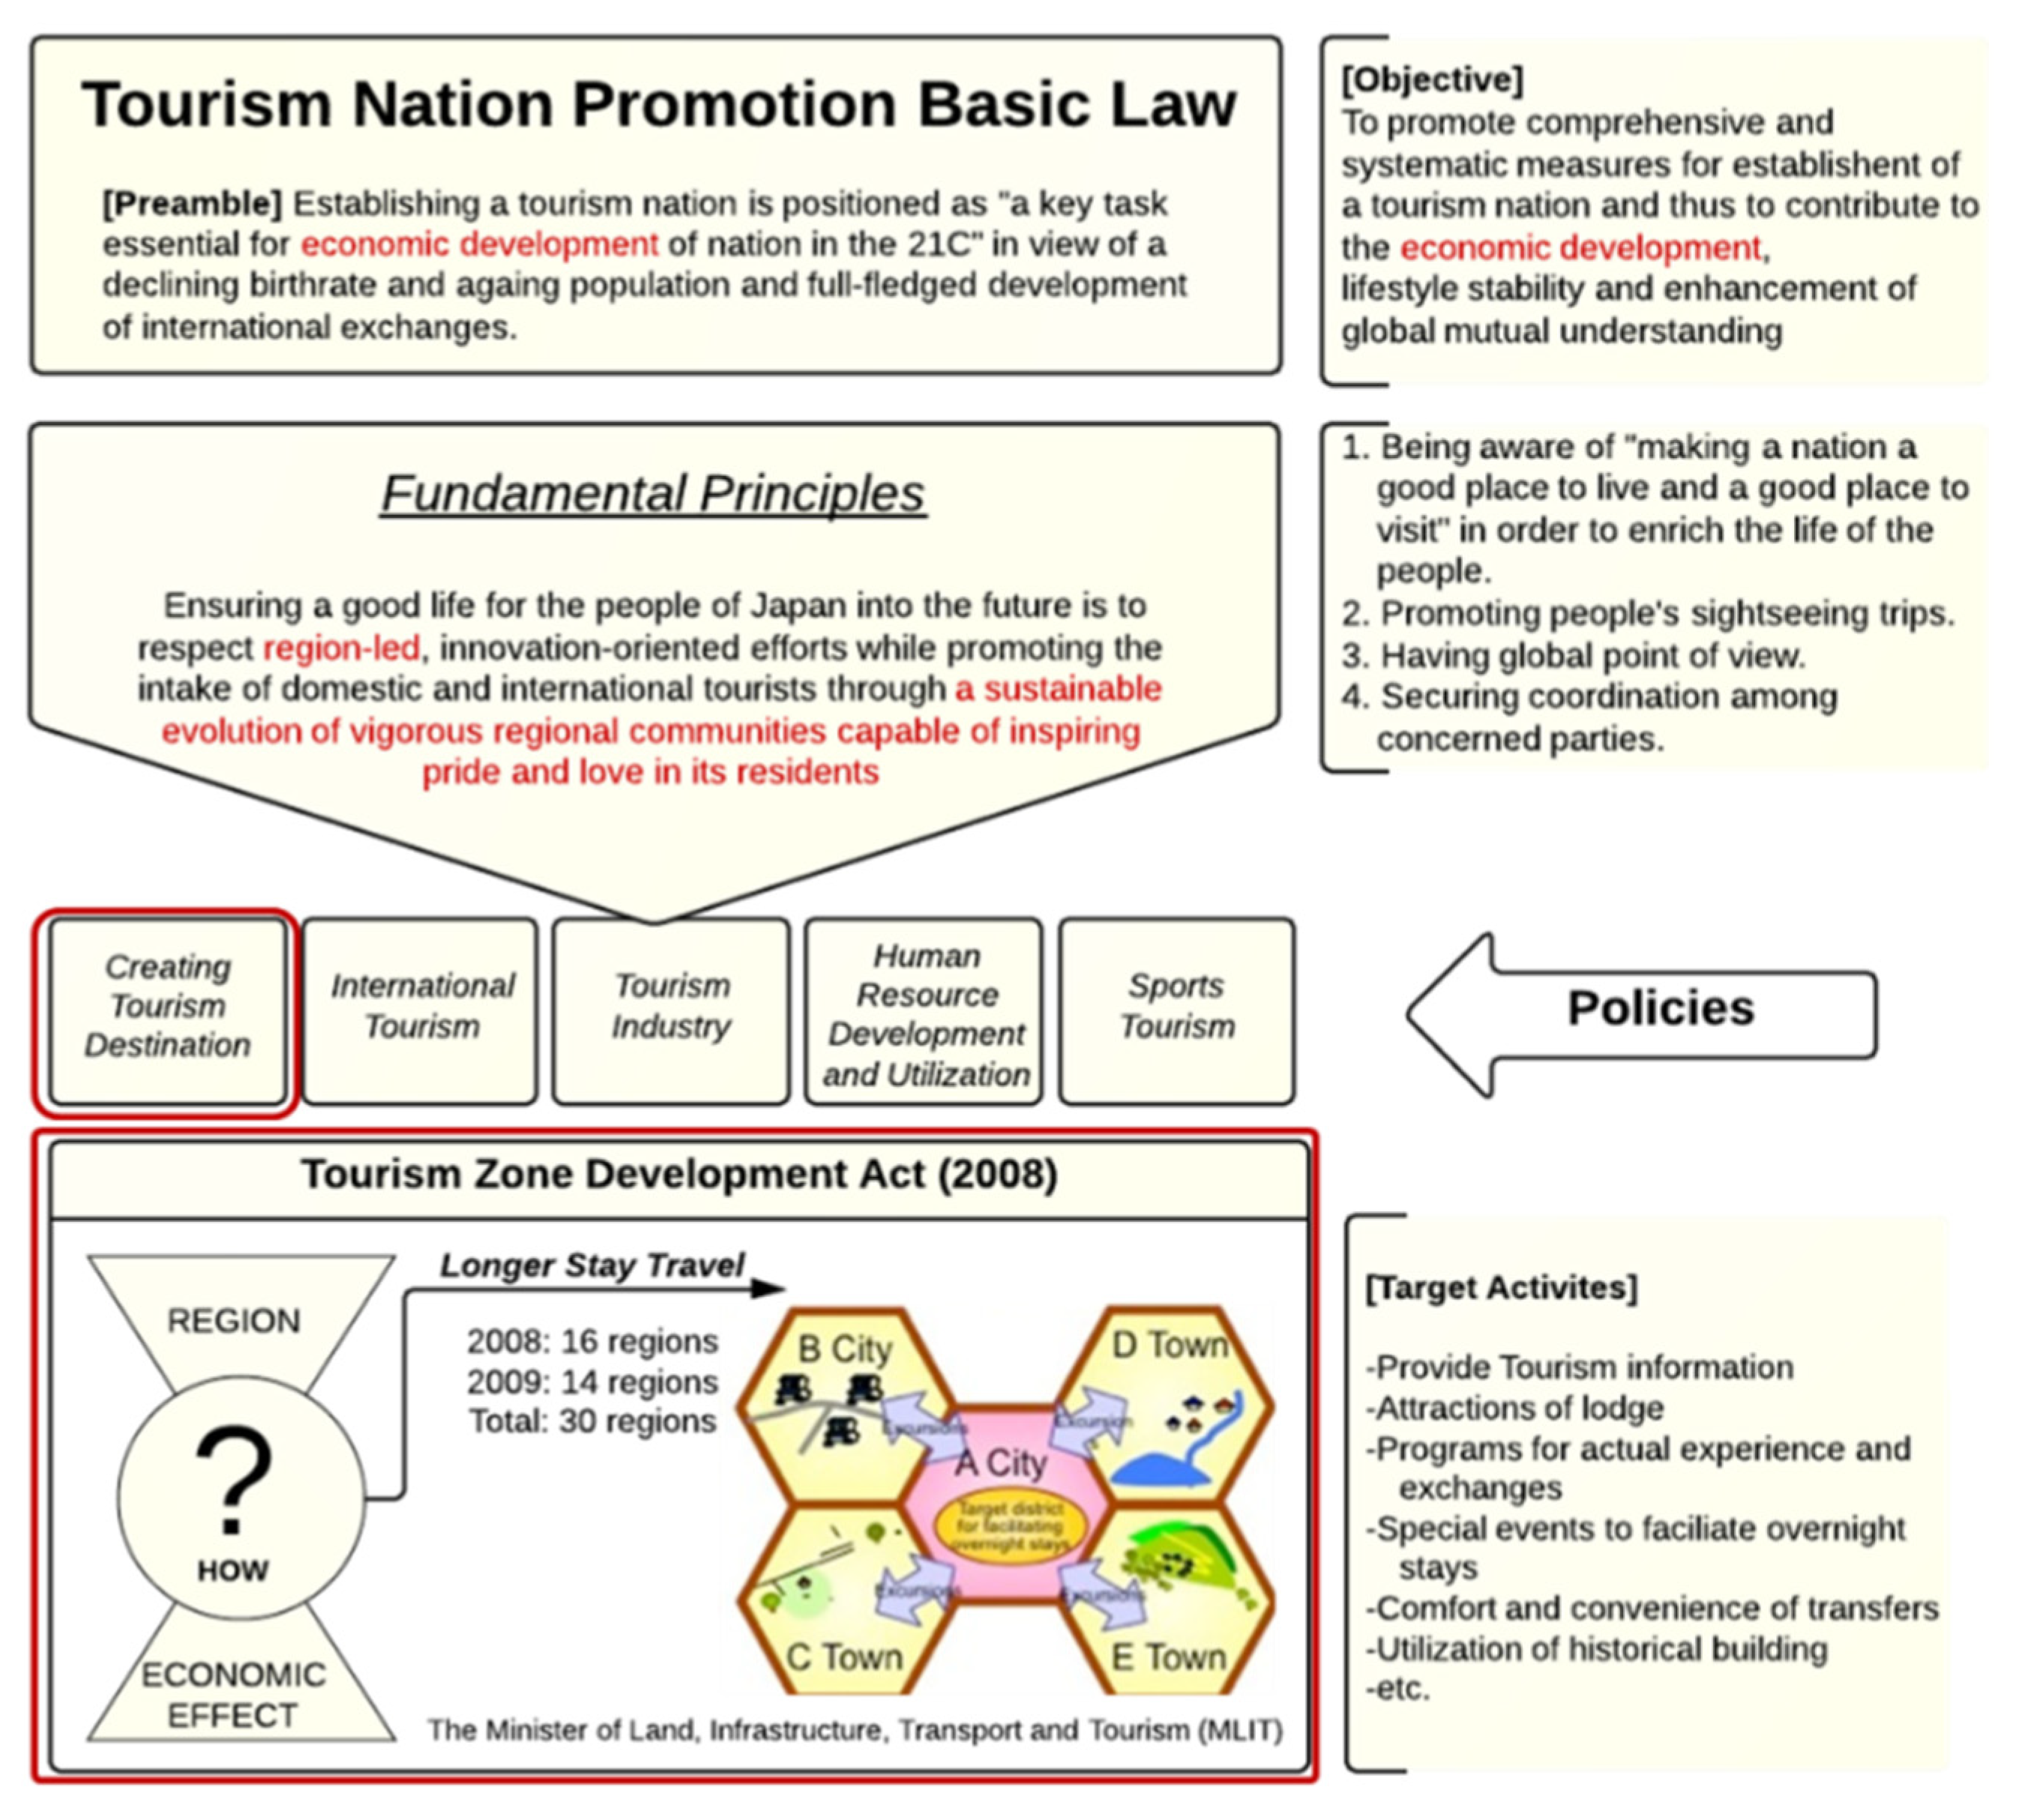
2.1.1. Tourism Nation and Regional Revitalization

The tourism industry is known to have the potential to expand economic opportunities within local communities [13]. In the Tourism Nation Promotion Basic Law, region-led development through regional communities was described as essential for economic development. The main goals of this law appear to be the improvement of the attractiveness of regions and the facilitation of economic development [10]. “Regional development” is now inseparable from tourism planning, and “region” has become an important key word in the new tourism law. Figure 1 shows the main policies under the Tourism Nation Promotion Basic Law. There are five ongoing policies under this law—creating tourism destinations, international tourism, tourism industry, human resource development, and utilization and sports tourism. Creating tourism destinations originally focused on domestic tourism. Making a region attractive involves providing a good place to live for residents and providing a good place to visit for tourists. The inbound tourism policy was promoted by the Japan Tourism Agency (JTA). Simultaneously, inbound tourism was mostly promoted through the Japan National Tourism Organization’s Visit Japan campaign.
The main policy oriented toward regional revitalization is “creating tourism destinations”. This policy is promoted under the Tourism Zone Development Act. This act originally focused on domestic tourism. However, it was revised to target inbound tourists as well.

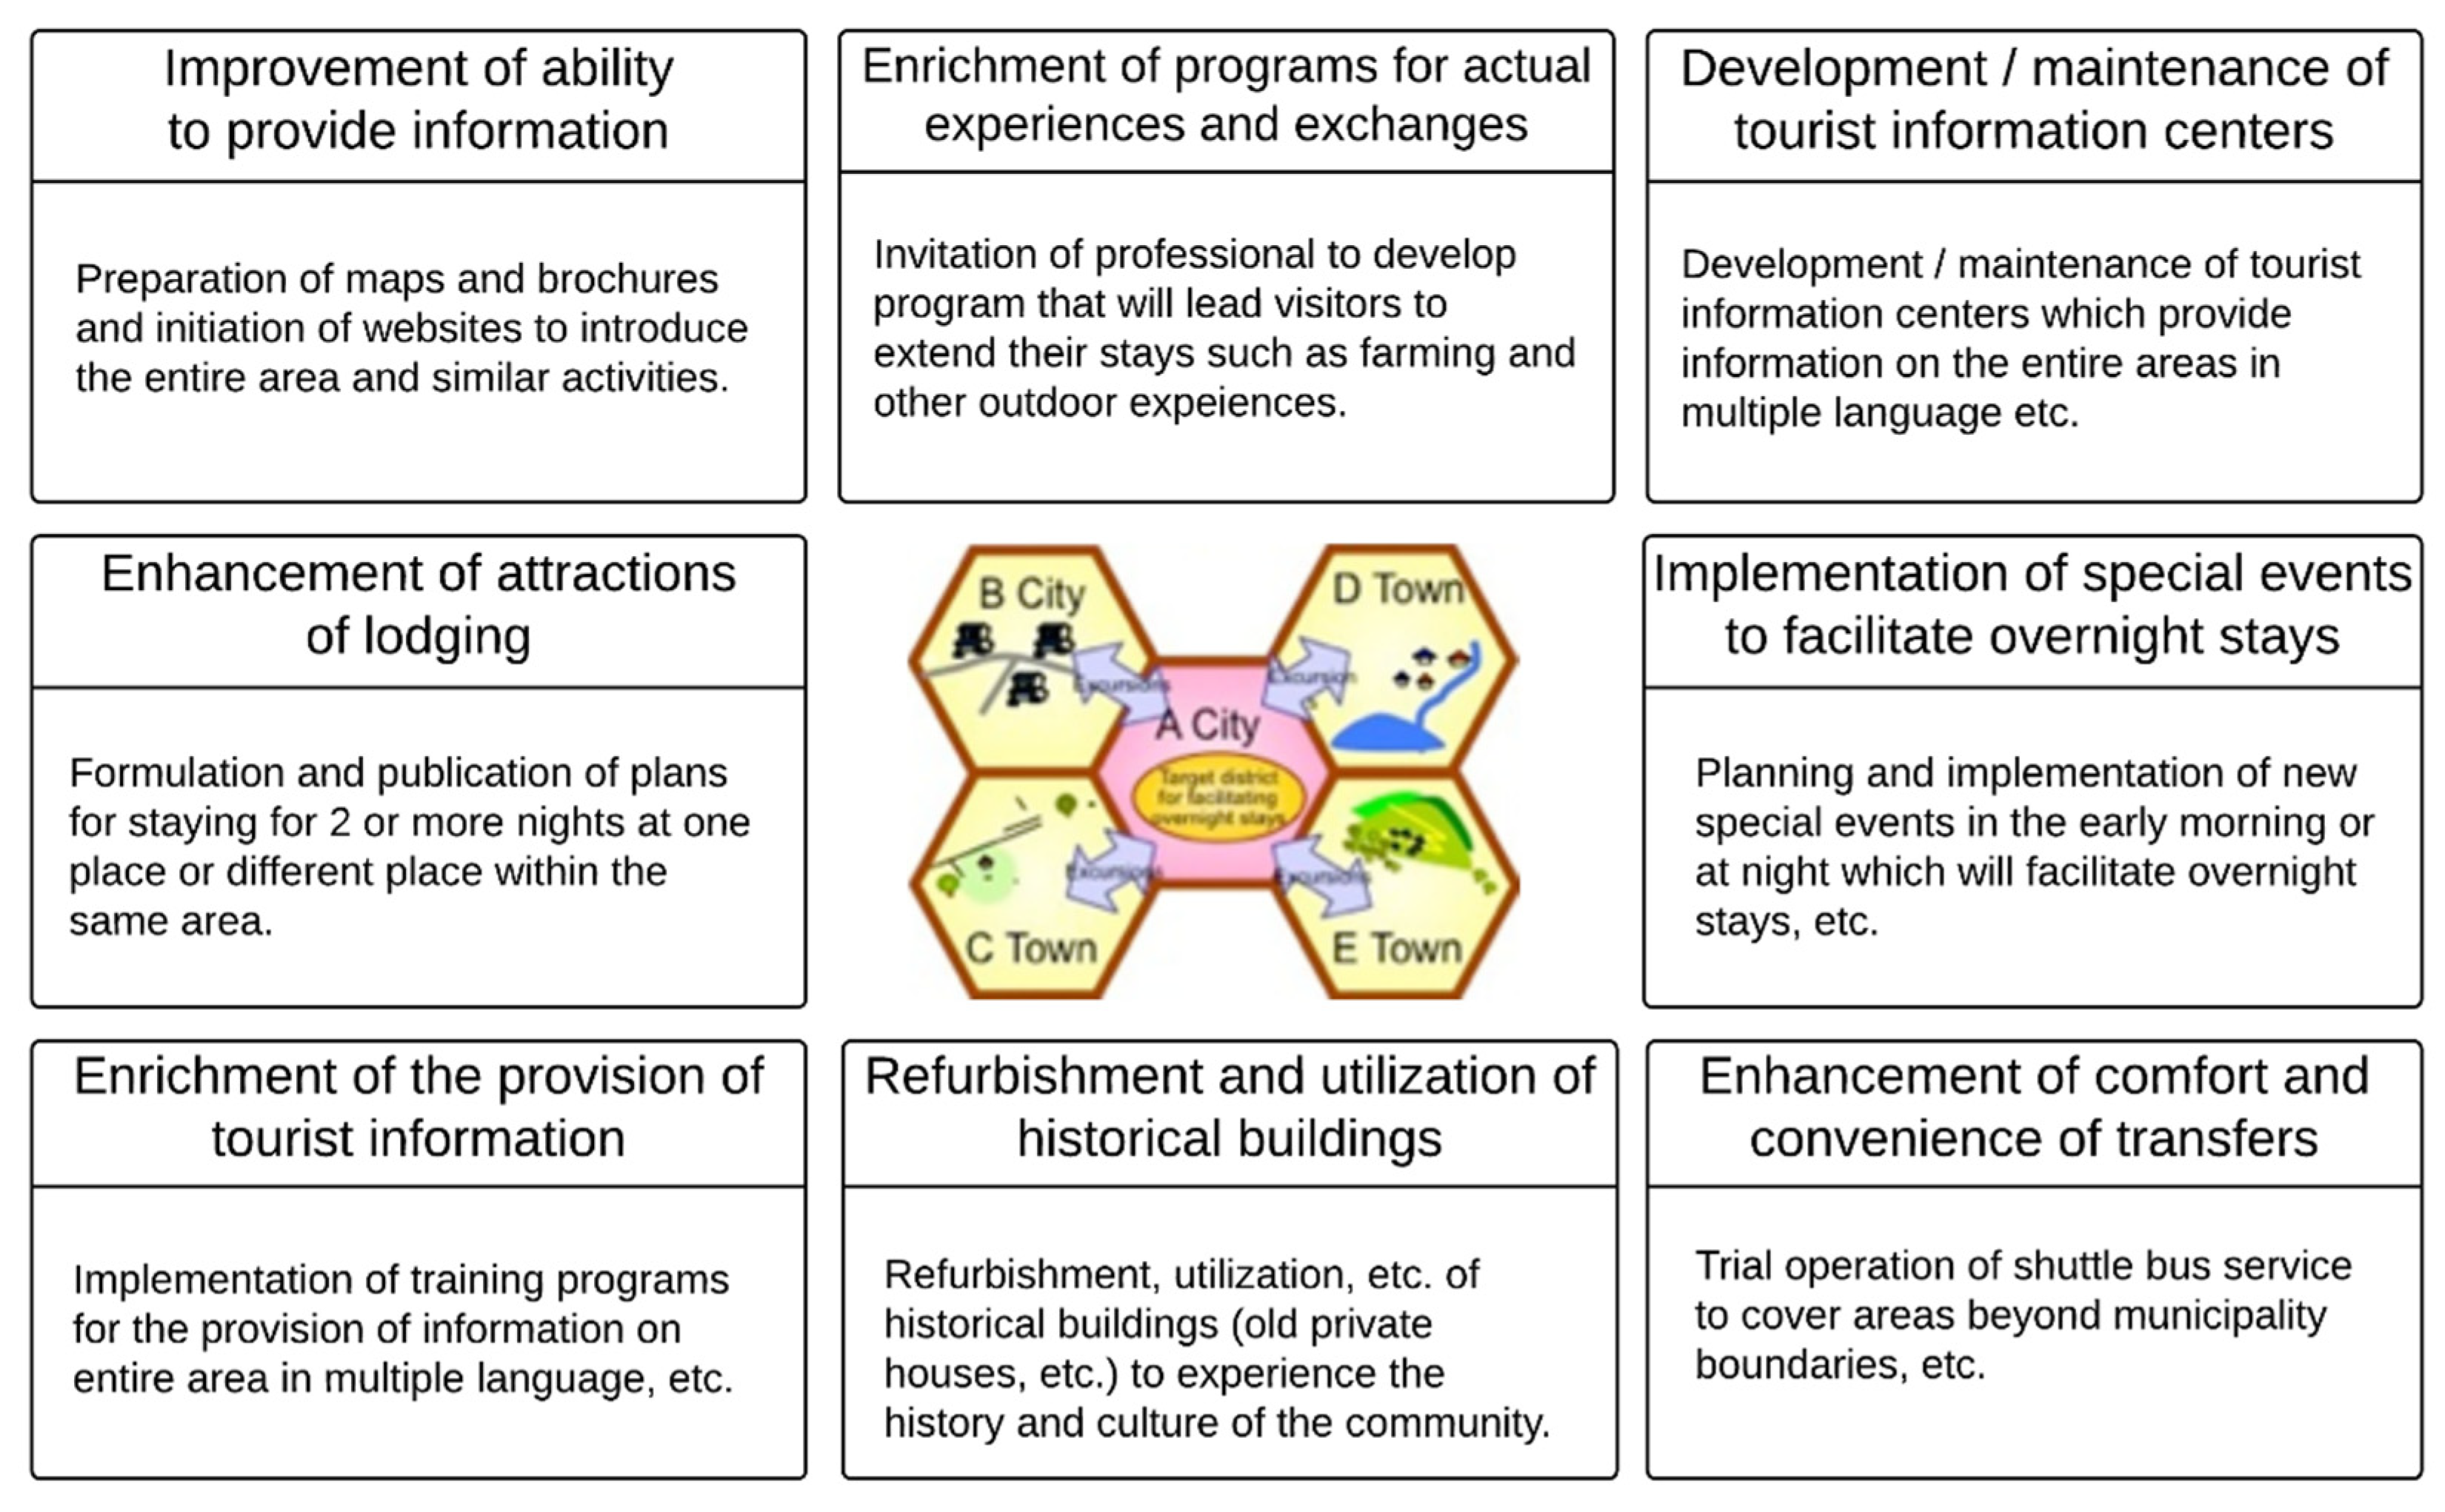
2.1.2. Target Policy: Tourism Zone Development

In 2008, the Tourism Zone Development Act (Act no. 39 of 2008) was introduced under the Tourism Nation Promotion Basic Law. Based on this Act, the tourism zone development plan has been carried out since 2008. The tourism zone development plan seeks to promote the arrangement of tourism zones for stay-oriented tourism, which includes the provision of lodging facilities, with the exemption of specific regulations, in order to enable Japan to become a tourism nation [14]. The plan aims to increase the number of tourists that visit Japan and to extend the length of their visits. This plan enables diverse groups such as local governments, tourism-related organizations, agriculture and fishing associations, and non-profit organizations to cooperate and function as an integrated union for regional revitalization (see Figure 2). They create a system of supporting subsidies for tourism zone development so that it systematically assists the formation of multiple broad tourism zones. A tourism zone is an area consisting of tourism sites that are closely linked in terms of nature, history, culture, or otherwise. A tourism zone is designed to enable longer stay during travel through cooperation among its tourism sites and aims to enhance the attractiveness of these sites [15].
Due to the introduction of the Tourism Nation Promotion Basic Law, regional revitalization was expected to be crystallized via the development of possible landmarks and tourism zones that possess enough national power to attract a number of people. It unites regions as an integrated tourism zone––generating numerous associations between tourist attractions. Through strategic tourism zone development, any related regions may encourage tourists to stay for longer periods and revisit its areas. In accordance with the approval of the tourism zone development plan, total comprehensive supports for tourism zone development could be implemented. These include: (1) support and subsidies to promote a return visit or projects expected to facilitate tourism zone development (up to 40%), (2) exceptions for the travel business regulation regarding landing travel package sales, and (3) easing the transportation-related procedures by adopting a gas coupon.
The Ministry of Land, Infrastructure, Transport and Tourism approved the tourism zone development plan for 16 zones on 1 October 2008, and 14 zones on 22 April 2009 (30 zones in total) [16]. Figure 3 shows the list of certified tourism zones, and detailed information regarding every tourism zone and their constituent municipalities is listed in Appendix A. In this study, a policy impact evaluation will be conducted in order to accurately measure the policy’s effectiveness on the first stage tourism zones that were established in 2008 and 2009. Owing to the revision of the Tourism Zone Development Act in 2012, some of these early tourism zones were duplicated or reassigned, which presents a risk of bias in measuring the policy’s effectiveness if the tourism zones that were constructed after 2012 are included. Through a quantitative summative evaluation of the tourism zone development policy during its early stages, this study seeks to obtain guidance for the implementation of the ongoing tourism zone development policy.

2.2. Tourism Policy Evaluation

2.2.1. Policy Evaluation Method

A policy evaluation is conducted to observe the impact of a policy in terms of necessity, efficiency, validity, etc., in order to improve its planning and implementation process [18,19]. The types of policy evaluation vary according to its timing, stage, purpose, etc. There are several ways to classify the types of policy evaluation, but Scriven’s classification is generally accepted. According to Scriven’s study, policy evaluations can be divided into: (1) formative evaluations and (2) summative evaluations [20]. A formative evaluation (also known as process evaluation) aims for policy performance improvement. It identifies what kind of program works properly and what is required to improve the program. Generally, a formative evaluation is conducted before or during the policy implementation. A summative evaluation, on the other hand, is outcome focused. A summative evaluation is also known as a policy impact evaluation, an outcome evaluation, or an effectiveness evaluation. Since they are the most widely used type, policy evaluations are generally considered to be policy impact evaluations (summative evaluations). Additionally, summative evaluations entail more objective, quantitative methods of data collection [21].
The policy evaluation methodology was developed particularly from the perspectives of social psychology, sociology, and economics. Social psychologists and sociologists determined the effectiveness of a certain program or project by using an experimental design. On the other hand, economists measured the efficiency of a program or project by applying a cost-benefit analysis or cost-effectiveness analysis [22]. The evaluation designs and methodology were developed with a focus on policy impact evaluation. Thus, in this study, basic evaluation designs for summative evaluation (policy impact evaluation) will be introduced as an analytical design. A policy impact evaluation enables the identification of the difference between the conditions before and after the policy implementation. Therefore, the precise measurement of the direct impact of the policy is a critical element of the evaluation.
Experimental research aims to determine whether a specific treatment or intervention influences an outcome [23]. As an analytical design for policy impact evaluation, true-experimental design is the most powerful in terms of controlling spurious or confounding factors that threaten internal validity [23,24]. Additionally, this design is widely known as the most convincing method of evaluation [25]. However, during the implementation of policies, it is occasionally not possible to randomly assign the groups among which the policy is implemented. This means that the treatment or intervention group (policy implemented group) and control group may not be assigned randomly. A quasi-experiment has all of the features of an experiment except random assignment [24]. For policy evaluation, the quasi-experimental design is often adapted to evaluate the impact of the treatment/intervention [24]. A non-experimental design is utilized when experimental or quasi-experimental designs cannot be easily applied. A typical non-experimental design method is statistical analysis. The type of information available to the researcher, the underlying model, and the parameter of interest are the factors that affect the appropriateness of non-experimental data [25]. In sum, experimental designs (i.e., quasi-experiment and true experiment) are a powerful method for measuring whether the treatment/intervention (policy) had an impact. On the other hand, regression modeling as a typical non-experimental design method serves as a tool to measure parameters, i.e., the degree of the treatment’s impact.

2.2.2. Tourism Policy Evaluation in Japan

This study reviews on the tourism policy evaluation in Japan as two aspects; empirical tourism studies and studies regarding tourism zone development.
Isikawa and Fukeshige analyzed the correlation between local government and the socioeconomic status of residents of Amami Oshima Island by applying a probit model (binary choice). Their study suggested that tourism policies and industrial development should be promoted, municipalities should undertake greater responsibility, and the tourism sector and each of the three administrative levels––municipalities, the prefectures, and the central government––should examine industrial policies [26]. They also investigated the impact of tourism and fiscal expenditure in Amami Island. They estimated the long-run fiscal and tourism multiplier with applying Schwartz’s Bayesian Information Criteria (SBIC), with survey of statements/taxation of accounts of cities, towns and villages, account books, and statistics bureau data [27].
Romão et al. conducted a multinomial logistic regression to determine tourists’ choice to visit the Shiretoko Peninsula [28]. Their analysis enabled them to figure out the visitors’ probability choice. However, a limitation of their research was that tourists’ choice with respect to all areas in Japan could not be obtained. Ohe and Kurihara evaluated the relationship between local brand farm products and rural tourism using an estimation model, which calculated the direct and indirect economic impact of rural tourism [29]. They resultantly indicated that a local partnership between agriculture and tourism is important and that wider, longstanding perspectives on the management of local resources are necessary [29]. Ohe also evaluated the household leisure behavior of rural tourism by applying a binominal logit model [30]. The rural preference function was estimated through this research, and it was significant in comparison to other previous research because it investigated all areas in Japan. However, it only examined rural tourism.
Previous studies have utilized both qualitative and quantitative approaches to investigating tourism zone development. Seki demonstrated that the public and private partnership in regional tourism management, especially with respect to tourism zone development, is the challenge facing the social and economic development of Japan [10]. The paper provided a background and idiographic explanation for tourism zone development. Patandianan and Shibusawa quantitatively evaluated the tourism demand in Shizuoka Prefecture and considered its spatial spillover effects [11]. They were able to estimate the economic spillover effects of tourist demand in each municipality. However, they only focused on Shizuoka Prefecture. Chi et al. quantitatively evaluated the impact of tourism nation promotion project using a difference-in-differences methodology; however, they were mainly focused on inbound tourist in Japan [31].
Japanese regional planning is mainly based on a bottom-up approach, known as Machizukuri (community planning) [32,33,34,35]. However, once the government identified tourism as being the driving force behind regional revitalization, the tourism zone development policy was promoted as a nation-wide project. Considering the importance of this policy, it is paramount to investigate it using a comprehensive nation-wide approach that quantitatively estimates its effectiveness by examining the subsidies provided, features of tourism zones, etc.

3. Research Framework

3.1. Theoretical Background and Methodology

Scientific experiments usually can usually divide their subjects into a control group (comparison group) and a treatment group through a randomized distribution. On the other hand, this method is not feasible for social science, particularly for policy evaluation, due to ethical and practical reasons. For example, policies cannot be applied to a randomized group. Thus, a quasi-experimental design is usually adopted for policy evaluation [23,24].
Table 1 shows certain basic types of quasi-experimental design. The pretest–posttest nonequivalent control group design is a popular approach to quasi-experiments [23]. In it, both groups (group A and group B) take a pretest and a posttest, but only the intervention (experimental) group receives the treatment. On the other hand, in the single-group interrupted time-series design, the researcher measures the results only for a single group both before and after treatment. A control group interrupted time-series design is a modification of the single-group interrupted time-series design. In this study, the pretest–posttest nonequivalent control group design was chosen as the methodology for conducting a summative evaluation of tourism zones.
Estimating impact is important because of the need to know whether policy interventions actually have the desired beneficial effects [24]. As seen in Section 2.1.1 (Policy Evaluation Method), to figure out the actual impact of a policy, the measurement should be based on whether the policy was implemented or not. For example, to observe the impact of tourism zone development, all variables other than the tourism zone development policy should be controlled. Considering merely simple statistics, a problem is observed for which the main confounders cannot be controlled. For example, even if the number of visitors increased drastically in a certain area, it is challenging to explain whether the increased number of visitors was a result of the policy implementation or other external effects.
To estimate the effectiveness of the tourism zone development policy, control group cities/towns (before the policy implementation) that were similar to the tourism zones in terms of their population, economic situation, nature, industry, etc., were selected in order to observe their conditions before and after the policy implementation. If it is possible to control other factors except policy implementation, the results of a comparative analysis between the tourism zone area (treatment/intervention group) and control group area can be regarded as the impact of the policy (treatment/intervention effect) (see Figure 4).

3.2. Data

  • National urban traffic characteristic survey (person trip data)
To observe the before and after changes upon the implementation of this policy, information regarding travelers’ trips is necessary. This data should include trip records that cover all departure and arrival information of travelers from all areas within Japan. In addition, for more up-to-date information pertaining to the period after the policy, the data should be checked periodically to update the travel related information.
The national urban traffic characteristic survey (herein, person trip data) [36] was first conducted in 1987. It has since been continually conducted every 5 years. Person trip data is comprised of a variety of information, including occupation, age, gender, trip mode, trip purpose, time travelled, etc. Most of all, it is an excellent resource that enables the identification of trips that were solely for the purposes of tourism. In addition, the detailed individual characteristics that it offers can be used to determine the visitors’ attributes.
  • Regional data
Since the smallest unit area of tourism zone is the municipality, the regional data to be used for the factor analysis and regression model should also pertain to the municipal level. In order to set control groups, detailed regional data regarding the pretest year (in this study: 2005) that represents each city/town’s characteristics, such as population, economic situation, etc., are required. To conduct the regression model, since the purpose of the estimation is to identify significant differences in conditions before and after the policy implication, regional data for the pretest and posttest years are required (in this study: 2005 and 2010, respectively).
Municipal level data related to population and households, natural environment, economic base, administrative base, labor, culture and sports, etc., can be obtained from the Portal Site of Official Statistics of Japan [37]. However, some data could not be obtained due to the change of the data collection method. For example, economic base data were collected as Commercial Statistics in 2004; however, the data were collected as Economic Census in 2011 due to the revision of the Statistics Act.

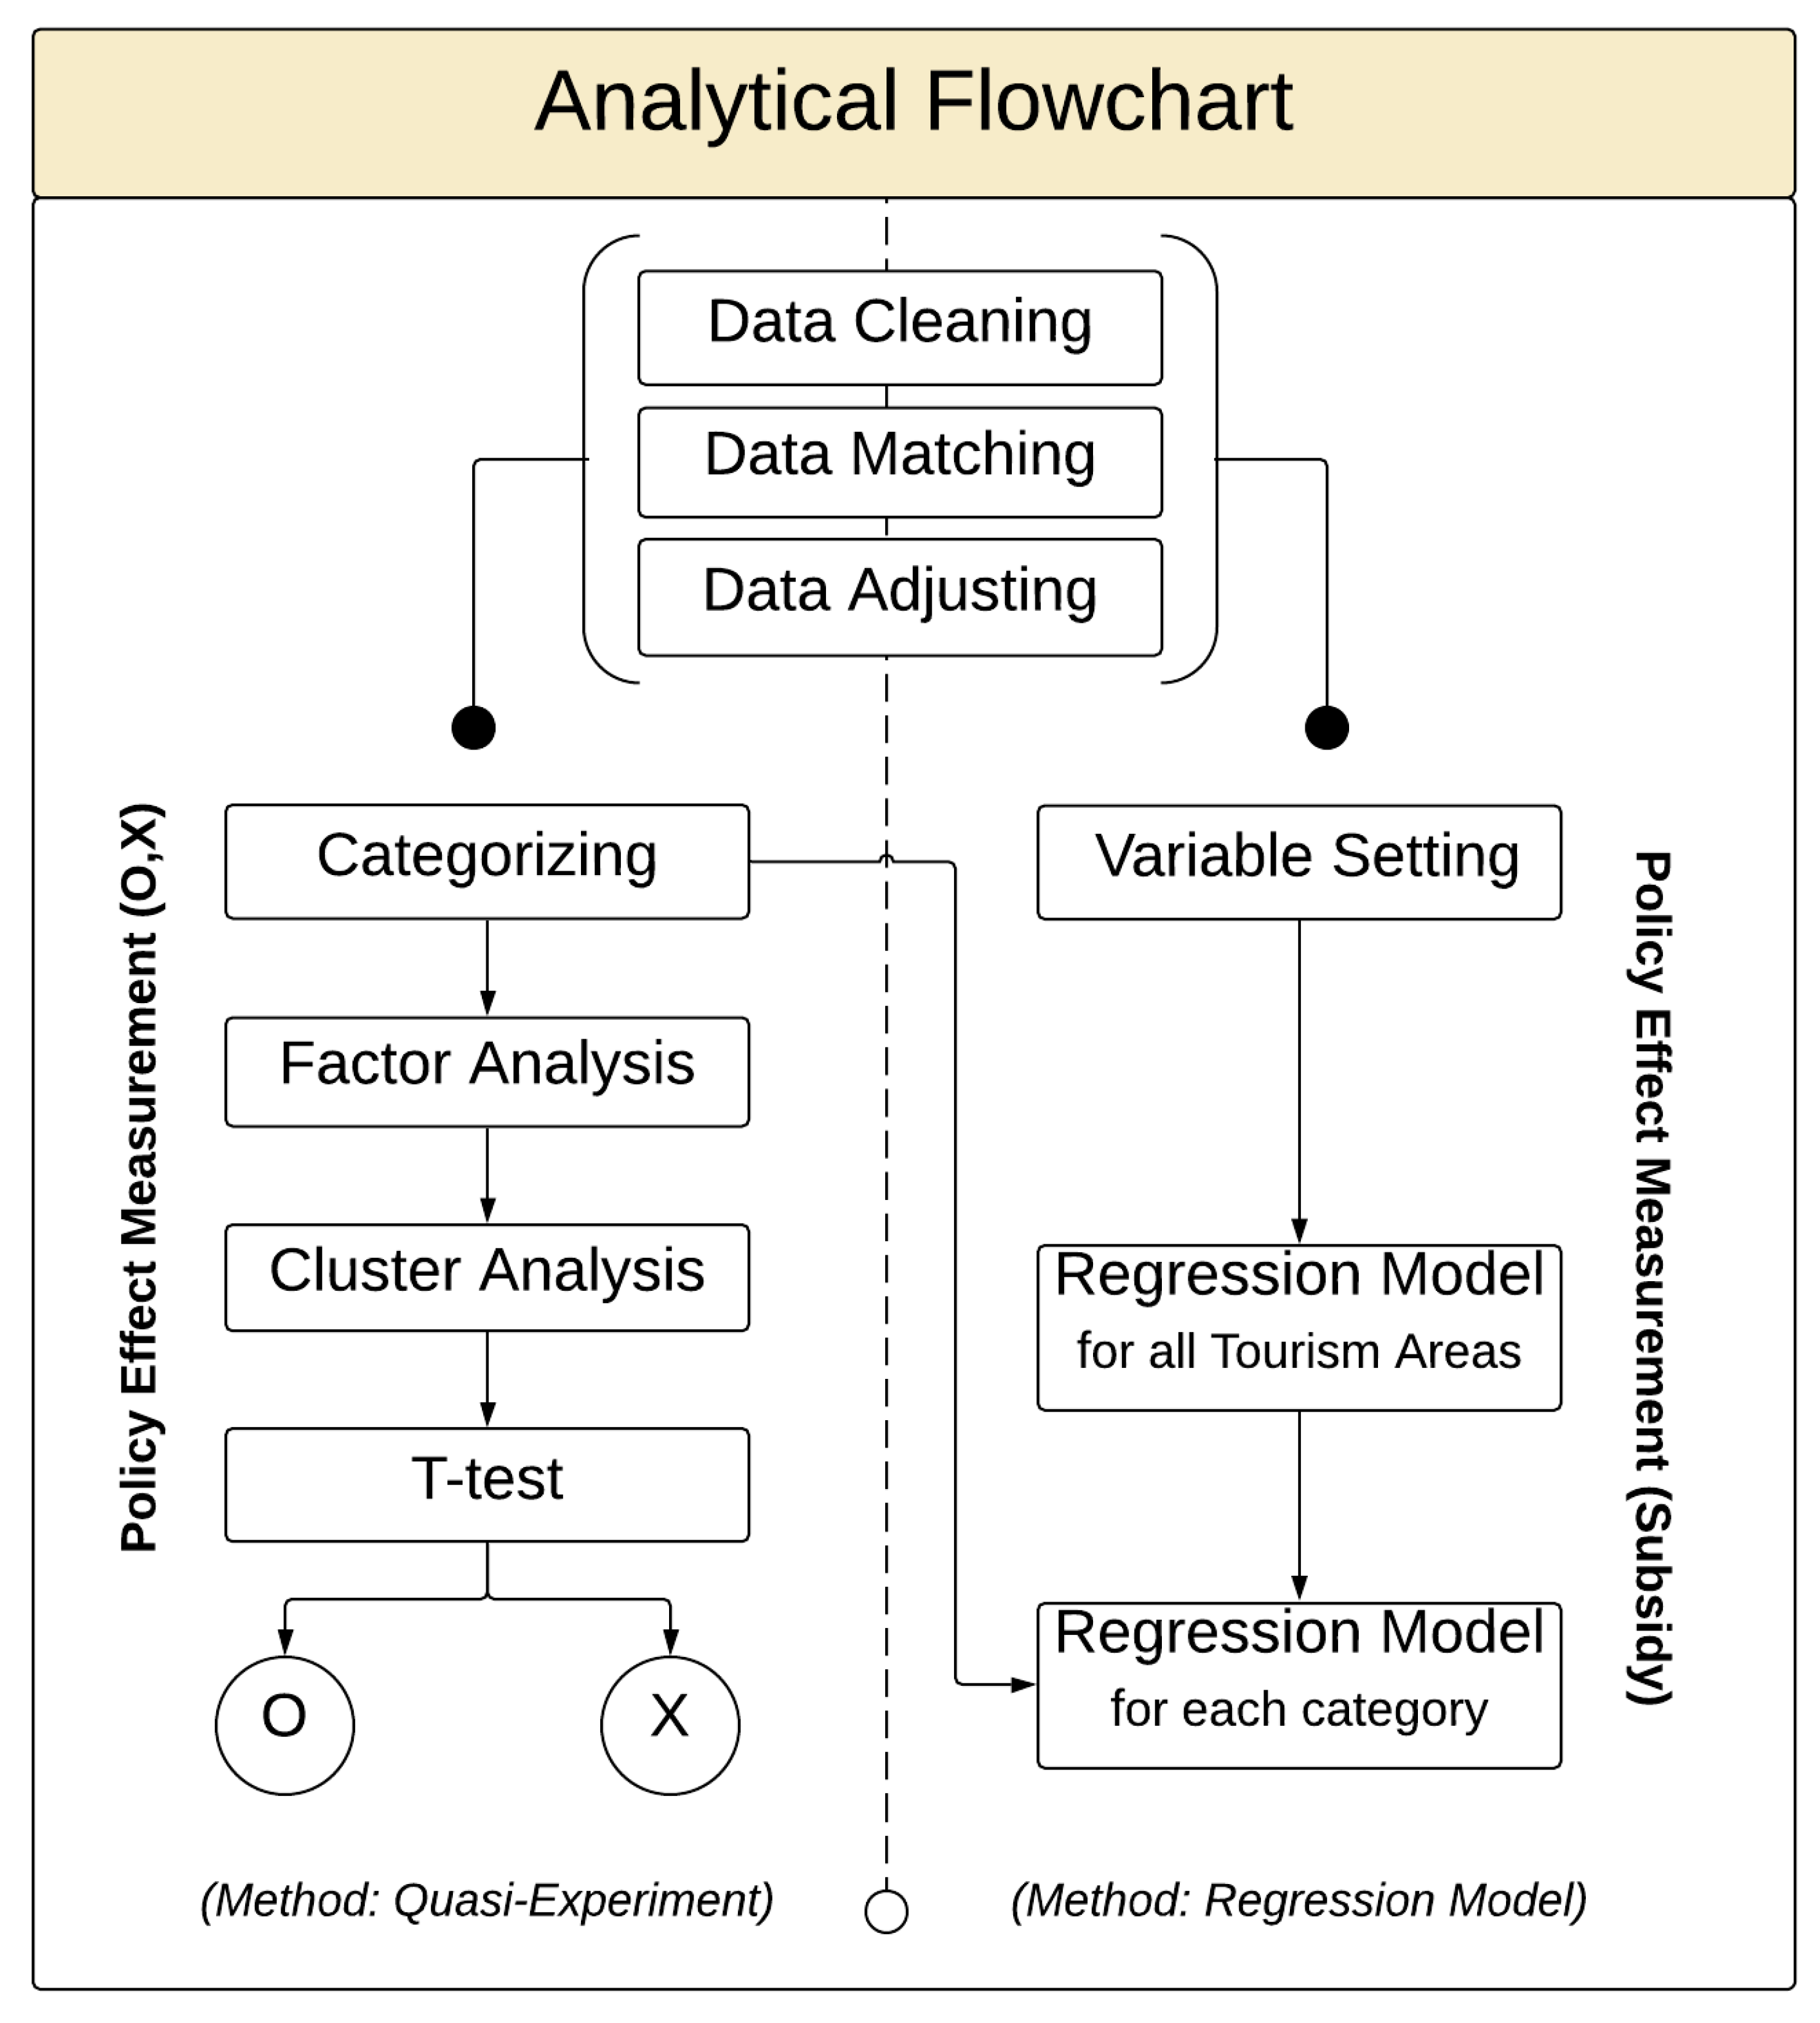
3.3. Research Procedures

Since the goal of the policy was to increase the number of tourists, it is necessary to ascertain whether each tourism zone received more tourists after the implementation of the policy. Furthermore, the effectiveness of subsidies offered within each tourism zone area should be calculated. Based on the background and the purpose of this study, the research questions to be addressed are sequentially presented as follows: (1) Did the tourism zone development policy have any impact? (2) Based on the configuration type of each tourism zone, how distinctively did the impact vary? Accordingly, the measurement of the impact will be divided into two parts. First, by applying the pretest–posttest control group design, an analysis will be carried out in order to ascertain whether the policy implementation had an impact. Second, the effect of each subsidy can be measured through regression modeling. Based on the configuration of each tourism zone, the tourism zones will be categorized. Then, based on each category, the quasi-experiment and regression model will be utilized to observe the different results across each category. Figure 5 shows the analytical flowchart of the study.
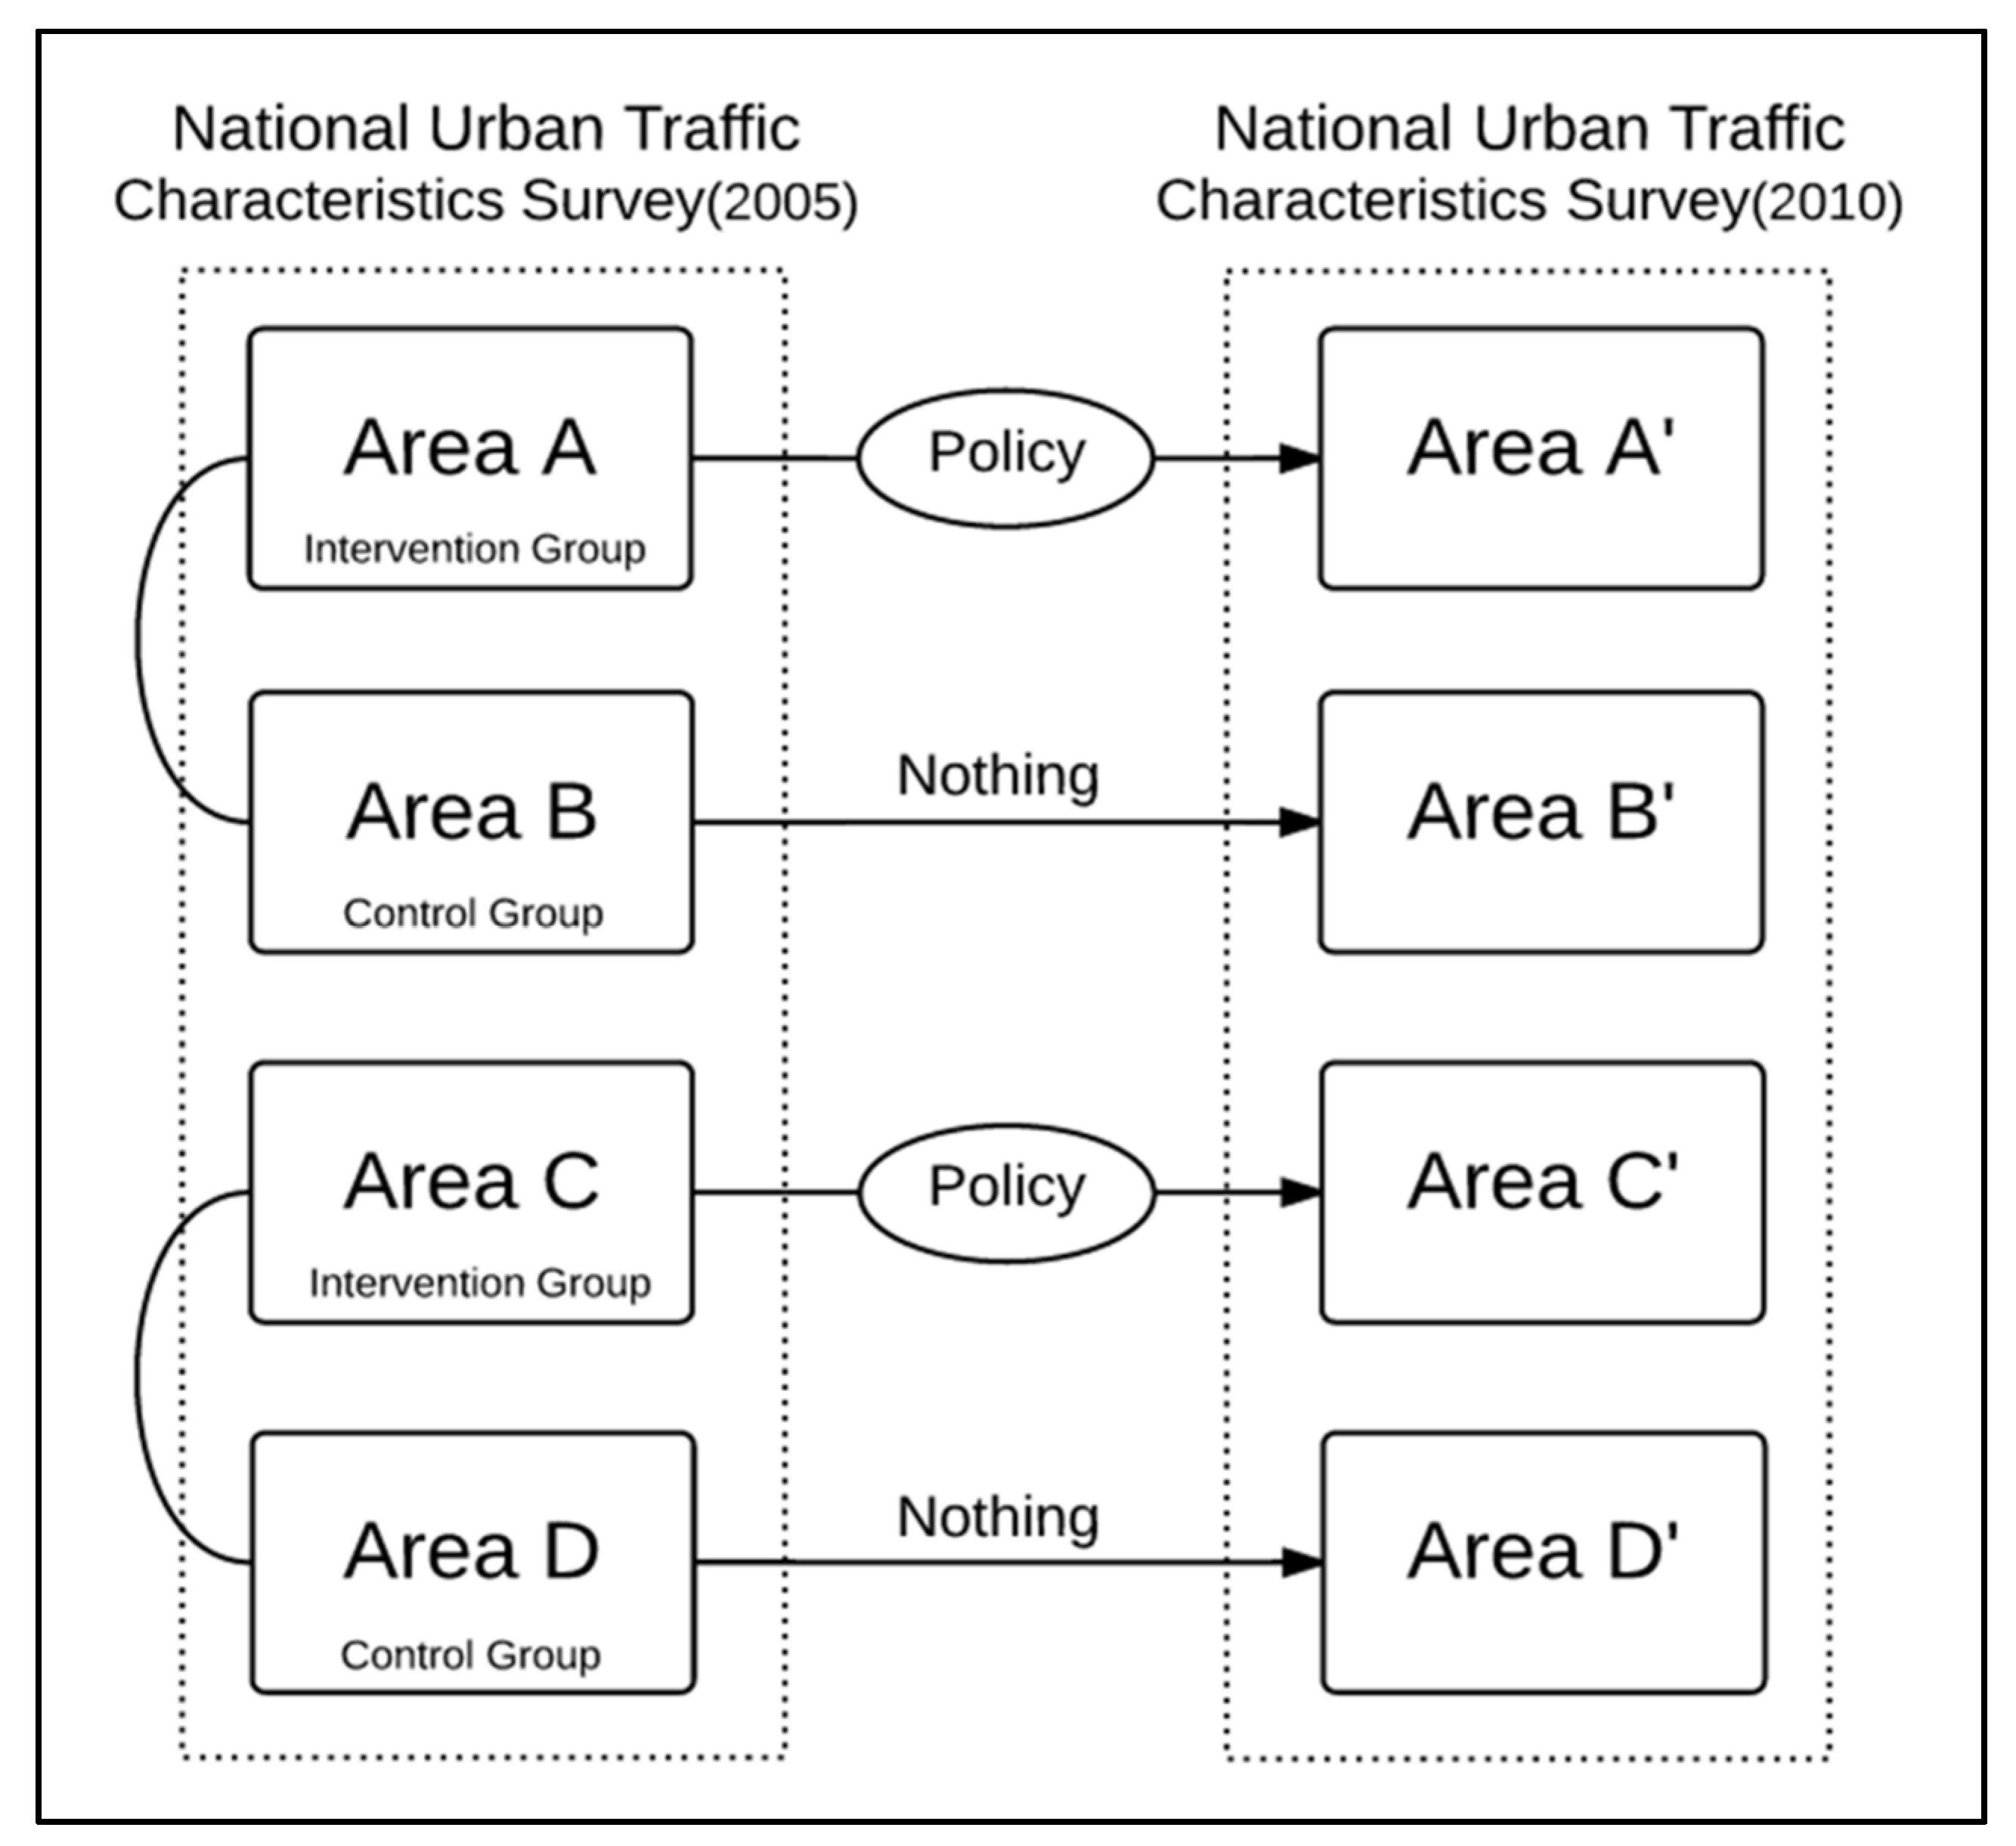
  • Did the development of tourism zones have an impact? (Method: quasi-experiment)
The measurement of the policy’s impact will be divided into two parts. First, by applying the pretest–posttest control group design, an analysis will be carried out in order to ascertain whether the policy implementation had an impact. To conduct this quasi-experiment, a representative control group needs to be assigned for the test [23,24]. The cities/towns that have similar social, economic, and physical characteristics to the tourism zone regions prior to the policy implementation are assigned as the control group. A quasi-experiment analysis can be divided in to four phases: (1) categorizing tourism zone, (2) factor analysis, (3) cluster analysis, and (4) t-test. Since the features of the areas that comprise a tourism zone may vary, these zones are categorized based on their characteristics. To assign control group, a factor analysis is conducted to extract the main characteristics of each area: population, economic situations, physical information, etc. Using these main characteristics, a cluster analysis is conducted to identify the control group city/town. Lastly, whether policy implementation resulted in significant differences between the tourism zone and control group can be assessed through a t-test.
  • How will the effects vary across tourism zones? (Method: regression modeling)
The tourism zones vary in terms of size, administrative division, and regional characteristics. Some tourism zones consist of two municipalities (e.g., Lake Hamana Tourism Zone and Holy Place Kumano Healing and Reconstruction Tourism Zone), whereas other tourism zones are composed of twenty-five municipalities (e.g., Sanin Culture Tourism Zone). In addition, there are some zones that consist of two or more prefectures, while some tourism zone areas are within the same prefecture. Some tourism zones also contain nearby islands. The impact of the policy will differ based on each tourism zone’s features. Using regression modeling and the subsidy expenditure information, the policy’s impact on each tourism zone is calculated. An empirical estimation of the relationship between tourism demand and its explanatory variables across all areas and categories is conducted.

4. Results

4.1. Data Processing

  • Data cleaning
To examine the national traffic situation, the national urban traffic characteristics survey (person trip data) investigated 70 cities and 60 towns and villages that consist of 500 households and received responses from about 38,000 households. The survey obtained 52,005 and 33,542 responses in 2010 and 2005, respectively. This data is composed of three categories: household characteristics, individual characteristics, and traffic characteristics. Therefore, this study builds a dataset that consists of these characteristics based on the tourist destination. Tourism-related trips were identified from amongst 17 different trip purposes. After eliminating the outliers, 18,347 samples remained for 2010 and 10,540 samples remained for 2005.
  • Data matching
Each region was described as their regional code. This regional code consists of five letters. The first two letters denote the prefecture, and the remaining three letters denote the city/town. For example, “01229” represents Hokkaido Furano-shi (“01” stands for Hokkaido prefecture and “229” indicates Furano-shi). Since the dataset was gathered from the data based on the tourist destination, the regional data (independent variable) and person trip data (dependent variable) should correspond to the same standard. Therefore, the data-matching process was conducted for the 2010 and the 2005 data based on these five-letter codes.
  • Data adjusting
While matching the data, some areas were combined or experienced a change in their code number. This was due to “the great Heisei mergers.” The mergers were performed in order to strengthen local governments by allotting them certain regulatory functions from the central government. The largest mergers were done in 2005 [38,39,40]. Therefore, it was necessary to adjust person trip data as well as regional data based on the new codes.

4.2. Policy Impact Measurement: Quasi-Experiment

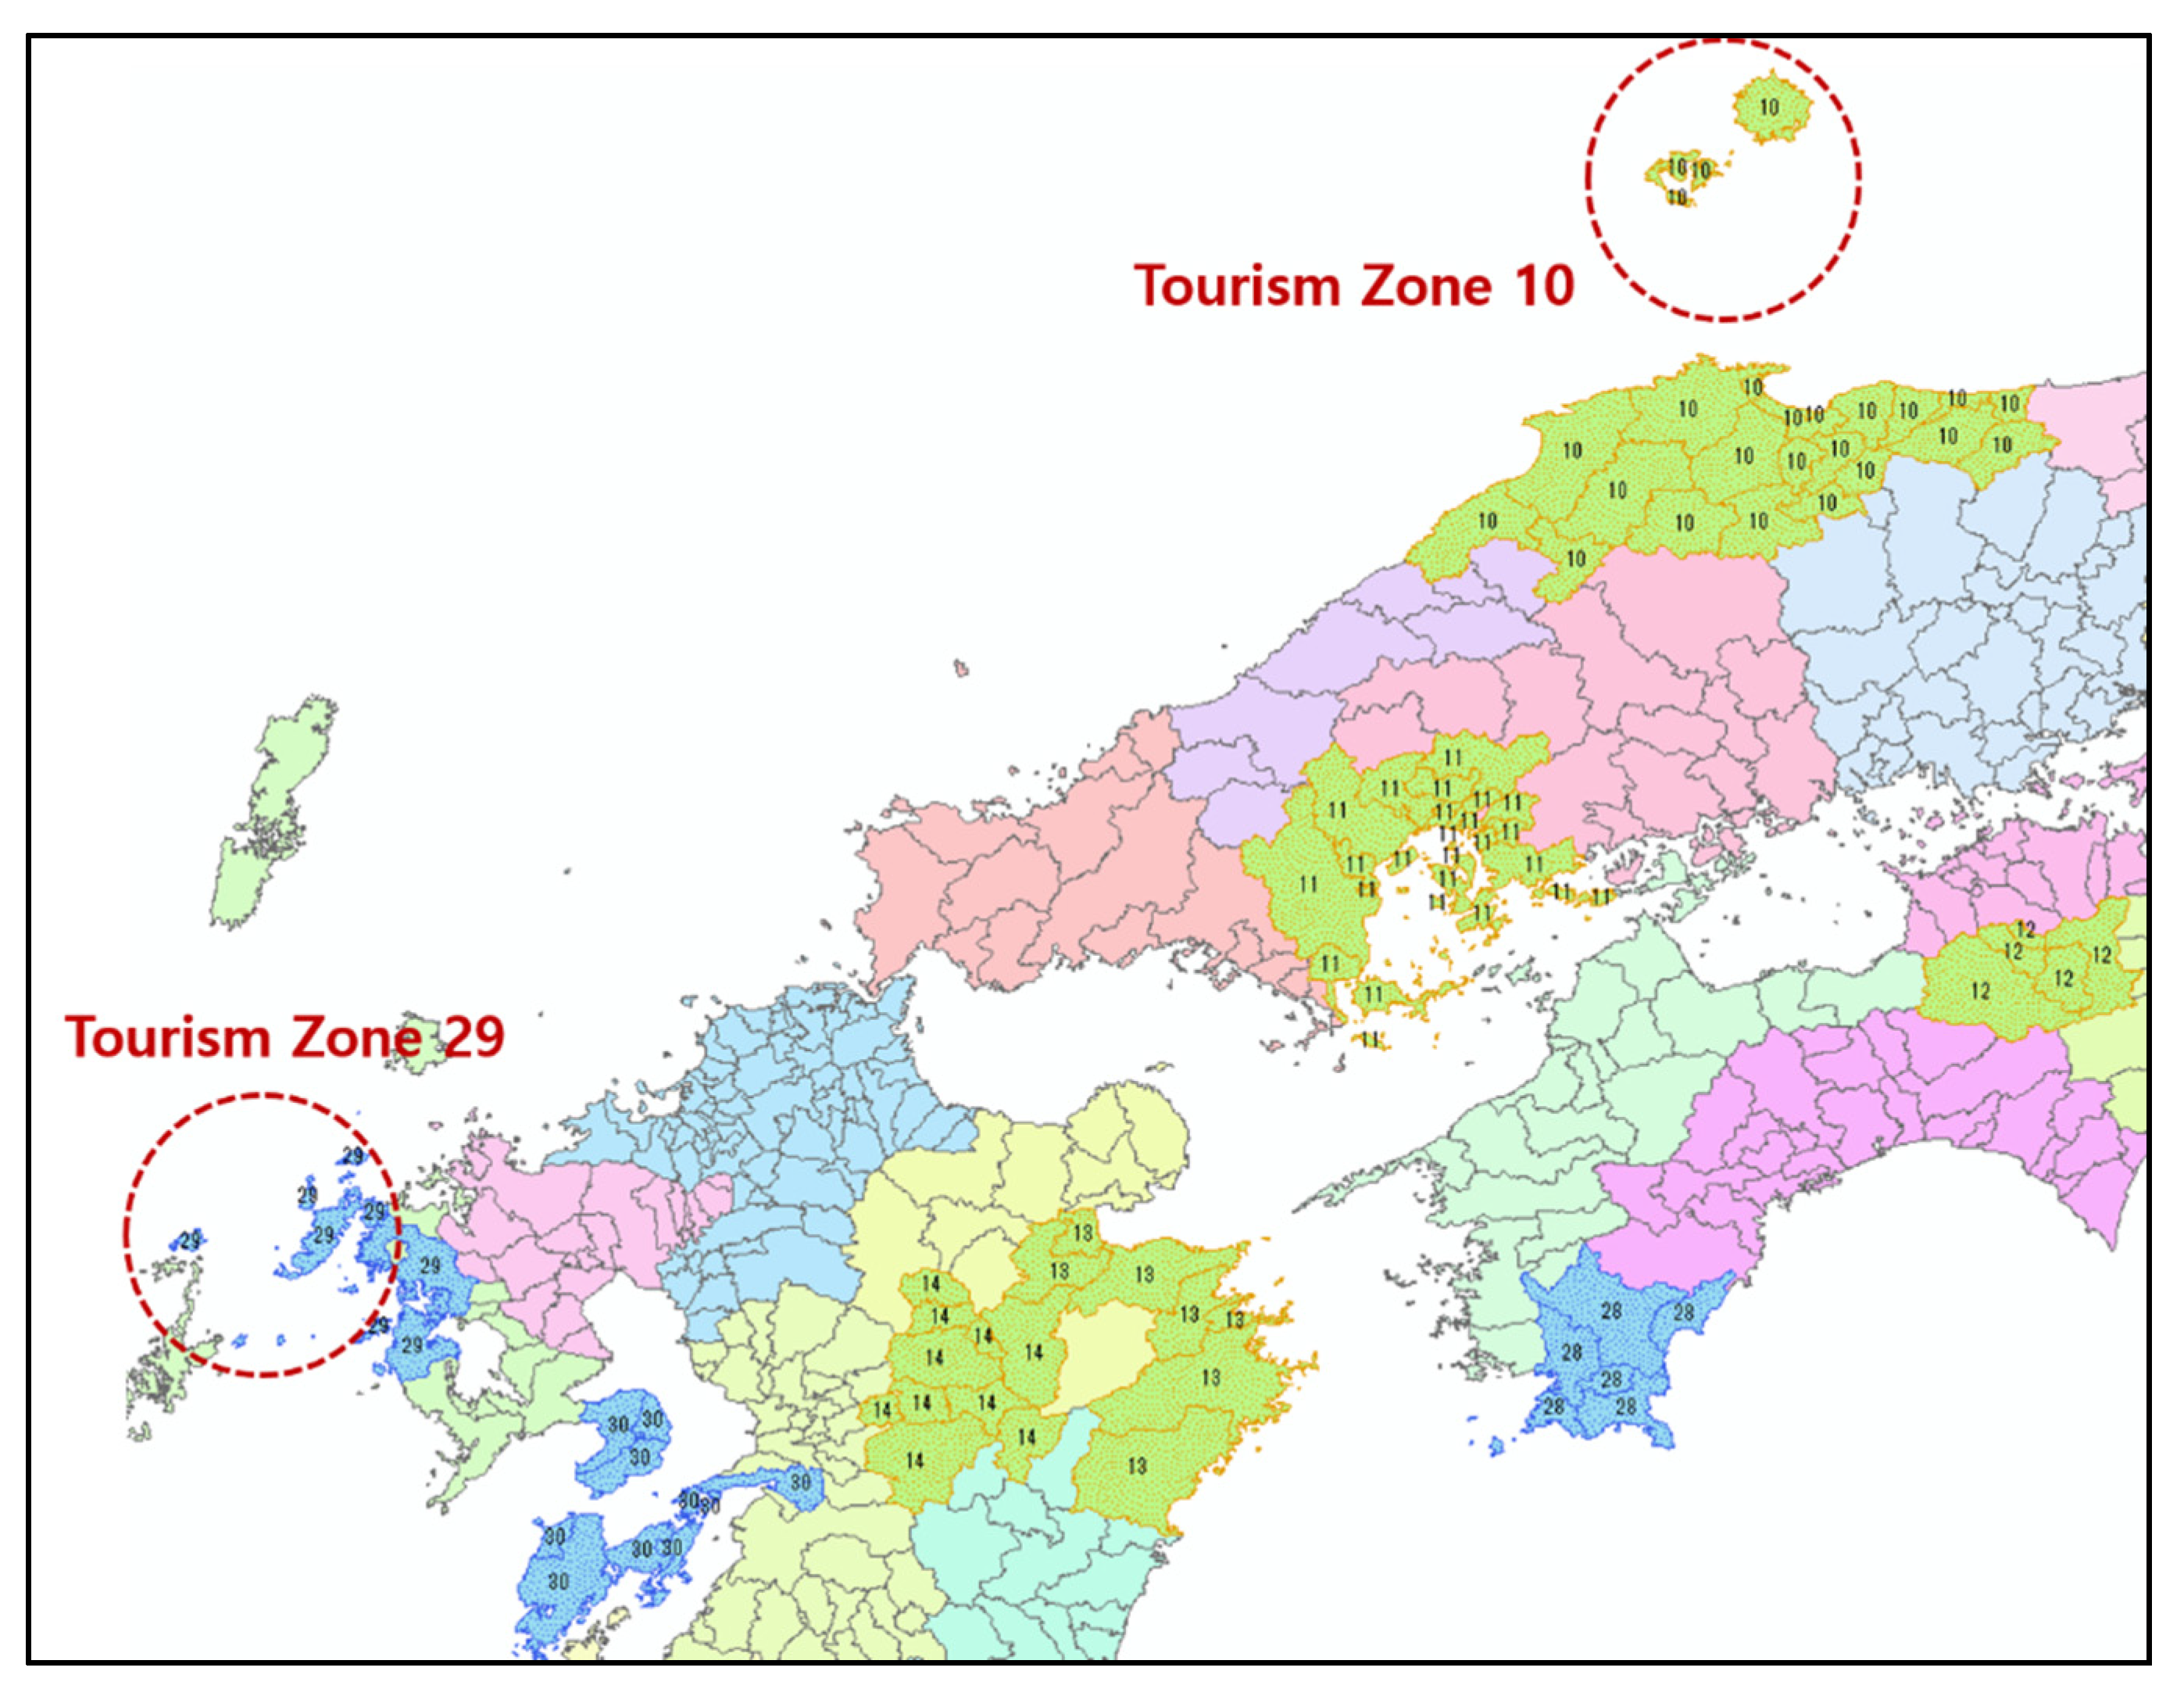
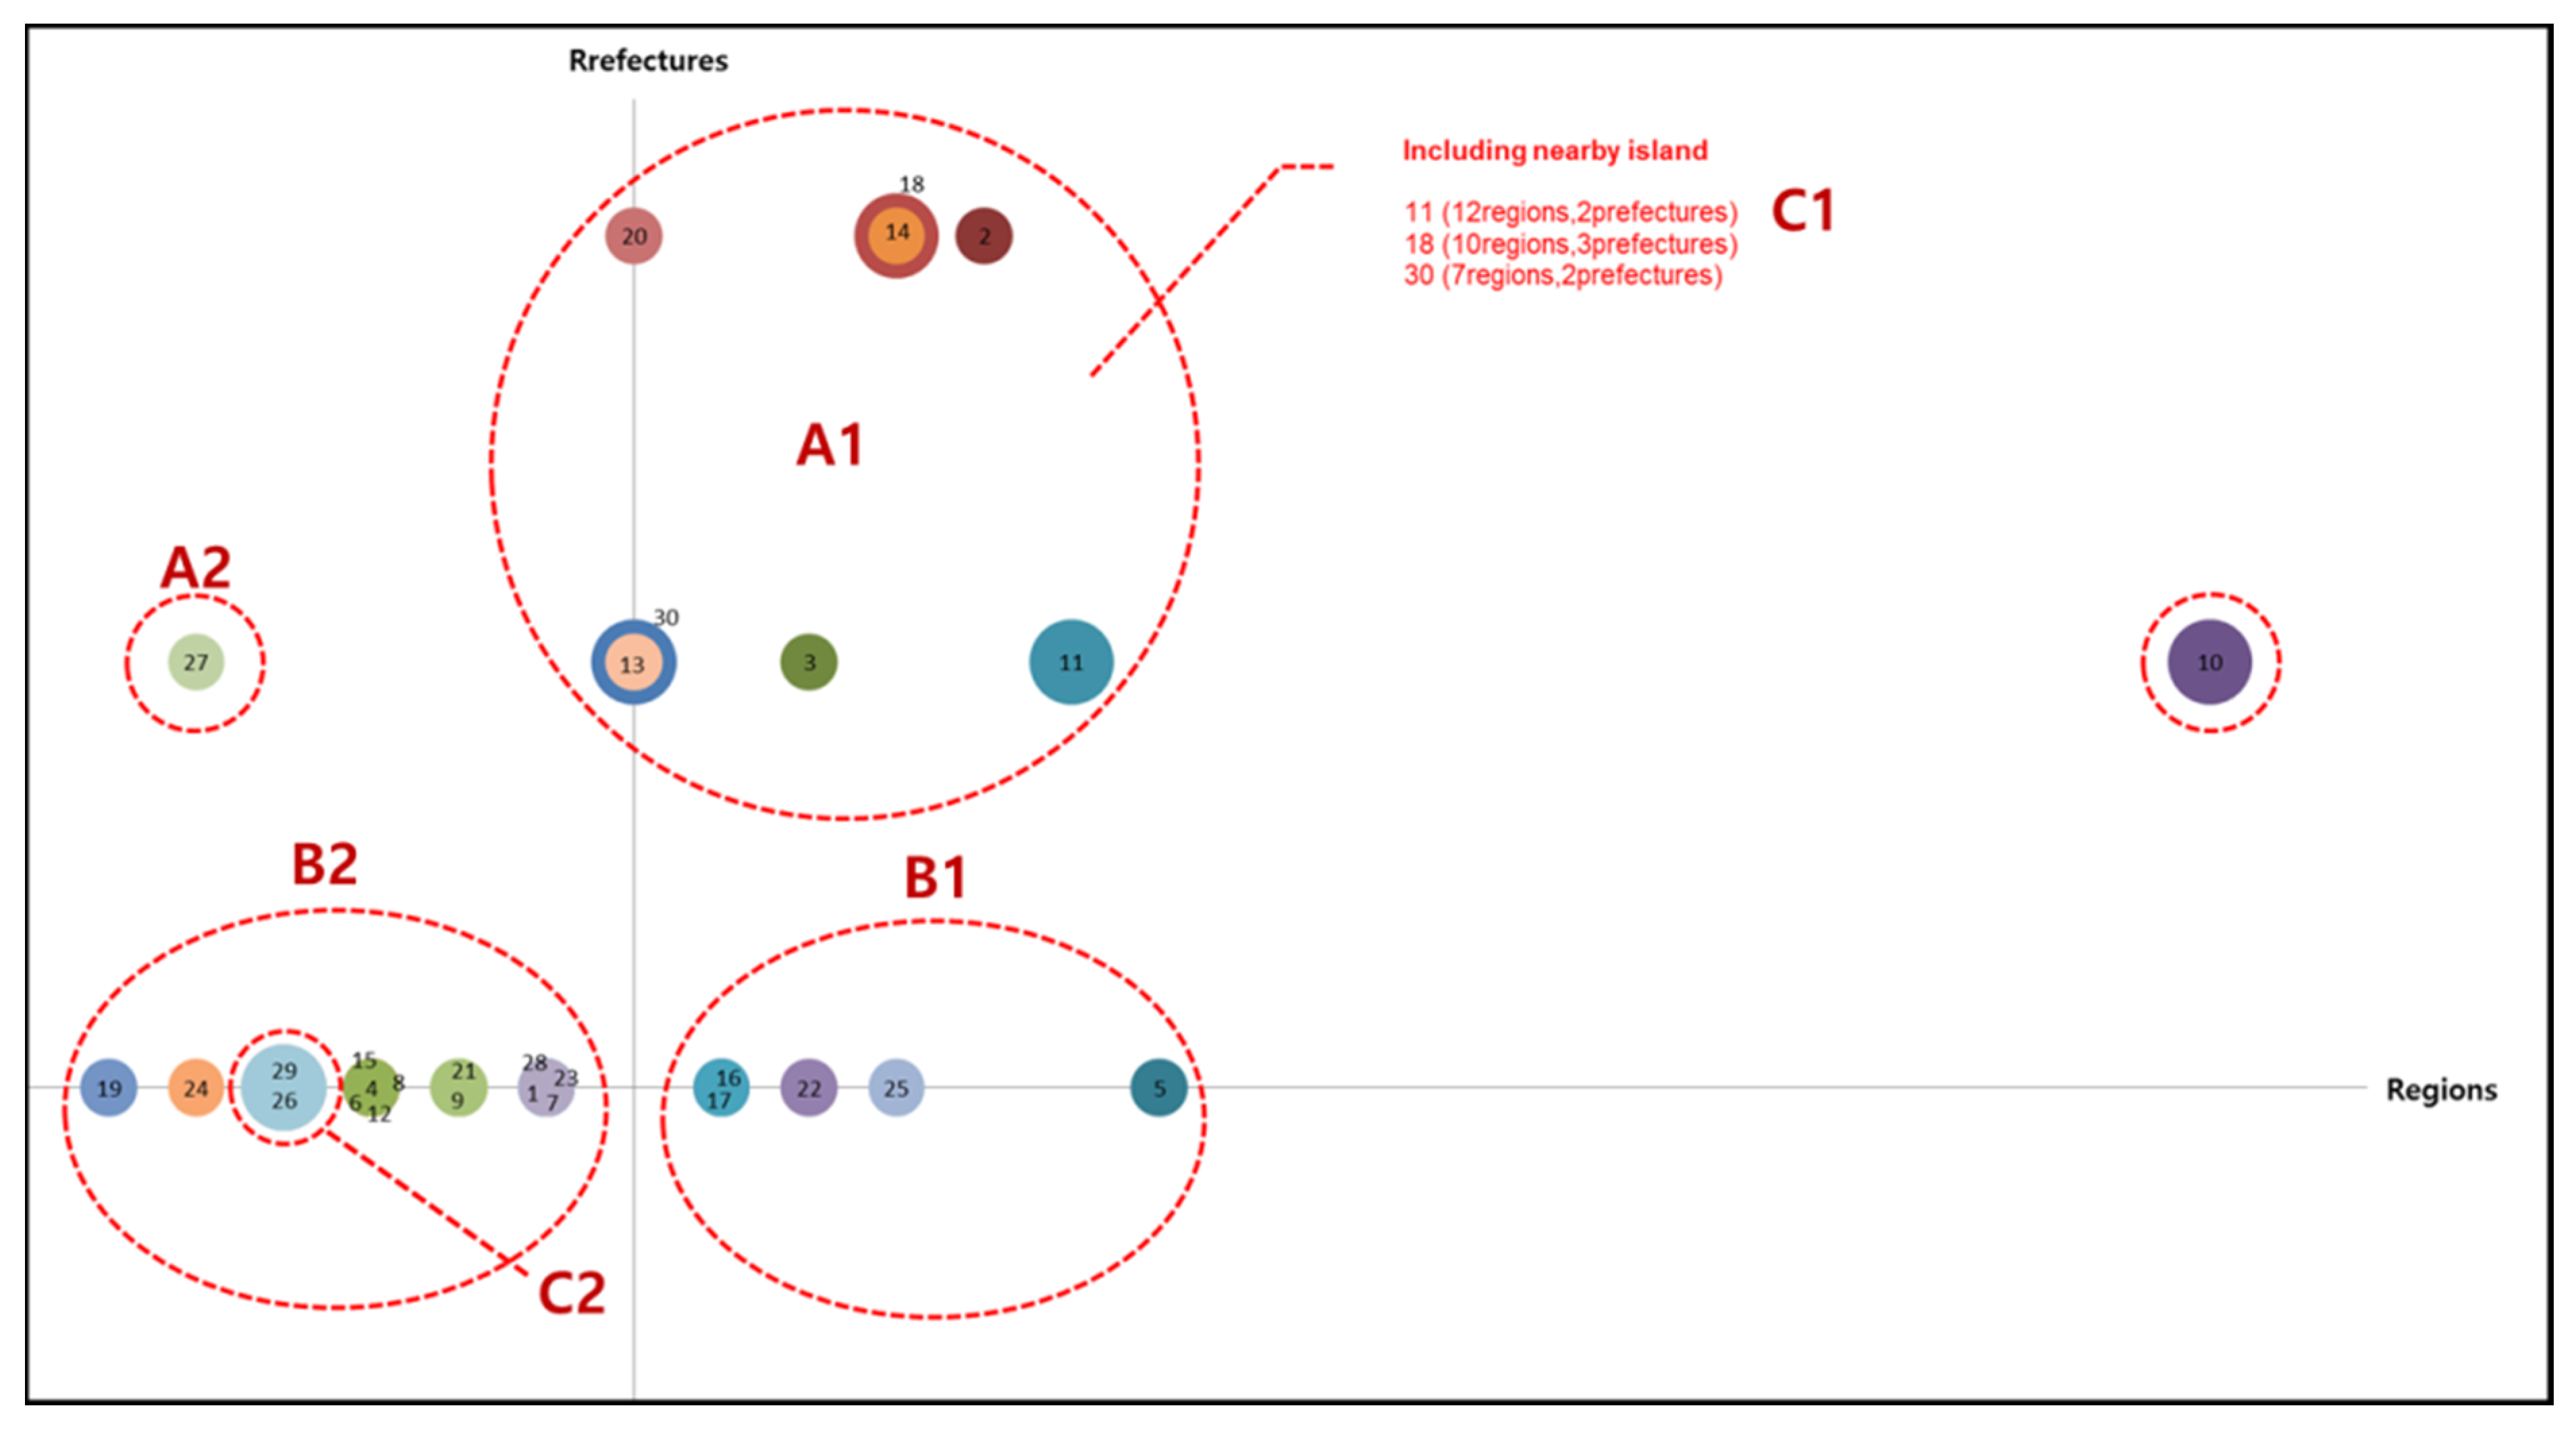
4.2.1. Categorizing Tourism Zones

Before the tourism zones were grouped, numbers were assigned to represent the 30 tourism zones in order to facilitate the analysis. The characteristics of each zone are listed in Table 2.
The tourism zones are significantly varied in terms of size. Tourism zone 1 (Furano Biei Wide Tourism Zone) consists of six municipalities in the same prefecture and no nearby island. Tourism Zone 29 and Tourism Zone 10 contain a nearby island (see Figure 6), which signifies that each of their territories contains a small island that is not one of the four main Japanese islands (Hokkaido, Honshu, Shikoku, and Kyushu).
Perceptual maps are usually utilized in business management as a tool for grouping targets, but they have been positively adopted in tourism studies as well [41]. In this study, using the different characteristics shown in Table 2, groups for the tourism zones were constructed (see Figure 7 and Table 3).
Each tourism zone is placed in category A, B, or C depending on whether it consists of two or more prefectures (category A), is within a single prefecture (category B), or includes a nearby island (category C). Additionally, the tourism zones are further differentiated based on whether they cover a wide region (category 1) or a narrow region (category 2). For example, category A1 consists of tourism zones that contain two or more prefectures and cover a wide region (seven or more municipalities). Tourism zone 2 (Elegant Wide Tourism Zone) would fall within category A1, as it is comprised of three different prefectures and covers 11 municipalities.

4.2.2. Exploratory Factor Analysis

Ahead of conducting the cluster analysis, problems such as the correlation of some variables with each other should be considered. For example, total population and labor force of a region have some correlation each other. To resolve such problems, an exploratory factor analysis is conducted in this study to reduce the numbers of the variables and construct a model that exclusively consists of major factors.
Factor analysis seeks to analyze the correlation among the variables so that underlying factors in mutual actions can be extracted to reduce the numbers of some variables that represent all the data. Therefore, by implementing a factor analysis, data comprised of different forms of variables can be narrowed down to the main inherent factors, which makes the comprehension and analysis of data more convenient. In other words, factor analysis solves any problems of information flood, so data characteristics are easily analyzable. Exploratory factor analysis is generally applied to factor analysis [42]. In this study, an exploratory factor analysis will be used to extract meaningful data. The variables from regional data used for exploratory factor analysis are from 2005–the pretest year.
The Kaiser–Meyer–Olkin Measure of Sampling Adequacy (herein, KMO) is utilized to assess if this data is suitable for conducting factor analysis. Additionally, Bartlett’s Test is employed to check if the variables are sufficiently correlated. Principle component analysis was used as the extraction method because it diminishes the loss of information is less. The extractions were all over 0.4 (min value: 0.590, max value: 0.991). The Varimax rotation method was used.
As shown in Table 4, all results indicate that the data is suitable for factor analysis. The KMO was 0.094, and Bartlett’s test was significant in the level of significance 0.000. A cumulative percentage that is 84.251 of total variance explained implies that can 84% of the information can be obtained using five components (see Table 5).
Through the factor analysis, 29 variables were organized into five components: population and labor force, primary industry, economic welfare, secondary industry, and unemployment rate. Table 6 shows each variable and derived components expressed with same color. A cluster analysis is then conducted using these components (Section 4.2.3).

4.2.3. Cluster Analysis

A cluster analysis was conducted to identify the control city/town for each tourism zone. Using the five components obtained from the factor analysis, a cluster analysis was carried out with the help of SPSS software. Ward’s linkage that applied the Euclidean distance and Z standardization was used as the cluster method. Ward’s linkage and Euclidean distance are commonly used for clustering analysis, and since the unit of each component is different, the Z standardization was chosen for the analysis. These pairs will be used in the t-test to observe the difference between the control group and the tourism zone.

4.2.4. t-Test: Tourism Zone vs. Control Group

This is the final phase of pretest-posttest control group quasi-experimental design. The paired t-test was conducted to observe the significant differences between the tourism zones and control group cities/towns across each category with the trip change from 2010 to 2005 (purpose: tour) of person trip data. The results revealed there was no case in which the trip change of a tourism zone decreased significantly. There were eight zones in which the trip change increased significantly and eight zones in which the increase was not significant.
The paired t-test indicated that Tourism Zone 8 (Ise Shima Region Tourism Zone), Tourism Zone 19 (Nikko Tourism Zone), and the corresponding control groups displayed a significant difference (p < 0.01), and the number of visitors increased in the regions where the policy was implemented (tourism zone). Tourism Zone 1 (Furano Biei Wide Tourism Zone), Tourism Zone 12 (Nishi Awa Tourism Zone), Tourism Zone 15 (Shiretoko Tourism Zone), and their control groups also displayed a significant difference (p < 0.05), and the number of visitors increased in the regions where the policy was implemented. Tourism Zone 3 (Aizu and Yonezawa Region Tourism Zone), Tourism Zone 4 (Tenderness and Natural Warmth Fukusima Tourism Zone), and the corresponding control groups displayed a significant difference (p < 0.1), and the number of visitors increased in the regions where the policy was implemented (See Table 7).
The number of visitors to Tourism Zone 5 (Mito Hitachi Tourism Zone; Your Sky and Earth), Tourism Zone 6 (Southern Boso Region Tourism Zone), Tourism Zone 20 (Snow Country Tourism Zone), Tourism Zone 23 (Fukui Sakai Wide Tourism Zone), Tourism Zone 24 (Lake Hamana Tourism Zone), Tourism Zone 27 (Holy Place Kumano Healing and Reconstruction Tourism Zone), Tourism Zone 28 (Shimanto and Ashizuri Area Tourism Zone), and Tourism Zone 30 (Unzen Amakusa Tourism Zone) increased in comparison to that of their control groups. However, they did not display a significant difference (See Table 8).
The visitors to Tourism Zone 11 (Hiroshima, Miyajima, and Iwakuni Region Tourism Zone), Tourism Zone 13 (New East Kyushu Tourism Zone), Tourism Zone 18 (Kira Kira Uetsu Tourism Zone), Tourism Zone 21 (Toyama Bay, Kurobe Canyon, Etchu Niikawa Tourism Zone), Tourism Zone 26 (Awaji Island Tourism Zone), and Tourism Zone 29 (Hirato, Sasebo, Saikai Long Stay Tourism Zone), with no significance, the visitors decreased in comparision to that of their control groups (see Table 9).
Except for Tourism Zone 3, the areas where the trip changes increased significantly were the tourism zones in category B2, which are those that cover a narrow region within the same prefecture. This result echoes those of existing policy impact studies, which indicate that the impact of policy is large in regions where significant subsidies are provided [43].

4.3. Policy Impact Measurement: Regression Modeling

4.3.1. Variable Setting

The tourism demand is generally measured based on the number of visiting tourists or tourist expenditure [44]. In this study, tourism demand (dependent variable) is measured by the increase in the number of visiting tourists (∆ trip 2010–2005).
There are three types of projects that received subsidies from the government. Using regression modeling, whether a project was successful or not can be ascertained (see Table 10).
The explanatory variables are vitality, commerce, attractions, transportation, and policy. Except for the variables related to the tourism zone development policy, the variables are the difference in the values from 2010 and 2005 (see Table 11).

4.3.2. Regression Model for All Tourism Zones

This is the empirical result of a regression model for all tourism zones. Project 1 had an adverse impact on the arrival change for tourism. On the other hand, Project 2 and Project 3 had no impact overall (see Table 12).

4.3.3. Regression Model for Most vs. Least Effective Case

Regression models were conducted to identify the most effective case and least effective case across all categories (see Table 13 and Table 14). The most effective case would be the case where the subsidy had a positive impact at the most significant level across all the possible models. The least effective case would be the case where the subsidy had a negative impact at the most significant level across all possible models.
The selection criteria of finding these model is from each category, where the subsidy is significantly positive or negative. The explanatory variables were selected equally in both the most effective and least effective cases. The beta sign for the size of commerce and manufacturing expenditure and the number of public parks was almost the same in both the most effective and least effective cases. The subsidy effect was different in the most effective and least effective case. The subsidy for Project 1 (improving stay program, marketing, development of human resource/awareness enlightenment) had a positive impact in the most effective case, but it had a negative impact in the least effective case. The subsidies for Project 2 and Project 3 had a positive impact in the most effective case but demonstrated no significant impact in the least effective case.
The tourism zones where the policy was most effective were mostly in category B (zones within a single prefecture), whereas the tourism zones where the policy was the least effective were mostly in category C (zones that include a nearby island).

4.3.4. Regression Model for Each Category

Regression models for each category were conducted in order to observe the differences between each category. For the zones within category A (zones that consist of two or more prefectures), Project 1 had an adverse impact on the arrival change for tourism. On the other hand, Project 2 and Project 3 had no impact overall. For the zones within category B, Project 2 had a positive impact on the arrival change for tour. On the other hand, Project 1 and Project 3 had no impact overall. For the zones within category C, all projects had no impact overall (see Table 15, Table 16 and Table 17).
This result was similar to the quasi-experiment result. Overall, the policy resulted in an increase in the number of tourists visiting the zones in category B. The data analysis suggests that the policy impact was large on the zones that consist of regions within the same prefecture.

4.3.5. Synthesis of Regression Models

Table 18 shows the synthesis of the regression results. From this table, it can be observed that only the subsidy effect of Project 1 had a negative impact (all areas, category A, least effective case), while Project 2 had a positive impact. It is inferred that the characteristics of Project 1 are based on the software program (improving stay program, marketing, development of human resource/awareness enlightenment), whereas those of Project 2 are based on the hardware program (information transmission, measures for the secondary traffic, space formation). The effectiveness of software programs is generally demonstrated over the long-term, which is why Project 1 appeared to presently have a negative impact. The development of human resources especially needs sufficient time for a genuine impact to be observed.

4.4. Comprehensive Results

In order to measure the impact of the tourism zone development policy, a comprehensive measurement was conducted through a quasi-experiment and regression modeling. The zones where the number of visitors increased as a result of the policy intervention were those that were located within a single prefecture. In addition, the subsidy effect was positive in the tourism zones that consisted of areas within the same prefecture covering a narrow range (less than seven municipalities).
Table 19 lists the tourism zones where the number of visitors increased as a result of the policy intervention (result from quasi-experiment) and had positive subsidy effects (result from regression model of most effective case). Except for Tourism Zone 3, these areas all fell within category B2 (in the same prefecture, narrow range). Tourism zone 3 is in category A1, but this zone is actually positioned next to Tourism Zone 4, which is in category B2 (see Figure 8).
The constituent areas of the tourism zones that experienced a positive policy impact and subsidy effects are originally famous tourist spots (e.g., Furano Biei, Mt. Fuji), whereas those that experienced negative subsidy effects are not relatively famous tourist areas. Tourism Zone 18 (Kira Kira Uetsu Tourism Zone) consists of agricultural rural areas. One of the purposes of tourism zone development is the balancing of regional disparities, so these areas experienced negative subsidy effects. In addition, the least effective cases were the tourism zones that consisted of a significant number of municipalities, especially Tourism Zone 10 (Sanin Cultural Tourism Zone).

5. Discussion

This study proposed two research problems related to the evaluation of the tourism zone development policy. Based on these verifications, it analyzed the effectiveness of tourism zone development. The primary content and results of this research are as follows.
First, empirical analyses were carried out, with the targets being tourism zones nation-wide. By utilizing person trip data and regional data, a quasi-experiment was conducted to ascertain whether the policy implementation had an impact, and regression modeling was utilized to observe how effectively the policy worked. The results revealed that overall, the tourism zones that cover a narrow region within the same prefecture experienced a positive impact. Among the three types of subsidies, the subsidy of Project 2 (information transmission, measures for the secondary traffic, space formation) had an impact on increasing the number of visiting tourists. Second, the tourism zones were categorized into three broad categories (each of which had two sub-categories) and empirical regression models that included the subsidy expenditures were conducted. Results of the analysis indicated that the zones in category B1 (zones consisting of regions in the same prefecture and covering a narrow area) experienced the impact of the policy. The subsidy of Project 2 (information transmission, measures for the secondary traffic, space formation) had a positive impact on the zones in category B (zones consisting of regions in the same prefecture).
The main policy implications of tourism zone development that were derived through the interpretation of the main findings of the study are as follows. First, the impact of the implementation of the tourism zone development policy may have been lower than expected. The empirical results revealed that overall, the tourism zone areas did not experience a significant increase in the number of visiting tourists after the implementation of the policy. Additionally, a crowding-out effect on the subsidy investment was demonstrated. The presence of this effect can be observed due to the following facts: (1) policies related to infrastructure formation take a long time to display the expected results, (2) the tourism industry largely experiences an indirect effect, and 3) one of the policy objectives may be the balancing of regional disparities. Second, instead of including a wide area within a single tourism zone, the inclusion of moderately sized regions within a single zone results in a stronger policy impact. If a tourism zone consists of regions within multiple prefectures, a system for fluent cooperation and communication between prefectures would be required.
This study is significant because it empirically evaluated a contemporary tourism policy (tourism zone development) in Japan. Even though Japan aims to become a tourism nation, very few previous studies have conducted nation-wide tourism research. Moreover, this study synthetically examined two different aspects of the implementation of the tourism zone development policy: (1) whether the policy implementation had an impact and (2) the degree of this impact. The main limitations of this study are the following. First, this study could not consider the factors such as tourists’ expenditure data, which might have a great influence on the tourism policy’s impact. Detailed tourism data, such as information regarding the number of accommodations or tourists’ expenditure, could not be acquired because of the data collection year (accommodation statistics in municipality were only collected from 2007). Second, this study could not include data regarding inbound tourism, because the data used for the measurement (person trip data) only pertained to the tourism of Japanese locals. However, considering the prominent role of domestic tourism in Japan (domestic travel spending generated around 81% of the direct travel and tourism GDP, whereas foreign visitor spending constituted 19% in 2019 [46]), this study still provides enlightening information regarding the Japanese tourism sector. The limitations related to analysis are mainly the result of limitations related to data acquisition. Most of the data provided concerns the prefectural level, whereas the tourism zone areas are at the municipal level. Thus, there was a limit in terms of useable data. If it is possible to conduct a materialized analysis across each region with detailed data, more useful suggestions on tourism policy could be provided. Japan has begun generating various tourism-related data since the establishment of the JTA. If follow-up studies are conducted using these data, analyses that reflect the economic impact of expenditure costs can be expected.

6. Conclusions

Under the continuing global recession from the subprime mortgage crisis, many countries are struggling with overcoming this long-lasting recession. The tourism industry usually had been perceived as a major industry in developing countries. However, in the countries that had previously placed a greater focus on other sectors, the tourism industry is emerging as a strategy to overcome the economic recession. Japan, as a major global manufacturer and trader, had been leading the world economy and has tremendously influenced the global economy. Nevertheless, Japan continues to struggle with the economic recession. The Japanese government identified the tourism industry as a key strategy for economic revival as well as a key for regional revitalization. Given this global trend toward tourism, this paper explores the tourism-related policies being promoted by the Japanese government and their effectiveness.
The tourism industry is affected by many aspects such as seasonal fluctuation, historical events, the global economy, disasters, etc. A recent global pandemic situation (i.e., COVID-19) affected the tourism sector due to restricted mobility and social distancing [47]. However, tourism is one of the key industries that can also reduce disaster risks, and fundamental changes in tourism can be observed as recovering and learning after disasters [48,49]. Therefore, it is important to conduct a summative evaluation of a certain event that can significantly affect tourism sector. In this study we empirically evaluated one of the key tourism policies in Japan. We hope that this study can contribute sustainable tourism policies and regional planning in urban studies.

Author Contributions

Conceptualization, H.K.; methodology, H.K. and E.J.K.; software, H.K.; validation, H.K. and E.J.K.; formal analysis, H.K.; investigation, H.K.; resources, E.J.K.; data curation, H.K.; writing—original draft preparation, H.K.; writing—review and editing, H.K. and E.J.K.; visualization, H.K.; supervision, H.K. and E.J.K.; project administration, H.K. and E.J.K.; funding acquisition, H.K. and E.J.K. All authors have read and agreed to the published version of the manuscript.

Funding

This research received no external funding.

Institutional Review Board Statement

Not applicable.

Informed Consent Statement

Not applicable.

Data Availability Statement

Not applicable.

Acknowledgments

The authors would like to express their gratitude to the Japan Tourism Agency (JTA) for their support with respect to interviews and materials.

Conflicts of Interest

The authors declare no conflict of interest.

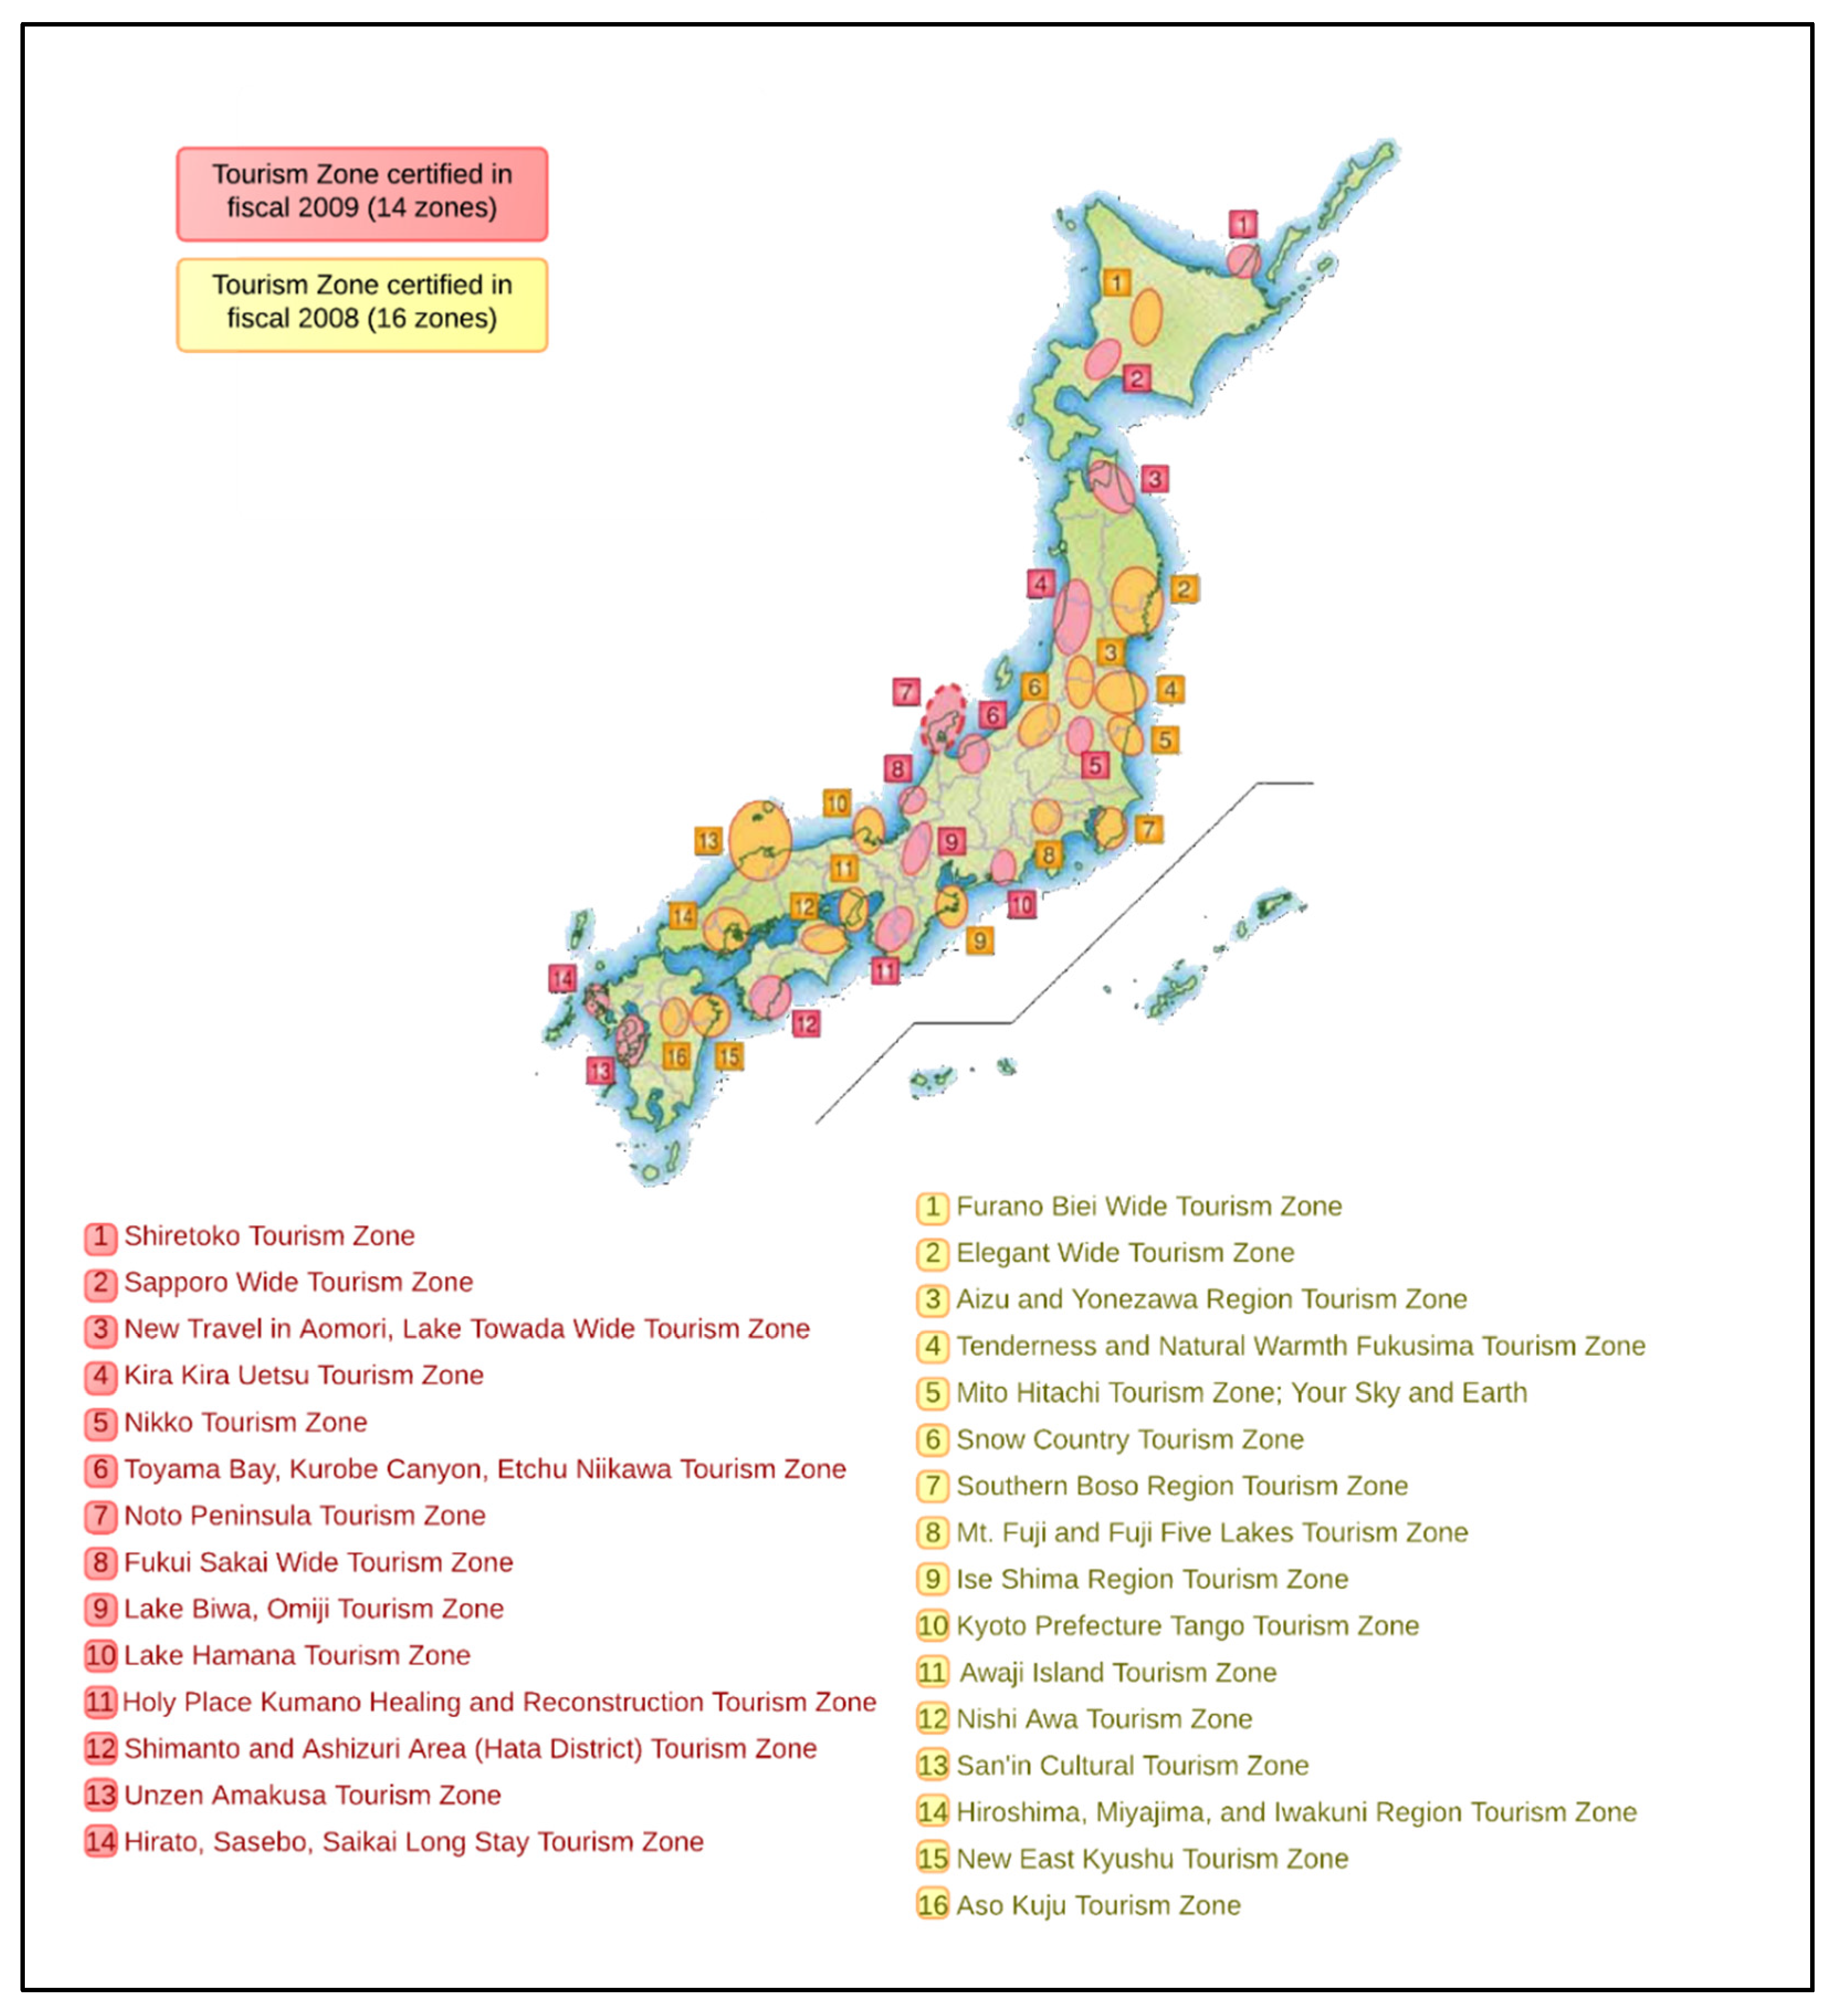
Appendix A. List of Tourism Zones

No.NameConstituent Cities/Towns
1Furano Biei Wide Tourism ZoneHokkaido Furano-shi, Biei-cho, Kamifurano-cho, Nakafurano-cho, Minamifurano-cho, Shimukappu-mura
2Elegant Wide
Tourism Zone
Iwate-ken Ichinoseki-shi, Oshu-shi, Hiraizumi-cho, Miyagi-ken Sendai-shi, Kesennuma-shi, Tome-shi, Osaki-shi, Matsushima-machi, Rifu-cho, Minamisanriku-cho, Yamagata-ken Mogami-machi
3Aizu and Yonezawa Region Tourism ZoneFukushima-ken Aizuwakamatsu-shi, Kitakata-shi, Shimogo-machi, Minamiaizu-machi, Kitashiobara-mura, Nishiaizu-machi, Bandai-machi, Inawashiro-machi
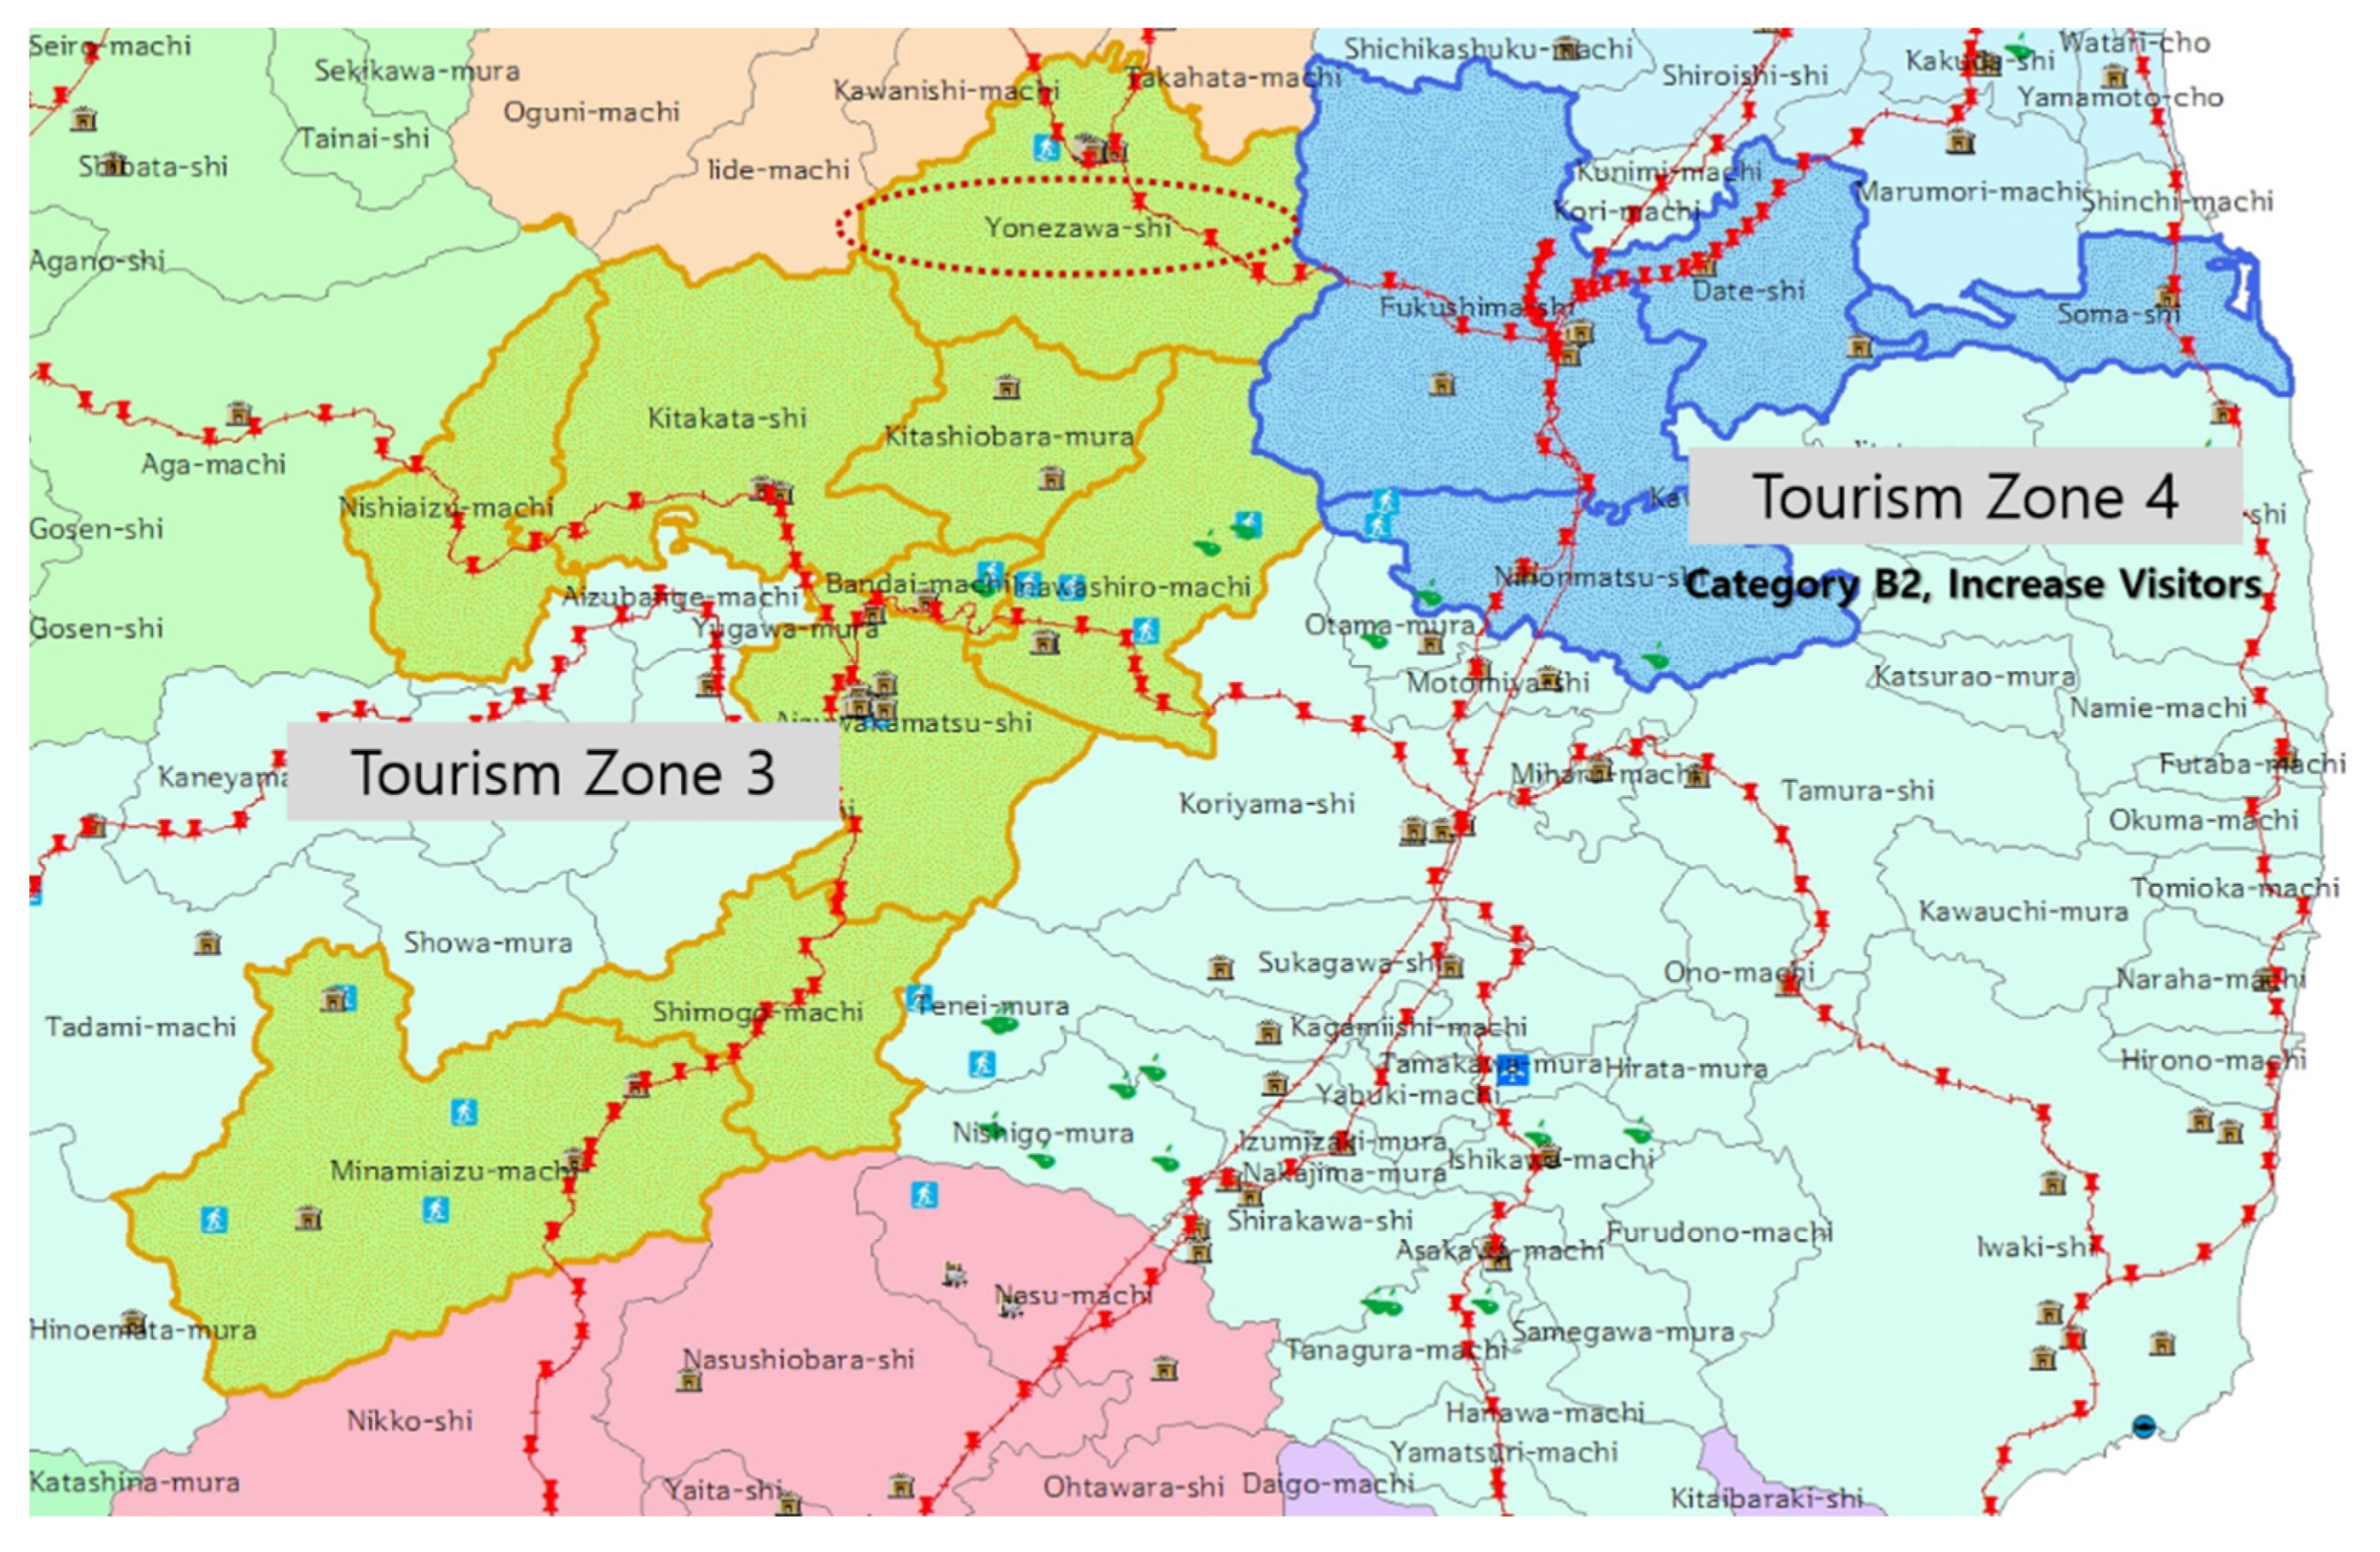
4Tenderness and Natural Warmth Fukusima
Tourism Zone
Fukushima-ken Fukushima-shi, Soma-shi, Nihonmatsu-shi, Date-shi
5Mito Hitachi Tourism Zone; Your Sky and EarthIbaraki-ken Mito-shi, Hitachi-shi, Hitachiota-shi, Takahagi-shi, Kitaibaraki-shi, Kasama-shi, Hitachinaka-shi, Hitachiomiya-shi, Naka-shi, Oarai-machi, Shirosato-machi, Tokai-mura, Daigo-machi
6Southern Boso Region Tourism ZoneChiba-ken Tateyama-shi, Kamogawa-shi, Minamiboso-shi, Kyonan-machi
7Mt. Fuji and Fuji Five Lakes Tourism ZoneYamanashi-ken Fujiyoshida-shi, Nishikatsura-cho, Oshino-mura, Yamanakako-mura, Narusawa-mura, Fujikawaguchiko-machi
8Ise Shima Region
Tourism Zone
Mie-ken Ise-shi, Toba-shi, Shima-shi, Minamiise-cho
9Kyoto Prefecture Tango Tourism ZoneKyoto-fu Maizuru-shi, Miyazu-shi, Kyotango-shi, Ine-cho, Yosano-cho
10Sanin Cultural
Tourism Zone
Tottori-ken Yonago-shi, Kurayoshi-shi, Sakaiminato-shi, Misasa-cho, Yurihama-cho, Kotoura-cho, Hokuei-cho, Hiezu-son, Daisen-cho, Nambu-cho, Hoki-cho, Nichinan-cho, Hino-cho, Kofu-cho, Shimane-ken Matsue-shi, Izumo-shi, Oda-shi, Yasugi-shi, Unnan-shi, Okuizumo-cho, Iinan-cho, Ama-cho, Nishinoshima-cho, Chibu-mura, Okinoshima-cho
11Hiroshima, Miyajima, and Iwakuni Region Tourism ZoneHiroshima-ken Hiroshima-shi, Kure-shi, Otake-shi, Hatsukaichi-shi, Etajima-shi, Kaita-cho, Kumano-cho, Saka-cho, Yamaguchi-ken Iwakuni-shi, Yanai-shi, Suooshima-cho, Waki-cho
12Nishi Awa
Tourism Zone
Tokushima-ken Mima-shi, Miyoshi-shi, Tsurugi-cho, Higashimiyoshi-cho
13New East Kyushu
Tourism Zone
Oita-ken Oita-shi, Beppu-shi, Saiki-shi, Usuki-shi, Tsukumi-shi, Yufu-shi, Miyazaki-ken Nobeoka-shi
14Aso Kuju
Tourism Zone
Kumamoto-ken Aso-shi, Minamioguni-machi, Oguni-machi, Ubuyama-mura, Takamori-machi, Nishihara-mura, Minamiaso-mura, Yamato-cho, Oita-ken Taketa-shi, Miyazaki-ken Takachiho-cho
15Shiretoko
Tourism Zone
Hokkaido Shari-cho, Kiyosato-cho, Shibetsu-cho, Rausu-cho
16Sapporo Wide
Tourism Zone
Hokkaido Sapporo-shi, Ebetsu-shi, Chitose-shi, Eniwa-shi, Kitahiroshima-shi, Ishikari-shi, Tobetsu-cho, Shinshinotsu-mura
17New Travel in Aomori, Lake Towada Wide
Tourism Zone
Aomori-ken Aomori-shi, Hachinohe-shi, Towada-shi, Misawa-shi, Shichinohe-machi, Rokunohe-machi, Tohoku-machi, Oirase-cho
18Kira Kira Uetsu Tourism ZoneAkita-ken Nikaho-shi, Yamagata-ken Tsuruoka-shi, Sakata-shi, Tozawa-mura, Mikawa-machi, Shonai-machi, Yuza-machi, Niigata-ken Murakami-shi, Sekikawa-mura, Awashimaura-mura
19Nikko Tourism ZoneTochigi-ken Nikko-shi
20Snow Country
Tourism Zone
Niigata-ken Uonuma-shi, Minamiuonuma-shi, Yuzawa-machi, Tokamachi-shi, Tsunan-machi, Gumma-ken Minakami-machi, Nagano-ken Sakae-mura
21Toyama Bay, Kurobe Canyon, Etchu Niikawa Tourism ZoneToyama-ken Uozu-shi, Namerikawa-shi, Kurobe-shi, Nyuzen-machi, Asahi-machi
22Noto Peninsula
Tourism Zone
Ishikawa-ken Nanao-shi, Wajima-shi, Suzu-shi, Hakui-shi, Shika-machi, Hodatsushimizu-cho Nakanoto-machi, Anamizu-machi, Noto-cho
23Fukui Sakai Wide Tourism ZoneFukui-ken Fukui-shi, Awara-shi, Sakai-shi, Eiheiji-cho, Ono-shi, Katsuyama-shi
24Lake Hamana
Tourism Zone
Shizuoka-ken Hamamatsu-shi, Kosai-shi
25Lake Biwa, Omiji Tourism ZoneShiga-ken Hikone-shi, Nagahama-shi, Higashiomi-shi, Maibara-shi, Hino-cho, Ryuo-cho, Aisho-cho, Toyosato-cho, Kora-cho, Taga-cho
26Awaji Island
Tourism Zone
Hyogo-ken Sumoto-shi, Minamiawaji-shi, Awaji-shi
27Holy Place Kumano Healing and Reconstruction
Tourism Zone
Nara-ken Totsukawa-mura, Wakayama-ken Tanabe-shi
28Shimanto and Ashizuri Area (Hata District)
Tourism Zone
Kochi-ken Sukumo-shi, Tosashimizu-shi, Shimanto-shi, Otsuki-cho, Mihara-mura, Kuroshio-cho
29Hirato, Sasebo, Saikai Long Stay
Tourism Zone
Nagasaki-ken Sasebo-shi, Hirado-shi, Saikai-shi
30Unzen Amakusa Tourism ZoneNagasaki-ken Shimabara-shi, Unzen-shi, Minamishimabara-shi, Kumamoto-ken Kamiamakusa-shi, Uki-shi, Amakusa-shi, Reihoku-machi

References

  1. WTTC World Tavel and Tourism Council. Available online: https://wttc.org/Research/Economic-Impact (accessed on 16 April 2021).
  2. Direct Contribution of Tourism to OECD Countries. Available online: http://dx.doi.org/10.1787/888934076134 (accessed on 16 April 2021).
  3. OECD. OECD Tourism Trends and Policies 2012; OECD Tourism Trends and Policies; OECD Publishing: Paris, France, 2012; ISBN 9789264177550. [Google Scholar]
  4. Darabi, H.; Ansari-Moqadam, A.; Saidi, A.; Rouzrokh, H. Economic Fluctuation and Its Effects on Tourism in Kish Island, Iran. J. Tour. Hosp. Sports 2014, 2, 1–16. [Google Scholar]
  5. Gunn, C.A. Turgut var Tourism Planning: Basics Concepts Cases, 4th ed.; Routledge: London, UK, 2002; ISBN 0-415-93269-6. [Google Scholar]
  6. Long, A.; Ascent, D. World Economic Outlook. Int. Monet. Fund 2020. [Google Scholar] [CrossRef]
  7. JTA about JTA|Japan Tourism Agency. Available online: http://www.mlit.go.jp/kankocho/en/about/index.html (accessed on 15 April 2021).
  8. Tourism Nation Council Report: Creating a Country Where You Can Live and Visit. Available online: https://www.kantei.go.jp/jp/singi/kanko/kettei/030424/houkoku.html (accessed on 16 April 2021).
  9. JTA Tourism Nation Promotion Basic Law. Available online: https://www.mlit.go.jp/kankocho/en/kankorikkoku/index.html (accessed on 16 April 2021).
  10. Seki, K. A study on the process of regional tourism management in collaboration between public and private sectors. WIT Trans. Ecol. Environ. 2013, 179, 339–349. [Google Scholar]
  11. Patandianan, M.V.; Shibusawa, H. Evaluating the spatial spillover effects of tourism demand in Shizuoka Prefecture, Japan: An inter-regional input–output model. Asia Pac. J. Reg. Sci. 2020, 4, 73–90. [Google Scholar] [CrossRef]
  12. Funck, C.; Cooper, M. Japanese Tourism: Spaces, Places and Structures; Berghahn Books: New York, NY, USA; Oxford, UK, 2013; Volume 5, ISBN 1782380760. [Google Scholar]
  13. Ashley, C.; De Brine, P.; Lehr, A.; Wilde, H. The Role of the Tourism Sector in Expanding Economic Opportunity; John F. Kennedy School of Government, Harvard University: Cambridge, MA, USA, 2007; Available online: https://www.hks.harvard.edu/sites/default/files/centers/mrcbg/programs/cri/files/report_23_EO+Tourism+Final.pdf (accessed on 16 April 2021).
  14. MLIT. Tourism Nation Promotion Basic Plan(Provisional Translation); MLIT: Tokyo, Japan, 2012. [Google Scholar]
  15. JTA Tourism Zone Development Act|Creating Tourism Destinations|About Policy|Japan Tourism Agency. Available online: http://www.mlit.go.jp/kankocho/en/shisaku/kankochi/seibi.html (accessed on 16 April 2021).
  16. Tourism Zone Development Act. Available online: https://www.mlit.go.jp/kankocho/en/shisaku/kankochi/seibi.html (accessed on 16 April 2021).
  17. White Paper on Tourism in Japan. 2009. Available online: https://www.mlit.go.jp/common/000221174.pdf (accessed on 16 April 2021).
  18. Poland, O.F.; Horst, P.; Nay, J.N.; Scanlon, J.W.; Wholey, J.S.; Lewis, F.L.; Zarb, F.G.; Brown, R.; Pethtel, R.D.; Marvin, K.E.; et al. Program Evaluation. Public Adm. Rev. 1974, 34, 299–338. [Google Scholar] [CrossRef]
  19. Hall, C.M. A typology of governance and its implications for tourism policy analysis. J. Sustain. Tour. 2011, 19, 437–457. [Google Scholar] [CrossRef]
  20. Scriven, M. The Methodology of Evaluation (Vol.1); American Education Research Association: Washington, DC, USA, 1967. [Google Scholar]
  21. Wholey, J.S. Formative and summative evaluation: Related issues in performance measurement. Eval. Pract. 1996, 17, 145–149. [Google Scholar] [CrossRef]
  22. Poland, O.F. Program evaluation and administrative theory. Public Adm. Rev. 1974, 34, 333–338. [Google Scholar] [CrossRef]
  23. Creswell, J.W.; Creswell, J.D. Research Design: Qualitative, Quantitative, and Mixed Methods Approaches; Sage Publications: London, UK, 2017; ISBN 1506386717. [Google Scholar]
  24. Reichardt, C.S. Quasi-experimental design. SAGE Handb. Quant. Methods Psychol. 2009, 46, 490–500. [Google Scholar]
  25. Blundell, R.; Costa Dias, M. Evaluation methods for non-experimental data. Fisc. Stud. 2000, 21, 427–468. [Google Scholar] [CrossRef]
  26. Ishikawa, N.; Fukushige, M. Who expects the municipalities to take the initiative in tourism development? Residents’ attitudes of Amami Oshima Island in Japan. Tour. Manag. 2007, 28, 461–475. [Google Scholar] [CrossRef]
  27. Ishikawa, N.; Fukushige, M. Impacts of tourism and fiscal expenditure to remote islands: The case of the Amami islands in Japan. Appl. Econ. Lett. 2007, 14, 661–666. [Google Scholar] [CrossRef]
  28. Romão, J.; Neuts, B.; Nijkamp, P.; Shikida, A. Determinants of trip choice, satisfaction and loyalty in an eco-tourism destination: A modelling study on the Shiretoko Peninsula, Japan. Ecol. Econ. 2014, 107, 195–205. [Google Scholar] [CrossRef]
  29. Ohe, Y.; Kurihara, S. Evaluating the complementary relationship between local brand farm products and rural tourism: Evidence from Japan. Tour. Manag. 2013, 35, 278–283. [Google Scholar] [CrossRef]
  30. Ohe, Y. Evaluating Household Leisure Behaviour of Rural Tourism in Japan; Exploring Diversity in the European Agri-Food System: Zaragoza, Spain, 2002; Available online: https://ageconsearch.umn.edu/record/24932/files/cp02oh15.pdf (accessed on 16 April 2021).
  31. Chi, P.-Y.; Chang, T.; Takahashi, D.; Chang, K.-I. Evaluation of the impact of the tourism nation promotion project on inbound tourists in Japan: A difference-in-differences approach. Asia Pac. J. Tour. Res. 2019, 24, 31–55. [Google Scholar] [CrossRef]
  32. Okyere, S.A.; Diko, S.K.; Abunyewah, M.; Kita, M. Toward citizen-led planning for climate change adaptation in Urban Ghana: Hints from Japanese ‘Machizukuri’activities. In The Geography of Climate Change Adaptation in Urban Africa; Springer: Berlin/Heidelberg, Germany, 2019; pp. 391–419. [Google Scholar]
  33. Sorensen, A.; Koizumi, H.; Miyamoto, A. Machizukuri, civil society, and community space in Japan. Polit. Civ. Sp. Asia Build. Urban Communities 2008. [Google Scholar] [CrossRef]
  34. Hein, C. Toshikeikaku and machizukuri in Japanese urban planning: The reconstruction of inner city neighborhoods in Kōbe. Japanstudien 2002, 13, 221–252. [Google Scholar] [CrossRef]
  35. Kusakabe, E. Advancing sustainable development at the local level: The case of machizukuri in Japanese cities. Prog. Plann. 2013, 80, 1–65. [Google Scholar] [CrossRef] [Green Version]
  36. National Urban Traffic Chracteristics Survey. Available online: https://www.mlit.go.jp/toshi/tosiko/toshi_tosiko_tk_000033.html (accessed on 16 April 2021).
  37. e-Stat, Portal Site of Official Statistics of Japan. Available online: https://www.e-stat.go.jp/en/regional-statistics/ssdsview (accessed on 16 April 2021).
  38. Takaharu, K. The great Heisei consolidation: A critical review. Soc. Sci. Jpn. 2007, 37, 7–11. [Google Scholar]
  39. Rausch, A. The Heisei Dai Gappei: A case study for understanding the municipal mergers of the Heisei era. Jpn. Forum 2006, 18, 133–156. [Google Scholar] [CrossRef]
  40. Shimizu, N. Effects of Municipal Mergers in Japan; Canadian Political Science Association, Annual Conference: Victoria, BC, Canada, 2013. [Google Scholar]
  41. Kuo, R.J.; Akbaria, K.; Subroto, B. Application of particle swarm optimization and perceptual map to tourist market segmentation. Expert Syst. Appl. 2012, 39, 8726–8735. [Google Scholar] [CrossRef]
  42. Habing, B. Exploratory factor analysis. Univ. S. C. Oct. 2003, 15, 2003. [Google Scholar]
  43. Galster, G.; Walker, C.; Hayes, C.; Boxall, P.; Johnson, J. Measuring the impact of community development block grant spending on urban neighborhoods. Hous. Policy Debate 2004, 15, 903–934. [Google Scholar] [CrossRef]
  44. Martin, C.A.; Witt, S.F. Tourism demand forecasting models: Choice of appropriate variable to represent tourists’ cost of living. Tour. Manag. 1987, 8, 233–246. [Google Scholar] [CrossRef]
  45. National Land Numerical Information Download Service, MLIT. Available online: http://nlftp.mlit.go.jp/ksj/ (accessed on 16 April 2021).
  46. WTTC Economic Impact Report. Available online: https://wttc.org/Research/Economic-Impact/country-analysis/country-data (accessed on 16 April 2021).
  47. Gössling, S.; Scott, D.; Hall, C.M. Pandemics, tourism and global change: A rapid assessment of COVID-19. J. Sustain. Tour. 2021, 29, 1–20. [Google Scholar] [CrossRef]
  48. UNISDR. From Shared Risk to Shared Value-The Business Case for Disaster Risk Reduction: Global Assessment Report on Disaster Risk Reduction; United Nations Office for Disaster Risk Reduction: Geneva, Switzerland, 2013. [Google Scholar]
  49. Chan, C.-S.; Nozu, K.; Cheung, T.O.L. Tourism and natural disaster management process: Perception of tourism stakeholders in the case of Kumamoto earthquake in Japan. Curr. Issues Tour. 2020, 23, 1864–1885. [Google Scholar] [CrossRef]
Figure 1. Main policies under the Tourism Nation Promotion Basic Law.
Sustainability 13 07478 g001
Figure 2. Tourism zone development plan (modified from [15]).
Sustainability 13 07478 g002
Figure 3. A list of approved tourism zones. (Adapted from: white paper on tourism in Japan, 2009, p. 60 [17]).
Sustainability 13 07478 g003
Figure 4. Policy impact measurement (pretest–posttest control group design).
Sustainability 13 07478 g004
Figure 5. Analytical flowchart.
Sustainability 13 07478 g005
Figure 6. Examples of the tourism zones that contain a nearby island.
Sustainability 13 07478 g006
Figure 7. Perceptual map of tourism zones.
Sustainability 13 07478 g007
Figure 8. Tourism Zone 3 and Tourism Zone 4.
Sustainability 13 07478 g008
Table 1. Quasi-experimental designs [23].
Quasi-Experimental DesignsSchema
Non-equivalent (Pretest and Posttest)
Control Group Design
Group A O---------X---------O
Group B O--------------------O
Single-Group Interrupted Times-Series DesignGroup A O--O--O--O--X--O--O--O--O
Control Group Interrupted Time-Series DesignGroup A O--O--O--O--X--O--O--O—O
Group B O--O--O--O--O--O--O--O--O
Table 2. Characteristics of tourism zones.
NumTourism Zone NameMunicipalities
(City/Town)
PrefecturesIsland
(Dummy)
1Furano Biei Wide Tourism Zone610
2Elegant Wide Tourism Zone1130
3Aizu and Yonezawa Region Tourism Zone920
4Tenderness and Natural Warmth410
5Fukusima Tourism Zone1310
6Mito Hitachi Tourism Zone; Your Sky and Earth410
7Southern Boso Region Tourism Zone610
8Mt. Fuji and Fuji Five Lakes Tourism Zone410
9Ise Shima Region Tourism Zone510
10Kyoto Prefecture Tango Tourism Zone2521
11Sanin Cultural Tourism Zone1221
12Hiroshima, Miyajima,410
13and Iwakuni Region Tourism Zone720
14Nishi Awa Tourism Zone1030
15New East Kyushu Tourism Zone410
16Aso Kuju Tourism Zone810
17Shiretoko Tourism Zone810
18Sapporo Wide Tourism Zone1031
19New Travel in Aomori,110
20Lake Towada Wide Tourism Zone730
21Kira Kira Uetsu Tourism Zone510
22Nikko Tourism Zone910
23Snow Country Tourism Zone610
24Toyama Bay, Kurobe Canyon,210
25Etchu Niikawa Tourism Zone1010
26Noto Peninsula Tourism Zone311
27Fukui Sakai Wide Tourism Zone220
28Lake Hamana Tourism Zone610
29Lake Biwa, Omiji Tourism Zone311
30Awaji Island Tourism Zone721
Table 3. Categories of tourism zones.
CategoryTourism Zone CharacteristicsExamples
A1Consists of two or more prefectures.
Covers a wide region (seven or more municipalities).
Tourism zone
2, 3, 13, 14, 20
A2Consists of two or more prefectures. Covers a narrow region (less than seven municipalities).Tourism zone
27
B1Covers a wide region within the same prefecture.Tourism zone
5, 16, 17, 22, 25
B2Covers a narrow region within the same prefecture.Tourism zone
1, 4, 6, 7, 8, 9, 12, 15, 19, 21, 23, 24, 28
C1Includes a nearby island and consists of two or more prefectures. Covers a wide region (seven or more municipalities).Tourism zone
10, 11, 18, 30
C2Includes a nearby island and
Covers a narrow region within the same prefecture (less than seven municipalities).
Tourism zone
26, 29
Table 4. KMO and Bartlett’s Test.
Kaiser–Meyer–Olkin Measure of Sampling Adequacy.0.904
Bartlett’s Test of SphericityApprox. Chi-Square147,477.977
df406
Sig.0.000
Table 5. Total variance explained (rotation method: Varimax with Kaiser Normalization).
ComponentExtraction Sums
of Squared Loadings
Rotation Sums of Squared Loadings
Cumulative%Total% of VarianceCumulative%
162.04317.39459.97959.979
270.7742.5588.81968.798
376.8361.9476.71575.513
480.7561.3774.75080.263
584.2511.1563.98784.251
Table 6. Rotated component matrix.
VariablesComponent
12345
Total households0.9930.0480.0430.0160.007
Persons employed in the tertiary industry (person)0.9890.0660.0550.0260.005
Population 15 to 64 years old (person)0.9890.0760.0640.0440.009
Total population (person)0.9880.0880.0610.0520.012
Labor force (person)0.9880.0940.0630.0540.008
Immigrants from other prefectures (person)0.987−0.0080.037−0.019−0.006
Daytime population (person)0.9860.0550.044−0.002−0.003
Total welfare expenditure (thousand yen)0.9850.0290.0070.0430.025
Taxable income (thousand yen)0.9810.0250.064−0.050−0.022
Total dwellings0.963−0.1000.061−0.0170.008
Commercial and neighboring commercial area (ha)0.9590.1040.0180.1220.019
Persons employed in the secondary industry (person)0.9530.1600.1060.1420.003
Manufacturing establishments0.9300.0830.0420.0670.011
Local taxes (thousand yen)0.9280.0900.0850.2410.005
DIDs area (km2)0.926−0.0150.1170.1890.026
Public works expenditure (thousand yen)0.8830.1160.0250.3150.035
Industrial and quasi-industrial area (ha)0.8610.2140.0830.2770.042
Persons at work in manufacturing establishments (person)0.8290.2400.1640.255−0.009
Commerce and manufacturing expenditure (thousand yen)0.6730.090−0.0660.4350.055
Labor expenditure (thousand yen)0.6660.2270.130−0.0090.082
Persons employed in the primary industry (person)0.2000.872−0.0480.0910.026
Agriculture forestry and fishery expenditure (thousand yen)0.1570.852−0.1430.1440.012
Cultivated land area (ha)0.0000.816−0.074−0.045−0.096
Financial strength index0.013−0.0990.7510.329−0.059
Taxable income per tax debtor (thousand yen)0.238−0.0800.703−0.052−0.269
Ratio of owned houses0.044−0.1670.6740.0310.191
Public halls per 1,000,000 persons−0.050−0.238−0.5100.216−0.473
Exclusive industrial area (ha)0.2170.1380.1600.7760.037
Unemployment rate0.053−0.124−0.0420.0890.891
Table 7. T-test result: increased significantly.
GroupMeanStd. Deviationt-ValueSig.
Control Group10.71431.20439−2.2330.044 **
Tourism Zone 12.07142.26900
Control Group 3−0.07141.60851−1.8420.077 *
Tourism Zone 30.00002.50924
Control Group 41.11544.79439−1.7580.091 *
Tourism Zone 42.34625.80994
Control Group 7−0.16672.47890−3.6690.001 ***
Tourism Zone 72.04172.47561
Control Group 80.41381.11858−4.3320.000 ***
Tourism Zone 82.62072.65133
Control Group 121.38892.27877−2.8870.010 ***
Tourism Zone 123.05562.85888
Control Group 150.28570.95119−3.8730.008 ***
Tourism Zone 151.71430.48795
Control Group 190.15791.64192−6.4700.000 ***
Tourism Zone 193.73682.18180
Significant at the level of * p < 0.1, ** p < 0.05, *** p < 0.01.
Table 8. T-test result: increased not significantly.
GroupMeanStd. Deviationt-ValueSig.
Control Group 50.97141.88626−1.1280.267
Tourism Zone 51.45711.97548
Control Group 60.66671.21106−0.8960.411
Tourism Zone 63.00006.06630
Control Group 201.16132.60892−0.299.0767
Tourism Zone 201.35482.07442
Tourism Zone 230.96552.94573−1.4380.161
Control Group 232.34483.91221
Control Group 241.68752.27211−0.920.928
Tourism Zone 241.75000.85635
Control Group 270.87101.89283−0.8670.393
Tourism Zone 271.16131.00322
Control Group 281.68752.27211−1.1650.262
Tourism Zone 282.25001.80739
Control Group 300.52382.42114−0.2490.806
Tourism Zone 300.71433.88771
Table 9. T-test result: decreased not significantly.
GroupMeanStd. Deviationt-ValueSig.
Control Group 112.21438.503930.500.960
Tourism Zone 112.16078.93568
Control Group 130.68422.326180.6120.545
Tourism Zone 13−0.05266.28575
Control Group 180.70593.721590.2270.822
Tourism Zone 180.55881.58001
Control Group 216.777818.935790.4580.650
Tourism Zone 215.296312.47093
Control Group 260.42111.574650.2970.770
Tourism Zone 260.26321.75885
Control Group 292.18751.641900.8890.388
Tourism Zone 291.68751.07819
Table 10. Projects of the tourism zone development program.
ProjectProject Details
Project 1Improving stay program, marketing, development of human resource/awareness enlightenment
Project 2Information transmission, measures for the secondary traffic, space formation
Project 3Inbound support, quality management
Table 11. Variables used in regression modeling.
Dependent Variable Arrivals Change for Tour
(∆2010–2005)
Source [36]
Explanatory VariablesVitalityDaytime population (person)Source [37]
Rate of day to night population (%)
CommerceCommerce and manufacturing expenditure (thousand yen)
Persons employed in the tertiary industry (person)
Commercial and neighboring commercial area (ha)
AttractionsNumber of public parks
Number of zoos
Number of art museums
Number of golf clubs
TransportationTotal real length of roads (km)Source [45]
Total real length of major roads (km)
Total real length of local roads (km)
Total real length of major paved roads (km)
Total real length of local paved roads (km)
Tourism Zone Development
Policy
Dummy_project1Source: JTA
Dummy_project2
Dummy_project3
Project 1 subsidy(yen)
Project 2 subsidy(yen)
Project 3 subsidy(yen)
Total project subsidy (Total yen)
Number of cities/towns
Table 12. Result of multiple regression model: all tourism zones.
Independent VariablesBetat-ValueSig.ToleranceVIF
(Constant) 3.3160.001 ***
Commerce and manufacturing expenditure0.4768.0970.000 ***0.9671.035
Number of public parks0.3826.3170.000 ***0.9161.092
Project 1 subsidy−0.102−1.6710.097 *0.8981.113
Project 2 subsidy−0.019−0.3220.7480.9651.037
Project 3 subsidy0.0070.1210.9040.9261.08
R2 = 0.422 (adjusted R2 = 0.405), Durbin–Watson = 1.914. Significant at the level of * p < 0.1, *** p < 0.01.
Table 13. Result of multiple regression model: most effective case.
Independent VariablesBetat-ValueSig.ToleranceVIF
(Constant) −3.3130.002 ***
Commerce and manufacturing expenditure (thousand yen)0.63510.0660.000 ***0.9691.032
Number of public parks0.4276.6060.000 ***0.9221.084
Project 1 subsidy0.3073.5790.001 ***0.5221.914
Project 2 subsidy0.1852.7290.008 ***0.8431.186
Project 3 subsidy0.2673.3290.002 ***0.6011.664
R2 = 0.776 (adjusted R2 = 0.757), Durbin–Watson = 1.791. Significant at the level of *** p < 0.01.
Table 14. Result of multiple regression model: least effective case.
Independent VariablesBetat-ValueSig.ToleranceVIF
(Constant) 3.0010.004 ***
Commerce and manufacturing expenditure (thousand yen)0.7067.6190.000 ***0.9191.088
Number of public parks0.4174.3800.000 ***0.8731.146
Project 1 subsidy−0.254−2.6780.010 ***0.8791.138
Project 2 subsidy−0.077−0.7870.4350.8201.220
Project 3 subsidy−0.015−0.1510.8800.8581.166
R2 = 0.589 (adjusted R2 = 0.550), Durbin–Watson = 1.791. Significant at the level of *** p < 0.01.
Table 15. Result of multiple regression model: category A.
Independent VariablesBetat-ValueSig.ToleranceVIF
(Constant) 1.2520.22
Number of public parks0.4513.0120.005 ***0.941.064
Project 1 subsidy−0.419−2.4590.019 **0.7251.38
Project 2 subsidy0.1040.6180.5410.7361.359
Project 3 subsidy−0.026−0.1680.8670.9131.096
R2 = 0.306 (adjusted R2 = 0.222), Durbin–Watson = 2.318. Significant at the level of ** p < 0.05, *** p < 0.01.
Table 16. Result of multiple regression model: category B.
Independent VariablesBetat-ValueSig.ToleranceVIF
(Constant) 3.6530
Commerce and manufacturing expenditure0.6799.2820.000 ***0.921.087
Dummy_project1−0.273−2.5820.011 **0.4392.275
Project 1 subsidy0.0770.7580.4510.4722.119
Project 2 subsidy0.1621.9540.054 *0.7181.392
Project 3 subsidy0.1381.620.1080.6831.465
R2 = 0.512 (adjusted R2 = 0.488), Durbin–Watson = 1.804. Significant at the level of * p < 0.1, ** p < 0.05, *** p < 0.01.
Table 17. Result of multiple regression model: category C.
Independent VariablesBetat-ValueSig.ToleranceVIF
(Constant) 0.2510.803
Daytime population (person)0.7596.0230.000 ***0.7041.42
Number of public parks0.5124.2280.000 ***0.7611.313
Project 1 subsidy0.0650.1910.850.09610.433
Project 2 subsidy0.0350.1010.920.0911.054
Project 3 subsidy0.10.8720.3880.8521.174
R2 = 0.52 (adjusted R2 = 0.464), Durbin–Watson = 1.604. Significant at the level of *** p < 0.01.
Table 18. Synthesis of regression results.
All
Areas
Category
A
Category
B
Category
C
Most
Effective
Least
Effective
Project 1
Subsidy
-- +-
Project 2
Subsidy
+ +
Project 3
Subsidy
+
Table 19. Tourism zones: increased visitors, positive subsidy effect.
Tourism ZoneIncrease Visitors
(Quasi-Experiment)
Most Effective Case
(Regression Model)
Category
1B2
3A1
4 B2
5 B1
7B2
8 B2
9 B2
11 C1
12B2
14 A1
15B2
19 B2
24 B2
25 B1
Publisher’s Note: MDPI stays neutral with regard to jurisdictional claims in published maps and institutional affiliations.

