1. Introduction
The Park-and-Ride (P&R) system is a set of facilities available for private vehicle users to transfer to public transport to complete their journey. Thus, the facilities should be located close to public transport stations. Besides this, in most cities with a Sustainable Urban Mobility Plan (SUMP), the purpose or criteria for these facilities is stipulated. These criteria include reducing pollution in the city center, increasing accessibility to public transport, and reducing private vehicle trips to the Central Business District (CBD) [
1,
2,
3,
4].
Considering that establishment of a P&R system involves locating them close to public transport stations, it would be necessary to have a facility for each public transport station. Therefore, a set of criteria and sub-criteria should be formulated, based on which experts can support the implementation of the P&R system in the urban area of a city in an efficient way [
5,
6,
7,
8,
9,
10,
11].
Thus, a set of 6 main criteria and 19 sub-criteria have been established in research on the P&R system, in which the authors have used two methods of multi-criteria identified as AHP (Analytic Hierarchy Process) and BWM (Best Worst Method) (
Figure 1) [
12,
13,
14]. Using the AHP and BWM methods, accessibility to public transport is the crucial criterion in implementing the P&R. Furthermore, the set of main criteria proposed in the study does not differ for the multi-criteria methods used, while differences remain between the sub-criteria. Therefore, more comprehensive models such as the AHP-BWM model should be applied to these criteria and sub-criteria [
15]. The authors have already created a set of criteria and sub-criteria, however, it is pertinent to analyze these with different multi-criteria methods in order to know if the criteria are modified according to the method applied.
Although researchers have begun to use Multicriteria Decision-Making Applications (MCDM) in the area of transportation, a gap is evident. Essentially there are no articles that have developed an investigation of the location of facilities of a P&R system using AHP-BWM.
Section 2 provides the theoretical background for MCDM methods, including a description of the location of the P&R facilities;
Section 3 details the research method;
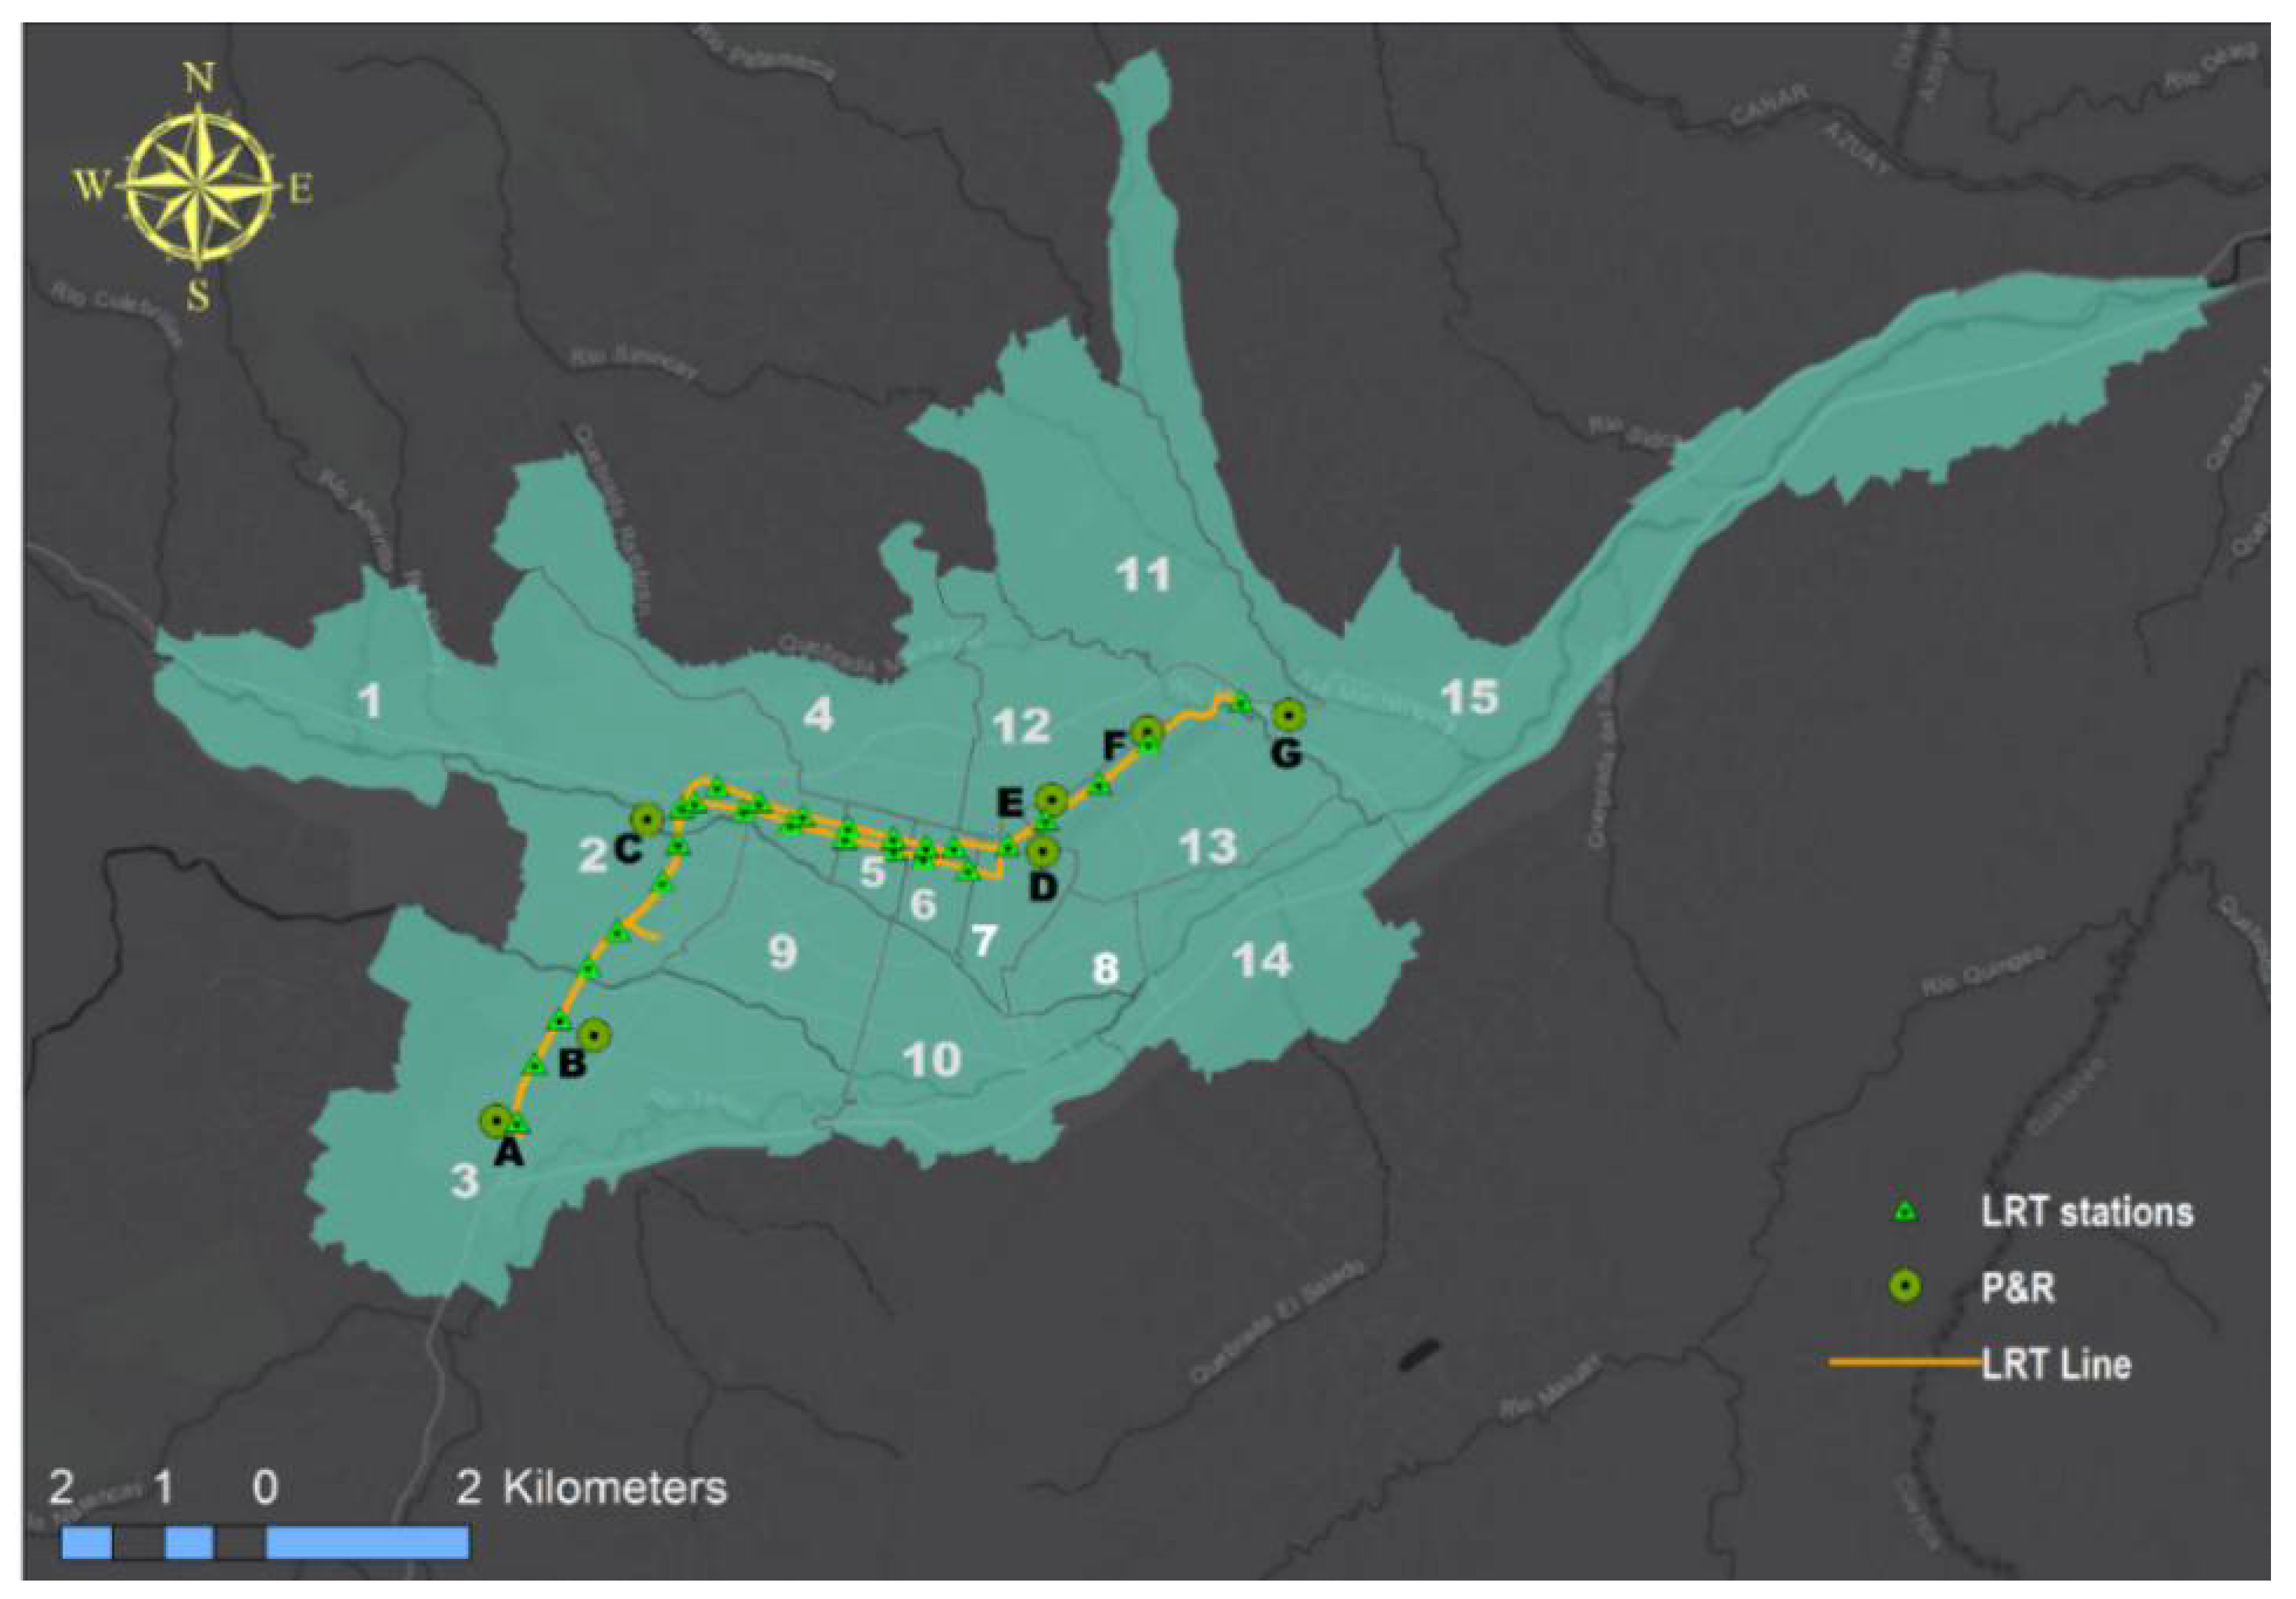
Section 4 explains the case study for Cuenca, Ecuador;
Section 5 applies the method developed; and
Section 6 presents and discusses the results obtained by applying the methodology. The conclusions section discusses the findings of the study and offers directions for future research.
2. Literature Review
The literature review in this paper discusses the criteria used by the researchers for the location of P&R facilities, accompanied by an overview of the multi-criteria methods.
Private vehicles have negatively impacted CBDs in urban areas, and their consequences are widely known: congestion and pollution. Mobility experts made numerous recommendations to city leaders to mitigate these issues [
16]. The vast majority of approaches consisted of switching from a private mode to a more beneficial transportation mode (e.g., public transport, pedestrian) [
17,
18,
19]. Although for citizens who have private vehicles and live outside the metropolitan area with no public transport connections or limited transport, there should also be an option. This option is commonly known as the P&R system. The P&R system is a connection point between the private vehicle and public transport, and therefore, the criteria that the experts consider when implementing the system are related to all the transport modes involved [
20,
21,
22].
Establishing a P&R system in the urban environment of a city leads to a set of criteria that are part of the operation of the P&R system, such as the capacity that refers to the number of necessary parking places spaces that can be installed in the P&R system. Moreover, since the P&R system involves public transportation parameters such as demand, accessibility, frequency, and travel times of public transportation, these criteria are also taken into consideration [
23,
24,
25,
26,
27]. Besides, when involving private vehicles, criteria such as traffic, travel time, and pollution are taken into account [
28,
29,
30,
31,
32].
A multi-criteria MCDM models a method that is widely used for offering solutions to several problems in the field of transport and urban planning [
33,
34,
35,
36,
37,
38,
39,
40]. The AHP approach is based on the criteria for the interpretation, assessment, correction, and selection of the experts’ judgment, which leads to some imperfections of the outcomes, resulting in a certain loss of precision in weighting the criteria and findings that contradict reality [
41,
42]. Therefore, to solve AHP problems more efficiently, they were combined with other multi-criteria methods and used different mathematical and optimization models to achieve greater accuracy [
43,
44,
45,
46]. The specialists also compared and optimized pair matrices using a real scenario, incorporating a sensitivity assessment with a simulation approach and a network analytical method (ANP) [
47,
48,
49]. In an alternative integration model, the AHP approach was used to incorporate a model with the order of priorities to resemble the optimal solution preferences in order to assess the feasibility of this method [
50,
51]. Combining fuzzy theory and AHP makes it possible to interpret imprecise parameters within the mathematical decision-making in the fuzzy domain [
45,
46]. The ANP can be combined with the fuzzy theory to minimize possible errors in the decision-making system [
47,
48]. The so-called B&W method (Best Worst Method) helps to minimize pair-wise comparisons (PC) in questionnaire surveys; the method aims to facilitate fewer pair-wise comparisons than the traditional method. Pairwise comparisons are formulated and solve max-min problems to determine the weight of the criteria among all pairwise criteria between each of the best and worst criteria for the decision [
52]. In addition, a technique of preference ordering by similarity to the ideal solution (TOPSIS) has been developed with interval-valued fuzzy numbers for multi-criteria decision making with variables and their transformation [
53,
54]. However, the method is new and has not been used to study which criteria are important for the location of the P&R system. [
55,
56].
The P&R system and MCDM techniques are combined in a few studies. For example, social, environmental, and economic criteria were applied to assess the location of P&R in combination with the VISUM software [
57,
58].
The scientific literature on P&R and MCDM shows a gap in P&R planning using advanced MCDM models. This article aims to formulate a combined model between AHP-BMW that contributes to making decisions about the location of P&R facilities in a consistent manner.
3. Data Collection and Methods
This section deals with methodological elements and references, including a summary of how the survey was performed and a detailed overview of the methodology used.
3.1. Survey
The surveys have been prepared on the basis of meetings with transport planning specialists in order to determine the most relevant criteria for the implementation of a set of facilities in a P&R system. Respondents were recruited from the municipality and university’s transport planning experts, consisting of six men and four women of different ages. The survey was completed in 25 to 30 min per expert. A total of 25 P&R system elements were assessed.
3.2. Design of the Saaty Scale and Description Criteria
The planning and ranking of the criteria to be used or taken into account for the location of the P&R system facilities is one of the most relevant parts of the study, and therefore, these criteria are ordered on a scale from 1 to 9. The use of this scale has the advantage of simplicity of application and the possibility of also using a scale of proportions. Moreover, it is more accurate than other methods as it compares each indicator with the other. According to the previous study, 6 main criteria and 19 sub-criteria were identified [
59].
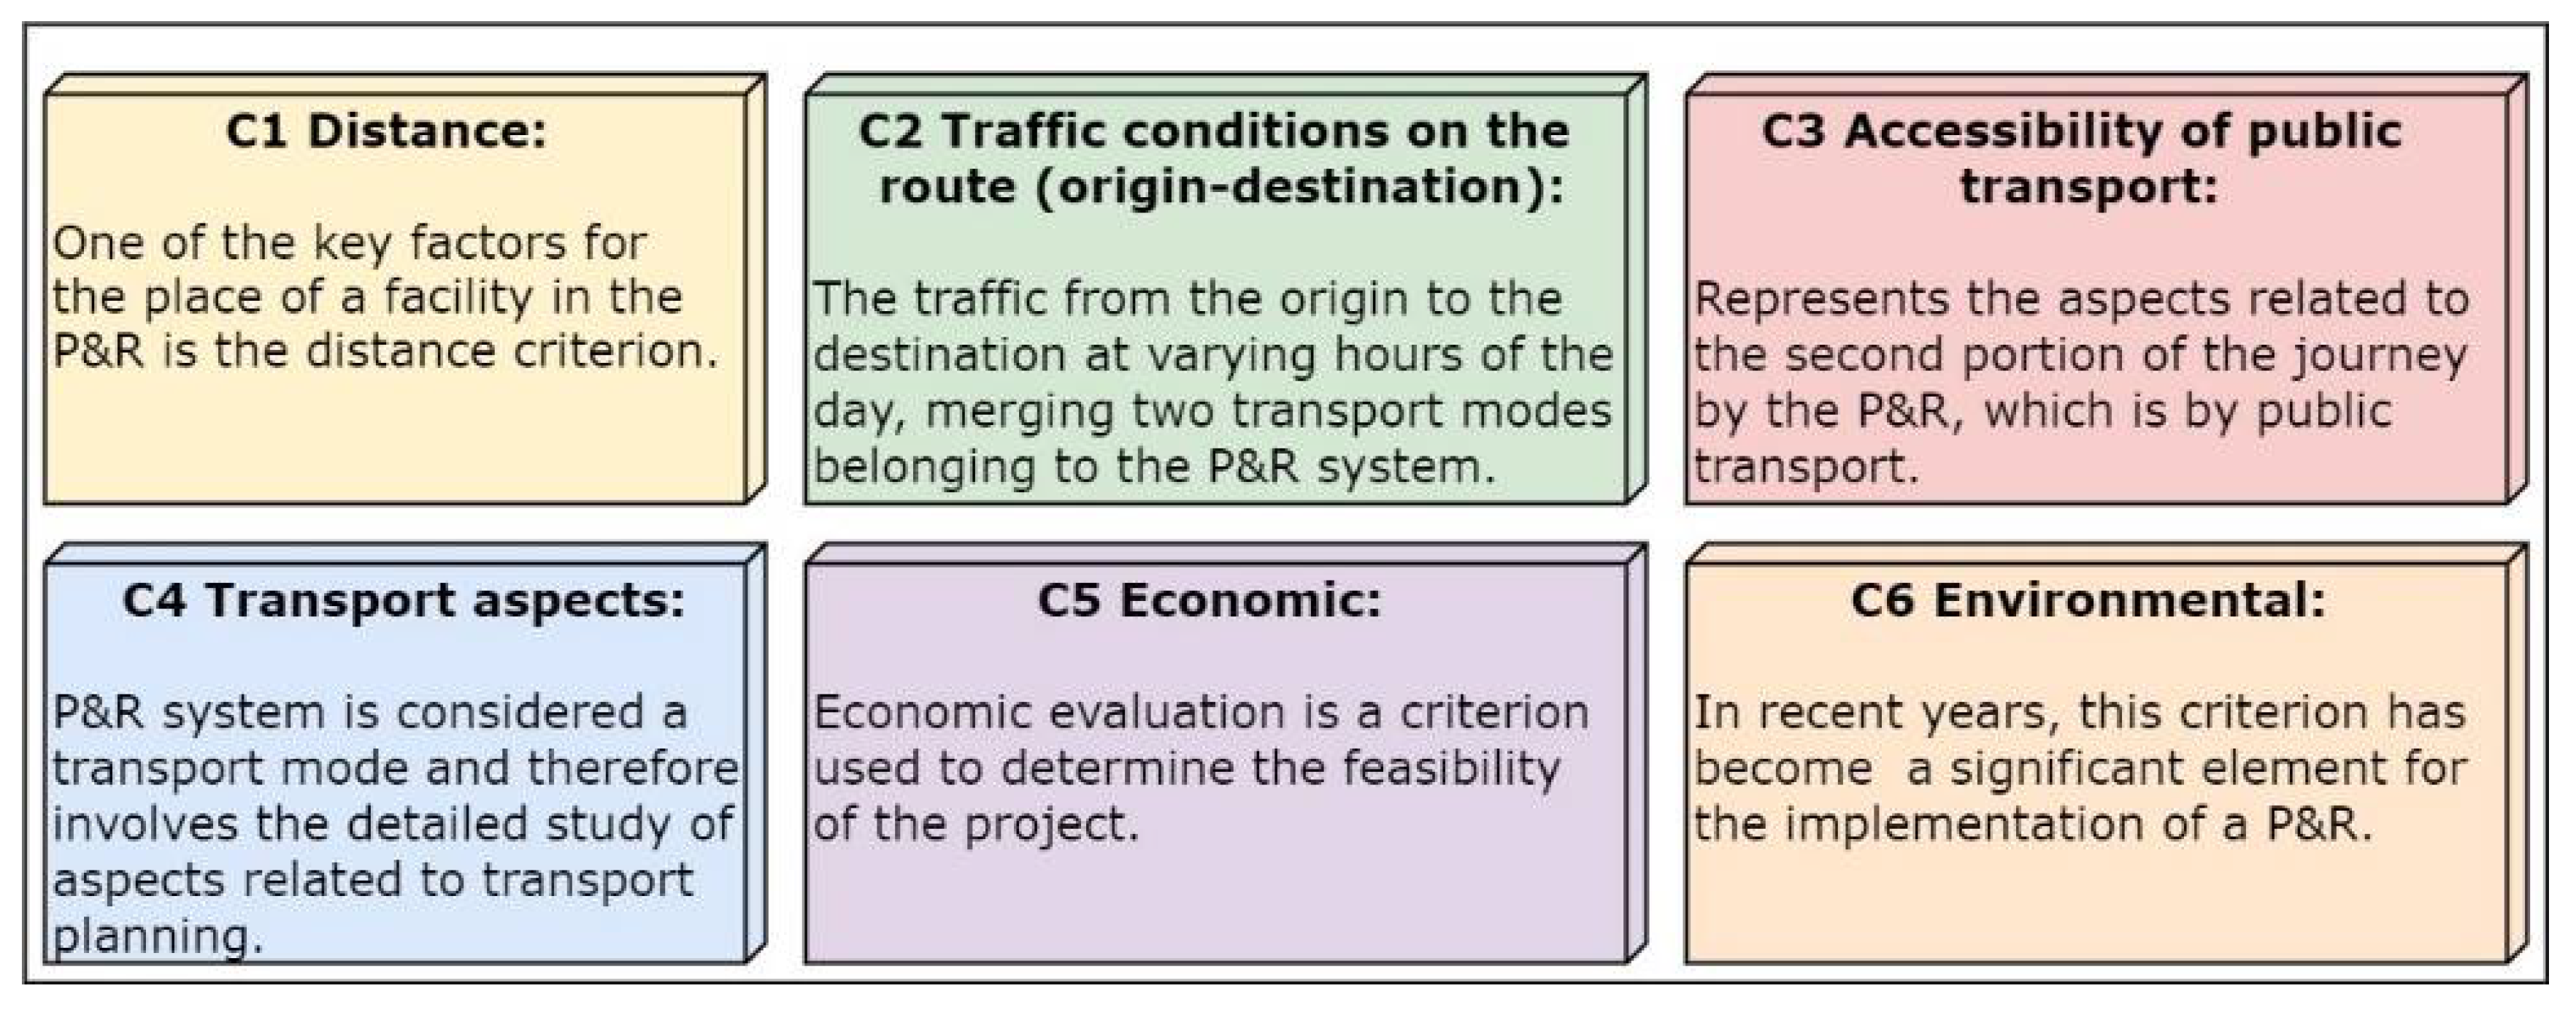
Figure 2 shows the coding of each main criterion and also contains the description of the first level. Six criteria are the main criteria of this level (designed as level 1). These criteria have been assigned a code ranging from C1 to C6.
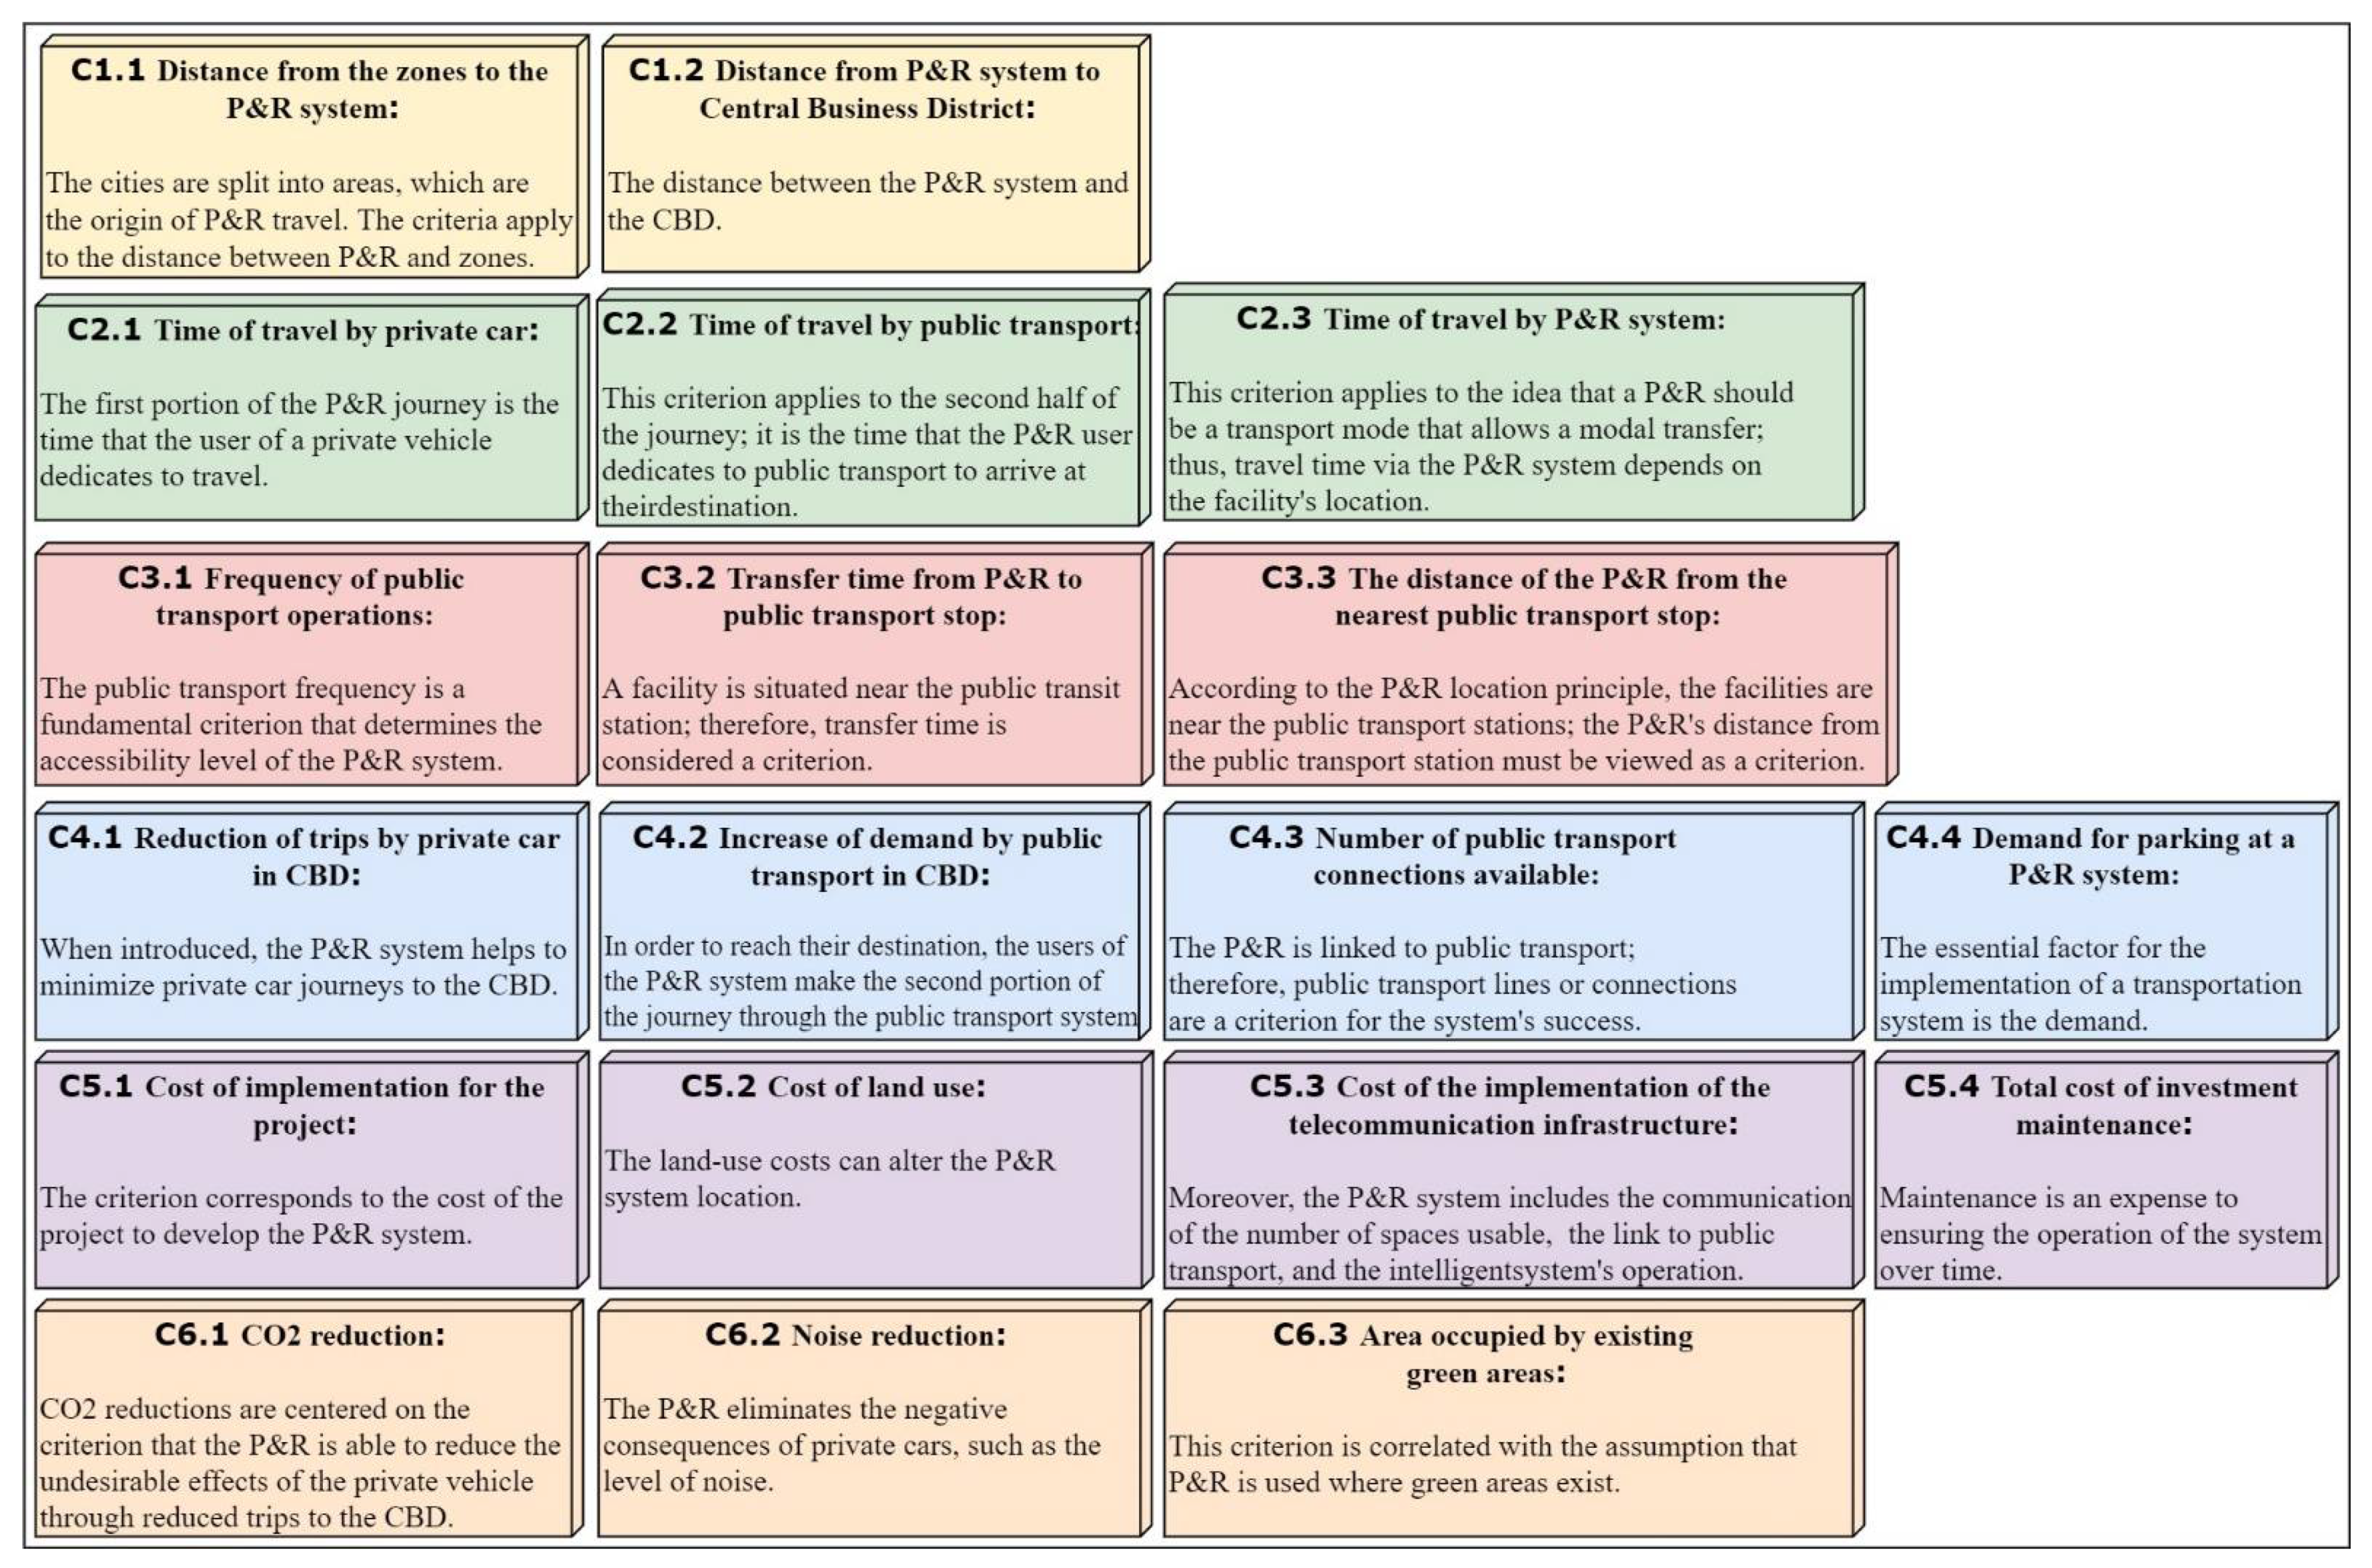
Figure 3 refers to the description of the 19 sub-criteria of the second level, and a code is provided that identifies which main criteria it belongs to.
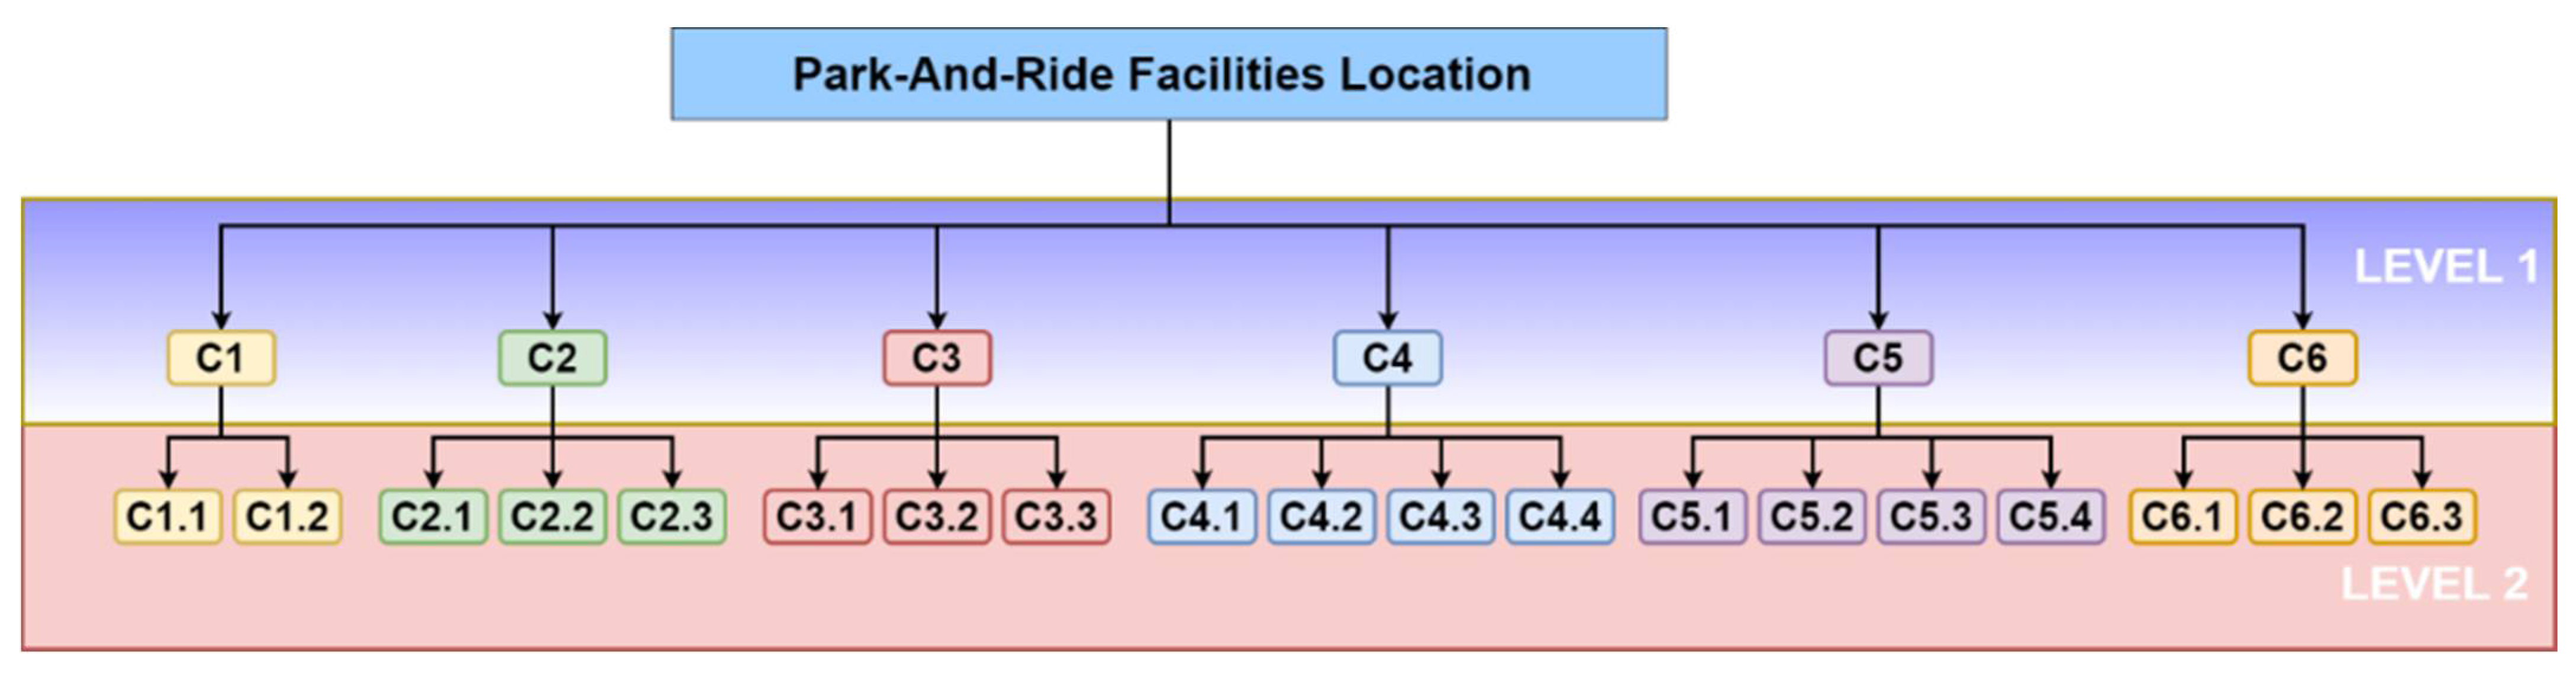
The approach is determined by the hierarchical criterion structure, in which criteria of the same category from the decision criteria tree chosen by the expert assessors are compared in pairs. (See
Figure 4).
3.3. Description of the Conventional Analytic Hierarchy Process (AHP)
The traditional AHP approach is built on the hierarchical decision-making structure formed from decision-making elements and applied extensively in many fields [
29,
30,
31]. The hierarchical structure consists of multi-levels where the main elements and sub-elements are placed, and the significance for the final level of the various levels defines the global values. The main steps of the conventional AHP are:
setting up the hierarchical structure of the decision problem,
formulating PCMs dependent on the hierarchy,
planning the questionnaire sample,
testing the accuracy,
aggregation by the geometric mean,
calculating weight vectors,
estimating the global ratings,
sensitivity evaluation.
The PCM is often a positive square
, where
is the quantitative measure between
and
, and
is the weight score from the
Table 1. The popular method of Saaty for PCMs can be determined using the following equation:
where the maximum eigenvalue of the
matrix is
.
For experiential PCMs: the reciprocity is indeed fulfilled for every PCM,
where
is provided. However, for empirical matrices, accuracy is most likely not achieved. Participants were invited to indicate how frequently each studied Park-and-Ride facility location factors were on a Saaty scale, as shown in
Figure 4 [
60] and
Table 2. The criteria for consistency were:
Empirical matrices are generally not congruent in the eigenvector method despite being filled in by the evaluators.
In order to examine the PCM consistency, Saaty invented an AHP consistency check, which guarantees that those matrices fulfill the appropriate inconsistency criterion [
60].
where CI is the Consistency Index and
is the maximum eigenvalue of the PCM, while
m represents the number of rows in the matrix. CR is determined by the following formula:
where RI is the average CI value of randomly generated PCM of the same size (
Table 3). In AHP method, the acceptable value of Consistency Ratio (CR) is CR < 0.1.
Sensitivity analysis allows perceiving the effects of alternates in the main element on the sub-element ranking and helps the decision-maker to check the stability of results throughout the process.
3.4. Best Worst Method
The Best Worst Method (BWM) was implemented to produce weights in criteria and sub-criteria while allowing less pair comparisons and offering a clearer comparison procedure. The key criterion for decision making is the best or the most important criterion or alternative, whereas the worst or less important criterion or alternative is the opposite. [
61,
62]. As part of a broad range of MCDM approaches, BWM is established. It is seen as a successful solution because of its data criteria, as well as being well-structured, transparent, easy to use, and producing accurate outcomes [
63]. The key distinction between the BWM approaches is based on pair comparisons and relies on the most significant and least critical parameters [
64]. The appeal of the BWM is motivated by its advantages, including multiple features that facilitate measurement and interpretation: fewer pair compared approaches, greater reliability, and output precision of calculated weight coefficients. Below, the key steps are quickly explained:
Determination of decision-making criteria;
Identifying the least (worst) and most important (best) parameters;
Identifying the most relevant (best) criterion of priority over all other metrics;
Identifying the least relevant (worse) criterion of all the less significant priority;
Testing for coherence;
Evaluation of values of weight.
We consider various elements () and then select and contrast the best part of the scale (designed from 1–9). This evaluation gives the best of the elements to others, and the adopted vector would be: , and obviously . However, the worst element to other vectors would be: by adopting the same scale.
The optimal weights were obtained, and the concordance values were checked by calculating the coefficient of concordance by the use of the following formula:
The consistency index values are shown in
Table 4:
In order to achieve an optimum weight for all components, the maximum differences should be indicated
and
, and for all
is minimized. Assuming a positive sum for the weights, the following problem is solved:
The conflict can be described in the following scenario:
By solving the mentioned problem, the optimal weights are obtained and .
3.5. The Proposed AHP-BWM Model
Suppose that in a decision problem, there are n criteria structured in m levels. Thus, we have levels in the decision. Let us designate criteria at a certain level of the decision to indicate a criterion at a certain level where we have criteria.
and J is the group of all decision criteria as . In this sense, it refers respectively to the first criterion of the first level and so on.
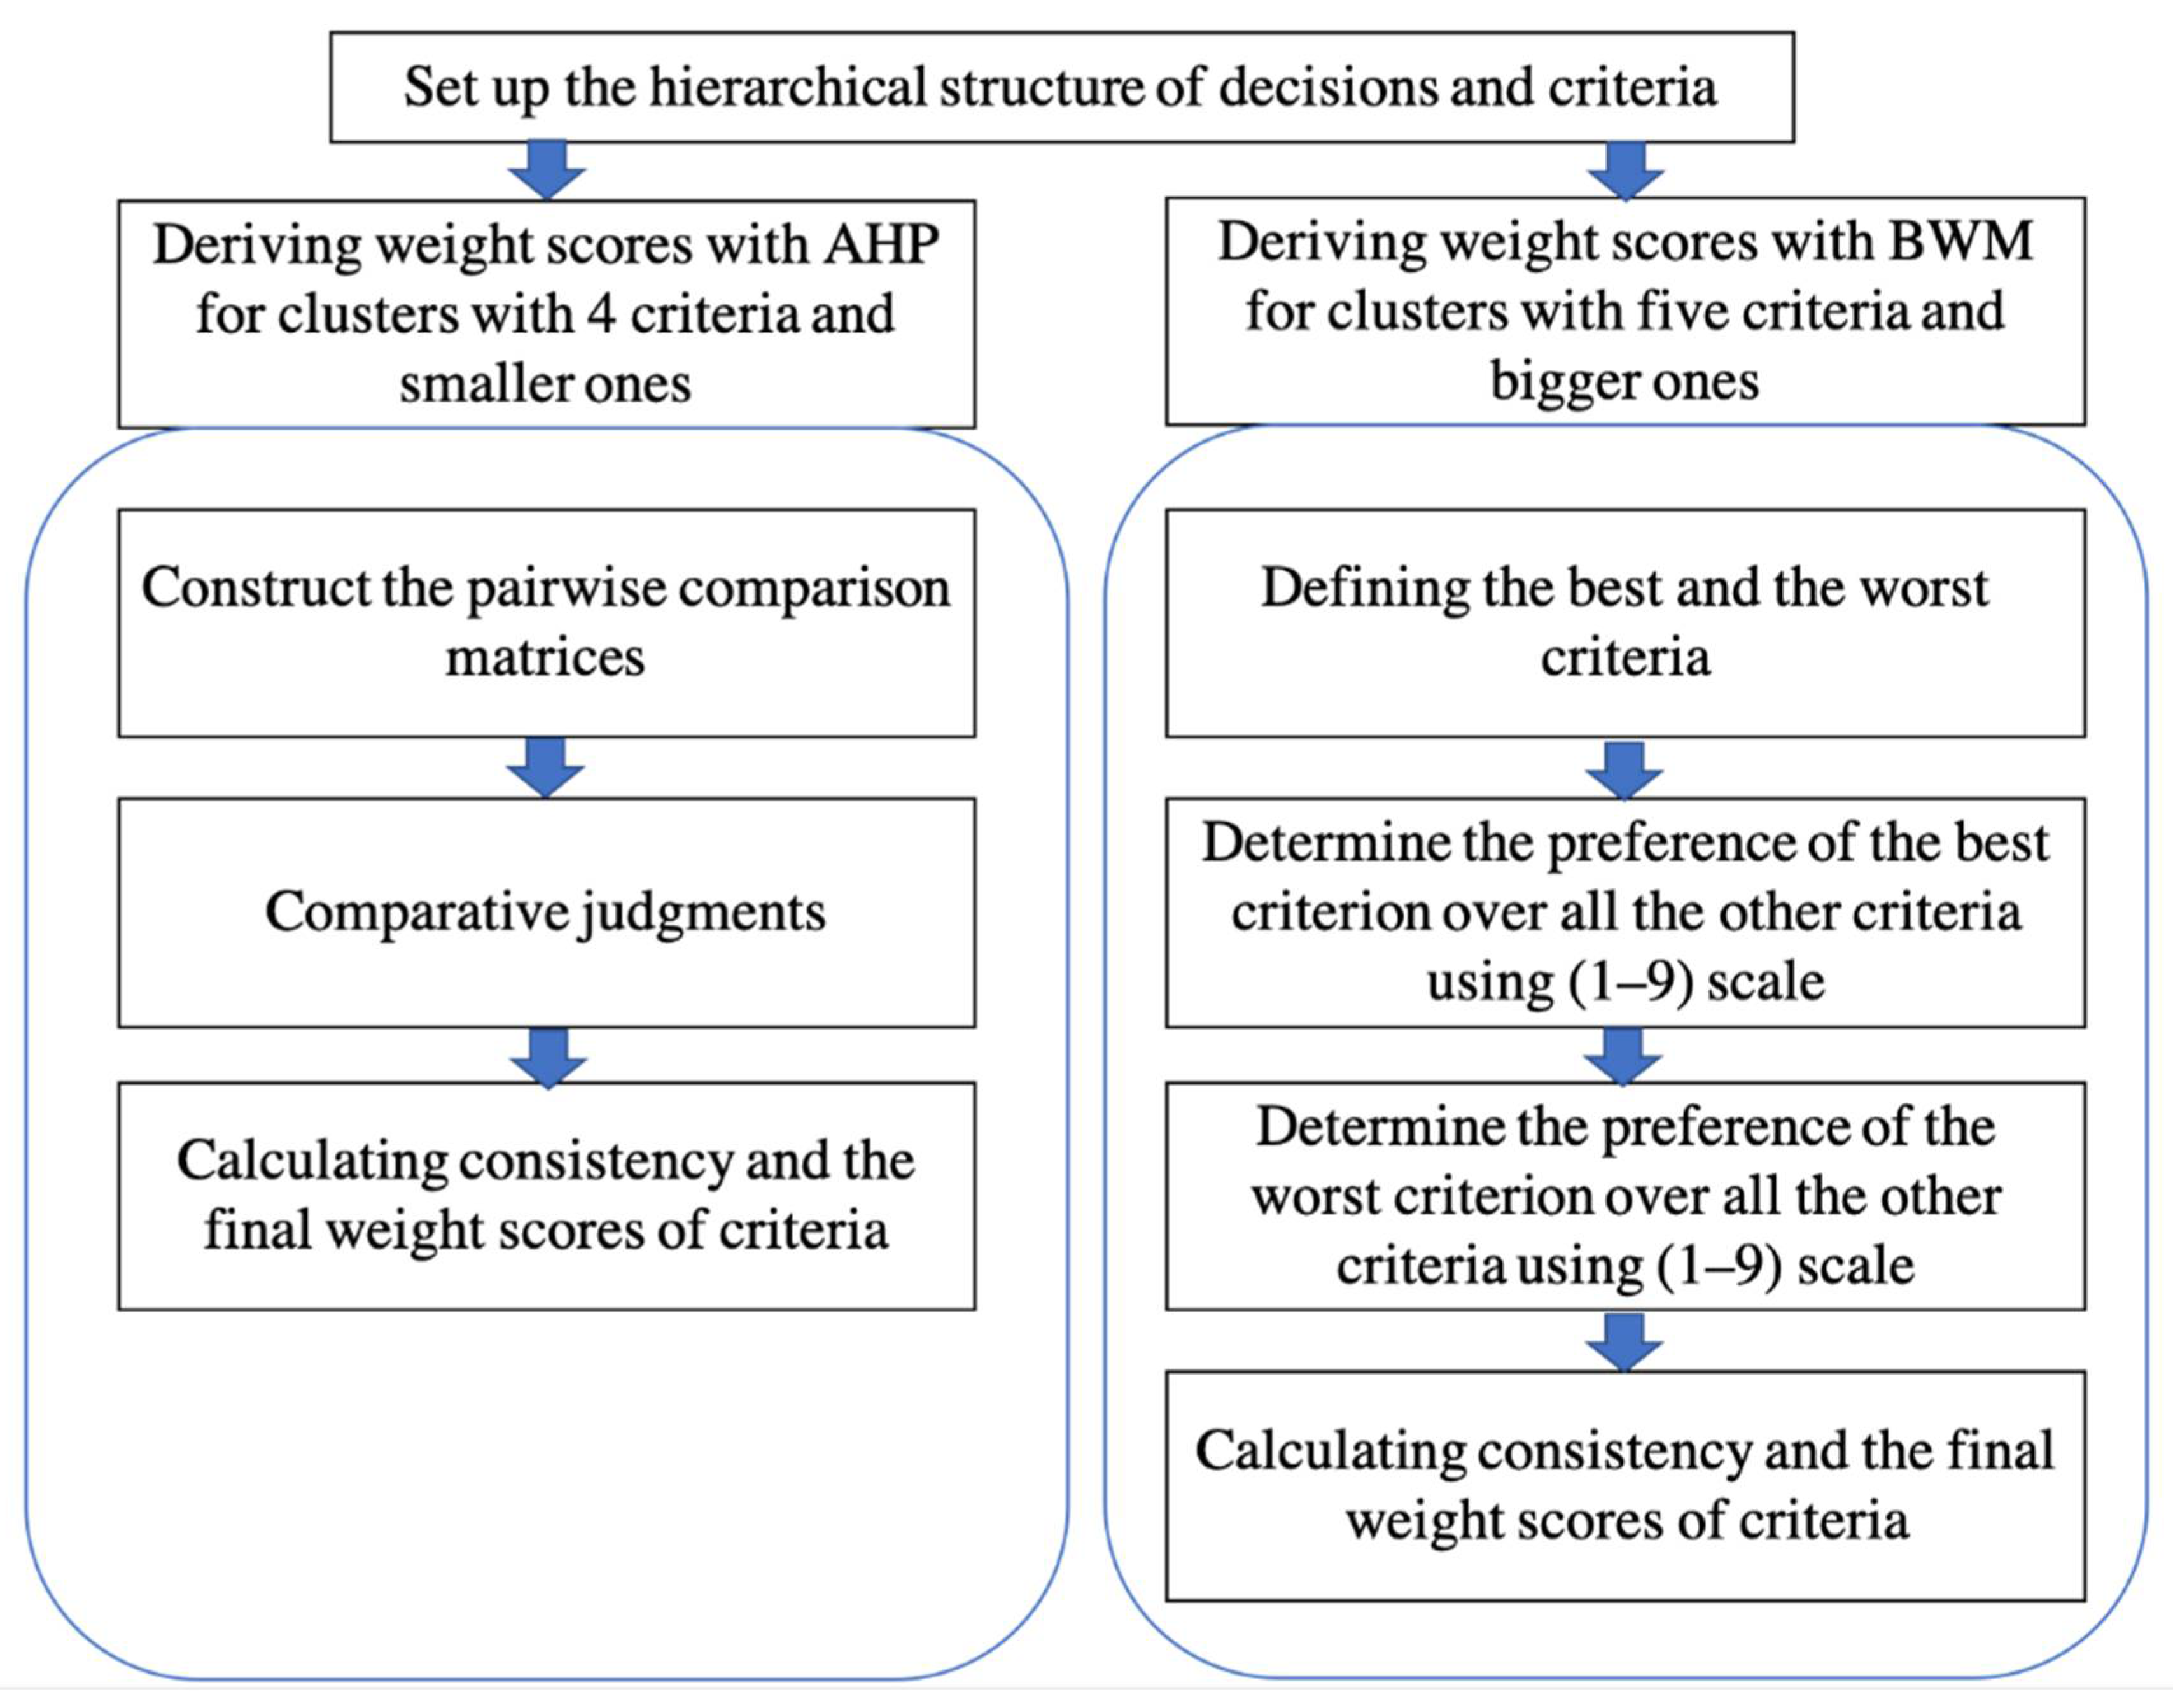
The first step in the proposed model is setting up hierarchical structure of decisions and alternatives, in the second step, the BWM approach has to be applied for the clusters, which contains 5 criteria or more, and AHP approach has to be applied for the clusters, which contains 4 criteria and smaller clusters. The proposed AHP-BWM model helps the evaluators to avoid the inconsistency issue during the evaluation process. Moreover, the model saves time and effort for both evaluators and experts, because in the AHP approach the evaluators need to evaluate pairwise comparisons (PCs), however, in the BWM approach the evaluators need PCs.
The main steps of the proposed AHP-BWM model are described in
Figure 5.
6. Discussion
The research carried out with transport planners in municipalities and local universities regarding the location of facilities in the P&R system allowed a fundamental assessment to be made of each factor that planners consider when placing a facility. As a result of this approach, the criteria that are considered most relevant can be identified.
To facilitate the interpretation of the data, the discussion section is divided into three parts. The first part focuses on level one of
Figure 1 and describes the level of relevance and the usefulness of taking all these criteria into account. The next part consists of a comparison between the sub-criteria belonging to the main criterion. Finally, the second level results, in which the 19 sub-criteria are ranked, are analyzed.
At the first level, each criterion in a sequence is defined, beginning with the most important one and going towards to the least important criterion. The C3 criterion of “accessibility to public transport” proved to be the most important. This is a rather rational outcome, since the second part of the journey is made by public transport in the P&R system. Accessibility of public transport also lies in the accessibility of the P&R system. After that is criterion C6, which refers to the “environment”; i.e., to minimize the adverse effects of cars in the city center. In order of importance, the following criterion is C4, which applies to all transport aspects in which the P&R system is implemented as part of the urban transport network. This derives from the fact that the P&R is connected to public transport. The following one is the “economic” criterion, C5, whereby, similar to all transport projects, the economic aspect of the project’s development focuses on the location and viability of the project. C1 is the penultimate criterion and refers to the shortest or longest distance from the P&R system, but transport planners do not consider it very relevant, because a private car is used in the first part of the journey. The lowest ranking criterion is C2, which applies to the route’s traffic conditions, because the second part of the journey is via a direct public transport line.
The principal criterion comprises several sub-criteria. Thus, criterion C1 is composed of two sub-criteria in which the C1.1 is more significant than the criterion C1.2. The explanation can be found in the fact that the first portion of the trip is made by a private vehicle; therefore, the distance that the user can travel in the first portion of the trip is also more relevant, compared to the distance of the user who makes the second part of the trip by public transport.
Sub-criterion C2.3 is the most prominent one within C2, and reflects the total travel time using the P&R system (private vehicle + parking time + bus time). In contrast, when comparing sub-criteria C2.1 and C2.2, the more prominent sub-criterion is travel time by public transport, meaning that the hourly operations of public transport are essential to ensure the accessibility of the system. The experts considered one of the most important aspects of the P&R system to be public transport.
Regarding the sub-criteria belonging to the main criterion, C3, C3.1, is the most important one, because it ensures connectivity with the other part of the journey, and C3.3 follows it. As described in the literature, this is one of the elements of the facilities that are part of the P&R system; thus, sub-criterion C3.2 is related to travel time.
In category C4, C4.2 was ordered first, which reflects that the demand for public transport is increased due to the potential users of the P&R system. C4.1, the decrease of private car journeys, is one of the main objectives of the P&R system and it is consequently one of the main components. C4.3 is connectivity and the number of existing public transport lines. C4.4 is the demand for parking in the P&R system. C5 involves the economic part of the project, and sub-criterion C5.2, which is the cost of land use, depends on the profitability of the project, followed by C5.1 and C5.3, which refers to the financial part of the operation of the P&R system. Sub-criterion C5.4 refers to the cost of implementation and maintenance.
Furthermore, the order of relevance of the sub-criteria of criterion C6 is pollution reduction, C6.1, followed by noise reduction, C6.2. These two sub-criteria relate to the undesirable effects of the private vehicles in the CBD that can be reduced with the implementation of a P&R system. Finally, C6.3 refers to the expropriation of land used principally for green spaces.
Level two of the hierarchy requires extensive explanation and has been divided into three categories for better understanding: most important (<6), mid-level important (6–12), and low-level important (>12). The most important criterion is C3.1, since specialists consider implementing a P&R system that ensures accessibility and connection to public transport to be essential, as the P&R system is a place of interchange between the private vehicle and public transport. In the second place, there is criterion C6.1, which reflects that the P&R system is a tool that reduces pollution in the CBD. C1.1 and C3.3 are sub-criteria that both relate to the distance from the origin to the facility in the P&R system and to the facility’s distance to the public transport station. C4.2 refers to the demand for public transport by users of the P&R system. C6.2 involves the undesirable effects of the private car, such as noise.
At a medium level of importance is C4.1, which refers to reducing private vehicle trips in the CBD. C3.2 is the travel time from the facility to the public transport station. C5.2 focuses on the cost of land use, in terms of expropriation or use of land to implement the P&R system. C2.3 is the total travel time using the P&R system. C4.3 relates to the number of transport connections connected to the P&R system. C6.3 is about the land occupied by the P&R system to be expropriated.
The sub-criteria levels considered not important for implementing the P&R system are C5.1, and C5.3, which relate to the economic aspects of project construction C2.2 focuses on general transport aspects, such as demand and travel time by public transport, which is guaranteed due to its connection or implementation of a direct public transport line. C5.4 refers to the maintenance cost, C1.2, which is the distance in the first portion of the trip. C 4.4 the demand on the P&R system that is guaranteed according to the demand of the total system. C2.1 is the lowest priority of all the criteria since it belongs to the first part of the route using a P&R system, which is done by private vehicle.
The research carried out is a tool for planning the P&R system in medium-sized cities with a P&R system or the wish to implement one. In Latin America, P&R is relatively new, and it would be interesting to carry out a study to compare Latin American and European cities. The most important thing is to guarantee the connection to the public transport system and, consequently, to encourage private vehicle users to make this change; and therefore, one of the main criteria is the accessibility to public transport.
7. Conclusions
Park-and-Ride facility location problems have been considered an important and complex task for solving road issues because of the large amount of location data and its variation. The study conducted in this paper sets out the criteria and sub-criteria identified by transport planning specialists in developing a P&R system. A multi-criteria decision model is used to select the order of importance of criteria (MCDM). This novel approach to the location of P&R facilities is possible because it combines environmental, traffic and distance attributes. The AHP-BWM model enables us to identify, interpret, and know experts’ essential requirements for locating the ideal place for a P&R facility within a city’s urban environment. In comparison to conventional MCDM models, the approach offers a more excellent range. As the PCs are consistent, the models’ findings are better than those from the traditional models.
The AHP-BWM approach’s findings are more realistic than the conventional multi-criteria approach, mathematically representing the criteria properly considered by transport planning experts. The accessibility of public transport is thus the most crucial criterion. P&R should be linked to a city’s public transport connections, thus guaranteeing a strategic position in public transport stations. The P&R system is new in some Latin American cities. In scientific testing of the parameters used to locate P&R structures, some design parameters have a secondary function. For instance, a new approach is to apply this methodology to cities with a P&R framework and determine if these requirements are different from expert opinions.
Considering further research, many other AHP-BWM model applications are necessary to analyze different real-world characteristics. The objective benefits are clear, it provides faster and cheaper survey process, and undoubtedly the survey pattern can more easily be extended by this technique than applying the conventional AHP with a complex PC questionnaire. However, this paper merely provided one example, but many other applications can ultimately verify the technique. The combined AHP-BWM model will help the researchers to improve their future studies by improving the consistency with fewer PCs and save time for analyzing the collected data. However, the analysis process needs considerable time and effort from the experts, making it challenging to gather the various transport planners’ answers.
Multiple MCDM techniques (e.g., ELECTREE, TOPSIS, machine learning) should be adopted in fuzzy environment for future study. The combination of this model and another broader model group, such as the geographical approach. A discrepancy between cities with P&R will bring new ideas to light. A study where experts and potential users are consulted will allow us to evaluate the requirements to be improved in the implementation and design of the P&R system.


 ,
, 


