Article

Spatio-Temporal Patterns of Global Population Exposure Risk of PM2.5 from 2000–2016

College of Geography and Environmental Science, Northwest Normal University, Lanzhou 730070, China
*
Author to whom correspondence should be addressed.
Sustainability 2021, 13(13), 7427; https://doi.org/10.3390/su13137427
Submission received: 4 June 2021 / Revised: 27 June 2021 / Accepted: 28 June 2021 / Published: 2 July 2021
(This article belongs to the Section Air, Climate Change and Sustainability)

Abstract

:
A high level of fine particulate matter (PM2.5) has become one of the greatest threats to human health. Based on multi-source remote sensing data, the pollutant population exposure model, accompanied by the Theil–Sen Median and Mann–Kendall methods, was used to analyze the spatio-temporal patterns of global population exposure risk of PM2.5 from 2000 to 2016. The population distribution patterns of high-risk exposure areas have been accurately identified; the variation trend and stability of global population exposure risk of PM2.5 have also been analyzed. According to the results, the average concentration of PM2.5 is correlated with the total population. The average concentration of PM2.5 for countries from high to low are Asia (14.7 μg/m3), Africa (8.1 μg/m3), Europe (8.03 μg/m3), South America (5.69 μg/m3), North America (4.41 μg/m3), and Oceania (1.27 μg/m3). In addition, the global average population exposure risk of PM2.5 is decreasing annually. Specifically, China, India, Southeast Asia, and other regions have higher exposure risks. Less developed mountainous regions, cold regions, deserts and tropical rainforest regions have lower exposure risks. Moreover, Oceania, North America, South America and other regions have relatively stable exposure, whereas areas with relatively unstable exposure risk of PM2.5 are mainly concentrated in Asia, India, and eastern China, followed by Southeast Asia, Europe, and Africa. Furthermore, Asia has the largest population of all the continents, followed by Africa and Europe. Countries with increased populations are mainly distributed in Africa, whereas the countries with a declining population are mainly distributed in Europe. Based on this, it is important to identify the relationship between PM2.5 concentration and population exposure risk to improve human settlements and environmental risk assessment.

1. Introduction

Due to the continuous growth of the global manufacturing scale and population, energy extraction, processing, and consumption are exponentially increasing. The contradiction between resources, environment, and development has intensified, leading to great difficulties in the governance of ecological environments. Air pollution has become a global challenge to human health, production, and life. The World Health Organization has emphasized that air pollution is one of the main environmental risks affecting human health. PM2.5 (or particulate matter with an aerodynamic diameter ≤2.5 μm) is a solid particulate matter with an equivalent diameter less than or equal to 2.5 μm in aerodynamics [1]. It is the main form of air pollution and the leading cause of global non-communicable diseases [2]. Air pollution exposure refers to the state or process in which individual residents are exposed to air pollution by direct contact with air pollutants [3]. Scientific and accurate exposure assessment is a prerequisite for the risk prevention and control of PM2.5. Since the beginning of the 21st century, PM2.5 has not only become one of the main threats to human health but has also brought many challenges to the sustainable development of cities [4]. Scientifically identifying the changing characteristics and patterns of the spatial distribution of PM2.5 concentration and revealing the patterns of population exposure risk of PM2.5 are of great significance to the coordinated development of regional environmental protection and economy.
European and American countries, as well as the WHO, have stipulated an international standard for PM2.5 monitoring based on the results of epidemiological research on PM2.5 [1]. The international standard has three transitional goals. The annual average concentration and daily average concentration standards of PM2.5 are 35 μg/m3 and 75 μg/m3 in the first transition period and 25 μg/m3 and 50 μg/m3 in the second transition period, and 15 μg/m3 and 37.5 μg/m3 in the third transition period. At present, this standard has been widely adopted in the world [5,6]. Previous studies have shown that long-term exposure to excessive PM2.5 increases the risk of lung diseases (such as lung cancer) [1,7], cardiovascular diseases [8], cerebrovascular diseases [9], etc., while also increasing the death rate [1,10,11]. Since the beginning of the 21st century, developed countries in Europe and North America, which were plagued by environmental pollution, have successfully dealt with pollution problems. The present environmental pollution is mainly distributed across developing countries. The report of State of Global Air 2019 released by the American Institute of Health Effects shows that the number of people who died of stroke, heart disease, lung cancer, diabetes, and chronic lung disease due to long-term exposure to outdoor and indoor air pollution in 2017 reached nearly 5 million worldwide, and 1.2 million in China.
At present, most research has been conducted on the spatial and temporal pattern and evolution of PM2.5 at different spatial scales [12,13,14]. Few have studied the exposure risk assessment for macro-level populations and the temporal and spatial changes of PM2.5. Most research uses air quality monitoring data to widely study the temporal changes and spatial patterns of PM2.5 nationwide, in regions (such as the Yangtze River Delta, Pearl River Delta, Beijing-Tianjin-Hebei) [15,16], provinces [17], as well as cities [18]. Some scholars have put PM2.5 monitoring values into space through spatial interpolation methods such as the Kriging interpolation, inverse distance weighted interpolation, and spline function interpolation to obtain the spatial data of PM2.5 [19]. Using Zhao County in Shijiazhuang as an example, Li et al. [20] selected 100 monitoring sites of PM2.5 as sample points to compare and analyze the accuracy of different interpolation methods on the spatial results of PM2.5. The aerosol optical depth (AOD) in satellite remote sensing data and the particle concentration observed on the ground are closely correlated [21]. Therefore, models such as the linear regression model [22], generalized additive model [23], geographic weighted model [24], BP neural network model [25], and support vector machines [26] can be used to construct the relationship between remote sensing retrieved AOD data and PM2.5, and assess PM2.5 mass concentration. While exploring the temporal and spatial changes of PM2.5, some scholars have also analyzed the composition of PM2.5 and its relationship with natural conditions such as meteorology [27], topography and vegetation, and social and economic activities such as population distribution, urbanization, energy utilization, to explain the source of PM2.5 and the reasons for its changes. With a deeper understanding of PM2.5 and its hazards, research on PM2.5 has gradually extended to the field of human health but mostly focuses on specific groups (such as the elderly and children) or microscopic assessment of individual exposure and health risks [28,29].
In recent decades, the exposure risk assessment of PM2.5 pays less attention to the exposure risk of large-scale groups. In addition, a common research paradigm and approach have not been established on this topic. Most of the existing studies only analyze the impact of PM2.5 exposure on human health from a micro perspective and lack a macro perspective and long-term evaluation of the temporal and spatial patterns of PM2.5 population exposure risk [30]. In the past, the population exposure risk of PM2.5 was mostly based on the analysis of an administrative unit scale, although social and economic factors such as population, gender, education level, and income can also be considered administrative regions. The research based on this type of data treats the population of each census block as a homogeneous entity and does not study the spatial heterogeneity in depth. Research on the exposure risk of the environmental population in previous years was mainly conducted in the disciplines of epidemiology and environmental chemistry, and the research content developed from single pollutant to mixed pollutants, from individuals to groups, from statistical methods to model improvements. Traditional research on the population exposure risk of PM2.5 is based on administrative regions, which has defects in the continuity of time and space [31,32]. Some research relying on the census data and the data of PM2.5 from environmental monitoring sites ignore the internal spatial heterogeneity and splits the spatial units, which is not conducive to pollutant prevention and control from a macro perspective [33]. For the census data, the credibility is high, but the time resolution updated every decade or more meets neither the real-time change of exposure risk nor matches the data of PM2.5. In recent years, with the wide application of the pattern-scale-driving force paradigm in the fields of geoscience and environmental science, as well as the rapid progress in the spatial and temporal resolution of remote sensing data, better data sources are provided to conduct environmental monitoring, pollution distribution, and exposure risk assessment on different temporal and spatial scales. Research objects include administrative regions, cities (groups), watersheds [34,35,36], and others. The research content mainly focuses on factor research, source analysis, migration paths, health risks, and policy governance of environmental exposure [37,38].
Mankind has only one earth, and all countries live in one world. It is the responsibility of everyone to build a community of shared future for mankind, protect the ecological environment, and resolve climate change issues. Based on the remote sensing data of global PM2.5 and population from 2000 to 2016, this article uses the pollutant population exposure risk model and the approaches of Theil–Sen Median and Mann–Kendall to analyze the temporal and spatial evolution patterns of PM2.5 in long-term time series and the evolution characteristics of global population exposure risk of PM2.5 on the pixel scale. This article also analyzes the stability of PM2.5 population exposure and explores the temporal and spatial evolution patterns of exposure risk. By showing spatial results of regional differences in the population exposure risk of PM2.5 globally, this article proposes differentiated and targeted response measures to PM2.5. Long-term quantitative studies of PM2.5 population exposure risk are helpful to analyze global exposure risk changes of PM2.5. They not only provide a reliable and detailed data basis for research on health effects and exposure risk of PM2.5, environmental management, and epidemiology, but also provide scientific references for the governance of the global atmospheric environment.

2. Materials and Methods

2.1. Data Source

The concentration data of PM2.5 used in this article comes from the Global Annual PM2.5 Grids from Moderate Resolution Imaging Spectroradiometer (MODIS), Multi-angle Imaging SpectroRadiometer (MISR), Sea-Viewing Wide Field-of-View Sensor (SeaWiFS) and Aerosol Optical Depth (AOD) with geographically weighted regression (GWR). The data was downloaded from NASA (National Aeronautics and Space Administration). The time series was from 2000 to 2016, and the spatial resolution was 0.01° × 0.01° (http://earthdata.nasa.gov, accessed on 10 October 2020). The PM2.5 grid data used GWR, which was retrieved from AOD data from MODIS, MISR and SeaWiFS. In order to determine whether the accuracy of the data met the research needs, this article collected accessible PM2.5 data monitored on the ground in three regions (Europe, Canada, and China). The data was matched with the remote sensing data, and three selected indicators including Coefficient of Determination (R2), Mean Prediction Error (MPE), and Root Mean Squared Prediction Error (RMSE), to verify the accuracy of the remote sensing data of PM2.5 mass concentration.
The population grid data comes from LandScan Global Population Grids (https://landscan.ornl.gov, accessed on 10 October 2020), and the spatial resolution is about 1km. LandScan collects high-precision census data and data on roads, slopes, land cover, night lights and city density in various countries using GIS technology and high-resolution remote sensing images to simulate the spatial distribution of a population. LandScan uses population-related indicative factors such as building areas and residential areas to check and verify the simulation results, thereby ensuring the accuracy of the data. Many scholars use LandScan to conduct research in different regions of China, verifying its applicability and accuracy [39,40]. This article uses the population data of various countries published by the World Bank (https://www.worldbank.org/en/home, accessed on 10 October 2020) to verify the LandScan population grid data. It uses GIS spatial zoning statistical tools to count the total population of each country in LandScan and compares it with the total population published by the World Bank for verification.
The vector base map of the world’s boundaries comes from standard maps on the website of the Department of Natural Resources of China (http://bzdt.ch.mnr.gov.cn/, accessed on 10 October 2020). It was drawn based on a world map with the approval number GS (2016) No. 1665. The base map was not modified.

2.2. Research Methodology

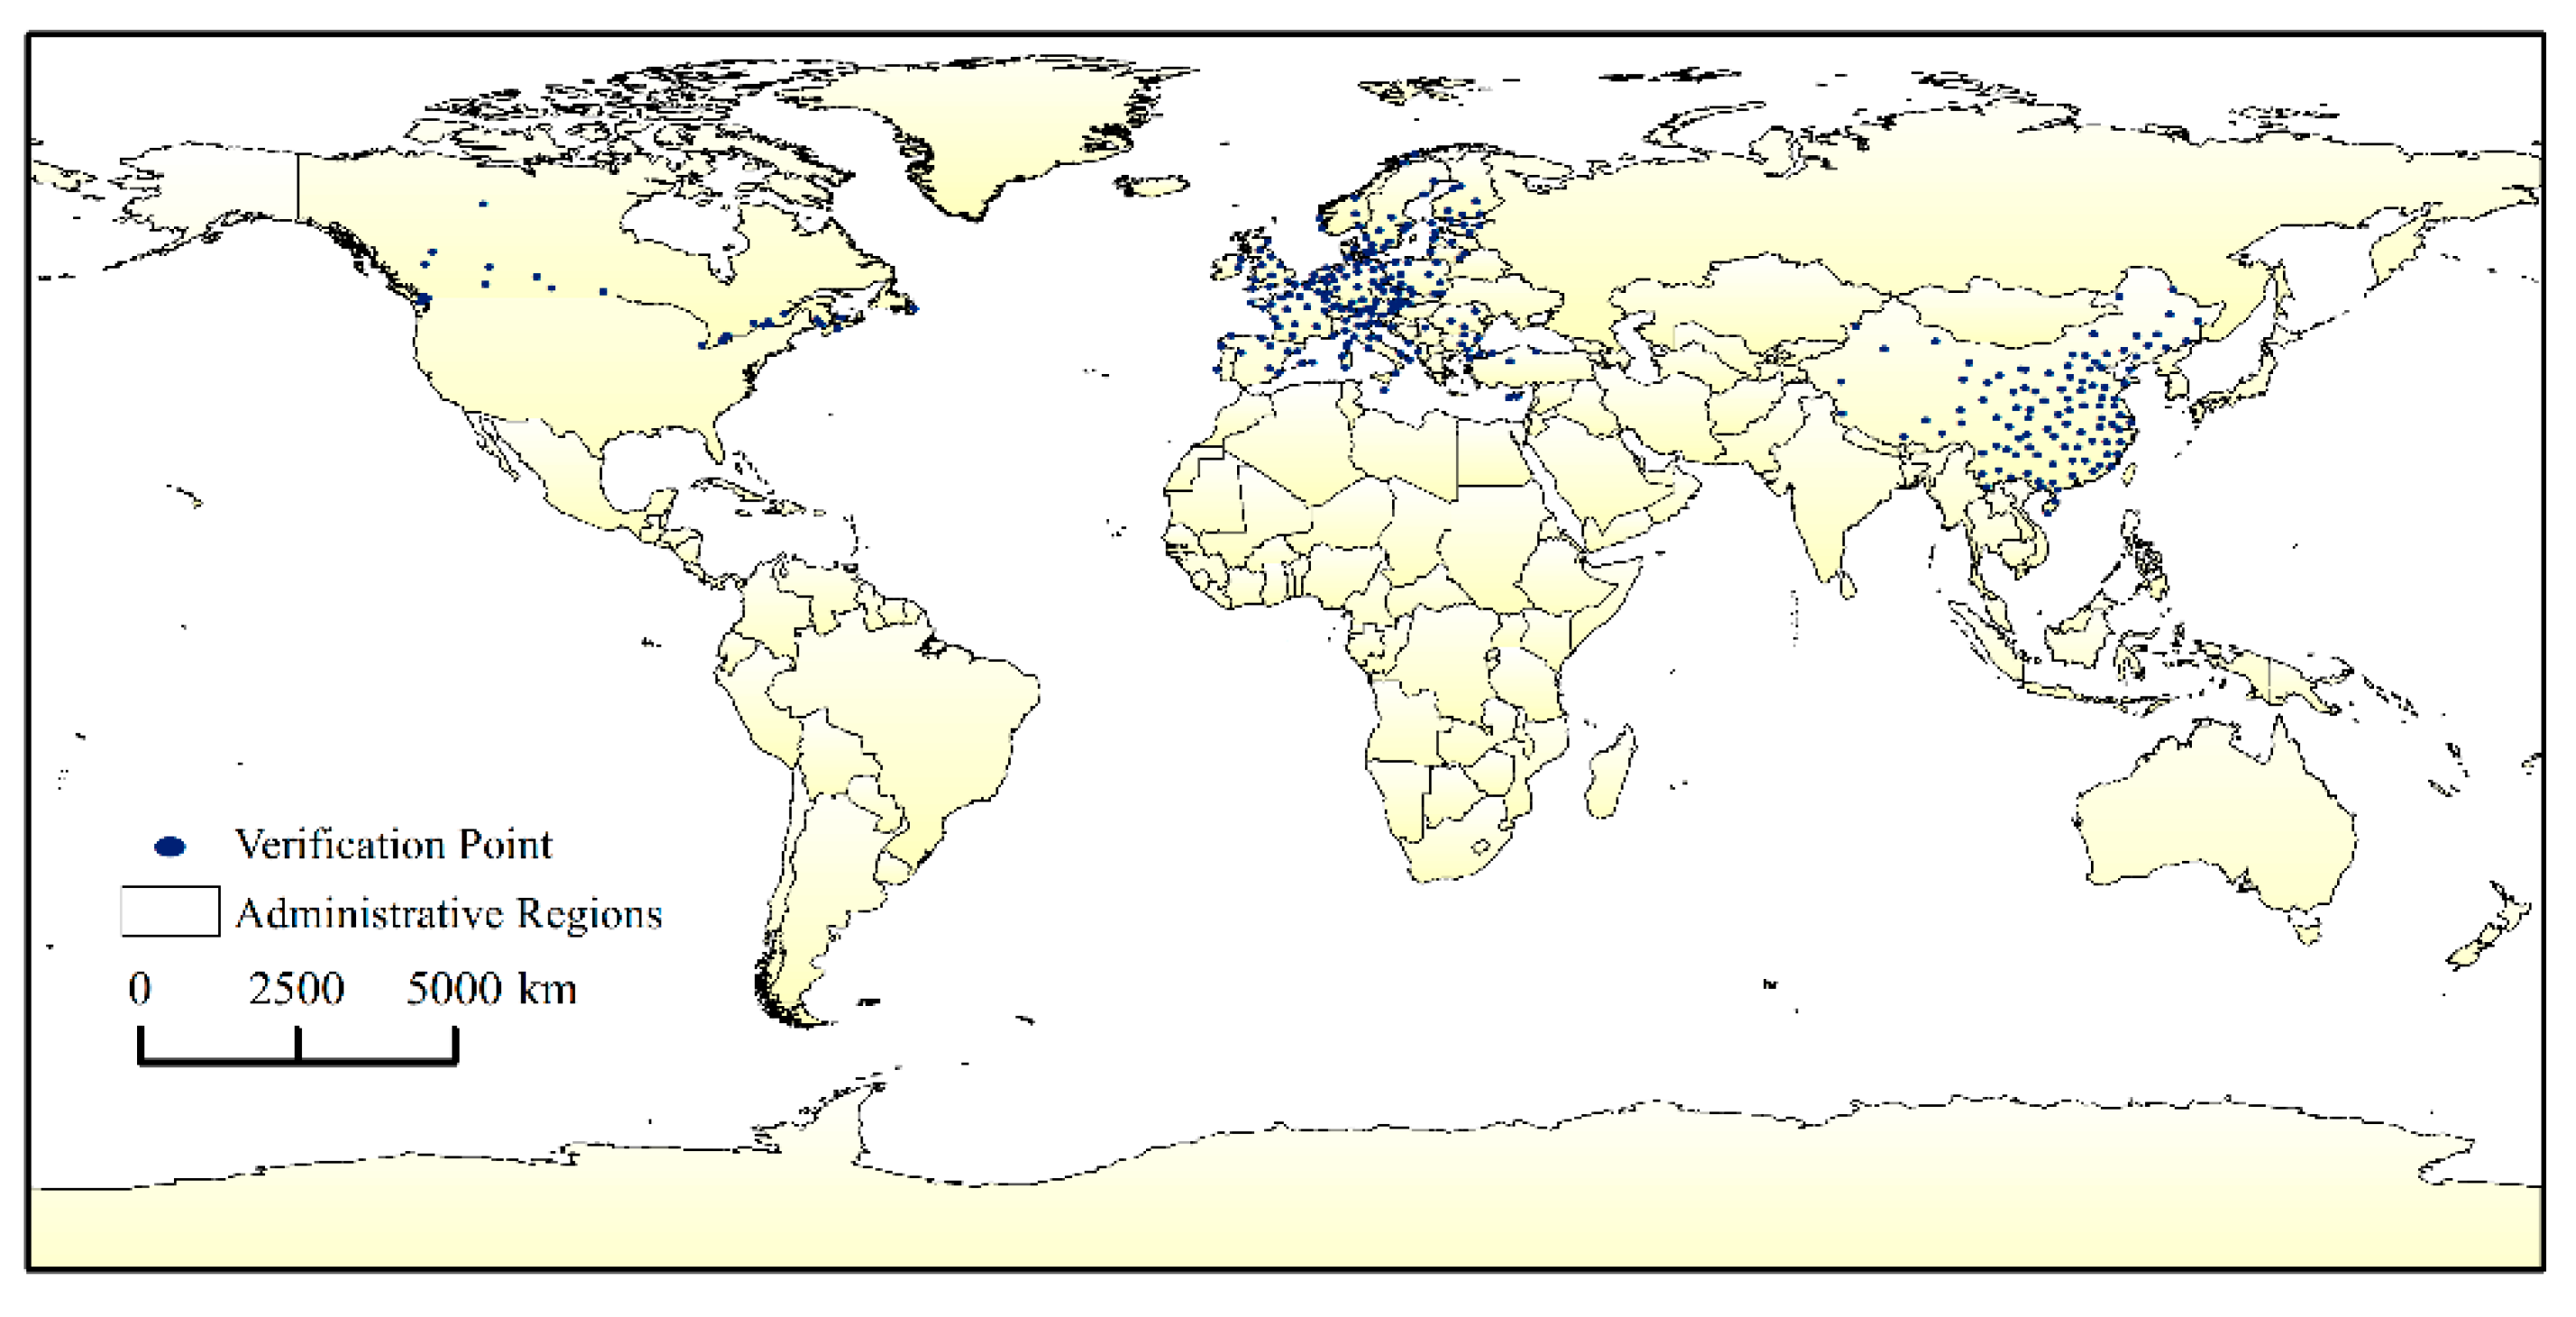
2.2.1. Accuracy Test of Remote Sensing Data

To comprehensively and objectively evaluate the estimation accuracy of the GWR spatial downscaling method used in this article, predicted values and observed values from the ground observation stations of R2, MPE and RMSE are used to evaluate the accuracy of the remote sensing data of PM2.5. The formula and specific definitions are as follows:
MPE = i = 1 n | P P M 2.5 P M 2.5 | n
RMSE = i = 1 n ( P P M 2.5 P M 2.5 ) 2 n
where PPM2.5 indicates remote sensing value; PM2.5 represents station observations; n represents the total number of modeling dataset records.

2.2.2. Calculation of Global Population Exposure Risk of PM2.5

The PM2.5 population exposure risk index can evaluate the exposure status in each pixel of raster [41,42]. The formula is as follows:
R i = P O P i × C i i = 1 n P O P i × C i n
where i denotes the grid number; Ri represents the PM2.5 population exposure risk index in grid i; POPi denotes the number of populations within grid i; Ci denotes the PM2.5 concentration value within grid i; n is the sum of the number of grid nets in the study area.

2.2.3. Trend Analysis

Theil–Sen Median trend analysis can simulate the changing trend of each grid. It does not require samples to form a certain distribution and is not interfered with by abnormal values. It has strong resistance to data errors and can objectively reflect the changing trend of PM2.5 population exposure risk in a long-term time series. The formula is as follows [43]:
S R = M e d i a n ( R j R i j i )   2000     i   j   2016
where SR is the slope of the fitted equation; Ri is the exposure risk index value in year i; Rj is the exposure risk index value in year j. SR > 0 indicates an increasing trend in the population exposure risk to PM2.5, and SR < 0 indicates population exposure risk to PM2.5 showing a decreasing trend.
The Mann–Kendall test is a non-parametric statistical test used to determine the significance of trends. The formula is as follows [44].
Setting the time series data i and j, 2000 ≤ ij ≤ 2016.
Z = { S 1 s ( S ) , S > 0 0 , S = 0 S + 1 s ( S ) , S < 0
S = j = 1 n 1 i = j + 1 n s g n ( R j R i )
sgn ( R j R i ) = { 1 , R j R i > 0 0 , R j R i = 0 1 , R j R i < 0
s ( S ) = n ( n 1 ) ( 2 n + 5 ) 18
where Ri and Rj denote the PM2.5 population exposure risk values in years i and j of the cell, respectively; n indicates time series; sgn(R) represents notation function. When |Z| ≥ Z1−α/2, the null hypothesis is rejected. Z1−α/2 is the standard normal variance, and α is the significance test level. When |Zc| is greater than or equal to 1.28, 1.64, and 2.32, it means that the significance test passed the 90%, 95%, and 99% confidence levels, respectively. It judges the significance of exposure risk over time series in α = 0.05 [45].

3. Results

3.1. Spatial Distribution Pattern of Global PM2.5 and Population

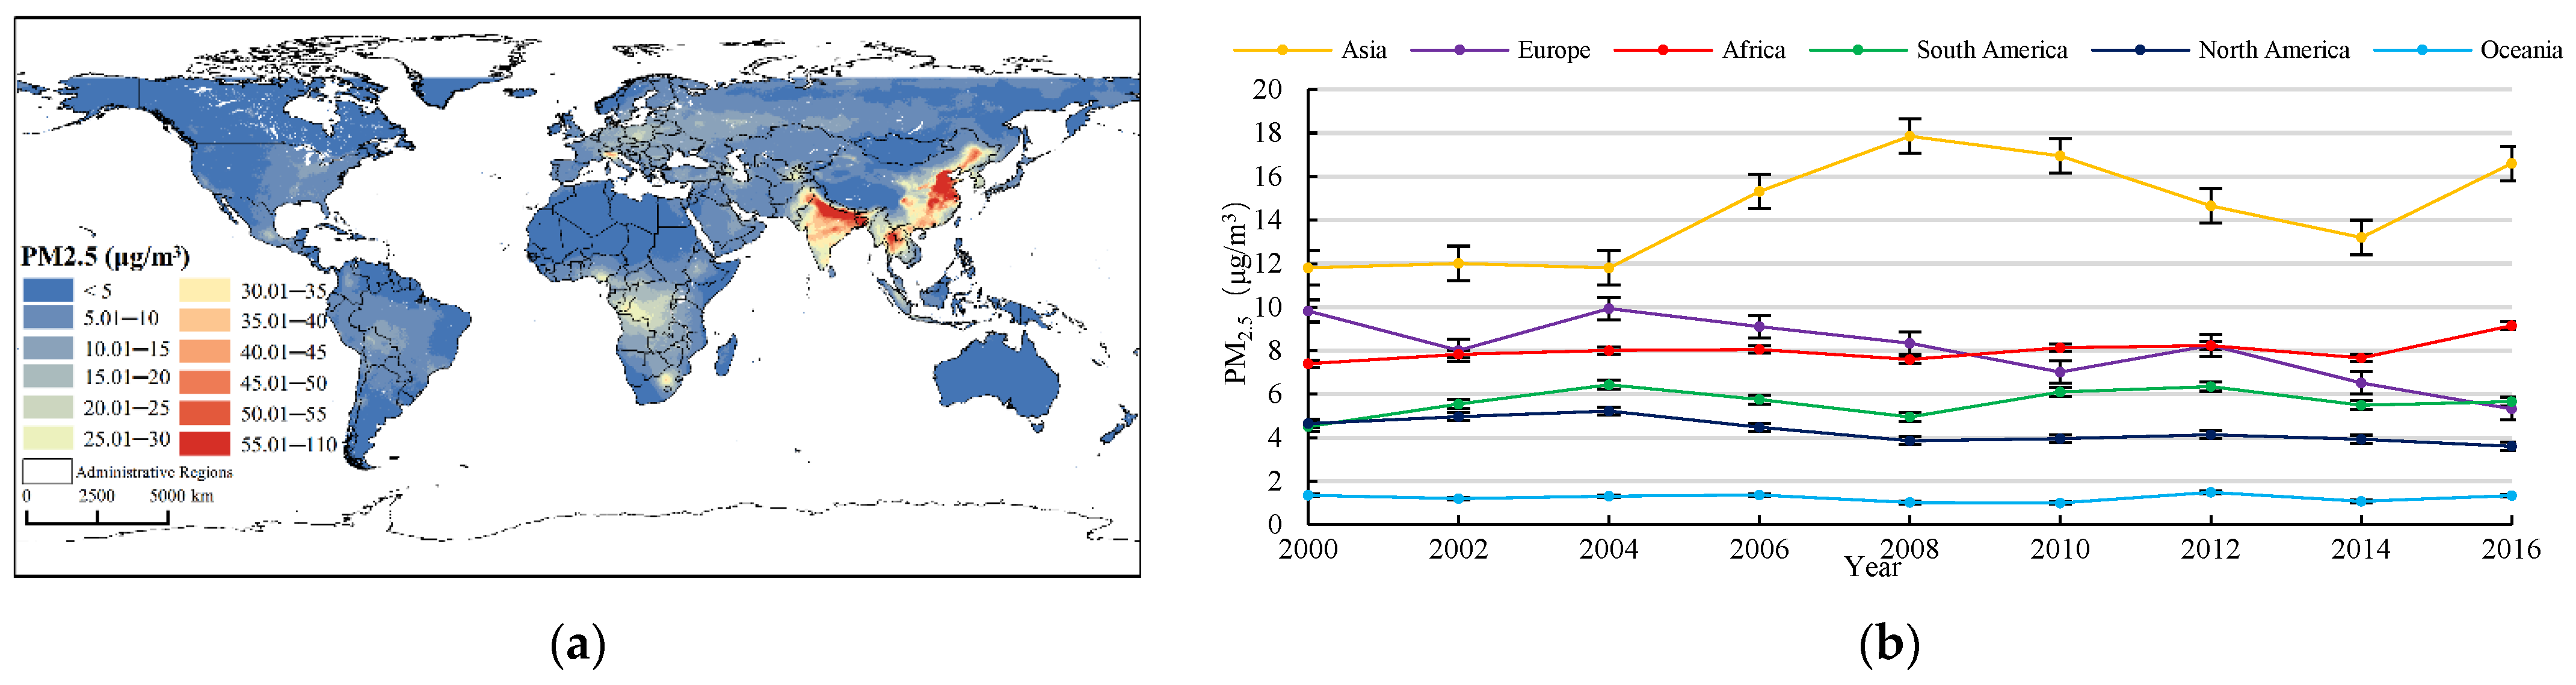
3.1.1. Spatial Distribution Pattern of Global PM2.5

The article ensures the reliability of the remote sensing data of PM2.5 by selecting China, Canada, and Europe as the verification regions and matching the data with annual averages of PM2.5 in the three regions until 2016. Since 2016, there have been 1542 environmental monitoring sites in China. This article ensured that the verification points were distributed as evenly as possible in space by selecting 230 verification points randomly in space. There are 1327 PM2.5 monitoring sites in Europe, from which 180 verification points were selected randomly. There are 30 monitoring sites in Canada, located mainly in the south, from which 12 verification points were randomly selected. Finally, a total of 442 sets of valid data were obtained. The spatial distribution is shown in Figure 1. This study conducts the accuracy test to it.
After comparing the verification results of PM2.5 data in the three regions, this article finds that the EU has the highest R2, followed by Canada and China; Canada has the highest MPE and RMSE, followed by the EU and China. It can be concluded that PM2.5 data from the EU and Canada have high accuracy and good inversion results, whereas that of China is low. The average R2 of these three regions is 0.755, MPE is 3.512%, and RMSE is 4.739 μg/m3. On the whole, the accuracy of PM2.5 remote sensing data met the research needs and accuracy was ensured. The data has also been widely used in related research [12,46,47,48].
The spatial distribution of global and various continents average PM2.5 concentration from 2000 to 2016 is shown in Figure 2a. It can be seen that Asia has the highest concentration, followed by Africa, Europe and other continents. The average concentration of PM2.5 per unit is 14.7 μg/m3 in Asia, 8.1 μg/m3 in Africa, 8.03 μg/m3 in Europe, 5.69 μg/m3 in South America, 4.41 μg/m3 in North America, and 1.27 μg/m3 in Oceania. The current value of PM2.5 (2016) is 16.6 μg/m3 in Asia, 9.15 μg/m3 in Africa, 8.9 μg/m3 in Europe, 5.66 μg/m3 in South America, 3.6 μg/m3 in North America, and 1.34 μg/m3 in Oceania.
Figure 2b shows the PM2.5 concentration of various continents. It can be directly concluded that the PM2.5 pollution in Asia is much higher than in other continents; the average concentration of PM2.5 in 17 years is about 30 μg/m3, especially that in India and China. The areas with high PM2.5 concentrations in China are mainly distributed in the central part of the Northeast Plain and the triangle, an area surrounded by Beijing-Shanghai-Changde. The highly polluted areas of PM2.5 in South Asia are mainly distributed in India and Bangladesh, and the PM2.5 concentration in India shows a gradually increasing trend, with a 17-year annual average value of 33.36 μg/m3. The PM2.5 value in Europe is also relatively high, showing an increasing then decreasing trend. Highly polluted areas of PM2.5 are distributed in Poland, Czech Republic, Bulgaria, and Italy. The third highest is in Africa, where the PM2.5 concentration is spatially high in the middle, low in the north and south, high in the west and low in the east. The 17-year PM2.5 concentration in Africa shows a slowly increasing trend. The areas with increases are mainly distributed in the central and southern regions of Africa. The Sahara Desert in the northern region is inaccessible, so the PM2.5 concentration remains extremely low throughout the year.
The annual average PM2.5 value of North America and Oceania remained at a relatively low level; the average PM2.5 concentration in 2017 was 4.4 μg/m3 and 1.34 μg/m3, respectively. The two continents have a low population density with high industrial output value but low pollution due to the developed tourism industry in Oceania and the surrounding ocean so it is not affected by the diffusion of PM2.5 from other areas; therefore, the air quality is good. The economic development of South America is much lower than that of North America; it is an important agricultural product and the export regions of mineral resources have underdeveloped industries. The annual average concentration of PM2.5 is 5.69 μg/m3, which is slightly higher than that of North America.

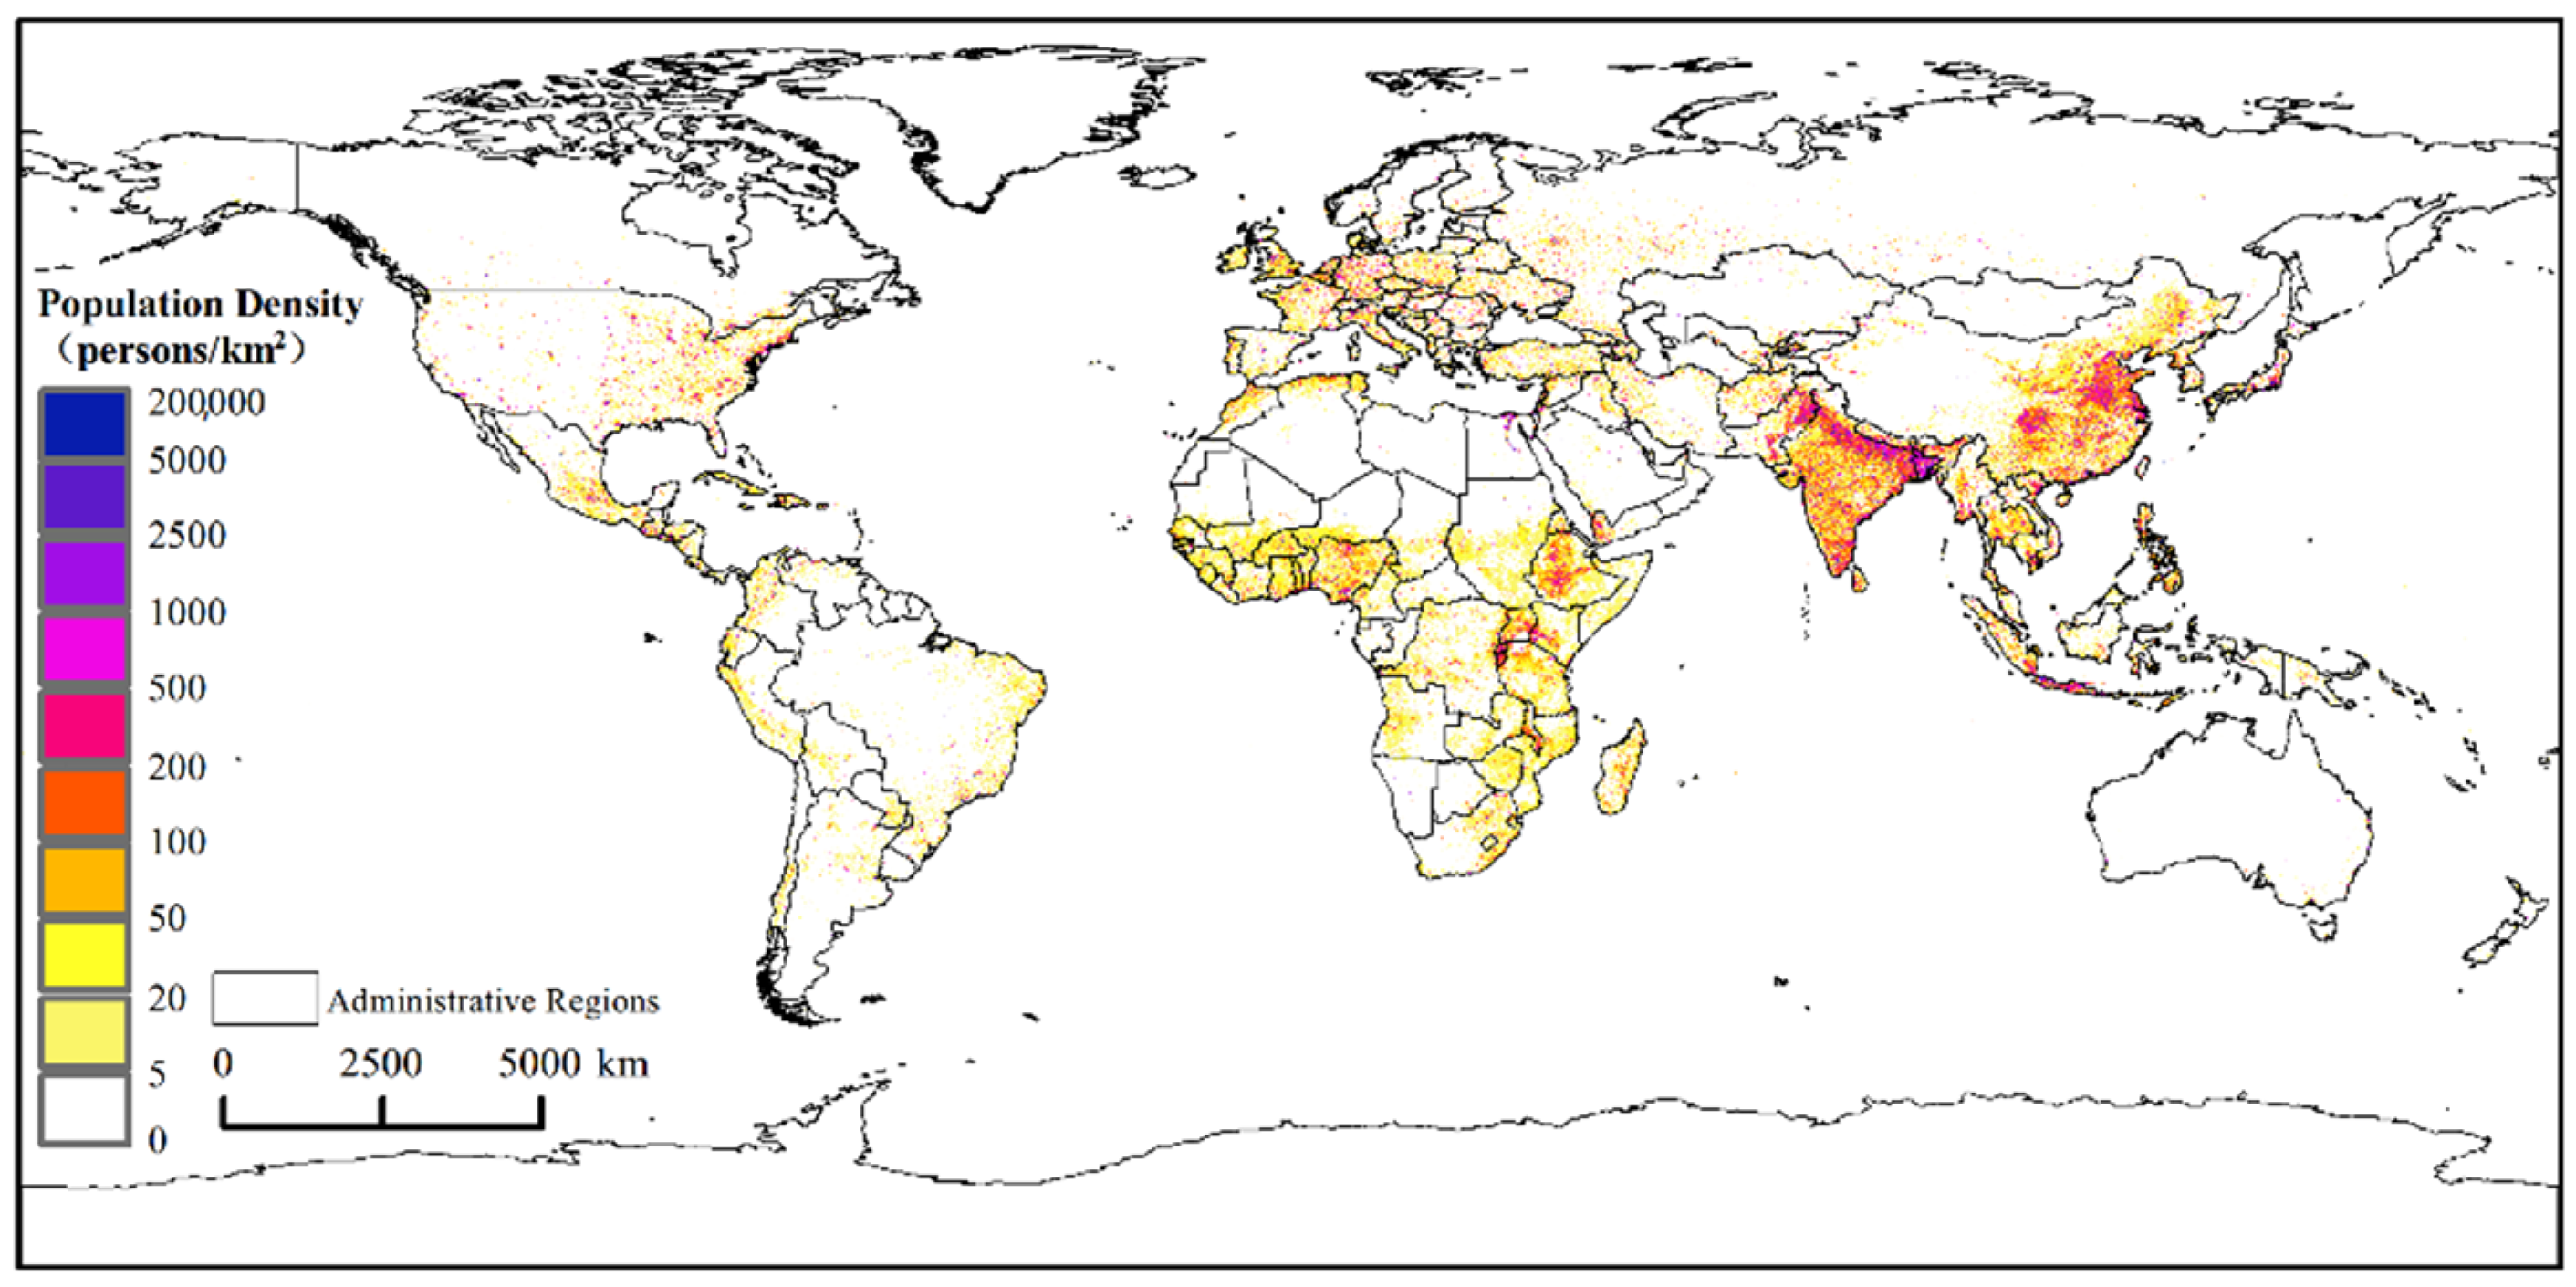
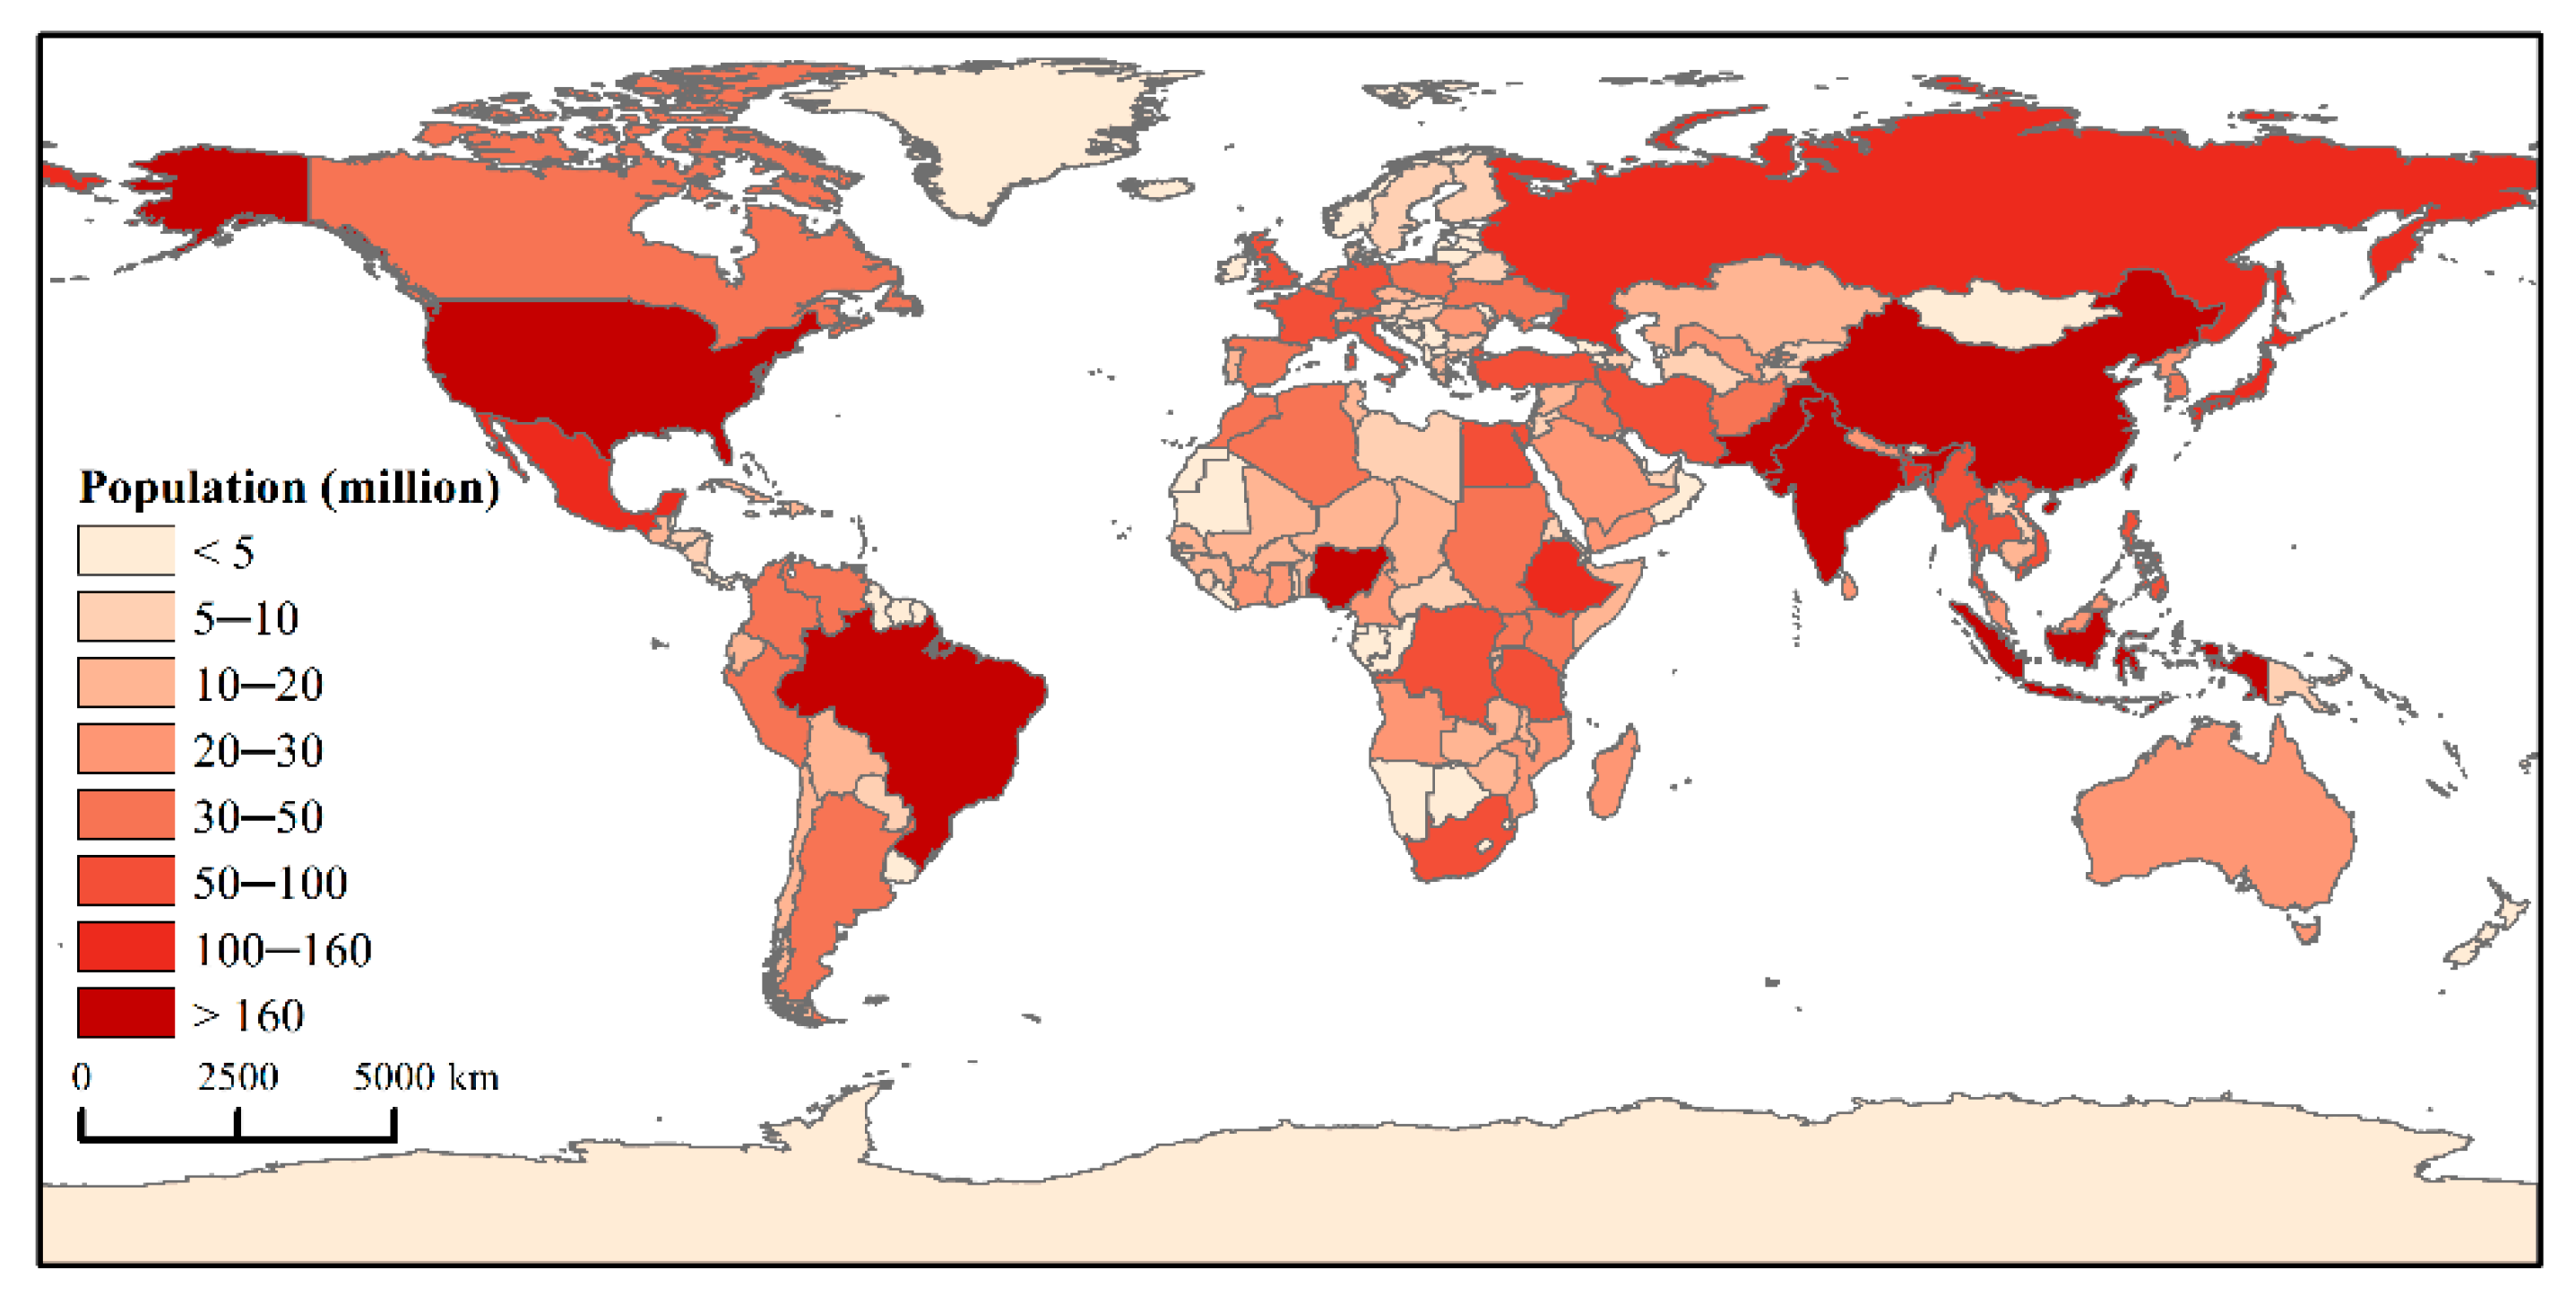
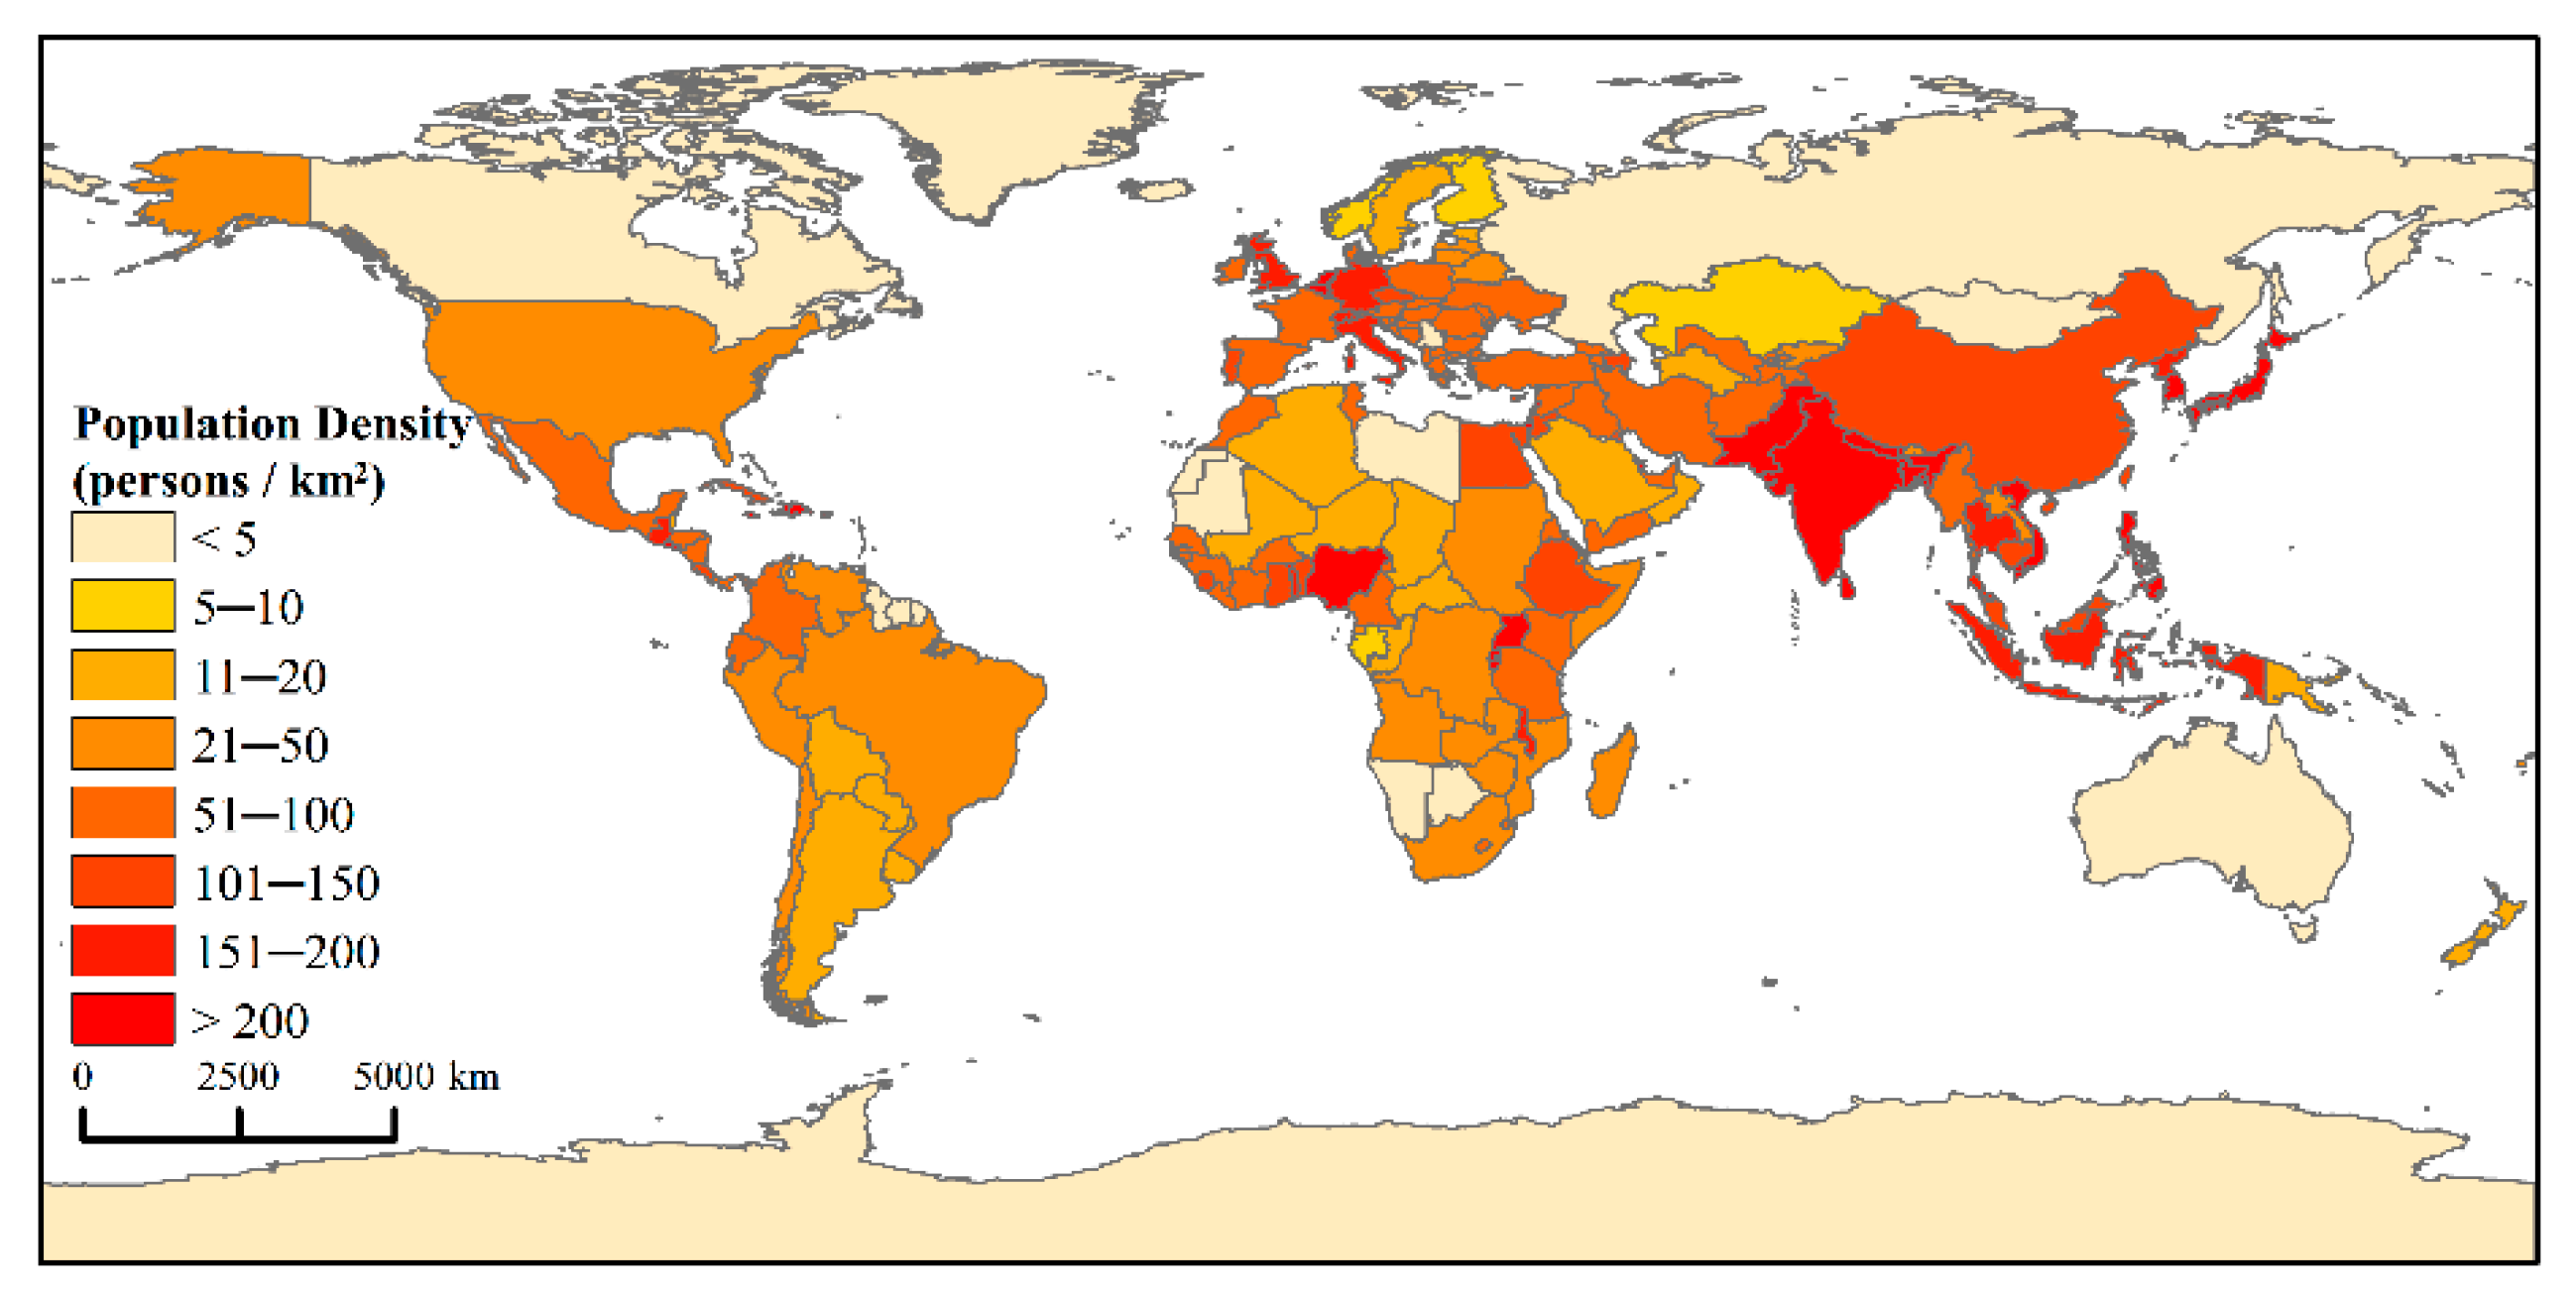
3.1.2. Spatial Distribution Pattern of Global Population

LandScan Global Population Grid data is the basic data for research on PM2.5 population exposure risk in this article, so it is necessary to ensure the accuracy of the population grid data. This article obtains the total population data of various countries in 2016 from the World Bank database, including 97 sets of valid data. Using the regional statistical tool of ArcGIS software, the total population of each country under the remote sensing data was counted. Through comparison with statistical data from the World Bank, this article verifies these 97 sets of data. It was found that the data is accurate, with 0.99 R2 (p < 0.001). The average deviation was only 2.43%.
In Figure 3, which shows the spatial distribution of the global population from 2000 to 2016, it can be seen that Asia has the largest population, followed by Africa, Europe, North and South America, and Oceania. Asia has the largest population base and land mass than that of other continents. In particular, the countries of China, India, Indonesia, and Japan account for about 40% of the global population. This massive population consumes a lot of resources and energy, and the processing and production of resources and energy have caused a large amount of PM2.5 emissions. On the contrary, serious PM2.5 pollution has a counterproductive effect on humans and affects human health. Countries where the population continues to grow are mainly distributed in Africa, and countries where the population continues to decrease are mainly distributed in Europe. The population growth rate of Africa is fast, and regions with the highest population densities are distributed in three regions, namely, the Nile River Basin, the Gulf of Guinea coast, and the Mediterranean coast. The population density in Europe is 20–50 persons/km2. The population density of North and South America is 0–25 persons/km2 with densely populated areas mainly distributed in the United States, Brazil, and Mexico. The population of Oceania is mainly distributed in the coastal areas of southeastern Australia and New Zealand.

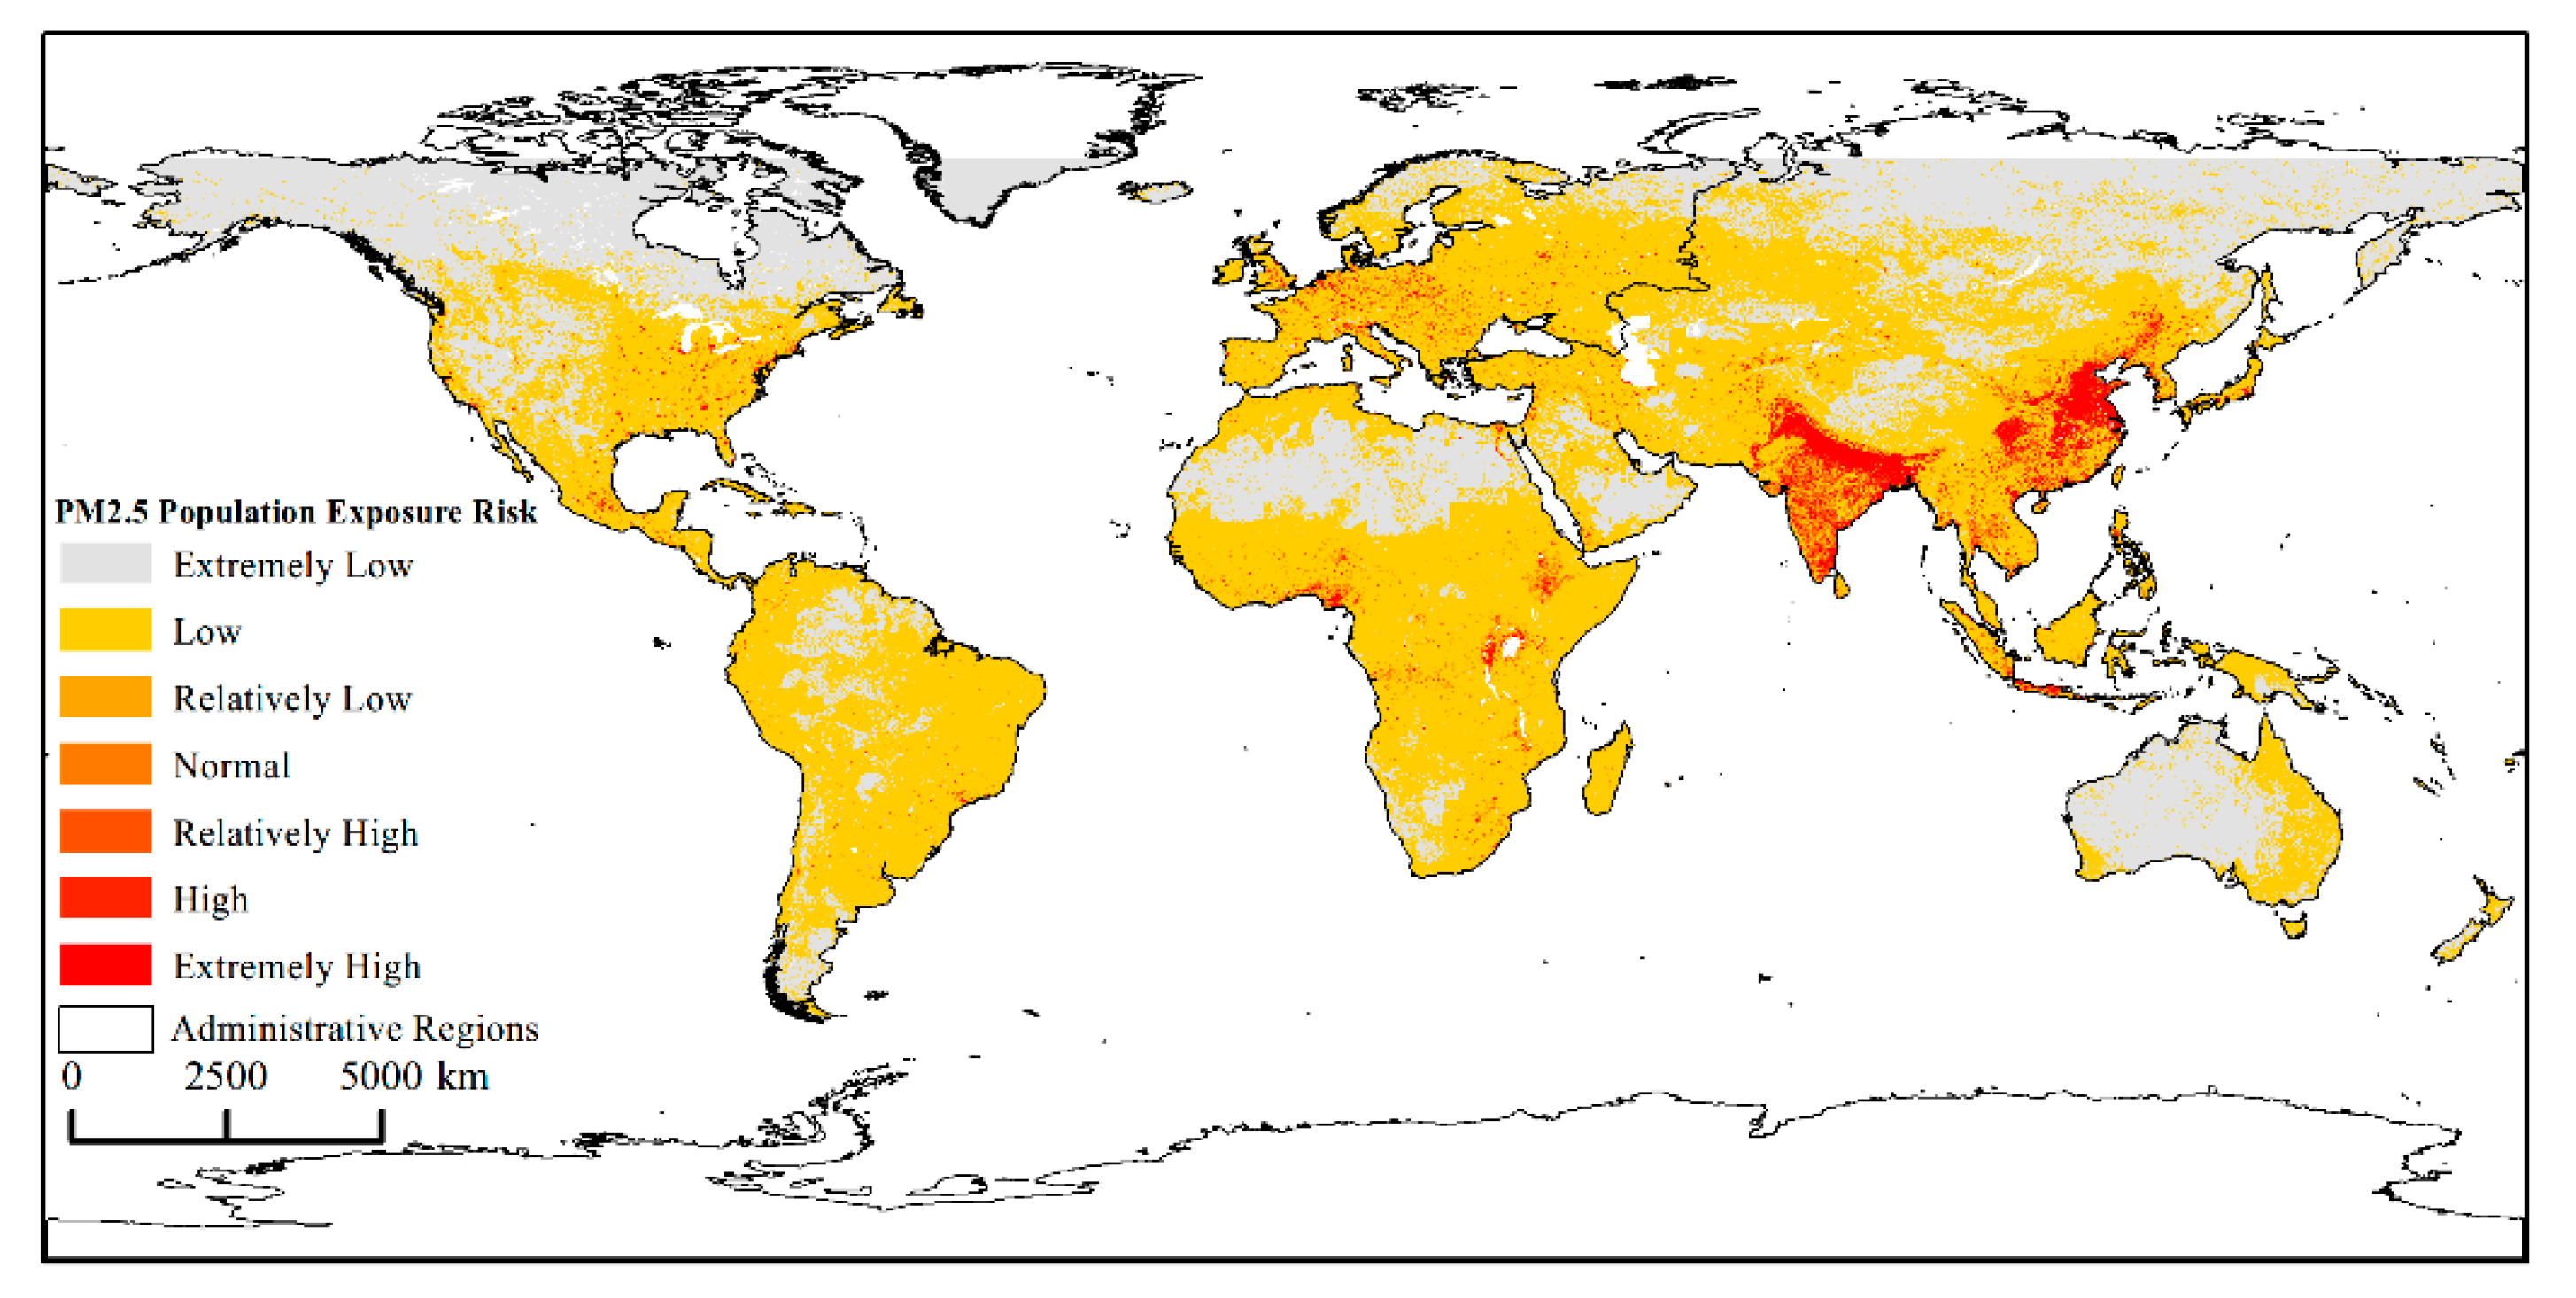
3.2. Distribution Pattern of Global Population Exposure Risk of PM2.5

This article divides the population exposure risk value (Ri) of PM2.5 into seven levels: extremely low risk, low risk, relatively low risk, general risk, relatively high risk, high risk, and extremely high risk [34,49]. Table 1 shows the detailed descriptions.

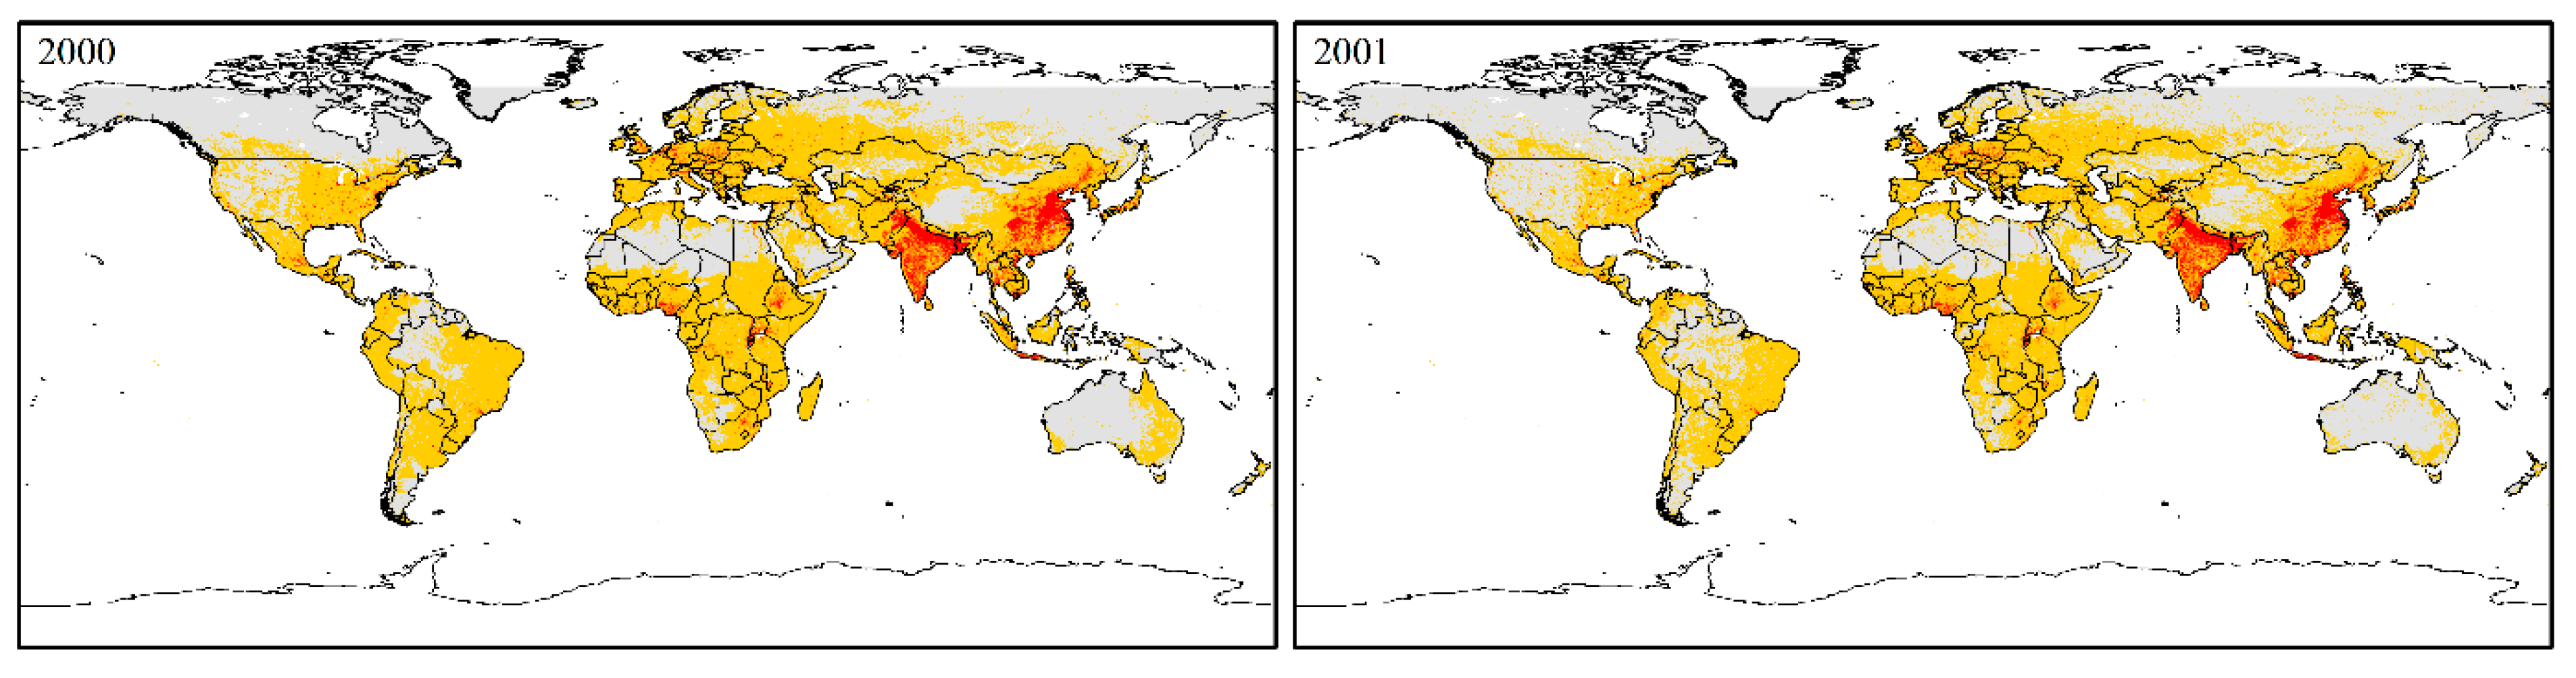
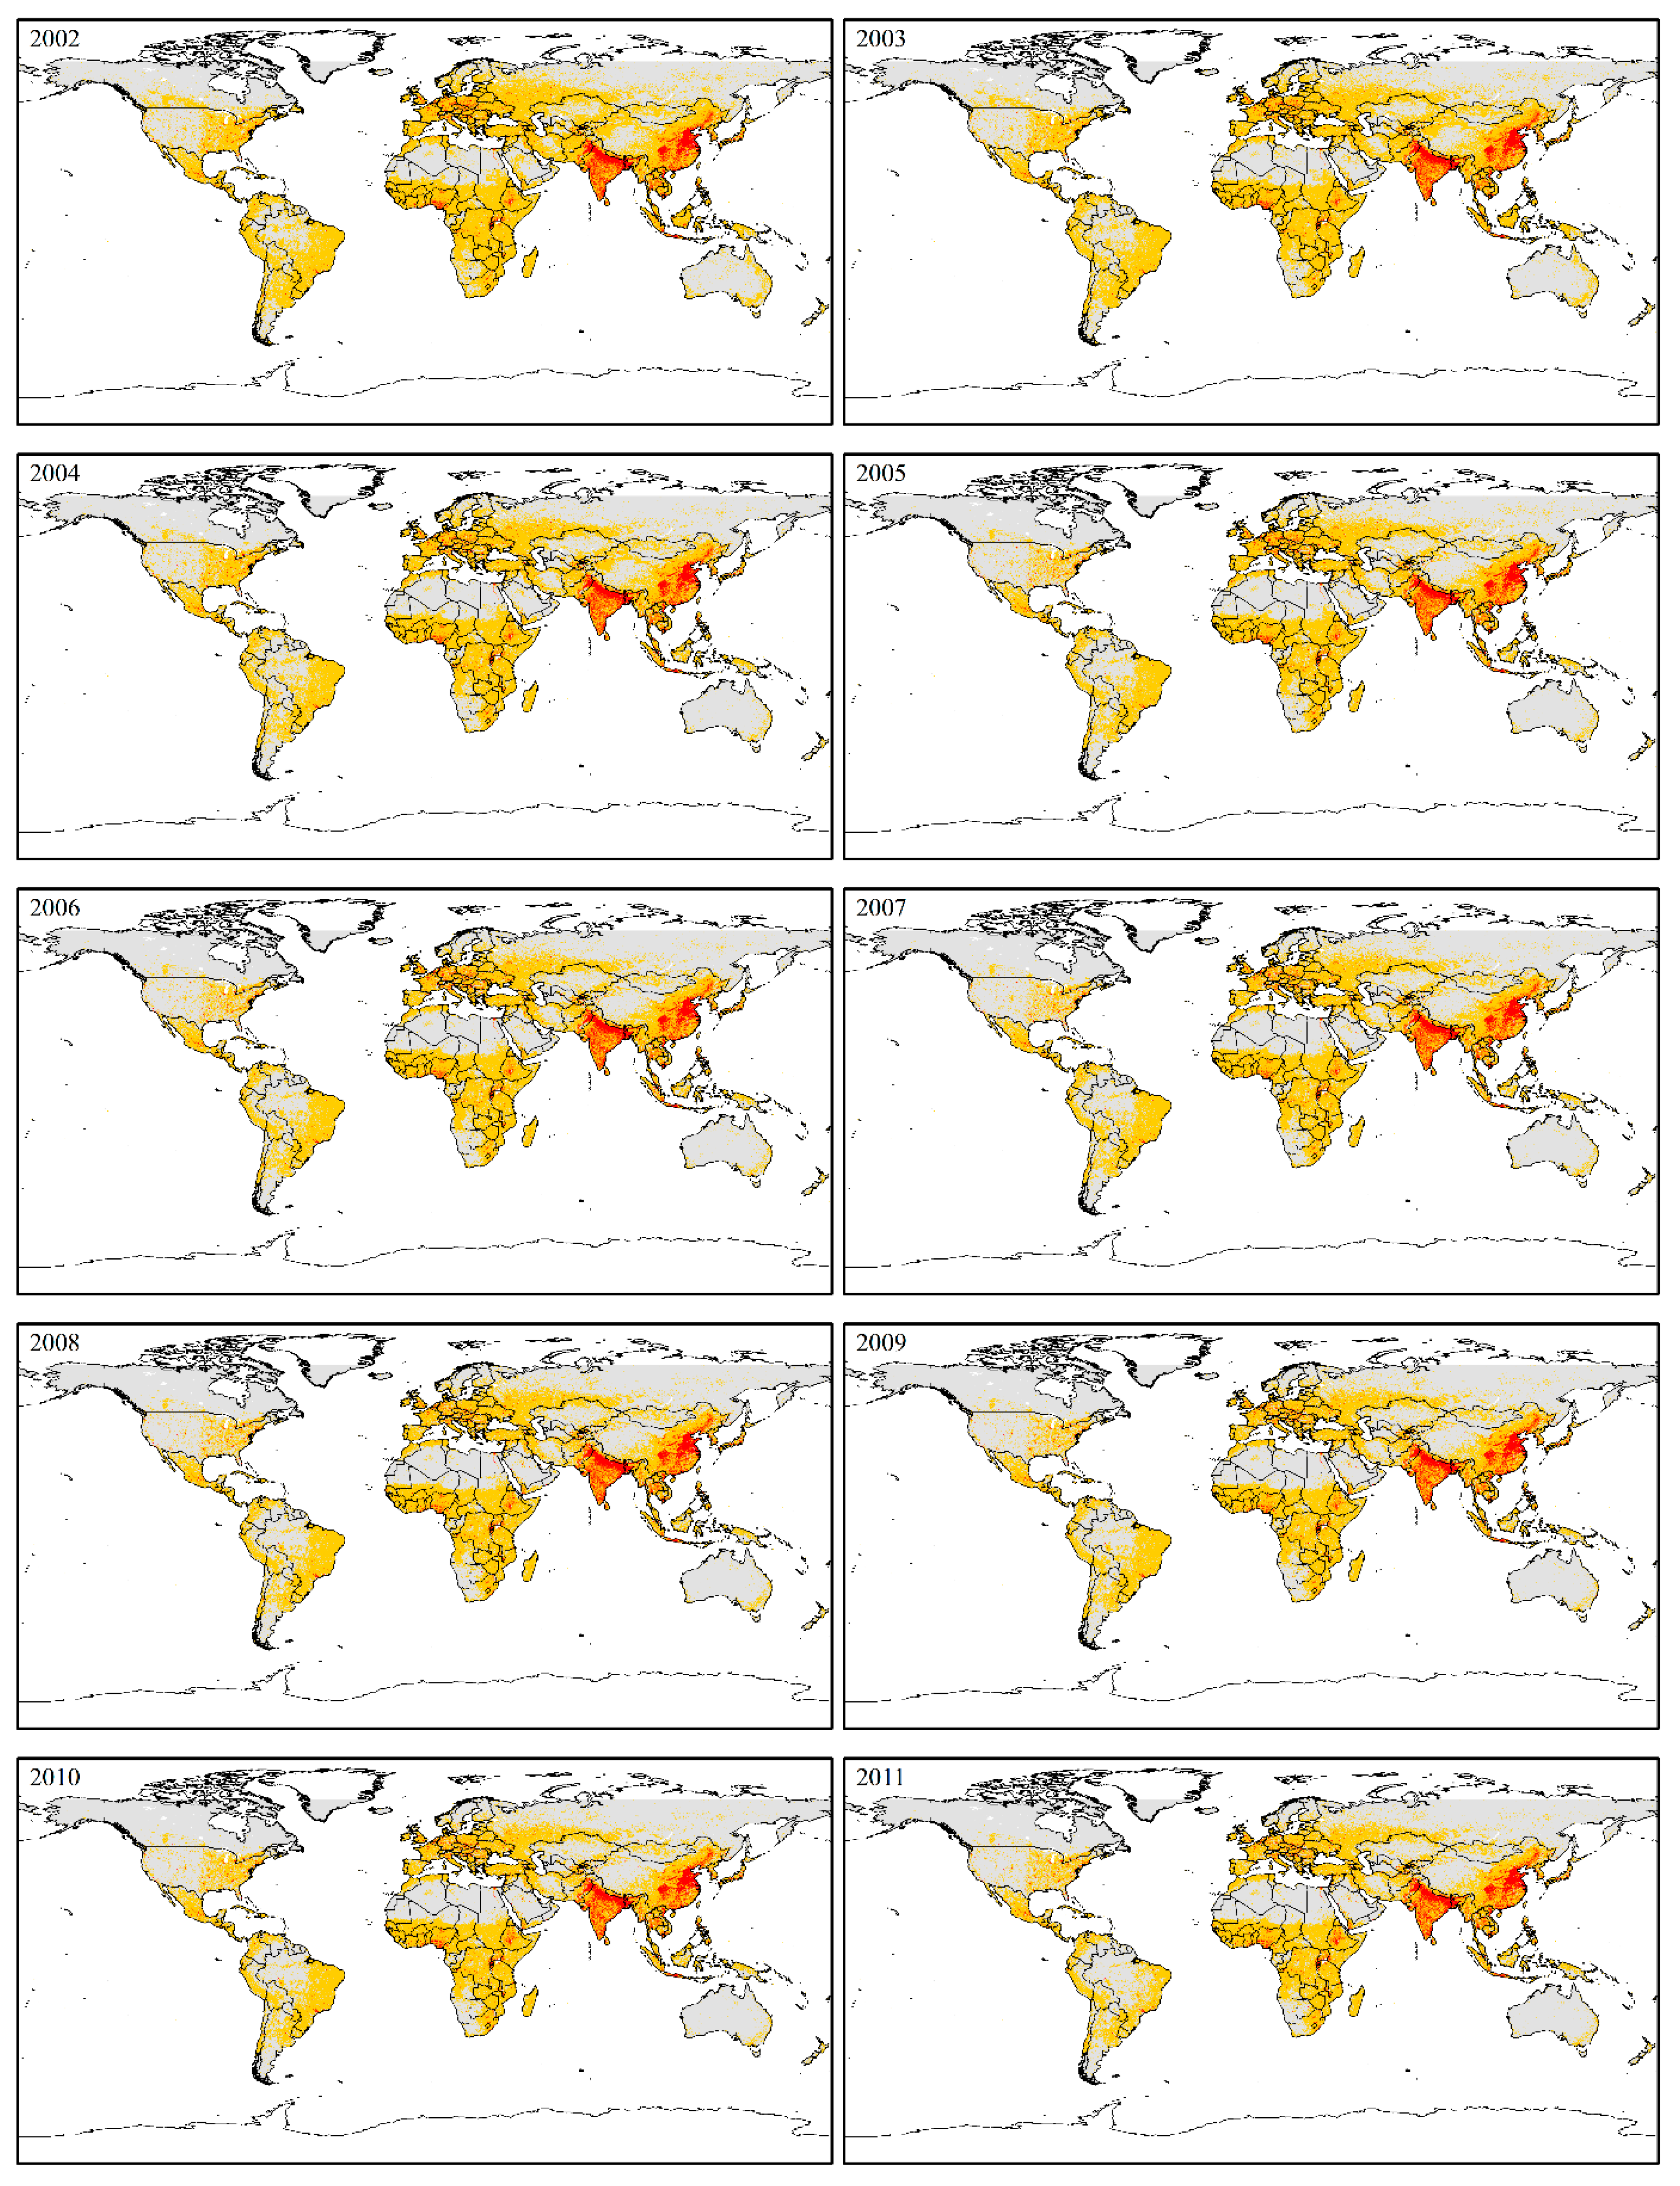
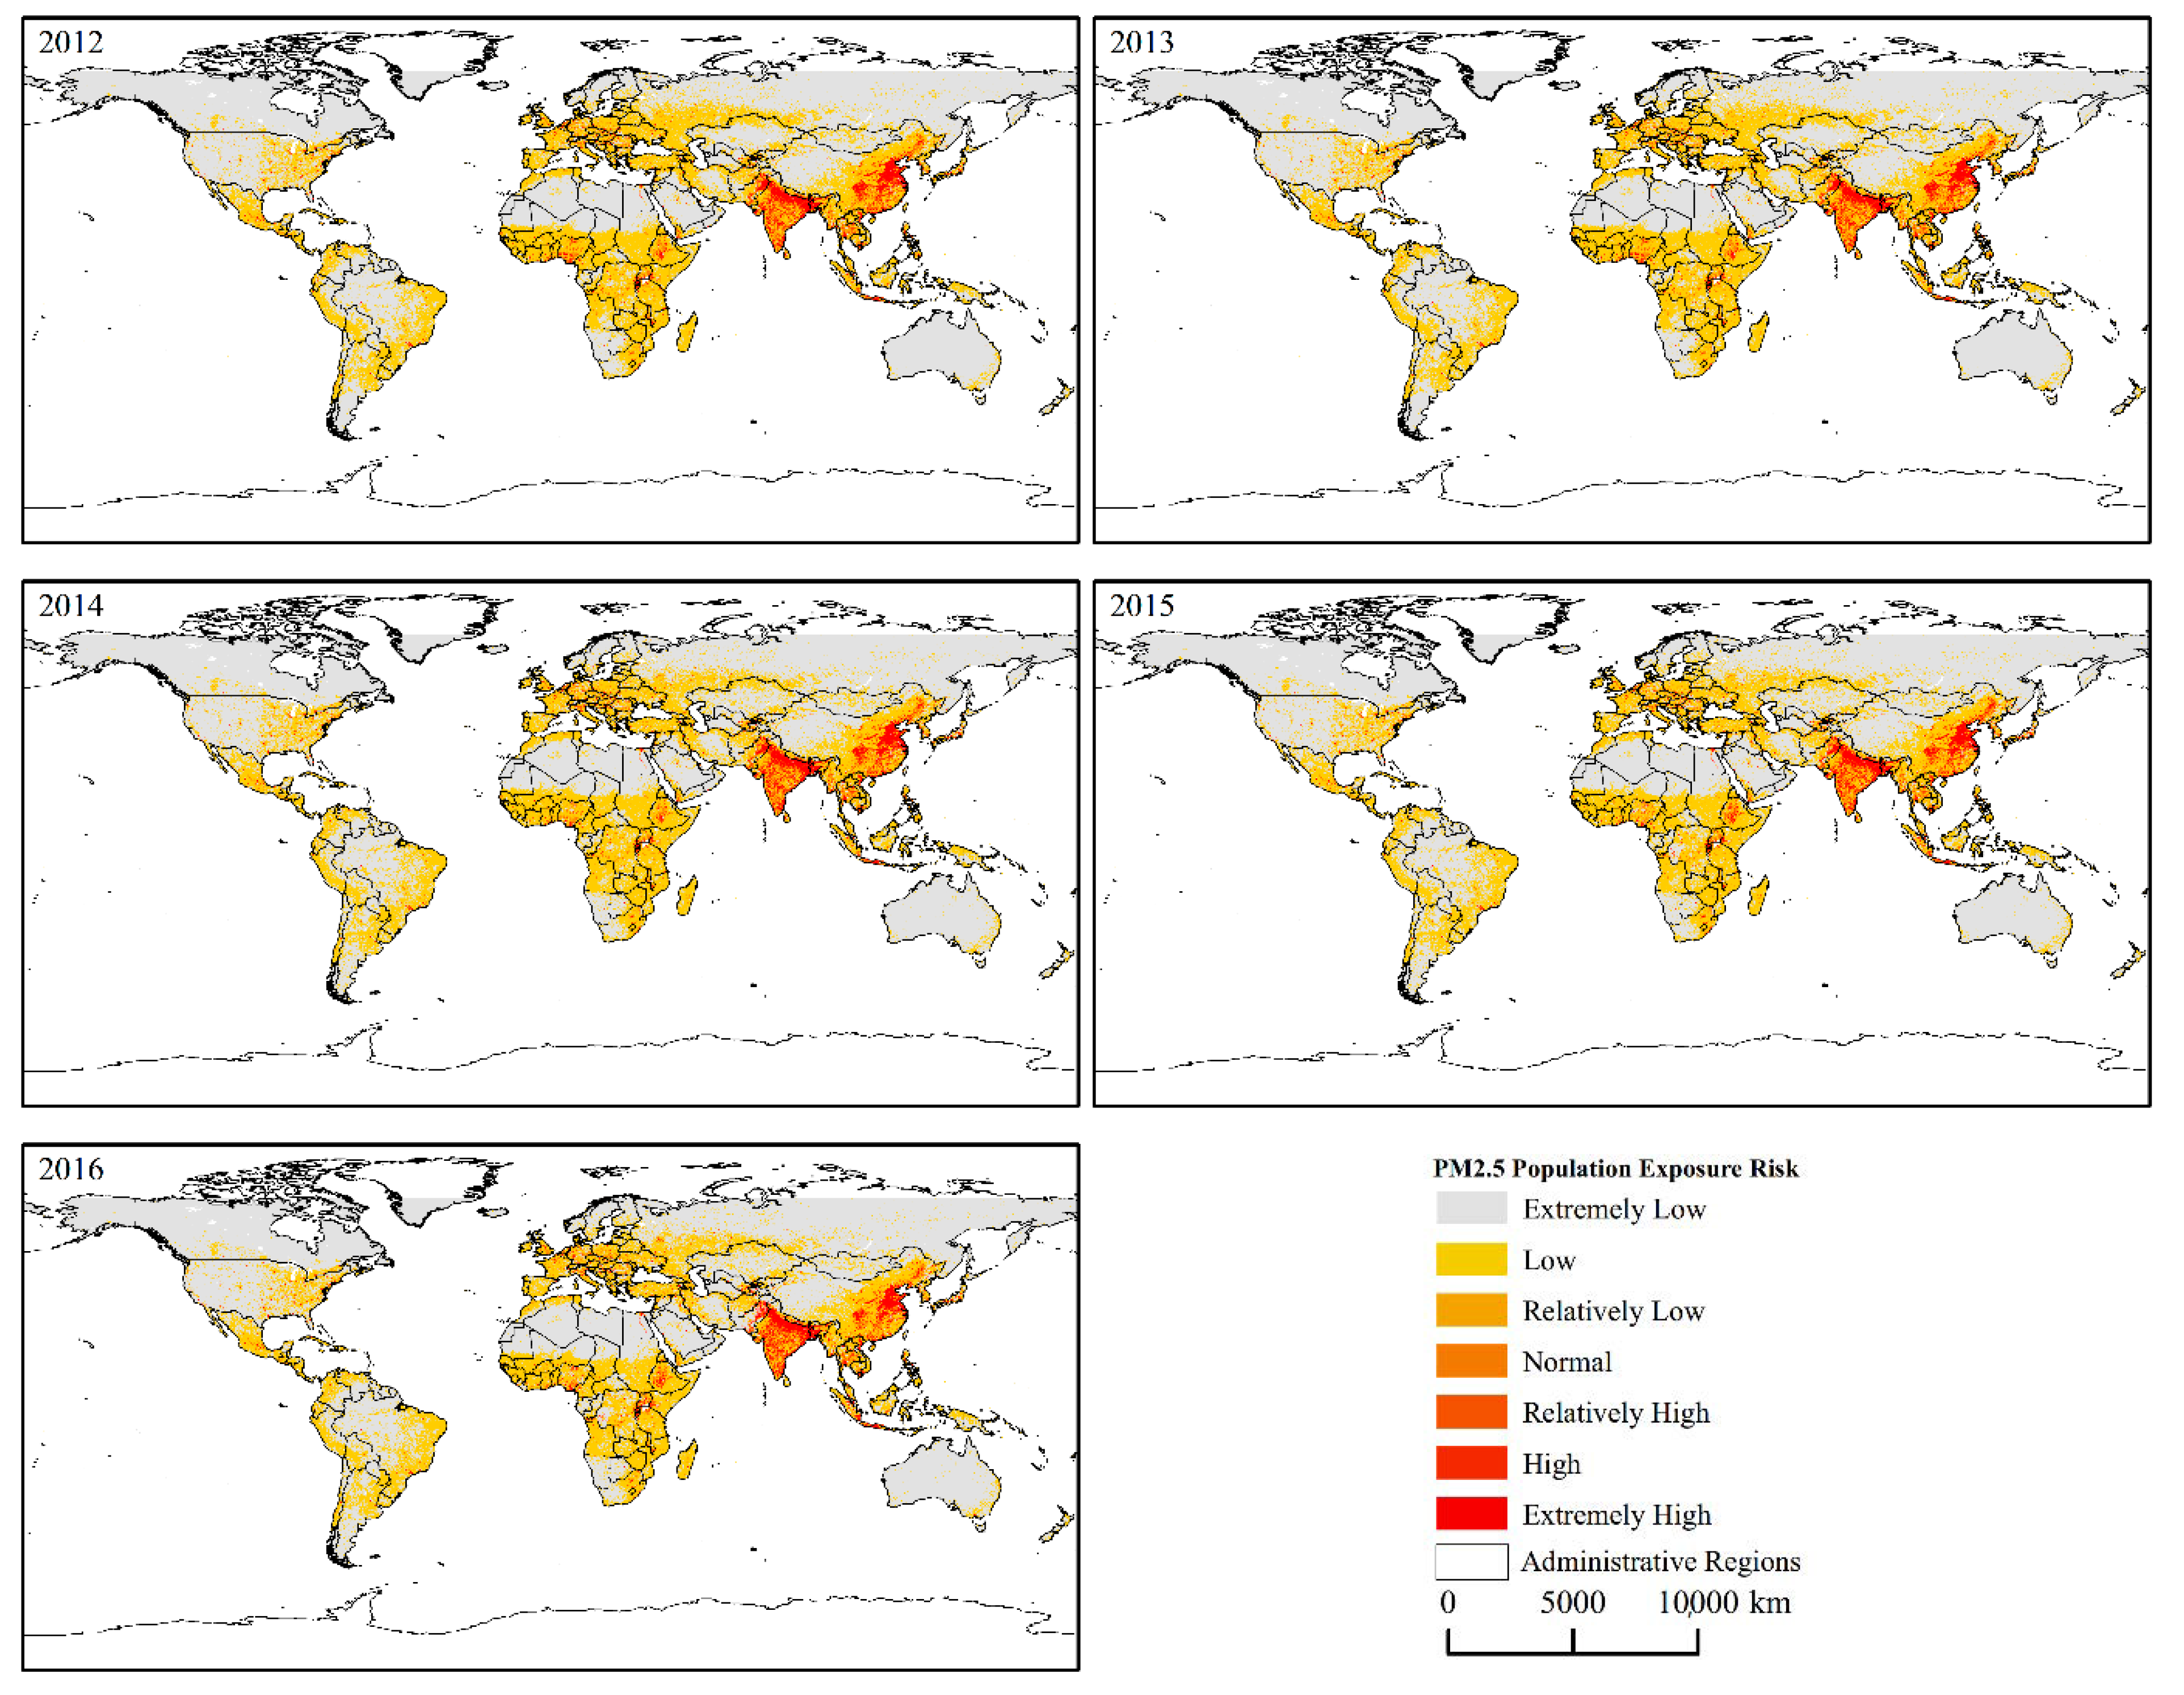
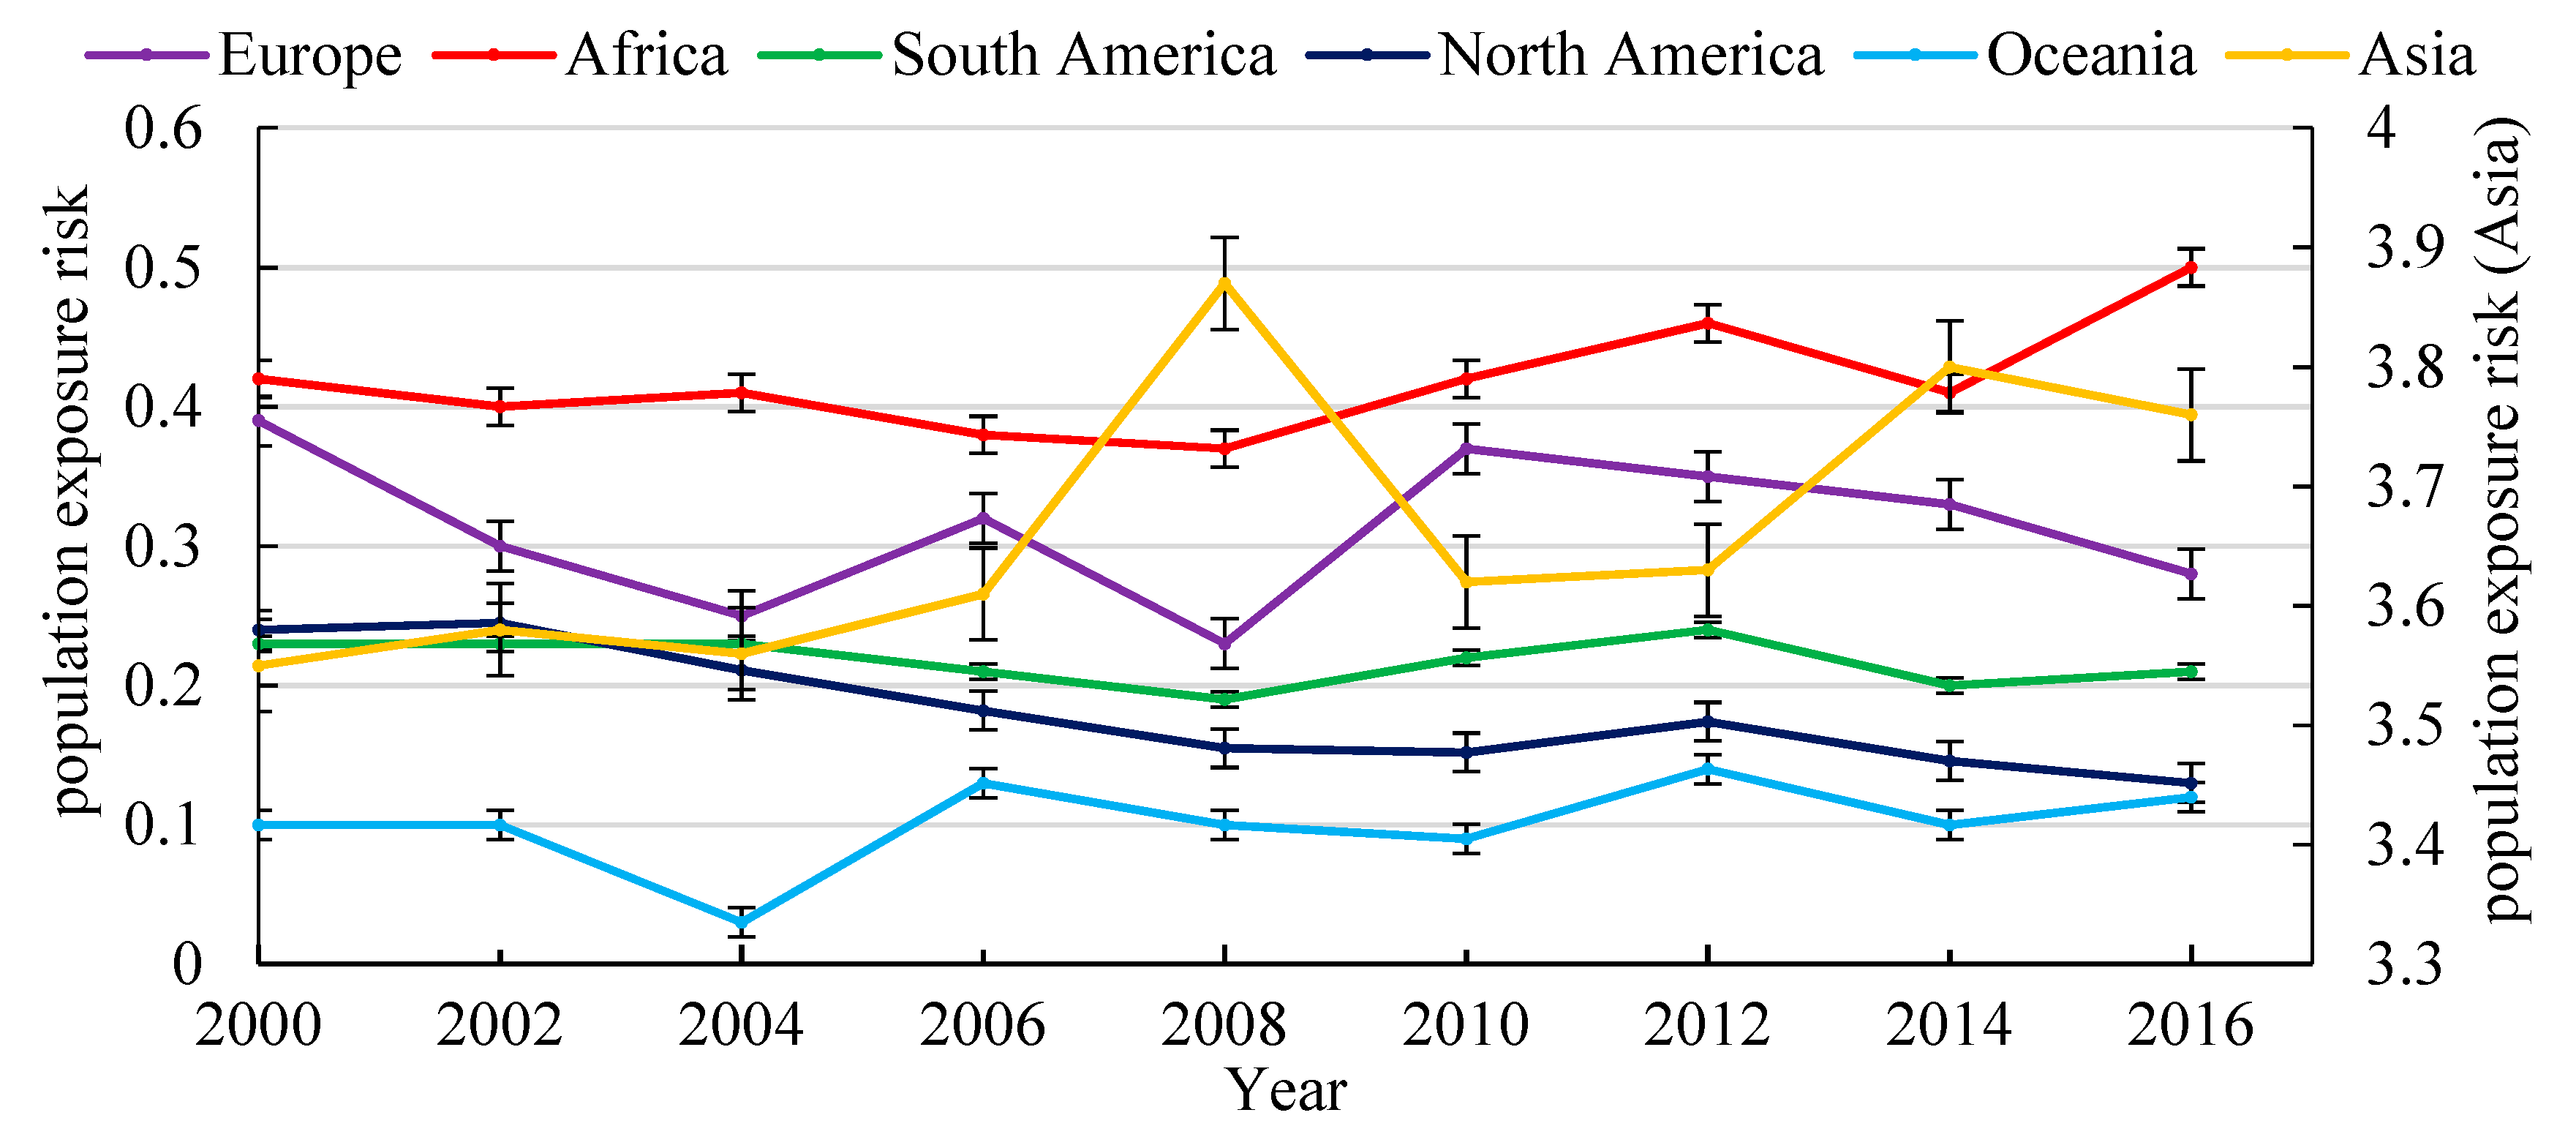
3.2.1. Interannual Change of PM2.5 Population Exposure Risk

The annual average population exposure risk of PM2.5 globally is decreasing annually on a macro-scale. However, due to significant differences in industrialization and consumption levels in various regions, differences show within the regions (Figure 4). Areas with high PM2.5 exposure risk are distributed in regions and countries with high population density and rapid economic growth, including China, India, Southeast Asia, the Nile River, the Gulf of Guinea, Western Europe, and other places. Areas with low PM2.5 exposure risk are mainly distributed in plateaus, deserts, tropical rainforests, and other places, such as the Qinghai-Tibet Plateau, Greenland Island, Siberian Plain, Sahara Desert, and Amazon River. Asia (5.94) has the highest PM2.5 exposure risk, followed by Africa (0.62), Europe (0.45), South America (0.32), North America (0.27), and Oceania (0.01).
With every 5 μg/m3 indicating a level, the cumulative percentage of populations exceeding the limit of each level was counted by the average PM2.5 concentration every 4 years from 2000 to 2016 from 10 to 45 μg/m3 (Figure 5). The results show that from 2000 to 2008, the proportion of people over 20 μg/m3 had a significant upward trend; in 2012, it shows a significant downward trend, and in 2016, it shows a trend of recovery. In 2000, 73.82% of the global population were exposed to an environment with PM2.5 concentration over 10 μg/m3, 12.59% were exposed to an environment with PM2.5 concentration over 35 μg/m3, and 6.26% were exposed to an environment with PM2.5 concentration over 45 μg/m3. In 2004, 76.51% of the global population were exposed to an environment with PM2.5 concentration over 10 μg/m3, and 22.06% were exposed to an environment with PM2.5 concentration over 35 μg/m3. In 2008, 74.09% of the global population were exposed to an environment with PM2.5 concentration over 10 μg/m3, 28.77% were exposed to an environment with PM2.5 concentration over 35 μg/m3, and 18.99% were exposed to an environment with PM2.5 concentration over 45 μg/m3. In 2012, 75.17% of the global population were exposed to an environment with PM2.5 concentration over 10 μg/m3, 25.07% were exposed to an environment with PM2.5 concentration over 35 μg/m3. In 2016, 75.72% of the global population were exposed to an environment with PM2.5 concentration over 10 μg/m3, 27.51% were exposed to an environment with PM2.5 concentration over 35 μg/m3, and 18.8% were exposed to an environment with PM2.5 concentration over 45 μg/m3.

3.2.2. Distribution Pattern of Population Exposure Risk of PM2.5 in Various Continents

The average population exposure risk of PM2.5 in all continents from 2000 to 2016 are shown in Figure 6. The average exposure risk in Asia in the past 17 years was 5.94, much higher than that of other continents. Exposure is an extremely high risk. Due to flat terrain, frequent human activity, high levels of industrialization and consumption, northern India and eastern China, which are the two major regions with the highest PM2.5 concentration in the world, have serious air pollution. Exposure risk is determined by both PM2.5 and population; those two regions not only have high PM2.5 concentration but also an extremely high population density. China and India are the most populous countries in the world, so the exposure is at an extremely high-risk level. The population exposure risk of PM2.5 is also high in Japan, with an average value of 4.48 in the past 17 years, which is at a high-risk level. India, Bangladesh, and eastern Pakistan in South Asia are areas with extremely high risk of population exposure to PM2.5, and the risk is increasing annually with the highest value in 2016. Southeast Asia is another region with high PM2.5 population exposure risk, including Vietnam, Thailand, Cambodia, Myanmar, and Indonesia. The average exposure risk in the past 17 years was 8.44, 5.89, 2.03, 2.25, and 2.76, respectively, among which Vietnam and Thailand have extremely high exposure risk.
The average exposure risk of PM2.5 in the past 17 years in Africa was 0.62, and the exposure risk level is relatively low, showing a spatial distribution pattern of high in the south and low in the north. The areas with high population exposure risk of PM2.5 are mainly concentrated in five areas along the northern coast of the Gulf of Guinea, the Nile River and the deltas in Egypt, Ethiopia, Lake Victoria, and Pretoria in South Africa. The common denominator of these countries is the relatively slow economic development. However, they have abundant mineral resources and a large amount of cheap labor, so the economy will grow rapidly, and exposure risks will gradually increase. The Pretoria region of South Africa has the most developed economy and the largest population in Africa, so the exposure risk is also higher. The population exposure risk of PM2.5 in other regions and countries in Africa is mainly at low levels.
The average exposure risk of PM2.5 in the past 17 years in Europe was 0.45, second only to Asia and Africa. Europe borders the Arctic Ocean to the north, the Atlantic Ocean to the west, and the Mediterranean to the south. The climate is mainly a temperate marine and Mediterranean climate, which is suitable for human production and life. The population is mainly concentrated in megacities, and the urbanization rate is extremely high. Europe is also one of the most economically developed regions in the world. Belgium, Italy, Germany, the United Kingdom, Poland, France, and Ukraine have higher population exposure risks of PM2.5. The average values in 2017 were 5.35, 3.63, 3.42, 2.81, 2.76, 1.58, and 1.29, respectively. Exposure risks in urban areas are mainly at extremely high levels. The population exposure risk of PM2.5 first increases then decreases. It gradually increased from 2000 to 2006, and then decreased slowly after 2006. The health standard of PM2.5 stipulated by the EU is 25 μg/m3. In 2014, only 8% of the urban population was exposed to an environment where PM2.5 exceeds the standard [50]. In summary, the European air pollution control effect is significant, and its air pollution control measures and experience have important reference value for other regions [51].
The population exposure risk of PM2.5 in North America is relatively low, mainly with extremely low risk and low risk levels. The average population exposure risks of PM2.5 in Mexico, the United States, and Canada are 1.27, 0.41, and 0.03, respectively, and the current exposure risk values are 0.98, 0.3, and 0.02. Both the 17-year average and current exposure values are relatively low. Although industry in South America is underdeveloped, this region is rich in natural resources and reserves, especially oil, iron ore, and coal. Economic development depends mainly on the export of primary products and singularized products [52]. Areas with the highest population exposure risk of PM2.5 in North America are distributed in clusters of megacities. The population exposure risk of PM2.5 in Oceania remains at extremely low and low risk levels. In recent years, the exposure risk of PM2.5 in central Australia, southern Australia, and New Zealand has been gradually increasing; this is due to the arid climate and minimal rainfall in central and western Australia, which is affected by the subtropical high pressure and the great watershed. As the global climate becomes warmer, the temperature in Oceania is rising and has become more arid, so deserts are more widespread, causing a high concentration of PM2.5.

3.3. Temporal and Spatial Changing Characteristics of Global Population Exposure Risk of PM2.5

3.3.1. Temporal Changing Characteristics of Global Population Exposure Risk of PM2.5

Figure 7 shows the time changing trend of population exposure risk of PM2.5 in each continent from 2000 to 2016. It can be directly concluded that the changes in each continent are significantly different. The exposure risk value in Asia is significantly higher than other continents (the ordinate is on the right). The lowest value is in the year 2000, when the exposure risk value was 3.55. The highest value was in 2008, when the exposure risk value was 3.87. The exposure risk value of other continents was relatively low (the ordinate is on the left). The exposure risk value of Africa has been increasing, with the lowest value being 0.33 in 2009 and the highest value being 0.45. Europe and North America show a decreasing trend. The highest values of exposure risk in Europe and North America were 0.39 and 0.24 in 2000, and the lowest values were 0.23 in 2008 and 0.13 in 2016, respectively. The exposure risk values in Oceania and South America are relatively low and the changes are also small. In particular, the exposure risk values in Oceania have always remained extremely low.

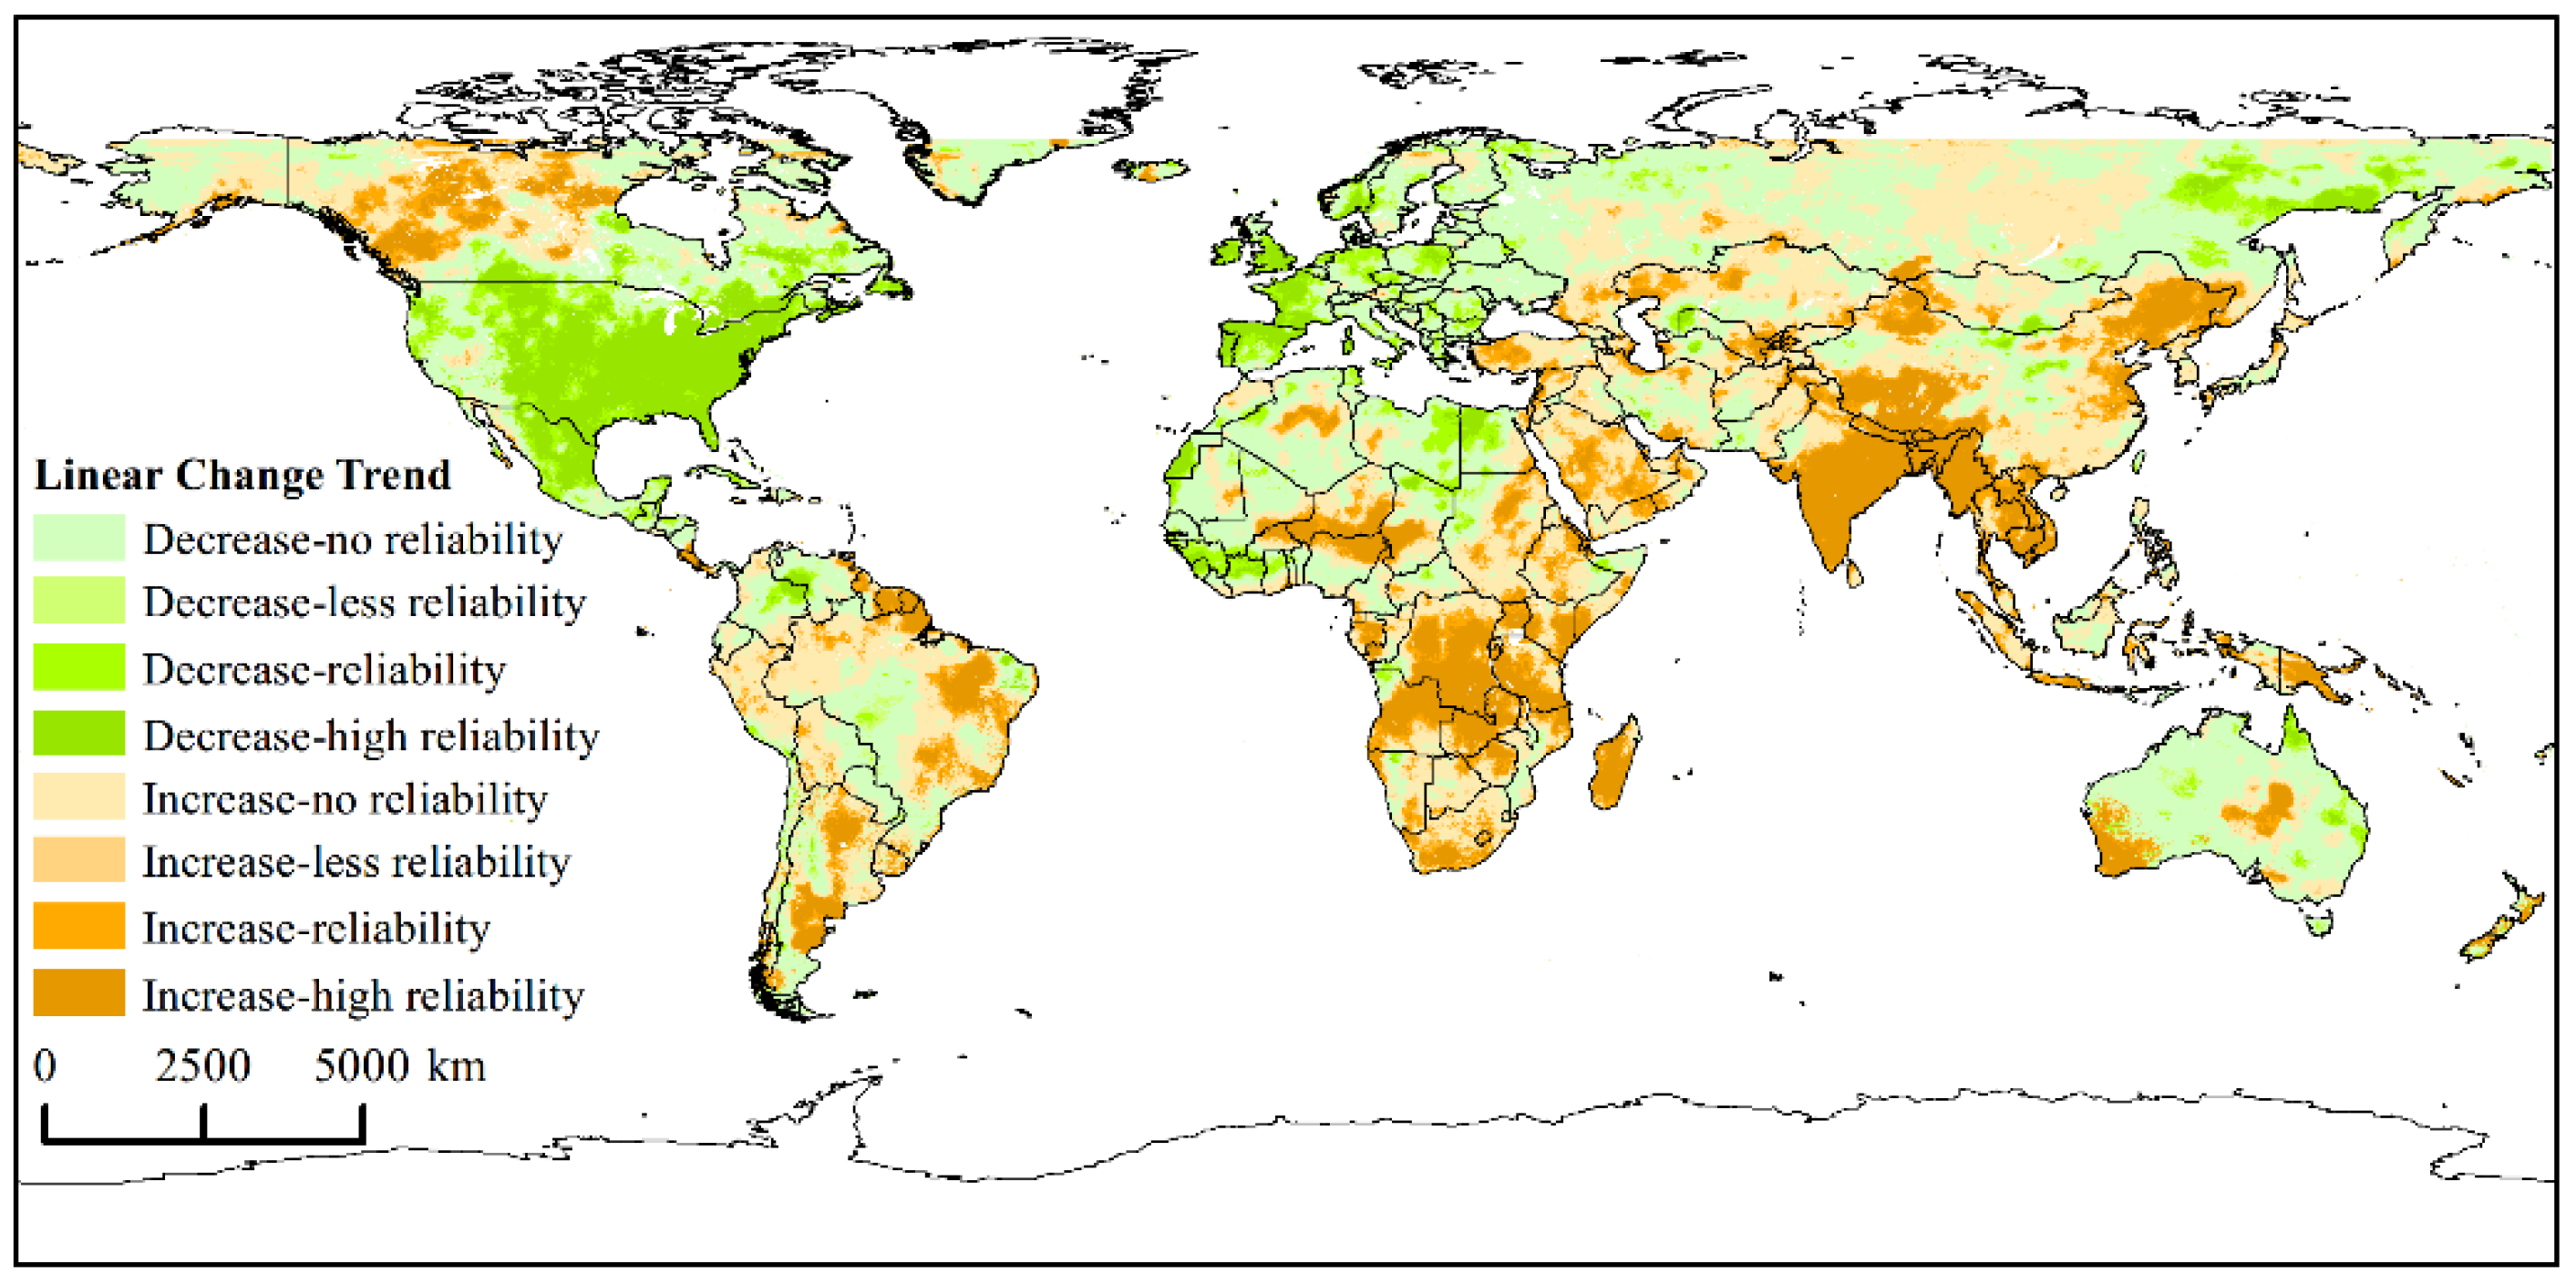
3.3.2. Linear Change Trend of Global Population Exposure Risk of PM2.5

The approaches of Theil–Sen Median and Mann–Kendall were used to characterize significant changes in the time series of global population exposure to PM2.5. When S > 0, it indicates that the population exposure to PM2.5 has an increasing trend in the time series. When S < 0, population exposure to PM2.5 shows a decreasing trend. The Z value of the test result is graded separately, and the absolute value of the Z value is divided into four levels [45]: high reliability change (|Z| > 2.58), reliability change (1.96 < |Z| ≤ 2.58), less reliability change (1.65), and no reliability change (0 < |Z| ≤ 1.65). The S value and the |Z| value are reclassified and then superimposed on the same pixel to obtain the linear change trend of global population exposure to PM2.5 (Figure 8).
As shown in Figure 8, regions with high reliability increases in global population exposure risk of PM2.5 are mainly distributed in Asia and Africa. Regions with less reliability increases are distributed around the areas of high reliability increases, and regions with high reliability decreases are mainly distributed in Western Europe and the United States.
The regions with significant increases in Asia are mainly distributed in the South Asia, Northeast China, the Qinghai-Tibet Plateau, the Pamirs Plateau, the Caspian Sea, and Southeast Asia. The Indo-China Peninsula also shows a significant increase, including Vietnam, Laos, Cambodia, Myanmar, eastern Thailand, and Java Island, the northwestern Sumatra Island in Indonesia. Their changing trends all increased significantly. In particular, the Qinghai Tibet Plateau is sparsely populated; however, there is also an increasing trend of exposure risk with high reliability. With the increase of global temperature, the frozen soil becomes degraded, and even freeze-thaw desertification occurs; the climate of Qinghai Tibet Plateau is cold and dry, and the effect of freezing and weathering is strong. The freezing and thawing process of surface rock and soil is also intensified due to the degradation of frozen soil; it will lead to vegetation decline with bare and broken soil, leading to desertification. The PM2.5 concentration formed an increasing trend in this area.
The changing characteristics in Africa are mainly high reliability increases, caused by the rapidly growing economy and population. The proportion of secondary industry in Africa continues to rise, leading to a significant increase in industrial waste gas, which has deteriorated the natural environment and continuously destroyed ground vegetation. Therefore, many areas see a significant increase in population exposure to PM2.5. Areas with high reliability increases include Congo, Zambia, Angola, Tanzania, Zambia, South Africa, Madagascar, southern Niger, northern Nigeria, Burkina Faso, western Chad, and central Algeria. Areas with reliability increases and less reliability increases surround areas with high reliability increases. Areas with significant decreases in Africa are distributed in the northern Gulf of Guinea, Western Sahara, Egypt, and Libya.
The changing trends in North America are polarized. The United States sees high reliability decreases, and only southern Alaska has a small area with high reliability increases. The western and central regions of Canada show a large area with high reliability increases. The changing characteristics in South America are mainly increasing, and the areas with significant increases include the Amazon delta, eastern Brazil, and the Negro and Colorado river basins in Argentina.
Oceania is the region with the best air quality in the world, except for Antarctica. Central and southwestern parts of Australia have seen high reliability increases of PM2.5 exposure risk due to the influence of the natural environment. The central and western areas of Australia are affected by the subtropical ridge, so the climate is arid. In addition, the Great Dividing Range blocks the warm and wet flow brought by southeast monsoons, rendering the climate more arid. Moreover, there are many eucalyptus trees in Australia prone to large fires, thus increasing the exposure risk of PM2.5.

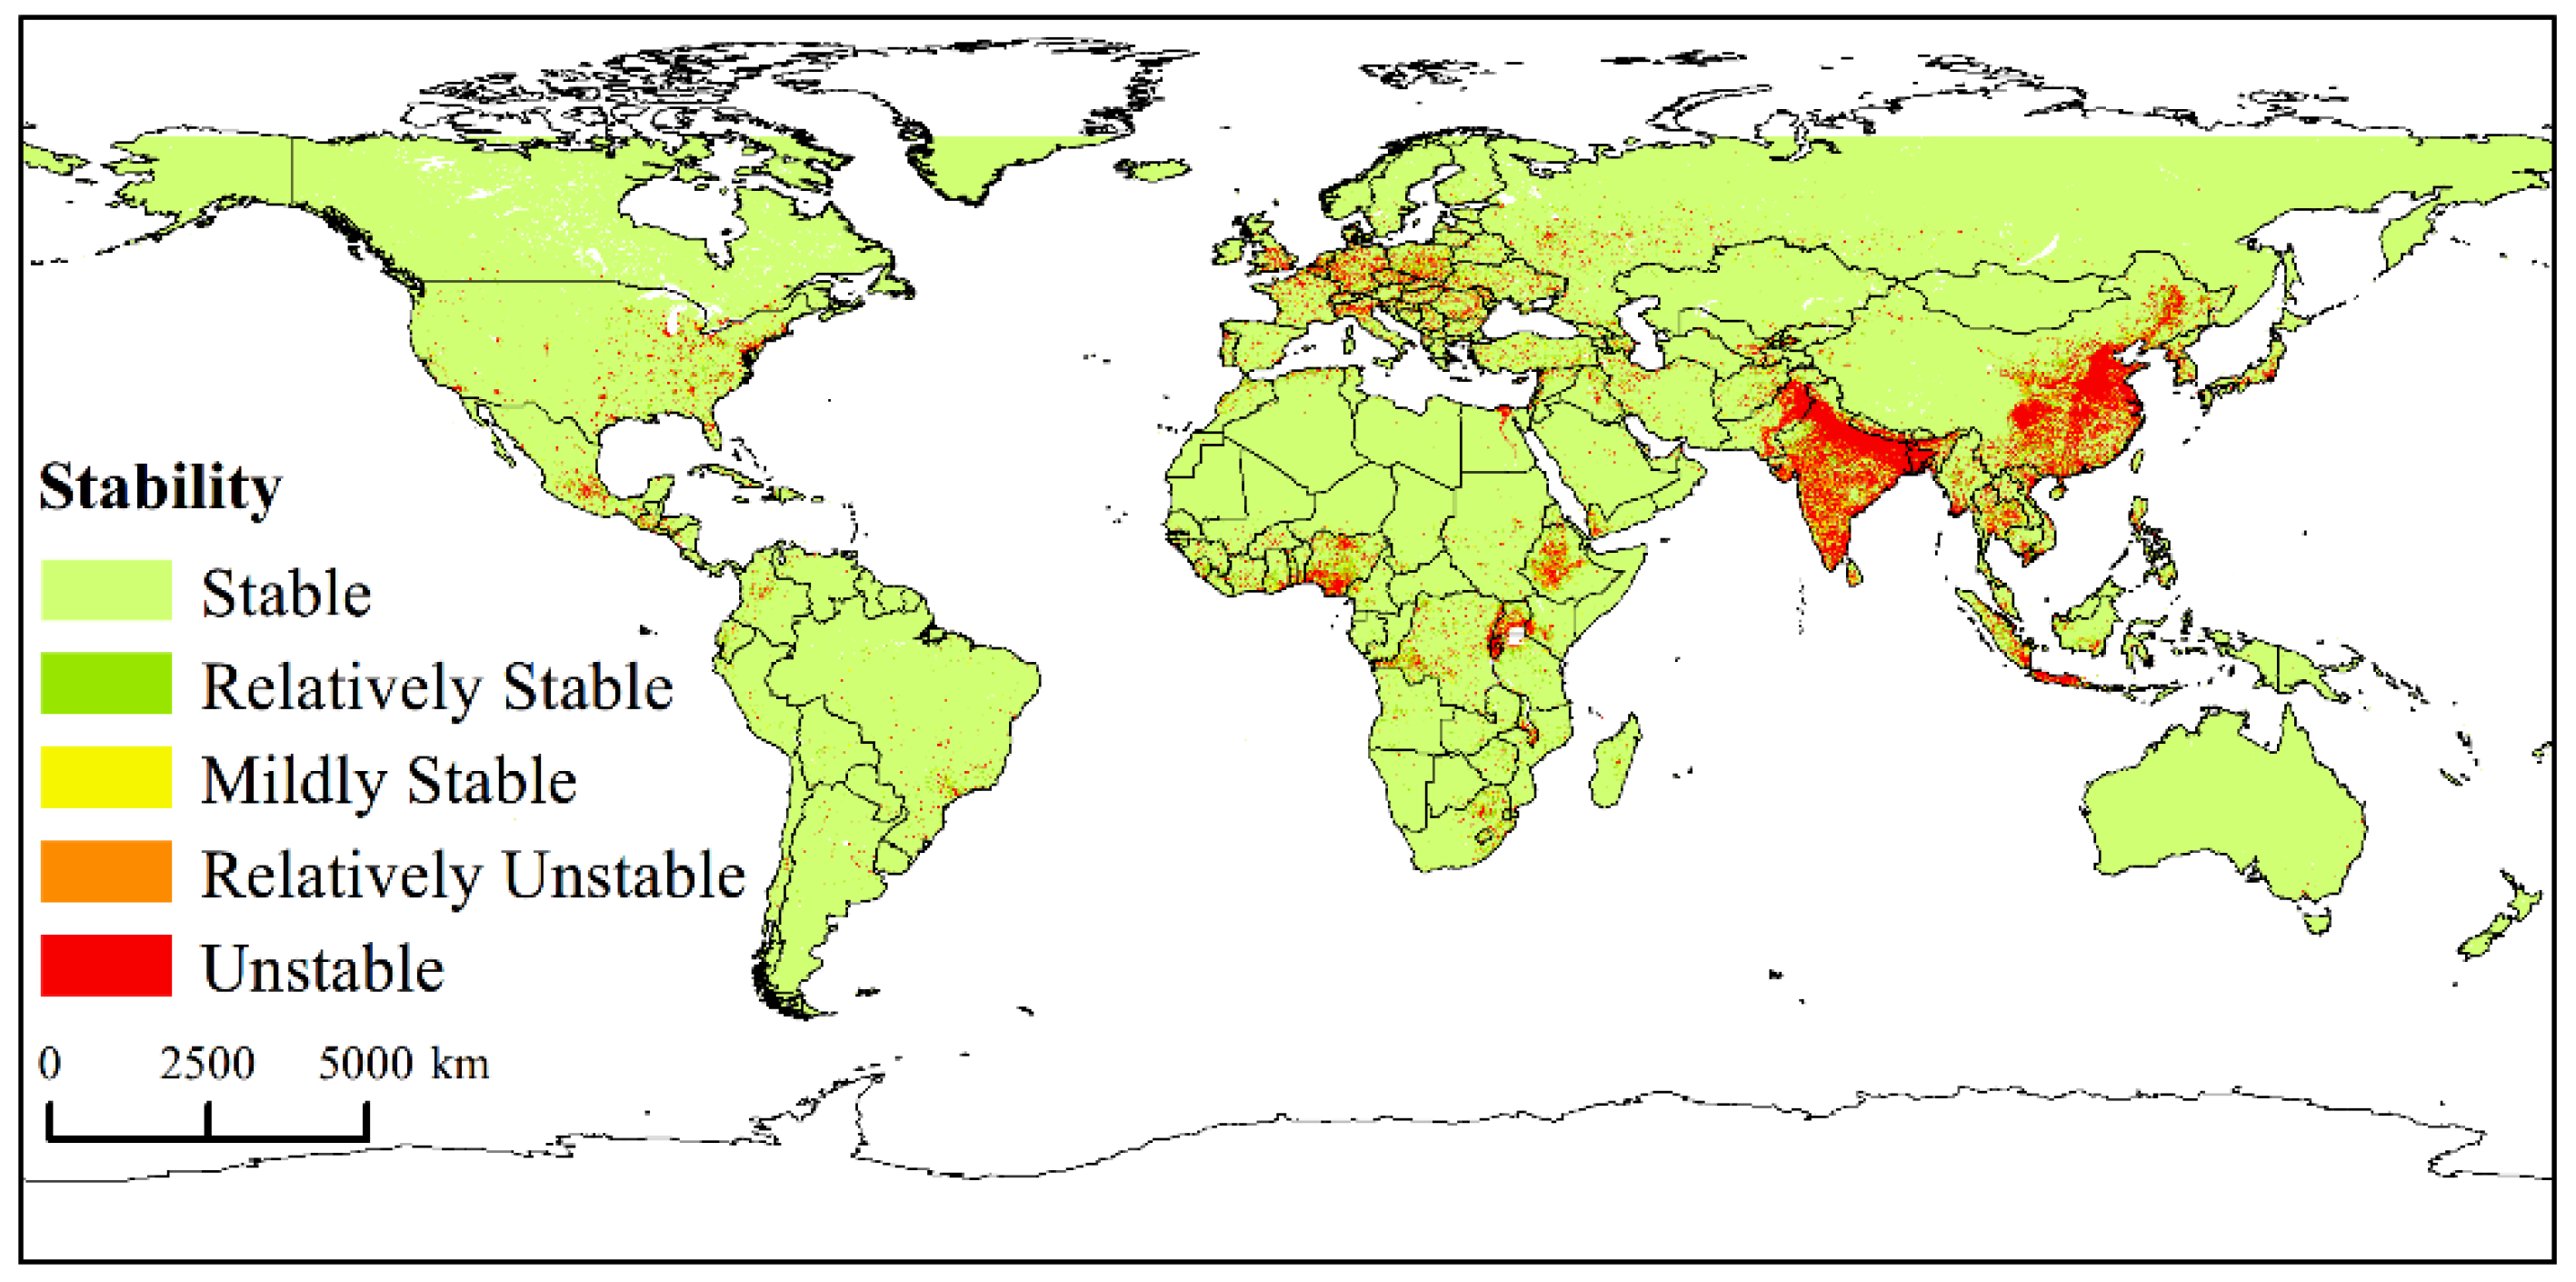
3.3.3. Stability of Global Population Exposure Risk of PM2.5

The stability of the population exposure risk of PM2.5 from 2000 to 2016 was analyzed by the standard deviation method, and the stability of population exposure changes is divided into five levels: stable, relatively stable, mildly stable, relatively unstable, and unstable. It can be seen in Figure 9 that there are apparent spatial differences in the changes in population exposure to PM2.5. Asia, India and eastern China see the significant changes in exposure risk, followed by Southeast Asia, Europe and Africa. The two regions of India and eastern China are among the fastest growing regions in the world in terms of GDP. The material and capital flow are extremely fast, the population density is high, the PM2.5 concentration is high, and the fluctuation is dramatic; therefore, the exposure risk is unstable.
The regions with unstable exposure risk in Africa are mainly distributed in the Congo, South Africa, the Gulf of Guinea, Lake Victoria, and Ethiopia. These regions are rich in natural resources and abundant in labor, attracting a large amount of foreign capital for development and investment, especially for mine development and the manufacturing industry, which have continuously increased the concentration of fine particles; the stability of population exposure to PM2.5 has also continued to decrease. Europe is one of the most economically developed regions in the world. Most countries have entered the post-industrial era. In recent years, low-risk atmospheric control has been improved, and the air quality has become increasingly excellent. Most areas of North America show good stability. Only the eastern part of the United States, Guatemala, and Mexico City, the capital of Mexico, show unstable population exposure to PM2.5. These three regions are areas where population exposure to PM2.5 has significantly decreased.

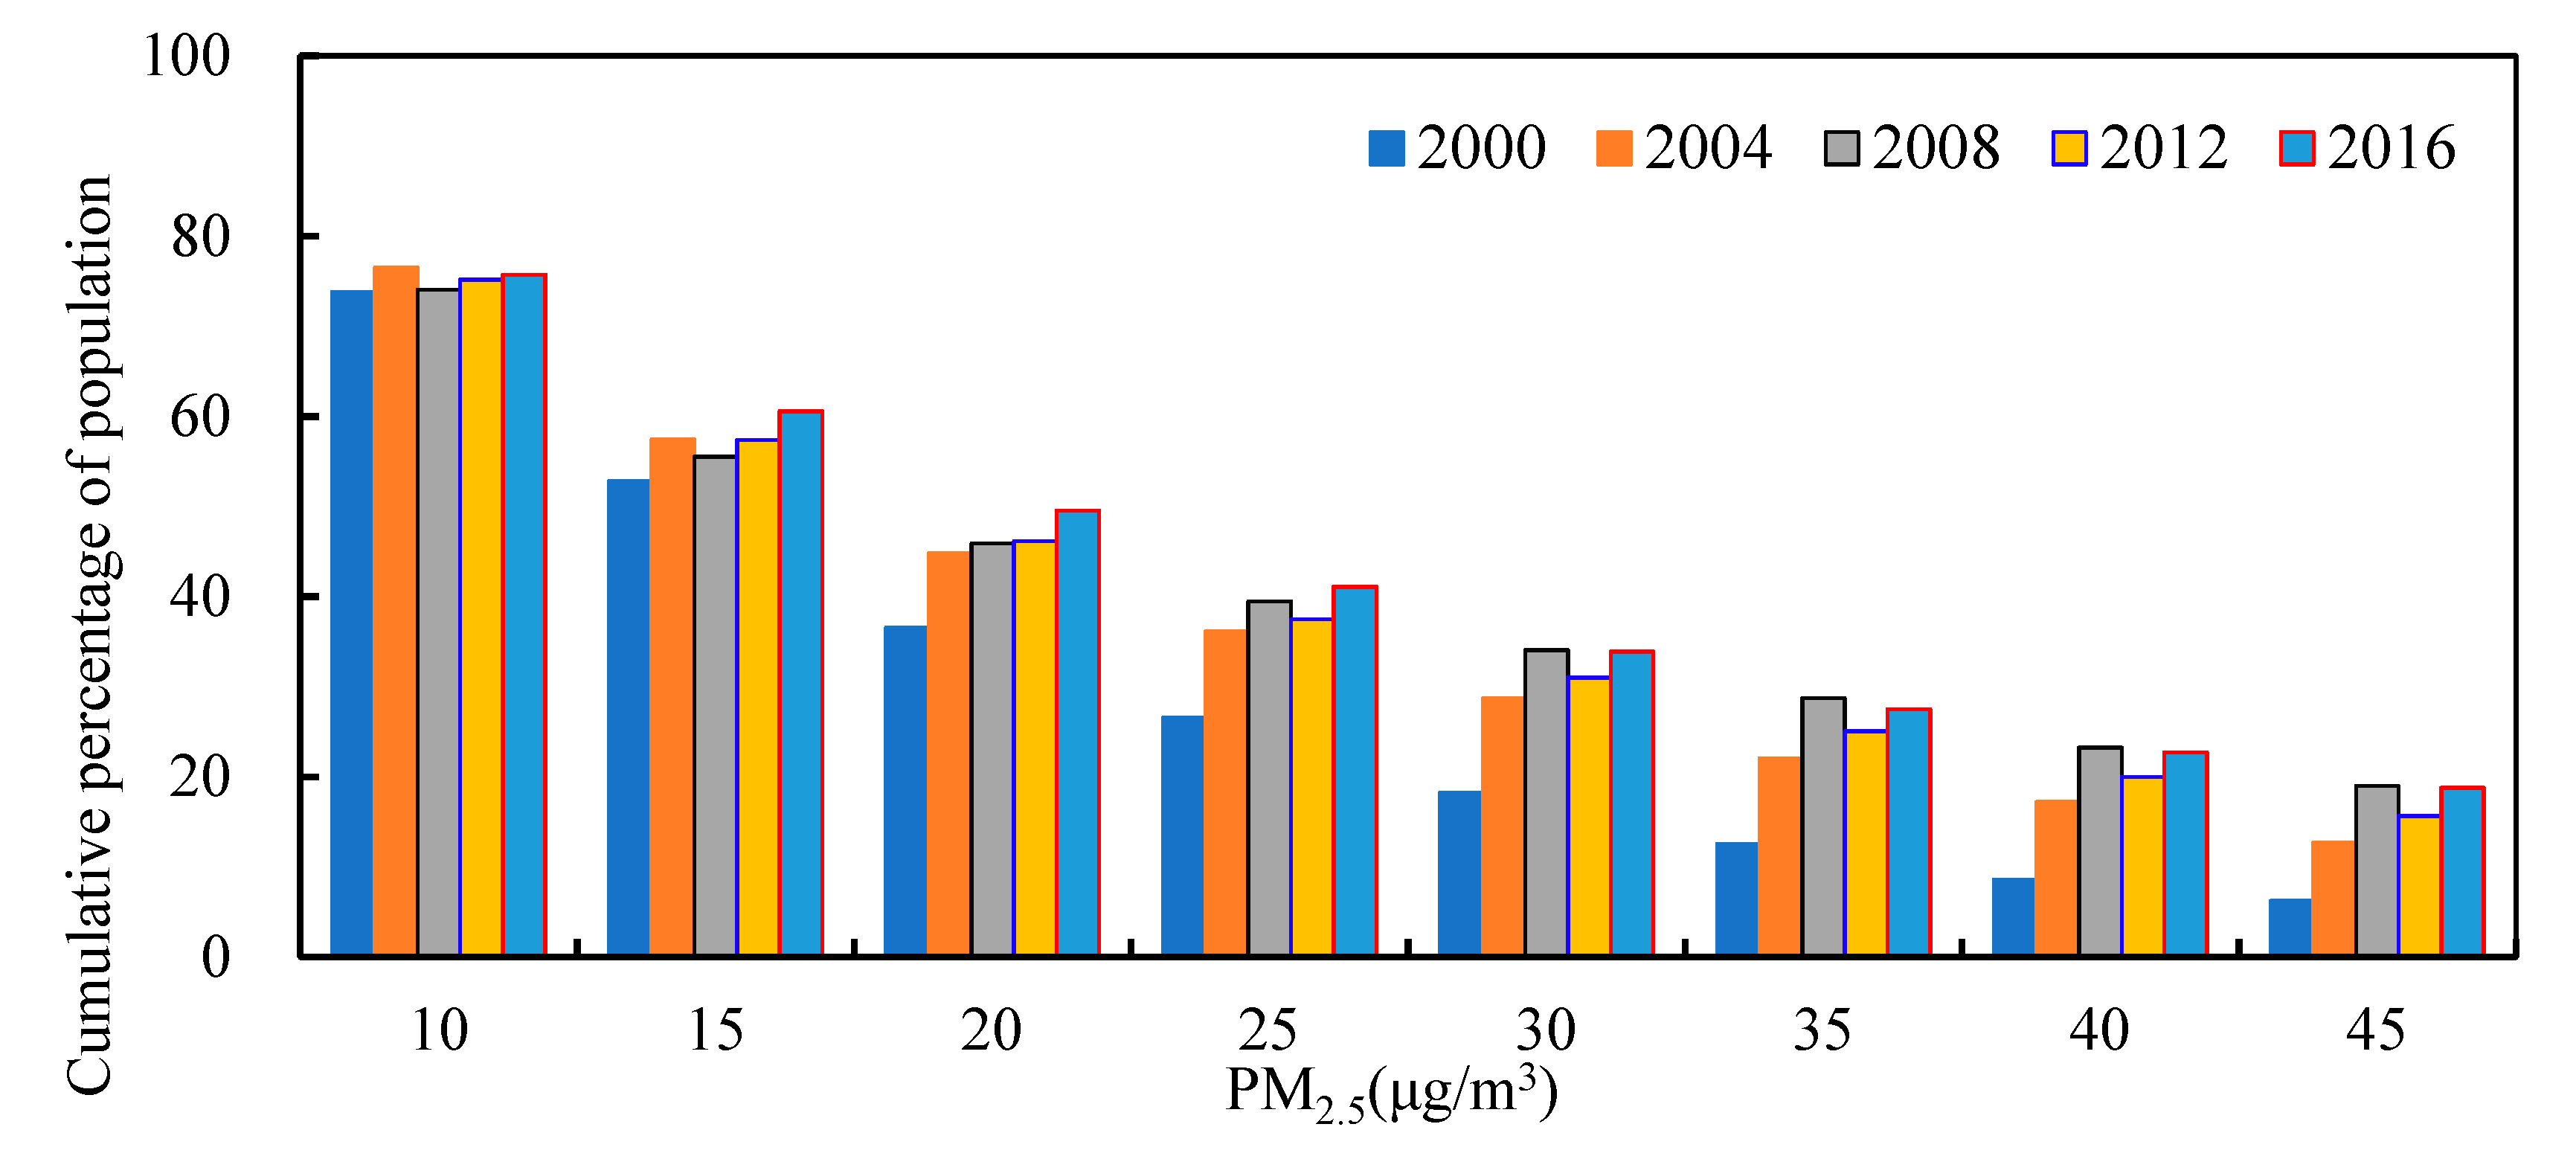
3.4. Population Distribution Characteristics under High Exposure Risk of PM2.5

For 2016, the total population distribution under high exposure risk of PM2.5 (including high risk and very high risk of exposure) is shown in Figure 10. The total population distribution of all countries under high exposure risk shows a high spatial distribution in Asia and the Americas and a low spatial distribution in Europe, Africa, and Oceania. Countries with a total population exceeding 100 million with high exposure risk include China, India, the United States, Indonesia, Brazil, Pakistan, Nigeria, and Bangladesh, which are among the top ten countries in terms of population. Countries with a population between 50 million and 100 million with high exposure risk include Russia, Mexico, Japan, and Egypt. The actual populations of these countries also rank among the highest in the world. The total population under high exposure risk is consistent with the actual population.
Figure 11 shows the spatial distribution of population density under high exposure risk of PM2.5 globally in 2016. The population density of continents with high exposure risk are Asia and Europe in terms of spatial distribution, and low in other continents. Countries with a population density over 200 persons/km2 with high exposure risk include India, Japan, South Korea, Bangladesh, the Netherlands, Rwanda, and Burundi. There are 13 countries with a population density between 100 and 200 persons/km2, namely, the United Kingdom, Germany, Switzerland, Belgium, Italy, Pakistan, Nepal, North Korea, Vietnam, the Philippines, Dominica, El Salvador, and Nigeria. Countries with a population density between 50 and 100 persons/km2 include China, Thailand, Malaysia, Indonesia, Sri Lanka, France, Spain, Poland, Czech Republic, Hungary, Croatia, Turkey, Iraq, Jordan, and Egypt.

4. Discussion

This article focuses on the current situation of population exposure of PM2.5 from a global macro perspective by identifying high exposure risk areas and analyzing the temporal and spatial changes of areas with high exposure risk of PM2.5. By combining previous research results, this article explores the reasons for high exposure risk in various countries in order to reduce exposure risks and provide continuous basic data in continuous time and space for cross-border and inter-regional air pollution prevention and control. The analysis of the population exposure risk of PM2.5 in the long-term time series from 2000 to 2016 has compensated for missing data in some countries.
This article finds that from 2000 to 2016, the global population exposure risk of PM2.5 showed a gradually decreasing trend on a macro-scale, with the highest spatial distribution in Asia, followed by Africa, Europe, and other continents. Among them, the PM2.5 pollution in Asia is the most serious, with the exposure risk value far higher than that of other continents. In particular, India and China, which are also the two most populous countries in the world, have a high exposure risk of PM2.5 as a result of their high population density. In these areas of high exposure risk, it is necessary to establish atmospheric quality standards and reduce emissions simultaneously [53]; a series of environmental action plans should be continuously formulated, adjusted and implemented. The effectiveness of economic activities should be emphasized, and a convergence of environmental protection and economic development should be established [54,55]. Under unchangeable natural conditions such as terrain and climate, adjusting and optimizing the industrial structure, energy consumption structure, and transportation structure are the main means to eradicate air pollution [56].
Considering the low level of economic development in some countries and regions, the imperfect industrial structure, the complexity of air pollutants and the long-term governance of air pollutants, it is important to think about solutions for treating both symptoms and root causes in order to mitigate air pollution when a radical cure cannot be achieved. While mitigating air pollution, reducing population exposure risks and protecting public health are also issues that must be considered. In addition to source prevention and control, this article’s authors believe that areas with high population exposure risk of PM2.5, public awareness of air pollution, health risk assessment, health warning on heavy pollution, the emergency response of medical systems, and health protection of special groups should also be considered, and corresponding countermeasures should be formulated.
Due to limited data acquisition, this article lacks daily, monthly and seasonal average data of PM2.5 and population data. Therefore, it does not analyze the daily, monthly and seasonal differences of population exposure to PM2.5. Future research is expected to obtain such data with a higher temporal and spatial resolution to further refine the dynamic population exposure risk analysis of PM2.5. In addition, this article’s authors think that the driving mechanism of the evolution of temporal and spatial patterns of population exposure of PM2.5 require further in-depth and quantitative research.

5. Conclusions

In general, based on multi-source remote sensing data, the pollutant population exposure model, accompanied by the Theil–Sen Median and Mann–Kendall methods were used to analyze the spatio-temporal patterns of global population exposure risk of PM2.5 from 2000 to 2016. The population distribution patterns of high-risk exposure areas were accurately identified, the variation trend and stability of global population exposure risk of PM2.5 were also analyzed. It was found that the total population has a certain relationship with PM2.5 concentration and exposure risk. The average annual population exposure risk of PM2.5 globally is decreasing annually on a macro-scale but there are differences within various regions. Specifically, areas with a higher population exposure risk of PM2.5 are China, India, Southeast Asia, and other areas with rapid economic development and a dense population. Eight countries among the most populated ten countries are under high exposure risk of PM2.5. On the contrary, exposure risk of PM2.5 is relatively low in mountainous areas, cold regions, deserts, tropical rainforests, and other areas with poor transportation and underdevelopment. Areas with a relatively stable population exposure risk of PM2.5 are mainly concentrated in Oceania, North America and South America; in contrast, areas with relatively unstable population exposure risk of PM2.5 are mainly concentrated in Asia, India and eastern China, followed by Southeast Asia, Europe and Africa. Therefore, by exploring the relationship between PM2.5 concentration and population exposure risk, we not only clarify the impact of spatial heterogeneity on PM2.5 concentration and population exposure risk but also provide a theoretical basis for global environmental risk assessment.

Author Contributions

Conceptualization, C.Z., J.P. and L.Z.; methodology, C.Z., J.P. and L.Z.; software, C.Z., J.P. and L.Z.; validation, C.Z., J.P. and L.Z.; formal analysis, C.Z., J.P. and L.Z.; investigation, C.Z., J.P. and L.Z.; data curation, C.Z., J.P. and L.Z.; writing—original draft preparation, C.Z.; writing—review and editing, C.Z. and J.P.; visualization, C.Z., J.P. and L.Z.; supervision, J.P.; project administration, J.P.; funding acquisition, J.P. All authors have read and agreed to the published version of the manuscript.

Funding

This research was funded by the National Natural Science Foundation of China, grant number 42071216.

Institutional Review Board Statement

Not applicable.

Informed Consent Statement

Not applicable.

Data Availability Statement

No new data were created or analyzed in this study. Data sharing is not applicable to this article.

Conflicts of Interest

The authors declare no conflict of interest.

References

  1. Li, J.; Han, X.; Jin, M.; Zhang, X.; Wang, S. Globally analysing spatiotemporal trends of anthropogenic PM2.5 concentration and population’s PM2.5 exposure from 1998 to 2016. Environ. Int. 2019, 128, 46–62. [Google Scholar] [CrossRef]
  2. Gakidou, E.; Afshin, A.; Abajobir, A.A.; Abate, K.H.; Abbafati, C.; Abbas, K.M.; Abd-Allah, F.; Abdulle, A.M.; Abera, S.F.; Aboyans, V. Global, regional, and national comparative risk assessment of 84 behavioural, environmental and occupational, and metabolic risks or clusters of risks, 1990–2016: A systematic analysis for the Global Burden of Disease Study 2016. Lancet 2017, 390, 1345–1422. [Google Scholar] [CrossRef] [Green Version]
  3. Ott, W.R. Concepts of human exposure to air pollution. Environ. Int. 1982, 7, 179–196. [Google Scholar] [CrossRef]
  4. Lu, D.; Mao, W.; Zheng, L.; Xiao, W.; Zhang, L.; Wei, J. Ambient PM2.5 Estimates and Variations during COVID-19 Pandemic in the Yangtze River Delta Using Machine Learning and Big Data. Remote. Sens. 2021, 13, 1423. [Google Scholar] [CrossRef]
  5. Marangon, D.; Traversi, D.; D’Agostino, A.M.; Gea, M.; Fontana, M.; Schilirò, T. The North-western Italy air quality moni-toring network: Improving experience of PM2.5 assessment with mutagenicity assay. Environ. Res. 2021, 195, 174–185. [Google Scholar] [CrossRef]
  6. WHO. Air Quality Guidelines for Particulate Matter, Ozone, Nitrogen Dioxide and Sulphur Dioxide; Global Update 2005; Sum Risk Assess 2006; WHO: Geneva, Switzerland, 2006. [Google Scholar]
  7. Hamra, G.B.; Guha, N.; Loomis, D.; Cohen, A.; Laden, F.; Raaschou-Nielsen, O.; Samet, J.M.; Vineis, P.; Forastiere, F.; Saldiva, P.; et al. Outdoor Particulate Matter Exposure and Lung Cancer: A Systematic Review and Meta-Analysis. Environ. Health Perspect. 2014, 122, 906–911. [Google Scholar] [CrossRef] [PubMed] [Green Version]
  8. Pope, C.A.; Brook, R.D.; Burnett, R.T.; Dockery, D.W. How is cardiovascular disease mortality risk affected by duration and intensity of fine particulate matter exposure? An integration of the epidemiologic evidence. Air Qual. Atmos. Health 2011, 4, 5–14. [Google Scholar] [CrossRef]
  9. Stafoggia, M.; Cesaroni, G.; Peters, A.; Andersen, Z.J.; Badaloni, C.; Beelen, R.; Caracciolo, B.; Cyrys, J.; De Faire, U.; De Hoogh, K.; et al. Long-Term Exposure to Ambient Air Pollution and Incidence of Cerebrovascular Events: Results from 11 European Cohorts within the ESCAPE Project. Environ. Health Perspect. 2014, 122, 919–925. [Google Scholar] [CrossRef] [Green Version]
  10. Huang, Y.-C.T.; Rappold, A.G.; Graff, D.W.; Ghio, A.J.; Devlin, R.B. Synergistic effects of exposure to concentrated ambient fine pollution particles and nitrogen dioxide in humans. Inhal. Toxicol. 2012, 24, 790–797. [Google Scholar] [CrossRef] [PubMed]
  11. Hoek, G.; Krishnan, R.M.; Beelen, R.; Peters, A.; Ostro, B.; Brunekreef, B.; Kaufman, J.D. Long-term air pollution exposure and cardio- respiratory mortality: A review. Environ. Health 2013, 12, 43. [Google Scholar] [CrossRef] [Green Version]
  12. Zhou, L.; Zhou, C.; Yang, F.; Yang, B.; Sun, D. Analysis of the characteristics and driving factors of China’s PM2.5 spatiotemporal evolution from 2000 to 2011. Acta Geogr. Sinica 2017, 72, 2079–2092. [Google Scholar]
  13. Franklin, M.; Zeka, A.; Schwartz, J. Association between PM2.5 and all-cause and specific-cause mortality in 27 US communities. J. Expo. Sci. Environ. Epidemiol. 2006, 17, 279–287. [Google Scholar] [CrossRef] [PubMed] [Green Version]
  14. Kourtchev, I.; Warnke, J.; Maenhaut, W.; Hoffmann, T.; Claeys, M. Polar organic marker compounds in PM2.5 aerosol from a mixed forest site in western Germany. Chemosphere 2008, 73, 1308–1314. [Google Scholar] [CrossRef]
  15. Fu, K.; Zhuang, R.; Liang, L.; Duan, Y.; Gao, J. The evolution and characteristics of the spatiotemporal pattern of PM2.5 in the Yangtze River Delta——Based on real-time monitoring data from 2013 to 2016. Geogr. Res. 2018, 37, 1641–1654. [Google Scholar]
  16. Huang, X.; Zhao, J.; Cao, J.; Xin, W. Evolution of PM2.5 distribution pattern and its influencing factors in the Yangtze River Economic Zone. Environ. Sci. Technol. 2020, 41, 1013–1024. [Google Scholar]
  17. Cao, C.; Jiang, W.; Wang, B.; Fang, J.; Lang, J.; Tian, G.; Jiang, J.; Zhu, T.F. Inhalable Microorganisms in Beijing’s PM2.5and PM10Pollutants during a Severe Smog Event. Environ. Sci. Technol. 2014, 48, 1499–1507. [Google Scholar] [CrossRef]
  18. Wang, Z.-B.; Fang, C.-L. Spatial-temporal characteristics and determinants of PM2.5 in the Bohai Rim Urban Agglomeration. Chemosphere 2016, 148, 148–162. [Google Scholar] [CrossRef]
  19. Kang, Y.; Chen, J.; Cao, Y.; Xu, Z. A Higher-Order Graph Convolutional Network for Location Recommendation of an Air-Quality-Monitoring Station. Remote. Sens. 2021, 13, 1600. [Google Scholar] [CrossRef]
  20. Li, J.; Zhai, L.; Sang, H.; Zhang, Y.; Yuan, J. Comparison of different spatial interpolation methods in PM2.5 concentration interpolation. Survey Map Sci. 2016, 41, 50–54, 101. [Google Scholar]
  21. Strandgren, J.; Mei, L.; Vountas, M. Study of satellite retrieved aerosol optical depth spatial resolution effect on particulate matter concentration prediction. Atmos. Chem. Phys. 2014, 14, 25869–25899. [Google Scholar]
  22. Kloog, I.; Nordio, F.; Coull, B.A.; Schwartz, J. Incorporating Local Land Use Regression and Satellite Aerosol Optical Depth in A Hybrid Model Of Spatiotemporal PM2.5Exposures In The Mid-Atlantic States. Environ. Sci. Technol. 2012, 46, 11913–11921. [Google Scholar] [CrossRef] [PubMed] [Green Version]
  23. Tian, J.; Chen, D. A semi-empirical model for predicting hourly ground-level fine particulate matter (PM2.5) concentration in southern Ontario from satellite remote sensing and ground-based meteorological measurements. Remote. Sens. Environ. 2010, 114, 221–229. [Google Scholar] [CrossRef]
  24. Van Donkelaar, A.; Martin, R.V.; Brauer, M.; Kahn, R.; Levy, R.; Verduzco, C.; Villeneuve, P.J. Global Estimates of Ambient Fine Particulate Matter Concentrations from Satellite-Based Aerosol Optical Depth: Development and Application. Environ. Health Perspect 2020, 118, 847–855. [Google Scholar] [CrossRef] [Green Version]
  25. Vlachogianni, A.; Kassomenos, P.; Karppinen, A.; Karakitsios, S.; Kukkonen, J. Evaluation of a multiple regression model for the forecasting of the concentrations of NOx and PM10 in Athens and Helsinki. Sci. Total. Environ. 2011, 409, 1559–1571. [Google Scholar] [CrossRef] [PubMed]
  26. Yeganeh, B.; Pour Motlagh, M.S.; Rashidi, Y.; Kamalan, H. Prediction of CO concentrations based on a hybrid Partial Least Square and Support Vector Machine model. Atmos. Environ. 2012, 55, 357–365. [Google Scholar] [CrossRef]
  27. Liu, X.; Yu, X.; Zhang, Z. PM2.5 Concentration Differences between Various Forest Types and Its Correlation with Forest Structure. Atmosphere 2015, 6, 1801–1815. [Google Scholar] [CrossRef] [Green Version]
  28. Kam, W.; Cheung, K.; Daher, N.; Sioutas, C. Particulate matter (PM) concentrations in underground and ground-level rail systems of the Los Angeles Metro. Atmos. Environ. 2011, 45, 1506–1516. [Google Scholar] [CrossRef]
  29. Cheng, Y.-H.; Chang, H.-P.; Yan, J.-W. Temporal Variations in Airborne Particulate Matter Levels at an Indoor Bus Terminal and Exposure Implications for Terminal Workers. Aerosol Air Qual. Res. 2012, 12, 30–38. [Google Scholar] [CrossRef] [Green Version]
  30. Zheng, G.J.; Duan, F.K.; Su, H.; Ma, Y.L.; Cheng, Y.F.; Zheng, B.; Zhang, Q.; Huang, T.; Kimoto, T.; Chang, D.; et al. Exploring the severe winter haze in Beijing: The impact of synoptic weather, regional transport and heterogeneous reactions. Atmospheric Chem. Phys. Discuss. 2015, 15, 2969–2983. [Google Scholar] [CrossRef] [Green Version]
  31. Zhu, C.; Przybysz, A.; Chen, Y.; Guo, H.; Chen, Y.; Zeng, Y. Effect of spatial heterogeneity of plant communities on air PM10 and PM2.5 in an urban forest park in Wuhan, China. Urban For. Urban Green. 2019, 46, 126487. [Google Scholar] [CrossRef]
  32. Zhang, X.; Lyu, J.; Han, Y.; Sun, N.; Sun, W.; Li, J.; Liu, C.; Yin, S. Effects of the leaf functional traits of coniferous and broad-leaved trees in subtropical monsoon regions on PM2. 5 dry deposition velocities. Environ. Pollut. 2020, 265, 114845. [Google Scholar] [CrossRef] [PubMed]
  33. Han, L.; Zhou, W.; Li, W. City as a major source area of fine particulate (PM2.5) in China. Environ. Pollut. 2015, 206, 183–187. [Google Scholar] [CrossRef]
  34. Sordillo, J.E.; Cardenas, A.; Qi, C.; Rifas-Shiman, S.L.; Coull, B.; Luttmann-Gibson, H.; Schwartz, J.; Kloog, I.; Hivert, M.-F.; DeMeo, D.L.; et al. Residential PM2.5 exposure and the nasal methylome in children. Environ. Int. 2021, 153, 106505. [Google Scholar] [CrossRef]
  35. Xiao, Q.; Wang, Y.; Chang, H.H.; Meng, X.; Geng, G.; Lyapustin, A.; Liu, Y. Full-coverage high-resolution daily PM2.5 esti-mation using MAIAC AOD in the Yangtze River Delta of China. Remote Sens. Environ. 2017, 199, 437–446. [Google Scholar] [CrossRef]
  36. Zhang, L.; Pan, J. Temporal and spatial patterns of China’s PM2.5 population exposure risk. China Environ. Sci. 2020, 40, 1–12. [Google Scholar]
  37. Abtahi, M.; Dobaradaran, S.; Torabbeigi, M.; Jorfi, S.; Gholamnia, R.; Koolivand, A.; Darabi, H.; Kavousi, A.; Saeedi, R. Health risk of phthalates in water environment: Occurrence in water resources, bottled water, and tap water, and burden of disease from exposure through drinking water in tehran, Iran. Environ. Res. 2019, 173, 469–479. [Google Scholar] [CrossRef] [PubMed]
  38. Hixson, M.; Mahmud, A.; Hu, J.; Kleeman, M.J. Resolving the interactions between population density and air pollution emissions controls in the San Joaquin Valley, USA. J. Air Waste Manag. Assoc. 2012, 62, 566–575. [Google Scholar] [CrossRef]
  39. Mohanty, M.P.; Simonovic, S.P. Understanding dynamics of population flood exposure in Canada with multiple high-resolution population datasets. Sci. Total. Environ. 2021, 759, 143559. [Google Scholar] [CrossRef]
  40. Jaber, S.M. Is there a relationship between human population distribution and land surface temperature? Global perspective in areas with different climatic classifications. Remote. Sens. Appl. Soc. Environ. 2020, 20, 100435. [Google Scholar] [CrossRef]
  41. Kousa, A.; Oglesby, L.; Koistinen, K.; Künzli, N.; Jantunen, M. Exposure chain of urban air PM2.5—associations between ambient fixed site, residential outdoor, indoor, workplace and personal exposures in four European cities in the EXPOLIS-study. Atmospheric Environ. 2002, 36, 3031–3039. [Google Scholar] [CrossRef]
  42. Zou, B.; Peng, F.; Peng, L.; Weng, M. Research on GIS Spatial Zoning of High-resolution Population Air Pollution Exposure. J. Wuhan Univ. 2013, 38, 334–338. [Google Scholar]
  43. Sen, P.K. Estimates of the regression coefficient based on Kendall’s tau. J. Am. Stat. Assoc. 1968, 63, 1379–1389. [Google Scholar] [CrossRef]
  44. Kendall, M.G. Rank correlation methods. Br. J. Psychol. 1955, 25, 86–91. [Google Scholar] [CrossRef]
  45. Xu, J. Mathematical Methods in Modern Geography; Higher Education Press: Beijing, China, 2016. [Google Scholar]
  46. Zhang, L.; Wilson, J.P.; MacDonald, B.; Zhang, W.; Yu, T. The changing PM2.5 dynamics of global megacities based on long-term remotely sensed observations. Environ. Int. 2020, 142, 105862. [Google Scholar] [CrossRef]
  47. He, C.Y.; Gao, B.; Huang, Q.X.; Ma, Q.; Dou, Y.Y. Environmental degradation in the urban areas of China: Evidence from multi-source remote sensing data. Remote. Sens. Environ. 2017, 193, 65–75. [Google Scholar] [CrossRef]
  48. Akyuz, E.; Samavati, M.; Kaynak, B. Spatial distribution of health risks associated with PM2.5 in Turkey and Iran using satellite and ground observations. Atmospheric Pollut. Res. 2020, 11, 2350–2360. [Google Scholar] [CrossRef]
  49. Peng, J.; Chen, S.; Lü, H.; Liu, Y.; Wu, J. Spatiotemporal patterns of remotely sensed PM 2.5 concentration in China from 1999 to 2011. Remote. Sens. Environ. 2016, 174, 109–121. [Google Scholar] [CrossRef]
  50. Vieno, M.; Heal, M.R.; Williams, M.L.; Carnell, E.J.; Nemitz, E.; Stedman, J.R.; Reis, S. The sensitivities of emissions re-ductions for the mitigation of UK PM2.5. Atmos. Chem. Phys. 2016, 16, 265–276. [Google Scholar] [CrossRef] [Green Version]
  51. Giani, P.; Castruccio, S.; Anav, A.; Howard, D.; Hu, W.; Crippa, P. Short-term and long-term health impacts of air pollution reductions from COVID-19 lockdowns in China and Europe: A modelling study. Lancet Planet. Health 2020, 4, e474–e482. [Google Scholar] [CrossRef]
  52. Karagöz, M.; Demirel, B.; Bozdağ, E.G. Pass-through Effect from Exchange Rates to the Prices in the Framework of Inflation Targeting Policy: A Comparison of Asia-Pacific, South American and Turkish Economies. Procedia Econ. Finance 2016, 38, 438–445. [Google Scholar] [CrossRef] [Green Version]
  53. Harding, S. State of the field: Latin American decolonial philosophies of science. Stud. Hist. Philos. Sci. Part A 2019, 78, 48–63. [Google Scholar] [CrossRef] [PubMed]
  54. Guo, Y.; Zeng, H.; Zheng, R.; Li, S.; Barnett, A.; Zhang, S.; Zou, X.; Huxley, R.; Chen, W.; Williams, G. The association between lung cancer incidence and ambient air pollution in China: A spatiotemporal analysis. Environ. Res. 2016, 144, 60–65. [Google Scholar] [CrossRef]
  55. Deng, S.; Ma, J.; Zhang, L.; Jia, Z.; Ma, L. Microclimate simulation and model optimization of the effect of roadway green space on atmospheric particulate matter. Environ. Pollut. 2019, 246, 932–944. [Google Scholar] [CrossRef] [PubMed]
  56. Wu, H.; Yang, C.; Chen, J.; Yang, S.; Lu, T.; Lin, X. Effects of Green space landscape patterns on particulate matter in Zhejiang Province, China. Atmos. Pollut. Res. 2018, 9, 923–933. [Google Scholar] [CrossRef]
Figure 1. Spatial Distribution of Verification Points of PM2.5 Data.
Sustainability 13 07427 g001
Figure 2. Global average PM2.5 concentration of spatial distribution from 2000 to 2016 (a); changes in PM2.5 concentration of in various continents (b).
Sustainability 13 07427 g002
Figure 3. Global population average spatial distribution from 2000 to 2016.
Sustainability 13 07427 g003
Figure 4. The spatial distribution of annual average PM2.5 population exposure risk globally from 2000 to 2016.
Sustainability 13 07427 g004aSustainability 13 07427 g004bSustainability 13 07427 g004c
Figure 5. Population percentage of exposure exceeding the 5 μg/m3 limit of each level.
Sustainability 13 07427 g005
Figure 6. Average population exposure risk of PM2.5 in all continents of the world from 2000 to 2016.
Sustainability 13 07427 g006
Figure 7. Temporal changes of average global population exposure risk of PM2.5 from 2000 to 2006.
Sustainability 13 07427 g007
Figure 8. Linear change trend of global population exposure to PM2.5.
Sustainability 13 07427 g008
Figure 9. Stability of global population exposure risk of PM2.5.
Sustainability 13 07427 g009
Figure 10. Population distribution under high exposure risk of PM2.5.
Sustainability 13 07427 g010
Figure 11. Population density distribution under high exposure risk of PM2.5.
Sustainability 13 07427 g011
Table 1. Division of Population Exposure Risk Value of PM2.5.
Population Exposure Risk ValuePopulation Exposure Risk Levels
Ri = 0extremely low risk
0 ˂ Ri ≤ 1low risk
1 < Ri ≤ 2relatively low risk
2 < Ri ≤ 3general risk
3 < Ri ≤ 4relatively high risk
4 < Ri ≤ 5high risk
Ri > 5extremely high risk
Publisher’s Note: MDPI stays neutral with regard to jurisdictional claims in published maps and institutional affiliations.

