
Friendly Locals and Clean Streets?—Evaluating Jakarta’s Destination Brand Image
by
 ,
,
Chandra Setiawan
1 ,
,
Bryna Meivitawanli
2,
Mary-Paz Arrieta-Paredes
3,
Alastair M. Morrison
4,* and
J. Andres Coca-Stefaniak
4 1
Faculty of Business, President University, Bekasi 17530, Indonesia
2
Binus Business School, Bina Nusantara University, Jakarta 10271, Indonesia
3
International Business and Economics Department, University of Greenwich, London SE10 9LS, UK
4
Greenwich Business School, Marketing, Events and Tourism Department, University of Greenwich, London SE10 9LS, UK
*
Author to whom correspondence should be addressed.
Sustainability 2021, 13(13), 7434; https://doi.org/10.3390/su13137434
Submission received: 7 June 2021
/
Revised: 30 June 2021
/
Accepted: 30 June 2021
/
Published: 2 July 2021
(This article belongs to the Collection Advances in Marketing and Managing Tourism Destinations)
Abstract
:Destination image and city branding are accumulating a growing body of knowledge in urban studies and tourism literature. Although several visitor destination image models have been proposed, the most prevalent in Asia remains the comprehensive destination image model. This is the first research to test the applicability of this model beyond the United States and with international (rather than domestic) visitors. Jakarta is chosen as the geographical test area for this study, which incorporates structural equation modeling on a data sample of international leisure visitors in Jakarta. The findings indicate that the destination image model could be generalized beyond the US and applied to Jakarta. This study finds that tourism policymakers in Jakarta should focus on promoting the friendliness of local residents and improving the city’s cleanliness, as these are the two most positive and negative perceptions. Overall, this study showed that a unique destination image—a largely under-researched topic in place branding—is a variable that should be considered when formulating the overall place image of city destinations around the world.
1. Introduction
Place branding has been applied to the promotion of nations, with a growing trend toward the more specific branding of urban destinations. In essence, nation and city branding are anchored in similar processes, albeit at different levels of governance [1,2,3,4]. This research uses destination branding to encapsulate these processes at differing levels, including cities. Historically, place branding and destination branding have emerged from a variety of disciplines, including marketing, public relations, international relations, public administration, public diplomacy, tourism, communication, and geography [5,6]. Not surprisingly, the diverse definitions of place branding is on par with the variety of disciplines contributing to the development of this body of knowledge [7]. Regardless, destination branding can be reduced to the concepts invoked in people’s minds when branding principles are applied to a place [8]. These associations can be modified to develop new and more desirable destination images. Scholars have developed and tested several models, items, and scales to analyze destination branding, with much of this focusing specifically on cities [9,10]. Regardless of the diverse and often contested interpretations of place branding [11], there appears to be consensus on place image playing a crucial role in destination branding [9,12,13,14,15]. Destination images have been studied since the early 1970s when a seminal study [16] examined the role of image in the development of tourism [17]. The depth and complexity of destination image have produced hundreds of studies investigating its various dimensions linked to overall place image [9,18,19,20,21,22,23]. In addition to the determinants of destination image, it is also essential to explore where destination image leads. Several studies have shown that there is a relationship between destination image and visitor behavior [24]. Therefore, this research focuses on the determinants of destination image and the relationship between this image and visitor behavioral intentions.
The two main research objectives were to evaluate the city brand of Jakarta (Indonesia) and to provide management and policy-making recommendations regarding the city’s existing place brand—Enjoy Jakarta. The research applied the comprehensive image destination model [24] to analyze data collected in Jakarta in 2015 to evaluate the city’s place brand. Although Jakarta’s city branding program has been in place for over 10 years, its popularity and success have suffered from ineffective implementation [25]. Recent political change in the national and city governments resulted in a renewed effort to reinvigorate the city’s brand.
2. Literature Review
2.1. Place and Destination Branding
Branding as a concept has been studied widely, with a considerable body of knowledge now available to build on. Brands have been defined as sources of differentiation (e.g., a logo, trademark, or package design) intended to identify the goods or services of either one seller or a group of sellers, with a clear competitive positioning compared to competitors [26]. In tourism, the goods and services are embodied by destinations. Although destination branding has not been studied quite as long as general branding, the literature is awash with different definitions. Scholarly research [27] has synthesized many of these definitions into a comprehensive definition describing destination branding as “a set of activities that first support the creation of a name, symbol, logo, wordmark or other graphics that readily identifies and differentiates a destination” which are implemented by “consistently conveying the expectations of a memorable travel experience uniquely associated with the destination, which serve to consolidate and reinforce the emotional connection between the visitor and the destination”, whilst reducing the cost and perceived risks among potential visitors when researching destinations. Effective destination branding has been linked to enhanced visitor experiences, reduced visitor search costs, and the creation of a unique selling proposition [15]. This is particularly important as the competition among destinations continues to grow [28,29].
The lack of consensus with regards to definitions of destination branding is mirrored in the variety of frameworks and theories that are applied. Recently, researchers have considered brand personality [30,31]; brand equity [32,33]; brand or place identity [34,35]; brand complexity [36,37]; place attachment [38,39]; and symbolic capital [40]. Nevertheless, there seems to be a wider level of agreement that destination branding is related to destination image [9], though this remains contested by some scholars [41] and, by extension, to the perceptions of target audiences [5,42].
2.2. Destination Image
Some of the earliest research on destination image was carried out in 1975 [15]. Since then, a growing body of knowledge has developed, making it arguably one of the dominant topics in tourism research [16]. Although there exist numerous definitions of destination image, one of the most widely accepted [14,16] remains that by Crompton [43], who linked the concept to the “beliefs, ideas and impressions that a person has of a destination”. Given the relatively abstract nature of definitions, destination image has been more commonly conceptualized using constructs and frameworks, with a considerable number of determinants of destination image identified in the literature [44]. Examples of this that were compiled [9] include the six dimensions of city image (presence, place, potential, pulse, people, and prerequisites) [45]; the four dimensions (urbanity and diversity, nature and recreation, job opportunities, and cost efficiency) [46]; and the four dimensions of destination image (infrastructure, attraction, value for money and enjoyment) [20].
Echtner and Ritchie’s [19] review of destination image research compiled research methodologies, which included sets of attributes ranging from 10 to 32, though the most frequently used attributes were found to be scenery/natural attractions and costs/price levels. However, one of the most cited models remains a multidimensional construct with two key dimensions: cognitive and affective or tangible and intangible [14,16]. The cognitive dimension refers to beliefs and knowledge about the physical attributes of a destination, while the affective component is the appraisal of feelings toward the attributes and the surrounding environments [16]. While most destination image studies only tend to take into account the cognitive component without including the affective [14,45], some studies included the affective element [46,47,48]. Both of these dimensions are important and deserve to be taken into account. Additionally, a third component (unique image) was added to the model making the destination image a tri-dimensional construct [24]. It is arguably this uniqueness (or authenticity) that compels a growing number of tourists to choose a specific destination over other alternatives [24,28,49].
2.3. Tourist Behavioral Intentions
Consumer behavior is important in image development and branding. There is a growing body of knowledge related to the influence of the destination image on tourist behavior [18,50,51,52]. It has been shown that destinations with strong positive images are more likely to be considered and chosen in the travel decision process [53], even if the destination image influences more than just the destination selection process, such as general tourist behaviors. Qu et al.’s [24] study showed that there are two key elements of tourist behavior that merit further analysis, namely intentions to revisit and recommend the destination. These two behavioral intentions are inextricably linked to customer loyalty and retention. Positive word-of-mouth is also an important factor influencing consumer’s choice of destination [54]. Other studies have shown that a destination’s overall image is one of the most important factors affecting visitors’ intentions to repeat their trips to that destination [50,55] and that a person with a positive perception of a destination is more likely to recommend that destination to others [50].
2.4. Conceptual Model and Hypotheses
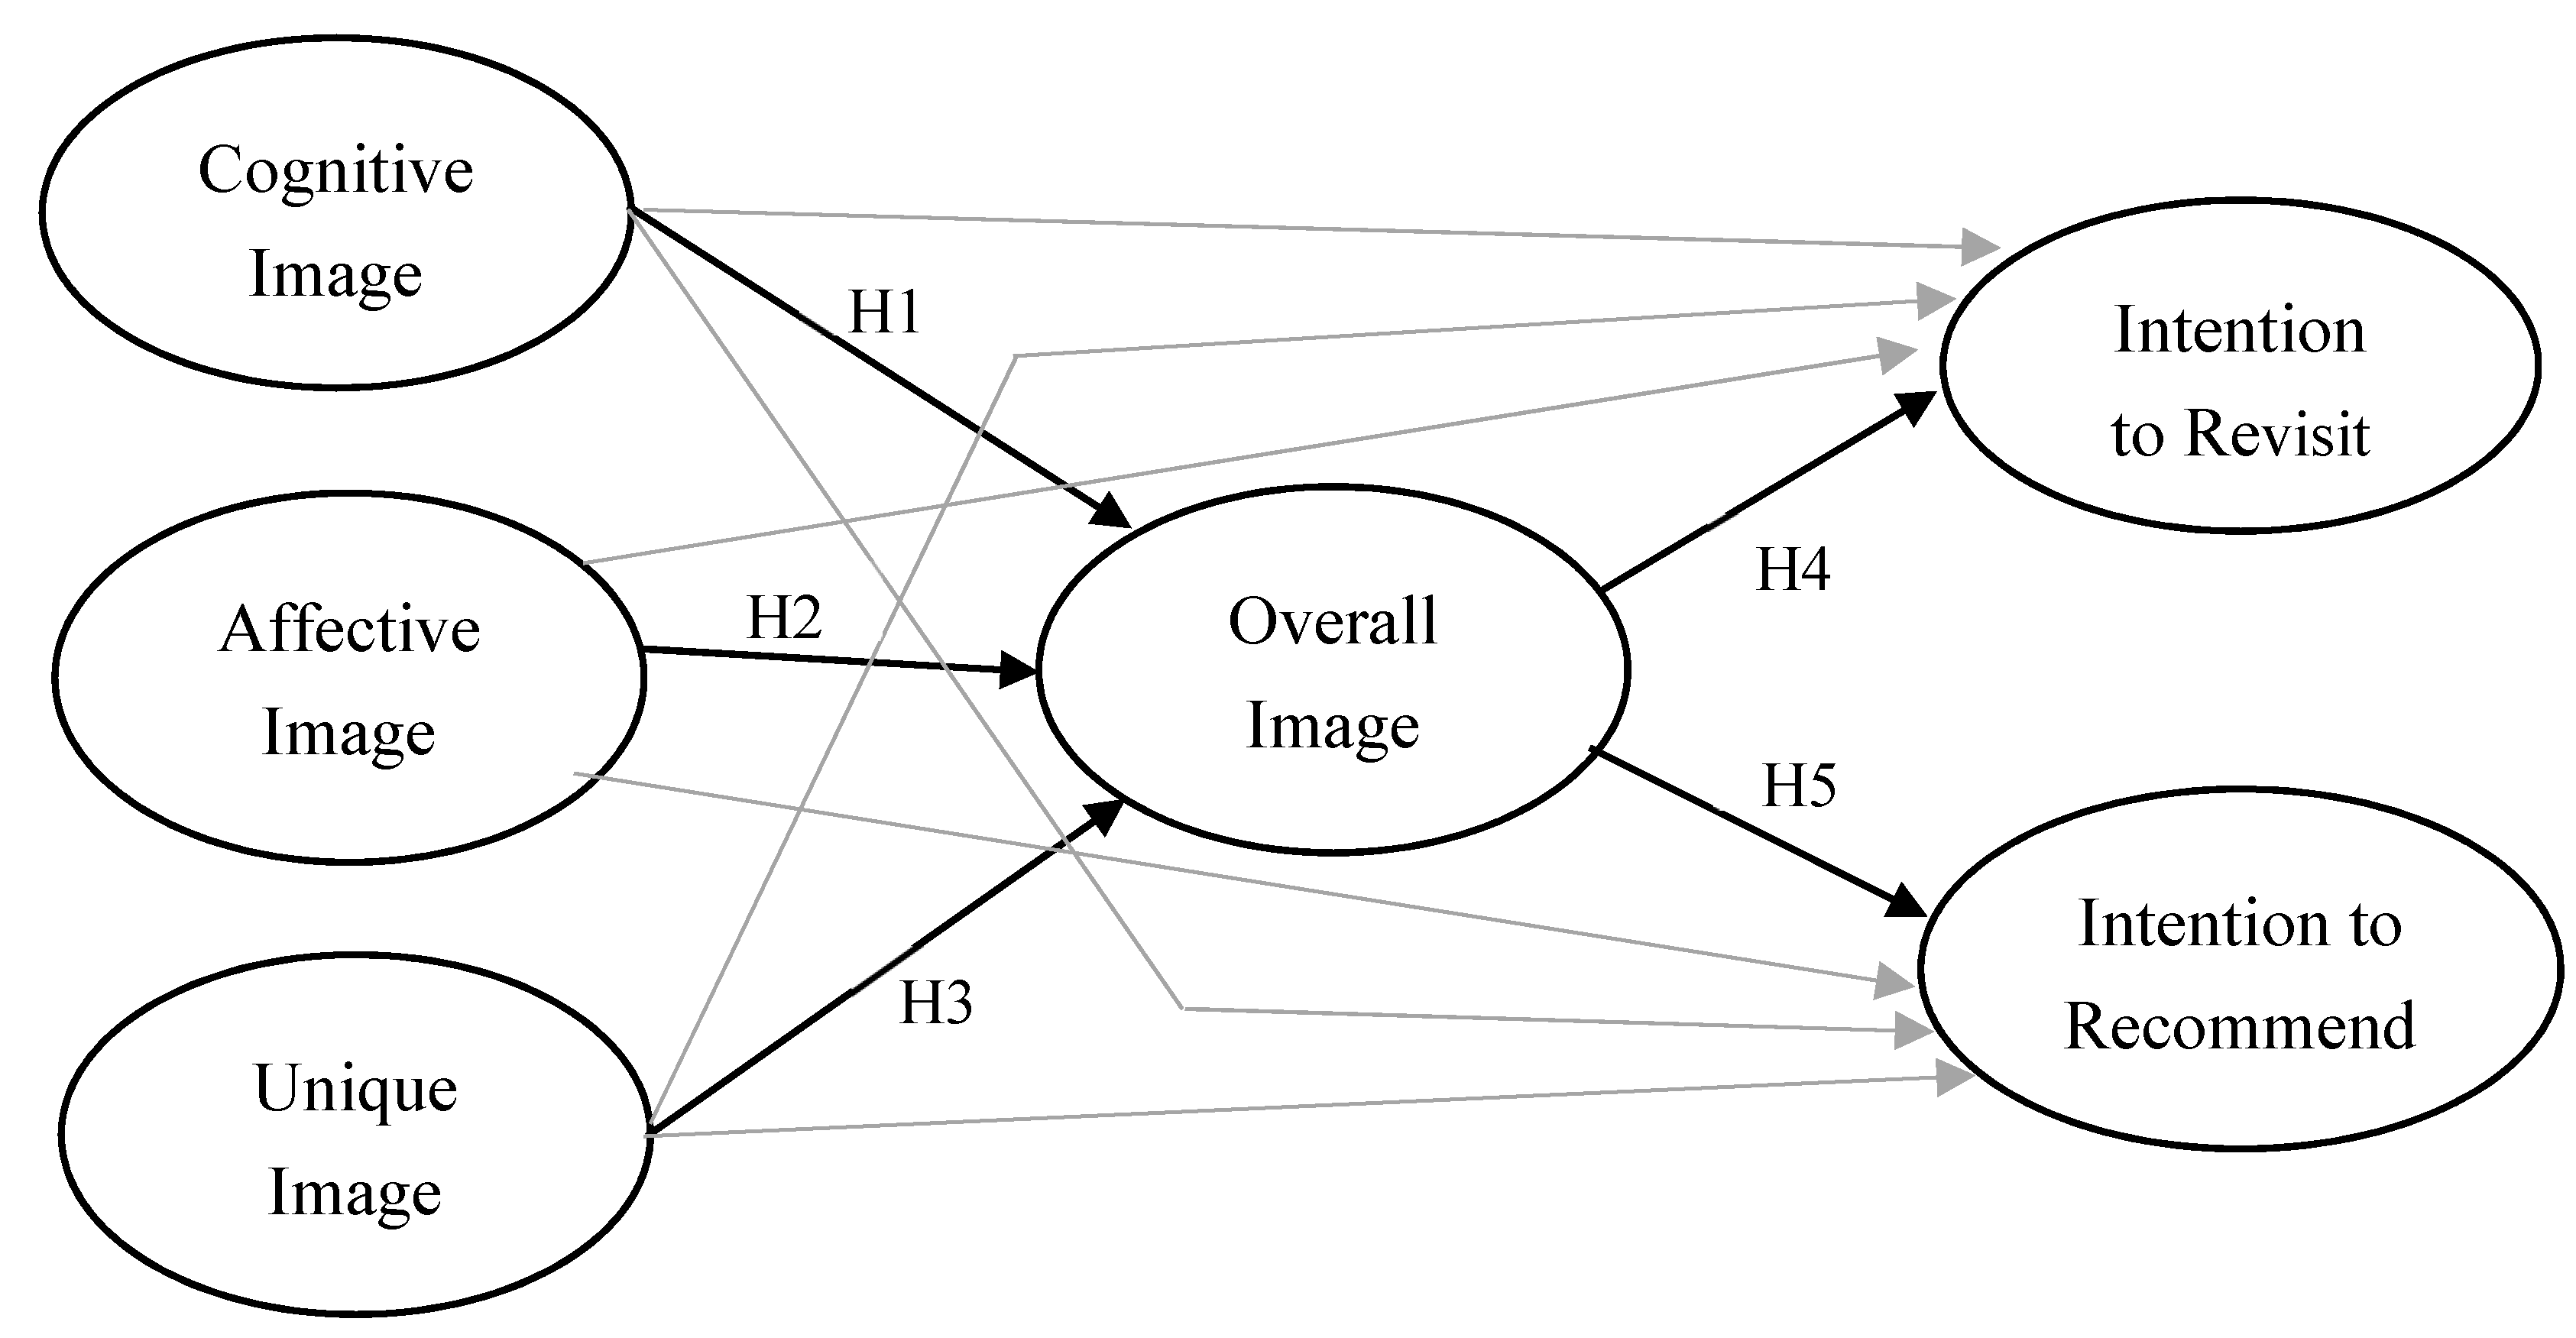
The approach put forward by Qu et al. [24] forms the framework for this research’s proposed model shown in Figure 1. According to the proposed model, the following five hypotheses were specified for testing:
Hypotheses 1 (H1):
A visitor destination’s cognitive image affects the overall image of the destination.
Hypotheses 2 (H2):
A visitor destination’s affective image affects the overall image of the destination.
Hypotheses 3 (H3):
A visitor destination’s unique image affects the overall image of the destination.
Hypotheses 4 (H4):
Visitors’ perceptions of a destination’s overall image mediate the relationships between three destination brand images (cognitive, affective, and unique images) and people’s intentions to revisit the destination.
Hypotheses 5 (H5):
Visitors’ perceptions of a destination’s overall image mediate the relationships between three destination brand images (cognitive, affective, and unique images) and people’s intentions to recommend the destination to others.
Figure 1.
Proposed model. Source: Adjusted from Qu, H., Kim, L. H., and Im, H. H. (2011). A model of destination branding: Integrating the concepts of the branding and destination image. Tourism Management, 32(3), p. 468. (Note: the grey arrows indicate potential direct effects tested to determine the overall image’s level of mediation).

3. Methodology
3.1. Survey Questionnaire and Administration
The survey questionnaire was structured using the framework provided by Qu et al. [24] and was divided into three sections. The first section focused on individual travel trip characteristics and demographic information (e.g., the purpose of visit, length of stay, gender, age, etc.), and information sources used as part of the decision-making process to select the destination. The second section investigated respondents’ cognitive, unique, effective, and overall images of Jakarta as a travel destination. The cognitive image included 27 items measured on a 5-point Likert scale (1 = strongly disagree; 2 = disagree; 3 = neutral; 4 = agree; and 5 = strongly agree). The method used was adapted from Echtner and Ritchie’s [19] study on destination images. The unique image items were developed on the basis of existing promotional literature about Jakarta and other cities. The affective image items were developed building on a study by Russel [55] and included four bipolar scales: sleepy-arousing, unpleasant-pleasant, gloomy-exciting, and distressing-relaxing on a 7-point semantic differential scale, where the negative poles were assigned to smaller values (e.g., 1 = sleepy and 7 = arousing). The overall destination image was adapted from Stern and Krakover [56], using a 7-point scale, which ranged from 1 as “very negative” to 7 as “very positive”. The third section included two questions aimed at eliciting whether respondents intended to visit Jakarta again and their intention to recommend Jakarta to others using a 5-point Likert-type scale (1 = most unlikely; 5 = most likely). The questionnaire contained 45 scale items: questions 1 to 27 were related to cognitive images; 28 to 38 dealt with unique images; 39 to 42 targeted affective images; 43 dealt with the overall image, 44 with an intention to revisit, and 45 with an intention to recommend the destination.
The data were collected using a survey questionnaire administered online and via hard copy to international tourists who visited Jakarta. The online questionnaire resulted in 23 responses, of which only 17 were usable. The offline (paper-based) questionnaire was distributed to international tourists visiting Jakarta between July 2015 and December 2015, with an overall data collection span of six months. Overall, 311 useable questionnaires were obtained. The questionnaire was distributed at several tourist attractions in Jakarta including the Grand Indonesia Mall, Kota Tua (Old Town), Jalan Jaksa (Jaksa Street), Monumen Nasional (National Monument), and Central Park Mall, with the majority of responses obtained at Kota Tua (Old City).
3.2. Data Analysis
The data were analyzed using structural equation modeling (SEM) with confirmatory factor analysis (CFA) chosen over exploratory factor analysis since the objective was to test an established model [24] where all the relationships among variables had already been confirmed using exploratory factor analysis. The data were analyzed using LISREL 8.8. as in the original study [24] to avoid any differences in the results obtained potentially attributable to different software versions. SPSS 23 was applied to generate descriptive results and perform reliability tests.
The construct validity was tested in this study with confirmatory factor analysis using the lambda (λ) coefficient in a similar fashion to factor loadings in EFA [55]. In spite of the fact that the confirmation of validity rendered further tests for reliability unnecessary [57], measuring reliability by analyzing internal reliability using Cronbach’s alpha (α) was employed, with a value of 0.7 used as the benchmark for reliability in line with earlier studies [58]. Two models were tested and compared to establish whether the three destination images were fully or partially mediated by the overall image.
4. Results and Discussion
4.1. Descriptive Statistics
4.1.1. Demographics, Origins, and Lengths of Stay
The age of the respondents varied from 16 to 71 years, rendering an average value of 29.8 with a mode of 23 years. Most were not married (228 respondents), with a majority of respondents being male (53.4%). There was also a wide range among respondents in terms of country of origin, with a total of 44 nationalities represented including countries in Europe, Asia, the Americas, Africa, the Middle East, and Oceania. The highest number of respondents originated from the Netherlands (80), representing 25% of the sample, which may be due in part to the historical links between Indonesia and the Netherlands.
The respondents were generally well educated, with 75.7% having university degrees. The lengths of stay in Jakarta were relatively short. Some 39.2% were in the city for less than three days, and 43.7% were staying for three to five days.
4.1.2. Cognitive Images
Table 1 shows the mean score for all image items. The highest mean score (4.35) was for friendly local people (Q7). Other cognitive images with higher scores included delicious local cuisine (Q8), good weather (Q12), a wide choice of accommodations (Q18), reasonable cost of hotels/restaurants (Q3), native Indonesian culture (Q26), and rich historic and cultural sites (Q27).
Only one of the 27 cognitive image items was ranked below the scale’s mid-point of 3.0. The lowest cognitive image item median score was for a clean/unspoiled environment (Q15). The highest median of 5 was for friendly local people. Most of the items had medians of 3, which shows that respondents perceived Jakarta neither very positively nor very negatively. These scores should be of some concern to the destination management officials in Jakarta.
4.1.3. Unique Images
The highest median score for unique images was 4. Only three out of 11 had median scores of 4. The rest had medians of 3. This is similar to Jakarta’s cognitive image.
4.1.4. Affective Images
The scale for the affective image was different than for the cognitive and unique, ranging from 1 to 7, with 4 as the neutral mid-point. The medians were mostly at 5, which again was slightly above neutral. The most negative score with a median of 4 was relaxing (Q41).
4.1.5. Overall Image of Jakarta
The median score for the overall image of Jakarta (Q43) was positive at 5.
4.1.6. Future Intentions
The intention to recommend (Q45) had a median score of 4, which was slightly higher than the intention to revisit (Q44) at 3.
4.2. Confirmatory Factor Analysis
4.2.1. Validity and Reliability Tests
The image items were further analyzed using SEM and CFA. Earlier studies of a similar nature have tended to eliminate factors with loadings lower than 0.40. However, in this research, factors with a lambda (λ) coefficient lower than 0.50 were excluded so as to increase validity. On this basis, 19 factors (Table 2) were chosen for further analysis. Although reliability tends to be implicit once validity has been justified, a reliability analysis using Cronbach’s alpha (α) was carried out as a double-check on the reliability of these data. The Cronbach’s alpha (α) values for the cognitive, unique, and affective images were found to be 0.849, 0.778, and 0.766 respectively. All data were deemed reliable as a result, given that similar earlier studies, as well as methodological discussions [57], have generally deemed 0.7 to be an acceptable threshold of reliability. Similarly, a number of items had a good fit, as shown in Table 3.
4.2.2. Goodness of Fit Tests
The most commonly used goodness of fit test is chi-square. In this research, a high value of 543.48 was obtained (Table 3). However, this type of test tends to be sensitive to sample size, whereby the chi-square analysis nearly always rejects the model when large samples are used [59,60]. To reduce the impact of sample size, researchers have suggested carrying out a relative/normed chi-square analysis. In this research, the value obtained was 2.7, which falls well within the generally accepted value range of more than 2 [61,62] up to less than 5 [63]. Given that earlier studies have found several limitations related to the chi-square tests, this research carried out a root mean square error of approximation (RMSEA) analysis, which resulted in a value of 0.076—well below the maximum 0.08 threshold for a good fit [64,65]. Other indices used to ascertain a good fit with the model included NFI, NNFI, CFI, IFI, and RFI rendered values above 0.90—the threshold above which a statistical good fit is deemed applicable [60,62]. As a result, it was concluded that there was a good fit between the model and the data.
This goodness of fit test was done twice since the first test indicated that the model did not have a good fit with the data, thus LISREL 8.8 suggested several modification indices. Three of these suggestions were applied, which were to establish a relationship between questions 23 and 24, questions 26 and 28, and questions 44 and 45. Question 24 was about adventurous activities and question 23 was about outdoor activities, which are similar and therefore a correlation between the two was quite high. Question 28 concerned native Indonesian cultures (unique image item) and question 26 also regarded native Indonesian cultures (cognitive image item). Since these two items were worded similarly, it was reasonable to consider them together. Question 45 was on intention to recommend and question 44 was on intention to revisit, both reflections of tourists’ intended future behavioral intentions. After these modifications were introduced, the results had the good fit indices discussed earlier.
4.3. Structural Equation Modeling
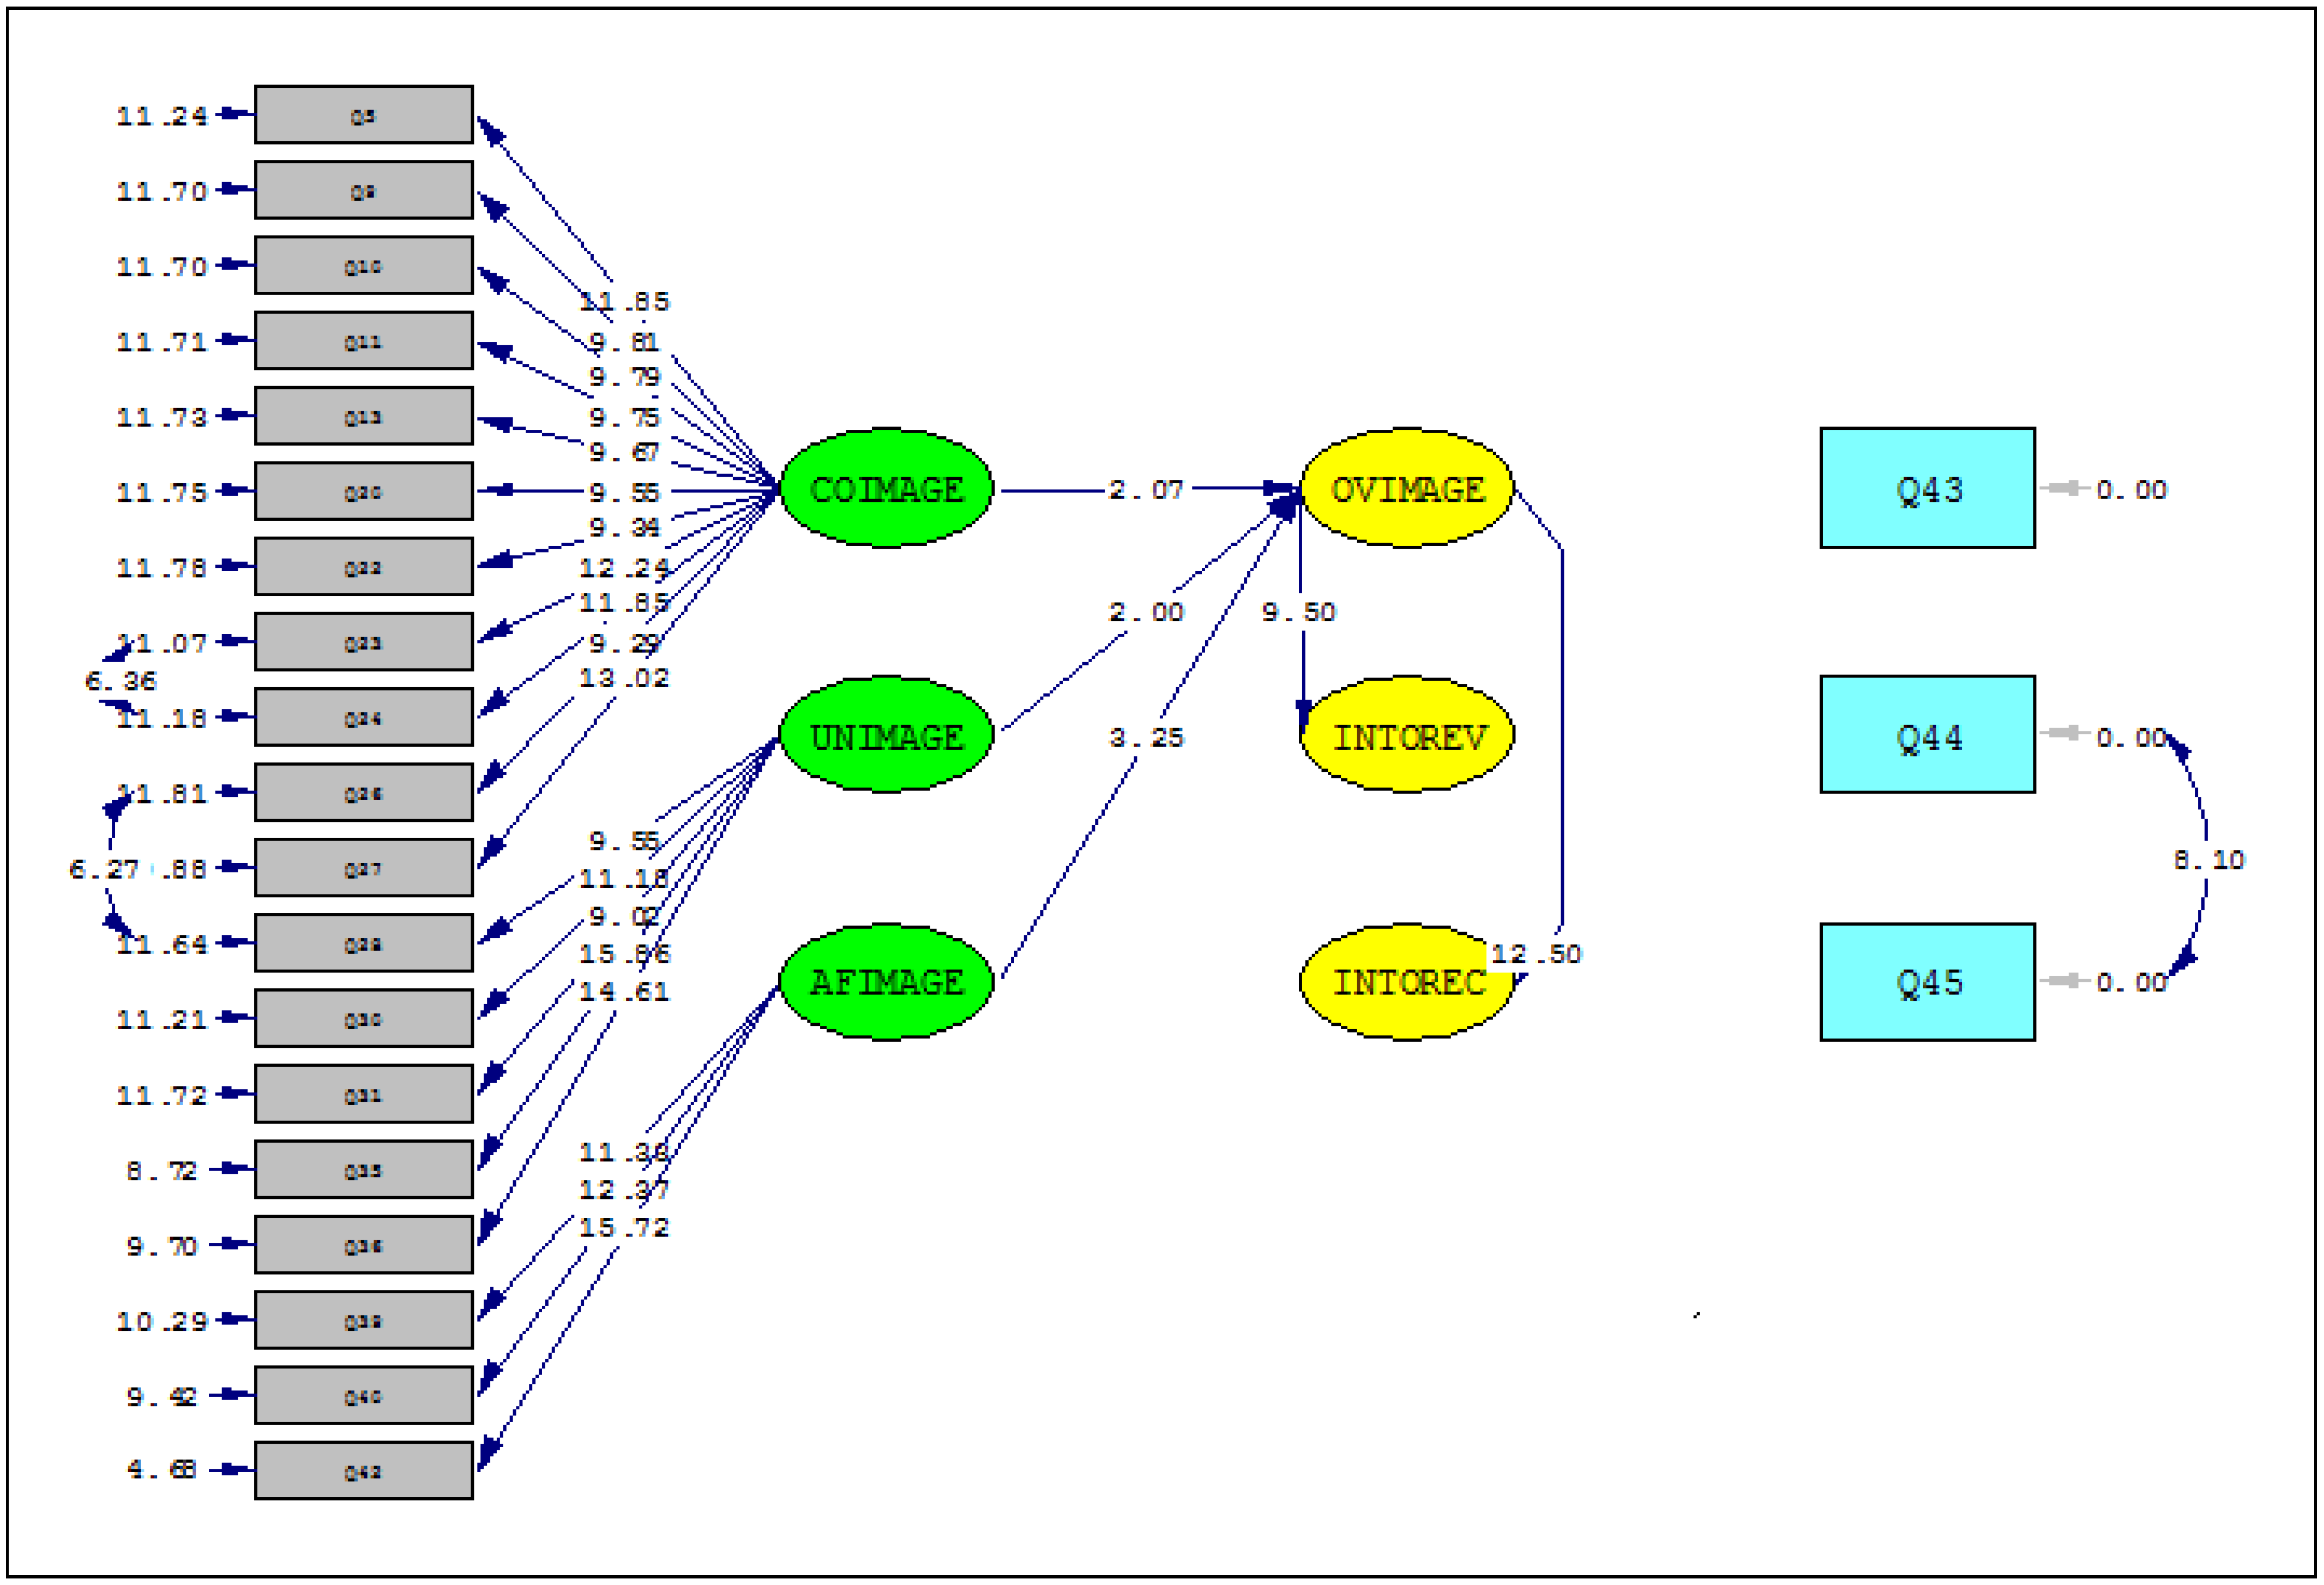
Figure 2 shows that the overall image mediated the relationship between the three destination image categories and behavioral intentions. The relationships between cognitive, unique, affective, and overall images, as well as the relationship between overall image and behavioral intentions (intention to revisit and intention to recommend destination to others), were all significant. However, further analysis was needed to determine whether the overall image was a full or partial mediator.
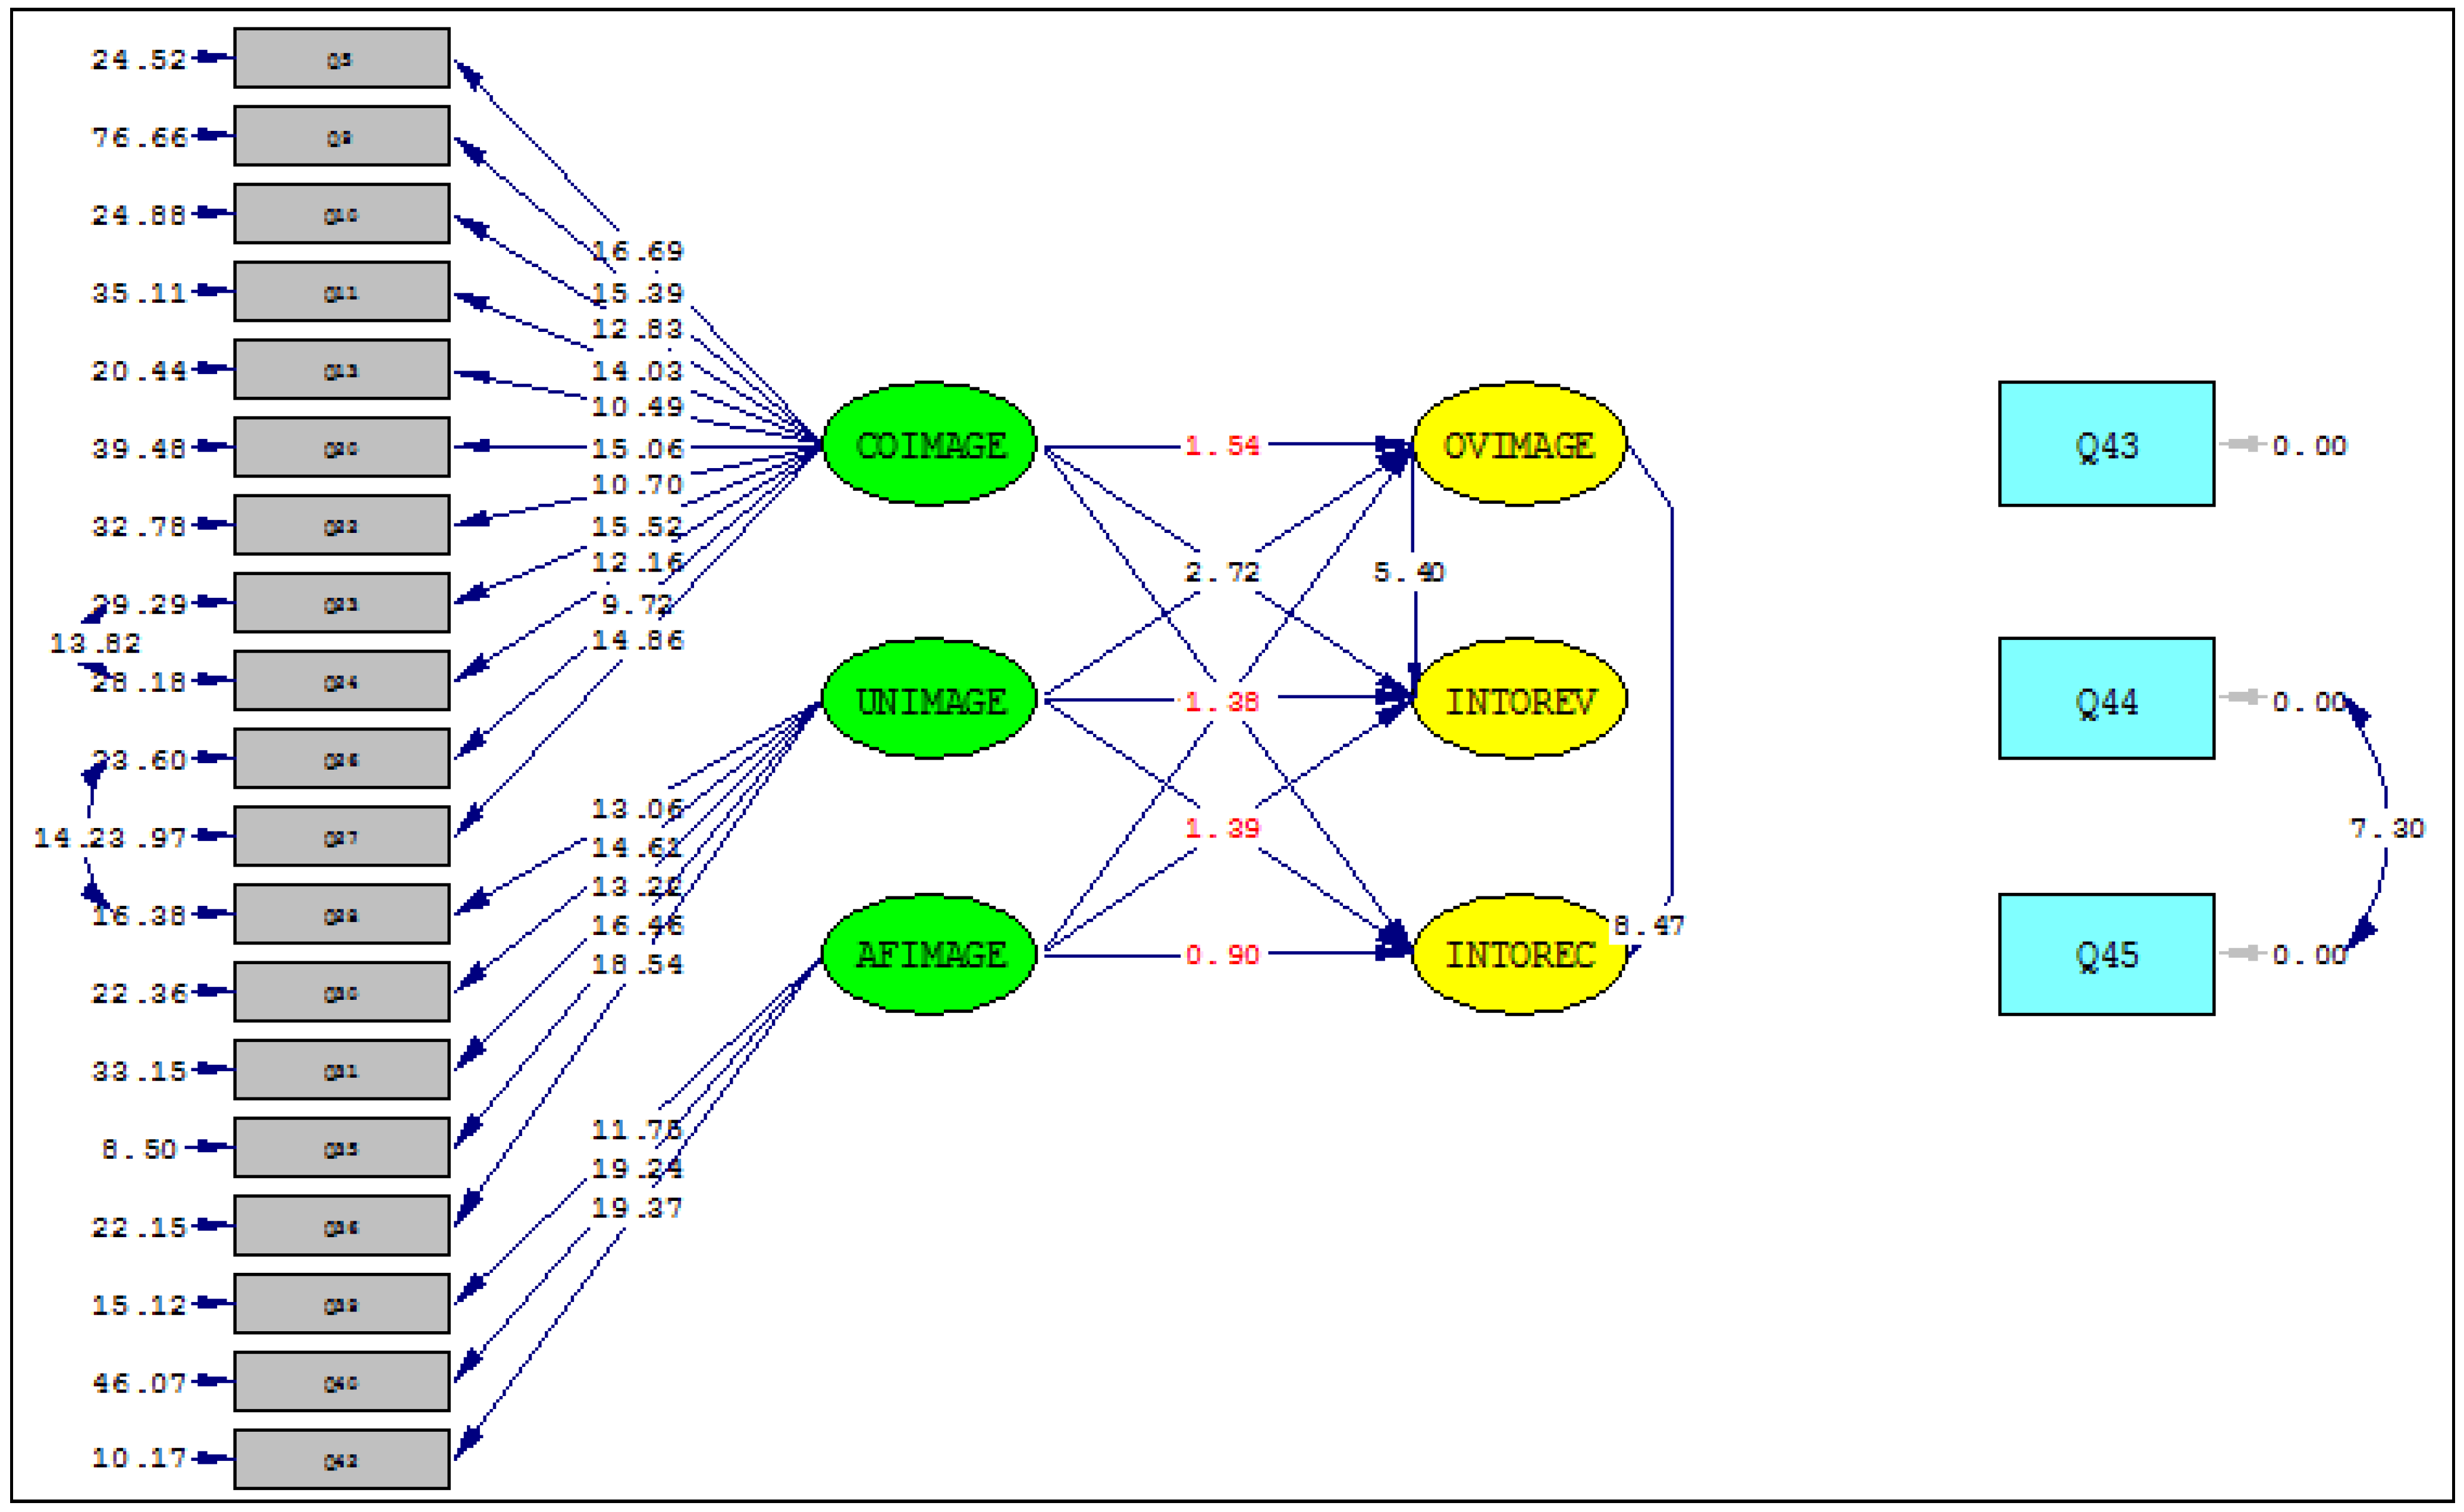
A competing model was analyzed and the results showed that the relationships between cognitive image and intention to recommend as well as the intention to revisit were significant (Figure 3). However, the relationships between the unique image and behavioral intentions, as well as the affective image and behavioral intentions, were not significant. Figure 3 shows the competing path diagram with corresponding t-values. Therefore, overall image was a partial mediator between cognitive image and behavioral intentions, while it was a full mediator between unique and affective images and behavioral intentions.
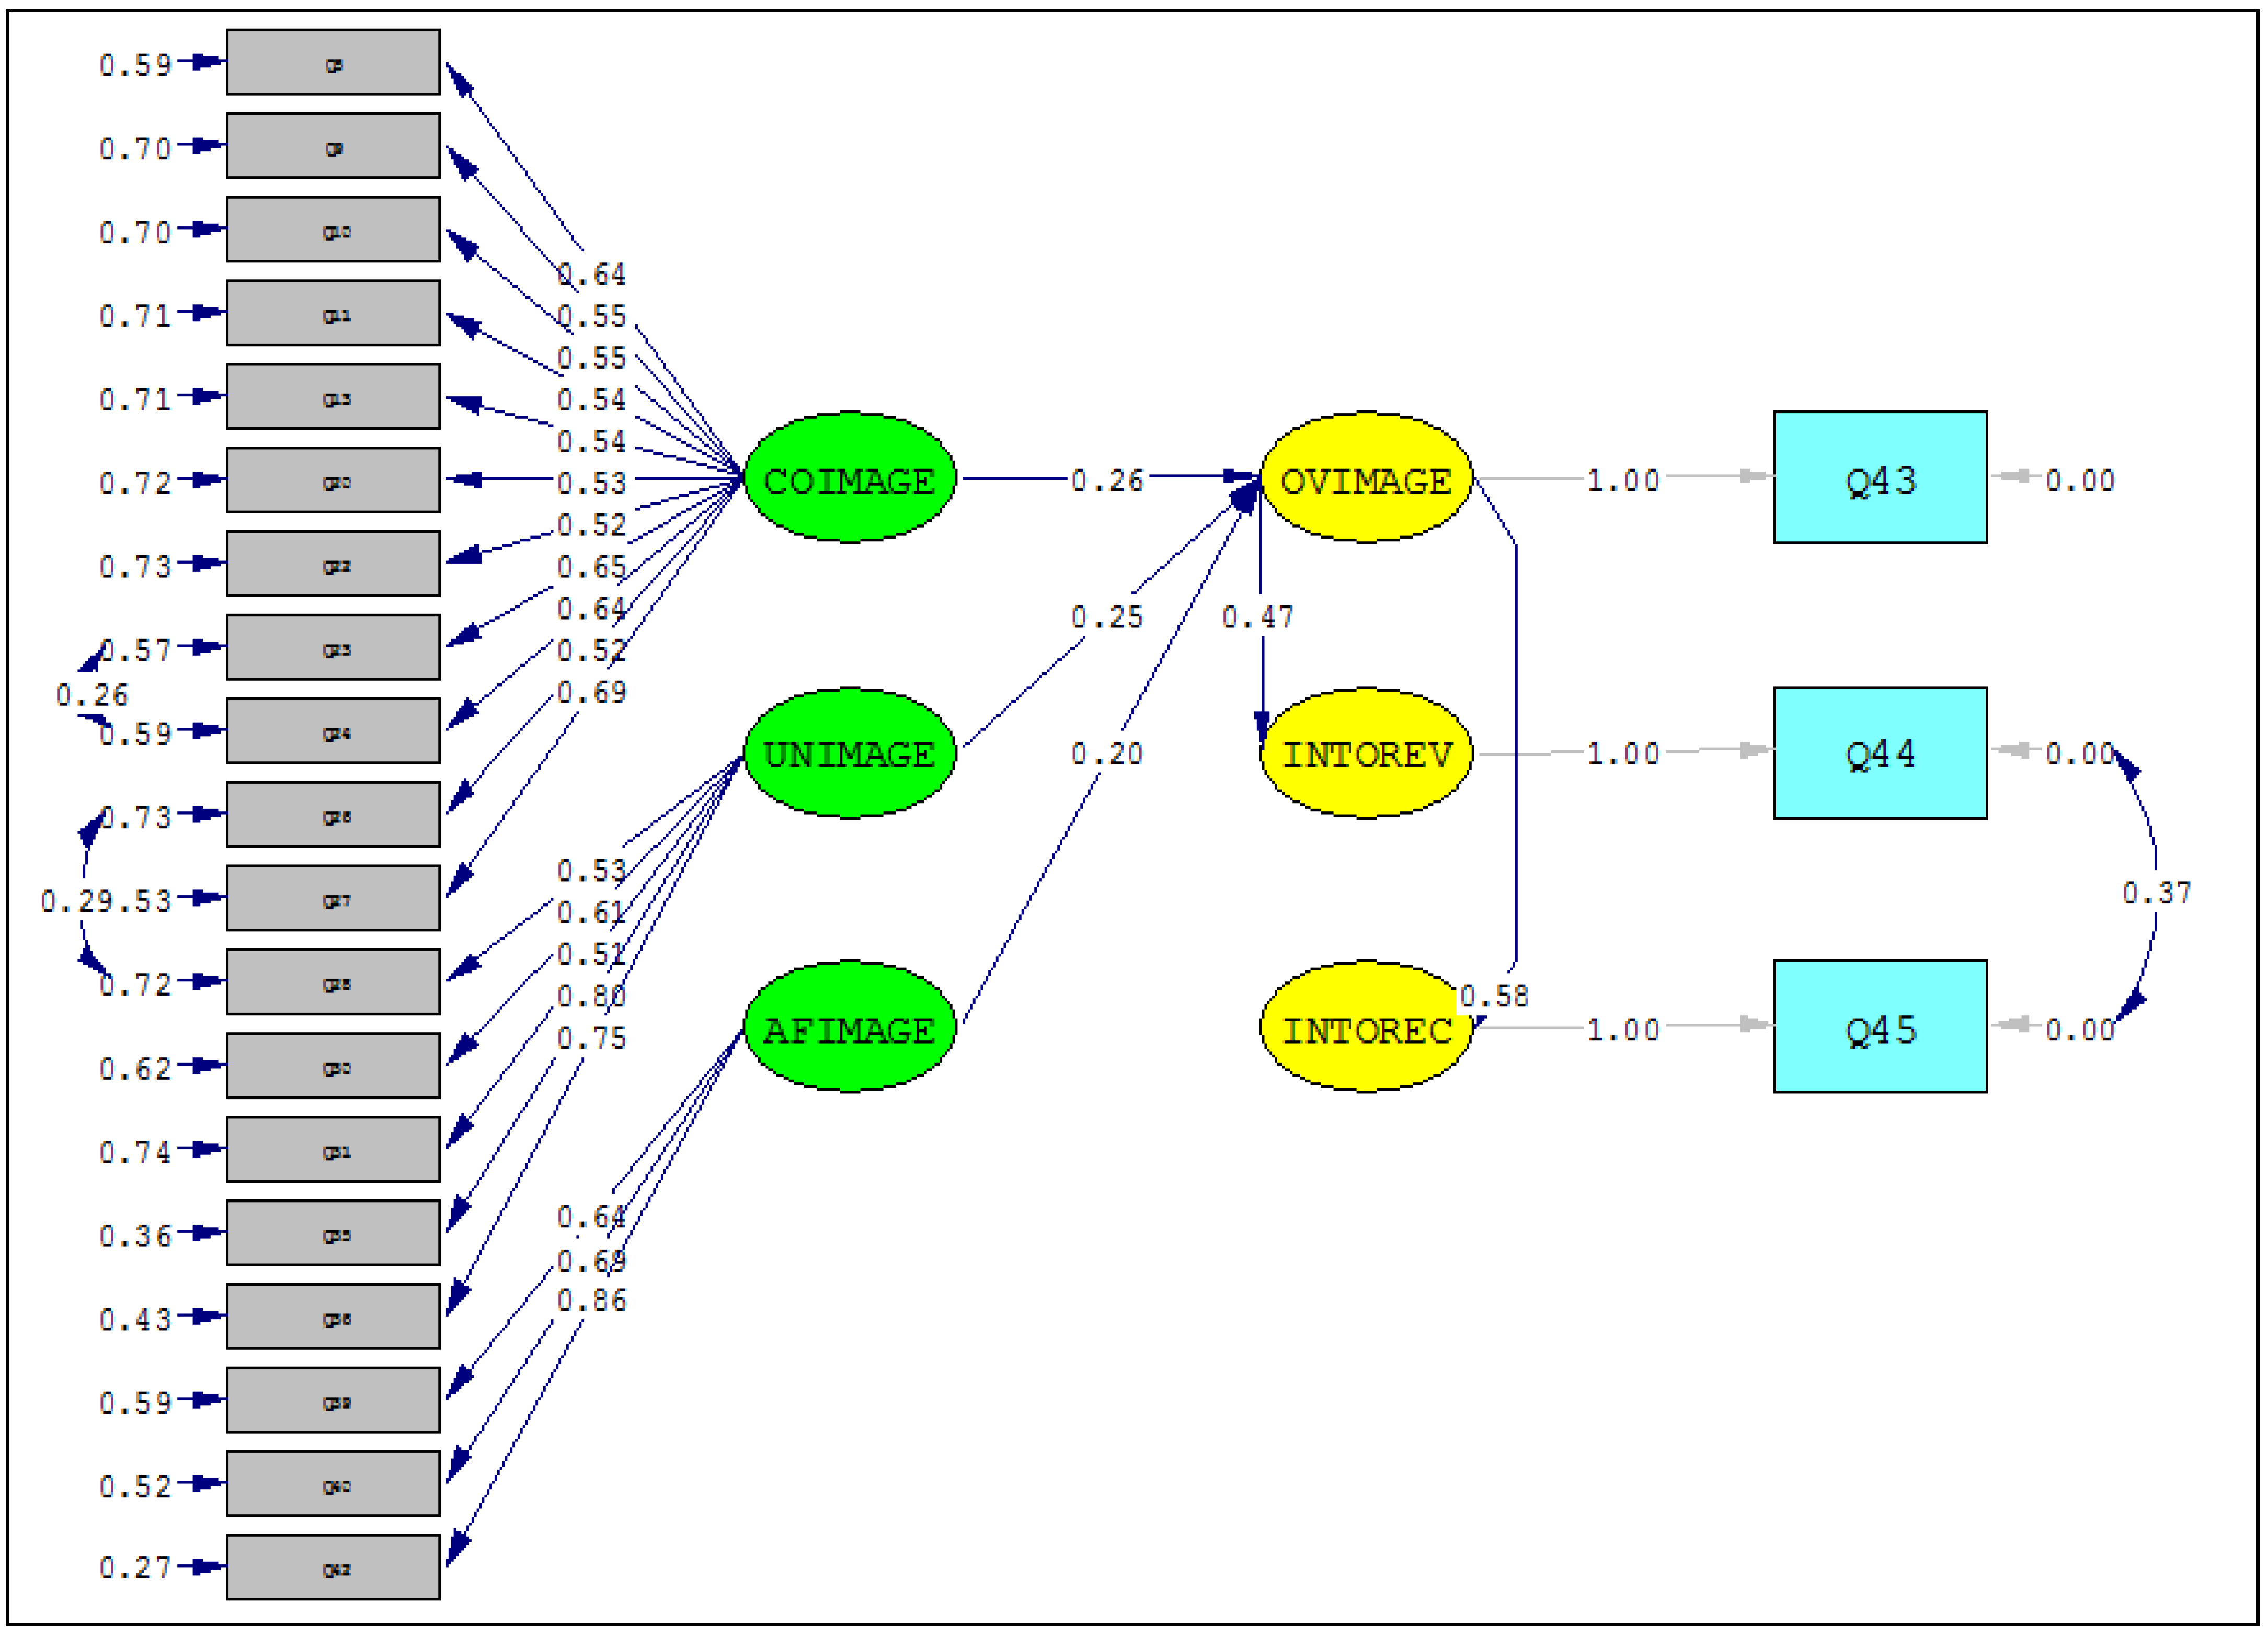
Given that the overall image acted as a full mediator for more variables, the original model (Figure 1) was retained. The original model with corresponding estimates or total effect is shown in Figure 4. The path diagram with its corresponding standardized solution shows the total effect of one variable on another. These values suggest which destination image items have the greatest effect on the overall image. They indicate that the cognitive image has the largest effect on the overall image. The unique image has the second-largest effect and the affective image has the least effect on the overall image. Due to the COVID-19 pandemic, research has shown that international tourists are becoming more selective with their choices of destinations. As a result of this, unique images, which had received less attention from scholars in the past, should play a more critical role in post-pandemic research on destination image. The reduced amount of travel across borders requires destinations to deliver a more unique and differentiated level of offering in order to remain competitive.
4.4. Hypotheses Tests
Once the data and model were proven to fit, be both valid and reliable, the hypotheses were tested. Each hypothesis had its null hypothesis, which was either rejected or accepted. The results for each of the five hypotheses were as follows:
Hypotheses 1 (H1):
A visitor destination’s cognitive image affects the overall image of the destination.
The hypothesis testing carried out resulted in the rejection of the null hypothesis and H1 was accepted with a significance level of 0.05 and a t-value larger than 1.96 (2.07) (Figure 3). Therefore, and in line with previous studies, cognitive image influenced the overall image of Jakarta.
Hypotheses 2 (H2):
A visitor destination’s affective image affects the overall image of the destination.
The second hypothesis was accepted, with the null hypothesis rejected with a t-value of 2.0, which was larger than 1.96 (significance level of 0.05) (Figure 2). This result was also in line with earlier studies and supports the assertion that visitors’ overall image of a destination is influenced by the affective image.
Hypotheses 3 (H3):
A visitor destination’s unique image affects the overall image of the destination.
Hypothesis 3 was accepted and the null hypothesis was rejected with a t-value larger than 1.96 at a significance level of 0.05 (3.25) (Figure 2). This is comparable with earlier studies and suggests that a destination’s unique image significantly affects the overall image of that destination.
Hypotheses 4 (H4):
Visitors’ perceptions of a destination’s overall image mediate the relationships between three destination brand images (cognitive, affective, and unique images) and people’s intentions to revisit the destination.
The null hypothesis was rejected and hypothesis 4 was accepted with a t-value of 9.50 (Figure 2), which is considerably higher than 1.96 (significance level of 0.05). This supports that the overall image significantly affects intentions to revisit a destination, which in turn also supports that the overall image is mediating the relationship between three destination brand images and intention to revisit, which is the same result as the original literature.
Hypotheses 5 (H5):
Visitors’ perceptions of a destination’s overall image mediate the relationships between three destination brand images (cognitive, affective, and unique images) and people’s intentions to recommend the destination to others.
Hypothesis 5 was accepted with a t-value larger than 1.96 at a significance level of 0.05 (12.50) (Figure 2), which suggests that a destination’s overall image influences intentions to recommend the destination to others, making the overall image a mediator between three destination images and intention to recommend.
5. Conclusions
This research tested whether the conceptual model put forward by Qu et al. [24] was applicable to the city of Jakarta. The results indicated that cognitive images positively influenced overall destination image, which replicated the results obtained by earlier studies [24,56,66]. It confirmed that cognitive images are the most influential in forming an overall destination image. The other results were consistent with earlier studies. Crucially, the issue of the unique destination image, which has received less attention, proved to have a greater effect on the overall destination image than the affective image. Finally, the affective image was found to significantly influence a destination’s overall image in line with earlier studies [24,66].
The research indicated that the destination image model first put forward by Qu et al. [24] is not only relevant for Oklahoma but also to Jakarta, demonstrating the applicability of the model to other geographical locations outside the US. Unlike the original research, where only domestic visitors were surveyed, this study used a sample of international visitors. Additionally, it was shown again that the unique destination image is a variable that should be taken into account when formulating the overall image of a destination since there has been little attention paid to the unique destination image in the tourism literature to date.
Additionally, this research sought information that could assist the Enjoy Jakarta campaign in being more successful. There were 19 factors used in the analysis. The means of the overall image and visitors’ intentions were just slightly above neutral. This shows that international visitors do not view Jakarta very positively or very negatively. The item showing a strong positive cognitive image was friendly local people (Q7) and a strong positive unique image was also found for friendly and helpful local people (Q29). The item for which international visitors had a strong negative cognitive image was a clean/unspoiled environment (Q15) and there were no strong negative unique images.
6. Marketing, Management, and Public Policy Implications
These findings can provide the Jakarta Tourism and Culture Office and other key stakeholders in the city’s visitor economy guidelines for catering to international target markets. To improve Enjoy Jakarta, the local government should maintain and promote the friendliness of Jakarta’s local people while dealing with the problem of cleanliness in Jakarta. In addition, instead of focusing on luxury and high-class or luxury attractions, the local government might want to focus more on pricing or promoting lower-cost attractions since the international tourists coming to Jakarta had lower income levels. One of the attractions that Enjoy Jakarta proposes is golf, which is targeted at people with higher incomes. This might be due to the many golfing facilities that Jakarta offers, however, the local government should focus more on what the international tourists want instead of highlighting the facilities that Jakarta provides. Entrepreneurs can use this research to determine investment opportunities that match tourists’ needs.
The ratings of image items in this research suggest that respondents are not particularly positive about Jakarta as a destination, and this should be of considerable concern to city tourism officials. Given that Jakarta has suffered from several terrorist bombings, civil unrest surrounding the governor elections in April 2017, and is well-known for traffic congestion, and frequent demonstrations, government officials need to pay careful attention to these mediocre scores and seek meaningful ways to enhance the city image. This is especially important since Jakarta is a major gateway to Indonesia for international visitors, and the national Ministry of Tourism was targeting significant growth to 20 million international visitors in 2019.
The findings of this research suggest that the Enjoy Jakarta approach, in addition to being applicable to almost any destination in the world, is not effectively portraying and expressing the unique images of the city. As such, marketing funds are not being effectively used and should be directed into a robust research and tourism planning effort to more precisely identify Jakarta’s uniqueness, as well as to address the factors that are negatively influencing its image. Both qualitative and quantitative research is needed, as well as a highly participatory approach to preparing a new tourism master plan for Jakarta.
7. Research Limitations and Further Research
The data were based on international visitors to Jakarta, and no domestic tourists were surveyed. In fact, the domestic market is larger and may have more favorable perceptions of their capital city. Additionally, the data may not include sufficient international tourists with higher income levels staying at 4- and 5-star hotels. The sample may represent the leisure visitors to Jakarta very well. However, business, the Meetings, Incentives, Conferences and Exhibitions (MICE) sector, the Visiting Friends and Family (VFR) segment, and personal business travelers were not included. Future research on Jakarta’s visitors should include all major trip purposes, using a data set from working directly with the local government so that hotels, immigration, and other locations to distribute the questionnaire. Furthermore, the field research for this study was conducted before the advent of the COVID-19 pandemic. As a result of this, it does not capture the effect of the pandemic on tourist destination branding. Post-pandemic studies could investigate this further in order to evaluate the differences between destination images before and after the COVID-19 pandemic.
Another research limitation of this study pertains to the model itself. The variables were limited to the ones employed by earlier studies. Thus, it is possible that there are other variables that form the overall destination image that were not included. For instance, the influence of trip characteristics (length of stay, previous visit history, travel party composition, trip expenditures, etc.) on destination image could be tested in future studies. This also applies to the items used to measure each construct. These items are limited to the ones used in the questionnaire. It is possible that there are other suitable items that can be used to measure each construct.
Additionally, it is recognized that the use of a unique image as a variable may be questioned by some scholars. This is acknowledged; however, the researchers set out to replicate the Qu et al. [24] methodology and this included the incorporation of unique images. The problems in applying Cronbach’s Alpha as a measure of reliability have been documented [67]. The researchers again acknowledge this body of work but have selected to use this test due to the extent of its past application in tourism research.
This research has highlighted some positive images, as well as potential negative perceptions, of Jakarta. However, the study was limited in the scope of its methods and geographic coverage. There is considerable opportunity for qualitative and mixed-methods research follow-up to explore the findings in greater depth. In addition, it is possible that the destination image of Jakarta may be connected to the destination and country images of Indonesia. This connection warrants further research. It will also be worthwhile to analyze other overall destination image formation variables and their measurement scales. Despite these research limitations, the current research has value in the validation of the destination image model.
Author Contributions
Conceptualization, C.S.; Methodology, B.M.; Supervision, C.S.; Software, B.M. and M.-P.A.-P.; Validation, B.M.; Data Analysis, C.S., B.M. and M.-P.A.-P.; Writing—original draft preparation, C.S., B.M., A.M.M. and J.A.C.-S.; Writing—review and editing, C.S., B.M., A.M.M. and J.A.C.-S. All authors have read and agreed to the published version of the manuscript.
Funding
This research received no external funding.
Institutional Review Board Statement
Not applicable.
Informed Consent Statement
Not applicable.
Data Availability Statement
The data presented in this study are openly available in FigShare at 10.6084/m9.figshare.14892381.
Conflicts of Interest
The authors declare no conflict of interest.
References
- Lucarelli, A.; Berg, P.O. City branding: A state-of-the-art review of the research domain. J. Place Manag. Dev. 2011, 4, 9–27. [Google Scholar] [CrossRef]
- Degen, M.; García, M. The transformation of the “Barcelona model”: An analysis of culture, urban regeneration and governance. Int. J. Urban Reg. Res. 2012, 36, 1022–1038. [Google Scholar] [CrossRef]
- Eshuis, J.; Edwards, A. Branding the city: The democratic legitimacy of a new mode of governance. Urban Stud. 2013, 50, 1066–1082. [Google Scholar] [CrossRef] [Green Version]
- Ginesta, X.; de San Eugenio, J. Rethinking Place Branding from a Political Perspective: Urban Governance, Public Diplomacy, and Sustainable Policy Making. Am. Behav. Sci. 2021, 65, 632–649. [Google Scholar] [CrossRef]
- Sevin, H.E. Understanding cities through city brands: City branding as a social and semantic network. Cities 2014, 38, 47–56. [Google Scholar] [CrossRef]
- Lu, H.; Ma, W.; Yang, Q.; Zhao, P. Exploring the impact of factors influencing case selection in the place branding literature from 2014 to 2018. J. Urban Aff. 2020. [Google Scholar] [CrossRef]
- Ma, W.; Schraven, D.; de Bruijne, M.; De Jong, M.; Lu, H. Tracing the origins of place branding research: A bibliometric study of concepts in use (1980–2018). Sustainability 2019, 11, 2999. [Google Scholar] [CrossRef] [Green Version]
- Kavaratzis, M. From city marketing to city branding: Towards a theoretical framework for developing city brands. Place Branding 2004, 1, 58–73. [Google Scholar] [CrossRef]
- Gilboa, S.; Jaffe, E.D.; Vianelli, D.; Pastore, A.; Herstein, R. A summated rating scale for measuring city image. Cities 2015, 44, 50–59. [Google Scholar] [CrossRef]
- Hanna, S.; Rowley, J.; Keegan, B. Place and Destination Branding: A Review and Conceptual Mapping of the Domain. Eur. Manag. Rev. 2020. [Google Scholar] [CrossRef]
- Evans, G. Hard-branding the cultural city—From Prado to Prada. Int. J. Urban Reg. Res. 2003, 27, 417–440. [Google Scholar] [CrossRef]
- Hollands, R.; Chatterton, P. Producing nightlife in the new urban entertainment economy: Corporatization, branding and market segmentation. Int. J. Urban Reg. Res. 2003, 27, 361–385. [Google Scholar] [CrossRef]
- Richards, G.; Wilson, J. The impact of cultural events on city image: Rotterdam, cultural capital of Europe 2001. Urban Stud. 2004, 41, 1931–1951. [Google Scholar] [CrossRef]
- Garcia, J.A.; Gomez, M.; Molina, A. A destination-branding model: An empirical analysis based on stakeholders. Tour. Manag. 2012, 33, 646–661. [Google Scholar] [CrossRef]
- Ruiz-Real, J.L.; Uribe-Toril, J.; Gázquez-Abad, J.C. Destination branding: Opportunities and new challenges. J. Destin. Mark. Manag. 2020, 17, 100453. [Google Scholar] [CrossRef]
- Hunt, J.D. Image as a factor in tourism development. J. Travel Res. 1975, 13, 1–7. [Google Scholar] [CrossRef]
- Hosany, S.; Ekinci, Y.; Uysal, M. Destination image and destination personality: An application of branding theories to tourism places. J. Bus. Res. 2006, 59, 638–642. [Google Scholar] [CrossRef]
- Ashworth, G.J.; Voogd, H. Selling the City: Marketing Approaches in Public Sector Urban Planning; Wiley: New York, NY, USA, 1991. [Google Scholar]
- Echtner, C.M.; Ritchie, J.R.B. The meaning and measurement of destination image. J. Tour. Stud. 1991, 14, 37–48. [Google Scholar]
- Siemiatycki, M. Message in a metro: Building urban rail infrastructure and image in Delhi, India. Int. J. Urban Reg. Res. 2006, 30, 277–292. [Google Scholar] [CrossRef]
- Byon, K.; Zhang, J. Development of a scale measuring destination image. Mark. Intell. Plan. 2009, 28, 508–532. [Google Scholar] [CrossRef]
- Zhang, L.; Zhao, S.X. City branding and the Olympic effect: A case study of Beijing. Cities 2009, 26, 245–254. [Google Scholar] [CrossRef]
- Kislali, H.; Kavaratzis, M.; Saren, M. Destination image formation: Towards a holistic approach. Int. J. Tour. Res. 2020, 22, 266–276. [Google Scholar] [CrossRef]
- Qu, H.; Kim, L.H.; Im, H.H. A model of destination branding: Integrating the concepts of the branding and destination image. Tour. Manag. 2011, 32, 465–476. [Google Scholar] [CrossRef]
- Rumata, V.M. Strategic City Branding—Kota Jakarta; Fakultas Ilmu Komunikasi Universitas Padjajaran: Jatinangor, Indonesia, 2006. [Google Scholar]
- Aaker, D.A. Managing Brand Equity; Free Press: New York, NY, USA, 1991. [Google Scholar]
- Blain, C.; Levy, S.E.; Ritchie, J.R.B. Destination branding: Insights and practices from destination management organizations. J. Travel Res. 2005, 43, 328–338. [Google Scholar] [CrossRef]
- Pike, S. Tourism destination branding complexity. J. Prod. Brand Manag. 2005, 14, 258–259. [Google Scholar] [CrossRef] [Green Version]
- Vinyals-Mirabent, S. European urban destinations’ attractors at the frontier between competitiveness and a unique destination image. A benchmark study of communication practices. J. Destin. Mark. Manag. 2019, 12, 37–45. [Google Scholar] [CrossRef]
- Aguilar, A.G.; Guillén, M.J.Y.; Roman, N.V. Destination brand personality: An application to Spanish Tourism. Int. J. Tour. Res. 2016, 18, 210–219. [Google Scholar] [CrossRef]
- Llanos-Herrera, G.R.; Merigo, J.M. Overview of brand personality research with bibliometric indicators. Kybernetes 2019, 48, 546–569. [Google Scholar] [CrossRef] [Green Version]
- Molina, A.; Fennandez, A.C.; 1omez, M.; Aranda, E. Differences in the city branding of European capitals based on online vs. offline sources of information. Tour. Manag. 2017, 58, 28–39. [Google Scholar]
- San Martín, H.; Herrero, A.; García de los Salmones, M.D.M. An integrative model of destination brand equity and tourist satisfaction. Curr. Issues Tour. 2019, 22, 1992–2013. [Google Scholar] [CrossRef]
- Rinaldi, C.; Beeton, S. Success in place branding: The case of the Tourism Victoria jigsaw campaign. J. Travel Tour. Mark. 2015, 32, 622–638. [Google Scholar] [CrossRef]
- Saraniemi, S.; Komppula, R. The development of a destination brand identity: A story of stakeholder collaboration. Curr. Issues Tour. 2019, 22, 1116–1132. [Google Scholar] [CrossRef]
- Zenker, S.; Braun, E.; Petersen, S. Branding the destination versus the place: The effects of brand complexity and identification for residents and visitors. Tour. Manag. 2017, 58, 15–27. [Google Scholar] [CrossRef]
- Kavaratzis, M.; Hatch, M.J. The elusive destination brand and the ATLAS wheel of place brand management. J. Travel Res. 2019, 60, 3–15. [Google Scholar] [CrossRef]
- Gursoy, D.; Chen, J.S.; Chi, C.G. Theoretical examination of destination loyalty formation. Int. J. Contemp. Hosp. Manag. 2014, 26, 809–827. [Google Scholar] [CrossRef]
- Liu, Y.; Hultman, M.; Eisingerich, A.B.; Wei, X. How does brand loyalty interact with tourism destination? Exploring the effect of brand loyalty on place attachment. Ann. Tour. Res. 2020, 81, 102879. [Google Scholar] [CrossRef]
- Michelson, A.; Paadam, K. Destination branding and reconstructing symbolic capital of urban heritage: A spatially informed observational analysis in medieval towns. J. Destin. Mark. Manag. 2016, 5, 141–153. [Google Scholar] [CrossRef]
- Garcia, B. “If everyone says so…” Press narratives and image change in major event host cities. Urban Stud. 2017, 54, 3178–3198. [Google Scholar] [CrossRef]
- Perkins, R.; Khoo-Lattimore, C.; Arcodia, C. Understanding the contribution of stakeholder collaboration towards regional destination branding: A systematic narrative literature review. J. Hosp. Tour. Manag. 2020, 43, 250–258. [Google Scholar] [CrossRef]
- Crompton, J.L. An assessment of the image of Mexico as a vacation destination and the influence of geographical location upon that image. J. Travel Res. 1979, 17, 18–23. [Google Scholar] [CrossRef]
- Birdir, S.S.; Dalgic, A.; Birdir, K. Destination marketing and destination image. In The Routledge Handbook of Destination Marketing; Gursoy, D., Chi, C.G., Eds.; Routledge: London, UK, 2018; pp. 71–81. [Google Scholar]
- Anholt, S. The Anholt-GMI city brands index: How the world sees the world’s cities. Place Branding 2006, 2, 18–31. [Google Scholar] [CrossRef]
- Zenker, S.; Petersen, S.; Aholt, A. The Citizen Satisfaction Index (CSI): Evidence for a four basic factor model in a German sample. Cities 2013, 31, 156–164. [Google Scholar] [CrossRef]
- Woosnam, K.M.; Stylidis, D.; Ivkov, M. Explaining conative destination image through cognitive and affective destination image and emotional solidarity with residents. J. Sustain. Tour. 2020, 28, 917–935. [Google Scholar] [CrossRef]
- Kim, S.; Lehto, X.; Kandampully, J. The role of familiarity in consumer destination image formation. Tour. Rev. 2019, 74, 885–901. [Google Scholar] [CrossRef]
- Pike, S. Destination image analysis—A review of 142 papers from 1973 to 2000. Tour. Manag. 2002, 23, 541–549. [Google Scholar] [CrossRef] [Green Version]
- Apostolakis, A.; Jaffry, S.; Sizeland, F.; Cox, A. The role of uniqueness in destination branding: The case of historical Portsmouth harbor. EuroMed J. Bus. 2015, 10, 198–213. [Google Scholar] [CrossRef] [Green Version]
- Bigné, J.E.; Sánchez, M.I.; Sánchez, J. Tourism image, evaluation variables and after purchase behavior: Inter-relationship. Tour. Manag. 2001, 22, 607–616. [Google Scholar] [CrossRef]
- Füller, H.; Michel, B. “Stop Being a Tourist!” New Dynamics of Urban Tourism in Berlin-Kreuzberg. Int. J. Urban Reg. Res. 2014, 38, 1304–1318. [Google Scholar] [CrossRef]
- Irazábal, C. Coastal Urban Planning in the “Green Republic”: Tourism Development and the Nature–Infrastructure Paradox in Costa Rica. Int. J. Urban Reg. Res. 2018, 42, 882–913. [Google Scholar] [CrossRef]
- Woodside, A.G.; Lysonski, S. A general model of traveler destination choice. J. Travel Res. 1989, 27, 8–14. [Google Scholar] [CrossRef]
- Russel, J.A. A circumplex model of affect. J. Personal. Soc. Psychol. 1980, 39, 1161–1178. [Google Scholar] [CrossRef]
- Stern, E.; Krakover, S. The formation of a composite urban image. Geogr. Anal. 1993, 25, 130–146. [Google Scholar] [CrossRef]
- Alcaniz, E.B.; Garcia, I.S.; Blas, S.S. Relationships among residents’ image, evaluation of the stay and post-purchase behavior. J. Vacat. Mark. 2005, 11, 291–302. [Google Scholar] [CrossRef]
- Kumar, S.; Phrommathed, P. Research Methodology; Springer: New York, USA, 2005; pp. 43–50. [Google Scholar]
- Nunnaly, J. Psychometric Theory; McGraw-Hill: New York, NY, USA, 1978. [Google Scholar]
- Jöreskog, K.; Sörbom, D. LISREL 8.0: Structural Equation Modeling with SIMPLIS Command Language; Scientific Software International: Lincolnwood, IL, USA, 1993. [Google Scholar]
- Hooper, D.; Coughlan, J.; Mullen, M. Structural equation modelling: Guidelines for determining model fit. Electron. J. Bus. Res. Methods 2008, 6, 53–60. [Google Scholar]
- Ullman, J.B. Structural equation modeling. In Using Multivariate Statistics; Tabachnick, B.G., Fidell, L.S., Eds.; Allyn and Bacon: Boston, MA, USA, 2001; pp. 653–771. [Google Scholar]
- Tabachnick, B.G.; Fidell, L.S. Using Multivariate Statistics, 5th ed.; Allyn & Bacon: Needham Height, MA, USA, 2007. [Google Scholar]
- Wheaton, B.; Muthén, B.; Alwin, D.F.; Summers, G.F. Assessing reliability and stability in panel models. Sociol. Methodol. 1977, 8, 84–136. [Google Scholar] [CrossRef]
- MacCallum, R.C.; Browne, M.W.; Sugawara, H.M. Power analysis and determination of sample size for covariance structure modeling. Psychol. Methods 1996, 1, 130–149. [Google Scholar] [CrossRef]
- Sarjono, H.; Julianita, W. Structural Equation Modeling (SEM); Salemba Empat: Jakarta, Indonesia, 2015; pp. 222–224. [Google Scholar]
- Sijtsma, K. On the use, misuse, and the very limited usefulness of Cronbach’s Alpha. Psychometrika 2008, 74, 107–120. [Google Scholar] [CrossRef] [PubMed] [Green Version]
Figure 2.
Path diagram with corresponding t-values.

Figure 3.
Competing path diagram with corresponding t-values. Chi-Square = 501.45, df = 195, p-value = 0.00000, RMSEA = 0.071.
Figure 3.
Competing path diagram with corresponding t-values. Chi-Square = 501.45, df = 195, p-value = 0.00000, RMSEA = 0.071.

Figure 4.
Final path diagram with corresponding standardized solution (total effect).


Table 1.
Median scores for image items.
| Cognitive Image Items | Median Scores (n = 311) |
|---|---|
| Easy access to the area (Q1) | 4 |
| Restful and relaxing atmosphere (Q2) | 3 |
| Reasonable cost of hotels/restaurants (Q3) | 4 |
| Reasonable cost of shopping centers (Q4) | 3 |
| Beautiful scenery/natural wonders (Q5) | 3 |
| Lots of open space (Q6) | 3 |
| Friendly local people (Q7) | 5 |
| Delicious local cuisine (Q8) | 4 |
| Great state/theme parks (Q9) | 3 |
| Good place for children/family (Q10) | 3 |
| Availability of tourist welcome centers (Q11) | 3 |
| Good weather (Q12) | 4 |
| Interesting cultural events/festivals (Q13) | 3 |
| Good shopping facilities (Q14) | 4 |
| Clean/unspoiled environment (Q15) | 2 |
| Good infrastructure (Q16) | 3 |
| Availability of travel information (Q17) | 3 |
| A wide choice of accommodations (Q18) | 4 |
| Safe and secure environment (Q19) | 4 |
| A wide variety of entertainment (Q20) | 3 |
| Great nightlife (Q21) | 3 |
| Numerous water sports (Q22) | 3 |
| A wide variety of outdoor activities (Q23) | 3 |
| Lots of adventurous activities (Q24) | 3 |
| Availability of facilities for golfing/tennis (Q25) | 3 |
| Native Indonesian culture (Q26) | 4 |
| Rich historic and cultural sites (Q27) | 4 |
Note: Strongly disagree = 1; disagree = 2; neutral = 3; agree = 4; strongly agree = 5.
Table 2.
Factors chosen for further analysis.
| Image Items | Cognitive | Unique | Affective |
|---|---|---|---|
| Beautiful scenery/natural wonders (Q5) | 0.64 | ||
| Great state/theme parks (Q9) | 0.55 | ||
| Good place for children/family (Q10) | 0.55 | ||
| Availability of tourist welcome centers (Q11) | 0.54 | ||
| Interesting cultural events/festivals (Q13) | 0.54 | ||
| A wide variety of entertainment (Q20) | 0.53 | ||
| Numerous water sports (Q22) | 0.52 | ||
| A wide variety of outdoor activities (Q23) | 0.65 | ||
| Lots of adventurous activities (Q24) | 0.64 | ||
| Native Indonesian culture (Q26) | 0.52 | ||
| Rich historic and cultural sites (Q27) | 0.69 | ||
| Native Indonesian cultures (Q28) | 0.53 | ||
| Wonderful scenery and natural wonders (Q30) | 0.61 | ||
| Relaxing spas (Q31) | 0.51 | ||
| Lots of tourist attractions (Q35) | 0.80 | ||
| Rich cultural/historical/heritage sites (Q36) | 0.75 | ||
| Pleasing (Q39) | 0.64 | ||
| Arousing (Q40) | 0.69 | ||
| Exciting (Q42) | 0.86 |
Note: Lambda coefficients from LISREL (LAMBDA-X). Cut-off at 0.50 for inclusion.
Table 3.
Goodness of fit test results.
| Goodness of Fit Tests | Statistics |
|---|---|
| Root Mean Square Error of Approximation (RMSEA) | 0.076 |
| Normed Fit Index (NFI) | 0.93 |
| Non-Normed Fit Index (NNFI) | 0.95 |
| Comparative Fit Index (CFI) | 0.95 |
| Incremental Fit Index (IFI) | 0.95 |
| Relative Fit Index (RFI) | 0.92 |
Publisher’s Note: MDPI stays neutral with regard to jurisdictional claims in published maps and institutional affiliations. |
© 2021 by the authors. Licensee MDPI, Basel, Switzerland. This article is an open access article distributed under the terms and conditions of the Creative Commons Attribution (CC BY) license (https://creativecommons.org/licenses/by/4.0/).
Share and Cite
MDPI and ACS Style
Setiawan, C.; Meivitawanli, B.; Arrieta-Paredes, M.-P.; Morrison, A.M.; Coca-Stefaniak, J.A. Friendly Locals and Clean Streets?—Evaluating Jakarta’s Destination Brand Image. Sustainability 2021, 13, 7434. https://doi.org/10.3390/su13137434
AMA Style
Setiawan C, Meivitawanli B, Arrieta-Paredes M-P, Morrison AM, Coca-Stefaniak JA. Friendly Locals and Clean Streets?—Evaluating Jakarta’s Destination Brand Image. Sustainability. 2021; 13(13):7434. https://doi.org/10.3390/su13137434
Chicago/Turabian StyleSetiawan, Chandra, Bryna Meivitawanli, Mary-Paz Arrieta-Paredes, Alastair M. Morrison, and J. Andres Coca-Stefaniak. 2021. "Friendly Locals and Clean Streets?—Evaluating Jakarta’s Destination Brand Image" Sustainability 13, no. 13: 7434. https://doi.org/10.3390/su13137434
Note that from the first issue of 2016, this journal uses article numbers instead of page numbers. See further details here.