Abstract
While it is generally assumed that employees who feel well are also productive, research has shown that this is not always the case. Specifically, some employees seem to experience low well-being while performing, and vice versa. As employee well-being and performance are both required to achieve corporate sustainability, the purpose of this research was to identify energy-related well-being/job performance profiles among 5729 employees from the Dutch division of a large bank and identify their antecedents. Using latent profile analysis, we found five profiles: 1. low well-being/low performance, 2. low well-being/medium performance, 3. high well-being/medium performance, 4. high well-being/high performance, and 5. high well-being/top performance. Using multinomial regression, we found that more learning and development opportunities, more social support from colleagues, more autonomy, and less role-conflict were related to the high well-being profiles. Second, more role clarity, more performance feedback, more autonomy, and less work-pressure were related to the high- and top-performance profiles. Finally, communication and social support from the manager were found to be relatively weak antecedents of the different profiles. This study thus highlights that the job demands and resources of employees may affect their well-being and performance.
1. Introduction
In pursuit of economic viability and social responsibility, a growing number of organizations are striving to simultaneously address the interests and concerns of multiple stakeholders. These companies are attempting to combine the pursuit of financial gains and social goals (protecting the environment, promoting healthy living, and ensuring employees’ health and well-being) [1]. In this context, management and employees are two important internal organizational stakeholders. While the managerial perspective remains dominant in the field of strategic human resource management (SHRM), there have been recent calls to more closely consider the concerns of multiple stakeholders [2] (p. 31) by exploring how win-win situations that directly both benefit employees and management can be achieved [3,4,5]. Empirical studies have demonstrated that high happiness well-being (e.g., employees’ satisfaction with their work) and performance can go hand-in-hand [6,7]. Other studies, however, have shown that organizations striving to improve their performance may also increase work intensity, which (unintentionally) negatively affects employee health well-being (e.g., exhaustion) [2,7,8]. This indicates that simultaneously promoting happiness and health well-being, while stimulating job performance is a challenging endeavor for organizations. Unfortunately, employee happiness well-being has primarily been studied as means to achieve performance and health well-being in parallel with performance [9], and the possibility that happiness, health, and performance co-occur in complex patterns has largely been neglected in SHRM literature. Hence, prior studies have provided limited insights into how organizations can simultaneously address the interests of managers and employees by creating sustainable jobs (high levels of performance combined with high levels of happiness and health well-being) [9]. Therefore, this article investigates how employee well-being and job performance co-occur in various combinations (reflecting different balances between management and employee interests).
Only recently have scholars begun to explore the co-occurrence of employee well-being experiences and performance behaviors at work by applying a person-centered approach. The few empirical studies following this line of enquiry have revealed that distinct types of employee well-being and employee well-being/performance profiles exist e.g., [10,11,12,13]. For example, Tordera et al. [12] found evidence for four patterns of happiness well-being and job performance, including a sustainable (happy-productive) and three unsustainable patterns (e.g., unhappy-productive). However, thus far, scholars have primarily studied job performance together with positive happiness indicators of well-being at work (e.g., life satisfaction and vigor), e.g., [10,11,12,13], while neglecting its negative health-related indicators (e.g., emotional exhaustion), or they have studied indicators of well-being at work only [10,11,12]. Positive happiness well-being and negative health well-being, however, are seen as distinct, from a conceptual and empirical point of view [13,14,15]. Moreover, some working conditions, such as large workloads, benefit positive indicators of happiness well-being (e.g., satisfaction) and job performance but are harmful for negative indicators of health well-being e.g., [16,17]. Therefore, we will investigate the combination of job performance and a positive aspect of happiness well-being (vigor) and a negative indicator of health-related well-being (emotional exhaustion). There are three justifications for investigating this particular combination. First, according to Schaufeli and Bakker [18], vigor and exhaustion can be seen as largely independent states of energetic well-being. Second, an increased proportion of employees feels exhausted at the end of the workday and less vigorous [19]. Third, vigor and emotional exhaustion have profound implications for both employees (e.g., life satisfaction) and organizations (e.g., financial performance) [20,21,22]. To the best of our knowledge, scholars have not previously studied how positive and negative indicators of well-being can be combined with job performance using a person-centered approach; thus, this is our first contribution.
To better understand the energetic well-being/performance profiles, we will also answer the call of Benitez, Peccei and Medina [13] to explore their antecedents. Specifically, we will investigate the role that work conditions play in shaping these well-being/performance profiles following the job demands and resources (JD-R) model of Demerouti, et al. [23]. The JD-R model assumes that an employee’s job demands and resources affect their well-being and performance outcomes [18,24]. As many scholars have studied the effects of job demands and resources on emotional exhaustion and engagement in isolation, we will follow the Schaufeli and Taris [25] recommendation and study the effects of two job demands and seven job resources on combinations of vigor, emotional exhaustion, and job performance. Specifically, our second contribution is therefore to investigate whether job demands and resources can serve as antecedents for our well-being/performance profiles.
In conclusion, by exploring various energy-related employee well-being and job performance combinations, this study contributes to understanding whether different employee well-being job performance profiles exist. Furthermore, by investigating the antecedents of these profiles, our study may clarify what employees need for beneficial well-being and performance outcomes. From a practical point of view, this may help organizations to create sustainable jobs by offering the job demands and resources an employee needs, thereby creating a win-win situation for employees and management.
1.1. Energetic Well-Being and Performance Profiles
As explained in the introduction, this study will investigate job performance and feelings of vigor and emotional exhaustion. Although there are many ways to define employee job performance, we will focus in this research on its traditional form: task performance. “Task performance” refers to the proficiency with which a worker performs the tasks central to their function and includes, among other elements, the quantity and the quality of their efforts [26,27]. Second, vigor is one of the three core elements of engagement and is characterized by high levels of energy and mental resilience while working [28]. According to Schaufeli, Salanova, González-Romá, and Bakker [28], the other two core elements are dedication and absorption. Third, “emotional exhaustion” refers to feeling depleted of one’s physical and emotional resources, and this is one of the three core elements of burnout [29]. The other two core dimensions of burnout are depersonalization and diminished personal accomplishment. Similar to vigor, emotional exhaustion is related to the energetic component of well-being. As such, it has been argued in the past that vigor and exhaustion are opposite poles on the same continuum [28]. However, while testing their own assumption, Schaufeli, Salanova, González-Romá, and Bakker [28] found that vigor and exhaustion were only weakly negatively related. In later work, Schaufeli and Bakker [18] explained their finding, stating that, “Feeling emotionally drained from one’s work ‘once a week’ does by no means exclude that in the same week one might feel bursting with energy,” (p. 294) and concluding that, instead of being mutually exclusive, these concepts should be seen as independent states. As vigor and emotional exhaustion are both work-related energetic well-being types, while one is an indicator of positive energy-related well-being and the other of negative energy-related well-being, we believe they are well suited for this study.
A study of well-being and job performance in conjunction is a step away from the variable-centered approach that has been primarily adopted by scholars. Although the variable-centered approach is useful for distilling general patterns, Hofmans et al. [30] argue that it is restrictive in its assumption that the research sample is homogenous. As a consequence, it assumes that employees can be categorized as (un)happy, (un)healthy, or (not) performing and ignores the possibility that employees have unique combinations of well-being experiences and job behaviors. Prior research has shown that there may be more complex combinations of well-being and performance. For example, scholars have found that some employees can be unhappy and unproductive, whereas others are happy but unproductive [10,12]. Furthermore, focusing exclusively upon employee well-being, others have found that different well-being indicators can be at odds with one another. Salanova, Del Líbano, Llorens, and Schaufeli [14], for example, found that employees can feel vigorous while being unhappy; and Somers, Birnbaum, and Casal [15] identified employees who felt both stressed and satisfied with their jobs. These findings are consistent with the Bakker and Oerlemans [31] framework for subjective well-being, which indicates that different combinations of feelings of activation and pleasantness are present in four states of well-being (i.e., engagement, satisfaction, workaholism, and burnout). Finally, previous research has shown that energetic well-being and performance indicators may mutually influence one another, as employees who feel vigorous may have sufficient energy to perform well, in contrast to those who feel emotionally exhausted [32,33].
To capture these potential combinations of job performance and positive and negative energetic well-being, a person-centered approach is needed [30]. The person-centered approach is useful for identifying employee profiles that differ on the qualitative and quantitative levels [34]. As Meyer et al. [35] explain, quantitative differences occur when employee profiles can be distinguished based upon their relative score—for example, “high well-being/high performance” and “low well-being/low performance.” Qualitative differences, on the other hand, emerge as explained by Meyer, Stanley and Vandenberg [35] when the hierarchical order of the profile scores differ for certain groups, such as “low well-being/high performance” and “high well-being/low performance”. There is initial empirical support for the existence for employee profiles that differ on qualitative and quantitative grounds. Applying this person-centered approach, researchers [10,11,12] have studied a number of the positive well-being indicators (e.g., satisfaction) in conjunction with job performance and found two synergetic patterns (i.e., high-high and low-low) and two antagonistic patterns (i.e., high-low and low-high).
On the basis of this line of reasoning and prior empirical work, it seems plausible that two synergetic patterns (high well-being/high performance and low well-being/low performance) and two antagonistic patterns (high well-being/low performance and low well-being/high performance) could emerge from our data. Furthermore, additional profiles in which the positive well-being indicators and negative well-being indicators are at odds with one another could also be expected (e.g., low vigor-high performance-high emotional exhaustion, high vigor-low performance-low emotional exhaustion). However, as this is, to the best of our knowledge, the first to study positive well-being indicators (vigor), negative well-being indicators, and performance (task performance) in conjunction, we make no a priori predictions about the profiles we will identify within the data or how many will emerge. This decision to make no predictions is consistent with previous research applying a person-centered approach, e.g., [36,37] and fits the inductive nature of this approach. Therefore, our first research question is as follows:
Research question 1:
Are there distinct employee well-being profiles (vigor and emotional exhaustion) and performance profiles that vary quantitatively (level) and qualitatively (shape)?
1.2. Job Resources and Profiles
This section will discuss how job resources can result in different well-being/performance profiles. In the literature, four types of job resources are distinguished: resources located at the organizational level (e.g., communication), the interpersonal level (e.g., social support), the way in which the job is organized (e.g., role clarity), and the task level (e.g., autonomy) [24]. In general, the JD-R model assumes a similar path for all job resources. First, in line with effort-recovery theory [38], it is argued that providing employees with job resources increases their external motivation to invest effort in their work. Second, in line with self-determination theory [39], it is argued that employees who receive job resources become intrinsically motivated, as these resources allow them to fulfill their basic human needs for autonomy, relatedness, and competence. As a result, the “motivational path” of the JD-R model argues that job resources cause employees to feel more vigorous and achieve a higher performance [24,25,40]. In addition, employees who possess more job resources have also been shown to perceive less strain, which makes them less likely to experience feelings of feeling burned out [41]. While positive effects on well-being and performance can be expected, Schaufeli and Taris [25] warn that the same job resources will have differential effects on outcomes. Therefore, based upon the work of Bakker and Demerouti [24], we will include seven types of job resources in our study—namely, communication (organizational level); social support from colleagues and the manager (interpersonal level); role clarity (organization of work); and learning opportunities, autonomy, and performance feedback (task level). It can thus be assumed, at a general level, that job resources will be related to positive well-being and performance profiles. However, as their exact relationship with well-being/performance profiles has yet to be explored, our second research question is as follows:
Research question 2:
Do job resources (at the organizational, interpersonal, organization-of-work, and task levels) differentiate employee well-being from performance profile?
1.3. Job Demands and Profiles
This section will discuss how job demands can result in different well-being/performance profiles. In line the meta-analysis of Lee and Ashforth [42] and the model of compensatory control [43], the JD-R model assumes that job demands have a negative effect on well-being. Specifically, it is argued that, in a situation of high demand (e.g., work pressure), employees try to protect their performance by increasing their effort. Although employees can use various coping strategies to manage this (e.g., taking breaks), their energy levels become drained if their job demands are high for a prolonged period of time. As a result, the “health impairment path” of the JD-R model assumes that job demands lead to emotional exhaustion and, more generally, to burnout [18]. Although research has consistently found that job demands lead to emotional exhaustion [25], the proposition of the JD-R model that job demands are not directly related to engagement has been called into question. In a meta-analysis, Crawford et al. [44] showed that specific job demands are positively and directly related to engagement, whereas others negatively affect this positive indicator of well-being. Consequently, they argue that there are two types of job demand: challenging demands and hindering demands. Although both types of demand lead to increased levels of emotional exhaustion, Crawford, LePine, and Rich [44] found that challenging demands (e.g., work pressure) can motivate employees to perform. In line with this, challenging demands have been found to be positively related to vigor and performance [16,44]. In contrast, hindering demands (e.g., role conflict) are associated with negative emotions that make employees less willing to invest energy into dealing with them [44]. In line with this, hindering demands have been found to be negatively related to vigor and performance [16,44,45].
Based upon the previous, it can thus be assumed that challenging demands and hindering demands have different effects on task performance, vigor, and emotional exhaustion. Therefore, we have included work pressure as a challenging demand and role conflict as a hindering demand in our model, in line with prior work [24,46]. As few scholars have explored the relationships between job demands and performance, vigor, and emotional exhaustion together—much less in conjunction—our final research question is as follows:
Research question 3:
Do job demands (challenging and hindering) relate to different employee well-being and performance profiles?
2. Materials and Methods
2.1. Sample and Procedure
For this research, a pre-existing dataset was taken from a large multinational company operating in the financial sector. The company originated through a series of mergers in the Netherlands, after which it expanded throughout the world. As of today, it is among the largest 30 banks worldwide and has its head office within the Netherlands. To offer a work environment that enhances well-being and enables employees to perform at their best, the company collaborates with a consultancy agency to improve the vitality of its workforce through 1. a self-assessment report for individual employees that provides insights into its workers’ job demands, resources, and well-being, while offering tips and tricks for improvement; and 2. departmental- and organizational-level reports, with insights for management into workers’ job demands, resources, and well-being. To generate these reports, surveys were distributed by the consultancy firm to all employees working in the Netherlands (N = 18,230) in June 2020. In total, 8839 (31%) people filled out the survey.
Due to the sensitive topics assessed in this survey (e.g., work pressure), the survey included no demographic questions. For similar reasons, we only had access to the fully anonymized data set, which means that we cannot discuss the specific characteristics of our sample. Instead, we will describe the characteristics of the entire population working for this organization in the Netherlands. This population consists of those working for the head office (n = 8413) and the Dutch division of the bank (n = 9817). There were similar response rates for the head office workers (28%) and Dutch division workers (33%). In this population, 64% of the workers are male and 36% are female. In addition, 2.31% are aged under 25 years, 29% are 26–35 years, 28.4% are 36–45 years, 26.7% are 46–55 years and 13.7% are older than 56 years. Finally, 85.5% of the employees have Dutch nationality. As the entire population was involved in this research, the functional areas included ranged from sales agents up to the CEO of the organization.
Finally, as we made use of a pre-existing dataset, we requested and acquired the approval of our university’s ethical review board after the dataset had been acquired. Similarly, the data privacy officer of the organization granted us permission to use this data for academic research after the primary purpose had been completed (e.g., providing self-assessment reports to employees and departments and organizational reports to managers).
2.2. Measures
The survey offered by the consultancy firm was the “JD-R monitor.” This survey is a commercialized online survey, developed based upon the JD-R model [25], in collaboration with Prof. Dr. Wilmar Schaufeli, a leading scholar in this area. All rights to the items and scales are reserved by the consultancy agency. To assess the reliability and validity of the antecedents of the well-being/performance items, we conducted a confirmatory factor analysis (CFA) and reliability analysis. The CFA was conducted using the package Lavaan (v.06-8) and the reliability analysis used the Psych package (v2.1.3) in R. Like other researchers [47,48,49], we conducted a latent class analysis (LCA) on the item level to identify the well-being and performance profiles. We did not conduct these analyses for the included well-being and performance items.
Job resources: In total, seven job resources were included in this research. These resources can be subdivided in four categories, according to Bakker and Demerouti [24]: resources stemming from the organization at large, the way in which the work is organized, interpersonal resources, and task resources. All resources were measured using three items each. First, communication was included as a job resource at the organizational level. For example, “I am sufficiently informed about developments within my organization.” The answer scale for both variables ranged from “totally disagree” (1) to “totally agree” (5), and it appeared to be sufficiently reliable (α = 0.68). Second, one type of resource concerned the way in which the work was organized (“role clarity”). One example item is, “Do you know exactly what is expected of you at work?” Answers were given using a Likert-scale, ranging from “never” (1) to “always” (5). The scale was found to be reliable (α = 0.80). Third, two types of resources associated with the interpersonal level were included—namely, social support from colleagues and from (line) management. An example of an item for colleague support is, “Can you count on your colleagues for help and support, when needed?”, and an example for management support is, “Can you count on your line manager for help and support when needed?”. The answer scales ranged from “never” (1) to “always” (5) and the reliability of colleague support (α = 0.76) and manager support (α = 0.87) appeared to be sufficient. Fourth and finally, three types of task-level resources were included: learning opportunities, autonomy, and performance feedback. An example of the learning opportunities scale is, “My job offers adequate opportunities for personal growth and development.” Second, “Can you determine the content of your work?” is an example from the autonomy scale. Third, for performance feedback, an example item is, “Does your line manager provide information about how well you do your job?”. The respondents were, again, invited to answer on a scale ranging from “never” (1) to “always” (5). The Cronbach alpha’s of the learning opportunities (α = 0.86), autonomy (α = 0.80), and feedback (α = 0.76) scales indicated that they were reliable.
Furthermore, two CFAs were conducted simultaneously for the seven job resources. First, a unidimensional model was tested to verify whether the different dimensions should indeed be treated as separate types of resource. The model fit indicators, specifically the chi-square (χ2), comparative fit index (CFI), root mean square error of approximation (RMSEA) and standardized root mean square residual (SRMR), indicated that the unidimensional model was a poor fit for the data (χ2 = 23,856 (189), CFI = 0.550, RMSEA = 0.148, SRMR = 0.107). In contrast, the hypothesized model consisting of seven dimensions did result in a sufficient model fit (χ2 = 3688 (168), CFI = 0.933, RMSEA = 0.060, SRMR = 0.038). Therefore, all seven job resources were included as separate variables in the sequential analyses.
Job demands: For this research, two job demands were included from two subcategories. Specifically, we included the hindering-demand role conflict and the challenging-demand work pressure [16]. Both job demands were measured with three items, using a Likert scale ranging from “never” (1) to “always” (5). Role conflict was measured with items such as, “Do you have to do things at work that you would prefer to do differently?” and work pressure with items such as, “Do you have too much work to do?”. The scales for role conflict (α = 0.76) work pressure (α = 0.80) appeared to be reliable. Again, we conducted a series of CFA for the items. First, the unidimensional model was tested again, with all the items of both demands loaded onto one factor. As this model indicated a poor fit (χ2 = 3587 (9), CFI = 0.660, RMSEA = 0.263, SRMR = 0.156), the hypothesized model with the two separate demands was tested instead. This model appeared to fit the data (χ2 = 144 (8), CFI = 0.987, RMSEA = 0.055, SRMR = 0.032). Consequently, role conflict and work pressure were included in the sequential analyses.
Well-being: As explained before, both positive and negative facets of well-being were included in this research. We included two items for each facet, and respondents answered on a Likert-point scale ranging from “never” (1) to “always” (5). Vigor was included using two items from the Utrecht work engagement scale [50], and an example is, “At work, I am bursting with energy.” Emotional exhaustion was included using two items from the Utrecht burnout scale of Schaufeli and Van Dierendonck [51], and an example is, “I feel burned out at work.”
Performance: For performance, we included three items that used an 11-point Likert-scale ranging from “totally dissatisfied” (1) to “totally satisfied” (11). An example of an item is, “How would you rate the quality of your work in the past four weeks?”.
Finally, we investigated the correlations between the well-being and performance items. This analysis showed that the two items on similar topics (i.e., vigor, emotional exhaustion, or performance) had correlations ranging from 0.54 to 0.71. Between the topics, the correlations between the items ranged between −0.41 and 0.32. Therefore, it is concluded that neither the items nor their topics were redundant and different profiles may appear when conducting an LCA on these seven items.
2.3. Analyses
To identify the relevant employee well-being/performance profiles, we used LCA. At its core, LCA assesses whether the parameters of a statistical model vary for different unobserved subgroups [52]. This means that LCA can be used to identify typical response patterns for specific questions and identify sub-groups within the dataset. As such, it is typically used as an inductive approach when the number of classes is not known beforehand [36]. To determine the optimal number of profiles, the resulting models are compared based upon their model fit, specifically the Akaike information criterion (AIC), Bayesian information criterion (BIC), chi-square (χ2) and the G-square (G2), and the primary goal is to select a fitting model with the lowest number of classes [49]. For the model fit indicators used in this study, lower values indicate better performing models. Aside from statistical criteria, the model should also be evaluated for its theoretical and empirical interpretability. In line with Magidson, Vermunt, and Madura [49], we ran the LCA on the item scores to identify meaningful response patterns in the data. For this purpose, we used the package PoLCA (v1.4.1) in R. The parameters were estimated using the maximum likelihood method, with 1000 iterations to identify different profiles within the data based upon a pre-set number of classes. Rerunning the analyses with different numbers of classes allowed us to identify the most suitable number of well-being and performance profiles. Sequentially, we labeled the clusters by investigating their response patterns on the items measuring vigor, exhaustion, and performance, and we assigned each respondent to their predicted class using the PoLCA package. A new categorical variable was thus created for each respondent to indicate their class membership. To verify the profiles, various analyses of variance (ANOVAs) and Tukey’s multiple comparison tests were performed to assess whether the mean scores of the vigor, exhaustion, and performance items varied significantly between the profiles.
To assess which antecedents are predictive of the resulting profiles, we conducted a multinomial regression analysis using the package Nnet (v.7.3-16). This analysis compared the likelihood of an employee being a member of a certain profile with a referent group based on a specific antecedent. To facilitate the interpretation of the results, the odds ratio (OR) was calculated. The coefficients were transformed into an OR by taking the exponential of the coefficients. The OR reflects “the change in likelihood of membership in a target profile versus a comparison profile associated for each unit of increase in the predictor” [53]. Thus, an OR of 2 suggests that, with each unit-increase of a specific job demand or resource, the likelihood of being a member of a specific profile is two times higher than that of the referent profile. An OR under 1, for example 0.50, suggests that the likelihood of profile membership is reduced by 50% in comparison to the referent profile [53]. Finally, it should be noted that, as in other LCA studies (e.g., [14,36,37]), no additional control variables were used in this analysis.
3. Results
3.1. Descriptives
Table 1 shows the means, standard deviations, correlations, and Cronbach alphas of the job demands and resources. As can be seen from this table, all job resources correlated positively with one another and were typically negatively correlated with the job demands. The exception to this were the correlations of work pressure with learning and development (r = 0.03, p < 0.05) and performance feedback (r = 0.05, p < 0.01). Similarly, role conflict and work pressure appeared to be positively related with one another (r = 0.30, p < 0.01).

Table 1.
Correlations and descriptives of the antecedents.
3.2. Well-Being and Performance Profiles
As mentioned in the methods section, the number of classes was determined by an inductive approach in which the number of classes was increased until the most statistically and theoretically suitable model had been found. The pre-determined number was increased until the fit measures—such as the BIC and AIC—no longer indicated a model improvement or until the model no longer converged. In Table 2, the model fit indicators are presented for LCA solutions up to six classes. For seven classes, the model no longer converged. As can be seen from the model, fit indices such as the BIC and AIC favor the most complicated, six-class model, as both values are at their lowest point for this solution. However, the difference in fit indices with the five-class model is relatively small, and the six-class model often failed to replicate the solution. Moreover, in the six-class solution, a profile consisting of a very small sub-set (4.36% of the sample) was created and the solution appeared to be more difficult to interpret than the five-class solution. Therefore, the five-class solution was chosen as it statistically outperformed the other solutions and provided the most meaningful solution from both the theoretical and the empirical perspectives.
Table 2.
Summary of the latent class analysis (LCA) for the different models.
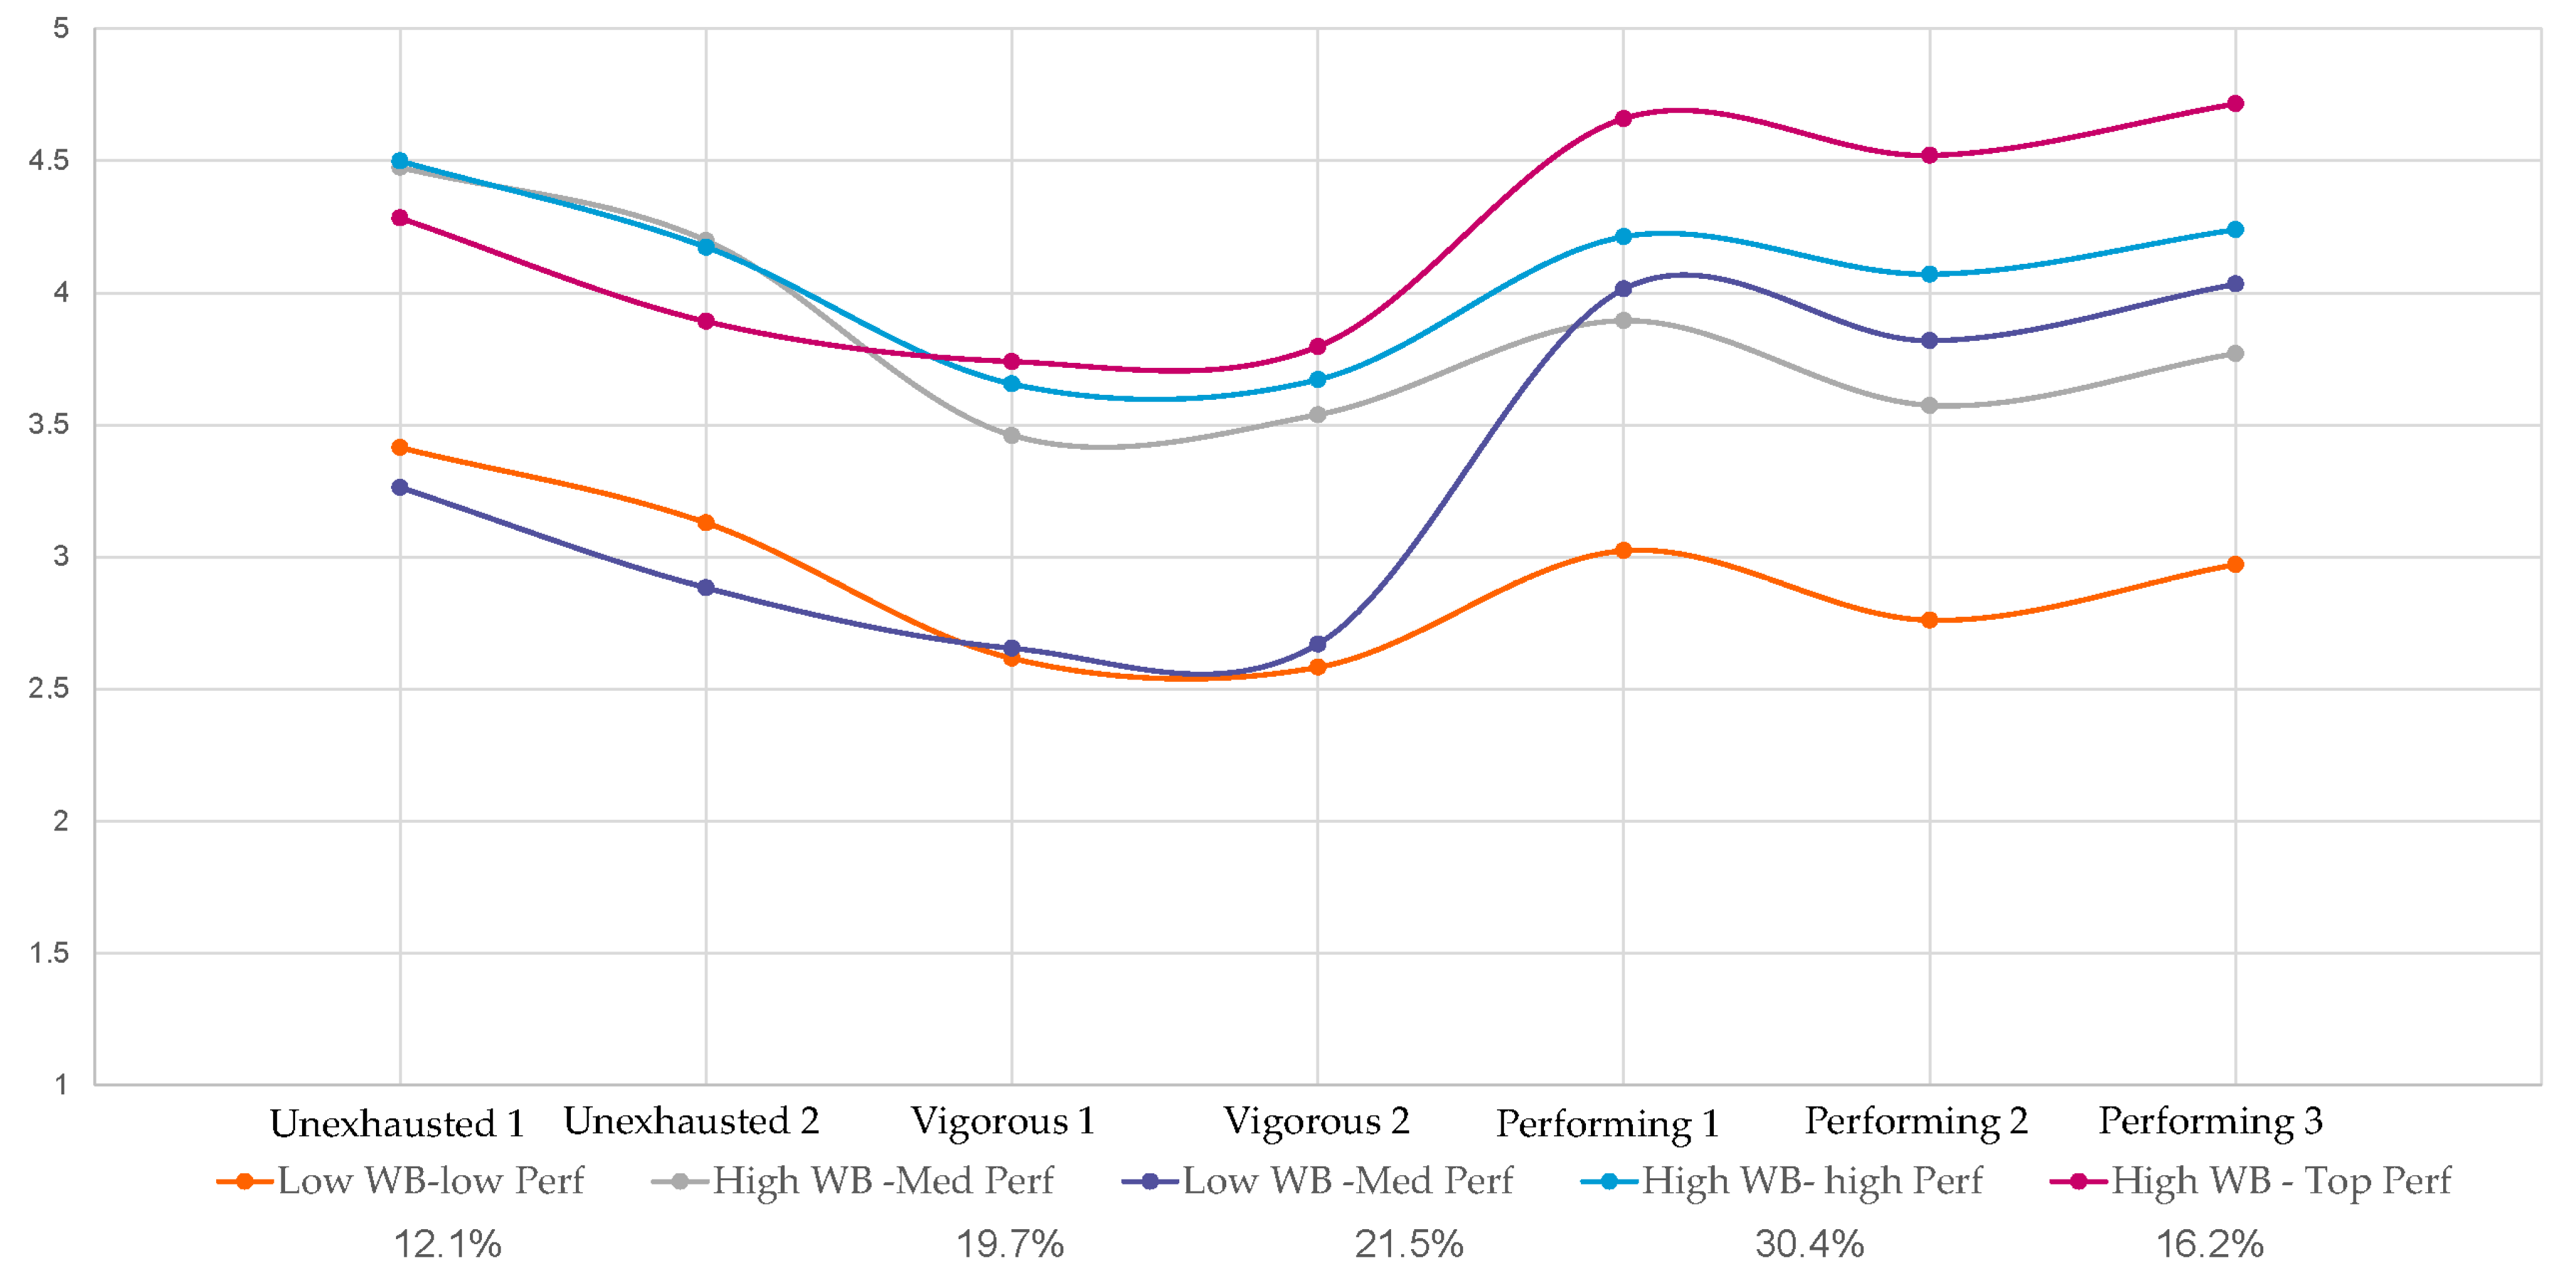
The five-class solution is shown in Figure 1. As shown there, the first class (12.1%) has low scores for all well-being and performance items (orange line). Therefore, we labeled this the “low well-being/low performance” profile. The second class (19.7%) scored relatively highly on the well-being items, but it had the second-to-lowest performance pattern of all profiles (gray line). This profile was sequentially labeled the “high well-being/medium performance” profile. The third class (21.5%) is characterized by its low scores on the well-being items, but it scored mid-range for performance (blue line). Therefore, we labeled this class the “low well-being/medium performance” profile. The fourth class (30.4%) scored highly on all well-being and performance profiles (blue line) and therefore received the label of the “high well-being/high performance” profile. Finally, the fifth group (16.2%) also scored highly on all well-being items, but it had a distinctively high-performance pattern (purple line). Therefore, we labeled this class the “high well-being/top performance” profile.
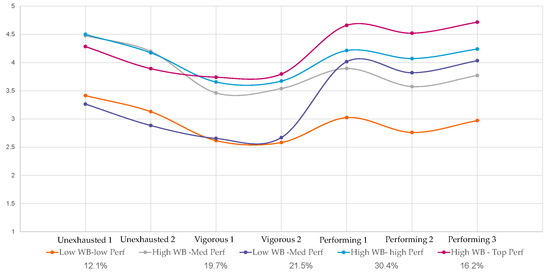
Figure 1.
Profile plot five-class solution. To facilitate the interpretation of this figure, the items from “emotional exhaustion” were mirrored, so that higher scores indicate increased levels of well-being. Moreover, the performance scale ranging from 1–11 was transformed to a five-point scale.
We conducted ANOVAs to test whether the profiles that we found were distinctive. A Tukey’s mean score comparison test was conducted where the ANOVA results indicated that the mean scores differed significantly from one another. These analyses showed that the means of the first vigor item (Mdiff = 0.037, p = 0.851) and the second vigor item (Mdiff = 0.089, p = 0.067) were not significantly different for the “low well-being/medium performance” profile and the “low well-being/low performance” profile. Additionally, we found that, for the “high well-being/medium performance” profile and the “high well-being/high performance” profile, the means of the first (Mdiff = −0.024, p = 0.914) and second exhaustion items (Mdiff = 0.0252, p = 0.917) were not significantly different. As all other mean scores for vigor, exhaustion, and performance were found to be significantly different across the five profiles, it is concluded that it is indeed possible to distinguish five unique well-being and performance profiles, as identified in the LCA.
Finally, it should be noted that the profiles we found differed in qualitative and quantitative terms. In terms of quantitative differences, we found three profiles that differ in their levels of all vigor, exhaustion, and performance items (i.e., the “low well-being/low performance,” “high well-being/high performance,” and “high well-being-top performance” profiles). In addition, we found two qualitative different profiles. One combined low levels of well-being with medium levels of performance (i.e., the “low well-being/medium performance” profile) and the other combined high levels of well-being with medium levels of performance (i.e., “high well-being/medium performance” profile). Therefore, the results confirm the value of using the person-centered LCA method [35].
3.3. Test of Antecedents
To answer our second and third research questions, we investigated whether job demands and resources were differentiated for the five profiles that we found. Specifically, we used multinomial regression to test whether seven job resources (communication, role clarity, social support from colleagues, social support from managers, learning opportunities, autonomy, and performance feedback) and two job demands (work pressure and role clarity) determined profile membership. The results of this analysis can be found in Table 3.
Table 3.
Results of the multinomial regression.
Organizational-level resources: Communication appeared to do relatively little to distinguish our profiles, with two exceptions. First, employees who perceive higher levels of communication were 1.3 to 1.5 times less likely to be in the “low well-being/low performance” profile compared to the other profiles. Second, communication increased the likelihood of membership in the “high well-being/high performance” profile relative to “high well-being/medium performance” (OR = 1.22).
Organization of work: Having more role clarity appeared to increase the likelihood of being in the high- or top-performance profile, in comparison with the low-to-medium performance profiles. Especially noticeable in this regard was that more role clarity made individuals 2.6 times more likely to be in the “high well-being/top performance” profile than in the “low well-being/low performance” profile. Furthermore, compared with the “low well-being/low performance” profile, greater role clarity increased the likelihood of being in one of the two medium performance profiles (“high well-being/medium performance” [OR = 1.36] and “low well-being/medium performance” [OR = 1.26]). Finally, for the two high-performance profiles, greater role clarity increased the likelihood of being in the “high well-being/top performance” profile, compared to the “high well-being/high performance” profile (OR = 1.52). This means that, of all the profiles, employees with high levels of role clarity were most likely to fall into the “high well-being/top performance” profile.
Interpersonal resources: Social support from the managers rarely appeared to be predictive of class membership. The only exception was where this appeared to differentiate between the “low well-being/medium performance” profile and two other profiles. First, the likelihood of being in the “low well-being/low performance” profile decreased by 0.82 for employees with higher levels of social support from their manager in comparison to the “low well-being/medium performance” profile. Second, employees with more social support from their manager were more likely to be in the “high well-being/top performance” profile, compared to the “low well-being/medium performance” profile.
Having social support from one’s colleagues appeared to be an important antecedent of the profiles, as employees with more social support from their colleagues were more likely to be a member of the high well-being profiles than the low well-being profiles. Specifically, the ORs of the high well-being profiles ranged between 1.34 and 1.39 in comparison to the low well-being profiles. When the two low well-being and three high well-being profiles are viewed independently, social support from colleagues appears to do little to differentiate between them.
Task resources: Learning opportunities, performance feedback, and autonomy appeared to be important antecedents of our profiles. First, having more learning and development opportunities increased the likelihood of an employee being in one of the three high well-being profiles, in comparison with the low well-being profiles. Specifically, the ORs of the high well-being profiles ranged between 1.67 and 1.90, in comparison to the “low well-being” profiles. When the two “low well-being” and three “high well-being” profiles are viewed separately, only two differences are observed. First, compared to the “low well-being/low performance” profile, employees with high learning and development opportunities were more likely to be in the “low well-being/medium performance” profile (OR = 1.17). Second, employees with higher levels of learning and development opportunities were 1.16 times more likely to be in the “high well-being/high performance” profile than in the “high well-being/medium performance” profile.
Second, it appeared that employees with higher levels of performance feedback were more likely to be among the two high-to-top performance profiles than the three low-to-medium performance profiles. For example, these employees were 1.57 times more likely to be a member of the “high well-being/top performance” profile than the “low well-being/low performance” profile. Furthermore, although having more performance feedback did not appear to differentiate the three low-to-medium performance profiles, it did increase the likelihood of being in the “high well-being/top performance” profile, compared to the “high well-being/top performance” profile (OR = 1.24).
Third, having a high degree of autonomy appeared to increase the chances of being in the three high well-being profiles. Specifically, compared to the two low well-being profiles, the OR of being in one of the three high well-being profiles ranged from 1.19 to 1.45. Furthermore, having higher autonomy increased the likelihood of being in the high- or top-performance profile, compared to the low or medium performance. Specifically, the ORs of the high-performance profiles ranged between 1.06 and 1.45 in comparison to the low-to-medium performance profiles. However, while more autonomy increased the likelihood of being in the “high well-being/high performance” profile, compared to “high well-being/medium performance,” this was only by a small degree (OR = 1.06).
Conclusion on job resources: In conclusion, it appears that job resources have distinct effects on well-being and performance profiles. In general, employees with more learning opportunities, social support from their colleagues, and autonomy are more likely to fall into the three high well-being profiles than the two low well-being profiles. Furthermore, employees with more role clarity, performance feedback, and autonomy are more likely to be in the two profiles characterized by high performance than in the three medium-to-low performance profiles. Finally, although there were some differences between the profiles, communication and social support from the manager did little to differentiate between the profiles. However, employees who scored highly for communication had a lower chance of being in the “low well-being/low performance” profile than in any of the other profiles.
Challenging demands: Work pressure appeared to be an important differentiator for the profiles. Most notable was that greater work-pressure made employees 1.28 to 1.67 times less likely to be in the “high well-being/medium performance” profile. Furthermore, having more work-pressure made employees more likely to be in the “low well-being/medium performance” profile than in the “low well-being/low performance” profile (OR = 1.47). Additionally, exposure to high work-pressure decreased the likelihood of being in the “high well-being/high performance” profile, in comparison with the “low well-being/medium performance” profile (OR = 0.76). Finally, high work-pressure increased the likelihood of being in the “high well-being/top performance” profile, compared to the “low well-being/low performance” (OR = 1.44) and the “high well-being/high performance” profiles (OR = 1.28).
Hindering demand: Generally, it appeared that perceptions of high role-conflict decreased the likelihood of being in one of the three high well-being profiles, in comparison with the two low well-being profiles. Specifically, the OR of being in one of the three high well-being profiles—compared to the two low well-being profiles—ranged from 0.45 to 0.66. Most notable was that, for individuals with high levels of role conflict, the chances of being in the “high well-being/high performance” profile decreased by 55%. However, higher levels of role conflict increased the chances of an employee to be in the “high well-being/top performance,” in comparison with the other two well-being profiles. Specifically, role conflict increased the likelihood of being in the “high well-being/top performance” profile by 1.23, compared with the “high well-being/medium performance” profile, and by 1.36 compared with the “high well-being/high performance” profile.
Conclusion of job demands: Lower levels of work pressure increased the likelihood of an employee being a member of the “high well-being/low performance” profile. Furthermore, while differences between specific profiles were found, it appeared that greater work pressure was generally associated with the two higher well-being and (top) performance profiles. With regards to role conflict, it was found that employees with less role-conflict have a higher likelihood of having one of the three high well-being profiles in comparison to the two low well-being profiles. Surprisingly, when the three high well-being profiles are viewed in turn, it seems that having greater role conflict increases the chances of being in the “high well-being/top performance” profile.
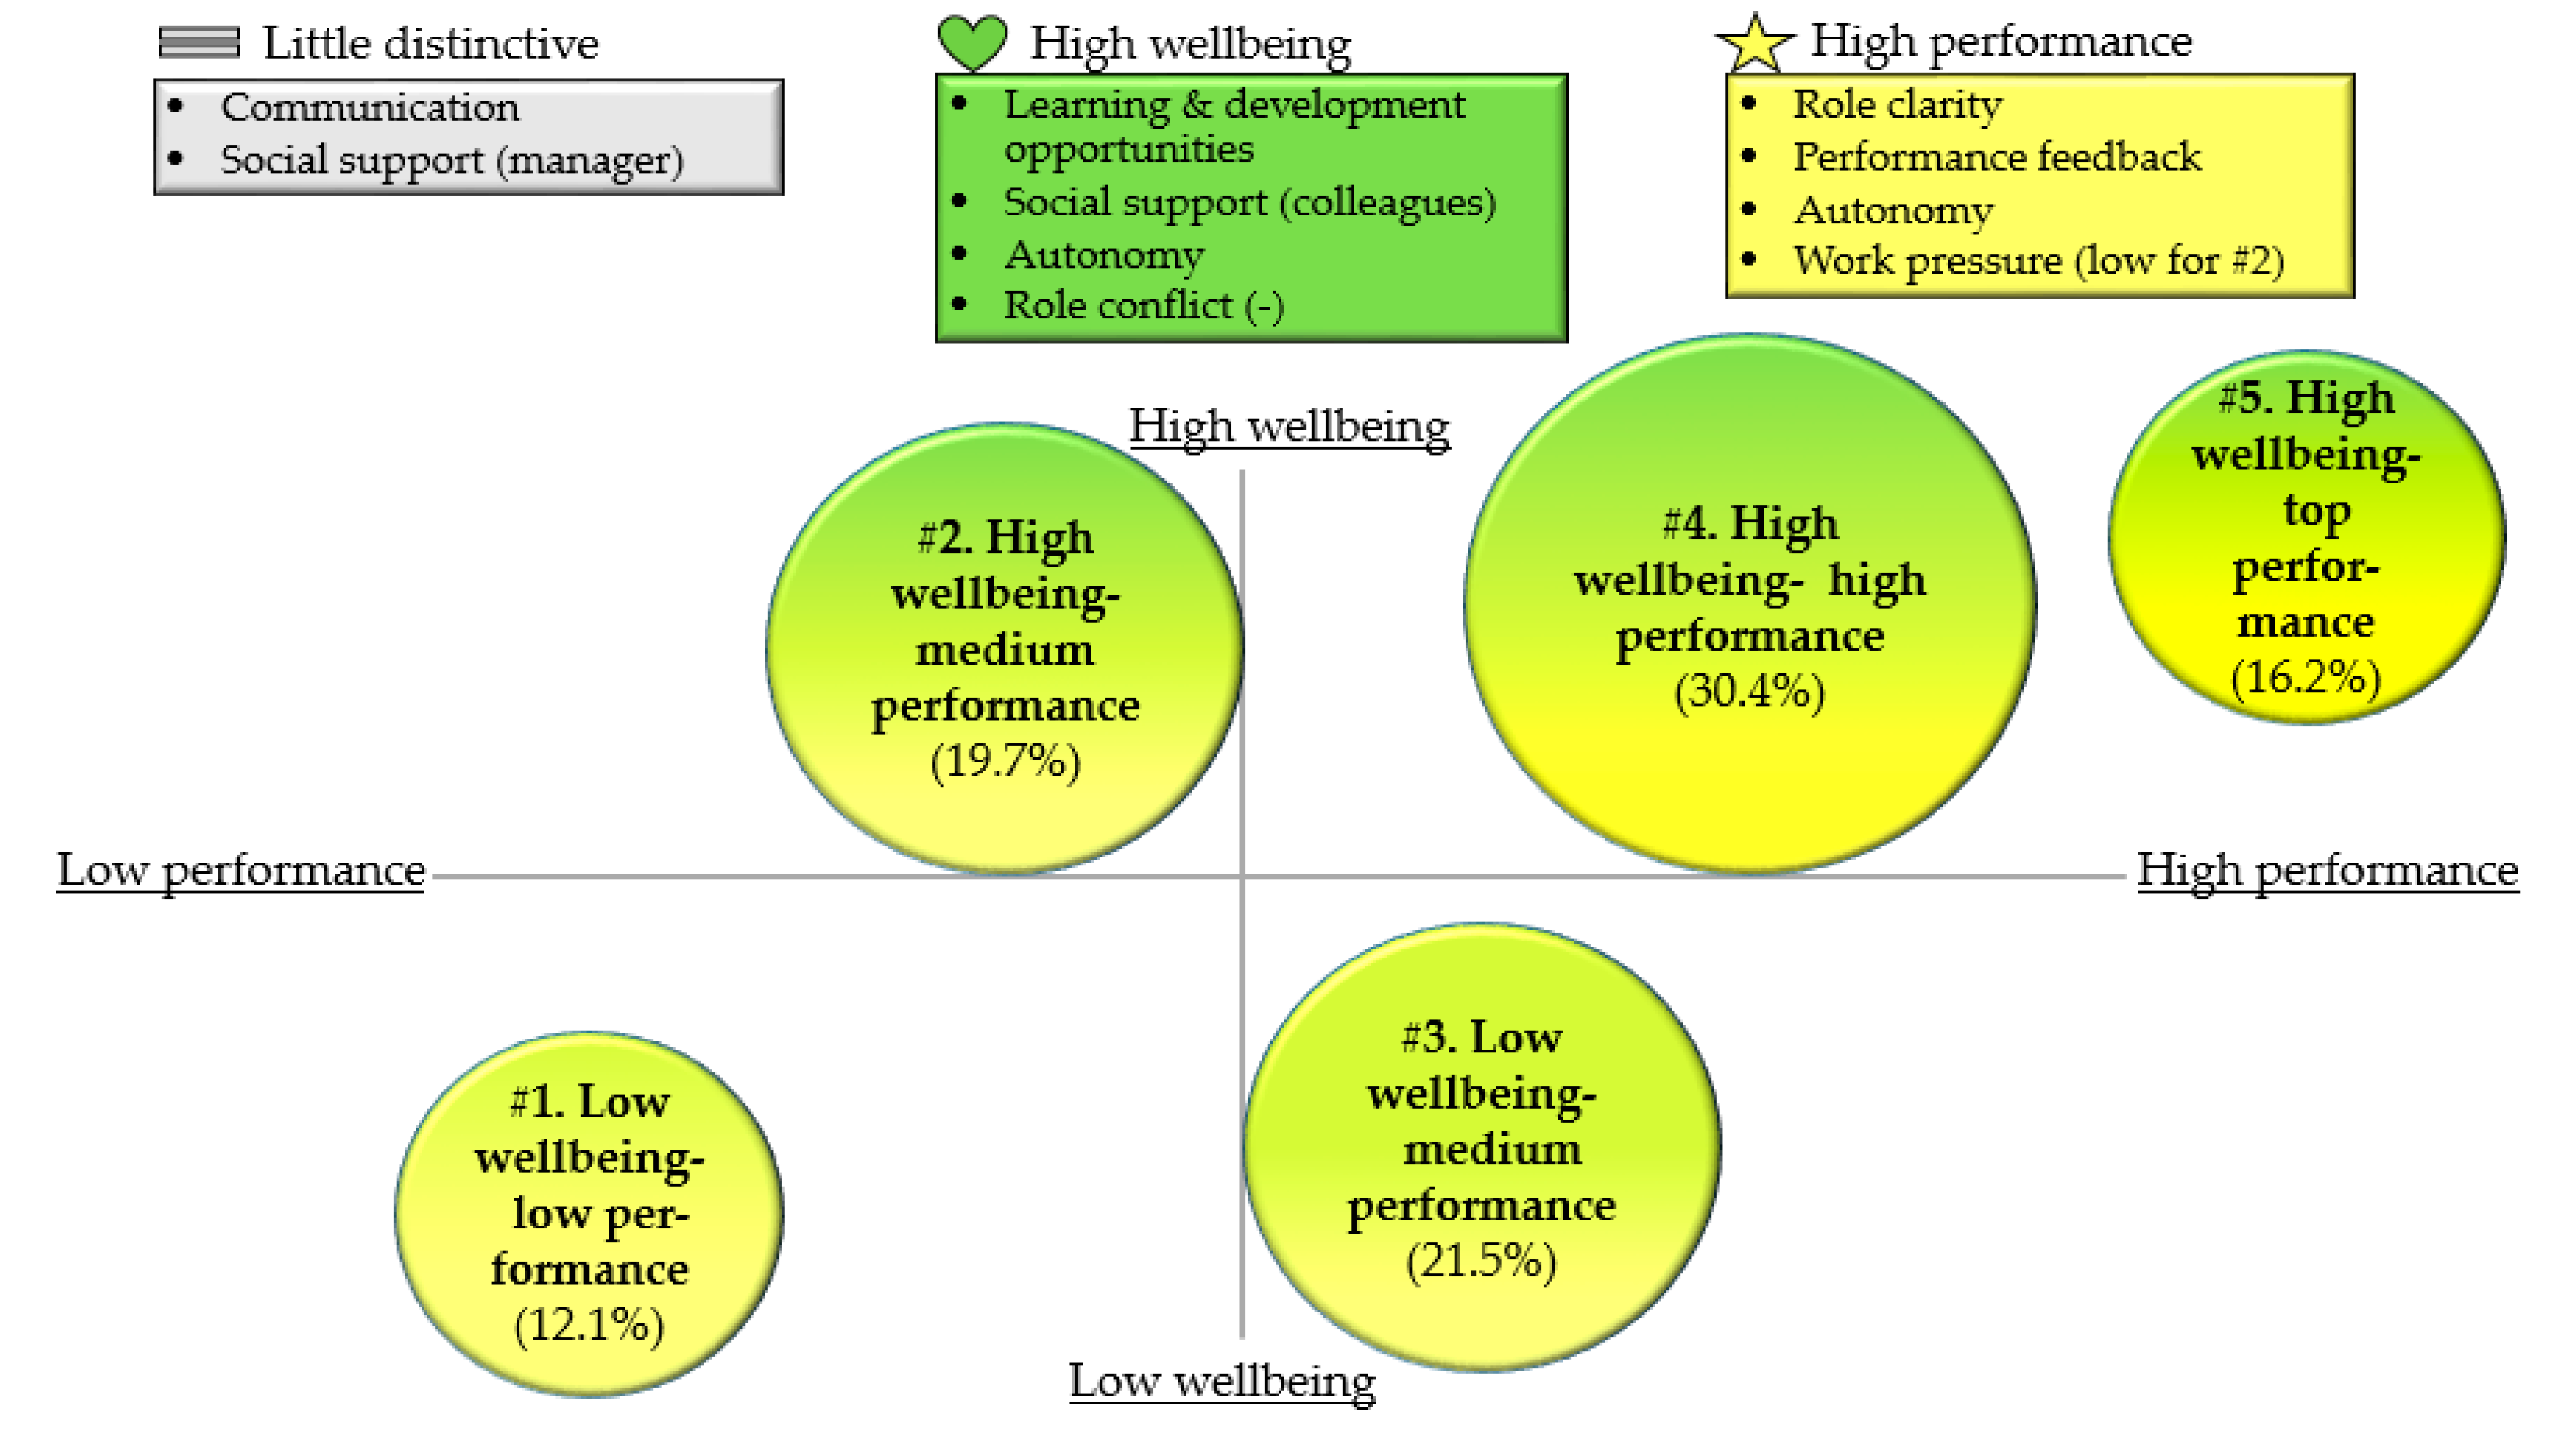
The primary results of the analyses are also summarized in Figure 2.

Figure 2.
Summary of the results.
4. Discussion
The aim of this study was to increase our understanding of how organizations can create jobs that are sustainable from the perspectives of both employee well-being and job performance. To do so, we first used LCA to identify well-being and performance profiles. Five energy-related employee well-being and job performance profiles emerged from the data. These profiles differed on quantitative and qualitative grounds. Specifically, we found three profiles that differed quantitatively (1. low well-being/low performance, 2. high well-being/high performance, and 3. high well-being/top performance) and two profiles that differed qualitatively (4. low well-being/medium performance and 5. high well-being/medium performance). As each profile consisted of a substantial proportion of our sample (between 12.1% and 30.4%), these outcomes support the existence of relevant and theoretically meaningful energy-related employee well-being/performance profiles.
Second, we explored whether two job demands and seven resources predicted well-being/performance profile membership. Most notably, having more learning opportunities, autonomy, and social support from colleagues and less role-conflict increased the likelihood of an employee being in one of the three high well-being profiles. Having more role clarity, performance feedback, and autonomy each increased the chances of being a member of the high- or top-performance profiles. Furthermore, employees with low work-pressure were typically in the “high well-being/medium performance” profile, while employees who perceived little communication had a higher likelihood of being in the “low well-being/low performance” profile than in the other profiles. In general, though, communication and social support from the manager did little to differentiate our profiles. In sum, these findings indicate that job demands and resources relate differently to employee well-being/performance profiles.
Although to the best of our knowledge, this is the first study of job performance and positive (vigor) and negative (exhaustion) energetic well-being indicators, the profiles that we found are mostly consistent with previous findings on performance/well-being at work profiles. While focusing upon performance in combination with positive well-being indicators, other researchers have similarly found low well-being/low performance and high well-being/high performance profiles together with low well-being/high performance and high well-being/low performance profiles [10,11,12]. In contrast to those results, our findings indicate that there may be an additional fifth profile for employees who show superior job performance over the high/high profiles. This “high well-being/top performance” profile consisted of a substantial part of our sample (16.2%). In addition, while our findings do not suggest qualitative differences between the positive and negative well-being indicators, other scholars who have focused exclusively on well-being profiles have found qualitative different patterns [14,15]. For example, Salanova, Del Líbano, Llorens, and Schaufeli [14] note that, aside from high well-being and low well-being profiles, employees who have high energy while working but derive no pleasure from it (e.g., workaholics) also exist. In contrast, a recent study by Benitez, Peccei, and Medina [13] only found quantitative differences between positive and negative well-being indicators (e.g., low/low and high/high profiles). Although vigor and emotional exhaustion were not found to be highly correlated, in line with Schaufeli, Salanova, González-Romá, and Bakker [28], this does call into question the benefits of including multiple well-being indicators in a study of well-being/performance profiles. As we only included energetic well-being indicators in our model, future research is needed to consider other types of well-being (e.g., stress, meaningfulness) and determine whether the inclusion of different well-being indicators helps to identify profiles from a qualitative perspective.
Turning to the antecedents of these five profiles, the first point to note is the general pattern that those employees with more resources and fewer hindering demands and more work-pressure are more likely to be in the “high well-being/high performance” and “high well-being/top performance” profiles, compared to the three low well-being and low-to-medium performance profiles. This finding is consistent with the JD-R’s “motivational path,” which argues that job resources increase employee well-being and performance [24,25,40]. Our findings are also in line with the Crawford, LePine, and Rich [44] distinction between challenging demands and hindering demands. Specifically, these authors argue that challenging demands—such as work pressure—enhance employee well-being and performance, whereas hindering demands—such as role conflict—decrease well-being and performance, in line with the “health impairment path” of the JD-R model [18,44].
Second, employees in the high well-being/top performance profile appear to have more role clarity, performance feedback, work pressure, and role conflict, in comparison with employees in the “high well-being/high performance” profile (30.4%). While it is consistent with the literature that a higher level of job resources and work pressure can lead to more favorable performance outcomes [18,44], it is surprising that those with more role conflict are also more likely to be in the top performance profile. However, as employees within the top-performance profile also had more role clarity, it may be that role conflict is considered to be inherent to their job and is, therefore, not seen as a negative, as is normally the case for hindering demands, according to Crawford, LePine, and Rich [44]. Consequently, employees who expect role conflict due to their role clarity may have their expectations fulfilled by perceiving role conflict in practice, which would be in line with the finding of Ayala, Silla, Tordera, Lorente, and Yeves [10] that happy-productive employees perceive their psychological contract to be fulfilled, whereas unhappy-unproductive employees do not. Consequently, future research could investigate by whom role conflict is perceived as a hindering demand and by whom as challenging demand.
Third, a closer look at the different qualitative profiles suggests two possible explanations for membership of the “low well-being/medium performance” profile. Specifically, compared to the “low well-being/low performance” profile, employees in the “low well-being/medium performance” profile appeared to have more learning opportunities, communication, role clarity, and work pressure and less support from their managers. On one hand, and in line with the JD-R model, it may thus be argued that because these specific resources primarily relate to the task level and there is higher work pressure, employees may be more enabled and motivated to perform [24,44]. On the other hand, as relationship with one’s supervisor has appeared to be related to well-being [54], it may be that the relatively low social support from the manager for this group—compared to the levels of the “low well-being/low performance” and “high well-being/medium performance” profiles—may lead to its low well-being. Alternatively, the manager may be more likely to provide social support to employees who have lower well-being scores when they also have lower job performance.
Finally, for the other qualitatively different profile (“high well-being/medium performance”), it appeared that having more work-pressure increased the likelihood of being in the “high well-being/high performance” and “high well-being/top performance” profiles, compared to “high well-being/medium performance.” This is consistent with the notion of Crawford, LePine, and Rich [44] that challenging demands can be motivating. Furthermore, this finding may hint at the existence of the boosting effect described on a few occasions in the literature [55]. The boosting effect suggests that the positive effects of job resources on engagement can be strengthened by certain job demands [25], such as work pressure. This is conceptually different from the buffering effect, which suggests that job resources may compensate for high job demands [55]. As interaction effects between job demands and resources have only been found on a few occasions [24], more research is required to explore whether such interactions may predict employee well-being/performance profile membership.
4.1. Limitations and Directions for Future Research
Several limitations for our research should be considered. First, due to data privacy and ethical considerations, we only had access to an anonymous dataset, comprising survey data gathered at one point in time. This means that we were unable to enrich our data with data from other sources such as the supervisor or human resources (HR) system. Therefore, our outcomes may have been subject to common method bias [56]. To reduce the potential for this issue in the future, we recommend that researchers combine data sources. For instance, performance ratings from the manager and other well-being indicators, such as absenteeism data, could be included in the LCA. Furthermore, to assess whether job demands and resources lead to certain profiles—or if it is the other way around—and to investigate the dynamic nature of these profiles in more detail, we recommend longitudinal (intervention) studies.
Second, the research was conducted with a single company (albeit a large one) that operates at the national and international levels, and it included a sample of all staff, from low-ranking up to high-ranking workers in a variety of functions (such as sales, accounting, compliance, stockbroking, and HR), each based in the company’s Dutch division or head office. This one company provides an example of the possibilities of using LCA to distinguish the different profiles/categories of staff with respect to the balance or imbalance between well-being and performance and related job resources and demands. Owing to the increasing availability of survey-based data in large companies [57], other firms could conduct similar analyses to discern the profiles found in their own organizations and make improvements to the mixes of available resources and challenging demands.
Third, in this research, no interaction effects between job demands and resources were used to predict membership of the well-being and performance profiles. We made this choice because of the limited empirical evidence [24] and theoretical consensus on these effects. For instance, whereas the JD-R model has traditionally only focused on buffering effects in which job resources can compensate for high demands, boosting effects have recently been introduced to explain how job demands can strengthen the positive effects of job resources [58]. Furthermore, although some researchers have suggested that job resources should be matched to job demands to find significant interaction effects, others have shown that job demands and resources that have conceptually little in common are able to boost engagement [55]. Considering that well-being and performance profiles are relatively underexplored, we made the choice not to further complicate our research by also investigating these interactions. Nevertheless, some of our findings do hint to the existence of interaction effects, such as the “high well-being/top performance” profiles experiencing both role clarity and role conflict. Therefore, in line with other scholars [59], we recommend that future researchers explore these possible interactions between job demands and resources.
Finally, as the well-being and performance profiles that we found in this study reflect patterns of realized outcomes of organizations across (some of the) financial and social goals, future research could also use the distribution of these profiles as organizational-level proxies for the intensity with which organizations engage in corporate sustainability. In addition, the distribution of well-being and performance profiles could serve as an indicator or outcome of the organization’s perspective on the employment relationship. Using the profiles, scholars could, for example, identify the proportion of individuals in an organization who have sustainable work (those belonging to the “high well-being/high performance” profile) and investigate whether these organizations are more likely to adopt a mutual investment approach. A company with a mutual investment approach is one that typically invests heavily in its employees (e.g., providing training and development opportunities) and expects high employee contributions in return [60].
4.2. Practical Implications
This research has several practical implications. First, a little over half of our sample provide support for the hypothesis that employees who feel well also perform well e.g., [61]. However, 41.2% of our sample was in one of the two profiles characterized by a trade-off between well-being and performance. This means that managers—preferably in close cooperation with their HR business manager—should consider these complex employee well-being/performance patterns when deciding upon an intervention. For example, to increase well-being and performance, managers should increase the job resources to which an employee has access if the individual is in the “low well-being/low performance” profile. These valuable job resources include learning and development, sufficient autonomy, and proper performance feedback. However, to increase the performance of the “high well-being/medium performance” profile, work pressure should be increased. The latter is in line with the Crawford, LePine, and Rich [44] assumption that challenging demands may motivate employees to perform.
Second, the largest single profile (30.4%) is the “high well-being/high performance” group, while relatively few are in the “low well-being/low performance” (12.1%) or “high well-being/top performance” (16.2%) profiles. This shows that situations in which employees have very limited resources and high hindering demands (“low well-being/low performance”) are relatively rare and there is more to gain by further improving the performance levels of the “high well-being/high performance” group. Based upon our research, we suggest that managers could achieve this by enhancing the role clarity and feedback of employees in the “high well-being/high performance group.” This could be done, for example, by being particularly attentive to role clarity when employees are new to their job during the socialization phase [62]. Alternatively, a manager may also work on his or her own style of feedback, making sure not to fall into the trap of micromanagement and instead focusing on the targets to be achieved and facilitating conditions (such as role clarity). This should ensure that employees are more receptive to feedback e.g., [63].
5. Conclusions
In pursuit of economic viability and social responsibility, many organizations strive to create jobs that increase employee well-being and organizational performance. Taking a person-centered approach, we identified five employee energy-related well-being and performance profiles, of which some have trade-offs (e.g., “low well-being/medium performance” and “high well-being/medium performance”). As each profile appears to be predicted by distinct job demands and resources, this study sheds light on the difficult task of creating jobs that are beneficial to both organizations and their employees.
Author Contributions
All authors substantially contributed to the conceptualization, methodology, validation, formal analysis, investigation, resources, data curation, writing—original draft preparation, writing—review and editing, visualization, supervision, and project administration of the research and research article. All authors have read and agreed to the published version of the manuscript.
Funding
This research received no external funding.
Institutional Review Board Statement
The study was conducted according to the guidelines of the Declaration of Helsinki and approved by the Ethics Review Board of Tilburg University. Permission to use the third-party data for academic research was granted by the data privacy officer and the management of the company.
Informed Consent Statement
The organization central to this research obtained informed consent from all subjects involved in the study.
Data Availability Statement
Data is owned by a third-party company and is not publicly available due to the sensitive and confidential nature of the data.
Conflicts of Interest
The authors declare no conflict of interest.
References
- Battilana, J.; Obloj, T.; Pache, A.-C.; Sengul, M. Beyond Shareholder Value Maximization: Accounting for Financial/Social Tradeoffs in Dual-Purpose Companies. Acad. Manag. Rev. 2020, 6, 18–50. [Google Scholar] [CrossRef]
- Jackson, S.E.; Schuler, R.S.; Jiang, K. An aspirational framework for strategic human resource management. Acad. Manag. Ann. 2014, 8, 1–56. [Google Scholar] [CrossRef]
- Boxall, P. Mutuality in the management of human resources: Assessing the quality of alignment in employment relationships. Hum. Resour. Manag. J. 2013, 23, 3–17. [Google Scholar] [CrossRef]
- Boxall, P. Studying mutuality and perversity in the impacts of human resource management on societal well-being: Advancing a pluralist agenda. Hum. Resour. Manag. J. 2021. [Google Scholar] [CrossRef]
- Beer, M.; Boselie, P.; Brewster, C. Back to the future: Implications for the field of HRM of the multistakeholder perspective proposed 30 years ago. Hum. Resour. Manag. 2015, 54, 427–438. [Google Scholar] [CrossRef]
- Jiang, K.; Lepak, D.P.; Han, K.; Hong, Y.; Kim, A.; Winkler, A.-L. Clarifying the construct of human resource systems: Relating human resource management to employee performance. Hum. Resour. Manag. Rev. 2012, 22, 73–85. [Google Scholar] [CrossRef]
- Van De Voorde, K.; Paauwe, J.; Van Veldhoven, M. Employee well-being and the HRM–organizational performance relationship: A review of quantitative studies. Int. J. Manag. Rev. 2012, 14, 391–407. [Google Scholar] [CrossRef]
- Ogbonnaya, C.N.; Nielsen, K. Transformational leadership, high performance work practices, and an effective organization. In Proceedings of the 76th Annual Meeting of the Academy of Management, Anaheim, CA, USA, 5–9 August 2016. [Google Scholar]
- Peccei, R.; Van De Voorde, K. Human resource management–well-being–performance research revisited: Past, present, and future. Hum. Resour. Manag. J. 2019, 29, 539–563. [Google Scholar] [CrossRef] [Green Version]
- Ayala, Y.; Silla, J.M.P.; Tordera, N.; Lorente, L.; Yeves, J. Job satisfaction and innovative performance in young spanish employees: Testing new patterns in the happy-productive worker thesis—A discriminant study. J. Happiness Stud. 2017, 18, 1377–1401. [Google Scholar] [CrossRef]
- Peiró, J.M.; Kozusznik, M.W.; Rodríguez-Molina, I.; Tordera, N. The happy-productive worker model and beyond: Patterns of wellbeing and performance at work. Int. J. Environ. Res. Public Health 2019, 16, 479. [Google Scholar] [CrossRef] [Green Version]
- Tordera, N.; Peiro, J.M.; Ayala, Y.; Villajos, E.; Truxillo, D. The lagged influence of organizations’ human resources practices on employees’ career sustainability: The moderating role of age. J. Vocat. Behav. 2020, 120, 103444. [Google Scholar] [CrossRef]
- Benitez, M.; Peccei, R.; Medina, F.J. Employee well-being profiles and service quality: A unit-level analysis using a multilevel latent profile approach. Eur. J. Work Organ. Psychol. 2019, 28, 859–872. [Google Scholar] [CrossRef]
- Salanova, M.; Del Líbano, M.; Llorens, S.; Schaufeli, W.B. Engaged, workaholic, burned-out or just 9-to-5? Toward a typology of employee well-being. Stress Health 2014, 30, 71–81. [Google Scholar] [CrossRef] [PubMed] [Green Version]
- Somers, M.; Birnbaum, D.; Casal, J. Application of the person-centered model to stress and well-being research. Empl. Relat. Int. J. 2019, 41, 649–661. [Google Scholar] [CrossRef]
- LePine, J.A.; Podsakoff, N.P.; LePine, M.A. A meta-analytic test of the challenge stressor–hindrance stressor framework: An explanation for inconsistent relationships among stressors and performance. Acad. Manag. J. 2005, 48, 764–775. [Google Scholar] [CrossRef] [Green Version]
- Podsakoff, N.P.; LePine, J.A.; LePine, M.A. Differential challenge stressor-hindrance stressor relationships with job attitudes, turnover intentions, turnover, and withdrawal behavior: A meta-analysis. J. Appl. Psychol. 2007, 92, 438. [Google Scholar] [CrossRef]
- Schaufeli, W.B.; Bakker, A.B. Job demands, job resources, and their relationship with burnout and engagement: A multi-sample study. J. Organ. Behav. Int. J. Ind. Occup. Organ. Psychol. Behav. 2004, 25, 293–315. [Google Scholar] [CrossRef] [Green Version]
- Eurofound. Sixth European Working Conditions Survey–Overview Report (2017 Update); Publications Office of the European Union: Luxembourg, 2017.
- Campbell, J.P.; Wiernik, B.M. The modeling and assessment of work performance. Annu. Rev. Organ. Psychol. Organ. Behav. 2015, 2, 47–74. [Google Scholar] [CrossRef] [Green Version]
- Erdogan, B.; Bauer, T.N.; Truxillo, D.M.; Mansfield, L.R. Whistle While You Work: A Review of the Life Satisfaction Literature. J. Manag. 2012, 38, 1038–1083. [Google Scholar] [CrossRef]
- Harter, J.K.; Schmidt, F.L.; Hayes, T.L. Business-unit-level relationship between employee satisfaction, employee engagement, and business outcomes: A meta-analysis. J. Appl. Psychol. 2002, 87, 268–279. [Google Scholar] [CrossRef] [Green Version]
- Demerouti, E.; Bakker, A.B.; Nachreiner, F.; Schaufeli, W.B. The job demands-resources model of burnout. J. Appl. Psychol. 2001, 86, 499. [Google Scholar] [CrossRef]
- Bakker, A.B.; Demerouti, E. The job demands-resources model: State of the art. J. Manag. Psychol. 2007, 22, 309–328. [Google Scholar] [CrossRef] [Green Version]
- Schaufeli, W.B.; Taris, T.W. A critical review of the job demands-resources model: Implications for improving work and health. In Bridging Occupational, Organizational and Public Health; Springer: Dordrecht, The Netherlands, 2014; pp. 43–68. [Google Scholar] [CrossRef]
- Campbell, J.P. Modeling the performance prediction problem in industrial and organizational psychology. In Handbook of Industrial and Organizational Psychology; Consulting Psychologists Press: London, UK, 1990. [Google Scholar]
- Koopmans, L.; Bernaards, C.M.; Hildebrandt, V.H.; Schaufeli, W.B.; de Vet Henrica, C.; van der Beek, A.J. Conceptual frameworks of individual work performance: A systematic review. J. Occup. Environ. Med. 2011, 53, 856–866. [Google Scholar] [CrossRef] [PubMed] [Green Version]
- Schaufeli, W.B.; Salanova, M.; González-Romá, V.; Bakker, A.B. The measurement of engagement and burnout: A two sample confirmatory factor analytic approach. J. Happiness Stud. 2002, 3, 71–92. [Google Scholar] [CrossRef]
- Maslach, C.; Jackson, S.E.; Leiter, M.P.; Schaufeli, W.B.; Schwab, R.L. Maslach Burnout Inventory; Consulting Psychologists Press: Palo Alto, CA, USA, 1986; Volume 21. [Google Scholar]
- Hofmans, J.; Wille, B.; Schreurs, B. Person-centered methods in vocational research. J. Vocat. Behav. 2020, 118, 103398. [Google Scholar] [CrossRef]
- Bakker, A.B.; Oerlemans, W. Subjective well-being in organizations. Oxf. Handb. Posit. Organ. Scholarsh. 2011, 49, 178–189. [Google Scholar] [CrossRef]
- Hülsheger, U.R.; Lang, J.W.B.; Maier, G.W. Emotional labor, strain and performance: Testing reciprocal relationships in a longitudinal panel study. J. Occup. Health Psychol. 2010, 15, 505–521. [Google Scholar] [CrossRef]
- Jiang, W.; Xiao, Z.; Liu, Y.; Guo, K.; Jiang, J.; Du, X. Reciprocal relations between grit and academic achievement: A longitudinal study. Learn. Individ. Differ. 2019, 71, 13–22. [Google Scholar] [CrossRef]
- Marsh, H.W.; Lüdtke, O.; Trautwein, U.; Morin, A.J. Classical latent profile analysis of academic self-concept dimensions: Synergy of person-and variable-centered approaches to theoretical models of self-concept. Struct. Equ. Model. A Multidiscip. J. 2009, 16, 191–225. [Google Scholar] [CrossRef] [Green Version]
- Meyer, J.P.; Stanley, L.J.; Vandenberg, R.J. A person-centered approach to the study of commitment. Hum. Resour. Manag. Rev. 2013, 23, 190–202. [Google Scholar] [CrossRef]
- Bennett, A.A.; Gabriel, A.S.; Calderwood, C.; Dahling, J.J.; Trougakos, J.P. Better together? Examining profiles of employee recovery experiences. J. Appl. Psychol. 2016, 101, 1635. [Google Scholar] [CrossRef] [PubMed]
- Gabriel, A.S.; Calderwood, C.; Bennett, A.A.; Wong, E.M.; Dahling, J.J.; Trougakos, J.P. Examining recovery experiences among working college students: A person-centered study. J. Vocat. Behav. 2019, 115, 103329. [Google Scholar] [CrossRef]
- Meijman, T.; Mulder, G.; Drenth, P.; Thierry, H.; de Wolff, C. Handbook of work and organizational psychology. Work Psychol. 1998, 2, 5–33. [Google Scholar]
- Ryan, R.M.; Deci, E.L. Self-determination theory and the facilitation of intrinsic motivation, social development, and well-being. Am. Psychol. 2000, 55, 68. [Google Scholar] [CrossRef] [PubMed]
- Xanthopoulou, D.; Baker, A.B.; Heuven, E.; Demerouti, E.; Schaufeli, W.B. Working in the sky: A diary study on work engagement among flight attendants. J. Occup. Health Psychol. 2008, 13, 345. [Google Scholar] [CrossRef] [PubMed]
- Hobfoll, S.E.; Freedy, J. Conservation of resources: A general stress theory applied to burnout. In Professional Burnout: Recent Developments in Theory and Research; Series in applied psychology: Social issues and questions; Taylor & Francis: Philadelphia, PA, USA, 1993; pp. 115–133. [Google Scholar]
- Lee, R.T.; Ashforth, B.E. A meta-analytic examination of the correlates of the three dimensions of job burnout. J. Appl. Psychol. 1996, 81, 123. [Google Scholar] [CrossRef]
- Hockey, G.R.J. Compensatory control in the regulation of human performance under stress and high workload: A cognitive-energetical framework. Biol. Psychol. 1997, 45, 73–93. [Google Scholar] [CrossRef]
- Crawford, E.R.; LePine, J.A.; Rich, B.L. Linking job demands and resources to employee engagement and burnout: A theoretical extension and meta-analytic test. J. Appl. Psychol. 2010, 95, 834. [Google Scholar] [CrossRef]
- Tubre, T.C.; Collins, J.M. Jackson and Schuler (1985) revisited: A meta-analysis of the relationships between role ambiguity, role conflict, and job performance. J. Manag. 2000, 26, 155–169. [Google Scholar] [CrossRef]
- Humphrey, S.E.; Nahrgang, J.D.; Morgeson, F.P. Integrating motivational, social, and contextual work design features: A meta-analytic summary and theoretical extension of the work design literature. J. Appl. Psychol. 2007, 92, 1332. [Google Scholar] [CrossRef] [Green Version]
- Brauner, C.; Wöhrmann, A.M.; Frank, K.; Michel, A. Health and work-life balance across types of work schedules: A latent class analysis. Appl. Ergon. 2019, 81, 102906. [Google Scholar] [CrossRef]
- Van Den Groenendaal, S.M.E.; Rossetti, S.; Van Den Bergh, M.; Kooij, T.D.; Poell, R.F. Motivational profiles and proactive career behaviors among the solo self-employed. Career Dev. Int. 2021, 26, 309–330. [Google Scholar] [CrossRef]
- Magidson, J.; Vermunt, J.K.; Madura, J.P. Latent Class Analysis; SAGE Publications Limited: London, UK, 2020. [Google Scholar]
- Schaufeli, W.B.; Bakker, A.B.; Salanova, M. The measurement of work engagement with a short questionnaire: A cross-national study. Educ. Psychol. Meas. 2006, 66, 701–716. [Google Scholar] [CrossRef]
- Schaufeli, W.B.; Van Dierendonck, D. Handleiding van de Utrechtse Burnout Schaal (UBOS) [Manual Utrecht Burnout Scale]; Swets Test Services: Lisse, The Netherlands, 2000; pp. 177–196. [Google Scholar]
- Vermunt, J.K.; Magidson, J. Latent class analysis. Sage Encycl. Soc. Sci. Res. Methods 2004, 2, 549–553. [Google Scholar]
- Morin, A.J.; Meyer, J.P.; Creusier, J.; Biétry, F. Multiple-group analysis of similarity in latent profile solutions. Organ. Res. Methods 2016, 19, 231–254. [Google Scholar] [CrossRef]
- Hooper, D.T.; Martin, R. Beyond personal leader–member exchange (LMX) quality: The effects of perceived LMX variability on employee reactions. Leadersh. Q. 2008, 19, 20–30. [Google Scholar] [CrossRef]
- Bakker, A.B.; Hakanen, J.J.; Demerouti, E.; Xanthopoulou, D. Job resources boost work engagement, particularly when job demands are high. J. Educ. Psychol. 2007, 99, 274–284. [Google Scholar] [CrossRef] [Green Version]
- Podsakoff, P.M.; MacKenzie, S.B.; Lee, J.-Y.; Podsakoff, N.P. Common method biases in behavioral research: A critical review of the literature and recommended remedies. J. Appl. Psychol. 2003, 88, 879. [Google Scholar] [CrossRef]
- Levenson, A.; Fink, A. Human capital analytics: Too much data and analysis, not enough models and business insights. J. Organ. Eff. People Perform. 2017, 4, 145–156. [Google Scholar] [CrossRef]
- Bakker, A.B.; Demerouti, E. Job demands–resources theory: Taking stock and looking forward. J. Occup. Health Psychol. 2017, 22, 273–285. [Google Scholar] [CrossRef] [PubMed]
- Van Veldhoven, M.; Van den Broeck, A.; Daniels, K.; Bakker, A.B.; Tavares, S.M.; Ogbonnaya, C. Challenging the universality of job resources: Why, when, and for whom are they beneficial? Appl. Psychol. 2020, 69, 5–29. [Google Scholar] [CrossRef]
- Tsui, A.S.; Pearce, J.L.; Porter, L.W.; Tripoli, A.M. Alternative approaches to the employee-organization relationship: Does investment in employees pay off? Acad. Manag. J. 1997, 40, 1089–1121. [Google Scholar] [CrossRef]
- Wright, T.A.; Cropanzano, R.; Bonett, D.G. The moderating role of employee positive well being on the relation between job satisfaction and job performance. J. Occup. Health Psychol. 2007, 12, 93. [Google Scholar] [CrossRef] [PubMed]
- Frögéli, E.; Rudman, A.; Gustavsson, P. The relationship between task mastery, role clarity, social acceptance, and stress: An intensive longitudinal study with a sample of newly registered nurses. Int. J. Nurs. Stud. 2019, 91, 60–69. [Google Scholar] [CrossRef] [PubMed]
- Steelman, L.A.; Wolfeld, L. The manager as coach: The role of feedback orientation. J. Bus. Psychol. 2018, 33, 41–53. [Google Scholar] [CrossRef]
Publisher’s Note: MDPI stays neutral with regard to jurisdictional claims in published maps and institutional affiliations. |
© 2021 by the authors. Licensee MDPI, Basel, Switzerland. This article is an open access article distributed under the terms and conditions of the Creative Commons Attribution (CC BY) license (https://creativecommons.org/licenses/by/4.0/).