Article

Integrated Energy System Planning Optimization Method and Case Analysis Based on Multiple Factors and A Three-Level Process

Power System and Its Automation, College of Energy and Electrical Engineering, Hohai University, No.1, Xikang Road, Gulou District, Nanjing 210098, China
*
Author to whom correspondence should be addressed.
Sustainability 2021, 13(13), 7425; https://doi.org/10.3390/su13137425
Submission received: 18 May 2021 / Revised: 15 June 2021 / Accepted: 16 June 2021 / Published: 2 July 2021

Abstract

:
Now that China has outlined its goals of “carbon peak and carbon neutrality”, the development of clean energy will accelerate, the connection between different energy systems will be closer, and the development prospects of the integrated energy service industry will be broader. Integrated energy services are promoting energy transformation and services. “Carbon peaking, carbon neutrality” and other aspects will also have multiple values and far-reaching significance. Before implementing integrated energy services, the top-level design of integrated energy system planning must be carried out, and how to achieve the optimal allocation of capacity in the field of integrated energy systems is an urgent problem to be solved in integrated energy system planning. This paper combines practical engineering experience and the latest theoretical research results to creatively introduce, for the first time, a comprehensive evaluation into the initial planning stage, and proposes, also for the first time, a three-level multi-element comprehensive energy system planning optimization method which combines multi-element requirements to carry out comprehensive energy system planning and optimization. The three-tier planning and optimization solution results in the optimal planning scheme of the integrated energy system, thereby making the scheme more specific and reliable. According to the demand data of an industrial park, this method was applied to complete a case analysis of integrated energy system planning, which verified the feasibility and effectiveness of the method. This method is easy to popularize, and it will guide the planning of integrated energy systems, promote integrated energy services, promote energy transition, and make positive contributions to achieve carbon neutrality as soon as possible.

1. Introduction

Energy is the foundation of human survival and development, and the lifeblood of economy and society. In 2020, General Secretary Xi Jinping outlined China’s new carbon emission peak goals and carbon-neutral vision, setting new requirements for energy development, clearly delineated the boundaries of the energy transition, and even more importantly, proposed the overall economic and social development and progress model which re-mobilized the direction and motivation of China’s development. China’s ambitions to achieve carbon peak by 2030 and carbon neutrality by 2060 are among the most arduous tasks of our century. To achieve the goals of “carbon peak and carbon neutrality”, it is imperative that China adjusts its economic structure accordingly as well as transforms and upgrades its development model, especially since the transformation and development of energy systems can aptly advance this goal of carbon peak and our means of attaining it—which is definitely worth exploring. The literature [1,2,3,4] has systematically summarized cases of energy transition and their related decision-making methods. The inevitable decision is that of transforming the energy system structure by replacing coal, oil, natural gas, etc., with clean energy such as renewable energy and nuclear energy. Since traditional fossil energy sources such as coal and oil are not renewable, improving the efficiency of traditional fossil energy utilization and strengthening the comprehensive utilization of renewable energy have become necessary efforts to resolve the contradictions between energy demand growth and energy shortages on one side, and energy utilization and environmental protection on the other. The integrated energy system (IES) has the advantages of multi-energy complementation and being conducive to renewable energy consumption. It is expected to alleviate the institutional contradiction between the current extensive energy use mode and environmental protection and economic development and promote energy use improvement, increased efficiency, as well as green and intensive social development. At present, the development of an integrated energy system has become an important part of the world’s energy strategy, and integrated energy services will become among the most important assets in realizing the future energy transition and achieve carbon neutrality as soon as possible.
To further advance the energy revolution and build a clean, low-carbon, safe and efficient energy system, in March 2021, the National Development and Reform Commission of China and the National Energy Administration jointly issued the Guiding Opinions on the Development of Integrated and Multi-Energy Complementarity (hereinafter referred to as the “Guiding Opinions”). The “Guiding Opinions” highlighted that the integration of source, grid, load and storage, and multi-energy complementation are important measures for the high-quality development of the power industry, aiming to “actively build a clean, low-carbon, safe and efficient new power system, and promote the transformation and upgrading of the energy industry.” The integration of source, grid, load and storage, and multi-energy complementation are important measures to achieve the high-quality development of the power system and promote the energy industry’s transformation, as well as its social and economic development. Its important significance lies in the fact that it is conducive to improving the quality and benefits of power development, strengthening the coordination and interaction between the source, network, and load and storage, fully exploiting the system’s flexibility, adjustment capabilities and demand-side resources, as well as improving the system’s operation efficiency and the comprehensive benefits of power development. This will also promote the construction of an ecological civilization, increase the development and consumption of non-fossil energy such as new energy, prioritize the use of clean energy resources, improve the regulation performance of conventional power stations, appropriately configure energy storage facilities, mobilize the enthusiasm of a flexible response on the demand side, and promote the new clean energy sector. The coordinated and sustainable development of the ecological environment is conducive to promoting the coordinated development of the region, following the concepts of cooperation and sharing, mutual benefit and win-win, taking advantage of cross-regional source–network–load–storage coordination and mutual assistance, and expanding the scope and scale of the optimal allocation of power resources.
By combining the “Guiding Opinions”, building an integrated energy system promotes the integration of source, network, load, and storage and the complementary development of a multi-energy system. The two concepts are the same: on the one hand, building an integrated energy system uses advanced physical information technology and innovative management models to integrate renewable energy, coal, oil, natural gas and other energy resources in the region to realize coordinated planning, optimized operation, coordinated management, interactive response, and mutual assistance among heterogeneous energy subsystems to meet the diversified energy demand in the system, whilst simultaneously effectively improving energy utilization efficiency and promoting sustainable energy development; on the other hand, relying on the integrated energy system to carry out integrated energy services, based on integrated energy supply, will integrate energy storage facilities, electrified transportation, and other elements through natural gas cooling, heating and power co-generation, distributed energy, energy-smart micro-grid, etc. This method, by combining with Big Data, Cloud computing, the Internet of Things, and other technologies, realizes multi-energy coordinated supply and the comprehensive cascade utilization of energy, improves the energy system efficiency, and reduces energy production and consumption costs. Building an integrated energy system is conducive to improving the quality and efficiency of power development, comprehensively promoting the construction of ecological civilization, and promoting coordinated regional development, consistent with the meaning of the “Guiding Opinions”.
After China’s “carbon peak and carbon neutralization” goal is put forward, the development of clean energy will be accelerated, the connection between different energy systems will be closer, and the development prospects of the integrated energy service industry will be broader. Integrated energy services not only help optimize the energy structure, but also help improve energy efficiency and reduce energy costs. It has multiple values and far-reaching significance in promoting energy transformation and serving “carbon peak and carbon neutralization ”. To this end, China has incorporated integrated energy services into its national energy plan. The National Energy Administration will accelerate the development of integrated energy services, promote clean and smart energy projects, and develop distributed energy and micro-energy projects by local conditions. More intelligent and environmentally friendly energy use scenarios, such as the Internet, energy storage, and intelligent charging and discharging of electric vehicles. The ninth meeting of the Central Finance and Economics Committee also pointed out that to build a “new power system with new energy as the mainstay”, it is necessary to accelerate the integration of source, network, load and storage. Through the construction of multi energy complementary comprehensive energy system, we can ensure the smooth consumption of large-scale new energy.
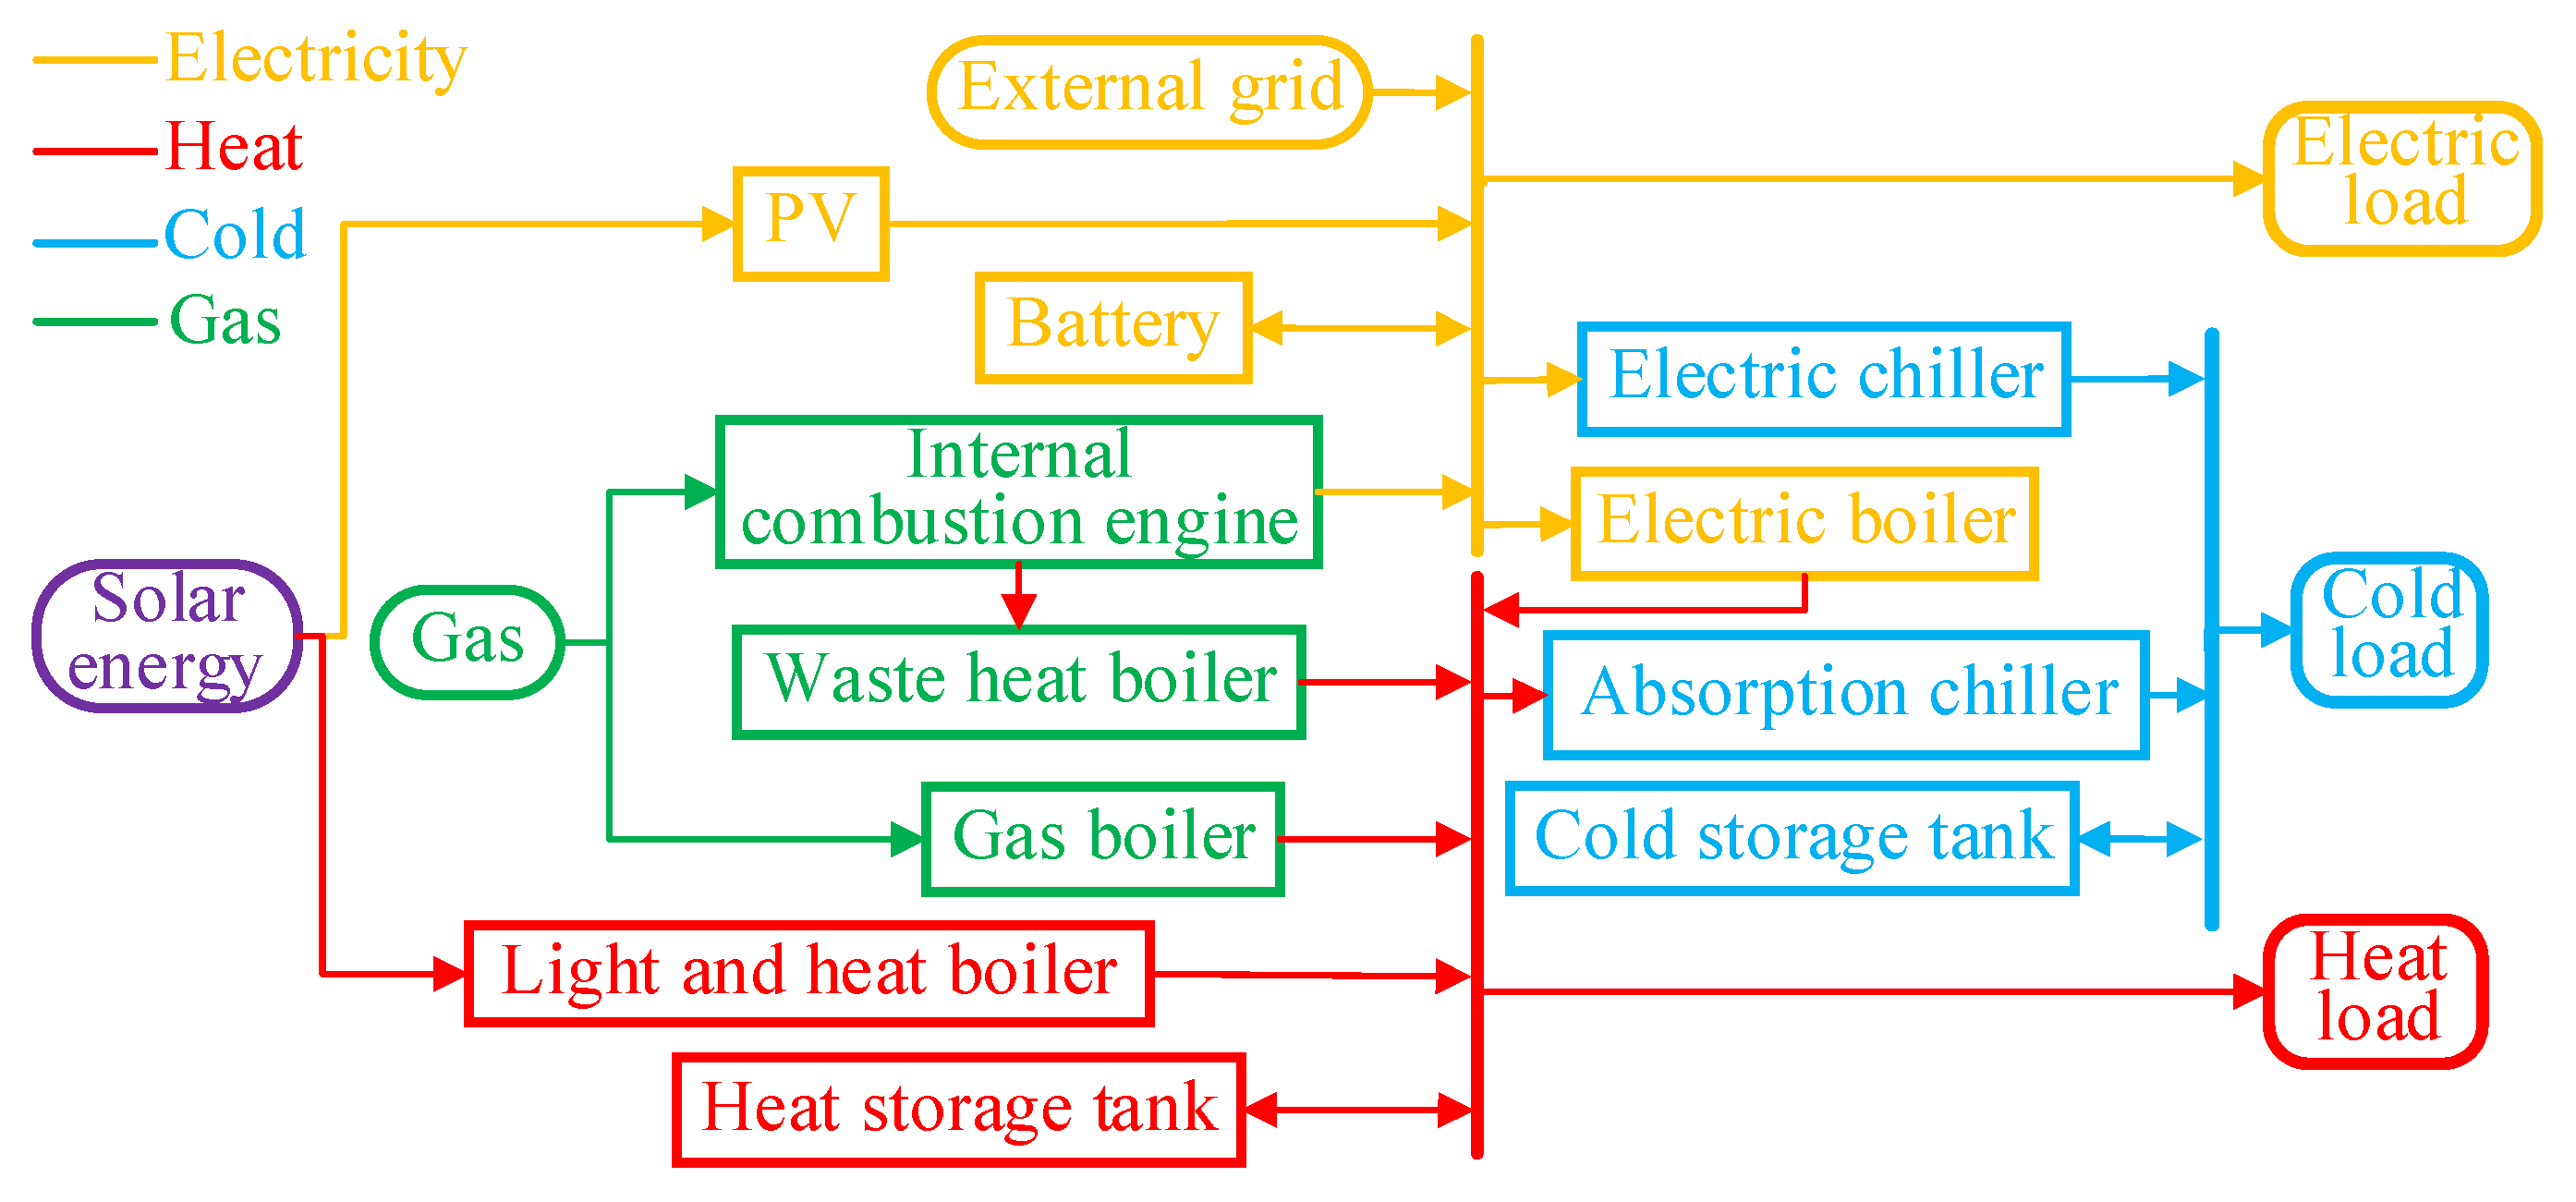
Before the implementation of integrated energy services, the top-level design of integrated energy system planning must be carried out. The construction of an integrated energy system must consider planning firstly, not just focusing on operation and scheduling. With the complementarity of the integrated energy system, the greatest benefit appears at the system planning level. If the system has not handled the various capacity configurations and important structures at the planning level properly, it will optimize the scheduling in the operation stage, and the optimization space is very small. The planning of the integrated energy system is different from traditional power system planning. It involves energy stations, energy networks, multi-energy loads, multi-energy storage, and multiple links, including electricity, gas, heat, and cold. The relationship between energy conversion and coupling is more complex, the interaction between the source network and the load and storage is more frequent, and the integration with the municipal transportation system and information system is more in-depth. When planning and constructing an integrated urban energy system, we must change the traditional model of separate planning, design, and operation of the original single energy species and supply links is necessary. According to the characteristics of energy and the characteristics of its use, we should implement the concepts of “integration of cold, heat and electricity”, “combination of various energy forms” and “adoption of safe and economic energy strategy”, and form the best energy supply scheme through systematic thinking and overall planning, so as to provide the basis for comprehensive energy services.
A large number of studies are dedicated to improving the planning level of the integrated energy system. The authors of [5,6] systematically summarized the research status and key issues of regional integrated energy system planning. The authors of [7] proposed an optimal equipment planning method to determine the number and capacity of CHP units. The authors of [8] took a hotel in Tehran as an example, proposed a capacity configuration method for combined cooling, heating, and power generation units, auxiliary boilers, and electric heat removal equipment, and realized the optimal planning of small combined cooling, heating, and power generation system. The authors of [9] considered the operating cost, power loss, network reliability, and voltage offset penalty in the optimal location and capacity problem of CHP units, which improved the accuracy and reliability of the model. The authors of [10] used cost and reliability as the principles to select electric heating equipment in the energy hub and established a multi-energy system optimization planning model that considers reliability constraints. The authors of [11] considered the impact of environmental factors on the planning results in the process of integrated energy system planning. The authors of [12] put forward a comprehensive energy system expansion planning model with the goal of low-carbon development model.
In addition to typically integrated energy equipment, such as CHP and heat storage tanks, cold, heat, and gas pipelines are also important parts of integrated energy planning that need to be considered. The gas path, water path, and heat path are generally described by partial differential equations, which are difficult to be directly brought into the planning model. The authors of [13] proposed a simplified model of natural gas pipeline based on mixed-integer linearization, which simplified partial differential equations into algebraic equations. On this basis, the authors of [14] studied the optimization planning of the regionally integrated energy system considering the equipment type selection and connection structure and proposed an initial planning model of the community integrated energy system based on graph theory. The authors of [15] proposed a two-stage regional integrated energy hub planning method. In the first stage, the equipment type of the energy hub is selected, and in the second stage, the network structure is selected. The authors of [16] considered energy transmission network planning based on traditional integrated energy equipment planning and evaluated the planning results of the integrated energy system with reliability, energy efficiency, and pollutant gas emissions as indicators. The authors of [17] modeled the integrated energy system and pipeline network expansion planning problem for the integration of electricity, gas, heat, and cooling to maximize the consumption rate of renewable energy. Considering that the planning and operation of the integrated energy system are jointly participated by multiple parties and the interests of all parties are different, the authors of [18] established a comprehensive energy system planning model that considers investment costs, operating costs, and carbon emission costs, and adopted the NSGA-II algorithm. Taking into account the uncertainty of distributed power sources and loads, the authors of [16] considered the planning of integrated energy systems under the worst influence of distributed power sources and load forecasting error distributions and used two-stage robust chance-constrained programming to solve them.
Furthermore, the emergence of an integrated energy system promotes market-oriented reform of the energy system. The authors of [19] analyzed the short-term regional integrated energy market’s business model and its value to the wholesale market and believed that the regional market could weaken the uncertainty in the wholesale market. The authors of [20] analyzed the business model of the thermo-electric coupling market, analyzed the role of market participants in the market, and gave an equilibrium solution for the market. The authors of [21] analyzed the generalized Nash equilibrium of the electro-thermal coupled market based on the multi-round auction model and designed an augmented Lagrange algorithm to speed up the solution. The authors of [22] analyzed the role of energy hub in the electric-thermal coupling market and gave its market participation strategy based on the Nash equilibrium. However, current research on the multi-energy coupling market is still in its infancy and is mostly based on the thermo-electric coupled market model, with fewer market participants considered, and the integrated energy business model has yet to be developed.
To sum up, the existing integrated energy system planning research mainly focuses on a certain aspect of the integrated energy system, and the discussion on the integrated energy system model is still in its infancy. At present, there is no systematic integrated energy system planning method to solve the problems of integrated energy system planning and capacity optimal allocation.
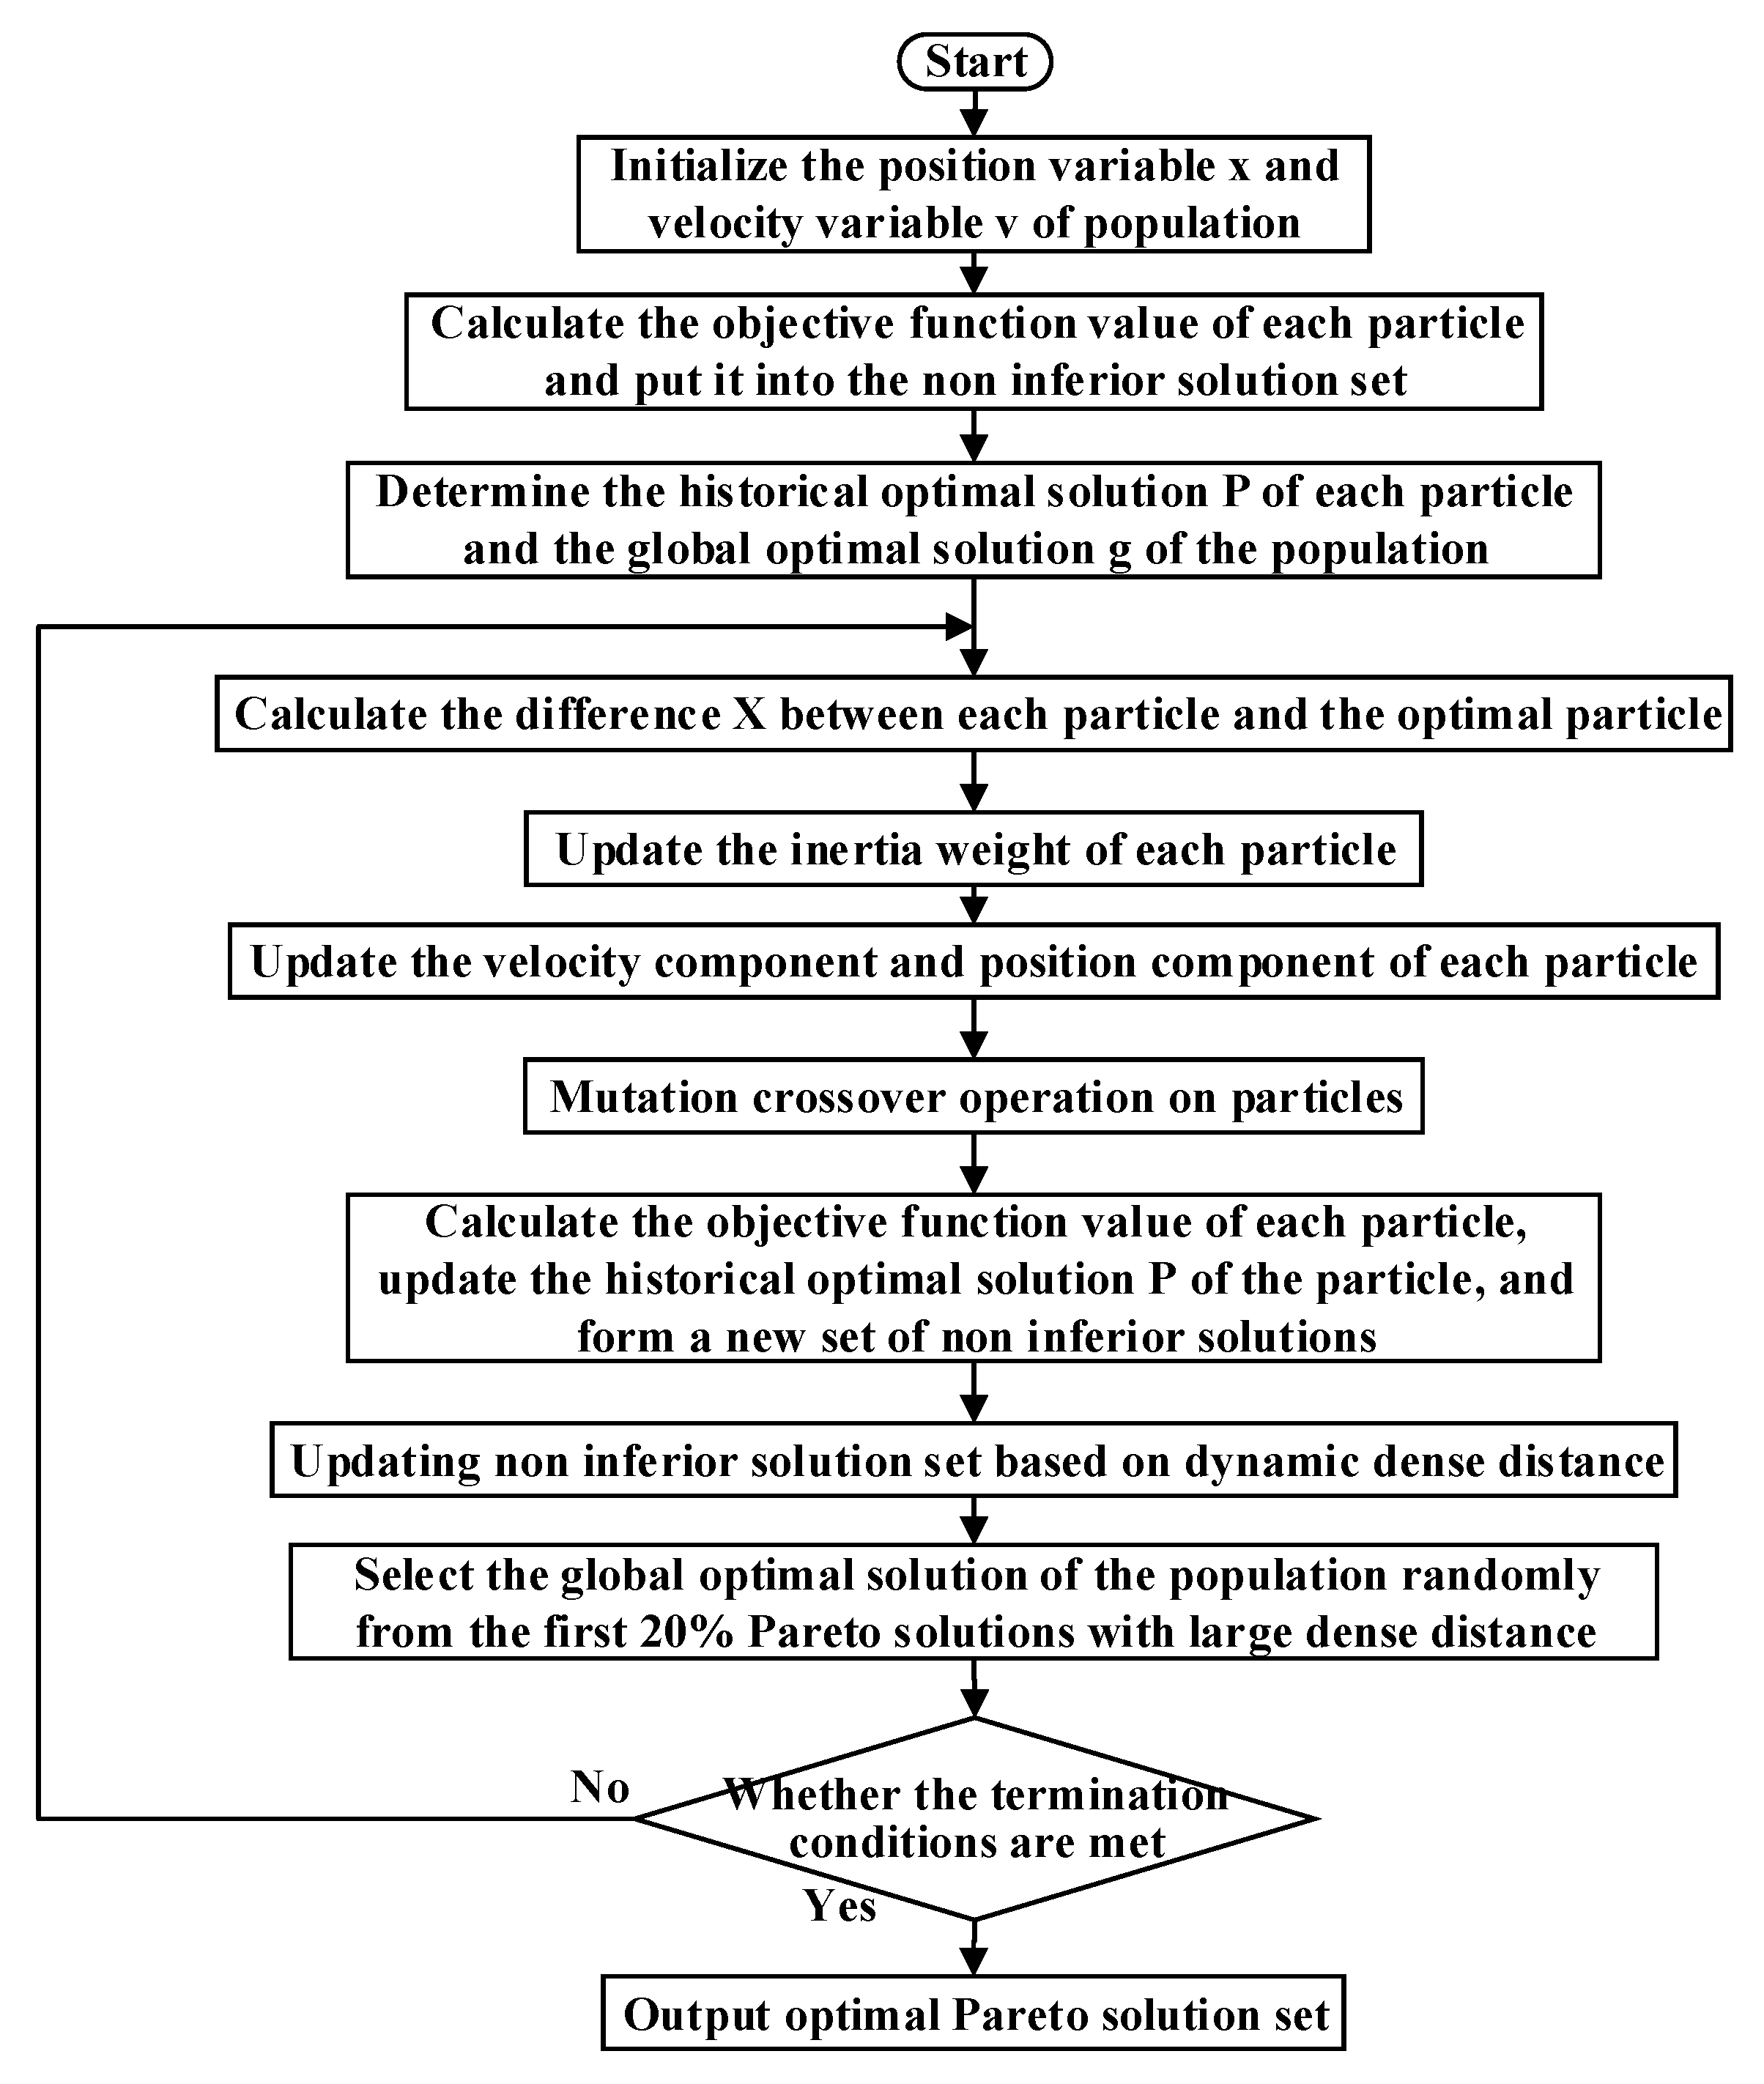
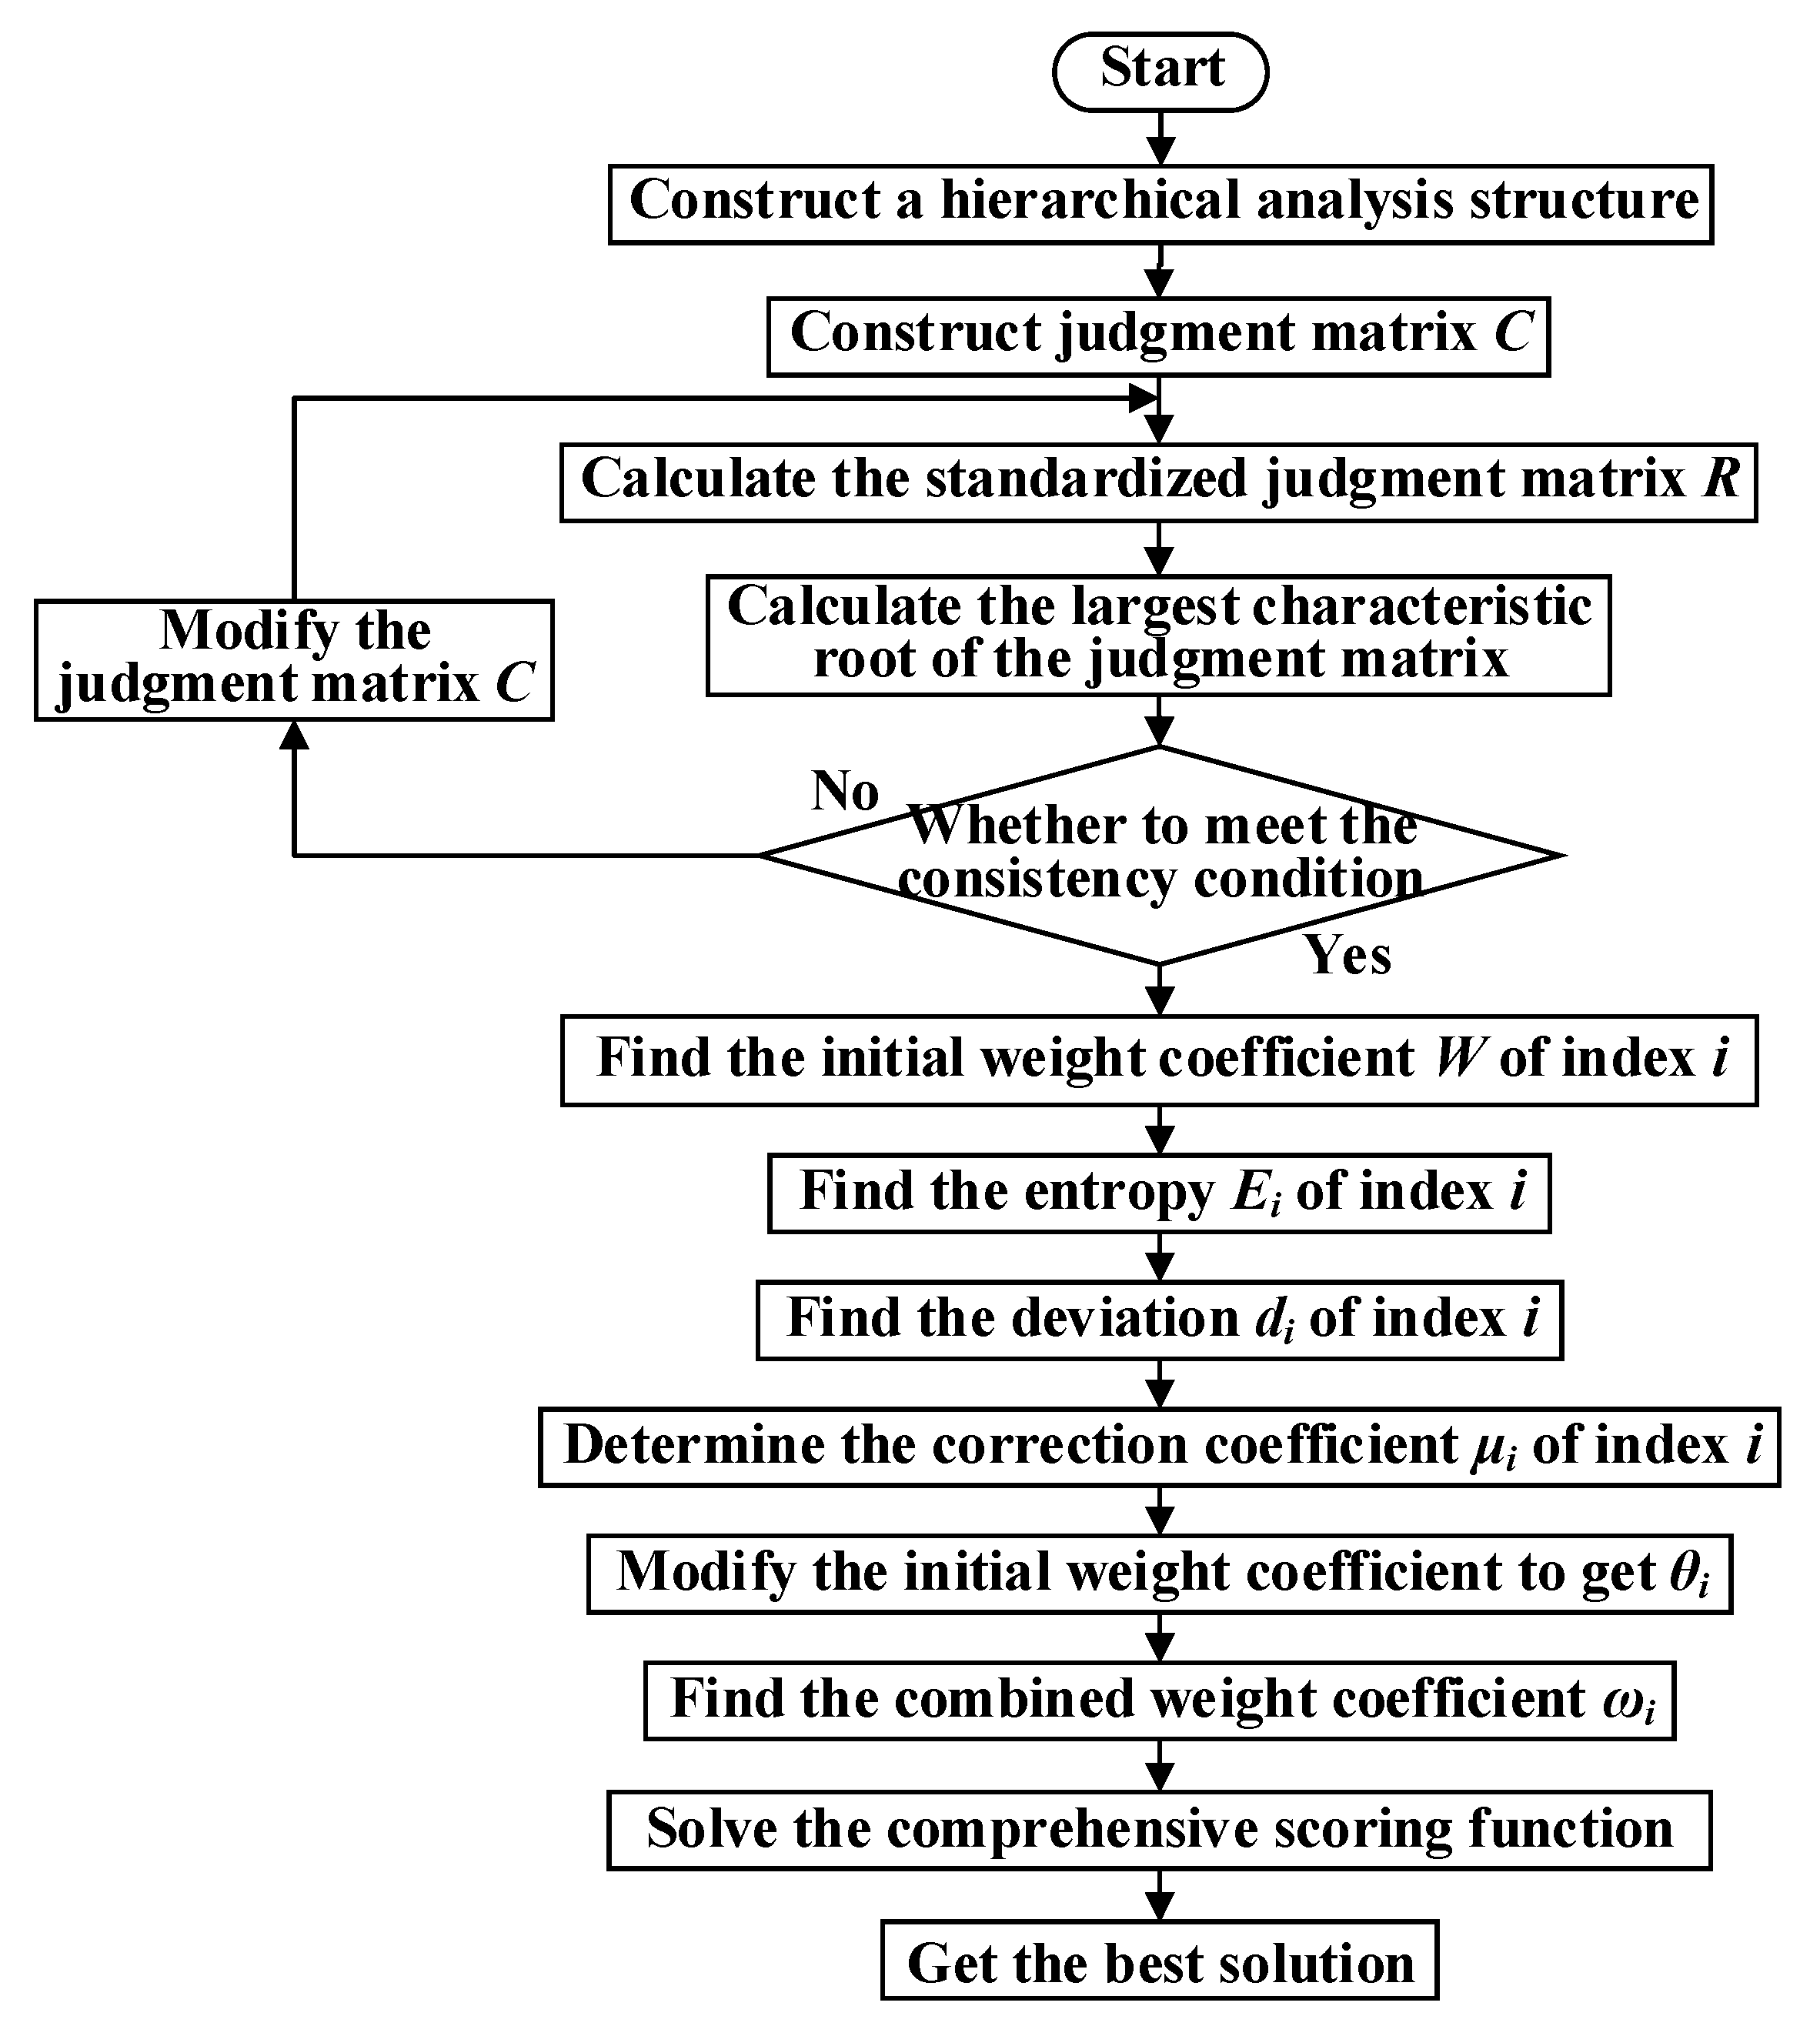
This paper combines actual engineering experience and the latest theoretical research results and proposes a comprehensive energy system planning optimization method based on multiple factors and a three-level process. This paper firstly establishes a comprehensive energy system multi-objective planning model with the annual total cost, annual pollution emissions, and annual primary energy consumption as objective functions; then it uses the improved multi-objective particle swarm algorithm to solve the problem and the Pareto solution set of multi-objective programming model is obtained. The solution set is supported, and preliminary planning schemes are formed according to the solution set. In order to realize the reasonable decision of the comprehensive energy system planning scheme, this paper creatively introduces the comprehensive evaluation into the initial planning stage for the first time, constructs a multi-index comprehensive evaluation system, and uses the combined evaluation method of analytic hierarchy process and entropy weight method to score the preliminary planning scheme comprehensively. The construction and application of the multi-index comprehensive evaluation system creatively consider the influence of economy, technology, environment, and other factors on planning the park’s integrated energy system, which makes the decision-making more comprehensive, intuitive, and reasonable. According to the demand data of an industrial park, a case study of integrated energy system planning is completed to verify the feasibility and effectiveness of the method.

2. Method and Process

This paper proposes a comprehensive energy system planning optimization method based on multiple factors and a three-level process as shown in Figure 1. The process is as follows:
  • Level I: Use the energy hub model to analyze the equipment composition of the integrated energy system, sort out the energy flow relationship, and preliminarily plan each unit’s equipment. Establish a multi-objective function according to the engineering needs, and establish constraint conditions based on the energy flow relationship and equipment performance to form a comprehensive energy system planning optimization model;
  • Level II: Use an improved multi-objective particle swarm algorithm to solve the integrated energy system planning optimization model, obtain a Pareto optimal solution set, and form a preferred planning scheme set according to the optimal solution set;
  • Level III: Establish a comprehensive evaluation index system according to engineering requirements and evaluate and score the optimal planning scheme set by using the analytic hierarchy process-entropy method to obtain the optimal planning scheme.

2.1. Optimization Model for Integrated Energy System Planning

Preliminary planning and energy flow are firstly analyzed for the integrated energy system based on the energy hub model, and an optimization model for integrated energy system planning is established. The optimization model is described in detail as follows:

2.1.1. Objective Function

(a)
Total annual cost
C total = C inv + C ope
where C inv is the cost value of the system’s total investment cost allocated to each year in the operating cycle by equal amounts, which is calculated as follows:
C inv = i = 1 I α i c i P i rated + f i c i P i rated
where I is the total number of equipment; P i rated is the rated capacity of the equipment; c i is the unit investment cost of the equipment; f i is the fixed operation and maintenance cost coefficient of the equipment; α i is the annual equivalent investment conversion coefficient of the equipment and can be calculated as:
α i = m 1 + m N 1 + m N 1
with m as the annual interest rate and N as equipment life.
Operating costs include equipment operation and maintenance costs C om and fuel costs C fuel :
C ope = C om + C fuel = h = 1 H i = 1 I a i P i h + h = 1 H j = 1 J u j h E j h
where H is the total annual operating hours of the equipment; a i is the unit variable operation and maintenance cost of the equipment; P i h is the output value of equipment i in the hth hour; J is the total number of types of input energy; u j h is the price of the j energy in the hth hour; E j h is the consumption of the j energy in the hth hour.
(b)
Annual pollution discharge
Taking air pollutant emissions as an indicator to measure the environmental benefits:
R = h = 1 H j = 1 J μ j pre + μ j int E j t
where μ j pre is the input emission coefficient of the jth energy; μ j int is the internal conversion emission coefficient of the jth energy. The types of pollutants mainly include CO 2 , NO x , etc.
(c)
Annual primary energy consumption
Using annual primary energy consumption as an indicator to measure the energy efficiency:
F = h = 1 H j = 1 J λ j h E j h
where λ j is the standard coal consumption conversion coefficient of the jth energy.

2.1.2. Restrictions

(a)
Equipment configuration capacity constraints
The capacity selection of equipment should consider the influence of factors, such as the number of resources, the size of the installation site, the maximum capacity that can be manufactured by the current technology, and so on, so there are the following constraints:
0 N i N max
P i rated , min P i rated P i rated , max
where N max is the maximum number of equipment that can be installed; P i rated , min and P i rated , max are the minimum and maximum values that can be selected for the rated capacity of the equipment, respectively.
(b)
Operating state constraints
S i t 0 , 1
where S i t is the operating state of equipment I in the tth hour.
(c)
Output power constraints
P i min P i P i max
where P i min and P i max are the minimum and maximum boundary values of the output power of the device, respectively.
(d)
Energy balance constraint
At every moment, the electricity, heat, and cold need to meet the following constraints:
i = 1 I P elec , i out P elec , i in = P elec demand i = 1 I P heat , i out P heat , i in = P heat demand i = 1 I P cold , i out P cold , i in = P cold demand
where P elec , i in , P elec , i out and P elec demand are the equipment’s input electric power, output electric power, and user’s electrical load requirements, respectively; P heat , i in , P heat , i out and P heat demand are the equipment’s input thermal power, output thermal power, and user’s thermal load requirements, respectively; P cold , i in , P cold , i out and P cold demand are the input cold power, output cold power of the equipment and the cooling load demand of the user, respectively.
The planning optimization model built above is then solved based on the improved multi-objective particle swarm algorithm as shown in Figure 2, and the Pareto optimal solution set is obtained, and the optimal planning scheme set is formed according to the optimal solution set. The specific algorithm is displayed in the Level II part of Figure 1.
This paper has made the following improvements to the conventional multi-objective particle swarm algorithm:
  • Use adaptive inertia weight. In this paper, when assigning the inertia weight ω , the difference between the particle and the optimal particle is taken as the reference standard, and the value of the inertia weight is adjusted accordingly according to the change in the size of the difference. To keep the particles with better global search ability, when the gap degree increases, the value of ω should increase; when the gap degree decreases, the value of ω should also decrease. The value curve of ω is shown in Figure 3.
    At time t, the distance X i ( t ) between particle i and the optimal particle of the population can be calculated by the following formula:
    X i ( t ) = 1 x max x min 1 D d = 1 D g d ( t ) x i d ( t )
    ω i ( t ) = ω start ω start ω end X i ( t ) 1 2
    In the formula: D is the dimension of the particle search space; ω i t is the value of ω of particle i at time t; ω start and ω end represent the initial and final values of ω , respectively; x max and x min , respectively represent the upper and lower limits of the particle’s flight position.
  • Crossover mutation. To improve the diversity of the particle population, this paper uses the cross-mutation operation in the genetic algorithm to update the position vector of the particle. The specific operation steps are as follows:
    (a)
    Determine the threshold X min , crossover rate p c , and mutation rate of the difference X.
    (b)
    Judge the degree of difference of particle i, if X i < X min , then cross-mutate particle i; if X i X min , then go to step (e).
    (c)
    Select the random number r in [0, 1] to assign values to the position components of each particle. For the random number r i d of the d-dimensional position component of the i particle, if r i d < p m , initialize the position component. The operation method is shown in Equation (14), if r i d p c , keep the position component unchanged.
    (d)
    After the i particle undergoes a mutation operation, if r i d < p c , the d-dimensional position component of the particle is crossed with the d-dimensional position component of the optimal particle; if r i d p c , the d-dimensional position component is kept unchanged.
    (e)
    The end of cross-mutation, namely:
    x i d = x min + x max x min · r
  • Update maintenance strategy based on dynamic dense distance. When updating and maintaining the non-inferior solution set, this paper uses the dynamic dense distance of the particles as a reference and selects the non-inferior solution set according to the size of the particle’s dense distance, leaving a Pareto solution that meets the requirements. The multi-objective planning model of the park integrated energy system established in this chapter includes three objective functions. If the objective functions are represented by f 1 , f 2 , and f 3 , respectively, the dense distance I x i of particle i can be calculated by the following formula:
    I x i = f 1 x j f 1 x k f 1 max + f 2 x j f 2 x k f 2 max + f 3 x j f 3 x k f 3 max
    where particle j and particle k are the two closest particles to particle i; f n x j represents the value of the n-th objective function of particle j; f n max represents the maximum value of the n-th objective function of all particles.

2.2. Comprehensive Evaluation Index System for Integrated Energy System

A comprehensive evaluation index system for the integrated energy system is established from the three aspects of the economy, technology, and environmental protection, as shown in Table 1.

2.3. Hierarchy Process and Entropy Method

The analytic hierarchy process-entropy method is used to calculate the subjective and objective comprehensive weights of indicators, and comprehensively score each scheme. To show the combined evaluation method used in this article more clearly, we have made a flowchart of the method shown in Figure 4. It can be seen from the figure that the combined evaluation method is based on the combination of analytic hierarchy process and entropy method. First, the analytic hierarchy process is used to calculate the subjective weight of the indicator, and then, the entropy weight method is used to calculate the objective weight of the indicator. Finally, the entropy weight method is used to modify the analytic hierarchy process to obtain the combined weight coefficient. The entropy weight method is used to modify the analytic hierarchy process to obtain the combined weight coefficient. This method mainly starts from the actual project, realizes the on-site project requirements with the analytic hierarchy process, and uses the entropy weight method to modify it, so as to avoid the index weight being too subjective. In the next study, we consider introducing intelligent algorithms into the calculation of indicator weights to improve the comprehensive performance of indicator weights.

2.3.1. Chromatographic Analysis Method to Determine the Index Weight

(a)
Construct a hierarchy analysis structure
The hierarchy analysis structure is generally divided into target level, criterion level, and program level. The goal level represents the purpose of solving the problem, that is, the goal to be achieved by applying the analytic hierarchy process; the criterion level represents the intermediate links involved in achieving the predetermined goal; the solution level represents the specific solution to the problem.
(b)
Construct a judgment matrix
Use the 1–9 scale method shown in Table 2 to judge the relative importance of each factor, and then establish a judgment matrix C of two or two indicators belonging to the same target layer according to expert opinions. Based on the above-mentioned judgment principles and criteria, for the existing n elements, the judgment matrix C = C i j n × n can be obtained:
C = C i j n × n = C 11 C 12 C 1 n C 21 C 22 C 1 n C n 1 C n 2 C n n
where C i j represents the important value of factor i and factor j relative to the target value.
(c)
Calculate the standardized judgment matrix R
Standardize the judgment matrix C to obtain the standardized judgment matrix R :
r i j = C i j / i = 1 n C i j
R = r i j n × n = r 11 r 12 r 1 n r 21 r 22 r 1 n r n 1 r n 2 r n n
(d)
Consistency test of judgment matrix
The judgment matrix constructed is not necessarily consistent due to the error of the evaluator or the lack of relevant knowledge. Therefore, in the evaluation process, it is necessary to check the consistency of the constructed judgment matrix. The consistency of judgment matrix is tested by the change of eigenvalue of judgment matrix.
First, calculate the largest characteristic root of the judgment matrix:
C i j W = λ max W
where λ max is the largest feature root of C i j ; W is the normalized feature vector corresponding to λ max .
Then, find the consistency index C I of the judgment matrix:
C I = λ max n n 1
The smaller the value of C I , the better the consistency of the judgment matrix; and vice versa.
The random consistency ratio is used to judge whether the judgment matrix has satisfactory consistency. The random consistency ratio C R is the ratio of the consistency index C I of the judgment matrix to the average random consistency index R I , as shown in Equation (21), and the value of R I is shown in Table 3. The first-order and second-order judgment matrices must have complete consistency. There is no need to calculate C R .
C R = C I R I < 0.10
When the calculated C R satisfies Equation (21), it can be determined that the constructed judgment matrix has a satisfactory one-off. If the calculated C R does not satisfy Equation (21), the judgment matrix constructed before needs to be adjusted until the requirement can be met.
(e)
Find the initial weight coefficient W i of index i
Based on the consistency of the judgment matrix, the sum of the vectors in each row of the matrix is averaged and then normalized to be the initial weight coefficient W i of the index i. The calculation formula is as follows:
W i = W i ¯ / i = 1 n W i ¯
where W i ¯ = M i n and M i is the product of the elements in the ith row of the judgment matrix.

2.3.2. Entropy Method to Determine the Index Weight

(a)
Find the entropy value E i of index i
E i = j = 1 n r i j ln r i j / ln n
(b)
Find the deviation d i of index i
d i = 1 E i
(c)
Determine the correction factor μ i of the index
μ i = d i / i = 1 n d i
(d)
Use each index correction coefficient μ i to correct the initial weight coefficient W i obtained by the analytic hierarchy process, and obtain the weight coefficient θ i after the entropy weight method:
θ i = μ i W i / i = 1 n μ i W i

2.3.3. Combination of Subjective and Objective Weights

The initial weight coefficient W i obtained by the analytic hierarchy process and the weight coefficient θ i modified by the entropy weight method are combined and calculated as follows to obtain the combined weight coefficient ω i based on the combination of the analytic hierarchy process and the entropy weight method:
ω i = ρ W i + 1 ρ θ i
where ρ is usually 0.5.

2.3.4. Solve the Scoring Function

The m system planning schemes participating in the evaluation are denoted as Y = y 1 , y 2 , , y m ; there are n evaluation indicators, denoted as X = x 1 , x 2 , , x n ; the j-th index value corresponding to the scheme y i can be represented by a i j , and the m × n evaluation indexes of m system schemes can be obtained the index matrix A = a i j m × n , namely:
A = a 11 a 12 a 1 n a 21 a 22 a 2 n a m 1 a m 2 a m n
For the index with the larger index value, the better index, use the following formula for standardization:
b i j = x i min x i max x i min x i
For the index with the smaller index value, the better index, use the following formula for standardization:
b i j = max x i x i max x i min x i
After standardization, the evaluation index 0 b i j 1 , that is, the index matrix A is normalized to matrix B = b i j m × n . Multiply the index normalized matrix B by the integrated weight matrix D to obtain the normalized weighted decision matrix Z .
Z = B D = b 11 b 12 b 1 n b 21 b 22 b 2 n b m 1 b m 2 b m n ϕ 2 ϕ 2 ϕ n = e 1 e 2 e m
The comprehensive scoring function of scheme y i can be denoted as F Z , y i = e i . When the comprehensive evaluation function achieves the maximum value, it means that the evaluation score of the scheme is the highest, and it is the preferred scheme.

3. Case Study

Based on the proposed multi-element three-level integrated energy system planning optimization method and specific steps, a regional multi-energy supply system multi-objective planning and design is studied for an industrial park in Jiangsu Province, China.

3.1. Basic Data and Preliminary Planning Analysis

3.1.1. Park Overview

The load demand of the industrial park is mainly electric load, heat load, and cooling load; the energy supply mode of the park is mainly solar energy, external grid electricity, and pipeline natural gas. In terms of energy equipment selection and installation, the environmental conditions of the park can meet the needs of installing photovoltaic and solar thermal boilers with a certain capacity; central cooling and heating of the park can be realized by installing absorption refrigeration devices, electric refrigeration devices or electric heating devices; it is allowed to install a certain capacity of electricity storage, heat storage, and cold storage devices to improve the flexibility and reliability of the energy supply of the park’s integrated energy system. Therefore, the basic energy flow structure of the integrated energy system of the industrial park is shown in Figure 5.

3.1.2. Load Curve

The annual electricity, heating, and cooling load demand and solar radiation density of the industrial park can be described by four typical day scenarios, namely spring (March, April, May), summer (June, July, August), autumn (September, October, November) and winter (December, January, and February). The park’s annual electricity, heating, cooling load, and solar radiation density curves are shown in Figure 6.

3.1.3. Energy Data

The price of energy is shown in Table 4. The power purchase price of the grid adopts the time-of-use price. Peak hours are 8:00∼12:00, 17:00∼21:00, normal hours are 12:00∼17:00, 21: 00∼24:00, and valley hours are 0:00∼8:00. The electricity price of each time is different while the natural gas price remains unchanged. Table 5 shows the pollution emission coefficients of energy and the equivalent conversion coefficients to standard coal.

3.1.4. Economic and Technical Parameters of the Equipment

The equipment considered in the planning and its economic and technical parameters are shown in Table 6, including data, such as its operating efficiency, investment cost, maintenance cost, service life, etc.

3.2. Optimal Planning Scheme Set

The Pareto frontier solution obtained by the improved multi-objective particle swarm algorithm is shown in Figure 7. It can be seen that the total annual cost of the park’s integrated energy system planning and the annual pollution emissions are mutually restricted. When the total annual cost of the program is lower, the pollution emissions are higher. This paper selects five planning schemes from the Pareto frontier solution in Figure 7 to form a set of optimal planning schemes. Table 7 and Table 8 list the system configuration and calculation values corresponding to these five schemes, respectively.
According to Table 8, the annual total cost of scheme S1, scheme S2, scheme S3, scheme S4 and scheme S5 gradually increases, the annual pollution emission gradually decreases, and the annual primary energy consumption changes within a certain range. When scheme S1 is selected, the economic benefit of the system is good, but its environmental protection is poor; similarly, when scheme S5 is selected, the environmental protection of the scheme is better, but the economy is not high. Therefore, it is necessary to adopt an effective decision-making method to select the most suitable system configuration plan from a set of optimal plans.

3.3. Comprehensive Weight of Index System

First, the combined weight of each indicator is obtained, and then the weight of each secondary indicator multiply the combined weight of the corresponding primary indicator to obtain the comprehensive weight of each secondary indicator. The results are shown in Table 9. The sum of the comprehensive weights of all secondary indicators is equal to 1.

3.4. Comprehensive Scoring Function

Combining the data in Table 7 and Table 8, the indicators of the five planning schemes are scored, and the results are shown in Table 10.
According to the scores of each indicator in Table 10, a standardized matrix of indicators B is formed and it is displayed in Equation (32).
B = 1.0000 1.0000 0.3333 0.4718 0.3585 0.2733 0.0000 0.0000 0.9167 0.7619 0.8333 1.0000 1.0000 1.0000 0.4483 0.6905 0.5833 0.5476 0.3333 0.0000 0.4214 0.1279 0.5747 0.5952 0.0000 0.3095 0.0000 0.2042 0.0000 0.6802 0.8966 0.9048 0.1667 0.0000 1.0000 0.3662 0.7987 0.0000 1.0000 1.0000
Multiplying the index normalized matrix B by the comprehensive weight matrix D results into the normalized weighted decision matrix Z as:
Z = B D = 0.7284 0.8498 0.4598 0.1785 0.3574 T
For the integrated energy system of the park, the comprehensive scores of five planning schemes are shown in Figure 8. It can be seen that scheme 2 has the highest comprehensive score, which is the optimal planning solution.
It can be seen from the research results and the configuration of Option 2: (a) The use of photovoltaic and internal combustion engine power generation to meet the basic needs of power supply, and the use of a small number of batteries to cut peaks and fill valleys can further improve energy efficiency; (b) considering the economy and environmental protection, gas boilers are is not applicable; the use of solar thermal boilers and electric boilers to meet the basic heating needs, and the use of waste heat boilers and thermal storage tanks for auxiliary heating are also conducive to further energy saving; (c) the use of electric refrigerators and absorption chillers to meet cooling demand, and use cold storage tanks for adjustment, can also improve energy efficiency.
The above research results show that: (a) By applying the multi-element and three-level integrated energy system planning optimization method and specific steps proposed in this paper, it is feasible to complete an integrated energy system planning case analysis based on the demand data of an industrial park. (b) After comparing with the main conclusions of existing research in the introduction of this article, it is proved that the above research results of this article are also valid. (c) Compared with existing research, the research advantage of this article is that the planning and optimization of the integrated energy system are divided into three layers, and comprehensive consideration is given to it. The influence of factors not only comprehensively optimizes the economy, technology, and environmental protection of the integrated energy system through multi-objective functions, but also creatively introduces comprehensive evaluation into the initial planning stage for the first time and integrates more specific technologies through the establishment of a comprehensive evaluation index system. Requirements, environmental indicators, etc. are introduced into the planning process to make the planning plan more specific and reliable.

4. Conclusions

In order to solve the problem of optimal capacity allocation in the field of integrated energy system planning, this paper combines actual engineering experience and the latest theoretical research results, and proposes for the first time an integrated energy system planning optimization method based on multi-factor and three-level: Firstly, based on the energy hub model, preliminary planning and an energy flow analysis are performed, and a comprehensive energy system planning optimization model is established; the planning optimization model is then solved by the multi-objective particle swarm algorithm to obtain the Pareto optimal solution set and the optimal planning scheme set is formed; finally, it creatively introduces comprehensive evaluation into the initial stage of plan for the first time, and establishes the comprehensive evaluation index system according to project requirements. A comprehensive evaluation index system is established into the initial planning stage according to the needs of the project, and the optimal planning scheme set is evaluated and scored by the analytic hierarchy process-entropy weight method to obtain the optimal planning plan.
This method divides the planning and optimization of the integrated energy system into three layers, considering the influence of multiple factors. It not only uses multi-objective functions to comprehensively optimize the economy, technology, and environmental protection of the integrated energy system, but also creatively establishes a comprehensive evaluation index system that introduces more specific technical requirements and environmental indicators into the planning process, so as to make the planning plan more specific and reliable. Based on the demand data of an industrial park, this paper completes a case analysis of integrated energy system planning and verifies the feasibility and effectiveness of the method. The integrated energy system planning optimization model and comprehensive evaluation index system in this method can also be deleted and added according to the needs of different engineering designs, which are flexible, reliable, and easy to popularize.
Applying the multi-factor and three-level integrated energy system planning optimization method and specific steps proposed in this paper, the past independent planning mode of electricity, gas, heat, and cold energy has been transferred to multiple forms of energy joint planning. This method can help guide the planning and construction of the integrated energy system, promote the energy transition, and make a positive contribution to the early realization of carbon neutrality in the world.
This article mainly considers the development of energy transition in a certain region from the perspective of improving the efficiency of comprehensive energy utilization. In order to better serve the decision-making and application of regional energy transformation and development, we will consider the collaborative participation of more social sectors (such as the government, environmental protection, financial institutions, etc.). For example, the optimization and adjustment of the energy structure are inseparable from financial support. Capital is a booster for the upgrading and development of the energy industry; It can play the leverage role of green finance, control the development of coal, steel, cement and other “three high” industries, so as to promote the production and consumption of alternative energy; We can formulate corresponding policies, such as green credit, bonds, securities, insurance, etc; It can encourage energy-saving production, improve efficiency and energy-saving technologies, For example, it can guide the capital market and derivative financial products market to support clean energy such as natural gas and renewable energy such as solar energy and wind energy. The above measures can build a green financial system and promote the transformation and upgrading of energy structure.

Author Contributions

K.Q. developed the concept, conceived the experiments, designed the study, and wrote the original manuscript. T.L., Y.Y. and K.Q. reviewed and edited the manuscript. All authors have read and agreed to the published version of the manuscript.

Funding

This work is supported by the National Key Research and Development Program of China (Grant 2016YFB0900100).

Institutional Review Board Statement

Not applicable.

Informed Consent Statement

Not applicable.

Data Availability Statement

Not applicable.

Acknowledgments

This work is supported by the research project “integrated energy system planning and business model research” of China energy construction group planning and Design Co., Ltd. (GSKJ2-X03-2021). At the same time, this paper is also a part of the project “grid planning method of integrated energy system” of China Energy Construction Group Jiangsu Electric Power Design Institute Co., Ltd. (32-JK-2021-009).

Conflicts of Interest

The authors declare no conflict of interest.

References

  1. Dialga, I. Evaluating normandy’s sustainable development and energy transition policies. J. Clean. Prod. 2021, 305, 127096. [Google Scholar] [CrossRef]
  2. Falcone, P.M. Analysing stakeholders’ perspectives towards a socio-technical change: The energy transition journey in gela municipality. AIMS Energy 2018, 6, 645–657. [Google Scholar] [CrossRef]
  3. Falcone, P.M.; Lopolito, A.; Sica, E. Instrument mix for energy transition: A method for policy formulation. Technol. Forecast. Soc. Chang. 2019, 148, 119706. [Google Scholar] [CrossRef]
  4. Höfer, T.; Madlener, R. A participatory stakeholder process for evaluating sustainable energy transition scenarios. Energy Policy 2020, 139, 111277. [Google Scholar] [CrossRef] [Green Version]
  5. Chen, H.; Hu, X.; Wang, L. Summary of research on regional integrated energy system planning. Autom. Electr. Power Syst. 2019, 43, 2–12. [Google Scholar]
  6. Conejo, A.J.; Chen, S.; Constante, G.E. Operations and long-term expansion planning of natural-gas and power systems: A market perspective. Proc. IEEE 2020, 108, 1541–1557. [Google Scholar] [CrossRef]
  7. Oh, S.; Lee, H.; Jung, J.; Kwak, H. Optimal planning and economic evaluation of cogeneration system. Energy 2007, 32, 760–771. [Google Scholar] [CrossRef]
  8. Sheikhi, A.; Ranjbar, A.; Oraee, H. Financial analysis and optimal size and operation for a multicarrier energy system. Energy Build. 2012, 48, 71–78. [Google Scholar] [CrossRef]
  9. Pazouki, S.; Mohsenzadeh, A.; Ardalan, S.; Haghifam, M.-R. Optimal place, size, and operation of combined heat and power in multi carrier energy networks considering network reliability, power loss, and voltage profile. IET Gener. Transm. Distrib. 2016, 10, 1615–1621. [Google Scholar] [CrossRef]
  10. Zhang, X.; Shahidehpour, M.; Alabdulwahab, A.; Abusorrah, A. Optimal expansion planning of energy hub with multiple energy infrastructures. IEEE Trans. Smart Grid 2015, 6, 2302–2311. [Google Scholar] [CrossRef]
  11. Salimi, M.; Ghasemi, H.; Adelpour, M.; Vaez-ZAdeh, S. Optimal planning of energy hubs in interconnected energy systems: A case study for natural gas and electricity. IET Gener. Transm. Distrib. 2015, 9, 695–707. [Google Scholar] [CrossRef] [Green Version]
  12. Chaudry, M.; Jenkins, N.; Qadrdan, M.; Wu, J. Combined gas and electricity network expansion planning. Appl. Energy 2014, 113, 1171–1187. [Google Scholar] [CrossRef]
  13. Shao, C.; Wang, X.; Shahidehpour, M.; Wang, X.; Wang, B. An milp-based optimal power flow in multicarrier energy systems. IEEE Trans. Sustain. Energy 2016, 8, 239–248. [Google Scholar] [CrossRef]
  14. Wang, Y.; Zhang, N.; Zhuo, Z.; Kang, C.; Kirschen, D. Mixed-integer linear programming-based optimal configuration planning for energy hub: Starting from scratch. Appl. Energy 2018, 210, 1141–1150. [Google Scholar] [CrossRef]
  15. Mu, Y.; Chen, W.; Yu, X.; Jia, H.; Hou, K.; Wang, C.; Meng, X. A double-layer planning method for integrated community energy systems with varying energy conversion efficiencies. Appl. Energy 2020, 279, 115700. [Google Scholar] [CrossRef]
  16. Azimian, M.; Amir, V.; Javadi, S. Economic and environmental policy analysis for emission-neutral multi-carrier microgrid deployment. Appl. Energy 2020, 277, 115609. [Google Scholar] [CrossRef]
  17. Huang, W.; Zhang, N.; Yang, J.; Wang, Y.; Kang, C. Optimal configuration planning of multi-energy systems considering distributed renewable energy. IEEE Trans. Smart Grid 2017, 10, 1452–1464. [Google Scholar] [CrossRef]
  18. Hu, Y.; Bie, Z.; Ding, T.; Lin, Y. An nsga-ii based multi-objective optimization for combined gas and electricity network expansion planning. Appl. Energy 2016, 167, 280–293. [Google Scholar] [CrossRef] [Green Version]
  19. Lezama, F.; Soares, J.; Hernandez-Leal, P.; Kaisers, M.; Pinto, T.; Vale, Z. Local energy markets: Paving the path toward fully transactive energy systems. IEEE Trans. Power Syst. 2018, 34, 4081–4088. [Google Scholar] [CrossRef] [Green Version]
  20. Chen, Y.; Wei, W.; Liu, F.; Sauma, E.E.; Mei, S. Energy trading and market equilibrium in integrated heat-power distribution systems. IEEE Trans. Smart Grid 2018, 10, 4080–4094. [Google Scholar] [CrossRef]
  21. Wu, C.; Gu, W.; Bo, R.; MehdipourPicha, H.; Jiang, P.; Wu, Z.; Lu, S.; Yao, S. Energy trading and generalized nash equilibrium in combined heat and power market. IEEE Trans. Power Syst. 2020, 35, 3378–3387. [Google Scholar] [CrossRef]
  22. Li, R.; Wei, W.; Mei, S.; Hu, Q.; Wu, Q. Participation of an energy hub in electricity and heat distribution markets: An mpec approach. IEEE Trans. Smart Grid 2018, 10, 3641–3653. [Google Scholar] [CrossRef]
Figure 1. Flow chart of multi-element three-planning of integrated energy system.
Sustainability 13 07425 g001
Figure 2. Flow chart of the improved multi-objective particle swarm algorithm.
Sustainability 13 07425 g002
Figure 3. Inertia weight.
Sustainability 13 07425 g003
Figure 4. Flowchart of the evaluation method.
Sustainability 13 07425 g004
Figure 5. Energy flow structure diagram of the park’s integrated energy system.
Sustainability 13 07425 g005
Figure 6. The load curve and solar radiation density curve of the park. (a) Typical day in spring. (b) Typical day in summer. (c) Typical day in autumn. (d) Typical day in winter.
Sustainability 13 07425 g006
Figure 7. Pareto frontier solution.
Sustainability 13 07425 g007
Figure 8. Comprehensive score values of the planning schemes.
Sustainability 13 07425 g008
Table 1. Comprehensive evaluation index system of integrated energy system.
Serial NumberFirst-Level IndexSerial NumberSecondary Indicators
C1EconomyC11Initial investment cost
C12Annual operating cost
C2TechnicalC21Primary energy consumption
C22Reliability rate of energy supply
C23Comprehensive energy efficiency
C24Equipment utilization
C3EnvironmentalC31Annual CO 2 emissions
protectionC32Annual NO x emissions
Table 2. Scale of judgment matrix.
Serial NumberImportance LevelCij AssignmentSerial NumberImportance LevelCij Assignment
1i is equally important than j110i is less important than j, between 1 and 1/31/2
2The importance of i to j is between 1 and 3211i is slightly less important than j1/3
3i is slightly more important than j312i is less important than j, between 1/3 and 1/51/4
4The importance of i to j is between 3 and 5413i is obviously less important than j1/5
5i is obviously more important than j514i is less important than j, between 1/5 and 1/71/6
6The importance of i to j is between 5 and 7615i is strongly less important than j1/7
7i is strongly more important than j716i is less important than j, between 1/7 and 1/91/8
8The importance of i to j is between 7 and 8817i is extremely less important than j1/9
9i is extremely important than j9
Table 3. Average random consistency indicator.
Matrix Order3456789
R I 0.580.901.121.241.321.411.45
Table 4. The price of energy.
Energy CategoryUnitPeak TimeNormal TimeValley Time
ElectricityYuan/kW·h1.09020.65410.315
Natural gas(GB)Yuan/kW·h0.3180.3180.318
Table 5. Emission factors and conversion factors of energy.
Energy CategoryPollution Emission Factor kg/ kW·hStandard Coal Conversion Coefficient kg/ kW·h
Electricity0.9560.320
Natural gas(GT, GE)0.1840.121
Natural gas(GB)0.2260.119
Table 6. The economic and technical parameters of equipment.
EquipmentOperating EfficiencyUnit Investment Cost (Yuan/kW)Fixed Maintenance Cost CoefficientVariable Maintenance Costs (Yuan/kW·h)Life (Year)
Photovoltaic-70000.020.03820
Light heat boiler0.6014500.010.02620
Internal combustion engineElectricity 0.36 Heat 0.4845000.010.05930
Gas turbineElectricity 0.28 Heat 0.5475000.010.05930
Gas boiler0.858000.040.02620
Waste heat boiler0.851400.040.01320
Electric refrigerator3.506000.030.01320
Absorption chiller1.028500.030.01320
Electric boiler0.9011000.040.01320
Accumulator0.926000.010.01310
Heat storage box0.951200.010.02620
Cold storage box0.951200.010.02620
Table 7. A set of multi-objective optimization planning schemes for the park’s integrated energy system.
ProgramPhotovoltaic /MWLight Heat Boiler/MWInternal Combustion Engine/MWGas Boiler /MWWaste Heat Boiler/MWElectric Boiler/MWElectric Refrigerator /MWAbsorption Chiller/MWAccumulator /MW·hThermal Storage Tank/MW·hCold Storage Tank/MW·h
S17.612.210.54.213.45.715.317.22.24.54.5
S27.812.712.8011.68.314.616.51.63.63.6
S37.313.913.3014.28.56.824.70.98.28.2
S47.114.513.7014.88.45.924.2010.810.8
S57.214.114.3014.35.85.624.1010.110.1
Table 8. The calculated value of the multi-objective planning scheme of the park’s integrated energy system.
ProgramTotal Annual Cost/107 YuanAnnual Pollution Discharge/107 YuanAnnual Primary Energy Consumption/107 YuanAnnual Electricity Purchase Cost /107 YuanAnnual Gas Purchase Cost/107 Yuan
Sl10.305.422.792.281.78
S210.415.032.851.841.82
S310.544.922.811.361.94
S410.714.642.831.152.02
S510.824.552.770.732.09
Table 9. The weight coefficient of each index in the comprehensive evaluation system.
Serial NumberFirst Level IndicatorCombination Weight  ω Serial NumberSecondary IndicatorsCombination Weight ω Comprehensive Weight Φ
C1Economy0.6122C11Initial investment cost0.66670.4081
C12Annual operating cost0.33330.2041
C2technical0.2987C21Primary energy consumption0.44350.1325
C22Reliability rate of energy supply0.40600.1213
C23Comprehensive energy efficiency0.09840.0294
C24Equipment utilization0.05210.0156
C3Environmental protection0.0891C31Annual CO 2 emissions0.83330.0742
C32Annual NO x emissions0.16670.0148
Table 10. Index scores.
ProgramInitial Investment Cost/107 YuanAnnual Operating Cost/107 YuanPrimary Energy Consumption/107 YuanReliability Rate of Energy SupplyComprehensive Energy EfficiencyEquipment UtilizationAnnual CO 2 Emissions/107 YuanAnnual NO x Emissions/105 kg
Sl1.918.392.7997.98%91.75%91.82%5.421.07
S21.928.492.8597.73%92.39%90.27%5.030.78
S31.968.582.8196.31%91.43%89.87%4.920.82
S42.038.682.8396.60%90.79%90.52%4.640.69
S52.018.812.7796.83%92.06%89.65%4.550.65
Publisher’s Note: MDPI stays neutral with regard to jurisdictional claims in published maps and institutional affiliations.

