Article

Does Car-Sharing Reduce Car Ownership? Empirical Evidence from Germany

Weizenbaum-Institut, Technische Universität Berlin, 10623 Berlin, Germany
Sustainability 2021, 13(13), 7384; https://doi.org/10.3390/su13137384
Submission received: 31 May 2021 / Revised: 27 June 2021 / Accepted: 28 June 2021 / Published: 1 July 2021
(This article belongs to the Special Issue Shared Mobility)

Abstract

:
The sharing economy is making its way into our everyday lives. One of its business models, car-sharing, has become highly popular. Can it help us increase our sustainability? Besides emissions and vehicle miles traveled, one key aspect in the assessment regards the effect of car-sharing on car ownership. Previous studies investigating this effect have relied almost exclusively on surveys and come to very heterogeneous results, partly suggesting spectacular substitution rates between shared and private cars. This study empirically explores the impact of car-sharing on noncorporate car ownership and car markets in 35 large German cities. The analysis draws on publicly available data for the years 2012, 2013, 2015, and 2017, including, among others, the number of shared cars per operating mode (free-floating and station-based) and the number of cars owned and registered by private individuals (i.e., excluding company cars). We find that one additional station-based car is associated with a reduction of about nine private cars. We do not find a statistically significant relation between car ownership and free-floating car-sharing. Neither type of car-sharing appears to impact the markets for used and new cars significantly. Given the measurable impacts on car ownership levels, this result is surprising and invites future research to study car-sharing’s impact on the dynamics of car markets.

1. Introduction

The sharing economy is considered a trend that fundamentally disrupts consumer habits, the organization of value chains, and economic activities. Through sharing instead of owning, the sharing economy promises temporary and flexible access to often expensive resources. Car-sharing has been available as a mobility service in many cities worldwide for quite some time [1]. Some of its users see it as an alternative to owning a car [2]. From a societal perspective, shared use of cars can reduce the number of vehicles required to serve mobility demand. This can reduce (external) costs associated with production and relieve notoriously scarce parking capacities. In order to assess these benefits, the decisive question is whether car-sharing represents a substitute for private car ownership.
Many survey-based studies show that car-sharing can substantially reduce car ownership among members [3,4,5,6,7]. However, as car-sharing has long been a niche phenomenon, the environmental and economic implications have been marginal. Furthermore, findings among early adopters might not always be generalizable to mass markets, and surveys can be prone to different biases. Now, in some parts of the world, including Germany, car-sharing has experienced considerable growth. With more than 2.5 million, the number of registered users in Germany has increased more than 15-fold in the past ten years (multiple registrations possible), and the number of shared cars has increased more than five-fold (see Section 2.2). Therefore, potential effects must be measured not only in surveys but also empirically. This work revisits the body of interview-based studies and, for the first time, tests the estimated substitution rates from these studies empirically. Instead of using self-reports of the users, we assess the impact by observing city-level changes in car-sharing, linking these to ownership rates and registrations of used and new cars. With this approach, we focus on the gap between survey-based car-sharing studies and studies empirically researching the impact of the sharing economy on incumbent industries [8].
Using panel data from Germany and a first-difference estimator, we investigate the relation between car ownership, car registrations, and car-sharing for 35 large German cities. The analysis draws on publicly available data for 2012, 2013, 2015, and 2017 and includes the number of shared cars per operating mode and different controls. This study focuses on shared cars that are either operated in a free-floating or station-based mode, which covers the vast majority of shared cars in Germany.
We confirm previous findings to the extent that station-based car-sharing correlates with a reduction in private car ownership (i.e., the stock of noncorporate cars). The effect roughly corresponds to a replacement of nine private cars by one station-based shared car. In contrast, we do not find a significant relation between car ownership and free-floating car-sharing. Furthermore, neither type of car-sharing appears to have a significant and reliable impact on the markets for used and new cars (i.e., the flow of privately purchased cars). Given the measurable impacts on car ownership levels, this result is surprising and invites future research to study car-sharing’s impact on the dynamics of car markets.
This paper is organized as follows. In Section 2, we introduce related research streams and the development of car-sharing in Germany. Section 3 then introduces the materials and method. Section 4 presents the results. We discuss and conclude our findings, implications, limitations, and potential future research in Section 5.

2. Literature

This paper intends to integrate two literature streams: the impact of car-sharing and substitutions between traditional markets and sharing platforms. The latter shares a similar methodological approach and will be discussed in the following subsection. In the second subsection, we will first give a short overview of car-sharing in Germany. Third, we give an overview of the mainly survey-based research on station-based car-sharing. Ultimately, in the fourth subsection, focusing on their impacts, we highlight differences between station-based and free-floating car-sharing.

2.1. The Sharing Economy and Its Impacts

Airbnb is probably the most prominent example of the sharing economy and has served as a “Guinea pig” for several empirical impact studies [9]. As such, Zervas et al. [8] provided one of the first empirical studies to quantify the impact of the Sharing Economy on an incumbent industry. Using a fixed-effects model, they find that a 1% increase in Airbnb listings is related to a 0.05% decrease in quarterly hotel revenues in Texas, U.S. This substitutive relation is most substantial among low-end hotels (economy, budget), while higher-priced hotels are almost unaffected.
In a methodologically comparable manner, Barron et al. [10] provide strong empirical evidence that Airbnb increases house prices and rents. They conclude that Airbnb listings cause replacements of long-term rentals with short-term accommodation. Methodologically, Barron et al. use a fixed-effects model with an instrument variable. The collected data from 2012 to 2016 includes monthly zip code-level data on Airbnb listings, house prices and rents, and several controls. Other literature on shared housing quantifies the relation between shared lodging and crime [11] and between Airbnb offerings and hotel pricing in Italy [12].
Airbnb is not the only example of the sharing economy whose impact has been studied empirically. Some studies examine ride-hailing services, such as Uber’s effect on the number of business start-ups [13] and its effect on traffic congestion [14]. These studies typically interpret the entry of Uber into a city as a form of treatment and combine this information with publicly available data, for example, by scraping information on the number of funding campaigns or traffic congestion.

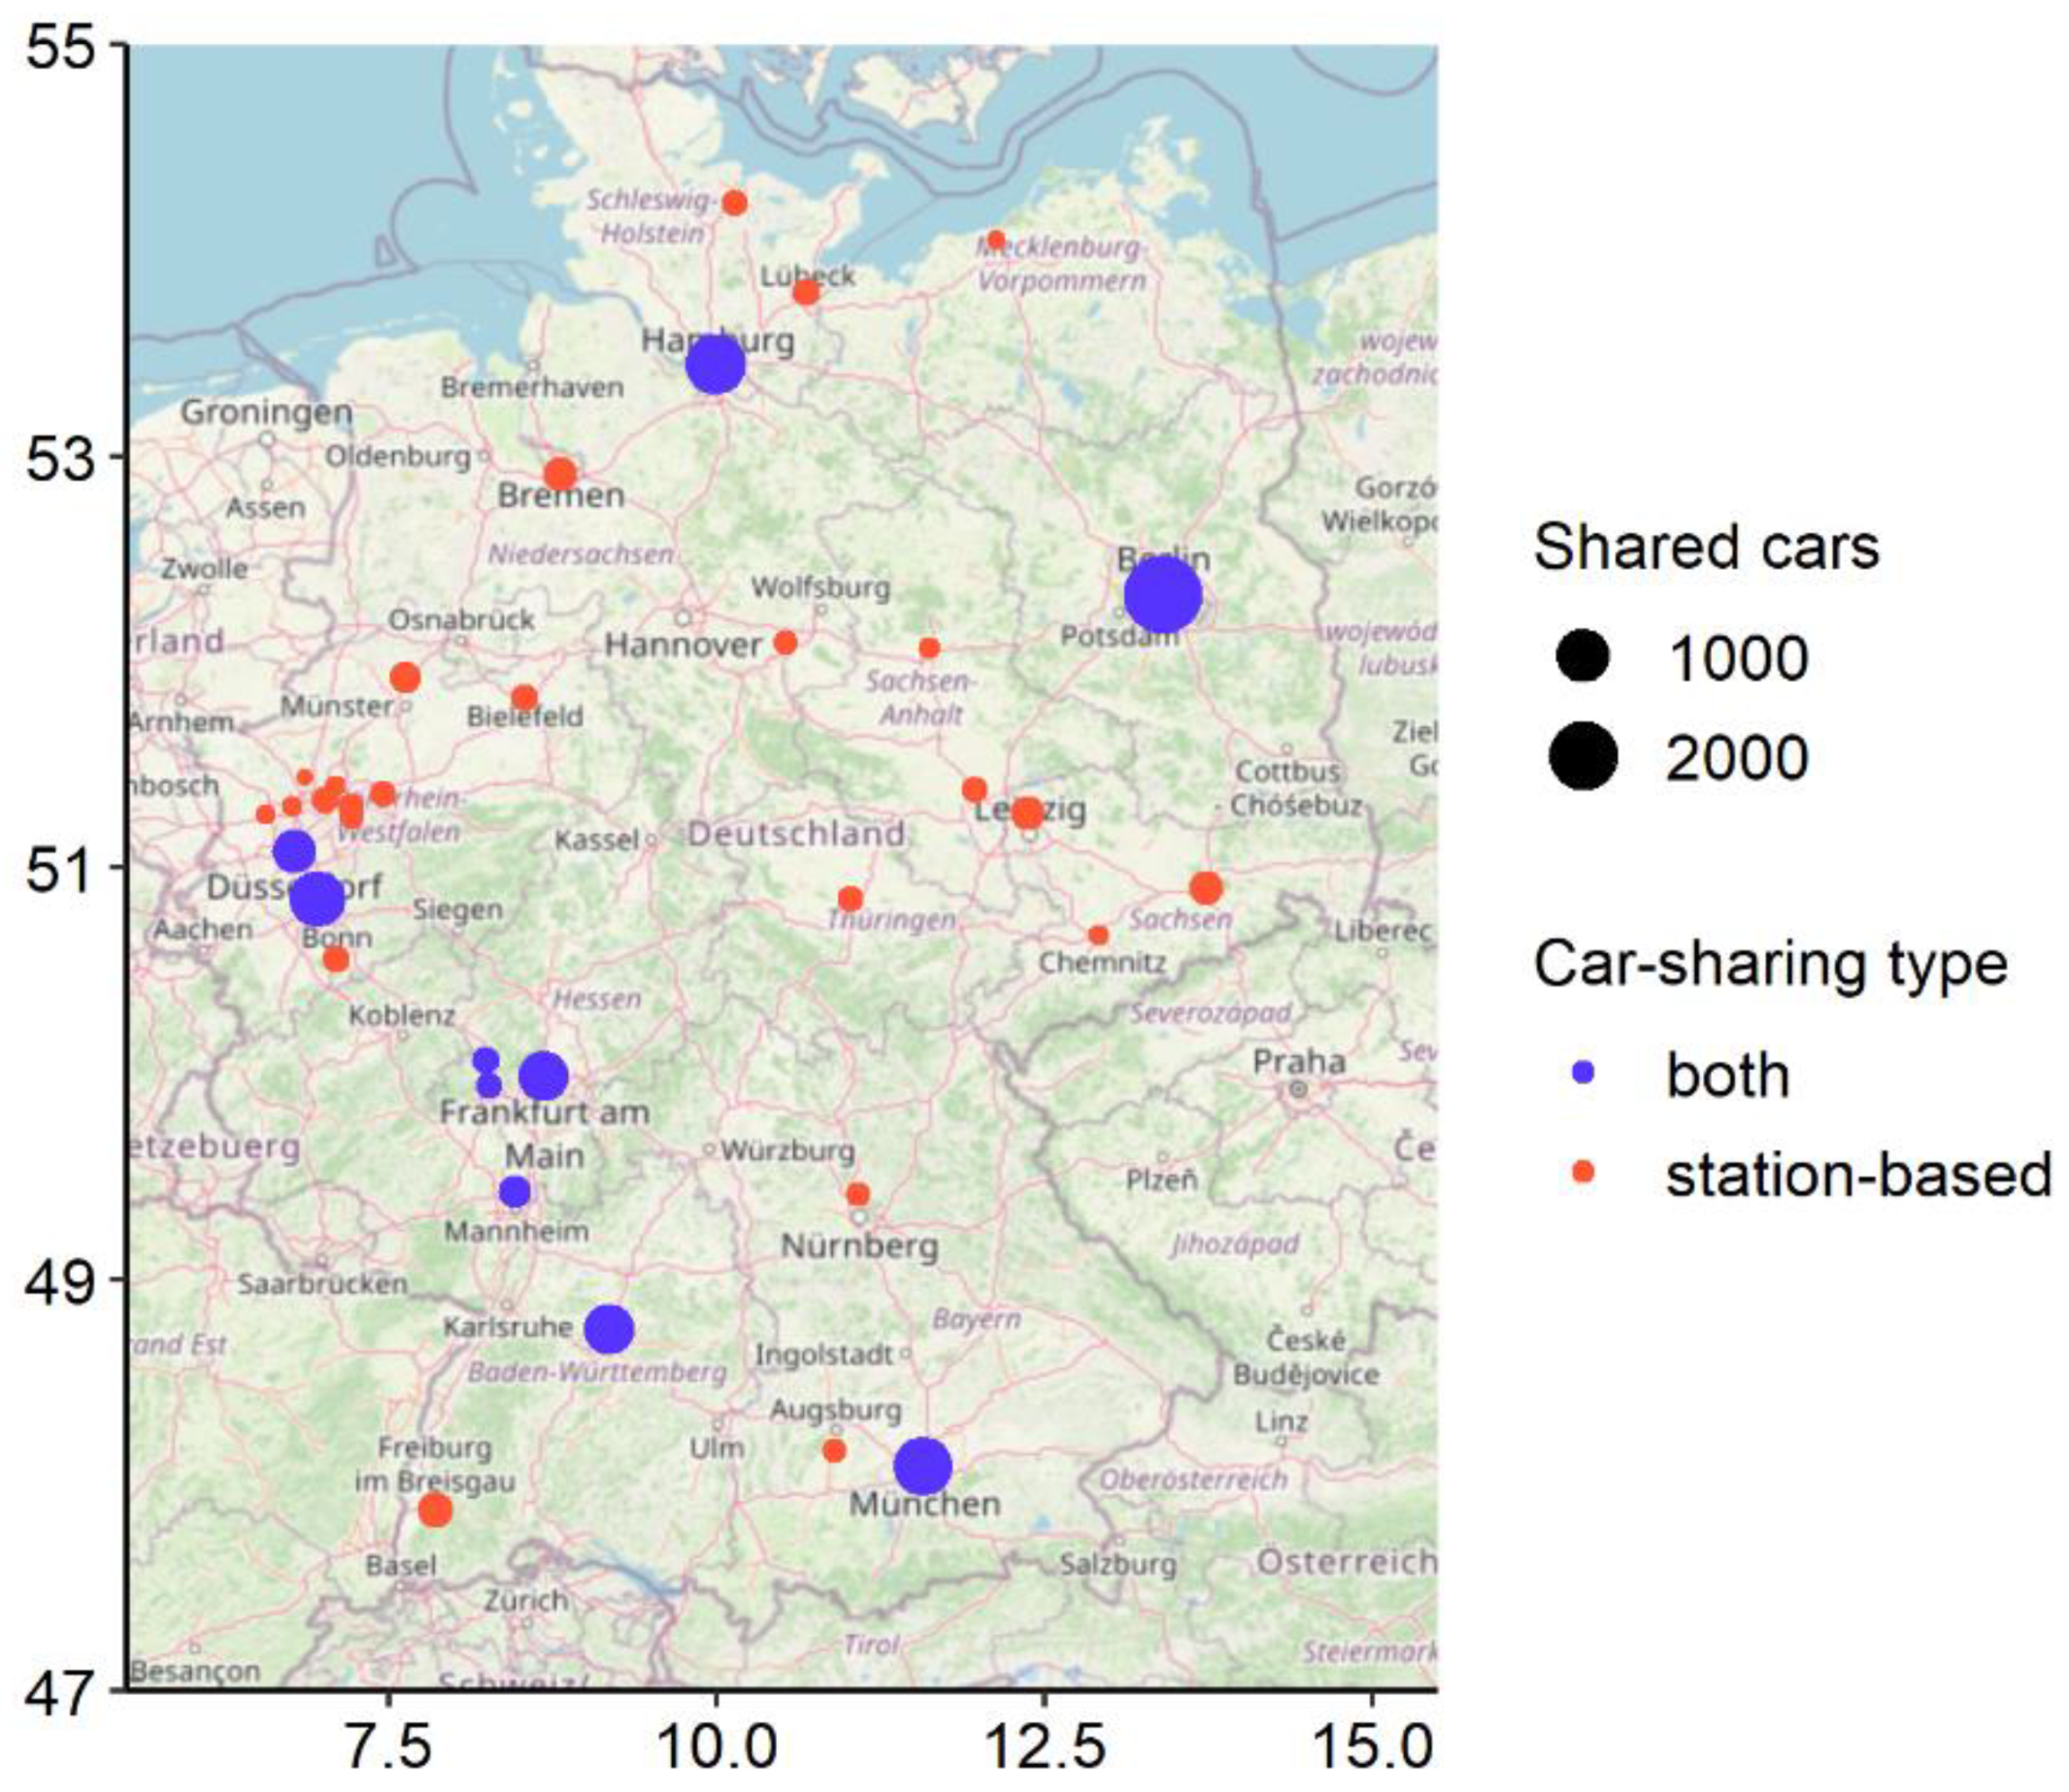
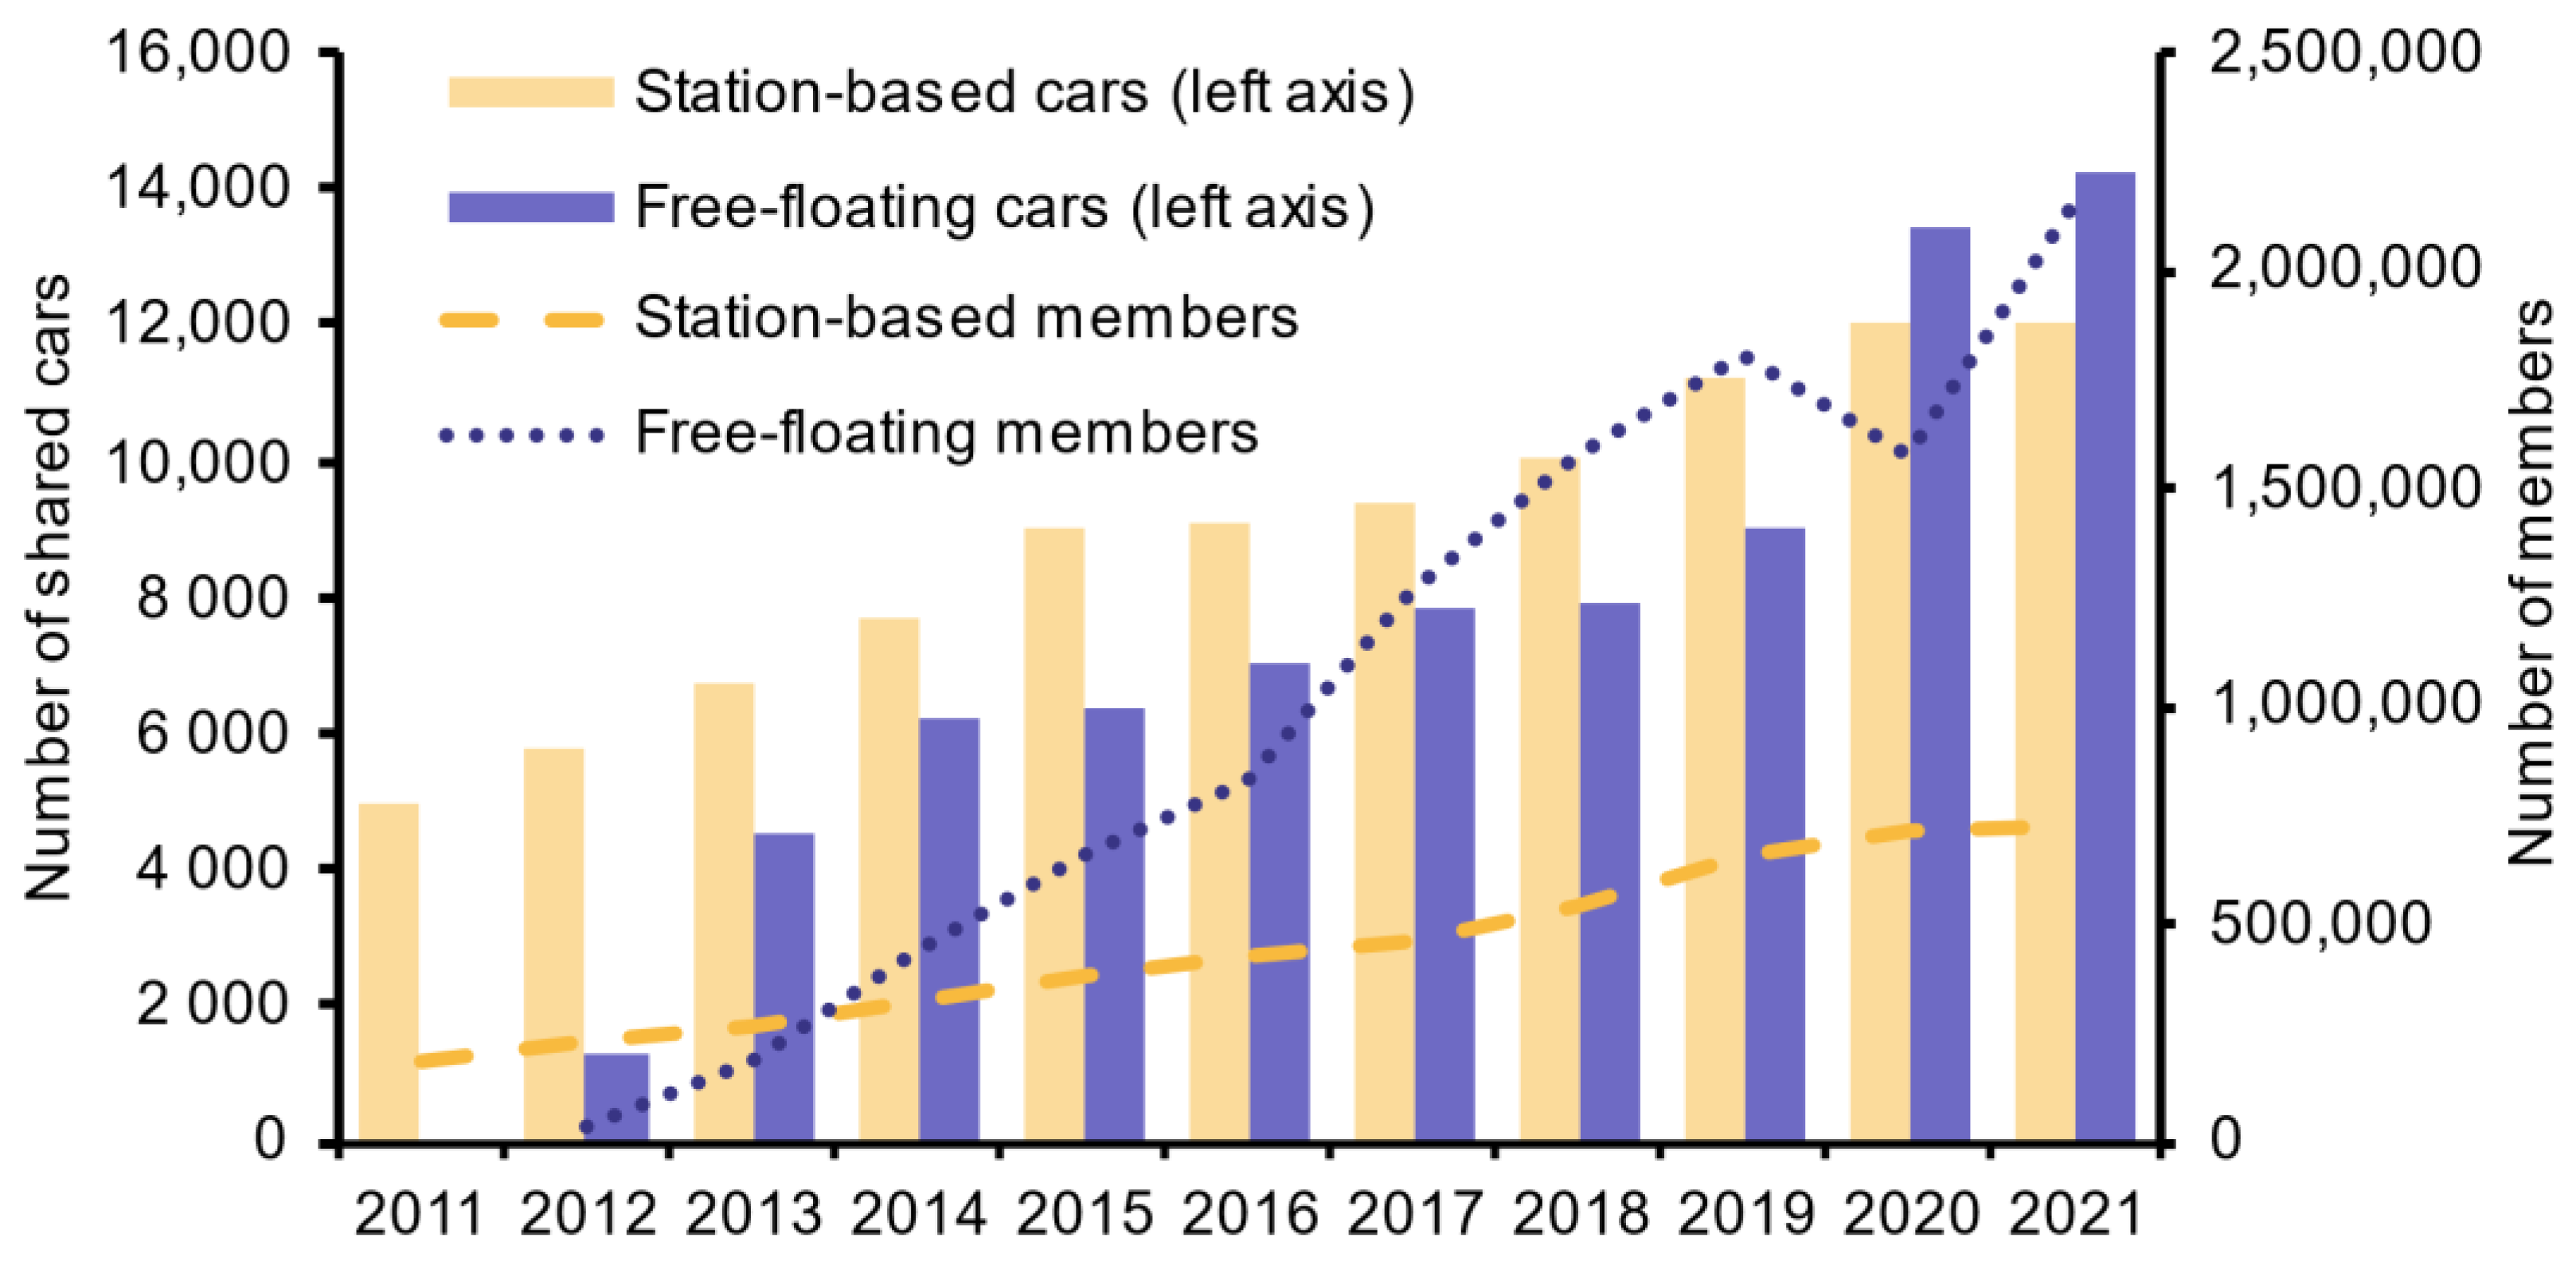
2.2. Car-Sharing in Germany

There are two major operating modes for car-sharing in Germany: free-floating and station-based. Free-floating cars can be found and parked in a predefined business area, usually city centers. Members typically locate and rent cars via smartphone. In contrast to station-based car-sharing, they usually pay a moderate registration fee and per trip fees (distance or time) but no annual fee. Large-scale free-floating car-sharing started in Germany in the year 2011 [15].
Station-based car-sharing started much earlier, the first offers launched in the 1980s. Similar to car rental services, cars must be picked up and brought back to a station. The differences between station-based car-sharing and car rental lie in the number of stations and the rental process. Car-sharing stations are usually not staffed and consist of one or two parking spaces. Customers usually book, pay, and open cars via a smartphone app, sometimes combined with a customer or key card. Since most station-based firms charge a basic fee, the share of inactive users is probably lower than among free-floating operators.
While station-based car-sharing was predominant for a long time, free-floating has recently outnumbered station-based car-sharing regarding cars and users in Germany. Figure 1 illustrates this trend. As of 2021, free-floating car-sharing sums up to a total of roughly 14,000 cars, which are available in 15, mainly large cities, operated by five companies [16]. In contrast, station-based car-sharing is more decentralized than free-floating car-sharing. There are over 200 providers at more than 6000 locations in 855 German cities, operating 12,000 cars [16]. For comparison, the 82.8 million inhabitants of Germany owned 40.5 million noncorporate cars (excluding motor homes), of which 8.5 million were registered in district-free cities in 2017. Combined business models and private car-sharing (peer-to-peer) played a marginal role in the observed years, so we counted combined cars as free-floating and left privately shared cars out.

2.3. Station-Based Car-Sharing

Research on the use of car-sharing and its (possible) effects on private car ownership is as old as car-sharing itself (see, e.g., [18], p.186 ff.). With the rise of the internet and mobile access options in the first decade of the millennium, both station-based car-sharing and its research became increasingly popular. A little less than a decade ago, the launch of free-floating options sparked further interest, particularly regarding differences between free-floating and station-based car-sharing. Almost all studies use customer surveys, asking participants about their habits and their willingness to (not) own a private car given a car-sharing option [6]. Nevertheless, in measuring, incentivizing, and isolating the actual effects (e.g., using a control group), both the studies and their results differ considerably.
Among the earliest and most prominent studies are those by Cervero et al. [3,19,20]. The three consecutive and survey-based studies analyze different effects of introducing a station-based car-sharing service in the San Francisco Bay Area. Using non-members as counterfactuals, the authors find that car-sharing reduces one or more cars in more than 20% of households [3]. Furthermore, 4.8% of participants claim they would have increased the number of cars without car-sharing. Overall, the authors estimate 28 fewer cars per 100 members two years after introducing car-sharing, which corresponds to seven to ten private cars replaced by one shared car (calculated from the reported numbers of shared cars and members). Nonetheless, four years after introducing car-sharing, as part of the third study, Cervero et al. found that the replacement rate had dropped: with a constant user-to-shared-car ratio, one shared car replaces roughly five private cars. The authors concluded that most of the reduction in private cars occurs one to two years after the launch of a car-sharing service [20].
Similar studies followed, for example, a study that examines a station-based car-sharing service in Philadelphia, Pennsylvania, U.S., finding a replacement rate of one to 23 [4]. This unusually high result is perhaps rooted in the lack of a control group and a very optimistic set of early adopters. With a large-scale survey of roughly 6000 members of different station-based car-sharing services in North America, Martin et al. found that the average number of cars per member-household drops from 0.47 to 0.24 [2]. The authors estimate that one shared car replaces between nine and thirteen private cars.
The specific context where car-sharing is offered might play a central role. Within a station-based car-sharing scheme, addressing university members in Ithaca, NY, U.S., Stasko et al. estimate a reduction rate of 0.19 cars per member [21]. This reduction corresponds to a replacement rate of one to 15 [21]. However, the authors note that frequent users are more likely to participate in the survey, which may confirm concerns that surveys are not representative of the population of car-sharing users. Other context-specific factors are the availability of public transport and parking spaces, the types of shared cars, and the cultural context. Two studies analyze station-based car-sharing in Seoul, South Korea, and find that good public transport and parking space problems are critical to motivating people to abandon cars [22,23]. The authors estimate that one station-based car replaces three to five private cars, for the latter assuming a member-to-car ratio of 40:1, which is the median ratio of all reviewed studies that report members and vehicles. Most studies concern the early phase of sharing services, rendering the ratio low compared to more current figures (see Figure 1). However, the share of active subscribers is unknown, and survey participants are disproportionately active. Therefore, we consider a ratio of 40:1 as a conservative but reasonable benchmark [22,23]. Another study from China suggests that the potential savings in the number of cars can be even greater in developing countries, as most households do not yet own a car [24].
Many European studies on station-based car-sharing are not published in academic journals but as final reports for various commissioned studies (see, e.g., [25,26]). One exception investigates station-based, round-trip, and peer-to-peer car-sharing in the Netherlands [27]. While focusing on economic impacts, the study reports a total reduction in car ownership of 0.4 cars per member [27], corresponding to a replacement rate of one to 16 (assuming a user-to-car ratio of 40:1).
Only a few studies use data sources other than surveys. One exception combines Canadian census data, household surveys that feature travel data (“origin-destination”), and data from a car-sharing service in Montreal [28]. The authors do not report substitution rates but find that the number of private cars shrinks significantly in areas with high availability of station-based shared cars [28]. Another non-survey-based study relies on answers from the California Household Travel Survey, finding that users of car-sharing own on average 0.27 fewer cars [29]. Attributing this difference to car-sharing and assuming that one shared car serves 40 members, one shared car is equivalent to eleven private cars.
In summary, all reviewed studies find a pronounced impact, ranging between three and 23 replaced cars per station-based shared car. The average of the eight studies above, in which substitution rates can be found or calculated, is 1:11.7 (median 1:11).

2.4. Differences between Station-Based and Free-Floating Car-Sharing

Ulm, Germany, was one of the first cities that witnessed the launch of a free-floating car-sharing scheme. Following this development, Firnkorn and Müller analyzed the ecological impact of the new free-floating car scheme in two subsequent studies [30,31]. The first study relies on a cross-section survey, asking pedestrians about their willingness to abandon car ownership. Correcting the answers with a flat rate, the authors estimated that roughly 2300 cars would be replaced on a five-year horizon, corresponding to a replacement rate of one to 19. In the second study, one and a half years after introducing the car-sharing service, the authors measured the actual reductions. Further, they asked members for a Likert scale assessment of how causal car sharing was to any reduction. By only accounting for narrow causality (high Likert values), the authors estimate a comparably low replacement rate (1:2–4). With a broader interpretation of causality, they appraise the rate between five and ten but acknowledge the estimate’s sensitivity against the share of inactive members.
A commissioned study accompanied the introduction of car2go, a free-floating car-sharing service, in Frankfurt, Stuttgart, and Cologne, Germany [25]. Based on panel interviews and controlling (among others) for demographic factors and difficulties with the individual parking situation, they find that one car2go car substitutes between 0.3 and 0.8 private cars. Therefore, including the registrations of the shared cars, the number of cars on the streets would increase.
Besides asking for actual behavior, for example, plans to scrap a car, some studies apply discrete choice experiments, encountering participants with different travel modes for a hypothetical trip. Such an experiment was conducted to estimate market potentials and impacts of both car-sharing modes in London, UK. Most private cars are abandoned due to station-based car-sharing (3.5%), while free-floating effects are relatively marginal (0.5%) [5]. Another example comes from South Korea: while mainly focusing on the environmental effects and choice patterns given different vehicle configurations, Jung and Koo report that 16% of car-sharing users would abandon an existing car or forgo a planned car purchase [32]. They find that one-way and delivery services increase the likelihood of using car-sharing, thereby exacerbating car-sharing’s overall negative environmental impact [32].
Le Vine and Polak find that 37% of users (are willing to) displace a car or did not purchase a car due to a newly launched free-floating service in London [33]. With 40 members per car, this reduction corresponds to a replacement rate of one to 15. The individual probability of reducing car ownership due to car-sharing decreases with higher income and higher education. A different study from Vancouver, Canada, mainly focuses on differences between free-floating and station-based car-sharing users. The number of cars per household decreases more among users of station-based car-sharing than among free-floating users [7]. However, the estimated replacement rate of free-floating car-sharing (1:6) is higher than for station-based car-sharing (1:5) [7]. This difference is due to relatively more free-floating users serviced by relatively fewer cars.
Among the most comprehensive studies are those by Becker et al. [6,34], investigating car-sharing in Basel, Switzerland. The authors include an untreated control group (non-users of car-sharing), use a panel design (only [6]), travel diaries (only [6]), and incentivize survey participation (only [6]). In their first study, Becker et al. find that more users of station-based car-sharing (19%) than users of free-floating car-sharing (8%) would buy a car if the service did not exist [34]. Assuming that 40 members share one car, this would correspond to a replacement rate of roughly 1:7.6 and 1:3.2, respectively. The second study follows a panel design. That is, Becker et al. measure actual ownership changes within one year after the launch of a free-floating service. The reported total reduction of 6% corresponds to a replacement rate between 1:0.7 (according to reported members and cars) and 1:2.4 (assuming a member-to-car ratio of 40:1).
Empirical studies examining free-floating car-sharing or differences between the operating modes are scarce. Still, one study analyses the introduction of free-floating car-sharing in eight large German cities, estimating that one shared free-floating car reduces annual new car sales by 2 to 4.5 times [35]. Car ownership, used car sales (title transfers), and station-based car-sharing are not investigated.
Summing up, the literature on the impact of free-floating car-sharing is ambiguous. Studies that rely on stated preferences, a single cross-section survey, and no control tend to estimate double-digit substitution rates. More sophisticated, panel-based studies that measure actual reductions estimate lower replacement rates, some close to zero.
This paper differs from the studies noted above primarily in that it does not rely on surveys. Surveys are an uncomplicated tool to explore new phenomena, but they might lack generalizability. The reasons are self-selection of respondents, motives and incentivization for answering, low response rates, subjectivity, and (frequently) missing treatment- and outside-effect controls. Controls help to correct third-party- and rebound effects, that is, effects on non-users, such as reduced parking space problems or lower car prices. Furthermore, the decision to participate in car-sharing is not random; thus, car-sharing might, in particular, “treat” people who want to abandon one or more cars regardless. In these cases, car-sharing would be a signal and not a cause for (planned) car ownership reductions [27]. Finally, a non-randomness in the participant selection might lead to overestimations. Most of the above-cited studies have a response rate below 20%. Thus, some of the results might not apply to all members of car-sharing. Missing incentivization or granting car-sharing vouchers (which applies to all but one reviewed study) might promote frequent user participation.
With this study, we aim to verify the survey-based results empirically. Instead of surveying users, we use actual market developments to investigate the relationship between shared cars and the number of registered private cars. As a result, we are not dependent on users’ causality assessments for any car purchase or their predictions about (omitted) car purchases. Simultaneously, the estimates include any rebound effects since we measure the overall development. This approach is consistent with other impact analyses in the sharing economy (as shown in Section 2.1).

3. Materials and Methods

This study empirically explores the impact of car-sharing on noncorporate car ownership and car markets in 35 large German cities between 2012 and 2017. For these cities, we look at changes in the number of registered cars, title transfers, and registrations of new cars and explain them with a set of explanatory variables, particularly the number of shared cars. In doing so, we identify the citywide association between three different dimensions of car ownership and car-sharing.
The study combines data from multiple publicly available sources. Most of the independent variables, as well as the explained variables (car ownership, purchase, and transfers), come from official records such as the German Federal Statistical Office (Destatis), the Federal Employment Agency (Bundesagentur für Arbeit), and the Federal Motor Vehicle Office (Kraftfahrtbundesamt). Furthermore, the Bundesverband CarSharing e.V. (The Federal Association for Car-sharing) provides data on the number of shared cars.
The objects of study are 35 district-free cities in Germany with more than 200,000 inhabitants, resulting from the combination of different data sources: on the one hand, there are 107 district-free cities in Germany, including the city-states Berlin and Hamburg. These correspond to NUTS 3 regions (or higher) and have an unambiguous geographical reference at high availability and quality of official statistics. On the other hand, the data from the Bundesverband CarSharing are partly limited to 37 cities with more than 200,000 inhabitants, as we explain in Section 3.1. Thus, after excluding two cities for statistical reasons (Karlsruhe is an outlier regarding the number of shared cars and Aachen is formally a district-free city but belongs in the official statistics to a larger region), 35 cities remain for the study. Figure 2 maps the analyzed cities and indicates which types of car-sharing and how many shared cars are available.

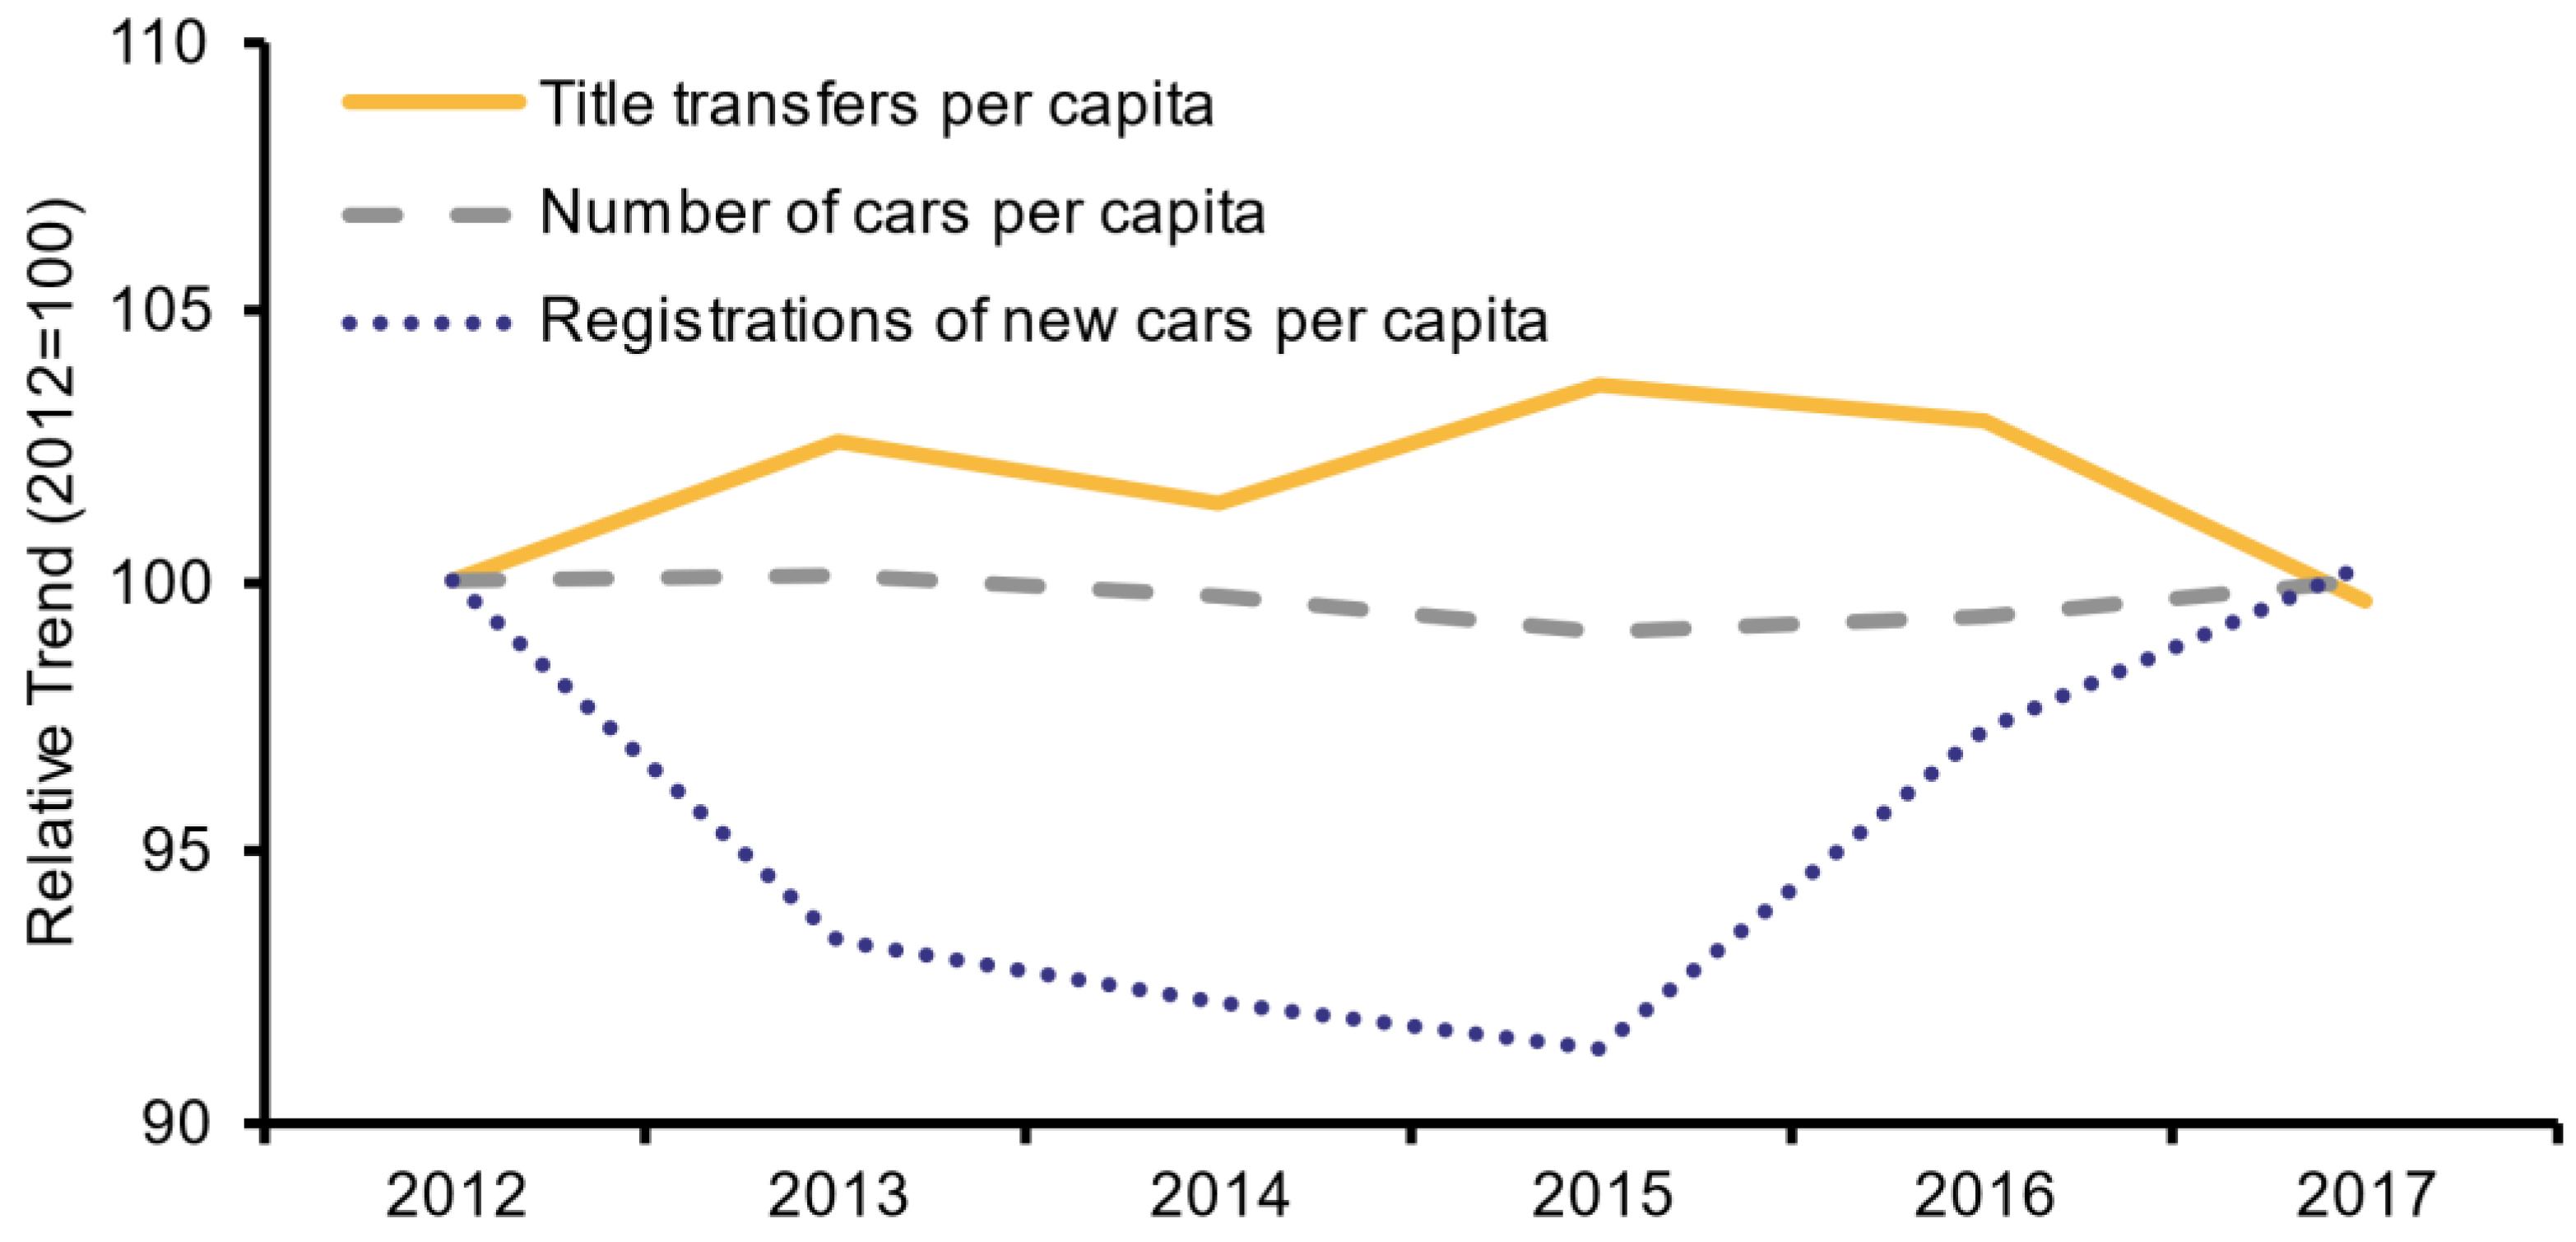
3.1. Data Origin of the Dependent Variables (Number of Cars)

The dependent variables and their sources are summarized in Table 1. The authority defines registrations of new cars as first-time approval and registration of a brand-new car with a registration number in Germany [38]. Consequently, new cars have neither been used abroad nor taken out of service before. In contrast, ownership transfers (used car registration) mean that previously registered cars get new owners. The transfer of ownership can result from, e.g., a gift, legacy, or purchase. We account for gratuitous title transfers by including demographic control variables as indicators for inheritances and gifts (see next section). By definition, title transfers do not include holders’ moves to other districts, name changes, or handovers (sales) to car dealers [38].
The dependent variables varied without a clear trend over the observed years, as shown in Figure 3. In the figure, values are normalized to the base year (2012 = 100) and population (per capita). The flow variables of annual registrations are subject to a higher variance than the stock of cars. In 2012, 6.6 million (private) cars were registered in the cities considered, 1.2 million (private) titles were transferred, and 0.2 million (private) new cars were registered.
The statistics explicitly name the number of commercial owners (“gewerbliche Halter”), which allows us to exclude them from the total. In this study, we focus on privately owned cars for the following reasons: (i) this study tries to estimate the effect of car-sharing on private car ownership, not on company cars, expecting that the impact will be most significant among private households; (ii) car-sharing is mainly seen as an offer to private households and frequently advertised as an alternative for not very frequently used private cars [39]; (iii) the motives and organizational possibilities for corporate car-sharing are different; (iv) car registrations by companies distort the official statistics, inter alia due to “one-day-registrations” (“Tageszulassungen”), headquarters of company fleets (e.g., Wolfsburg, where Volkswagen seats, counts more cars than inhabitants), and taxational issues; (v) most reviewed studies address car ownership in a (private) household context; (vi) statistics on private car ownership cover overall car ownership quite well: The Federal Motor Vehicle Office reported that of 45.8 million cars in Germany in 2017, 41.0 million were held by individuals (90%). While private individuals account for almost all (95%) used car registrations, businesses dominate new car registrations (64%).

3.2. Data Origin of the Controls

The data of the two main explanatory variables, the number of shared cars in both free-floating and station-based mode, originate from the Bundesverband CarSharing e.V., a federal association mainly representing the interests of station-based car-sharing cooperatives. The association reports the number of shared cars available in German cities (“Städteranking”) regularly every two years by asking all car-sharing companies to report their number of cars. We gathered these data for the years 2012, 2013, 2015, and 2017. For the first two years, the report includes cities with more than 200,000 inhabitants, while later reports include smaller cities (>50,000 inhabitants). Due to this switch in the reported base, there are three analyzable time-series: (i) the set of communities with more than 200,000 inhabitants for all four years; (ii) the set of all available 90 cities but for only two periods (2015 and 2017); (iii) the entire data set, accepting the imbalance. We chose to apply the first approach to work with a long-running, balanced panel.
Table 2 provides an overview of the independent variables: The number of shared cars in both operating modes and control variables expected to influence the number of cars. The literature mentions demographic and economic factors, as well as the population density, to influence car ownership [40,41]. Urban factors that are invariant over the observed time (e.g., highways) are controlled by individual effects. Time-variant factors, which are the same for all cities (e.g., oil prices, taxes), are controlled by time dummies.
We could not include other developments in the transport sector, such as moped-sharing, car-pooling, and ride-hailing (e.g., Uber), because of a lack of data. However, facing legal difficulties and bans, as well as studies showing no or only a weak link, we do not expect ride-hailing to have a significant impact before 2018 [42,43,44,45]. In Germany, moped-sharing is available for roughly half of the year, which is why we do not expect it to be a comprehensive substitute to car ownership, but it might be supportive.
Milage delivered by public transport is available but not included in the regression due to insufficient data quality. Official statisticians pointed out that the informative value, especially regarding annual changes, might be blurred by improvements in mileage allocation to the regions served. We searched for completions of sizeable public transport infrastructure projects or other significant disruptive changes in public transportation but have not seen any need for further controls.

3.3. Empirical Strategy

The first difference estimator is an approach to exclude time-fixed effects from a regression. It means regressing not the absolute levels but the differences of the observed variables between two time periods. The starting point for the basic model is a population model that explains the total number of (noncorporate) cars, here specified by city i:
carsit = αt + β1 sc_stationit + β2 sc_freeit + x’it γ + ai + uit.
In Equation (1), carsit represents the number of non-company cars. In line with previous, interview-based studies on the effects of car-sharing on car ownership, we expect that the number of cars in city i at time t depends on the following variables: sc_stationit, the number of shared cars in station-based mode, and sc_freeit, the number of shared cars operated in a free-floating mode. The term αt is a period-specific intercept, which allows for periodic, aggregate fluctuations in car ownership, for example, the nationwide effects of gasoline price increases or changes in car taxes. The term ai covers unobserved characteristics of the cities that do not (significantly) vary over time, for example, the length of the road network and the number of parking spaces. The vector x’it covers the remaining covariates, as described in Table 2. The error term uit is city- and time-specific.
We obtain the first difference by subtracting from Equation (1) the corresponding equation of the previous period (t − 1). Thereby, the city’s fixed effect ai drops out, as, by assumption, it is not varying over time, and regressions only account for changes in variables over time. The first-difference estimator is a way to suppress problems emerging from omitted variables. We will see that the model most likely suffers from autocorrelation in the error terms (uit). Thus, fixed effects could deliver biased estimates, making the first-difference estimator the better choice.
We investigate car-sharing’s effects on the markets for cars with a similar approach. However, to interpret the results correctly, we must recognize that the stock of cars results from various additions and disposals. From there on, we take a closer look at two inflows, namely the markets for new and used cars. Changes in the stock of private cars in a city result from the flows adding and removing cars. The following flows increase the number of privately owned cars in a city:
1.1
registrations of (privately owned) new cars;
1.2
title transfers from companies to private owners within the city;
1.3
title transfers due to imports from outside the city;
1.4
registrations of cars in the city because of relocation (without changes in ownership).
In contrast, the following flows decrease the number of private cars:
2.1
scrapping, suspension, and abandoning of (privately owned) cars;
2.2
title transfers from private persons to companies within the city;
2.3
title transfers due to out-of-town exports;
2.4
suspensions of cars because of relocation (without changes in ownership).
Further, there is one neutral factor for the total number of private cars in a city:
3.1
title transfers within the city between private owners.
We will analyze registrations of new cars (1.1) and title transfers (1.2, 1.3, 3.1). Registrations of new cars add directly to the stock of registered cars. Thus, if more (noncorporate) new cars are registered, the total number of cars will increase unless at least one opposed flow increases equally (2.1, 2.2., 2.3, and 2.4). We analyze the registrations of new cars in city i at time t (new_carsit) equivalent to Equation (1) and start with the following population model:
new_carsit = αt + β1 sc_stationit + β2 sc_freeit + x’it γ + ai + uit.
The variables and procedure (first difference) are equivalent to the explanations for Equation (1).
Private car ownership usually results from a title transfer, and most privately owned cars are former company cars, sometimes only for one day. As previously mentioned, car dealers frequently register new cars for one day to sell them afterward as used cars, thereby allowing for discounts and achieving sales targets. This circumstance renders the measurement of title transfers indispensable to quantify private car purchases. However, measuring title transfers and inferring car ownership can lead to a fallacy: title transfers are three flows (1.2, 1.3, and 3.1), while only two increase the number of privately owned cars (1.2 and 1.3). Thus, an increase in title transfers does not necessarily impact the total number of cars, even when negative flows (2.1, 2.2., 2.3, and 2.4) remain constant. Conversely, the number of registered cars can decrease at constant title transfers if scrapping, resales within the city, or exports increase.
The procedure to estimate the impacts on used cars differs from Equation (2) only on the left-hand side by exchanging new_carsit with used_carsit, which stands for the number of title transfers in city i at time t.
Specific substitutions between the submarkets for shared and new cars might blur fundamental trends regarding the willingness to purchase cars. We control this with a third model, where we use the sum of new car registrations and title transfers as the dependent variable.

4. Results

4.1. Summary Statistics

There are, on average, 168 station-based shared cars (median: 91) and 209 free-floating cars (median: 0) in the observed 35 cities in 2017. While station-based car-sharing is available in all observed cities, free-floating is only available in 13 of the 35 observed cities in 2017: the seven largest cities in the sample (>600,000 inhabitants: Berlin, Hamburg, Munich, Colonia, Frankfurt/Main, Stuttgart, Düsseldorf), two minor cities connected through the free-floating operating area to larger cities (Mainz, Wiesbaden), and four cities with local free-floating initiatives (Essen, Mannheim, Kiel, Halle/Saale). On average, there is one station-based shared car for 3060 inhabitants, ranging between 720 inhabitants (Freiburg) and 130,000 inhabitants (Gelsenkirchen) per shared car. Despite its wide availability, more cars are operated in free-floating than in station-based mode in large cities. In cities with free-floating car-sharing, there is on average one free-floating car per 2332 inhabitants.
The observed cities vary significantly in size, ranging from 208,000 (Rostock) to 3.6 million inhabitants (Berlin), with an average of 555,200 inhabitants (median: 325,500) in 2017. Therefore, for the following analyses, we divided standardizable variables by the city’s population in means of thousands.
On average, there are 383 private cars per 1000 inhabitants (median: 387) in 2017, with the lowest scores in dense cities (min: 284, Berlin). Annually used and new car registrations range from 1.88 million (2012) to 1.98 million (2016). With this in mind, with 1.60 million (2012) to 1.73 million (2016) holder replacements, used cars account for most noncorporate registrations. The number of new registrations has grown (non-steadily) in the examined period.

4.2. Number of Private Cars

The results of the first difference model, explaining the number of privately owned cars, can be found in Table 3. All three models include the car-sharing variables and time dummies but differ in the number of controls added. The first model in Table 3 does not incorporate any controls (1), the second one includes all controls (2), and the third one only includes significant controls (3). All reported standard errors are heteroscedasticity consistent.
In model one of Table 3, both car-sharing variables correlate strongly and negatively with the number of cars. The effect of station-based car-sharing seems to be twice the size of free-floating car-sharing.
The estimates change when controlling for other effects such as demography and commuters, especially for free-floating car-sharing (models two and three). The estimated coefficients for free-floating shared cars in models two and three in Table 1 are not significantly different from zero. The coefficients of station-based shared cars become more significant but reduce in size, indicating that one station-based shared car replaces close to nine private cars. Models two and three in Table 3 add significant controls to the model, which interact with the number of free-floating shared cars. Density and influx relate to fewer cars, while commuters relate to more noncorporate cars.
The fixed-effects estimator (within estimator) is more efficient than the first difference estimator when the unobservable errors are uncorrelated. Nevertheless, if the unobservable errors are correlated, the estimates can be biased ([46] pp. 321–326). We approximate correlation in the errors by testing if the differenced errors are autocorrelated. The bottom of Table 3 informs about autocorrelation in the differenced and original errors. In Model 1, both errors are autocorrelated, indicating that the model’s results might not be reliable, for example, due to omitted variables. In Models 2 and 3, differenced errors are not autocorrelated, while original errors are. This indicates that using the first difference estimator is legitimate, while estimates from a fixed-effects transformation might lead to wrong conclusions.
Summing up, the findings suggest that an increase in station-based shared cars correlates with a decrease in private car ownership. In contrast, free-floating cars do not seem to relate to private car ownership empirically. There is neither a comovement of private cars and shared cars nor a reduction in private cars with more free-floating shared cars.

4.3. Registrations of New and Used Cars

Table 4 presents estimates of the effects of car-sharing on the number of new car registrations and title transfers. Equivalently to Table 1, Models 1, 4, and 7 solely include the number of shared cars and dummies. Models 2, 5, and 8 include all controls; models three, six, and nine only those that remain significant after an iterative removal of insignificant controls. Again, we report heteroskedasticity-consistent standard errors.
Models 1 to 3 in Table 4 suggest that station-based shared cars correlate negatively with new car registrations. The effect sizes range between −1.3 and −1.6, suggesting that one additional, station-based shared car relates to roughly 1.5 fewer noncorporate new car registrations. The estimate is significant for all four models, with p < 0.05 for Model 2 and p < 0.01 for Models 1 and 3. The coefficients for free-floating cars are slightly larger than zero but statistically not significant. Notably, there is autocorrelation in the differenced errors, indicating that the results might be biased.
The results for used cars (title transfers) are inconclusive (Models 4–6, Table 4). All but one of the coefficients do not differ significantly from zero and tend to reverse signs compared to the results for new cars. That is, the coefficients for station-based shared cars are positive, and those for free-floating cars are negative.
The combined number of registrations (Models 7–9, Table 4) is the sum of new car registrations and title transfers. The coefficients indicate a negative relationship between all types of shared cars and car registrations, but the effects are minor and do not significantly differ from zero.

5. Discussion and Conclusions

Car sharing has become a widely available mobility service in recent years. At the same time, car-sharing is often seen as a building block for a more sustainable tomorrow. This study investigates the relationship of station-based and free-floating car-sharing to noncorporate car ownership in 35 German cities. We contribute to the research on the sustainability of car-sharing and empirical impact investigations of the sharing economy.
Most studies on car-sharing rely on single surveys, which raised concerns concerning their generalizability [6]. Furthermore, particularly the literature on free-floating car-sharing obtains inconsistent results regarding its contribution to reducing car ownership [25,30]. At the same time, the literature on the impact of other sharing businesses gives an excellent example of how empirical explorations can corroborate survey-based findings [8,12,13]. This analysis connects both literature streams, adding a new perspective on the impact of the sharing economy and overcoming some problems of survey-based research.
This study has two sets of findings on two dimensions: First, we differentiate between impacts on the stock (of cars) and impacts on the markets (for used and new cars). Second, we differentiate between two operating modes of car-sharing, which are either free-floating or station-based.
The results presented in Section 4.2 suggest that the number of station-based shared cars correlates negatively with the stock of noncorporate cars. We find that one station-based shared car replaces almost nine private cars. The effect is smaller than most survey-based studies suggest. We explain this difference by the fact that an empirical assessment does not suffer from selection and recall biases and includes rebound effects. Unsurprisingly, our findings confirm relatively conservative results of studies that control for such influences, for example, by panel surveys [3,6].
Further, the results from Section 4.2 suggest that free-floating car-sharing does not lead to a reduction in car ownership. The variable interacts with controls, indicating that free-floating car-sharing occurs under circumstances where private car ownership is in the retreat, namely large cities. Then, other effects such as density increases and influx are the true drivers of car ownership reductions. As for the case of station-based car-sharing, our empirical results reflect findings from survey-based results that try to minimize biases [6,25]. That is, this study suggests that free-floating car-sharing does not significantly affect car ownership.
The results presented in Section 4.3, that is, the impact of car-sharing on the desire for private cars, are not large enough to explain ownership reductions and do not significantly differ from zero. Two reasons are feasible: Either car-sharing does not influence the willingness to purchase cars, or it does, but rebound effects dampen the measurable impact. These rebound effects could, for example, be rooted in discounts by car dealers or shorter car holding periods.
Future research could further clarify the impact of car-sharing on the flows that increase and decrease the total number of privately owned cars in a city. A holistic approach would be helpful to explain the developments in the stock of cars comprehensively. Since we know that station-based car-sharing reduces ownership, our findings suggest that some other flows might be affected, too (i.e., scrapping, sales, or departures). In contrast to our findings, other publications report that free-floating car-sharing decreases sales of new cars; many members report a willingness to postpone or forego car purchases [2,3,27,35]. However, panel surveys show that car-sharing does not deter planned car purchases and the actual reductions are smaller than those expected [6,25]. Thus, again, our findings match conservative results from studies that differentiate between planned and actual reductions.
Turning to the environmental impact of car-sharing, measuring ownership reductions constitutes only a first step. Even if car-sharing induces ownership decreases, the environmental impact is still negative if carless households increase their mileage more than former car-owners reduce it [32]. Contrariwise, it is hard to imagine how car-sharing might overall decrease mileage when it does not lead to a reduction in privately owned cars. In the first step, car-sharing adds cars to the car fleet and makes car driving easily accessible. Consequently, its environmental impact depends on the user’s reaction. Our analyses show that station-based car-sharing induces quite pronounced ownership adaptions; environmental benefits are feasible. In contrast, free-floating car-sharing does not seem to impact car ownership, rendering contributions to environmental sustainability unlikely.
Of course, this research does not come without limitations. First, the quantification of free-floating car-sharing might be influenced by spatial mismatches and managerial decisions: The cities’ borders extend, in most cases, the dimensions of the operating area of free-floating car-sharing. More detailed spatial data, possibly for other countries, could help to validate our findings and refine the importance of the country’s economic development [24,28]. Further, free-floating car-sharing has witnessed a steep increase in some cities, which might have had a strategic background. In these cases, the number of shared cars would not represent the number of (active) users, which would be the actual fundament for ownership reductions.
A second limitation concerns the exogeneity of our explanatory variables (the number of shared cars). The explanatory variables must be uncorrelated with the idiosyncratic errors in each period ([46], p. 287). Thus, none of the explanatory variables must correlate with its previous values, which is violated if the operators’ decisions to alter the number of shared cars depend on previous adjustments. Nevertheless, this argument of a potentially non-random treatment applies to surveys, too, as there, participants choose to participate in car-sharing. In that sense, this and future empirical investigations are helpful to add another perspective to survey-based studies but do not provide unequivocal proof of causality. Future empirical research could further indurate causality by identifying exogenous shocks or suitable instruments. Furthermore, a comprehensive literature review with a critical summary of the heterogeneous literature is likely to help researchers and policymakers to see individual results in a broader frame.

Funding

This work has been funded by the Federal Ministry of Education and Research of Germany (BMBF) under grant no. 16DII124 (“Deutsches Internet-Institut”).

Data Availability Statement

All data used for the statistical analyses were available online at the time of the analysis at the following addresses: destatis.de, kba.de, statistik.arbeitsagentur.de, carsharing.de (accessed on 29 June 2021). Details can be found in Table 1 and Table 2.

Conflicts of Interest

The author declares no conflict of interest.

References

  1. Shaheen, S.A.; Cohen, A.P. Carsharing and Personal Vehicle Services: Worldwide Market Developments and Emerging Trends. Int. J. Sustain. Transp. 2013, 7, 5–34. [Google Scholar] [CrossRef]
  2. Martin, E.; Shaheen, S.A.; Lidicker, J. Impact of Carsharing on Household Vehicle Holdings: Results from North American Shared-Use Vehicle Survey. Transp. Res. Rec. 2010, 2143, 150–158. [Google Scholar] [CrossRef]
  3. Cervero, R.; Tsai, Y. City CarShare in San Francisco, California: Second-Year Travel Demand and Car Ownership Impacts. Transp. Res. Rec. 2004, 1887, 117–127. [Google Scholar] [CrossRef]
  4. Lane, C. PhillyCarShare: First-Year Social and Mobility Impacts of Carsharing in Philadelphia, Pennsylvania. Transp. Res. Rec. 2005, 1927, 158–166. [Google Scholar] [CrossRef]
  5. Le Vine, S.; Lee-Gosselin, M.; Sivakumar, A.; Polak, J. A New Approach to Predict the Market and Impacts of Round-Trip and Point-to-Point Carsharing Systems: Case Study of London. Transp. Res. D Transp. Environ. 2014, 32, 218–229. [Google Scholar] [CrossRef]
  6. Becker, H.; Ciari, F.; Axhausen, K.W. Measuring the Car Ownership Impact of Free-Floating Car-Sharing—A Case Study in Basel, Switzerland. Transp. Res. D Transp. Environ. 2018, 65, 51–62. [Google Scholar] [CrossRef] [Green Version]
  7. Namazu, M.; Dowlatabadi, H. Vehicle Ownership Reduction: A Comparison of One-Way and Two-Way Carsharing Systems. Transp. Policy 2018, 64, 38–50. [Google Scholar] [CrossRef]
  8. Zervas, G.; Proserpio, D.; Byers, J.W. The Rise of the Sharing Economy: Estimating the Impact of Airbnb on the Hotel Industry. J. Mark. Res. 2017, 54, 687–705. [Google Scholar] [CrossRef] [Green Version]
  9. Dann, D.; Teubner, T.; Weinhardt, C. Poster Child and Guinea Pig—Insights from a Structured Literature Review on Airbnb. Int. J. Contemp. Hospit. Manag. 2018, 31, 427–473. [Google Scholar] [CrossRef]
  10. Barron, K.; Kung, E.; Proserpio, D. The Effect of Home-Sharing on House Prices and Rents: Evidence from Airbnb. Mark. Sci. 2021, 40, 23–47. [Google Scholar] [CrossRef]
  11. Xu, Y.-H.; Pennington-Gray, L.; Kim, J. The Sharing Economy: A Geographically Weighted Regression Approach to Examine Crime and the Shared Lodging Sector. J. Travel Res. 2019, 58, 1193–1208. [Google Scholar] [CrossRef]
  12. Roma, P.; Panniello, U.; Lo Nigro, G. Sharing Economy and Incumbents’ Pricing Strategy: The Impact of Airbnb on the Hospitality Industry. Int. J. Prod. Econ. 2019, 214, 17–29. [Google Scholar] [CrossRef]
  13. Burtch, G.; Carnahan, S.; Greenwood, B.N. Can You Gig It? An Empirical Examination of the Gig Economy and Entrepreneurial Activity. Manag. Sci. 2018, 64, 5497–5520. [Google Scholar] [CrossRef] [Green Version]
  14. Li, Z.; Hong, Y.; Zhang, Z. An Empirical Analysis of On-Demand Ride Sharing and Traffic Congestion. In Proceedings of the 2016 International Conference on Information Systems (ICIS 2016), Dublin, Ireland, 11–14 December 2016. [Google Scholar]
  15. Heise Autos Car2go: Pkw-Spontanmiete Jetzt Auch in Hamburg. Available online: https://heise.de/-1223807 (accessed on 27 August 2019).
  16. Datenblatt CarSharing in Deutschland. Available online: https://carsharing.de/sites/default/files/uploads/datenblatt_carsharing_in_deutschland_stand_01.01.2021.pdf (accessed on 28 April 2021).
  17. Bundesverband CarSharing e.V. Marktentwickluung des CarSharing in Deutschland. Available online: https://carsharing.de/alles-ueber-carsharing/carsharing-zahlen/aktuelle-zahlen-fakten-zum-carsharing-deutschland (accessed on 28 April 2021).
  18. Petersen, M. Ökonomische Analyse des Car-Sharing; Schriften zur Unternehmensentwicklung; Deutscher Universitätsverlag: Wiesbaden, Germany, 1995; ISBN 978-3-8244-6111-0. [Google Scholar]
  19. Cervero, R. City CarShare: First-Year Travel Demand Impacts. Transp. Res. Rec. 2003, 1839, 159–166. [Google Scholar] [CrossRef]
  20. Cervero, R.; Golub, A.; Nee, B. City CarShare: Longer-Term Travel Demand and Car Ownership Impacts. Transp. Res. Rec. 2007, 1992, 70–80. [Google Scholar] [CrossRef]
  21. Stasko, T.H.; Buck, A.B.; Gao, H.O. Carsharing in a University Setting: Impacts on Vehicle Ownership, Parking Demand, and Mobility in Ithaca, NY. Transp. Policy 2013, 30, 262–268. [Google Scholar] [CrossRef]
  22. Kim, D.; Ko, J.; Park, Y. Factors Affecting Electric Vehicle Sharing Program Participants’ Attitudes about Car Ownership and Program Participation. Transp. Res. Part D Transp. Environ. 2015, 36, 96–106. [Google Scholar] [CrossRef]
  23. Ko, J.; Ki, H.; Lee, S. Factors Affecting Carsharing Program Participants’ Car Ownership Changes. Transp. Lett. 2019, 11, 208–218. [Google Scholar] [CrossRef]
  24. Hui, Y.; Wang, Y.; Sun, Q.; Tang, L. The Impact of Car-Sharing on the Willingness to Postpone a Car Purchase: A Case Study in Hangzhou, China. J. Adv. Transp. 2019, 2019, 12. [Google Scholar] [CrossRef]
  25. Öko-Institut e.V.; ISOE. Share—Wissenschaftliche Begleitforschung zu Car2go mit Batterieelektrischen und Konventionellen Fahrzeugen; Öko-Institut e.V.: Berlin, Germany, 2018. [Google Scholar]
  26. Team Red. Analyse der Auswirkung des Car-Sharing in Bremen; Team Red: Berlin, Germany, 2018. [Google Scholar]
  27. Nijland, H.; van Meerkerk, J. Mobility and Environmental Impacts of Car Sharing in the Netherlands. Environ. Innov. Soc. Transit. 2017, 23, 84–91. [Google Scholar] [CrossRef]
  28. Klincevicius, M.G.Y.; Morency, C.; Trépanier, M. Assessing Impact of Carsharing on Household Car Ownership in Montreal, Quebec, Canada. Transp. Res. Rec. 2014, 2416, 48–55. [Google Scholar] [CrossRef]
  29. Clewlow, R.R. Carsharing and Sustainable Travel Behavior: Results from the San Francisco Bay Area. Transp. Policy 2016, 51, 158–164. [Google Scholar] [CrossRef]
  30. Firnkorn, J.; Müller, M. What Will Be the Environmental Effects of New Free-Floating Car-Sharing Systems? The Case of Car2go in Ulm. Ecol. Econ. 2011, 70, 1519–1528. [Google Scholar] [CrossRef]
  31. Firnkorn, J.; Müller, M. Selling Mobility Instead of Cars: New Business Strategies of Automakers and the Impact on Private Vehicle Holding. Bus. Strategy Environ. 2012, 21, 264–280. [Google Scholar] [CrossRef]
  32. Jung, J.; Koo, Y. Analyzing the Effects of Car Sharing Services on the Reduction of Greenhouse Gas (GHG) Emissions. Sustainability 2018, 10, 539. [Google Scholar] [CrossRef] [Green Version]
  33. Le Vine, S.; Polak, J. The Impact of Free-Floating Carsharing on Car Ownership: Early-Stage Findings from London. Transp. Policy 2019, 75, 119–127. [Google Scholar] [CrossRef]
  34. Becker, H.; Ciari, F.; Axhausen, K.W. Comparing Car-Sharing Schemes in Switzerland: User Groups and Usage Patterns. Tansp. Res. Part A Policy Pract. 2017, 97, 17–29. [Google Scholar] [CrossRef] [Green Version]
  35. Schmidt, P. The Effect of Car Sharing on Car Sales. Int J. Ind. Organ. 2020, 71, 102622. [Google Scholar] [CrossRef]
  36. OpenStreetMap Exports from OpenStreetMap. Available online: https://www.openstreetmap.org/ (accessed on 5 February 2021).
  37. Bundesverband CarSharing e.V. Städteranking. 2017. Available online: https://carsharing.de/alles-ueber-carsharing/carsharing-zahlen/carsharing-staedteranking-2017 (accessed on 5 March 2019).
  38. Kraftfahrtbundesamt. Glossar. 2019. Available online: https://www.kba.de/DE/Service/Glossar/glossar_node.html (accessed on 30 June 2021).
  39. Bundesverband CarSharing e.V. Ist CarSharing das Richtige für Mich? Available online: https://carsharing.de/alles-ueber-carsharing/ist-carsharing/ist-carsharing-richtige-fuer-mich (accessed on 26 April 2021).
  40. Ewing, R.; Cervero, R. Travel and the Built Environment. J. Am. Plann Assoc. 2010, 76, 265–294. [Google Scholar] [CrossRef]
  41. Ding, C.; Wang, D.; Liu, C.; Zhang, Y.; Yang, J. Exploring the Influence of Built Environment on Travel Mode Choice Considering the Mediating Effects of Car Ownership and Travel Distance. Tansp. Res. Part A Policy Pract. 2017, 100, 65–80. [Google Scholar] [CrossRef]
  42. DeMasi, A.A. Uber: Europe’s Backseat Driver for the Sharing Economy. Creighton Int’l Comp. L.J. 2016, 7, 73–85. [Google Scholar]
  43. BVTM. Zahlen über den Taxi- und Mietwagenverkehr; Bundesverband Taxi und Mietwagen e.V.: Berlin, Germany, 2021; p. 11. [Google Scholar]
  44. BMVI. Bericht über die Sondererhebung zum Taxen- und Mietwagenverkehr; Bundesministerium für Verkehr und digitale Infrastruktur: Berlin, Germany, 2016; p. 32. [Google Scholar]
  45. Diao, M.; Kong, H.; Zhao, J. Impacts of Transportation Network Companies on Urban Mobility. Nat. Sustain. 2021, 4, 494–500. [Google Scholar] [CrossRef]
  46. Wooldridge, J.M. Econometric Analysis of Cross Section and Panel Data; MIT Press: Cambridge, MA, USA, 2010; ISBN 978-0-262-23258-6. [Google Scholar]
Figure 1. Development of shared cars and members in Germany by year and mode (data from Bundesverband CarSharing e.V. [17]).
Sustainability 13 07384 g001
Figure 2. Locations of the analyzed cities, by number of shared cars and offered car-sharing types as of 2015 (background image from [36], data from [37]).
Sustainability 13 07384 g002
Figure 3. Development of the number of cars per capita, title transfers per capita, and registrations of new cars per capita in the observed cities (2012 standardized to 100).
Sustainability 13 07384 g003
Table 1. Overview of the dependent variables.
DataSourceDescription
Number of carsFederal Motor Vehicle Office (Kraftfahrtbundesamt, FZ1)Number of cars owned by employees or unemployed persons on 1 January each year. Labeled “cars” in the equations.
Title transfers (used cars)Federal Motor Vehicle Office (FZ5)Number of title transfers towards employees or unemployed persons in a year.
Labeled “used_cars” in the equations.
Registration of new carsFederal Motor Vehicle Office (FZ5)Number of new car registrations by employees or unemployed persons in a year.
Labeled “new_cars” in the equations.
Table 2. Overview of the independent variables.
DataSourceDescription
Shared cars (station-based)Bundesverband CarSharing e.V. (“Städteranking“)Number of station-based shared cars on 1 July each year. Labeled “sc_station” in the equations.
Shared cars (free-floating)Bundesverband CarSharing e.V. (“Städteranking“)Number of free-floating shared cars on 1 July each year. Labeled “sc_free” in the equations.
Population densityDestatis (12411-0015 and 11111-0002), own calculationPopulation density (inhabitants per square kilometer) on 31 December each year, calculated from inhabitants and size.
Employment rateFederal Employment Agency (“Beschäftigungsquoten”)Number of employees subject to mandatory social insurance contributions relative to population aged between 15 and 65. The reporting date is June 30 each year.
CommutersFederal Employment Agency (“Gemeindedaten […] nach Wohn- und Arbeitsort“)Number of people commuting to another administrative district for work (NUTS 3). The reporting date is 30 June each year.
(Domestic) influxDestatis/Regionaldatenbank (“Fachserie 1 Reihe 1.2”)Number of people that moved into the observed city as annual total. Due to high refugee influxes in some years, probably not affecting short-run car registrations, we only use the domestic influx.
Disposable incomeDestatis/Regionaldatenbank (82411-01-03-4)Disposable income of households (including non-profit institutions), annual total.
MarriagesDestatis/Regionaldatenbank (12611-01-01-4, 12611-01-02-4)Number of marriages, annual total.
BornDestatis/Regionaldatenbank (12612-01-01-4)Number of births, annual total.
DeceasedDestatis/Regionaldatenbank (12613-01-01-4)Number of deaths, annual total.
Table 3. First difference models explaining the number of noncorporate cars.
Dependent Variable: Cars(1)(2)(3)
shared cars (station-based)−11.910 **−8.960 ***−8.826 ***
(4.871)(2.457)(2.153)
shared cars (free-floating)−5.725 ***0.109−0.096
(1.638)(0.878)(0.835)
density −0.100 ***−0.098 ***
(0.011)(0.010)
employment 0.040
(0.225)
commuters 0.300 ***0.310 ***
(0.095)(0.089)
influx −0.096 **−0.099 **
(0.047)(0.043)
disposable income −0.0002
(0.0004)
density t − 1 0.003
(0.004)
commuter t − 1 0.164 ***0.153 ***
(0.043)(0.037)
Period DummiesYesYesYes
InterceptYesYesYes
Observations105105105
R20.4960.7990.798
Adj. R20.4760.7750.781
Autocorrelation in differenced errors (α = 5%)Yes p < 0.01No p = 0.11No p = 0.11
Autocorrelation in original errors (α = 5%)Yes p < 0.01Yes p < 0.01Yes p < 0.01
Note: * p < 0.1; ** p < 0.05; *** p < 0.01.
Table 4. First difference models explaining the number of new and used car registrations (title transfers).
Dependent Variable:
New Car RegistrationsTitle TransfersBoth (New + Used)
(1)(2)(3)(4)(5)(6)(7)(8)(9)
shared cars (station-based)−1.590 ***−1.324 **−1.462 ***−0.7441.1660.916−2.334−0.158−0.084
(0.545)(0.536)(0.502)(1.779)(1.949)(2.181)(1.710)(1.905)(1.759)
shared cars (free-floating)0.2040.2290.201−2.125 **−1.017−1.297−1.920 **−0.788−0.899
(0.224)(0.261)(0.255)(0.834)(0.965)(1.069)(0.974)(1.188)(1.114)
density −0.001 −0.010 **−0.014 *** −0.011 **−0.011 **
(0.002) (0.004)(0.005) (0.005)(0.005)
employment −0.008 −0.319 * −0.327 *−0.336 *
(0.053) (0.164) (0.199)(0.194)
commuters 0.041 **0.038 ** 0.090 * 0.131 **0.127 **
(0.018)(0.018) (0.047) (0.055)(0.053)
influx −0.027 *−0.026 * 0.033 0.005
(0.015)(0.014) (0.035) (0.044)
disposable income −0.00000 −0.0001 −0.0001
(0.0001) (0.0003) (0.0003)
marriages −0.233 0.029 −0.204
(0.232) (0.429) (0.529)
born 0.298 **0.290 ** 1.366 ***1.535 *** 1.664 ***1.675 ***
(0.140)(0.140) (0.367)(0.368) (0.424)(0.427)
deceased 0.062 1.056 **0.899 ** 1.118 **1.079 **
(0.176) (0.420)(0.449) (0.501)(0.511)
Period DummiesYesYesYesYesYesYesYesYesYes
InterceptYesYesYesYesYesYesYesYesYes
Observations105105105105105105105105105
R20.7030.7380.7340.5870.6870.6640.2670.4430.442
Adjusted R20.6910.7040.7150.5700.6460.6390.2380.3700.389
Autocorrelation in differenced errors (α = 5%)Yes p = 0.02Yes p = 0.03Yes p = 0.02No p = 0.12No p = 0.59No p = 0.91No p = 0.79No p = 0.06No p = 0.07
Autocorrelation in original errors (α = 5%)Yes p = 0.02Yes p = 0.02Yes p = 0.02Yes p < 0.01Yes p < 0.01Yes p < 0.01Yes p < 0.01Yes p < 0.01Yes p < 0.01
Note: * p < 0.1; ** p < 0.05; *** p < 0.01.
Publisher’s Note: MDPI stays neutral with regard to jurisdictional claims in published maps and institutional affiliations.

