Article

Evaluation of Outdoor Particle Infiltration into Classrooms Considering Air Leakage and Other Building Characteristics in Korean Schools

Department of Architectural Engineering, Graduate School, University of Seoul, Seoul 02504, Korea
*
Author to whom correspondence should be addressed.
Sustainability 2021, 13(13), 7382; https://doi.org/10.3390/su13137382
Submission received: 15 April 2021 / Revised: 5 June 2021 / Accepted: 22 June 2021 / Published: 1 July 2021
(This article belongs to the Special Issue Air Circulation and Indoor Air Quality)

Abstract

:
We analyzed the effects of air leakage and other building characteristics on outdoor particle penetration in classrooms. The building characteristics including air leakage of 12 Korean schools were investigated, and onsite measurements were conducted to estimate the outdoor particle infiltration. The correlations among variables associated with air leakage and building characteristics and outdoor particle infiltration were analyzed using the Pearson correlation analysis and linear regression. The effective leakage area (ELA) of classrooms varied highly from 340.8–1566.9 cm2, and a significant disparity in the air leakage characteristics among the classrooms appeared. The results of onsite measurement revealed that the average ELA was larger in the corridor side with an ELAcorridor-side of 264.7 cm2 than in the outdoor side (ELAoutdoor-side of 93.1 cm2). Results of correlation analysis indicated a high correlation (r = 0.68~0.78, p-value < 0.05) between the size resolved outdoor particle source (P × λ) and specific ELA. Particularly, a strong linear relation (R2 = 0.69~0.71) with specific ELAcorridor-side was seen. Results suggest that cracks between windows and doors in the corridor side considerably affect outdoor particle penetration. These results indicate the importance of improving the airtightness of not only the building envelope but also the inter-zonal walls for effectively reducing the outdoor particle infiltration into classrooms.

1. Introduction

With increasing outdoor particle concentration, interest in reducing health risks of respiratory and cardiovascular systems due to exposure to particulate matters is growing [1,2]. In particular, children and adolescents having incomplete immune systems and lower weights than those of adults react more sensitively when exposed to equivalent particulate matters [3,4,5,6]. Classrooms have a high occupancy density with 20–30 students staying for long hours in areas of approximately 46–68 m2 [7,8,9]. Additionally, students may be exposed to a high particle concentration as they spend 8–10 h in classrooms per day [10,11,12,13,14]. Previous studies on particle concentration in classrooms and students’ health and academic achievement demonstrated that the particle concentration in classrooms adversely affects their health and academic performances [15], thereby leading to lower attendance rates and intelligence quotient (IQ) [16]. Accordingly, assessing the particle concentration in classrooms is important for managing the indoor air quality where children and youth vulnerable to particles stay.
The particle concentration in classrooms is affected by both indoor and outdoor sources such as indoor generation and resuspension from students’ indoor activities or outdoor particle penetration through building cracks. In some studies, it was found that the particles of the latter can be more harmful than those of the latter [17,18,19]. In particular, Zwoz’dziak et al. [19] analyzed the component of PM2.5 in classrooms and found high contents of Zn, Pb and S, which have an adverse effect on children’s health. Such components were found to originate from the high concentration of outdoor particles. Abt et al. [20] reported that 20–43% of indoor particles of 2–10 μm size and 63–92% of indoor particles of 0.2–0.3 μm size entered from outside. By investigating the characteristics of 34 classrooms in Korea in a study, over 65% of the classrooms were in more than 50 year old buildings [9], and thus it is highly likely that outdoor particles will penetrate through cracks of such buildings.
Previous studies have suggested that the outdoor particle infiltration is associated with air leakage and other building characteristics such as construction year and floor area [21,22,23,24]. Chao et al. [21] and Choi and Kang [23] presented that outdoor particles mainly penetrate through cracks in the exterior walls and exterior window frames in multifamily residential buildings. Stephens and Siegel [25] analyzed the correlation between outdoor ultrafine particle penetration and air leakage in exterior walls and building characteristics in single family residential buildings and observed a strong correlation between outdoor particle sources and leakage test results.
Unlike residential buildings, classrooms have a corridor on one side and an exterior on the other [26]. The corridor-side window or walls act as a barrier between the exterior and classroom. Especially, schools have a larger area connected to inter-zonal components such as corridors, lobbies, and entrance halls compared to that of residential buildings. As these inter-zonal components is indirectly associated with ambient conditions, the indoor-outdoor particle transport characteristics in classrooms may differ from those in residential buildings.
The objectives of this study are to analyze the effect of air leakage of both exterior walls and inter-zonal walls and other building characteristics on outdoor particle infiltration in classrooms. On-site experiments were carried out at 12 schools to measure particle infiltration and air leakage characteristics, and a statistical analysis was carried out to analyze the effect of air leakage and other building characteristics for size-resolved particles on outdoor particle infiltration. The analytical results can contribute to developing effective school construction guidelines for reducing indoor particles in classrooms.

2. Methods

2.1. Study Design

To analyze the effect of air leakage and other building characteristics of classrooms on outdoor particle infiltration, 10 elementary schools and two middle school classrooms, expected to have different classroom sizes and air leakage characteristics, were selected. The experiments were performed in a single classroom for each school. Air leakage and outdoor particle infiltration testing were conducted from January 2018 to November 2020. In particular, they were performed focusing on spring and winter seasons when the outdoor particle concentration is high in Korea [27]. Therefore, changes in outdoor particle concentration by season were not considered in the analysis. In addition, to estimate the penetration coefficient (P) and deposition loss rate (k) assuming no generation and resuspension of indoor particle, measurement were performed in the afternoon after class when the students were not occupied. For the correlation analysis, several variables associated with air leakage characteristics, other building characteristics, and outdoor particle infiltration were selected. (1) As variables related to air leakage characteristics, effective leakage area (ELA), specific ELA, air change per h at 50Pa (ACH50), flow coefficient (C), and flow exponent (n) in the power-law expression were selected, and the data were collected through field experiments in classrooms to investigate the analytical variables (2) As variables related to other building characteristics, built year, floor area, envelope area, and frame material were selected, and the values of these variables were investigated through field measurement. (3) As variables related to outdoor particle infiltration, penetration coefficient (P), deposition loss rate (k), and outdoor particle source (P × λ) were selected. A normality test of variables was performed to assess whether the measured data could fit the normal distribution. The correlations among the data were analyzed using Pearson correlation and linear regression analyses.

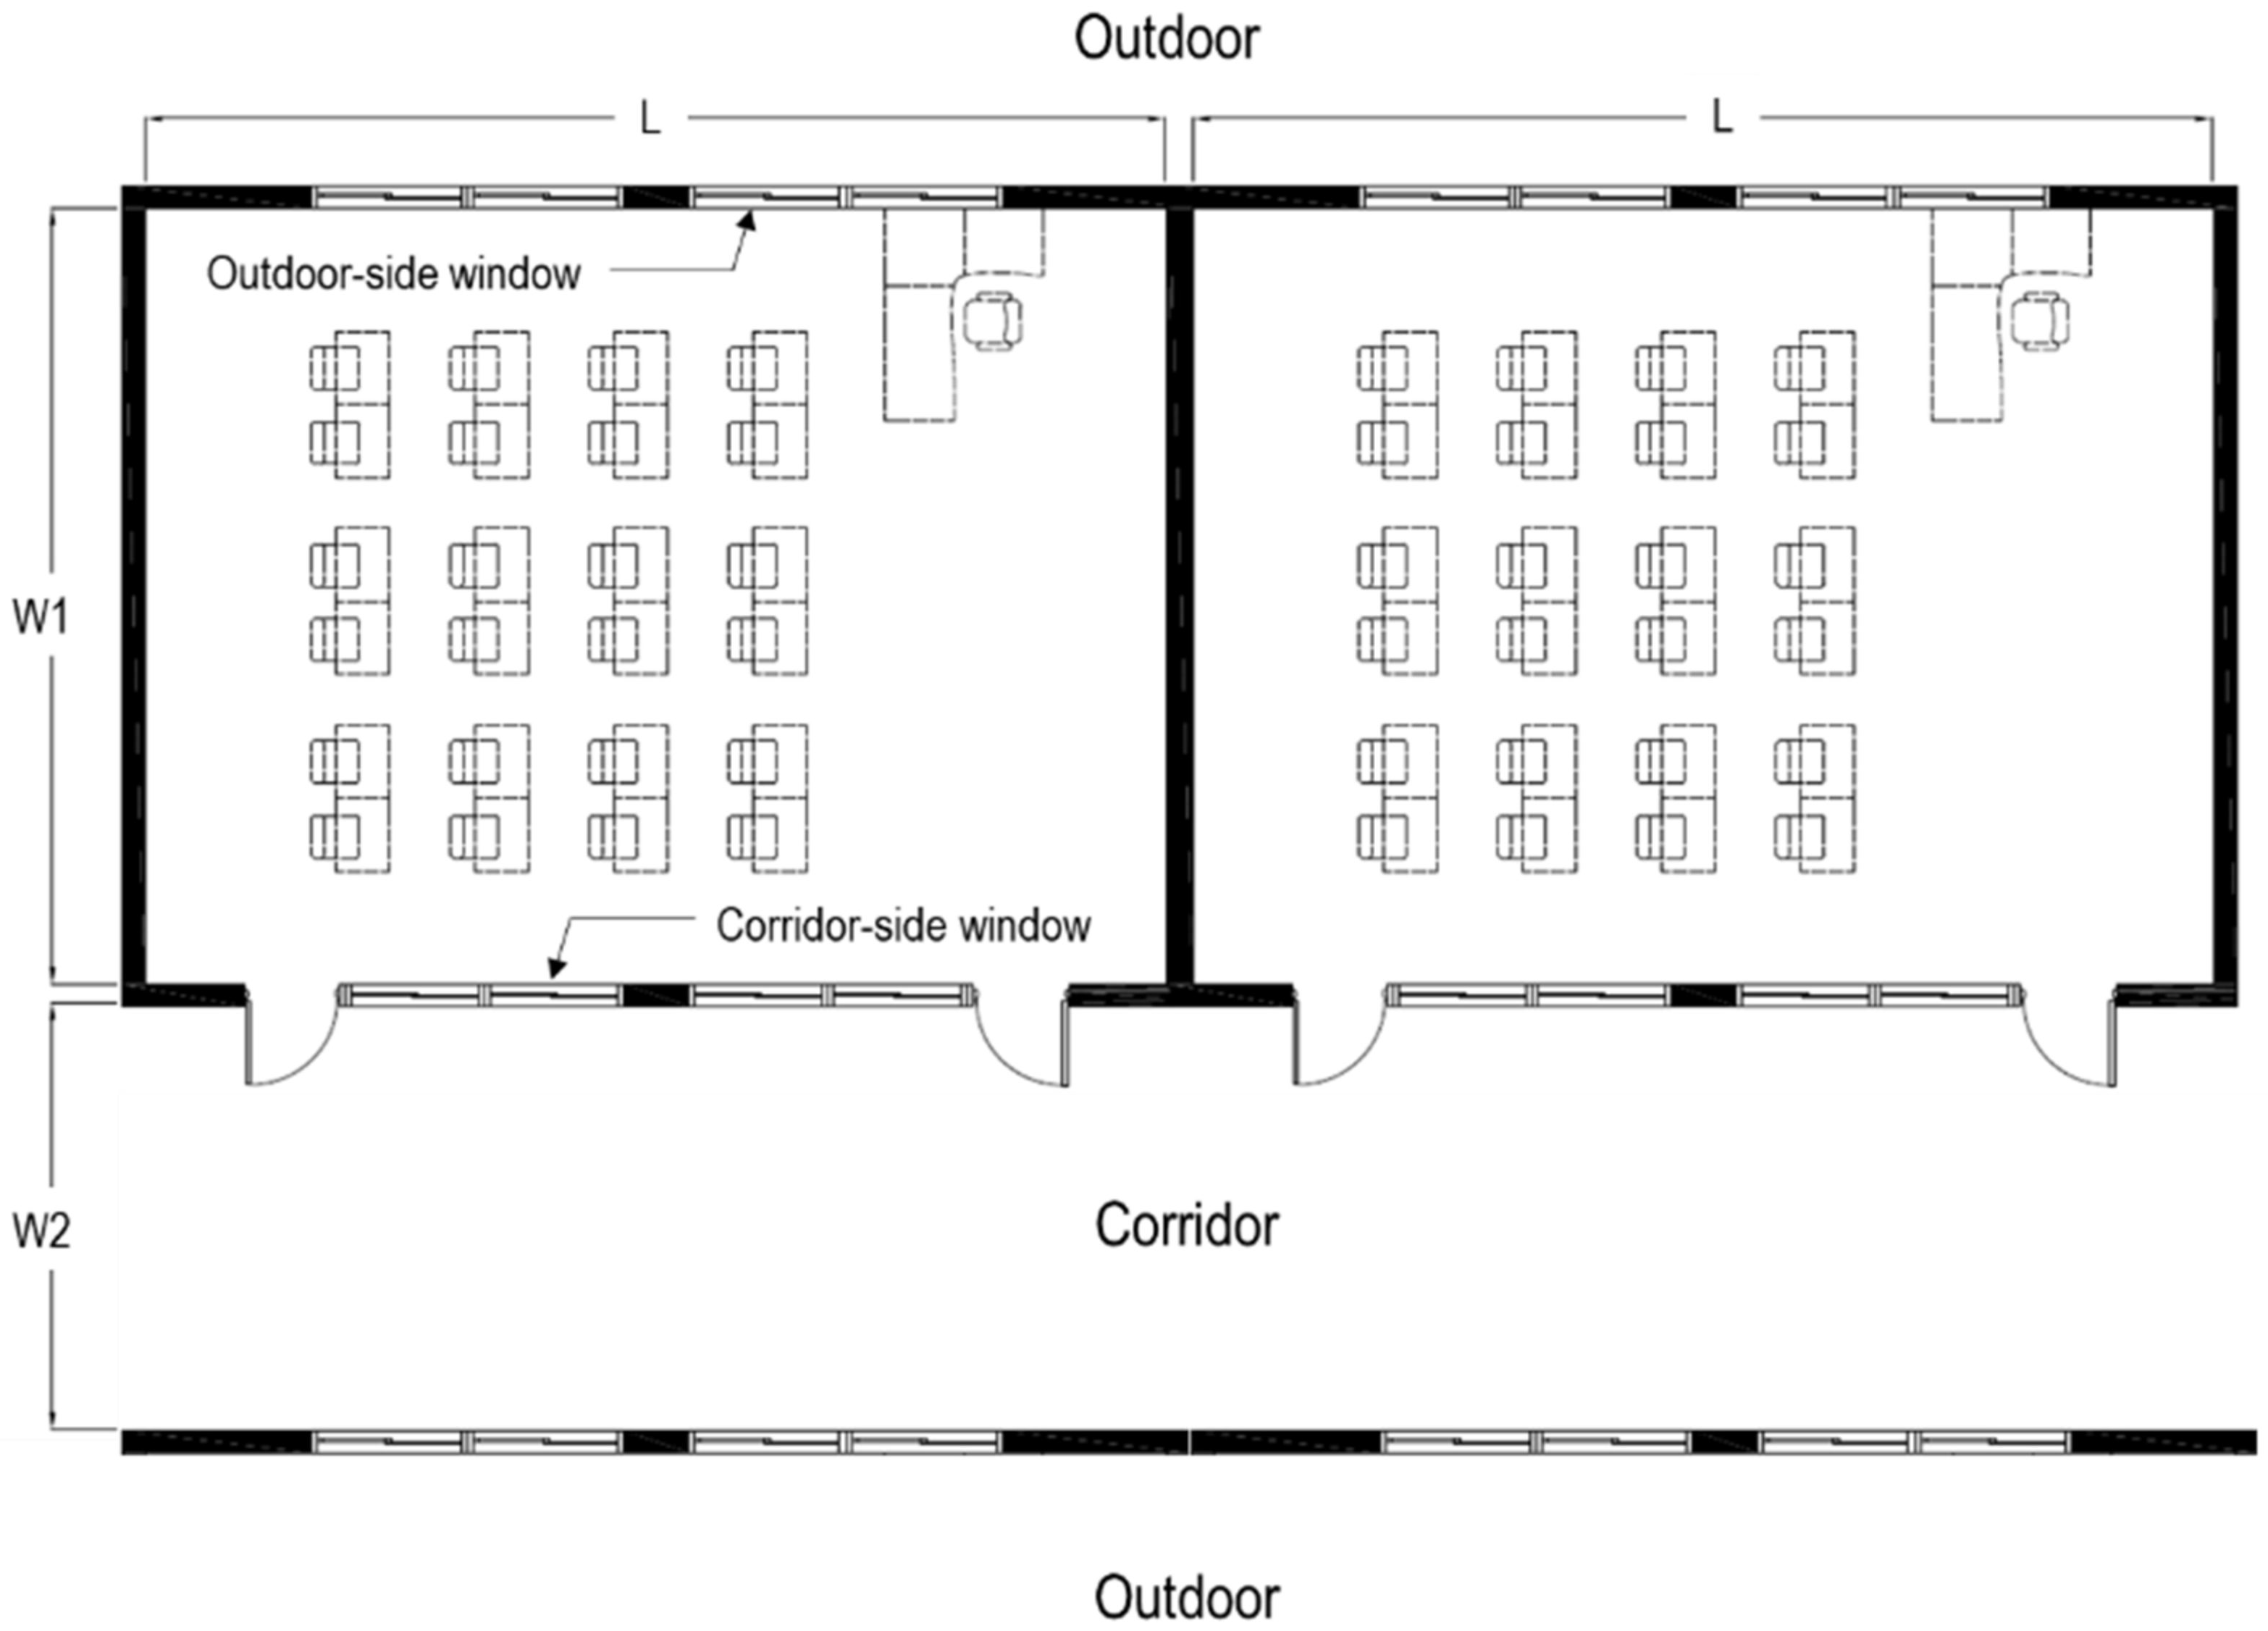
2.2. Description of Classrooms

Figure 1 shows the general configuration of the target classrooms. Classrooms in Korea generally face a corridor on one side and have a rectangular plan where the length is larger than the width. As the investigated classrooms have similar dimensions, the relevant factors such as floor areas, volume, and so on were not considered in the analysis. The characteristics of classrooms are summarized in Table 1. The 12 schools are located in Seoul and Gyeonggi-do in Korea and built with bricks or reinforced concrete structures, which were constructed in 1937–1998, and the average construction year was 1966. Nine of the 12 schools underwent renovation such as exterior window and door replacements between 1992 and 2019. The floor areas of 10 elementary school classrooms (A–J) are between 58.8–70.6 m2 with an average of 63.2 m2, while the floor areas of two middle school classrooms (K, L) are 90.8 m2, approximately 1.44 times that of the former. The floor area of the elementary classroom was similar to that of the previous study [7,8,9]. The floor height of classrooms is 2.5–2.9 m. The number of students per classroom is 16–28 with an average of 24 students.

2.3. Air Leakage Testing Method

The leakage area in the 12 classrooms was analyzed according to the outdoor particle penetration pathway and air leakage characteristics using the blower door testing method [28]. A blower door (Retrotec EU6101 with DM32, Retrotec, USA) was used for the measurement, and the measurement error of air volume was ±5%. The blower door was installed at the front or back door due to easy installation and control of power supply. The airflow rate was measured at a specific difference between indoor and outdoor pressures, which are related as shown in Equation (1):
Q = C Δ P n
where Q is the airflow rate through the building envelope (m3·h−1), C is a flow coefficient (m3·h−1·Pa-n), and n is a flow exponent (dimensionless).
C is correlated to the total leakage area in building envelope, and n varies from 0.5 to 1.0 according to the flow regime.
Based on the measurement results, the effective leakage area at 4 Pa (ELA) and air change per h at 50 Pa (ACH50) were calculated using Equations (2) and (3). To calculate the ELA by outdoor particle penetration pathway, the building envelope, window, and door frame, which are expected to be the main pathway, were sealed. After sealing, the blower door pressurization and depressurization test were conducted. The pressurization and depressurization tests were repeated as the seals removed sequentially. In addition, the specific ELA, which is defined as the measured ELA divided by the floor area as follows, was used to compare the degree of leakage for classroom of the different floor area.
E L A = C Δ P r e f n 0.5 ρ 2
A C H 50 = Q 50 V
where ELA is the effective leakage area (m2), Pref is a reference pressure (4 Pa) and ρ is the air density (assumed as 1.2 kg/m3). ACH50 is the air changes per hour at 50 Pa (h−1), Q50 is the airflow rate at 50 Pa (m3·h−1), and V is the classroom volume (m3).

2.4. Outdoor Particle Infiltration

To analyze the characteristics of outdoor particle infiltration into classrooms, we estimated the penetration coefficient (P) and deposition loss rate (k) using the natural decay method [21,29]. This method is to solve the mass balance equation under dynamic conditions without indoor particle generation. Penetration coefficient (P) is a dimensionless coefficient representing the rate of outdoor particle penetration into a room through the building envelope and ranges from 0 to 1. Deposition loss rate (k) is the rate of particles deposition loss onto interior surface and is positive.
The field measurement procedure is as follows. Before measurement, the classrooms were ventilated by opening windows to increase the indoor particle concentration level to the same as the outdoor particle concentration level. Figure 2 represents the outdoor particle number concentration during the outdoor particle infiltration test. The outdoor particle infiltration test was performed when the outdoor particle number concentration of 0.3 μm particles was at least 1 × 10⁵/m3. After increasing the indoor particle concentration, the windows were closed to naturally decrease it [29]. The indoor and outdoor particle number concentrations were measured using the optical particle counters TSI9306-v2 (TSI, USA), which has six channels for detecting the concentration number of size-resolved particles (0.3–0.5, 0.5–1.0, 1.0–3.0, 3.0–5.0, 5.0–10.0, >10.0 µm). The flow rate of TSI9306-v2 was 2.83 L/min with a ±5% accuracy. The optical particle counters were calibrated within one year from the measurement period by the qualified testing agency.
At a sampling interval of 1 min during the experiment periods, the indoor particle number concentration was measured at the classroom center and 1.2 m above the floor. The outdoor particle number concentration was measured at a location unaffected by direct radiation when opening the outdoor-side window of the adjacent classroom. To minimize the indoor particle generation and resuspension, the experiment was performed in the empty classroom. During the experiment, the mechanical ventilation system was not operated and naturally ventilated. In addition, in the case of classrooms equipped with a mechanical ventilation system, air-tight tapes were used to seal the supply diffuser and return grills. To secure repeatability, experiments to estimate P and k were conducted three times in nine school classrooms, except for classrooms A to C. There, the experiment was conducted only once due to limited school access.
The penetration coefficient (P) and deposition loss rate (k) were estimated using the indoor and outdoor particle concentration results over time based on the law of mass conservation (Equation (4)) assuming no indoor particle generation and resuspension.
The air change rate (AER, λ) was estimated using the tracer-gas method [30] with carbon dioxide (CO2), while reducing the indoor particle concentration. The CO2 concentration was measured using the IAQ-CALC TSI 7545(TSI, USA). CO2 gas injected till the indoor CO2 concentration of 1500 ppm, and a well-mixed condition was reached.
A significant estimation error appeared due to a small number of particles with sizes of 10 µm or larger measured when estimating P and k by particle size. Thus, the size-resolved particle P and k were estimated using the data of five particle sizes, except for particle sizes >10 µm using the following equation:
d C i n d t = P λ C o u t λ + k C i n
where Cin = indoor particle number concentrations (counts/m3), t = time (h), P = penetration coefficient (dimensionless), λ = air exchange rate (AER, h−1), Cout = outdoor particle concentration (counts/m3), and k = indoor particle deposition loss rate (h−1).
In Equation (4), all the variables except the penetration coefficient (P) and deposition loss rate (k) are obtained from field measurement. When Cout and AER are assumed to be constant, it can be expressed as an exponential particle decay profile as shown in Equation (5). The penetration coefficient and deposition loss rate were estimated by fitting the measured particle number concentration value into the equation using the curve fitting toolbox of MATLAB.
C i n = P λ C o u t λ + k + C i n t P λ C o u t λ + k e λ + k t
where Cint = initial indoor particle number concentration.

2.5. Statistical Analysis

In this study, the effects of air leakage and other building characteristics on outdoor particle infiltration were analyzed in 12 classrooms. For correlation analysis, SPSS 26.0 was used.

2.5.1. Normality Test

The normality of the measured data was tested using the Kolmogorov-Smirnov and Shapiro-Wilk test methods, and the test results are provided in Table A1. The number of samples of P and k was 12, and the average value estimated in each classroom was used. The results of P and k of size-resolved particles were observed to follow a normal distribution with a significance level (α) of 0.05 or higher, except for the significance level of P between 0.3 and 0.5 μm, which was 0.042, close to 0.05. Thus, normality was achieved because the significance level in the Kolmogorov-Smirnov test between the two testing methods was satisfied.

2.5.2. Correlation Coefficient

To analyze the correlations among the measured data, the Pearson analysis that analyzes correlations among variables having linear relations was conducted. The correlation was analyzed by calculating significance levels and correlations, and the statistical significance was verified.
The Pearson analysis is a statistical analysis method for analyzing the linear correlation between two variables and verifying its statistical significance. The correlation coefficient (r), calculated using Equation (6), ranges from −1 to 1, and a high relation is implied when its absolute value is close to 1. Thus, a strong relation between two parameters with correlation coefficient of 0.7 can be considered [31]. In addition, the statistical significance of correlation analysis result can be verified based on the significance level (p-value) calculated through a t-test between two variables. When the p-value is less than 0.05, the result is statistically significant. The equation for correlation coefficient is as follows:
r = i = 1 n x i x ¯ y i y ¯ n 1 S x S y
where r is the correlation coefficient, x ¯ is the mean of sample x, y ¯ is the mean of sample y, n is the number of samples, Sx is standard deviation of sample x, and Sy is the standard deviation of sample y.

3. Results and Discussion

3.1. Building Characteristic of Classrooms

The building characteristics of 12 classrooms such as mechanical ventilation system, envelope area, and window material and size are summarized in Table 2. Five of the 12 classrooms have a mechanical ventilation system, while three of them have a heating, ventilation and air-conditioning (HVAC) system including supply and return ductwork. The remaining two classrooms have a heat recovery ventilator (HRV) without ductwork.
The envelope areas of 10 classrooms (A–J) range between 19.0–25.5 m2, with an average of 22.8 m2, and two classrooms (K, L) have an average envelop area of 33.9 m2. All the 12 classrooms have wide exterior windows (average 12.4 m2) approximately 2.5 times the area of corridor windows (average 5.0 m2), and thus high outdoor particle penetration through the exterior windows is expected.
Schools that underwent renovation replaced the exterior windows, and the renovation year was surveyed. Ten classrooms have PVC window frame, while five of them have double glazing window made of PVC and steel or PVC and aluminum. The window frames on the corridor side have less PVC applications than exterior windows. Only two classrooms have PVC window frames on the corridor side, and eight classrooms have wooden window frames. Hence, the exterior windows are expected to have better airtightness than the corridor windows. The main materials of classroom doors are aluminum frame and wood, and PVC is used in two classrooms.

3.2. Air Leakage Characteristics of Classroom

The air leakage characteristics of the 12 classrooms measured using the blower door pressurization and depressurization test method are provided in Table 3. These characteristics were analyzed through C, n, ELA, ACH50, and specific ELA according to leakage pathways. The specific ELA was analyzed by dividing it into specific ELAoutdoor-side and specific ELAcorridor-side based on ELAoutdoor-side and ELAcorridor-side calculated in the main expected leakage pathway.
The flow exponent (n) was calculated to be between 0.55–0.71, which seemed reasonable given the flow exponent range (0.6–0.7) of general building cracks. The ACH50 of classrooms appeared in a wide range of 9.1–24.8 h−1, with an average of 16.0 h−1, which is lower than the airtightness of residential buildings (6.1 h−1, Choi & Kang [24]; 12.7 h−1, Stephen & Sigel [25]).
ELAtotal was calculated to vary widely as 340.8–1566.9 cm2 with an average of 685.9 cm2, thus showing a large difference in the leakage area of classrooms. The result of ELA according to leakage pathway in the 12 classrooms showed an average ELAoutdoor-side of 15% of ELAtotal., while the average ELAcorridor-side was 39%., indicating that the windows on the corridor side have a larger leakage area. It seems that the ELA is affected by the materials of window frame and door, and renovation of classrooms, given that the installation ratio of PVC window frame of outdoor side with a better airtightness than wood is high. The ELAother, which represents the ELA of other elements excluding the window and door, was 76% of ELAtotal, implying a large leakage area due to airflow rate between adjacent classrooms or cracks in the finishing materials of ceiling textile.
The specific ELA of the most airtight classroom H (ACH50 = 9.1 h−1) was 5.3 cm2/m2, and that of classroom K (ACH50 = 22.5 h−1), which was approximately 2.5 times less airtight than classroom H, was 17.4 cm2/m2, approximately 3.3 times larger than that of classroom H. In particular, classrooms I and J had similar airtightness, with ELA of 514.8 and 511.6 cm2 and ACH50 of 11.8 and 11.3 h−1, respectively. On the contrary, ELAoutdoor-side and specific ELAcorridor-side were 1.5 and 5.4 cm2/m2 (classroom I), and 3.6 and 3.2 cm2/m2 (classroom J), respectively, suggesting that the primary penetration pathway of outdoor particles will vary by classroom.

3.3. Outdoor Particle Infiltration

Table 4 provides a summary of the size-resolved particle penetration coefficient (P) and air exchange rate (AER, λ) measured in each classroom. The analysis result showed that the arithmetic mean and standard deviation (A.M., ± s.d) of estimated value of P0.3–0.5 is 0.80 ± 0.28, P0.5–1.0 is 0.75 ± 0.30, P1.0–3.0 is 0.60 ± 0.25, P3.0–5.0 is 0.57 ± 0.28, and P5.0–10.0 is 0.51 ± 0.25. Larger the particles, the smaller was the penetration coefficient, which is consistent with the result of previous studies [8,32,33]. It indicates that a small fraction of particles (0.3–0.5 μm) is easiest to enter indoors through the crack in the building envelope, and the indoor particle concentration has a high proportion of small particles.
The penetration coefficient of particles larger than 5.0 μm appeared to be small because interception, impaction, or gravitational settling are the major particle loss mechanisms of these large particles. In some classrooms (D and K), the penetration coefficient appeared to be large for a small fraction (0.3–0.5 μm). This is because the outdoor particle concentration was smaller than the indoor concentration at the time of measurement, and at the 2nd measurement in classroom K, the AER was calculated as 0.97 seemingly because a school administrator opened the classroom windows during the measurement. This balanced the indoor and outdoor concentration, causing an error. The mean value of AER was 0.41 ± 0.13 h−1.
Table 5 presents the deposition loss rate (k) of size-resolved particles of 12 classrooms in this study, which have a range of 0.22–1.03 h−1. This implies a particle sink effect corresponding to 0.54–2.51 times the average AER (0.41 h−1) of the 12 classrooms. This result indicates that the deposition loss rate is a significant factor affecting the particle sink within classrooms. The analytical result of arithmetic mean and standard deviation (A.M. ± s.d) of deposition loss rate by particle size showed that k0.3–0.5 is 0.22 ± 0.23 h−1, k0.5–1.0 is 0.30 ± 0.25 h−1, k1.0–3.0 is 0.32 ± 0.19 h−1, k3.0–5.0 is 0.65 ± 0.26 h−1, and k5.0–10.0 is 1.03 ± 0.25 h−1. The deposition loss rate was particle-size dependent, which show a similar trend to the result of previous studies on deposition loss rate by particle size [8,21,33,34,35]. However, the estimated value of k by particle size differed from the previous studies [21,33,34,35]. The deposition loss rate of the previous studies was estimated from residential buildings and varied according to indoor surface material and roughness [35,36], the amount of indoor surface area [37], and particle density.
By contrast, a study on deposition loss rate by particle size in a classroom of elementary school [8] deduced deposition loss rates of k0.3–0.5 = 0.16 h−1; k0.5–1.0 = 0.16 h−1; k1.0–2.0 = 0.33 h−1; k2.0–5.0 = 0.69 h−1; k5.0–10.0 = 1.32 h−1, similar to the result of this study. This is because features used [8] were similar to those in our study: classroom area (about 59 m2), material of the indoor surface and window frame (wall: painting; window frame: wood and single glazing window), and students’ desk and chair materials (wood framed by metal).

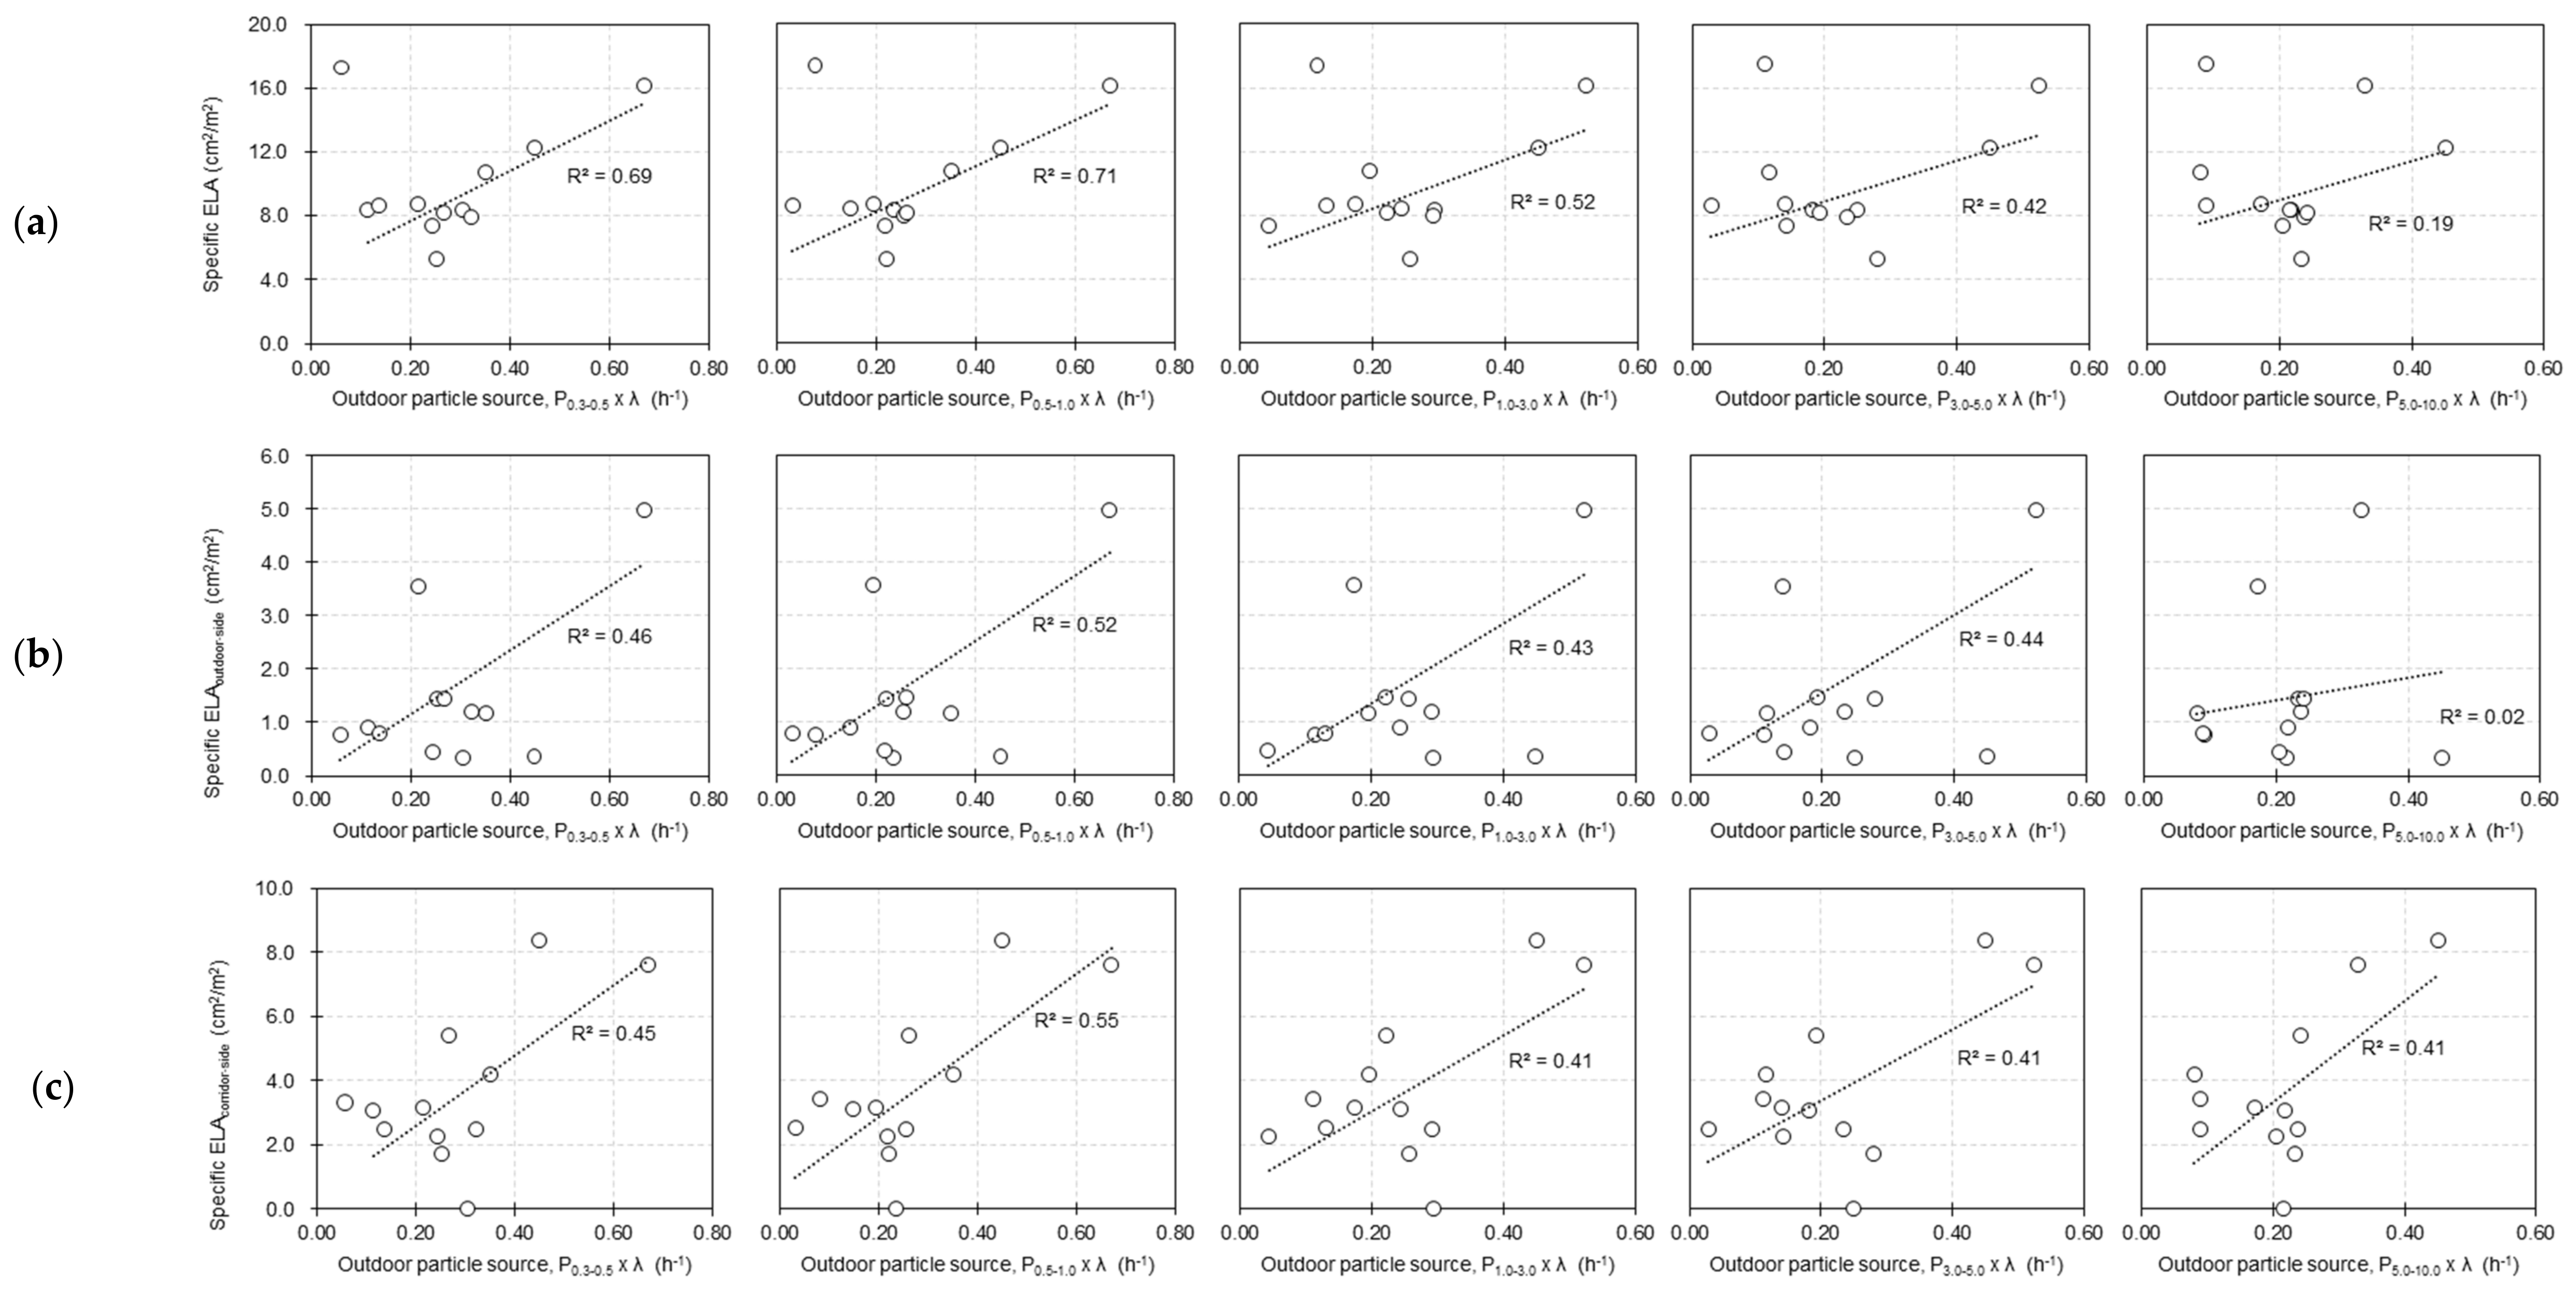
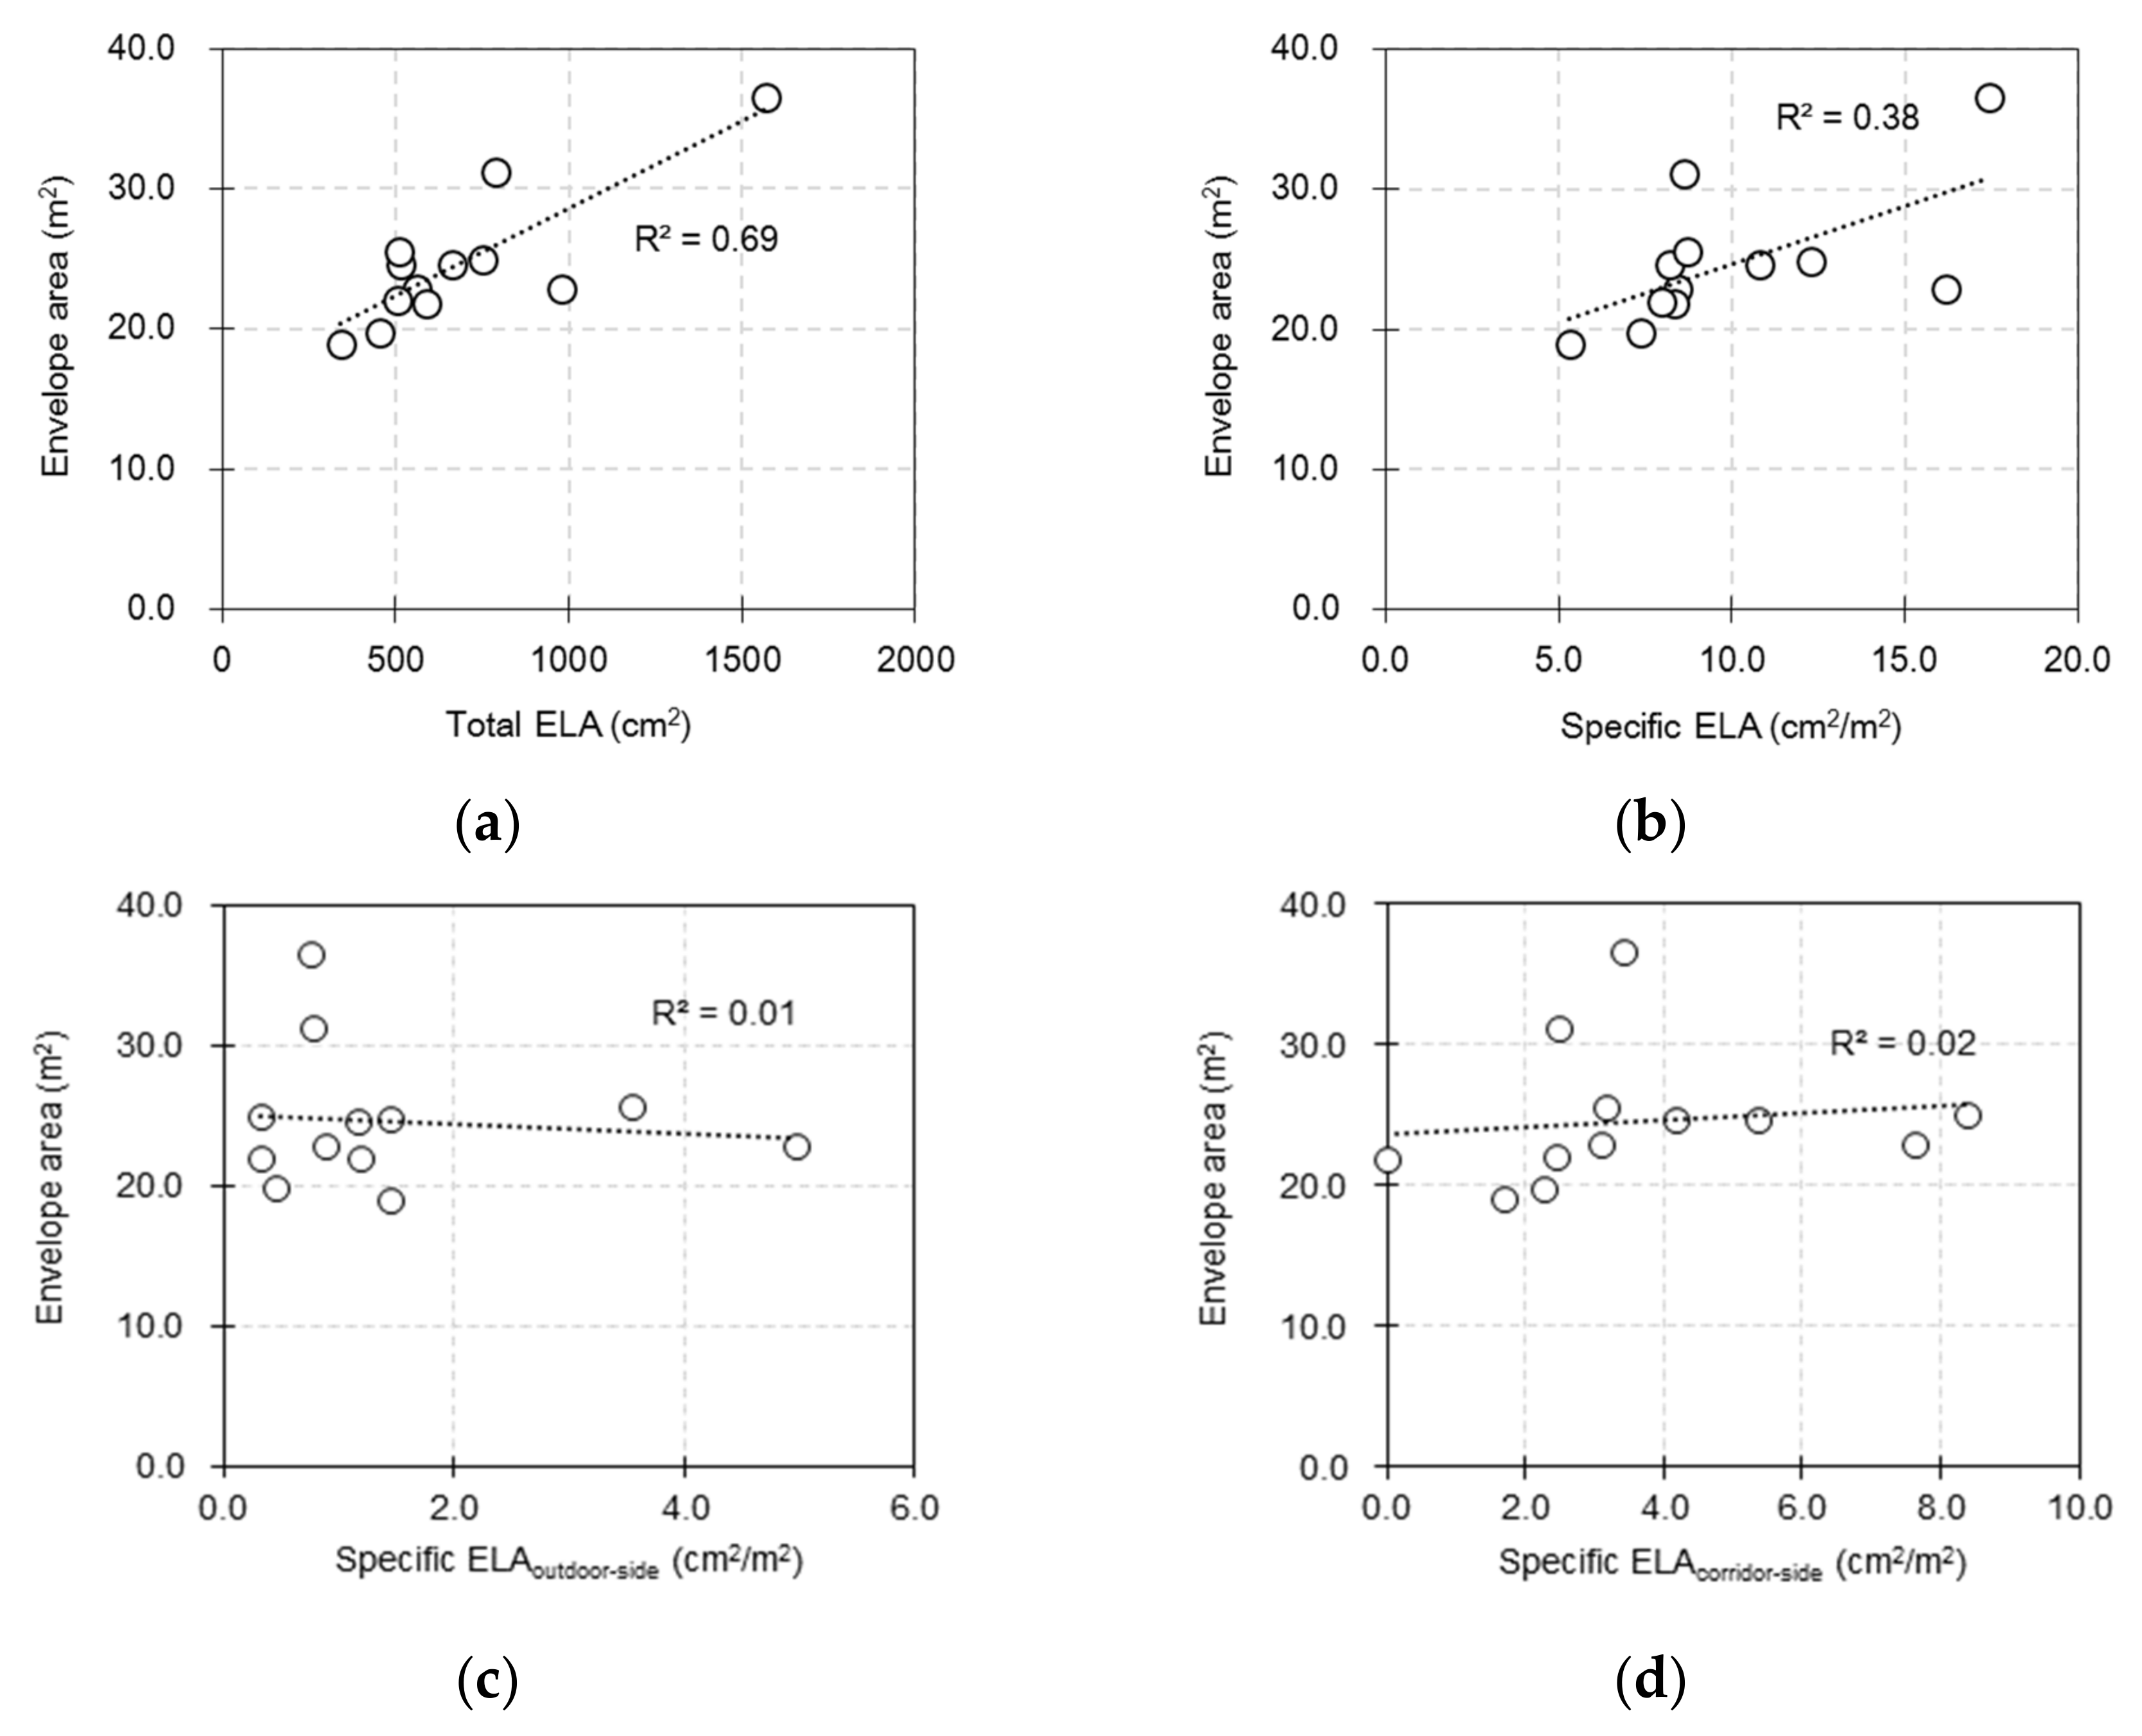
3.4. Relationship between Air Leakage Characteristics, Other Building Characteristics, and Outdoor Particle Infiltration

The Pearson correlation analysis was conducted to analyze the effects of air leakage characteristics (C, n, ACH50, ELA, and specific ELA) and other building characteristics (built year, floor area, volume, and envelope area) on size-resolved outdoor particle penetration.
The results of correlation analysis are provided in Table 6, Table 7 and Table 8. Table 6 indicates a high correlation between the size-resolved outdoor particle source (P × λ) and air leakage characteristic (specific ELAcorridor-side). As for the correlation coefficient between the outdoor particle source (P × λ) and total ELA, r0.3–0.5 was −0.070, r0.5–1.0 was −0.002, r1.0–3.0 was 0.027, r3.0–5.0 was 0.014, and r5.0–10.0 was −0.196, indicating almost no correlation. As for the correlation coefficient between the outdoor particle source and specific ELAcorridor-side, r0.3–0.5 was 0.705, r0.5–1.0 was 0.777, r1.0–3.0 was 0.727, r3.0–5.0 was 0.721, and r5.0–10.0 was 0.680, and the p-value was 0.05. Thus, a statistically significant relationship was seen. The results demonstrate that outdoor particle penetration in classrooms is likely to occur through the leakage pathway in corridors due to the fact that ELAcorridor-side is larger than ELAoutdoor-side. Corridors are easily connected to exterior through school doors, lobbies, and staircases, and thus the particle concentration in corridors may be as high as that outdoor. Consequently, renovating corridor windows as well as exterior windows needs to be considered to reduce outdoor particle penetration and improve airtightness of school classrooms.
Table 7 shows that there is no significant correlation between the deposition loss rate (k) and air leakage and other building characteristics, while Table 8 shows a high correlation between the envelope area, ELAtotal, and specific ELAtotal. The correlation coefficients (r) between the envelope area and ELAtotal and between the envelope area and specific ELAtotal were 0.831 and 0.615, respectively, and the p-values were 0.01 and 0.05, respectively. These results indicate that a larger envelope area increases the ELA.
Figure 3 and Figure 4 show the results of linear regressions of the factors having a high correlation. In this study, the Durbin-Watson test, used in autocorrelation analysis of residual variables, was performed. The range of the value of Durbin-Watson test was 1.339–2.106. This value is near or around 2, which indicates is no autocorrelation of error. Figure 3 provides a plot of the linear relation between the size-resolved outdoor particle source and three specific ELA parameters (specific ELAtotal., specific ELAoutdoor-side, and specific ELAcorridor-side). A strong linear relationship (R2 = 0.69 and 0.71) was observed between the outdoor particle sources of small particle size (0.3–0.5 and 0.5–1.0 μm, respectively). In the results of linear relations between the size-resolved outdoor particle source and ELA parameters, a sharp weakening of linear relation was observed between the outdoor particle source of particle sized 5.0–10.0 μm and the parameters, except for specific ELAcorridor-side. This implies that specific ELA calculated using the blower door in school classrooms can be utilized to estimate an outdoor particle source having small sizes. These results are similar to the results (PM2.5 outdoor particle source vs. ELA, R2 = 0.78) of Stephens & Siegel [25] on linear relations between an ELA measured in residential buildings and outdoor particle sources. Between the size-resolved outdoor particle source and specific ELAcorridor-side, a weak linear correlation (R2 = 0.41~0.55) was observed, unlike the Pearson correlation analysis where a high correlation coefficient (r = 0.68–0.78, p-value < 0.05) was obtained.
Figure 4 shows the analysis results of linear relations between the envelope area and ELA, and three specific ELA parameters. The envelope area has a high correlation (R2 = 0.69) with the ELA, whereas it has a weak or nearly no linear relation with the specific ELA parameters. Since this is a basic study to analyze which parameters of air-leakage characteristics and other building characteristics are correlated with the outdoor particle infiltration, a simple regression analysis was performed. Moreover, although the variables evaluated here were presented as major variables in previous studies [21,22,23,24], there may be confounding factors. In future, we plan to develop a predictive model for the outdoor particle infiltration of classrooms by performing multicollinearity and sensitivity tests of parameters.
Consequently, Table 6 and Table 7 show no significant correlation between the penetration coefficient (P) of classrooms and air leakage and other building characteristics. Such results are similar to those of previous studies (Liu & Nazzaroff [38,39]) that presented the particle size and crack height as primary determinants of particle penetration than the leakage area in a certain pressure range (4–10 Pa) using a chamber test. However, given an outdoor particle source in a small particle size range has a linear relation with the specific ELA parameters as shown in Figure 1, the particle penetration of small particle size seems to be affected by specific ELA. The results demonstrate that the outdoor particles penetrating classrooms have mostly a small size range, and that the particle penetration of such small particles should be analyzed when assessing the students’ hazards of exposure to outdoor particles.

4. Conclusions

In this study, the relationship among air leakage characteristics, other building characteristics, and outdoor particle penetration was analyzed. Furthermore, the air leakage characteristics of classrooms were analyzed, and the penetration coefficient and deposition loss rate were estimated by measuring the airtightness and indoor and outdoor particle concentrations according to particle size.
The airtightness of 12 classrooms appeared to be lower than that of residential buildings with an average ACH50 of 16.0 h−1. As expected, the estimated value of P by particle size demonstrated that larger the particle size, smaller was the penetration coefficient. The deposition loss rates of 12 classrooms ranged between 0.22–1.03 h−1, indicating a particle sink effect corresponding to 0.54–2.51 times the average air exchange rate (0.41 h−1). The correlation between the size-resolved outdoor particle source (P × λ) and specific ELA was high (r = 0.68–0.78, p-value < 0.05), and in particular, that with specific ELAcorridor-side was strong (R2 = 0.69~0.71).
These results strongly suggest that airtightness of corridor-side wall and windows is an important factor for outdoor particle infiltration. As the national renovation project for deteriorated schools has been conducted in Korea, the improvement of airtightness of exterior walls has been usually considered for both reducing energy consumption and reducing indoor particle concentration. The results of this study, however, indicated that improving airtightness of inter-zonal wall should be also considered for the same purpose.

Author Contributions

Conceptualization, Y.S.E. and D.H.K.; Data curation, Y.S.E. and B.R.P.; Investigation, Y.S.E. and H.W.S.; Methodology, Y.S.E. and B.R.P.; Supervision, D.H.K.; Validation, Y.S.E. and H.W.S.; Writing—Original draft, Y.S.E. and D.H.K.; Writing—Review & editing, D.H.K. All authors have read and agreed to the published version of the manuscript.

Funding

This research was supported by the National Research Foundation of Korea (NRF) grant funded by the Korea government (Ministry of Science and ICT, MSIT; Ministry of Education, MOE) (No. 2019M3E7A1113090).

Conflicts of Interest

The authors declare no conflict of interest.

Appendix A

Table A1. Results of normality test of penetration coefficient and deposition loss rate of size-resolved particles.
ParameterParticle Size (μm)Kolmogorov-SmirnovShapiro-WilkSkewnessKurtosis
TSignificance Level (α)TSignificance Level (α)
Penetration coefficient (P)0.3–0.50.1750.200 *0.8550.0420.9770.058
0.5–1.00.1700.200 *0.9140.2380.5051.019
1.0–3.00.0990.200 *0.9810.9860.1320.474
3.0–5.00.1490.200 *0.9580.7610.1810.392
5.0–10.00.1410.200 *0.9470.5980.3341.012
Deposition loss rate (k)0.3–0.50.1630.200 *0.9330.4180.7270.357
0.5–1.00.1710.200 *0.9320.4010.5240.963
1.0–3.00.1400.200 *0.9630.8270.5780.111
3.0–5.00.1210.200 *0.9750.9530.2170.605
5.0–10.00.1440.200 *0.9290.3670.8080.291
* Significance level limit.

References

  1. Pope, C.A., III; Ezzati, M.; Dockery, D.W. Fine-Particulate Air Pollution and Life Expectancy in the United States. N. Engl. J. Med. 2009, 360, 376–386. [Google Scholar] [CrossRef] [PubMed] [Green Version]
  2. Tzivian, T. Outdoor Air Pollution and Asthma in Children. J. Asthma 2011, 48, 470–481. [Google Scholar] [CrossRef] [PubMed]
  3. Mendell, M.J.; Heath, G.A. Do Indoor Pollutants and Thermal Conditions in Schools Influence Student Performance? A Critical Review of the Literature. Indoor Air 2005, 15, 27–52. [Google Scholar] [CrossRef] [PubMed]
  4. World Health Organization. The Effects of Air Pollution on Children’s Health and Development: A Review of the Evidence; WHO: Copenhagen, Denmark, 2005. [Google Scholar]
  5. Diapouli, E.; Chaloulakou, A.; Spyrellis, N. Indoor and Outdoor Particulate Matter Concentrations at Schools in the Athens Area. Indoor Built Environ. 2007, 16, 55–61. [Google Scholar] [CrossRef]
  6. Stranger, M.; Potgieter-Vermaak, S.S.; Van Grieken, R. Characterization of indoor air quality in primary schools in Antwerp, Belgium. Indoor Air 2008, 18, 454–463. [Google Scholar] [CrossRef]
  7. Almeida, S.M.; Canha, N.; Silva, A.; Freitas, M.C.; Pegas, P.; Alves, C.; Evtyugina, M.; Pio, C.A. Children exposure to atmospheric particles in indoor of Lisbon primary schools. Atmos. Environ. 2011, 45, 7594–7599. [Google Scholar] [CrossRef]
  8. Tran, D.T.; Alleman, L.Y.; Coddeville, P.; Galloo, J.C. Indoor particle dynamics in schools: Determination of air exchange rate, size-resolved particle deposition rate and penetration factor in real-life conditions. Indoor Built Environ. 2017, 26, 1335–1350. [Google Scholar] [CrossRef]
  9. Park, J.H.; Lee, T.J.; Park, M.J.; Oh, H.; Jo, Y.M. Effects of air cleaners and school characteristics on classroom concentrations of particulate matter in 34 elementary schools in Korea. Build. Environ. 2020, 167, 106437. [Google Scholar] [CrossRef]
  10. Weichenthal, S.; Dufresene, A.; Infante-Rivard, C. Indoor ultra-fine particles and childhood asthma: Exploring a potential concern. Indoor Air 2007, 17, 81–91. [Google Scholar] [CrossRef]
  11. Zhao, Z.; Zhang, Z.; Wa, Z.; Ferm, M.; Liang, Y.; Norback, D. Asthmatic Symptoms among Pupils in Relation to Winter Indoor and Outdoor Air Pollution in Schools in Taiyuan, China. Environ. Health Perspect. 2008, 116, 90–97. [Google Scholar] [CrossRef]
  12. Cleland, V.; Timperio, A.; Salmon, J.; Hume, C.; Baur, L.A.; Crawford, D. Predictors of time spent outdoors among children: 5-year longitudinal findings. J. Epidemiol. Community Health 2010, 64, 400–406. [Google Scholar] [CrossRef] [PubMed]
  13. McConnell, R.; Islam, T.; Shankardass, K.; Jerrett, M.; Lurmann, F.; Gililand, F.; Gauderman, J.; Avol, E. Childhood Incident Asthma and Traffic-Related Air Pollution at Home and School. Environ. Health Perspect. 2010, 118, 1021–1026. [Google Scholar] [CrossRef] [Green Version]
  14. Elbayoumi, M.; Ramli, N.A.; Yusof, N.F.F.M.; Madhoun, W.A. Spatial and seasonal variation of particulate matter (PM10 and PM2.5) in Middle Eastern classrooms. Atmos. Environ. 2013, 80, 389–397. [Google Scholar] [CrossRef]
  15. Wang, S.; Zhang, J.; Zeng, X.; Zeng, Y.; Wang, S.; Chen, S. Association of Traffic-Related Air pollution with Children’s Neurobehavioral Functions in Quanzhou, China. Environ. Health Perspect. 2009, 117, 1612–1618. [Google Scholar] [CrossRef] [PubMed] [Green Version]
  16. Mohai, P.; Kweon, B.S.; Lee, S.; Ard, K. Air Pollution around Schools Is Linked To Poorer Student Health and Academic Performance. Health Aff. 2011, 30, 852–862. [Google Scholar] [CrossRef] [Green Version]
  17. Ebelt, S.T.; Wilson, W.E.; Brauer, M. Exposure to Ambient and Nonambient Components of Particulate Matter: A Comparison of Health Effects. Epidemiology 2005, 16, 227–250. [Google Scholar] [CrossRef] [PubMed]
  18. Köenig, J.Q.; Mar, T.F.; Allen, R.W.; Jansen, K.; Lumley, T.; Sullivan, J.H.; Trenga, C.A.; Larson, T.V.; Liu, L.-J. Pulmonary Effects of Indoor and Outdoor-Generated Particles in Children with Asthma. Environ. Health Perspect. 2005, 113, 499–503. [Google Scholar] [CrossRef] [Green Version]
  19. Zwozdziak, A.; Sówka, I.; Krupinska, B.; Zwozdziak, J.; Nych, A. Infiltration or indoor sources as determinants of the elemental composition of particulate matter inside a school in Wroc1aw, Poland? Build. Environ. 2013, 66, 173–180. [Google Scholar] [CrossRef]
  20. Abt, E.; Suh, E.H.; Catalano, P.; Koutrakis, P. Relative Contribution of Outdoor and Indoor Particle Sources to Indoor Concentrations. Environ. Sci. Technol. 2000, 34, 3579–3587. [Google Scholar] [CrossRef]
  21. Chao, C.Y.H.; Wan, M.P.; Cheng, C.K. Penetration coefficient and deposition rate as a function of particle size in non-smoking naturally ventilated residences. Atmos. Environ. 2003, 37, 4233–4241. [Google Scholar] [CrossRef]
  22. Shi, S.; Chen, C.; Zhao, B. Air infiltration rate distributions of residences in Beijing. Build. Environ. 2015, 92, 528–537. [Google Scholar] [CrossRef]
  23. Choi, D.H.; Kang, D.H. Infiltration of Ambient PM2.5 through Building Envelope in Apartment Housing Units in Korea. Aerosol Air Qual. Res. 2017, 17, 598–607. [Google Scholar] [CrossRef] [Green Version]
  24. Choi, D.H.; Kang, D.H. Indoor/Outdoor Relationships of Airborne Particles under Controlled Pressure Difference across the Building Envelope in Korean Multifamily Apartments. Sustainability 2018, 10, 4074. [Google Scholar] [CrossRef] [Green Version]
  25. Stephens, B.; Siegel, J.A. Penetration of ambient submicron particles into single-family residences and associations with building characteristics. Indoor Air 2012, 22, 501–513. [Google Scholar] [CrossRef]
  26. Li, Y.; Liu, X.; Qian, F.; Du, S. Ventilation effect on different position of classrooms in “line” type teaching building. J. Clean. Prod. 2019, 209, 886–902. [Google Scholar]
  27. Vellingiri, K.; Kim, K.; Ma, C.; Kang, C.; Lee, J.; Kim, I.; Brown, R.J.C. Ambient particulate matter in a central urban area of Seoul, Korea. Chemosphere 2015, 119, 812–819. [Google Scholar] [CrossRef]
  28. ASTM E779. Standard Test Method for Determining Air Leakage Rate by Fan Pressurization; ASTM International: West Conshohocken, PA, USA, 2019.
  29. Lee, B.H.; Yee, S.W.; Kang, D.H.; Yeo, M.S.; Kim, K.W. Multi-zone simulation of outdoor particle penetration and transport in a multi-story building. Build Simul. 2017, 10, 525–534. [Google Scholar] [CrossRef] [PubMed]
  30. ASTM E741–2011. Standard Test Method for Determining Air Change in a Single Zone by means of a Tracer Gas Dilution; ASTM International: West Conshohocken, PA, USA, 2012.
  31. Pietrogrande, M.C.; Casari, L.; Demaria, G.; Russo, M. Indoor Air Quality in Domestic Environments during Periods Close to Italian COVID-19 Lockdown. Int. J. Environ. Res. Public Health 2021, 18, 4060. [Google Scholar] [CrossRef]
  32. Mosley, R.B.; Greenwell, D.J.; Sparks, L.E.; Guo, Z.; Tucker, W.G.; Fortmann, R.; Whitfield, C. Penetration of Ambient Fine Particles into the Indoor Environment. Aerosol. Sci. Technol. 2001, 34, 127–136. [Google Scholar] [CrossRef]
  33. Long, C.M.; Suh, H.H.; Catalano, P.J.; Koutrakis, P. Using Time-and Size-Resolved Particle Data to Quantify Indoor Penetration and Deposition Behavior. Environ. Sci. Technol. 2001, 35, 2089–2099. [Google Scholar] [CrossRef]
  34. Wallace, L.; Quakenboss, J.; Rodes, C. Continuous measurements of particles, PAH, and CO in an occupied townhouse in Reston, VA. In AWMA/EPA Symposium on the Measurement of Toxic and Related Air Pollutants; EPA/600/J-84/312, 860–871; Environmental Protection Agency Office of Research and Development: Washington, DC, USA, 1997. [Google Scholar]
  35. Lai, A.C.K.; Nazaroff, W.W. Modeling indoor particle deposition from turbulent flow onto smooth surfaces. J. Aerosol Sci. 2000, 31, 463–476. [Google Scholar] [CrossRef]
  36. Zhao, B.; Wu, J. Particle deposition in indoor environments: Analysis of influencing factors. J. Hazard. Mater. 2007, 147, 439–448. [Google Scholar] [CrossRef] [PubMed]
  37. Thatcher, T.L.; Layton, D.W. Deposition, resuspension and penetration of particles within a residence. Atmos Environ. 1995, 29, 1487–1497. [Google Scholar] [CrossRef]
  38. Liu, D.L.; Nazaroff, W.W. Modeling pollutant penetration across building envelops. Atmos. Environ. 2001, 35, 4451–4462. [Google Scholar] [CrossRef] [Green Version]
  39. Liu, D.L.; Nazaroff, W.W. Particle Penetration through Building Cracks. Aerosol. Sci. Technol. 2003, 37, 563–573. [Google Scholar] [CrossRef] [Green Version]
Figure 1. General plan of classrooms in Korea.
Sustainability 13 07382 g001
Figure 2. Outdoor particle number concentration during the outdoor particle infiltration tests (measured values in size ranges of 0.3–0.5, 0.5–1.0, 1.0–3.0, 3.0–5.0, 5.0–10.0 μm).
Sustainability 13 07382 g002
Figure 3. Linear regressions between size-resolved outdoor particle source (P × λ) and specific ELA: (a) specific ELAtotal., (b) specific ELAoutdoor-side, and (c) specific ELAcorridor-side.
Sustainability 13 07382 g003
Figure 4. Linear regressions between envelope area and ELA: (a) ELAtotal., (b) specific ELAtotal., (c) specific ELAoutdoor-side, and (d) specific ELAcorridor-side.
Sustainability 13 07382 g004
Table 1. Characteristics of Korean school classrooms.
Class
Rooms
OrientationBuilt Year
(Years)
Renovation Year
(Years)
Length, L
(m)
Width, W1
(m)
Floor Area
(m2)
Height (m)Floor LevelMechanical VentilationThe Number of Students in a Class
ASW198820108.86.960.72.63None24
BS193719938.87.061.62.83None16
CS198920198.96.961.42.83None22
DSE196120008.87.666.92.62None20
ESE194420108.48.470.62.61Installed
(HVAC)
23
FSE1971None8.87.263.42.52None25
GS196720147.97.861.62.53Installed
(HVAC)
26
HSW193720068.87.364.22.64None26
ISW198319928.57.462.92.91None28
JSE194420148.87.058.82.92Installed
(HRV)
25
KE1998None13.06.989.82.81Installed
(HVAC)
36
LS1965None10.88.591.82.92Installed
(HRV)
24
Table 2. Building characteristics of school classrooms.
ClassroomsBuilt Year
(Years)
Mechanical VentilationEnvelope Area
(m2)
Window Area (m2)Material of the Window FrameMaterial of the Door
Outdoor SideCorridor SideOutdoor
Side
Corridor SideFramePanel
A1988None22.98.66.7PVCWoodaluminumWood
B1937None24.610.47.4PVCPVCaluminum
C1989None24.98.96.7PVCWoodaluminumWood
D1961None22.913.06.2PVC, SteelWoodWood
E1944Installed
(HVAC)
21.89.60SteelNoneWood
F1971None22.014.75.1PVCSteelSteel
G1967Installed
(HVAC)
19.813.44.8PVC, SteelPVC, SteelPVC
H1937None19.015.14.5PVC, AluminumWoodWood
I1983None24.713.36.7SteelWoodWood
J1944Installed
(HRV)
25.514.25.5PVCWoodWood
K1998Installed
(HVAC)
36.515.62.4PVC, AluminumPVCPVC
L1965Installed
(HRV)
31.212.03.7PVC, AluminumPVCWood
Table 3. Air leakage characteristics of school classrooms.
ClassroomsC
(m3·h−1·Pa-n)
n (-)ACH50
(h−1)
ELA (cm2)Specific ELA (cm2/m2)
TotalOutdoor SideCorridor SideOtherTotalOutdoor SideCorridor Side
A410.20.5824.8981.2301.7462.6216.916.25.07.6
B264.80.6116.7663.772.0257.5334.310.81.24.2
C295.40.6219.6752.720.4514.9217.412.30.38.4
D212.20.6515.6562.960.3206.9295.78.40.93.1
E203.70.7118.1589.323.0175.6390.78.30.32.5
F200.40.6114.0505.376.4156.7272.28.01.22.5
G161.00.7015.9453.928.0140.2285.77.40.52.3
H133.90.629.1340.893.0110.5137.35.31.41.7
I209.40.6011.8514.891.7339.084.08.21.55.4
J222.40.5511.3511.6209.3186.2116.18.73.63.2
K671.30.5622.51566.969.1309.31188.517.40.83.4
L322.80.5912.3787.372.3228.9486.18.60.82.5
Table 4. Size-resolved particle penetration coefficient and air exchange rate of classrooms.
ClassroomsPenetration Coefficient, P aAir Exchange Rate a, λ (h−1)
0.3–0.5 μm0.5–1.0 μm1.0–3.0 μm3.0–5.0 μm5.0–10.0 μm
A b1.001.000.780.780.490.67
B b1.001.000.560.330.230.35
C b1.001.001.001.001.000.45
D0.26 ± 0.200.32 ± 0.180.51 ± 0.030.37 ± 0.110.43 ± 0.160.48 ± 0.10
E0.71 ± 0.270.55 ± 0.280.71 ± 0.270.61 ± 0.330.52 ± 0.230.42 ± 0.05
F0.68 ± 0.310.50 ± 0.190.47 ± 0.190.35 ± 0.240.37 ± 0.200.54 ± 0.28
G1.00 ± 0.000.88 ± 0.160.18 ± 0.260.58 ± 0.310.83 ± 0.240.25 ± 0.01
H0.83 ± 0.290.73 ± 0.390.89 ± 0.180.95 ± 0.090.77 ± 0.400.30 ± 0.09
I0.77 ± 0.390.76 ± 0.410.63 ± 0.350.56 ± 0.330.70 ± 0.280.36 ± 0.06
J0.88 ± 0.200.81 ± 0.190.72 ± 0.270.59 ± 0.360.72 ± 0.280.25 ± 0.03
K0.13 ± 0.000.15 ± 0.000.50 ± 0.150.29 ± 0.180.25 ± 0.190.53 ± 0.39
L0.54 ± 0.650.12 ± 0.130.43 ± 0.490.06 ± 0.050.31 ± 0.410.39 ± 0.19
AM c0.800.750.600.570.510.41
s.d c0.280.300.250.280.250.13
GM c2.051.871.791.651.711.50
GSD c1.411.391.361.381.361.20
a Mean ± standard deviations. b Classrooms A, B, and C were tested once in accordance with the school’s access issue. c AM, arithmetic mean; s.d, arithmetic standard deviations; GM, geometric mean; GSD, geometric standard deviations.
Table 5. Deposition loss rate of size-resolved particles of classrooms
ClassroomsDeposition Loss Rate (k) a
0.3–0.5 μm0.5–1.0 μm1.0–3.0 μm3.0–5.0 μm5.0–10.0 μm
A b0.160.330.400.890.89
B b0.710.770.530.700.84
C b0.430.260.400.851.25
D0.00 ± 0.000.00 ± 0.000.04 ± 0.060.46 ± 0.141.05 ± 0.19
E0.34 ± 0.270.21 ± 0.200.35 ± 0.301.03 ± 0.571.29 ± 0.36
F0.18 ± 0.150.14 ± 0.120.19 ± 0.070.70 ± 0.251.22 ± 0.32
G0.26 ± 0.160.33 ± 0.110.10 ± 0.070.37 ± 0.010.69 ± 0.04
H0.04 ± 0.070.06 ± 0.100.13 ± 0.100.45 ± 0.140.47 ± 0.42
I0.38 ± 0.470.46 ± 0.500.69 ± 0.240.95 ± 0.781.26 ± 0.61
J0.61 ± 0.120.68 ± 0.130.34 ± 0.080.55 ± 0.051.07 ± 0.32
K0.07 ± 0.000.11 ± 0.000.29 ± 0.000.60 ± 0.280.96 ± 0.43
L0.12 ± 0.000.64 ± 0.000.20 ± 0.120.16 ± 0.161.01 ± 0.34
AM c0.220.300.320.651.03
s.d c0.230.250.190.260.25
GM c1.301.341.311.882.75
GSD c1.311.341.241.471.48
a Mean ± standard deviations. b Classrooms A, B, and C were tested once in accordance with the school’s access issue. c AM, arithmetic mean; s.d, arithmetic standard deviations; GM, geometric mean; GSD, geometric standard deviations.
Table 6. Correlations coefficient between particle penetration(P), deposition loss rate(k), outdoor particle source (P × λ) of size-resolved particles, air exchange rate(λ) and air leakage characteristic (C, n, ACH50, ELA, and specific ELA).
Penetration Coefficient (P)Deposition Loss Rate (k)Outdoor Particle Source
(P × λ)
AERCnACH50Total
ELA
Specific
Total ELA
Specific
ELAc
0.3
–0.5
0.5
–1.0
1.0
–3.0
3.0
–5.0
5.0
–10.0
0.3
–0.5
0.5
–1.0
1.0
–3.0
3.0
–5.0
5.0
–10.0
0.3
–0.5
0.5
–1.0
1.0
–3.0
3.0
–5.0
5.0
–10.0
k0.3
–0.5
0.613 *0.615 *0.2450.1000.1641
0.5
–1.0
0.4510.284−0.015−0.289−0.1200.748 **1
1.0
–3.0
0.3770.4680.3230.1270.0270.653 *0.5261
3.0
–5.0
0.2920.4650.4710.4330.1410.361−0.0920.692 *1
5.0
–10.0
−0.186−0.1800.134−0.162−0.0390.2460.0460.4080.5431
P
×
λ
0.3
–0.5
0.733 **0.733 **0.5610.5740.2560.2640.1120.3980.590 *0.0501
0.5
–1.0
0.676 *0.784 **0.5570.614 *0.2690.2680.0480.4150.621 *0.0240.970 **1
1.0
–3.0
0.3420.4220.765 **0.596 *0.212−0.006−0.2250.2670.623*0.2650.820 **0.827 **1
3.0
–5.0
0.4560.5700.699 *0.788 **0.440−0.060−0.3400.1770.593 *0.0810.844 **0.871 **0.928 **1
5.0
–10.0
0.4190.4960.665 *0.790 **0.693 *−0.037−0.3750.1030.5010.2720.656 *0.677 *0.791 **0.882 **1
AER−0.296−0.1660.054−0.061−0.421−0.424−0.4070.0360.3790.3020.656 *0.4430.630 *0.5240.3111
C−0.441−0.270−0.284−0.280−0.464−0.209−0.0580.1480.0470.064−0.080−0.0080.0160.000−0.2140.5641
n0.1230.049−0.1080.1610.250−0.090−0.334−0.3070.098−0.0100.012−0.040−0.0850.0320.170−0.220−0.5331
ACH50−0.0330.168−0.0660.085−0.219−0.074−0.1970.1550.4280.1500.4530.5250.4340.4830.2530.724 **0.690 *−0.0141
Total ELA−0.447−0.278−0.293−0.278−0.465−0.218−0.0880.1350.0720.087−0.070−0.0020.0270.014−0.1960.582 *0.996 **−0.4570.732 **1
Specific Total ELA−0.1460.079−0.070−0.036−0.315−0.030−0.0180.2970.3010.1190.2930.3880.3220.3250.0740.680 *0.908 **−0.4680.877 **0.911 **1
Specific ELAc0.3940.5590.5100.4600.2980.2710.1220.580 *0.5640.3260.705 *0.777 **0.727 **0.721 **0.680 *0.4610.293−0.2770.5700.2960.594 *1
Specific ELAo0.3220.3790.2960.222−0.0150.1110.2650.2290.171−0.1410.5250.5580.4180.4100.1450.2830.134−0.5530.1850.0820.3270.350
** Significant at p < 0.01. * Significant at p < 0.05.
Table 7. Correlations coefficient between penetration coefficient(P), deposition loss rate(k), outdoor particle source(P × λ) of size-resolved particles, air exchange rate(λ) and other building characteristics (built year, floor area, volume, and envelope area).
Penetration Coefficient (P)Deposition Loss Rate (k)Outdoor Particle Source (P × λ)AERBuilt YearRenovation YearFloor AreaVolume
0.3
–0.5
0.5
–1.0
1.0
–3.0
3.0
–5.0
5.0
–10.0
0.3
–0.5
0.5
–1.0
1.0
–3.0
3.0
–5.0
5.0
–10.0
0.3
–0.5
0.5
–1.0
1.0
–3.0
3.0
–5.0
5.0
–10.0
k0.3
–0.5
0.613 *0.615 *0.2450.1000.1641
0.5
–1.0
0.4510.284−0.015−0.289−0.1200.748 **1
1.0
–3.0
0.3770.4680.3230.1270.0270.653 *0.5261
3.0
–5.0
0.2920.4650.4710.4330.1410.361−0.0920.692 *1
5.0
–10.0
−0.186−0.1800.134−0.162−0.0390.2460.0460.4080.5431
P
×
λ
0.3
–0.5
0.733 **0.733 **0.5610.5740.2560.2640.1120.3980.590 *0.0501
0.5
–1.0
0.676 *0.784 **0.5570.614 *0.2690.2680.0480.4150.621 *0.0240.970 **1
1.0
–3.0
0.3420.4220.765 **0.596 *0.212−0.006−0.2250.2670.623 *0.2650.820 **0.827 **1
3.0
–5.0
0.4560.5700.699 *0.788 **0.440−0.060−0.3400.1770.593 *0.0810.844 **0.871 **0.928 **1
5.0
–10.0
0.4190.4960.665 *0.790 **0.693 *−0.037−0.3750.1030.5010.2720.656*0.677 *0.791 **0.882 **1
AER−0.296−0.1660.054−0.061−0.421−0.424−0.4070.0360.3790.3020.4140.4430.630 *0.5240.3111
Built year−0.225−0.083−0.1850.0030.035−0.424−0.2670.1760.2110.3250.1610.2180.2410.3150.3610.610 *1
Floor area−0.712 **−0.818 **−0.474−0.627 *−0.550−0.464−0.059−0.215−0.4110.041−0.573−0.632 *−0.405−0.501−0.5420.1890.265−0.5111
Volume−0.634 *−0.736 **−0.379−0.615 *−0.494−0.2860.137−0.032−0.3820.110−0.562−0.613 *−0.403−0.528−0.5460.0970.262−0.4990.964 **1
Envelop area−0.572−0.518−0.370−0.555−0.494−0.0790.1930.165−0.1870.220−0.435−0.405−0.297−0.404−0.4570.2390.470−0.3360.797 **0.876 **
** Significant at p < 0.01. * Significant at p < 0.05.
Table 8. Correlations coefficient between air leakage characteristic (C, n, ACH50, ELA, and Specific ELA) and other building characteristics (built year, floor area, volume, and envelope area).
CnACH50Total ELASpecific Total ELASpecific ELAcSpecific ELAoBuilt YearFloor AreaVolume
n−0.5331
ACH500.690 * −0.0141
Total ELA0.996 **−0.4570.732 **1
Specific Total ELA0.908 **−0.4680.877 **0.911 **1
Specific ELAc0.293−0.2770.5700.2960.594 *1
Specific ELAo0.134−0.5530.1850.0820.3270.3501
Built year0.641−0.2930.5850.6440.6710.5780.0591
Floor area0.62−0.1960.1210.6310.283−0.309−0.3530.2651
Volume0.627 *−0.3490.0540.625 *0.300−0.196−0.2850.2620.964 **1
Envelope area0.847 **−0.592 *0.2940.831 **0.615 *0.072−0.0910.4700.797 **0.876 **
** Significant at p < 0.01. * Significant at p < 0.05.
Publisher’s Note: MDPI stays neutral with regard to jurisdictional claims in published maps and institutional affiliations.

