Article

Efficient and Comprehensive Evaluation Method of Temporary Overvoltage in Distribution Systems with Inverter-Based Distributed Generations

1
Korea Electric Power Research Institute, Daejeon 34056, Korea
2
School of Electrical Engineering, Korea University, Seoul 02841, Korea
*
Author to whom correspondence should be addressed.
Sustainability 2021, 13(13), 7335; https://doi.org/10.3390/su13137335
Submission received: 23 March 2021 / Revised: 20 June 2021 / Accepted: 28 June 2021 / Published: 30 June 2021
(This article belongs to the Special Issue Power Distribution System and Sustainability)

Abstract

:
In general, a temporary overvoltage (TOV) on the healthy phases occurs because of the neutral-shift phenomenon during a single line-to-ground (SLG) fault. The TOV can destroy the insulation of electric devices and cause damage to other equipment and customer loads in just a few cycles. In practice, the TOV can be affected by numerous factors: the sequence reactance ratio of the interconnection transformer, the ratio of load to DG, and the distance to the fault. More importantly, inverter-based distributed generations (DGs) have different influences on the TOV from traditional synchronous-machine-based DGs. In this sense, this work performed an efficient and comprehensive investigation on the effect of these various parameter types and their extensive variations, based on steady-state analysis with sequence equivalent circuits and three-dimensional representations. The proposed methodology can facilitate judging the impact of multi-parameter conditions on the TOV readily and comparing the fault characteristics of synchronous-machine-based and inverter-based DGs. Finally, the results can be used for future studies on TOV mitigation techniques.

1. Introduction

With the growing importance of renewable energy sources (RES) worldwide, the interconnection of inverter-based distributed generation (DG) increases. DGs are sited at or near customers in small-scale generation forms, not conventional centralized power sources [1]. DGs can be classified according to power generation technology, type of use, whether they operate in connection with the system, and the type of generator. The type of generator can be further classified into rotary and stationary machines. While rotary machines include synchronous-machine-based generators and induction generators, such as small hydropower plants and wind turbines (WT), stationary machines include fuel cells, WT, and photovoltaics (PV), which use inverters for grid interfacing [2]. Both machines have different models and control characteristics, and therefore their fault characteristics are also different [3].
A single line-to-ground (SLG) fault accounts for about 80% of grid accidents, causing a voltage rise on healthy phases because of the neutral-shift phenomenon [4]. The IEEE Std 142 calls for the installation of a neutral grounding resistor (NGR) between the main transformer (MTR) and the earth to suppress temporary overvoltage (TOV) [5,6]. The effective grounding requirement proposes adjusting the size of the fault current depending on the impedance ratio of the transformer to mitigate the TOV so that the coefficient of grounding does not exceed 80% [7]. In compliance with the effective grounding requirement, the ground fault factor does not exceed 1.38 [8]. Failure to follow this requirement can destroy the insulation of electric devices or damage customer loads [9].
Many utilities have begun to follow the effective grounding requirement even when the DG is connected to distribution systems [10]. However, it is needed to examine whether inverter-based systems are appropriate to meet and operate IEEE Std 142 because IEEE Std 142 was established based on existing rotary machines and because the physical characteristics of rotary and stationary machines are different from each other. In particular, the resistive component of a rotary machine can be ignored because it is smaller than the reactance. Meanwhile, inverters do not meet the conditions of IEEE Std 142 because they have no reactance in their impedance [11]. Additionally, even when IEEE Std 142 is fulfilled, TOV may still occur due to an SLG fault in distribution systems interconnected with PV systems [12].
With the growing penetration of RES, many studies have been conducted to evaluate TOV during an SLG fault. The influence of transformer configuration on TOV was analyzed by [13,14,15,16]; these studies verified the effectiveness for the primary winding grounding of the interconnection transformer. According to the voltage regulation allowance of the American National Standards Institute, the voltage on the healthy phases could rise by 1.82 pu during an SLG fault [13]. Ref. [14] performed a sensitivity analysis of the transformer connections, including Yg–Yg, Yg–D, Y-Yg, D–Yg, D–D, and D–Y, based on sequence equivalent circuits. Furthermore, in [14], the impacts of the sequence reactance ratio of interconnection transformer on TOV were evaluated, presenting the range of effective grounding. In [15], the influences of transformer configurations and NGR adjustments on TOV were investigated based on MATLAB/Simulink. In [16], various conditions, such as transformer grounding, grid connection, feeder capacitor, and load, were further considered based on EMTDC/PSCAD. Moreover, TOV figures were compared in consideration of both rotary-machine-based and stationary-machine-based DGs.
The authors of [17,18,19] examined TOV phenomena in distribution networks with inverter-interfaced DGs. First, [11] presented several factors that trigger TOV. Significant TOV occurred when the load was lower than DG. In [17], TOV might have increased to a maximum of 2.3 pu when the PV inverters were disconnected from the grid during an SLG fault. The authors could reduce TOV duration and the TOV level to 1.79 pu by improving the overvoltage protection algorithm. In [18], maximum peak voltage was measured up to 3.58 times the nominal voltage owing to an SLG fault. In [19], the authors used various commercial inverters to compare and analyze TOV figures. In [20,21,22], the authors proposed mitigation techniques for TOV during PV islanding. Since the TOV analysis under various conditions can help to develop TOV mitigation techniques, an accurate and efficient TOV analysis methodology is required.
This paper presented an efficient and comprehensive analysis methodology on the effect of various parameters and their extensive variations, based on steady-state analysis with sequence equivalent circuits and three-dimensional representations. Note that the proposed methodology was based on a sensitivity analysis with deep and efficient investigations on multi-parameters. In light of extensive research on this topic, the previous studies [13,14,15,16] mainly focused on the impact of DG interconnection transformer configuration on TOV. In comparison, this work investigates various parameters, including the sequence reactance ratio of the interconnection transformer, the ratio of load to DG, and the distance to the fault. In the meantime, [17,18,19] performed time-domain analyses to characterize transient behaviors of TOV. In general, these time-domain analyses were performed under very specific conditions and took a relatively long time for a single simulation. As a result, the time-domain approach is not suitable for observing TOV behaviors according to extensive parameter changes. In this sense, the proposed methodology was primarily based on a steady-state approach that can investigate extensive parameter variations. Besides, [14] analyzed the impacts of the sequence reactance ratio of interconnection transformer on TOV in a two-dimensional graph. In contrast, the proposed methodology presented TOV analysis results in a three-dimensional graph, which enabled more comprehensive and simultaneous analysis on multiple parameters, including, but not limited to, DG types, impedance ratios, load ratios, and distance to faults, relative to a two-dimensional one.
The main contribution of this work can be summarized as follows:
  • This paper analyzed the TOV impacts of multiple parameters: the impedance ratio of interconnection transformers, the ratio of loads to DGs, and the distance to the fault. There have been no such works that considered various parameters at the same time.
  • The proposed methodology can investigate extensive multi-parameter variations in TOV analysis, unlike time-domain, detailed simulations.
  • The paper also presented TOV analysis results in a three-dimensional graph for comprehensive and simultaneous observations based on multiple parameters. This approach can facilitate the TOV analysis of multi-parameter conditions and the comparison of the fault characteristics of synchronous-machine-based and inverter-based DGs.
This paper is organized as follows. Section 2 describes the formula for the voltage on the healthy phases during an SLG fault and then presents a voltage rise curve depending on the grounding system of transformers. In Section 3, a methodology to evaluate TOV is provided. In Section 4, case study results are presented and observed for both types of DGs. Finally, the paper is concluded in Section 5.

2. Background Theory

The voltage rise change during an SLG fault depends on the grounding system of transformers. As shown in Figure 1, (a) shows a pre-fault condition while (b) and (c) indicate the voltage on the healthy phases when phase A is at ground fault. Figure 1b shows an ungrounded system in which the line-to-neutral voltages on the healthy phases increase to 1.732 times the nominal voltage, which equals to the line-to-line voltage. The application of the effectively grounded system shown in Figure 1c can reduce the voltage rise from 1.732 to 1.38 times.
TOV occurs when a DG operates in the islanded mode after being disconnected from the grid owing to an SLG fault, and TOV can continue unless the fault is removed or the DG is disconnected. To reduce this TOV, the fault current magnitude needs to be increased by attaching an NGR as in the case of transmission systems. In other words, adjusting the impedance of the interconnection transformer can mitigate TOV within the range of effective grounding.

2.1. Voltage Formula during an SLG Fault

This section considers sequence-equivalent circuits to analyze the voltage on the healthy phases and fault voltage during an SLG fault, as shown in Figure 2. Note that the fault resistance is assumed to be zero and that other components such as lines, transformers, and loads are not connected to the circuits.
Assuming that phase A is at ground fault, the currents on the healthy phases can be expressed as follows:
  I b = I c = 0
where Ib and Ic are the phase-B and -C currents, respectively. The sequence components of the fault current are all identical, as presented in Equation (2).
[ I 1 I 2 I 0 ] = 1 3 [ 1 a a 2 1 a 2 a 1 1 1 ] [ I a I b I c ] = 1 3 [ I a I a I a ]
where I1, I2, and I0 are the positive-, negative-, and zero-sequence fault currents. Ia is the fault current, and a is a mathematical operator that means phase angle rotation as follows:
a = 1 120 °
The sequence components of the fault current can be solved by a sequence equivalent circuit, as in Equation (4).
I 1 = I 2 = I 0 = E a Z 1 + Z 2 + Z 0
where Ea is the positive-sequence voltage at phase A. Z1, Z2, and Z0 are the positive-, negative-, and zero-sequence impedances, respectively. Then, Equation (5) represents the sequence components of the fault voltage.
[ V 1 V 2 V 0 ] = [ E a I 1 Z 1 I 2 Z 2 I 0 Z 0 ] = [ E a Z 1 Z 1 + Z 2 + Z 0 · E a Z 2 Z 1 + Z 2 + Z 0 · E a Z 0 Z 1 + Z 2 + Z 0 · E a ]
where V1, V2, and V0 are the positive-, negative-, and zero-sequence components of the voltage. Finally, the fault voltage and the voltage on phases B and C can be expressed as shown in Equation (6).
[ V a V b V c ] = [ 1 1 1 a 2 a 1 a a 2 1 ] [ V 1 V 2 V 0 ] = [ V 1 + V 2 + V 0 a 2 V 1 + a V 2 + V 0 a V 1 + a 2 V 2 + V 0 ] = [ 0 ( a 2 a ) Z 2 + ( a 2 1 ) Z 0 Z 1 + Z 2 + Z 0 E a ( a a 2 ) Z 2 + ( a 1 ) Z 0 Z 1 + Z 2 + Z 0 E a ]

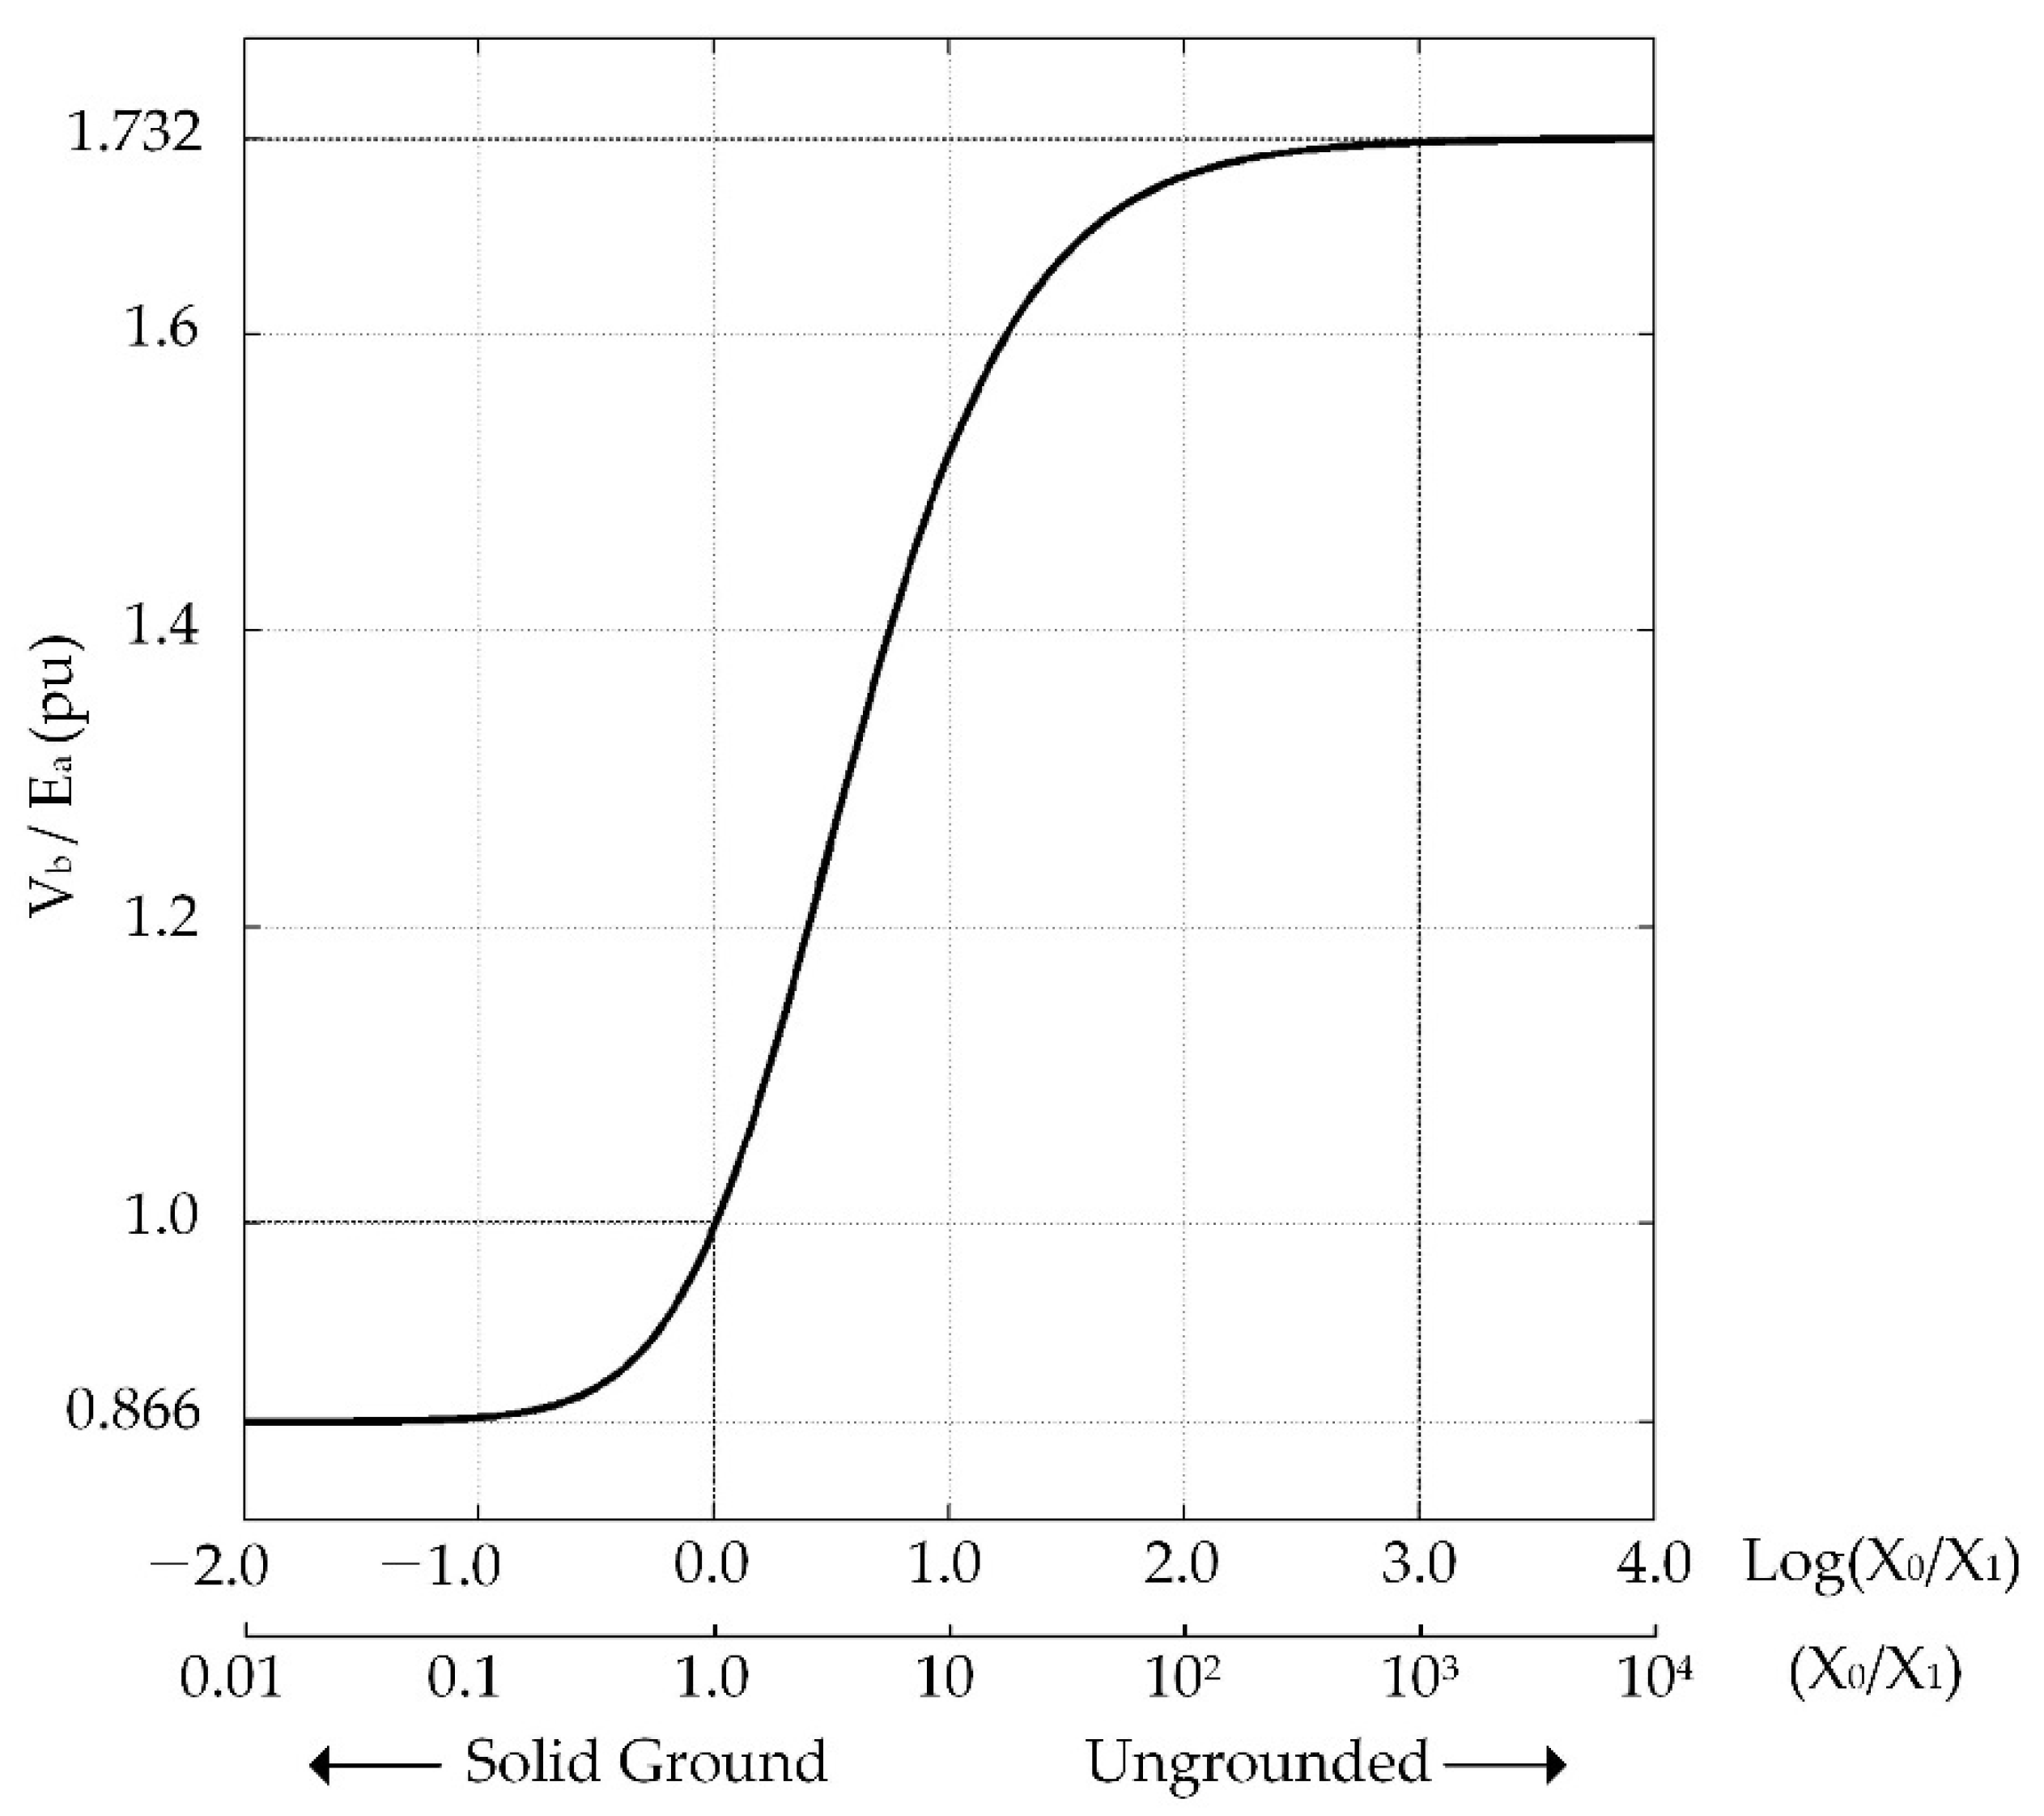
2.2. Voltage Rise Curve Depending on the Impedance Ratio of Transformer

The voltage formula based on transformer ground systems are expressed in Table 1. Note that the resistance of a transformer impedance is nearly zero since it is relatively much smaller than reactance in systems with synchronous-machine-based generators, thereby indicating Z0 = jx0. Likewise, the positive- and negative-sequence impedances can be expressed as Z1 = jx1 = Z2 = jx2.
The voltage on the healthy phases is close to 0.866 pu in the solidly grounded system, and the voltage increases up to 1.732 pu in the ungrounded system. In this manner, the fault voltage depends on the transformer impedance ratio, x0/x1. With effectively grounded systems, the voltage can be suppressed to less than 1.38 times the normal voltage. The voltage rise curve is shown in Figure 3, and phases B and C have the same results.

3. Proposed Methodology

Figure 4 presents a KEPCO standard distribution system consisting of the main generator, an MTR, loads, a recloser, an interconnection transformer, switches, and DGs. Table 2 lists the parameters of the test model. Note that the sequence impedances of aerial lines are actual values used in Korea. Although a rated power of 100 MW is large for the 22.9-kV line, realistic line parameters are used and converted to per unit based on a 100-MW power base. The converted line impedances are shown in Figure 4. DG1 is an inverter-based DG, and DG2 is a synchronous-machine-based DG. Simulations were performed in MATLAB.
The proposed methodology employed the fault calculation algorithm based on sequence equivalent circuits, considering the changes of various parameters in standard KEPCO systems. Hence, it is essential to thoroughly describe the standard systems and select several parameters regarded as critical factors in practical grid planning or protection design. As shown in Figure 4, the simulation procedures can be briefly described as follows. Switches 1 and 2 are closed in an initial state, and the operation of Switch 3 or 4 determines the DG type. Assume that an SLG fault occurred at the BUS 5 in a synchronous-machine-based DG system; in other words, Switches 3 and 4 are open and closed, respectively. After sensing a fault at BUS 5, the recloser at BUS 4 is tripped momentarily and then automatically closed, restoring services. If a fault is permanent, the recloser permanently opens after a preset number of operations. In this work, the TOV phenomena were analyzed in the DG islanded mode due to an SLG fault.
It can be assumed that the interconnection transformer has an automatic tap changer to stabilize the voltage profile. However, the TOV analysis should be based on the worst case, so this work used a transformer without a tap changer. As such, the turn ratio of the interconnection transformer was fixed at 22.9 to 0.38.
Moreover, IEEE std 1547 [23], a standard that provides criteria and requirements for grid integration of DGs, suggests DG operation and control under normal and fault conditions. Although controls in compliance with this standard might mitigate the TOV under the SLG fault (for example, by limiting fault currents), this work did not consider this standard since the maximum overvoltage (i.e., the worst case) should be obtained for TOV analysis.
One needs to consider the SLG fault case under the grid-connected mode. Figure 5 and Figure 6 depict how the healthy-phase voltage varies with the sequence reactance ratio of the interconnection transformer in a synchronous-machine-based DG system under the islanded and grid-connected mode, respectively. While the maximum phase-C voltage increases up to 1.829 pu in the islanded mode, it is mitigated down to 1.262 pu in the grid-connected mode. This mitigation is mainly due to the multi-grounded system of the main transformer. Therefore, this work investigated the islanded mode only.
The impacts of specific parameters on TOV can be analyzed in the following procedure:
(Case 1) The TOV influences of three parameters, including the x0/x1 ratio of the interconnection transformer, the ratio of load to DG, and the distance to the fault, are investigated. Note that the SLG fault occurs at BUS 5, and the interconnection transformer has the Yg-D connection.
(Case 2) Different fault resistance values were used in this analysis. The neutral grounding reactor of MTR was fixed at j0.6 ohms.
(Case 3) Two of the three specific parameters were analyzed simultaneously in terms of TOV impacts. The range of settings applied to each DG was as follows:
  • The impedance ratio of the interconnection transformer ranged from 0.01 to 1000, while the ratio of load to DG ranged from 0 to 3.
  • The impedance ratio of the interconnection transformer ranged from 0.01 to 1000, while the length of the fault section ranged from 0 to 5 km.
  • The ratio of load to DG ranged from 0 to 3, while the length of the fault section ranged from 0 to 5 km.
The results were visually presented in a three-dimensional graph to analyze the simultaneous impacts of parameters.
(Case 4) For the generality of observations obtained in the previous cases, the simplified actual distribution system of KEPCO was tested. Figure 7 illustrates the KEPCO system with four DGs, which can be based on synchronous machines or inverters so that two different types of DGs are analyzed and compared. Table 3 presents rated powers and voltages of each component, and its sequence impedances are the same as those presented in Figure 4.

4. Case Study

4.1. The Impacts of Three Specific Parameters on TOV

The TOV impacts of three parameters were investigated. An SLG fault occurred at the BUS 5 in the standard distribution system. DG supplies power to the load after being disconnected from the grid owing to an SLG fault. TOV is analyzed on the phase with maximum overvoltage at the point of BUS 5. Note that the fault resistance was set to zero.

4.1.1. Change in x0/x1 Ratio of Interconnection Transformer

TOV analysis results of a synchronous-machine-based DG system are shown in Figure 8. The maximum phase-C voltage was 1.829 pu, which exceeded the nominal voltage, and it occurred in the ungrounded system. The overvoltage can be mitigated by attaching NGR to the interconnection transformer, eventually decreasing the voltage to 1.38 pu, which is the effective grounding requirement.
In comparison, Figure 9 shows TOV analysis results of an inverter-based DG system. The maximum voltage was only 1.149 pu when the impedance ratio of the interconnection transformer was close to 10. It is needed to point out that the voltage decreased in the ungrounded system. As a result, unlike the synchronous-machine-based DG system, no TOV occurred on the inverter-based DG system because the voltages of healthy phases were within effective grounding requirements, which were below 1.38 pu. Table 4 and Table 5 present maximum voltages at BUS 5, 6, and 7 in synchronous-machine-based and inverter-based DGs during an SLG fault, respectively.

4.1.2. Change in the Ratio of Load to DG

Figure 10 and Figure 11 show the effect of the ratio of load to DG on TOV in a synchronous-machine-based and inverter-based DG system, respectively. In Figure 10, the voltages on the healthy phase were close to 1 pu regardless of the ratio, which indicates that the ratio does not affect TOV in synchronous-machine-based DG systems. In contrast, in the inverter-based DG system, the TOV was close to 1.8 pu when the ratio of load to DG was 0.5, indicating that a relatively small load causes significant TOV. When the ratio of load to DG was close to three, the voltage dropped below 1.38 pu. It can be concluded that the ratio has a considerable impact on inverter-based distribution systems. Table 6 and Table 7 show maximum voltages owing to an SLG fault when the ratio of load to DG is 0.5.

4.1.3. Change in Fault Location

Figure 12 and Figure 13 depict the impact of fault location on TOV in a synchronous-machine-based and inverter-based DG system, respectively. Because all voltages were close to 1 pu in both figures, TOV did not occur. Hence, it can be concluded that the length change at a fault section does not influence TOV regardless of a DG type. Table 8 and Table 9 indicate maximum voltages owing to an SLG fault when the length is 2.5 km.

4.2. Change in Fault Resistance

Different fault resistance values were tested to observe the fault resistance impact on TOV. Additionally, 30 ohms was also considered to present the impacts of high resistance on TOV. The test model and fault conditions are the same as those in Case 1. As shown in Table 10, the fault resistance impact on TOV was assessed based on various scenarios. From the table, it can be observed that fault resistances rarely changed maximum voltages, except for Scenario 1, where an ungrounded system in a synchronous-machine-based DG system was tested. In this case, the maximum voltage decreased as the fault resistance increased. For other scenarios, the fault resistance did not affect the TOV phenomenon and its analysis.

4.3. The Simultaneous Impacts of Two of the Three Parameters on TOV

In Case 3, we assessed the parameters such as x0/x1 of the sequence reactance ratio of interconnection transformer, the ratio of load to DG, and the distance to the fault simultaneously. The test model and fault conditions were the same as those in Case 1. The fault resistance was set to zero.

4.3.1. Change in x0/x1 Ratio of Interconnection Transformer and the Ratio of Load to DG

The impedance ratio of the interconnection transformer ranged from 0.01 to 1000, while the ratio of load to DG ranged from 0 to 3. Figure 14 shows the results in a synchronous-machine-based DG system through a three-dimensional graph. From this figure, one can directly conclude that the transformer ratio significantly affected TOV occurrence for any load-to-DG ratio, while the load-to-DG ratio had no impact on TOV regardless of the transformer ratio. In the meantime, Figure 15 shows the TOV analysis results when inverter-based DGs are connected, indicating that the load-to-DG ratio only affected TOV between the two parameters.

4.3.2. Change in x0/x1 Ratio of Interconnection Transformer and the Fault Location

The impedance ratio of the interconnection transformer ranged from 0.01 to 1000, while the length between BUS 5 and BUS 6 ranged from 0 km to 5 km. Figure 16 illustrates the TOV analysis results for the synchronous-machine-based DG system, presenting that the length did not affect voltage rise regardless of the transformer impedance ratio. As shown in Figure 17, in an inverter-based DG system, both the transformer impedance ratio and fault location did not cause TOV. From the two figures, the distance to the fault did not generate TOV regardless of the DG type, as evidenced by two-dimensional graphs in Section 4.1.3.

4.3.3. Change in the Ratio of Load to DG and the Fault Location

Finally, the ratio of load to DG ranged from 0 to 3, while the distance to the fault ranged from 0 km to 5 km. As depicted in Figure 18, voltage increase due to the ratio of load to DG or the fault location did not occur in a synchronous-machine-based DG system. Instead, the phase-C voltage was almost the same as the normal voltage. Figure 19 indicates that TOV could be induced only by the load-to-DG ratio, not by the fault location. Figure 18 and Figure 19 show that distance to the fault changes did not significantly affect the TOV behavior for any DG type. This is because the line impedance was too small to affect the overvoltage. In the case of a synchronous-machine-based DG system, the ratio of load to generation did not affect overvoltage since the load impedance magnitude is relatively much larger than line and transformer impedance magnitude, which resulted in limited current flow through the load. This phenomenon can be observed in Figure 18. The surface in Figure 18 is almost flat.

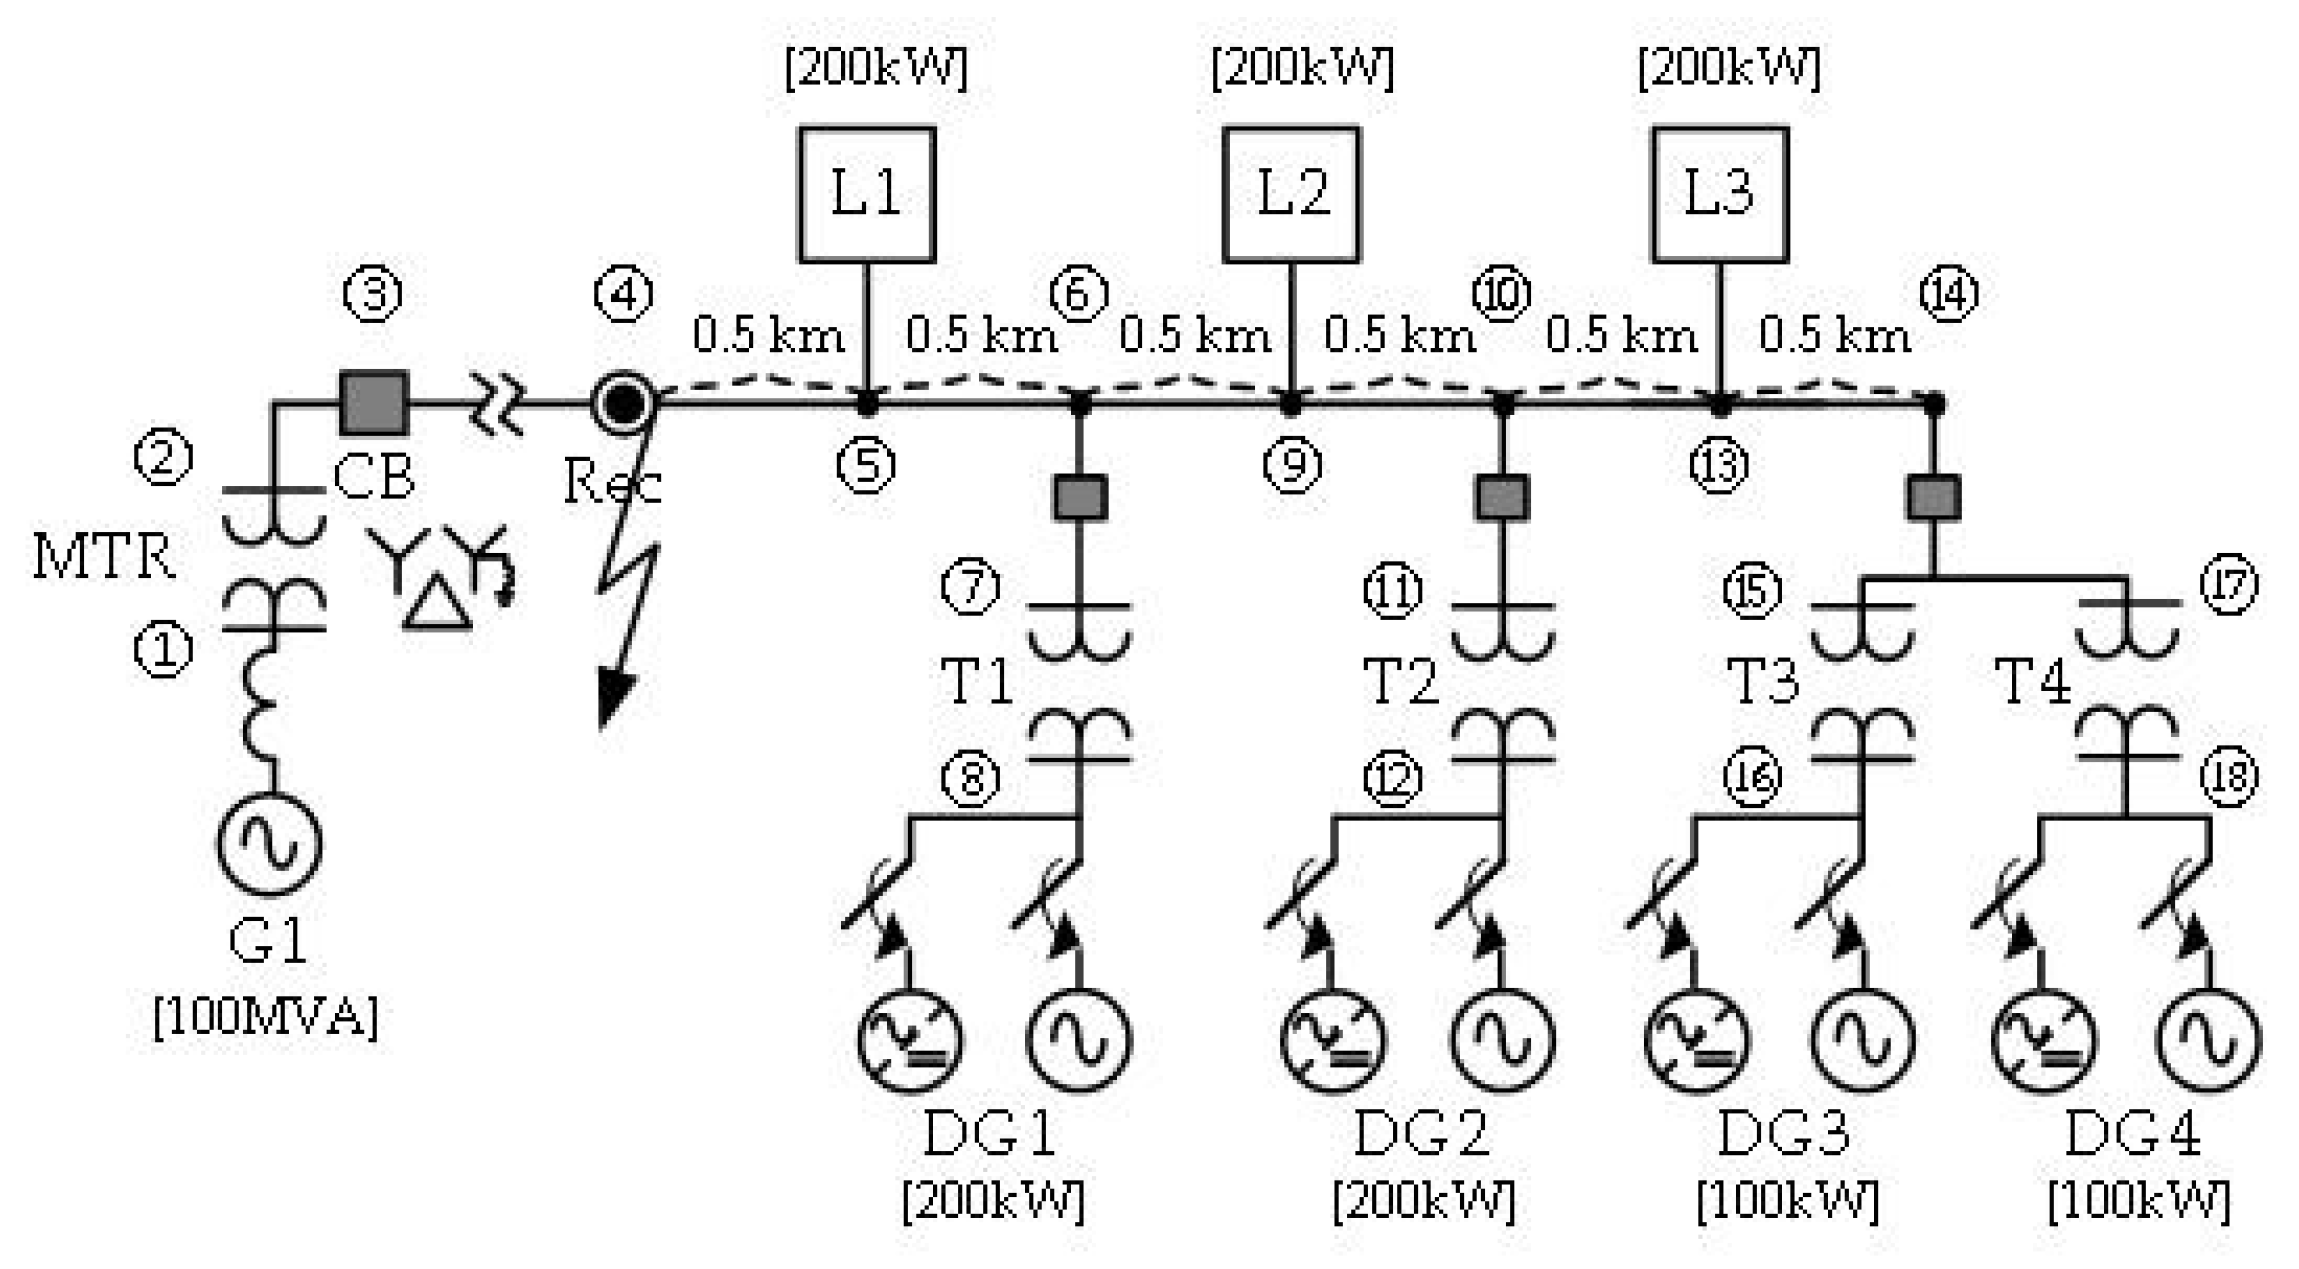
4.4. Verification in the Actual Distribution System

In Case 4, additional simulations were performed based on the KEPCO actual distribution system for practical and general results. TOV analysis results owing to an SLG fault are presented in a three-dimensional graph in Figure 20. The TOV results of Case 4 were slightly different from those of Case 3 because of different topologies and systems. Nevertheless, the TOV analysis results were identical to those in Case 3.

5. Discussion and Conclusions

This paper proposed an efficient and comprehensive methodology to evaluate TOV in distribution systems with DGs. To this end, the impedance ratio of the interconnection transformer, the ratio of load to DG, and the distance to the fault were investigated, and then resultant TOV analysis results were presented visually in a three-dimensional graph. Furthermore, the fault characteristics of two DG types were compared. Additionally, a KEPCO actual distribution system was tested for the generality of observations obtained in the previous cases.
As a result, it was observed that TOV occurrence during an SLG fault depended on the interconnection transformer impedance in a synchronous-machine-based DG system, while TOV did not occur in an inverter-based DG. Therefore, the existing effective grounding requirements in IEEE Std 142, which were established based on existing rotary machines, can be applied to mitigate TOV in synchronous-machine-based DG systems, not in inverter-based DG systems. On the contrary, TOV occurred depending on the ratio of load to DG in an inverter-based DG system, thereby requiring proper TOV mitigation standards for the system. Finally, the distance to the fault did not affect voltage variation in both the synchronous-machine-based and inverter-based DG system.
In summary, the advantages of the proposed methodology are as follows. First, a three-dimensional graph, which enables simultaneous TOV assessment with two parameters, can facilitate investigating the impacts of two parameters on TOV. Second, it is easier to compare the fault characteristics of synchronous-machine-based and inverter-based DG systems than a two-dimensional graph. Third, TOV analysis results based on various parameters can be presented without individual simulations. Finally, the study results can be used to provide a foundation for the future study of TOV mitigation techniques.

Author Contributions

Conceptualization, N.C.; methodology, N.C.; software, N.C. and M.Y.; validation, M.L. and S.C.; formal analysis, M.L.; investigation, M.Y.; resources, N.C.; data curation, M.L.; writing—original draft preparation, N.C., M.L., and S.C.; writing—review and editing, N.C. and S.C.; visualization, M.L.; supervision, N.C. and S.C.; project administration, N.C. and S.C.; funding acquisition, N.C. and S.C. All authors have read and agreed to the published version of the manuscript.

Funding

This research was supported in part by Korea Electric Power Corporation (Grant number: CX71-20-0007), in part by Korea Institute of Energy Technology Evaluation and Planning (KETEP) grant funded by the Korea government (MOTIE) (No. 20191210301890), and in part by the Basic Research Program through the National Research Foundation of Korea (NRF) funded by the MSIT (No. 2020R1A4A1019405).

Conflicts of Interest

The authors declare no conflict of interest.

References

  1. Driesen, J.; Belmans, R. Distributed generation: Challenges and possible solutions. In Proceedings of the 2006 IEEE Power Engineering Society General Meeting, Montreal, QC, Canada, 18–22 June 2006; pp. 1–8. [Google Scholar] [CrossRef]
  2. Musa, H. A Review of Distributed Generation Resource Types and Their Mathematical Models for Power Flow Analysis. Int. J. Sci. Technol. Soc. 2015, 3, 204. [Google Scholar] [CrossRef] [Green Version]
  3. Keller, J.; Kroposki, B. Understanding Fault Characteristics of Inverter-Based Distributed Energy Resources. In Understanding Fault Characteristics of Inverter-Based Distributed Energy Resources; Technical Report; National Renewable Energy Lab (NREL): Golden, CO, USA, 2010; pp. 1–48. [Google Scholar]
  4. Arritt, R.F.; Dugan, R.C. Distributed generation interconnection transformer and grounding selection. In Proceedings of the 2008 IEEE Power and Energy Society General Meeting—Conversion and Delivery of Electrical Energy in the 21st Century, Pittsburgh, PA, USA, 20–24 July 2008; pp. 1–7. [Google Scholar] [CrossRef]
  5. Institute of Electrical and Electronics Engineers (IEEE) Industry Applications Society. IEEE Standard for Insulation Coordination—Definitions, Principles and Rules. In IEEE Std C62.82.1-2010 (Revision of IEEE Std 1313.1-1996; IEEE: New York, NY, USA, 2011; pp. 1–22. [Google Scholar] [CrossRef]
  6. Institute of Electrical and Electronics Engineers (IEEE) Industry Applications Society. IEEE Recommended Practice for Grounding of Industrial and Commercial Power Systems. In IEEE Std 142-2007 (Revision of IEEE Std 142-1991; IEEE: New York, NY, USA, 2008; pp. 1–21. [Google Scholar] [CrossRef]
  7. Institute of Electrical and Electronics Engineers (IEEE) Industry Applications Society. IEEE Guide for the Application of Neutral Grounding in Electrical Utility Systems—Part I: Introduction. In Surge Protective Devices/High Voltage of the IEEE Power and Energy Society; IEEE: New York, NY, USA, 2017; pp. 1–37. [Google Scholar] [CrossRef]
  8. Grigsby, L.L. Temporary Over-Voltages and System Grounding. In Electric Power Engineering Handbook; CRC Press: Boca Raton, FL, USA, 2018; pp. 1–14. Available online: https://www.electricalengineering-book.com/pdf/chapter-754953.pdf (accessed on 29 June 2021).
  9. Wang, X.; Gao, J.; Wei, X.; Zeng, Z.; Wei, Y.; Kheshti, M. Single Line to Ground Fault Detection in a Non-Effectively Grounded Distribution Network. IEEE Trans. Power Deliv. 2018, 33, 3173–3186. [Google Scholar] [CrossRef]
  10. Ropp, M.; Hoke, A.; Chakraborty, S.; Schutz, D.; Mouw, C.; Nelson, A.; McCarty, M.; Wang, T.; Sorenson, A. Ground Fault Overvoltage with Inverter-Interfaced Distributed Energy Resources. IEEE Trans. Power Deliv. 2017, 32, 890–899. [Google Scholar] [CrossRef]
  11. Advanced Energy Industries Inc. Neutral Connections and Effective Grounding. Adv. Energy 2013, 1–7. Available online: https://pdf4pro.com/view/neutral-connections-and-effective-grounding-4d92e7.html (accessed on 29 June 2021).
  12. Bravo, R.J.; Yinger, R.; Robles, S.; Tamae, W. Solar PV inverter testing for model validation. In Proceedings of the 2008 IEEE Power and Energy Society General Meeting—Conversion and Delivery of Electrical Energy in the 21st Century, Detroit, MI, USA, 24–28 July 2011; pp. 1–7. [Google Scholar] [CrossRef]
  13. Barker, P. Overvoltage considerations in applying distributed resources on power systems. In Proceedings of the IEEE Power Engineering Society Summer Meeting, Chicago, IL, USA, 21–25 July 2003; pp. 109–114. [Google Scholar] [CrossRef]
  14. Balakrishnan, J.; Atputharajah, A.; Ekanayake, J. Review of the Effects of Transformer Configuration on Distributed Generator Interconnection. In Proceedings of the 2008 IEEE Region 10 and the Third international Conference on Industrial and Information Systems, Kharagpur, India, 8–10 December 2008; pp. 1–6. [Google Scholar]
  15. Sultan, A.; Mustafa, M.; Saini, M. Ground fault currents in unit generator-transformer at various NGR and transformer configurations. In Proceedings of the 2012 IEEE Symposium on Industrial Electronics and Applications, Bandung, Indonesia, 23–26 September 2012; pp. 136–140. [Google Scholar] [CrossRef]
  16. Saifi, P.; Moharana, A.; Varma, R.; Seethapathy, R. Influence of distributed generation interface transformer and DG configurations on Temporary Overvoltage (TOV). In Proceedings of the CCECE 2010, Calgary, AB, Canada, 2–5 May 2010; pp. 1–8. [Google Scholar] [CrossRef]
  17. Bravo, R.J.; Salas, R.; Yinger, R.; Robles, S.; Salas, R. Solar photovoltaic inverters transient over-voltages. In Proceedings of the 2013 IEEE Power & Energy Society General Meeting, Vancouver, BC, Canada, 21–25 July 2013; pp. 1–5. [Google Scholar] [CrossRef]
  18. Pazos, F. Power Frequency Overvoltages Generated by Solar Plants. In Proceedings of the IET International Conference on the Renewable Energies and Power Quality, Prague, Czech Republic, 8–11 June 2009; Institution of Engineering and Technology (IET): London, UK, 2009; pp. 1–8. [Google Scholar] [CrossRef] [Green Version]
  19. Nelson, A.; Hoke, A.; Chakraborty, S.; Ropp, M.; Chebahtah, J.; Wang, T.; Zimmerly, B. Experimental evaluation of load rejection over-voltage from grid-tied solar inverters. In Proceedings of the 2015 IEEE 42nd Photovoltaic Specialist Conference (PVSC), New Orleans, LA, USA, 14–19 June 2015; pp. 1–6. [Google Scholar] [CrossRef]
  20. Philip, S.S.; Koshy, D.E. Temporary overvoltage mitigation and re-connection of inverter after fault in a grid-connected photovoltaic system. Int. J. Eng. Res. Technol. 2016, 285–288. Available online: https://www.ijert.org/research/temporary-overvoltage-mitigation-and-re-connection-of-inverter-after-fault-in-a-grid-connected-photovoltaic-system-IJERTV5IS080242.pdf (accessed on 29 June 2021).
  21. Ghoddami, H.; Yazdani, A. A Mitigation Strategy for Temporary Overvoltages Caused by Grid-Connected Photovoltaic Systems. IEEE Trans. Energy Convers. 2014, 30, 413–420. [Google Scholar] [CrossRef]
  22. Varma, R.K.; Siavashi, E.M. Enhancement of Solar Farm Connectivity with Smart PV Inverter PV-STATCOM. IEEE Trans. Sustain. Energy 2019, 10, 1161–1171. [Google Scholar] [CrossRef]
  23. Institute of Electrical and Electronics Engineers (IEEE). IEEE Standard for Interconnection and Interoperability of Distributed Energy Resources with Associated Electric Power Systems Interfaces. In IEEE-SASB Coordinating Committees; IEEE: New York, NY, USA, 2018; pp. 1–138. [Google Scholar] [CrossRef]
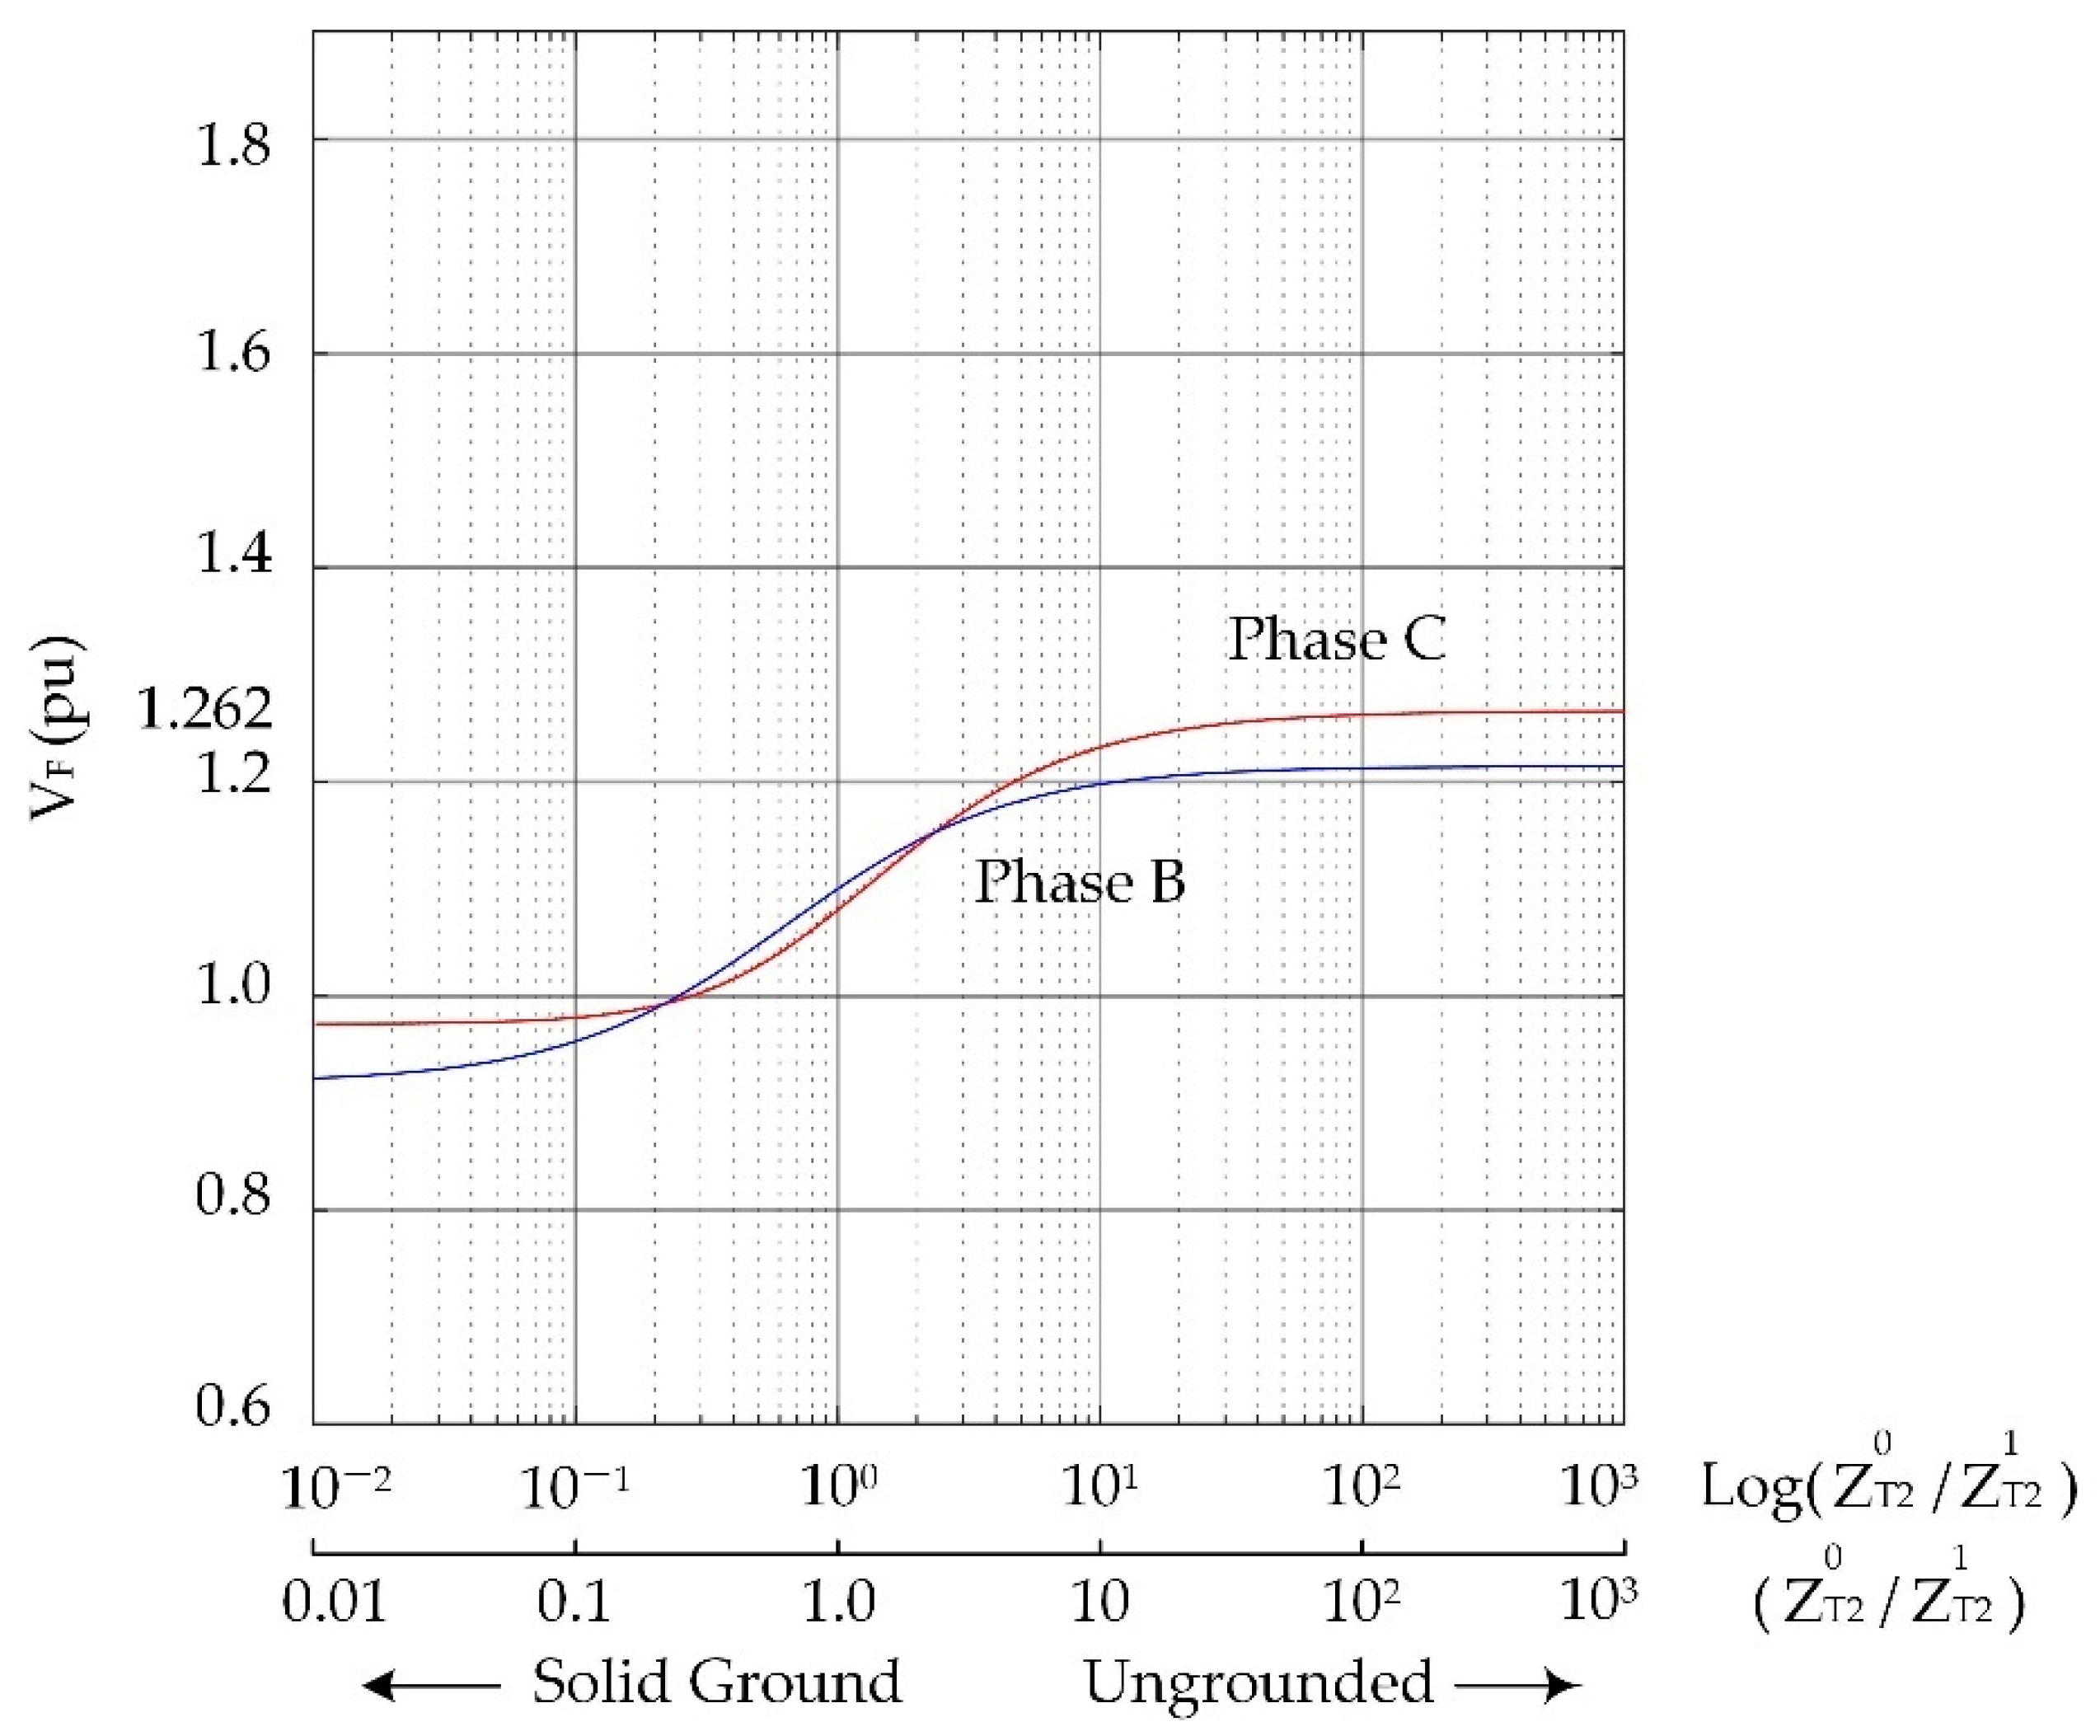
Figure 1. Voltage variation due to neutral shift: (a) pre-fault conditions, (b) ungrounded systems, and (c) effectively grounded systems.
Sustainability 13 07335 g001
Figure 2. Sequence-equivalent circuit during an SLG fault.
Sustainability 13 07335 g002
Figure 3. Voltage rise curve depending on the impedance ratio of transformer (phase B).
Sustainability 13 07335 g003
Figure 4. Standard distribution system interfaced with DGs.
Sustainability 13 07335 g004
Figure 5. Islanded mode.
Sustainability 13 07335 g005
Figure 6. Grid-connected mode.
Sustainability 13 07335 g006
Figure 7. Actual distribution system interfaced with DGs.
Sustainability 13 07335 g007
Figure 8. Synchronous-machine-based DG.
Sustainability 13 07335 g008
Figure 9. Inverter-based DG.
Sustainability 13 07335 g009
Figure 10. Synchronous-machine-based DG.
Sustainability 13 07335 g010
Figure 11. Inverter-based DG.
Sustainability 13 07335 g011
Figure 12. Synchronous-machine-based DG.
Sustainability 13 07335 g012
Figure 13. Inverter-based DG.
Sustainability 13 07335 g013
Figure 14. Synchronous-machine-based DG.
Sustainability 13 07335 g014
Figure 15. Inverter-based DG.
Sustainability 13 07335 g015
Figure 16. Synchronous-machine-based DG.
Sustainability 13 07335 g016
Figure 17. Inverter-based DG.
Sustainability 13 07335 g017
Figure 18. Synchronous-machine-based DG.
Sustainability 13 07335 g018
Figure 19. Inverter-based DG.
Sustainability 13 07335 g019
Figure 20. Additional verification: (a,c,e) are the results of synchronous-machine-based DGs; (b,d,f) are the results of inverter-based DGs.
Sustainability 13 07335 g020
Table 1. Voltage formula depending on ground systems.
Phase-B Voltage, VbPhase-C Voltage, Vc
Solidly grounded systems ( Z 0 = 0 ,   Z 1 Z 2 ) ( a 2 a ) Z 1 2 Z 1 E a = 0.866   E a ( a a 2 ) Z 1 2 Z 1 E a = 0.866   E a
Ungrounded systems ( Z 0 = ,   Z 1 Z 2 ) ( a 2 1 ) 1 = 1.732   E a ( a 1 ) 1 = 1.732   E a
Table 2. System parameters.
Main Generator (G1)MTRLineInterconnection
Transformer
(T1)
DG
Rated power [MVA]1004510033 (DG1, DG2)
Rated voltage [kV]154154/22.9/6.622.922.9/0.380.38
Table 3. System parameters.
G1MTRLineInterconnection
Transformer
DG
Rated power [MVA]100451000.2 (T1, T2)0.2 (DG1, DG2)
0.1 (T3, T4)0.1 (DG3, DG4)
Rated voltage [kV]154154/22.9/6.622.922.9/0.380.38
Table 4. Maximum voltages in a synchronous-machine-based DG system.
BUSVoltage (pu)
51.8291 at Phase C
61.8295 at Phase C
71.0331 at Phase A
Table 5. Maximum voltages in an inverter-based DG system.
BUSVoltage (pu)
51.1498 at Phase B
61.1498 at Phase B
71.0000 at Phase C
Table 6. Maximum voltages at the point of 0.5 in a synchronous-machine-based DG system.
BUSVoltage (pu)
50.9896 at Phase C
60.9756 at Phase B
71.0790 at Phase C
Table 7. Maximum voltages at the point of 0.5 in an inverter-based DG system.
BUSVoltage (pu)
51.7888 at Phase B
61.7856 at Phase B
72.0023 at Phase C
Table 8. Maximum voltages at the point of 2.5 in a synchronous-machine-based DG system.
BUSVoltage (pu)
50.9861 at Phase B
60.9834 at Phase B
71.0782 at Phase C
Table 9. Maximum voltages at the point of 2.5 in an inverter-based DG system.
BUSVoltage (pu)
50.9219 at Phase B
60.9191 at Phase B
71.0037 at Phase C
Table 10. Maximum voltage analysis results based on fault resistance with various scenarios.
Scenario123456
Condition
  • x0/x1: 1000 (ungrounded)
  • Ratio of load to DG: 1
  • Fault location: 2.5 km
  • x0/x1: 1
  • Ratio of load to DG: 0.5
  • Fault location: 2.5 km
  • x0/x1: 1
  • Ratio of load to DG: 0.5
  • Fault location: 5 km
DG typeSynchronous-machine-based DGInverter-
based DG
Synchronous-machine-based DGInverter-
based DG
Synchronous-machine-based DGInverter-
based DG
Fault
Resistance:
0 (Ω)
1.82911.14940.98961.78881.01121.8001
Fault
Resistance:
2 (Ω)
1.80111.14641.00801.78821.02481.8000
Fault
Resistance:
4 (Ω)
1.77461.14361.02481.78761.03711.7993
Fault
Resistance:
6 (Ω)
1.74971.14011.03951.78721.04761.7987
Fault
Resistance:
8 (Ω)
1.72621.13821.05181.78671.05641.7982
Fault
Resistance:
10 (Ω)
1.70391.13561.06181.78631.06341.7977
Fault
Resistance:
30 (Ω)
1.53451.11431.08241.78441.07551.7949
Publisher’s Note: MDPI stays neutral with regard to jurisdictional claims in published maps and institutional affiliations.

