Article

Impact of the Wind Turbine on the Parameters of the Electricity Supply to an Agricultural Farm

by
Zbigniew Skibko
1,*,
Magdalena Tymińska
2,
Wacław Romaniuk
3 and
Andrzej Borusiewicz
2
1
Faculty of Electrical Engineering, Bialystok University of Technology, 15-351 Bialystok, Poland
2
The Higher School of Agribusiness in Lomza, 18-402 Lomza, Poland
3
Department of Rural Technical Infrastructure Poland, Institute of Technology and Life Sciences, Branch in Warsaw, 02-532 Warsaw, Poland
*
Author to whom correspondence should be addressed.
Sustainability 2021, 13(13), 7279; https://doi.org/10.3390/su13137279
Submission received: 1 June 2021 / Revised: 23 June 2021 / Accepted: 25 June 2021 / Published: 29 June 2021

Abstract

:
Wind power plants are an increasingly common source of electricity located in rural areas. As a result of the high variability of wind power, and thus the generated power, these sources should be classified as unstable sources. In this paper, the authors attempted to determine the impact of wind turbine operation on the parameters of electricity supplied to farms located near the source. As a result of the conducted field tests, variability courses of the basic parameters describing the supply voltage were obtained. The influence of power plant variability on the values of voltage, frequency, and voltage distortion factor was determined. To estimate the capacity of the transmission lines, the reactive power produced in the power plant and its effect on the value of the power factor were determined. The conducted research and analysis showed that the wind power plant significantly influences voltage fluctuations in its immediate vicinity (the maximum value registered was close to 2%, while the value required by law was 2.5%). Although all the recorded values are within limits specified by the current regulations (e.g., the THD value is four times lower than the required value), wind turbines may cause incorrect operation of loads connected nearby. This applies mainly to cases where consumers sensitive to voltage fluctuations are installed in the direct vicinity of the power plant.

1. Introduction

Man has used wind energy for several thousand years. At that time, windmills were used to drive various types of machinery and equipment. Interest in windmills began to wane with the advent of steam engines and, in time, with the electrification of populated areas (development of electricity systems). Nowadays, interest in windmills—as devices for generating electricity—is returning. As a result, wind energy has also become a trendy field of research. Research topics can be divided into wind prediction and productivity forecasts [1,2], efficiency (optimization) of power generation [3,4,5,6,7], and the impact of power plants on the environment [8,9]. The subject matter of this paper falls within the scope of research concerning the influence of wind power plants on the quality of energy supplied to consumers located in the direct vicinity of the power plant.
In Poland, the wind energy sector has been developing for several years (Figure 1) [10,11]. The installed electrical capacity of all renewable energy source installations in 2020 exceeded 9500 MW. The capacity of wind power plants was 6347 MW [10,12]. Despite unfavorable legal conditions, lack of investment support, and the complexity of the administrative process related to the commissioning of the power plant, Polish investors show extraordinary resourcefulness and commitment to the construction of wind installations [13]. However, the distribution of power plants across the country is not regular (Poland is divided into 16 provinces). The highest power is generated in Zachodniopomorskie province (1800 MW) and the lowest in Małopolskie province (150 MW) [14].
The availability of different types of renewable energy sources depends on geographical location (e.g., the highest wind power is recorded in the northern regions of Poland) and agricultural use of soils (the most suitable for the construction of wind turbines is low-class land and located at a significant distance from wooded areas). The amount of installed capacity in different types of renewable energy sources used in the Podlaskie province is shown in Figure 2. Wind energy is the most widespread there. On the other hand, hydropower is the least developed, mainly due to the lack of natural water dams. Comparing the capacities of sources installed in urban and rural areas, non-urbanized areas are much better (due to land allowing the location of large generation units) [17].
The most recent document regulating planning in the energy sector is the “Energy Policy of Poland until 2040” [18]. Ensuring energy security is to go hand in hand with energy efficiency while maintaining the lowest possible impact of energy on the environment. It is expected that, in 2030, the share of RES in gross final energy consumption will be at least 23%—not less than 32% in electricity (mainly wind and PV). Installed offshore wind capacity will be around 5.9 GW in 2030 and 11 GW in 2040.
The increase in the number of wind turbines in low-urbanized areas poses significant challenges to the power system’s stability [19], protection [20], and security [21]. Power system security is defined as its ability to overcome random events (such as a significant fault) and deliver energy to consumers under abnormal conditions [22]. The need to centrally control many power unstable sources (wind and PV power plants) generates many difficulties maintaining system stability [23,24,25]. Hence, the branch of energy system stability modelling is increasingly developing [26,27]. Consequently, conventional methods of power system stability and security assessment show unsatisfactory performance. Several methods are used to improve the system stability with a large number of wind turbines. The noteworthy one is inertia control based on the frequency response estimation method [28]. Simplicity and low cost are characterized by integrating differential PI and PID controllers [29,30]. Many authors have also addressed power plant grid cooperation [31,32,33,34,35]. Some of them dealt with the dynamic impact of power plants [36,37]. However, none of the items dealt with analyzing the impact of a power plant on loads installed in its immediate vicinity. Power system stability issues are mainly classified as voltage stability, angular stability, or frequency stability problems [22,38,39]. This paper presents a field study of the effect of a wind turbine on the voltage parameters of a power grid at the connection point of an agricultural farm (located near the power station).
Wind power plants connected to the medium-voltage grid very often operate in the direct vicinity of farms. Particularly for cattle and pig farmers, providing energy with adequate parameters regardless of random events is very important [40,41]. The operation of a wind turbine is associated with constant changes in its operating condition, resulting in both the construction of the turbine and the variability of wind direction and strength. As a result of these changes, the connected wind power plants have a dynamic impact on the power grid at their point of connection.
The equipment of a wind power plant must be selected in such a way as to ensure that voltage values (specified in the terms and conditions of connection) are maintained at the point of grid connection and stability of the power plant’s operation with the power system. Wind power plants connected to the Polish power grid should not cause sudden voltage changes and jumps exceeding 3%, both during regular operation and in the case of start-ups and shutdowns of generating units (including emergency shutdowns). If voltage disturbances caused by the operation of wind power plants have a recurring character, then a single quick change of the practical value of the voltage at the connection point should not exceed 2.5% for a frequency of fewer than 10 disturbances per hour and 1.5% for a frequency of up to 100 disturbances per hour [42,43,44]. The authors became interested in this topic when, on one of the farms, irregular operation of the equipment installed there was observed. In particular, during the milking of cows (when the power consumption is the highest and the mains voltage is the lowest), outages of the latest milking machines were observed on windy days. These machines are susceptible to fluctuations in the supply voltage. In these conditions, every shutdown of a neighbouring wind turbine resulted in a shutdown of the milking cluster. Switching off the milking cluster required the operators to switch it on again. It also caused additional stress to the cows being milked.

2. Materials and Methods

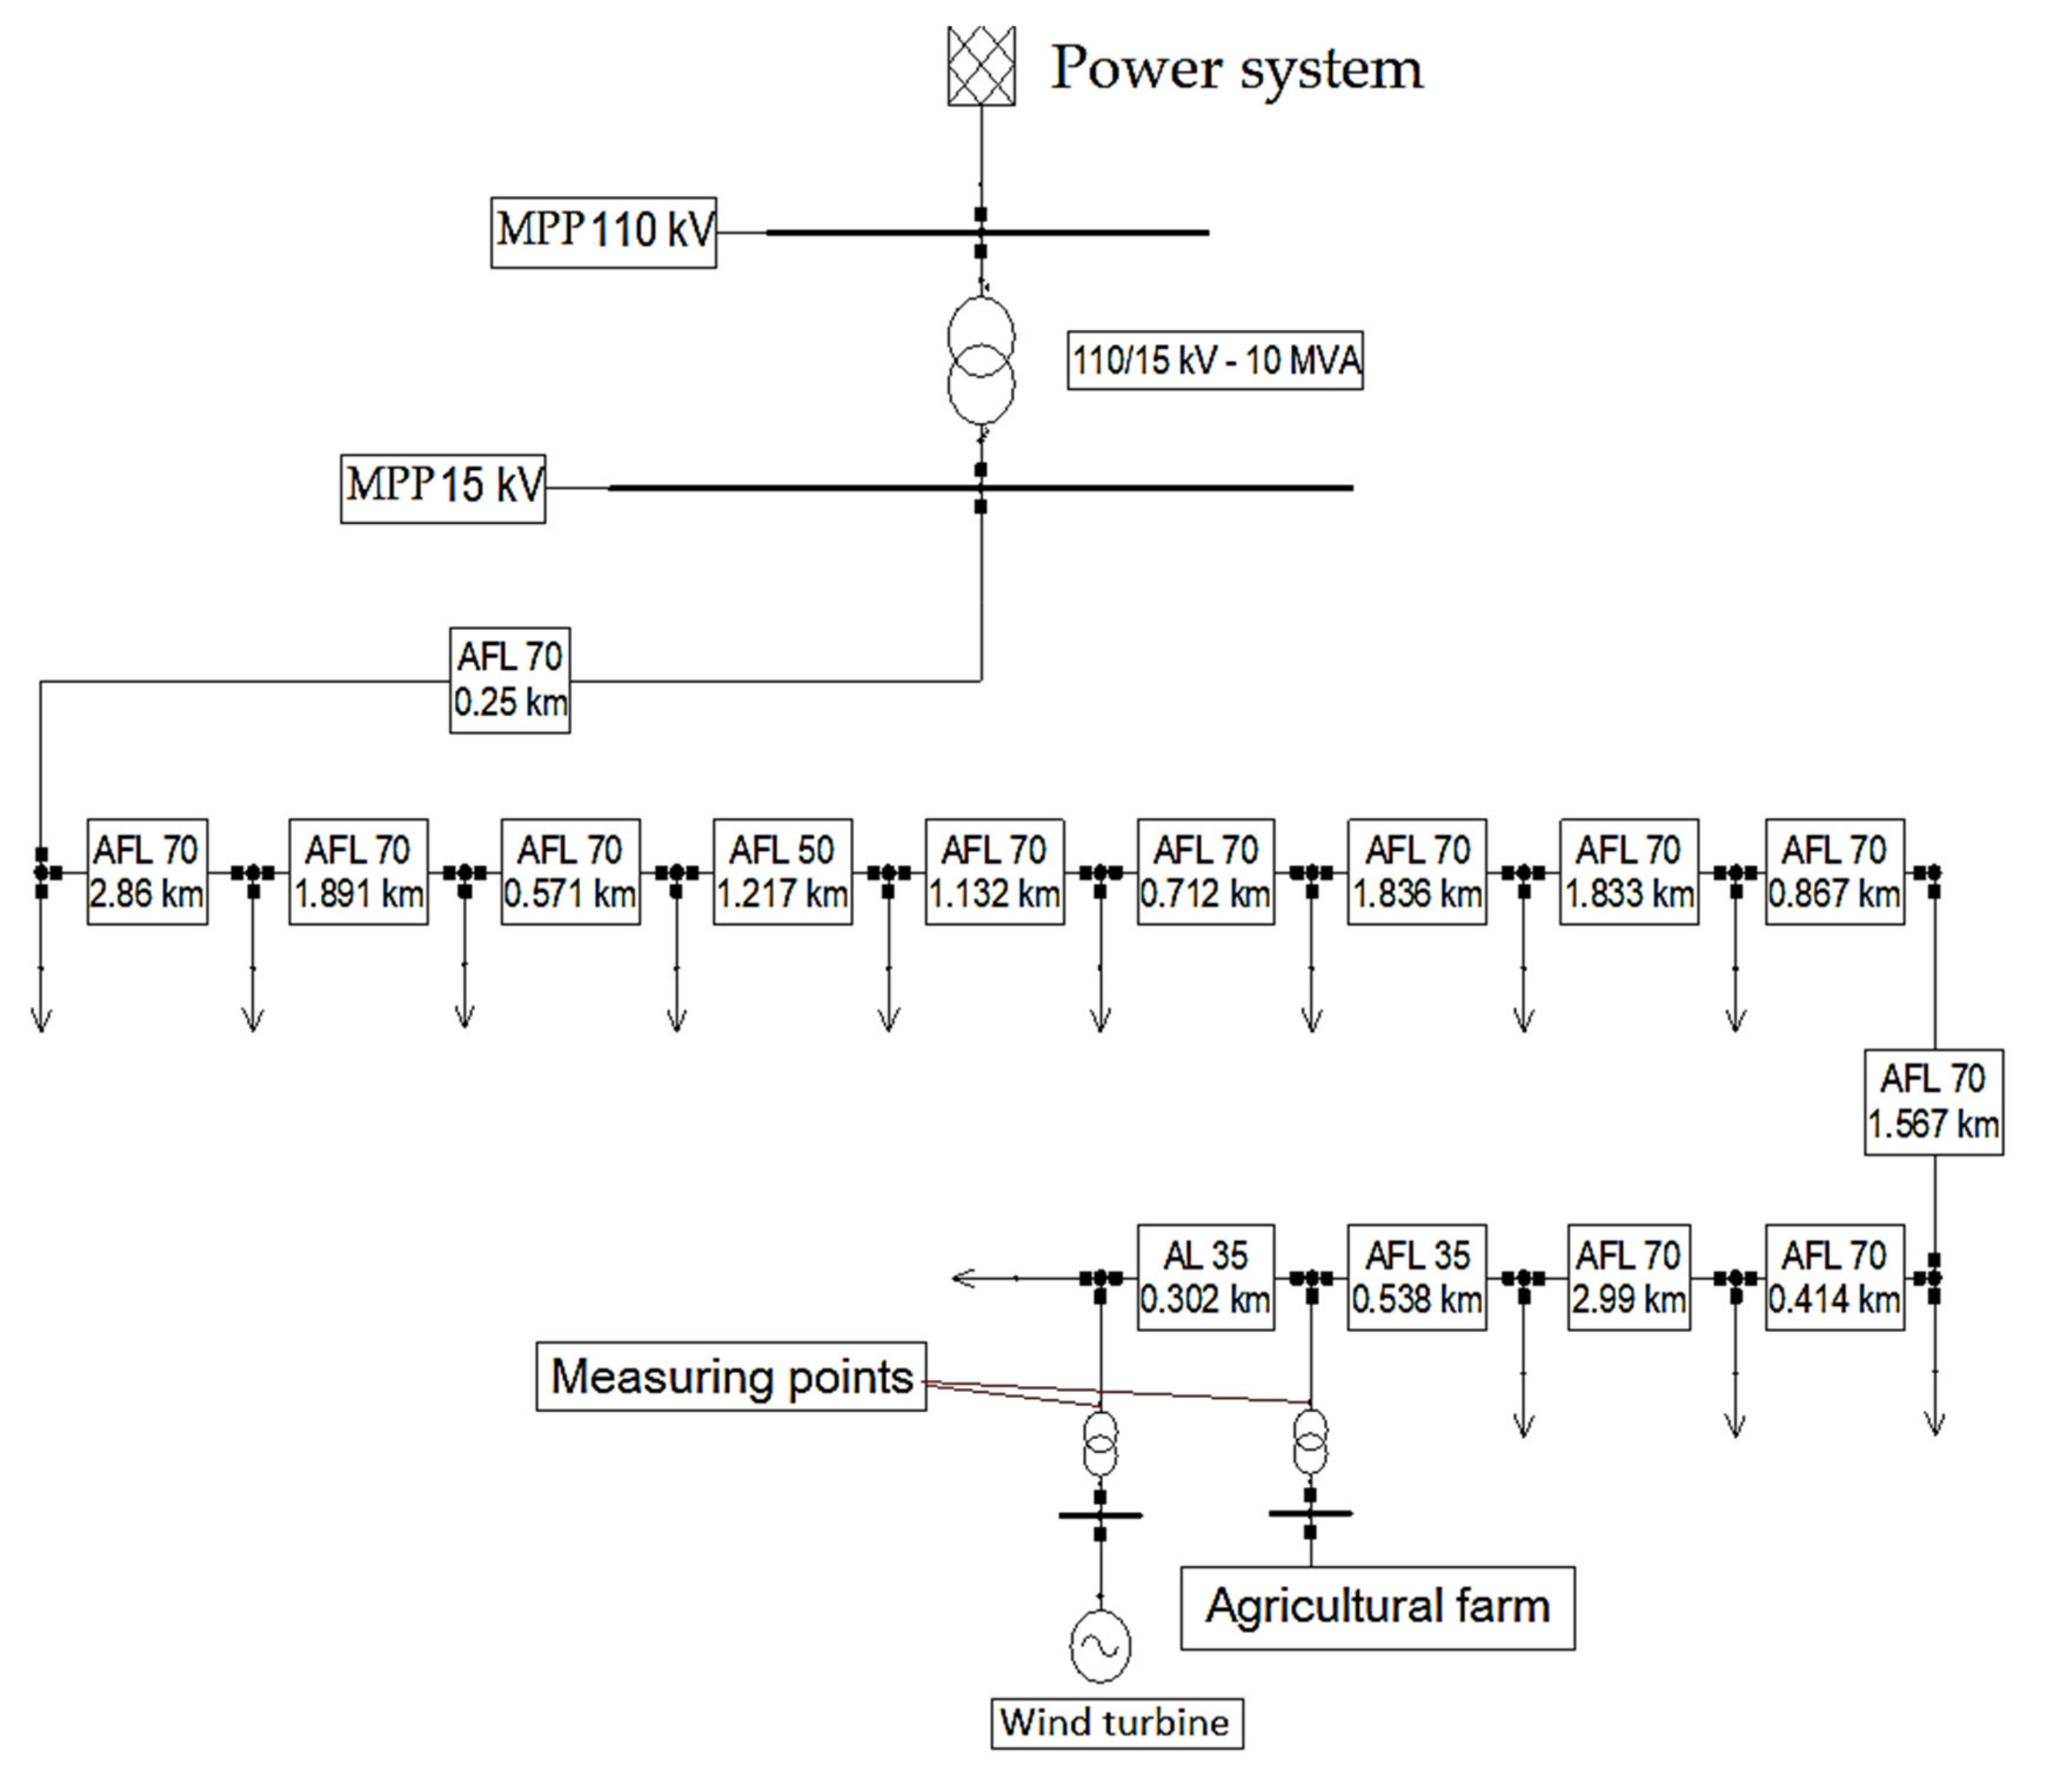
The registration of parameters describing the quality of electricity was made in the 15 kV power system of the professional power industry. The analysis concerned the medium voltage network to which an ENERCON E-40 wind power plant and a farm specializing in dairy cattle farming were connected in the immediate vicinity. The equipment recording the voltage quality parameters was installed on the medium voltage side, both in the place of the power plant connection (to measure the power generated by the source) and in the place of the farm connection (to measure the quality parameters of electricity supplying it). A schematic diagram showing the network structure in which the research was conducted is presented in Figure 3. The power line connecting the wind turbine with the farm is a 15 kV overhead line made with 35 mm2 aluminium conductors. The length of the line is 302 m.
Technical data of the tested Enercon E40 500 kW wind power plant:
  • rotor diameter, 40.3 m,
  • rotor swept area, 1275 m2,
  • rpm, rated power, 36 rpm,
  • rpm, initial, 18 rpm,
  • type of generator, synchronous ring generator
  • rated active power, 500 kW,
  • rated apparent power, 510 kVA,
  • rated power factor, 0.98
  • nominal voltage, 440 V,
  • rated current, 738 A,
  • rated frequency, 50 Hz,
  • cut-in wind speed, 3 m/s,
  • nominal wind speed, 12 m/s,
  • cut-out wind speed, 25 m/s,
  • ENERCON AC/AC converter.
One of the parameters describing the quality of electricity is the distortion of the supply voltage from sinusoidal waveforms. This parameter is currently increasing importance, mainly due to the increasing number of non-linear loads connected to the power grid. For the analysis of distorted (non-sinusoidal) waveforms, their decomposition into harmonics is used, sinusoidal waveforms with frequencies that are a multiple of the fundamental frequency (first harmonic). The most important indicators used to assess distortion are the percentage of each harmonic related to the first harmonic and the Total Harmonics Distortion (THD). The percentages of the individual voltage harmonics are determined from the following relationships [45]:
U h % = U h U 1 · 100 %
  • where: Uh—RMS voltage of the h-th harmonic, U1—RMS voltage of the fundamental harmonic, h—order of the harmonic.
  • The value of the total voltage distortion coefficient THDU (expressed as a percentage) can be described by the relation [45]:
T H D U = h = 2 n U h 2 U 1 · 100 %
A portable power quality analyzer MAVOWATT 240 from GOSSEN METRAWATT, with serial number MW240AJA007, with calibration certificate No. 101/45164804 issued by Drantez Laboratory was used to record changes in electrical quantities.
The analyzer is designed to measure and record the performance of single- and three-phase electrical networks according to the highest internationally accepted standards such as IEC 61000-4-30 Class A (all measured values), IEC 610004-7 (harmonics), IEC 61000-4-15 (flicker), IEEE 1159, IEEE 519 and IEEE 1453. It allows measurements in CAT III and CAT IV installations. The device has 8 galvanically isolated (1 kV) input channels, 4 for voltage measurement and 4 for current measurement. This makes it possible to measure true RMS values, peak values, and fundamental harmonic value of voltage and current for three phases and neutral and protective conductor and DC voltage and current. In addition, MAVOWATT 240 allows to measurement and record electrical quantities in steady and fault states (transient recording up to 10,000 cycles with the frequency of 512 samples/cycle).
To determine the effect of wind turbine operation on the voltage parameters supplying the farm, tests were performed with continuous winds allowing more than 50% of the rated power of the power plant. In addition, shutdowns were performed while the power plant was operating at its rated capacity. The tests consisted of measuring electricity parameters during operation and switching the wind turbine on and off three times. Direct measurement cycles occurring one after the other, including the time of operation and shutdown of the power plant, make it possible to determine the impact of the power plant on the grid while minimizing the impact of changes occurring independently in the mains.
Preliminary investigations included registering electricity quality parameters over one week (under the requirements of the quality standards in force in Poland). Measurements were made with the wind power plant in operation (one week) and switched off (the second week). However, the obtained values were burdened with a significant error. Changes in the parameters resulted from changes in the power plant’s operational status and disturbances occurring in the network (e.g., ground faults, changes of taps on the transformer, daily load variability). Moreover, with such a long sampling time (under regulations, the recording was carried out in 10 min intervals), it was impossible to observe changes resulting from switching on and off the power plant. In addition, at this time, there was the greatest impact of the power plant on the parameters of the supply voltage. Having the above in mind, the authors decided to carry out the tests in a shorter time interval, limiting the influence of the network on the tested values. Three measurement cycles were performed, immediately following each other. Each of these cycles included the time of operation and standstill of the power plant. The operating time of the power plant lasted at least 7 min until the power plant reached at least its rated power. Then the power plant was switched off. Once the wind power plant parameters had stabilized, a “background” measurement was made for about 7 min, after which the power plant was switched on again. The test was repeated three times to confirm the repeatability of the values achieved. All parameters describing the power quality (currents, voltages, powers, power coefficients, flickers, THD, harmonics) were recorded at a sampling rate of 1 min. From each one-minute data set, three values were stored in the memory of the measuring device: mean, maximum and minimum). In this paper, only those indicators are presented in which the influence of the wind turbine on the given value was noticeable.

3. Results and Discussion

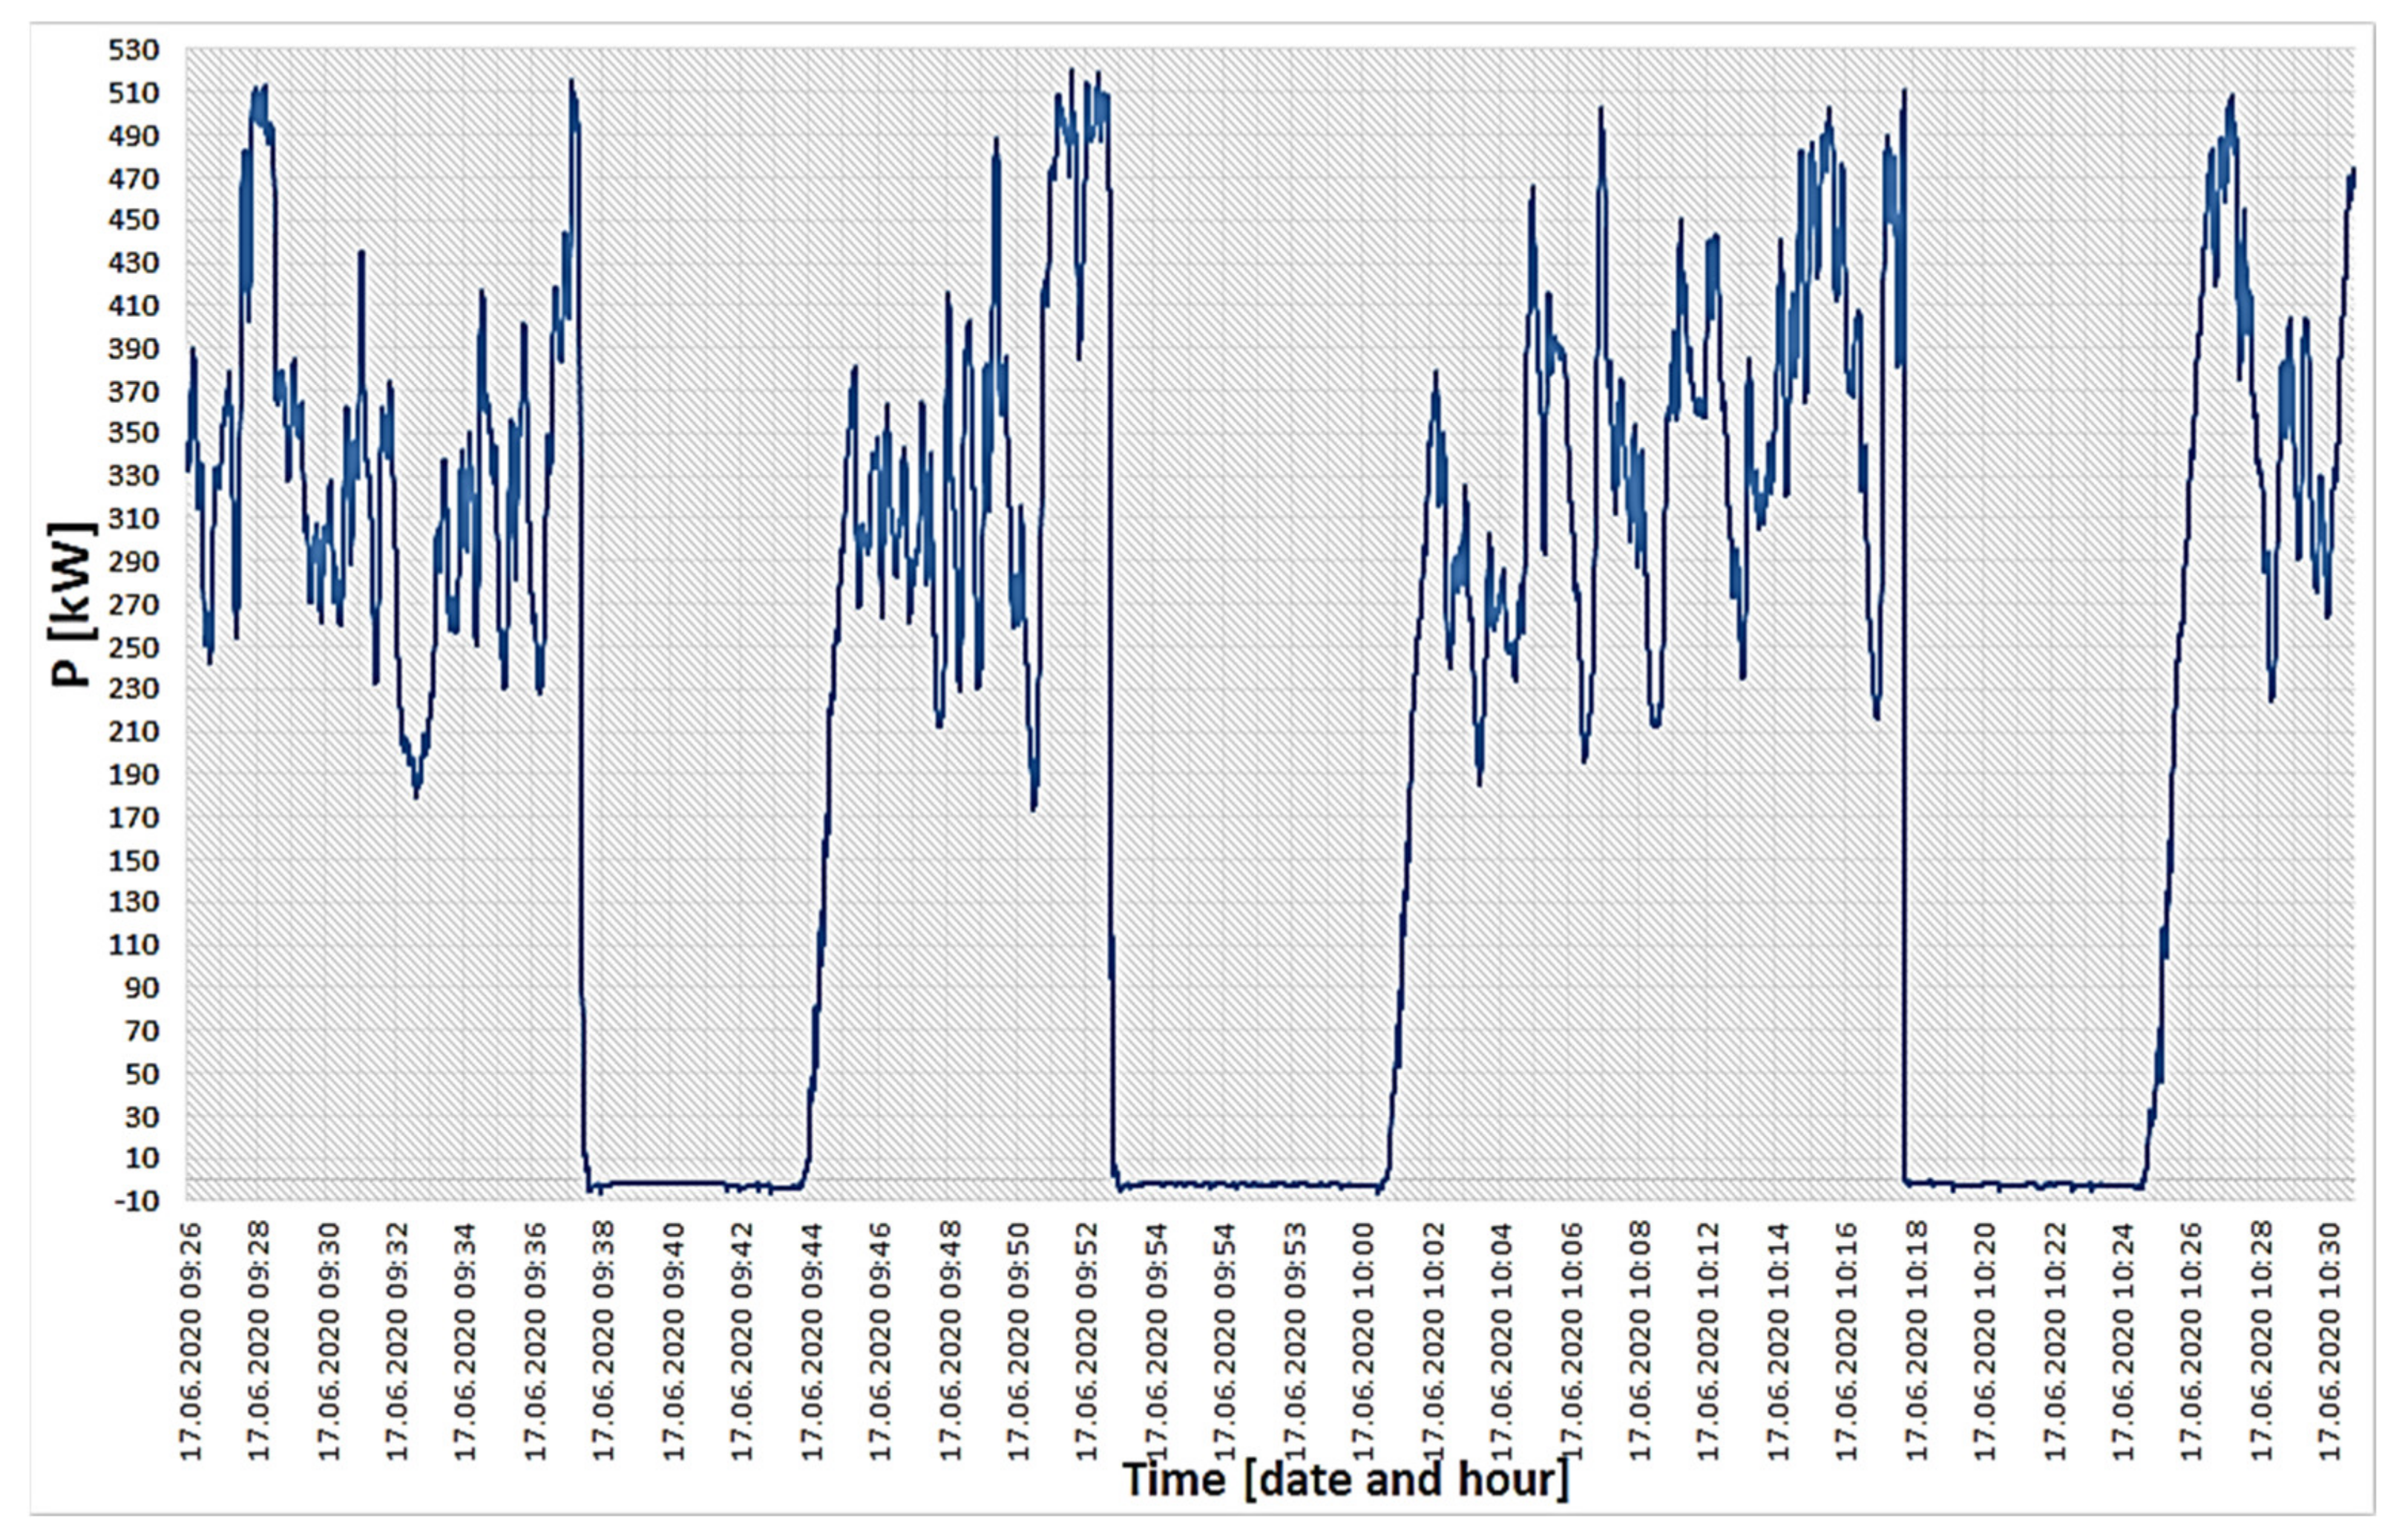
The course of the variability of active power produced by the analyzed wind power plant is presented in Figure 4. As can be seen from the recorded curve, all power plant outages occurred at power close to the rated power of the source. Negative values of power result from the necessity to cover the electricity demand of the power plant equipment (the so-called source’s own needs). This results in a change in the direction of electricity flow.
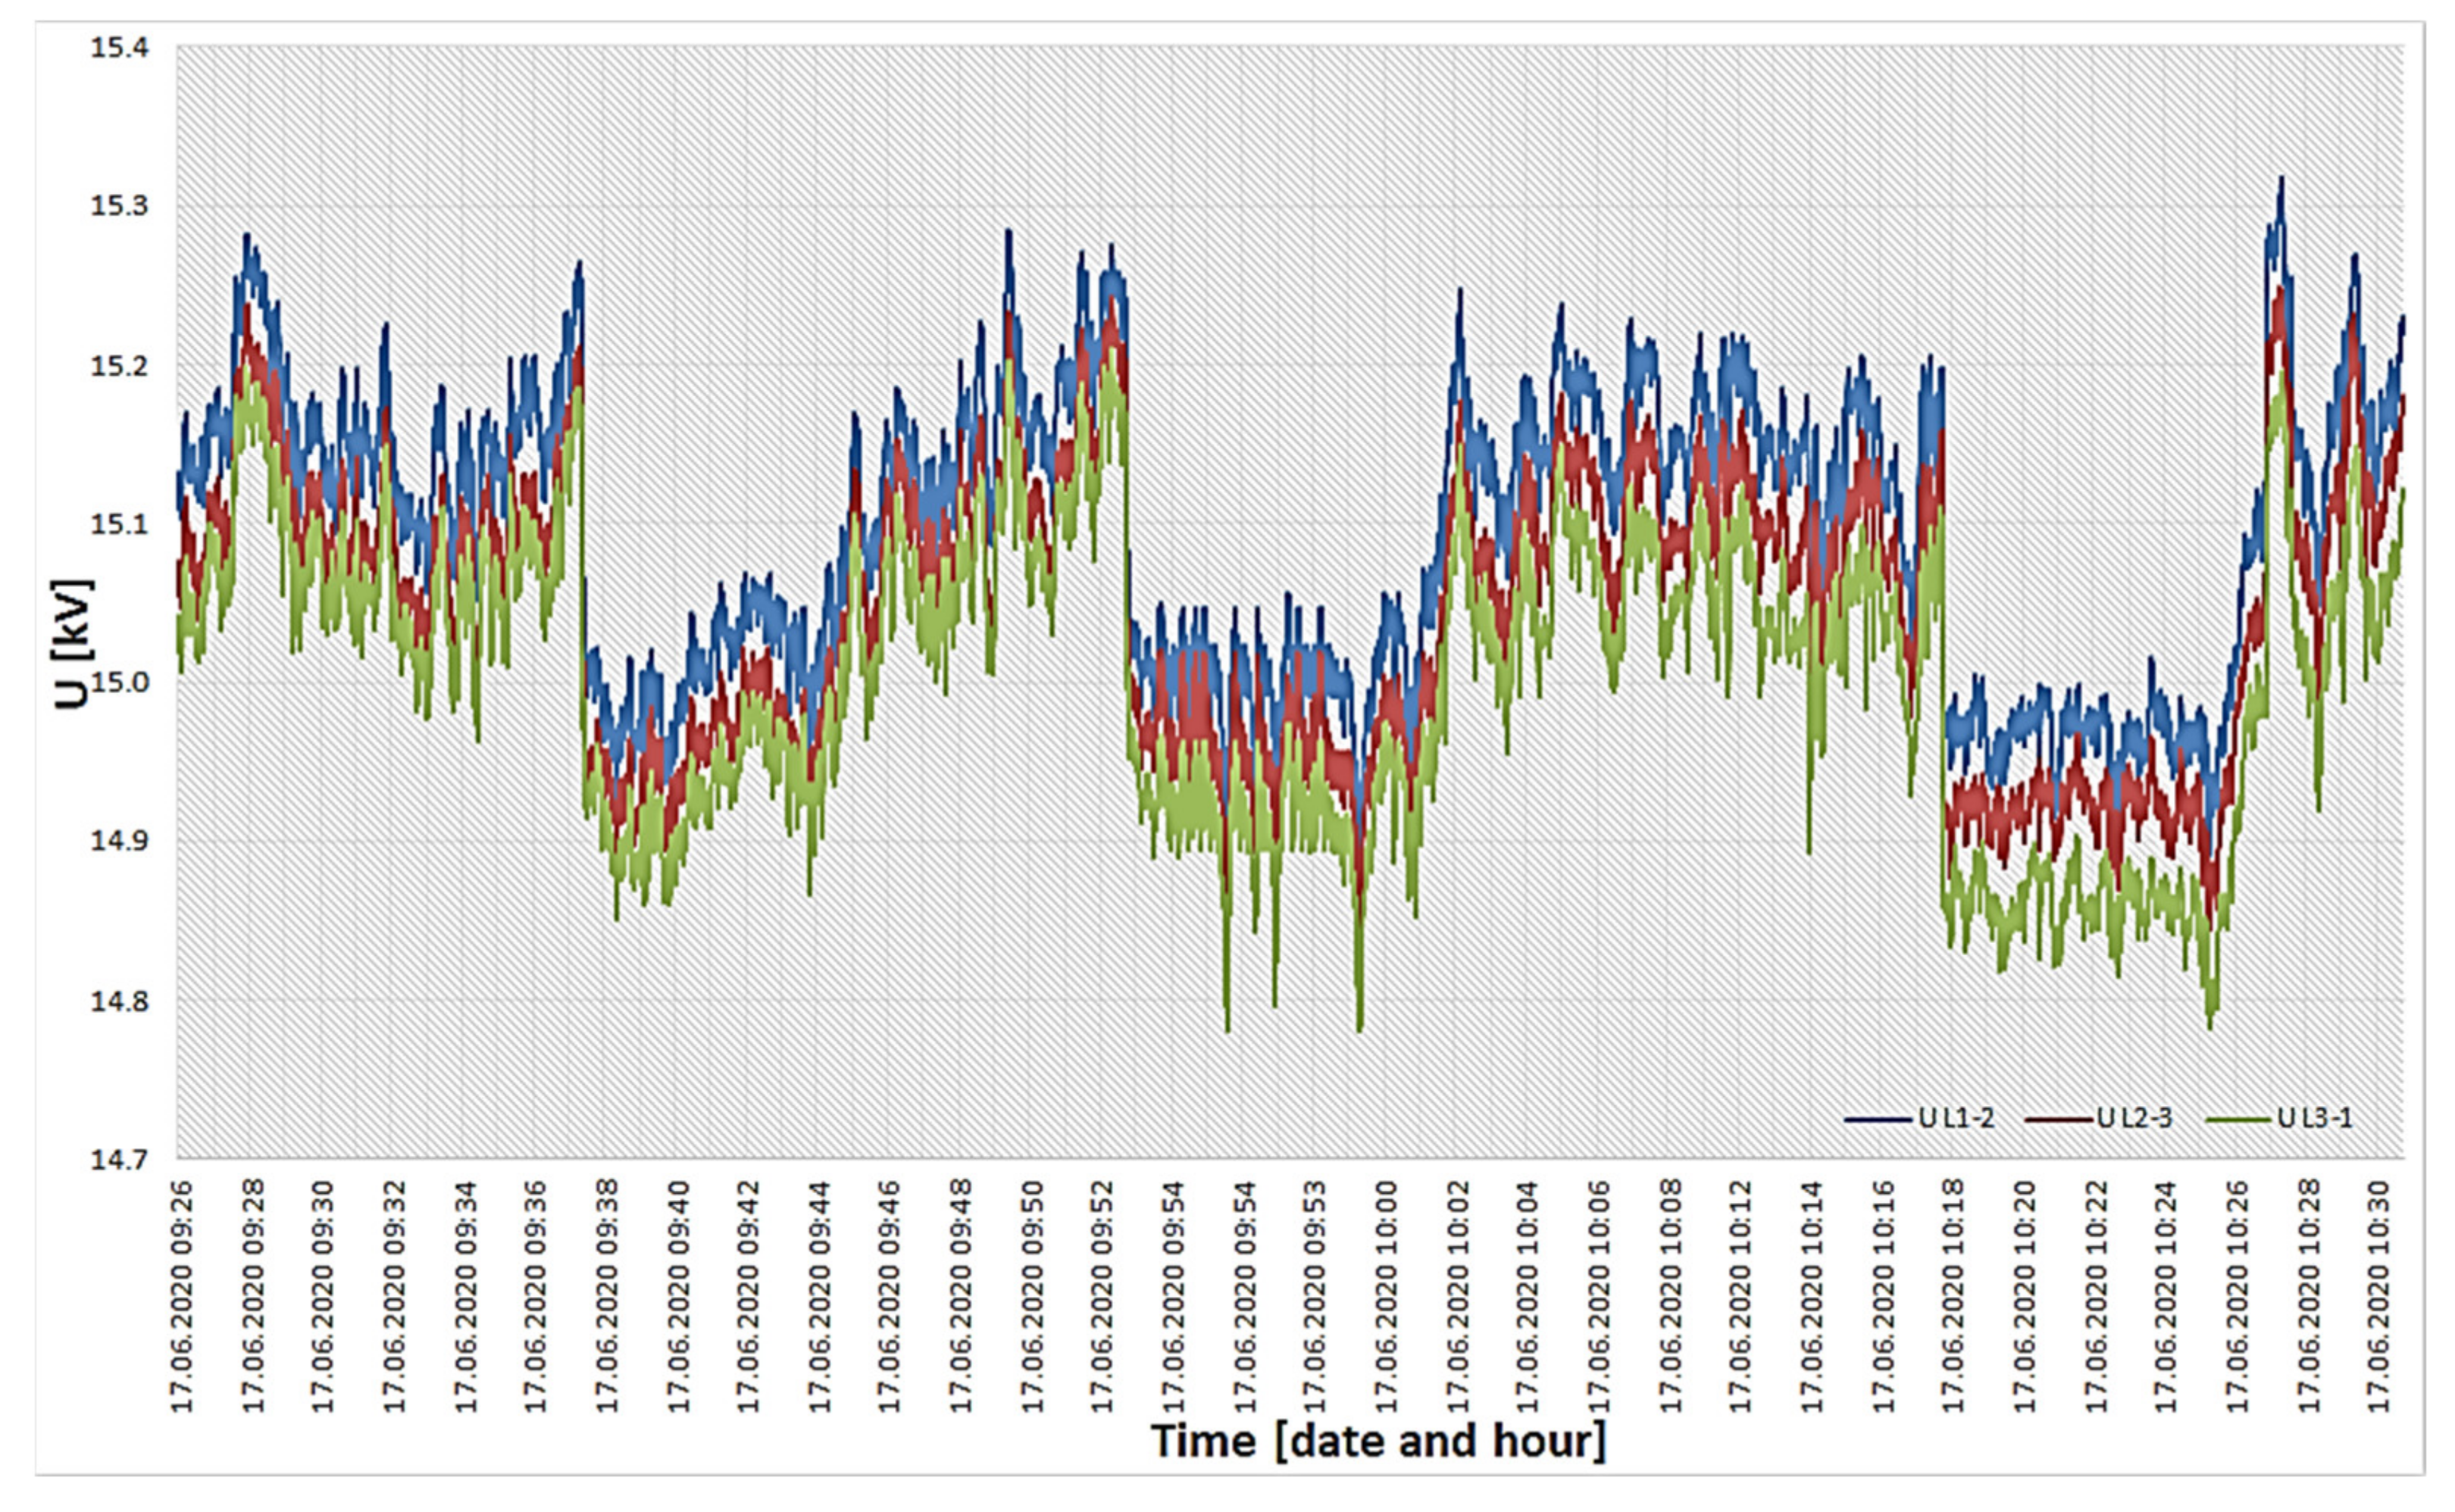
According to the theory, a change in the generation capacity at the source caused a variation in the voltage at the power plant connection point. This variation was transmitted (via the grid) to the power point located in the vicinity of the farm—Figure 5. Switching off the source caused a sudden drop in voltage values. The highest recorded voltage change in the farm was almost 2% of the rated voltage of the grid (Table 1).
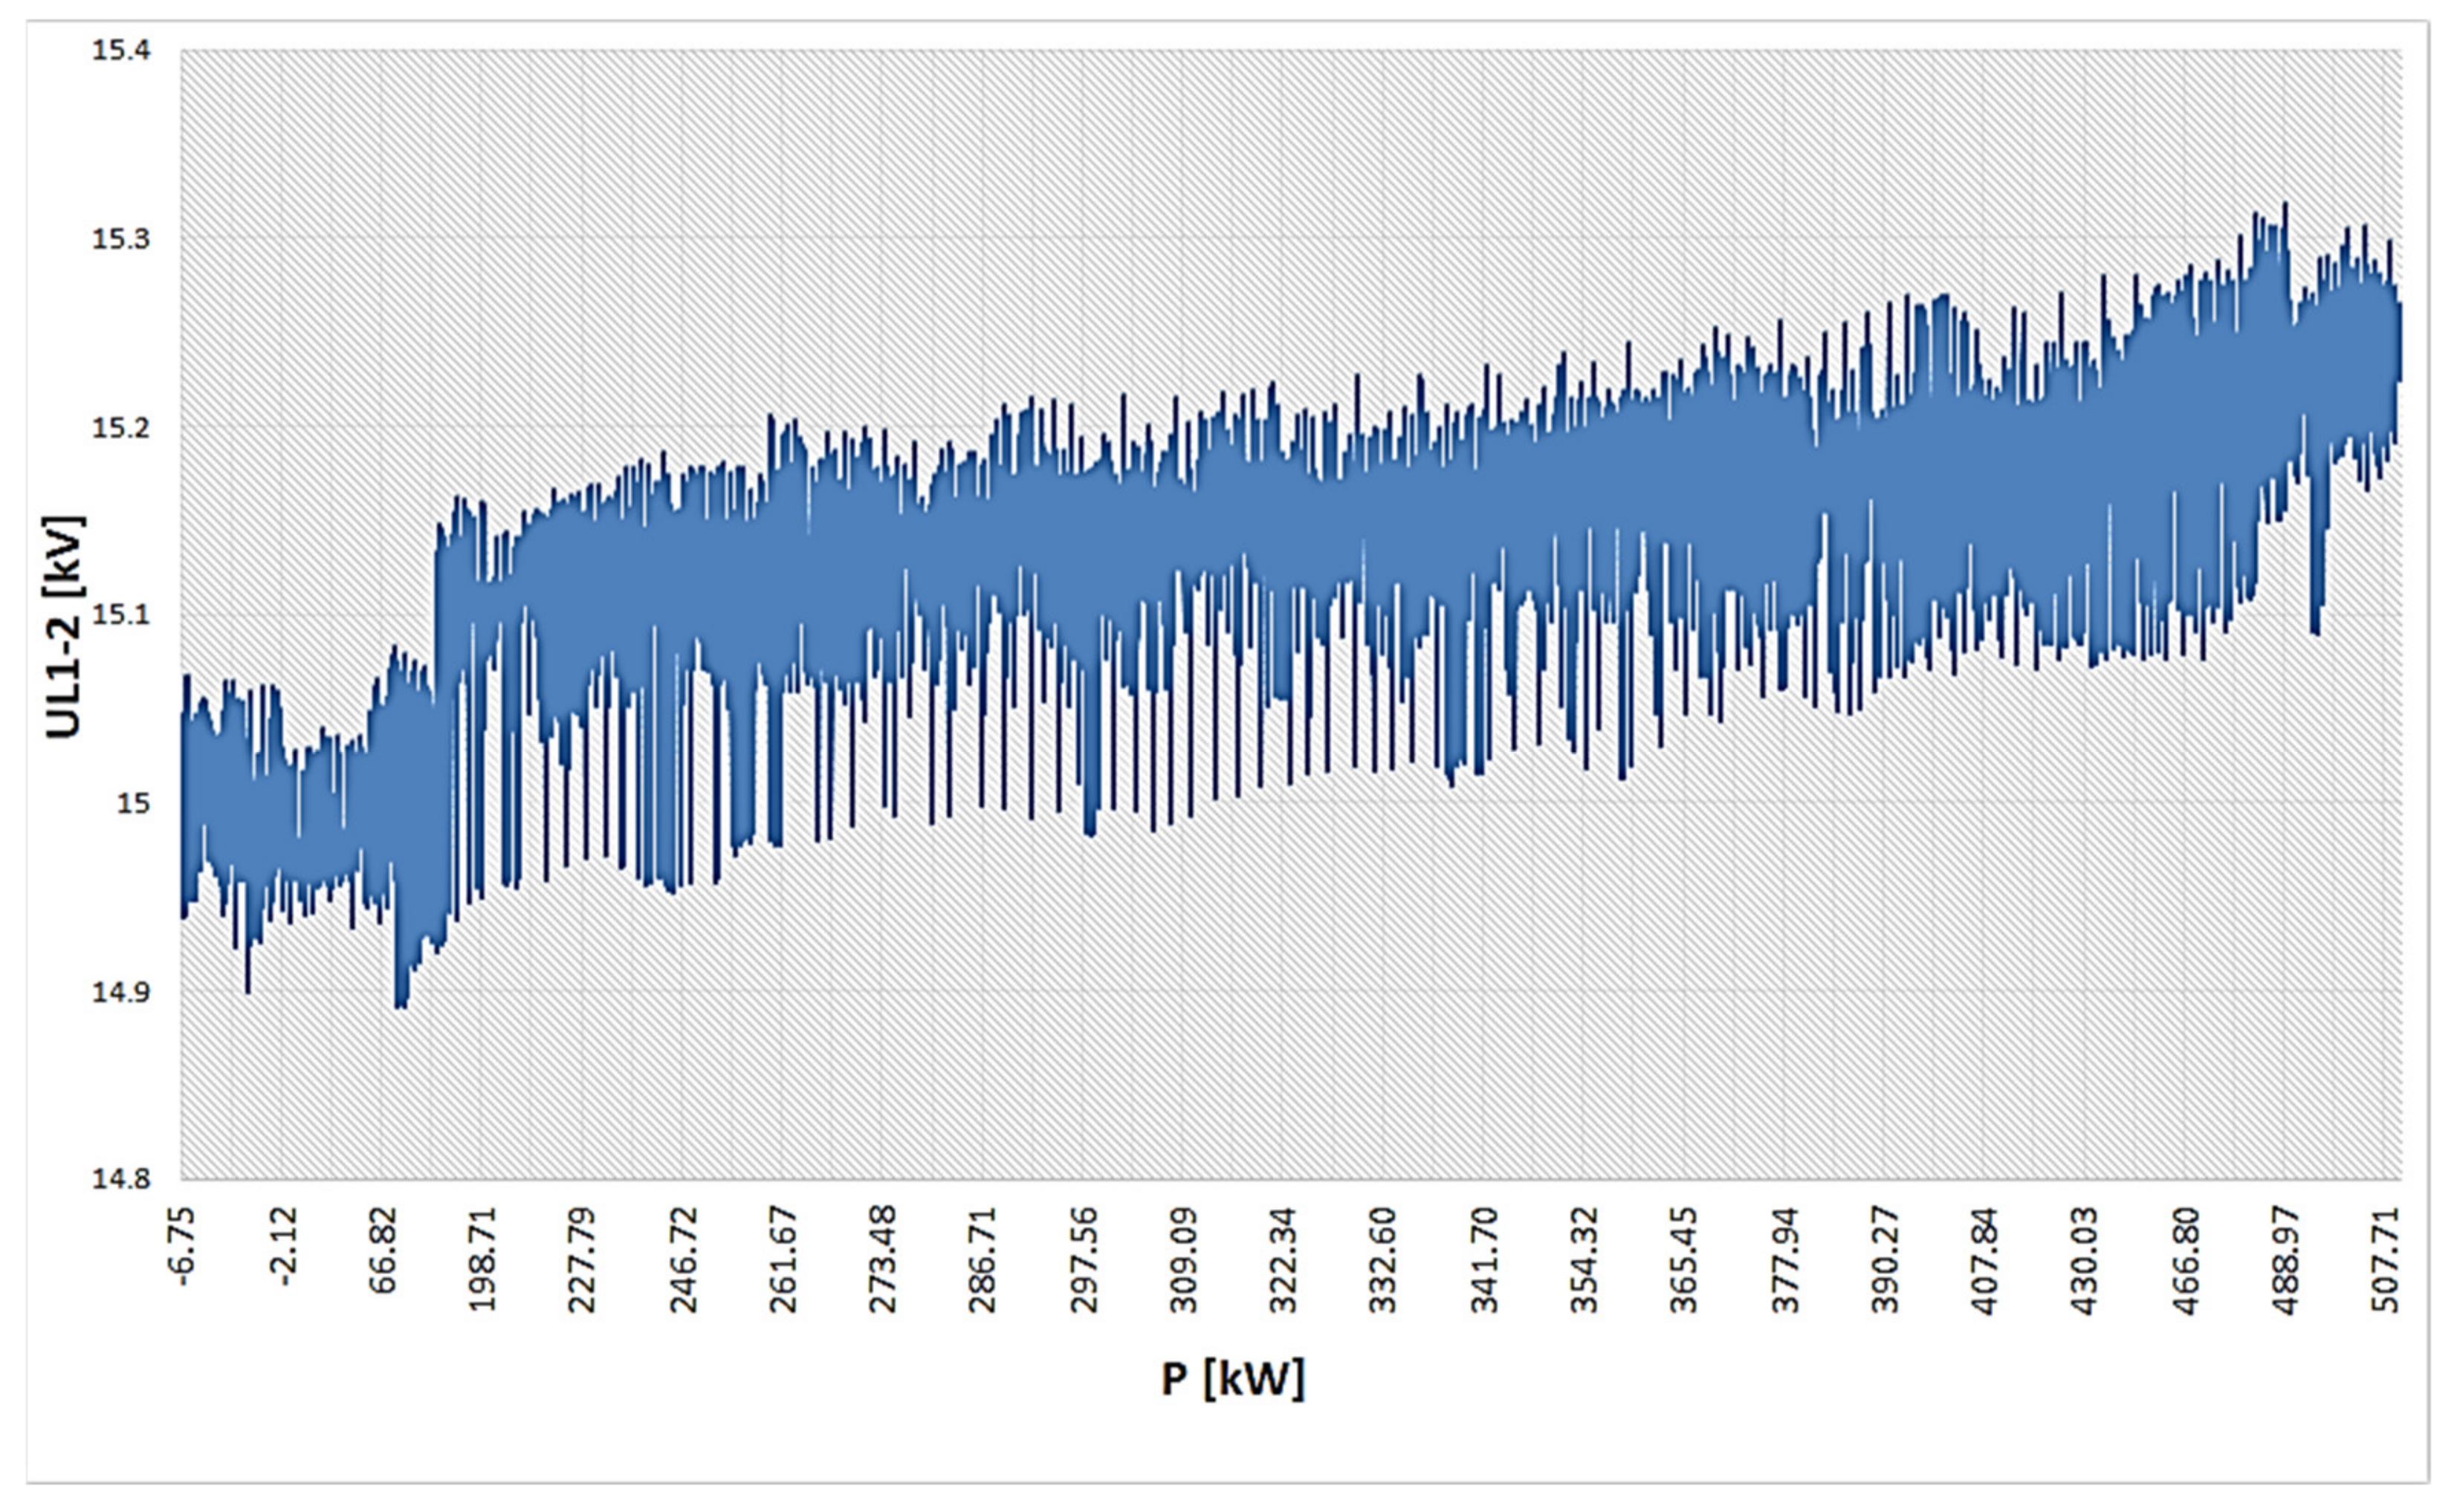
This value is lower than the value allowed by the Polish regulations (voltage fluctuations caused by the operation of the source should not be higher than 2.5%). It is also worth noting the voltage variations occurring when the power plant is not operating. The conducted analyses show that they are the result of load variability in the network. As a result of the variation in wind speed over time, the power plant’s power also fluctuates. Thus, it was possible to observe the influence of the source power on the value of the supply voltage—Figure 6. As expected, the voltage value increases with the increase of the energy generated in the power plant. However, it is worth noting that the range of voltage fluctuations is much smaller when the power plant is not operating and when the power plant is operating close to its rated power. However, prolonged nominal operation of the power plant or periods of no generation occurs very rarely during the year, so that the consumer is exposed to continuous voltage fluctuations in the supply network. However, these fluctuations are not significant as they do not exceed 0.25% over the period recorded. These values are well below the regulatory requirement of 2.5%.
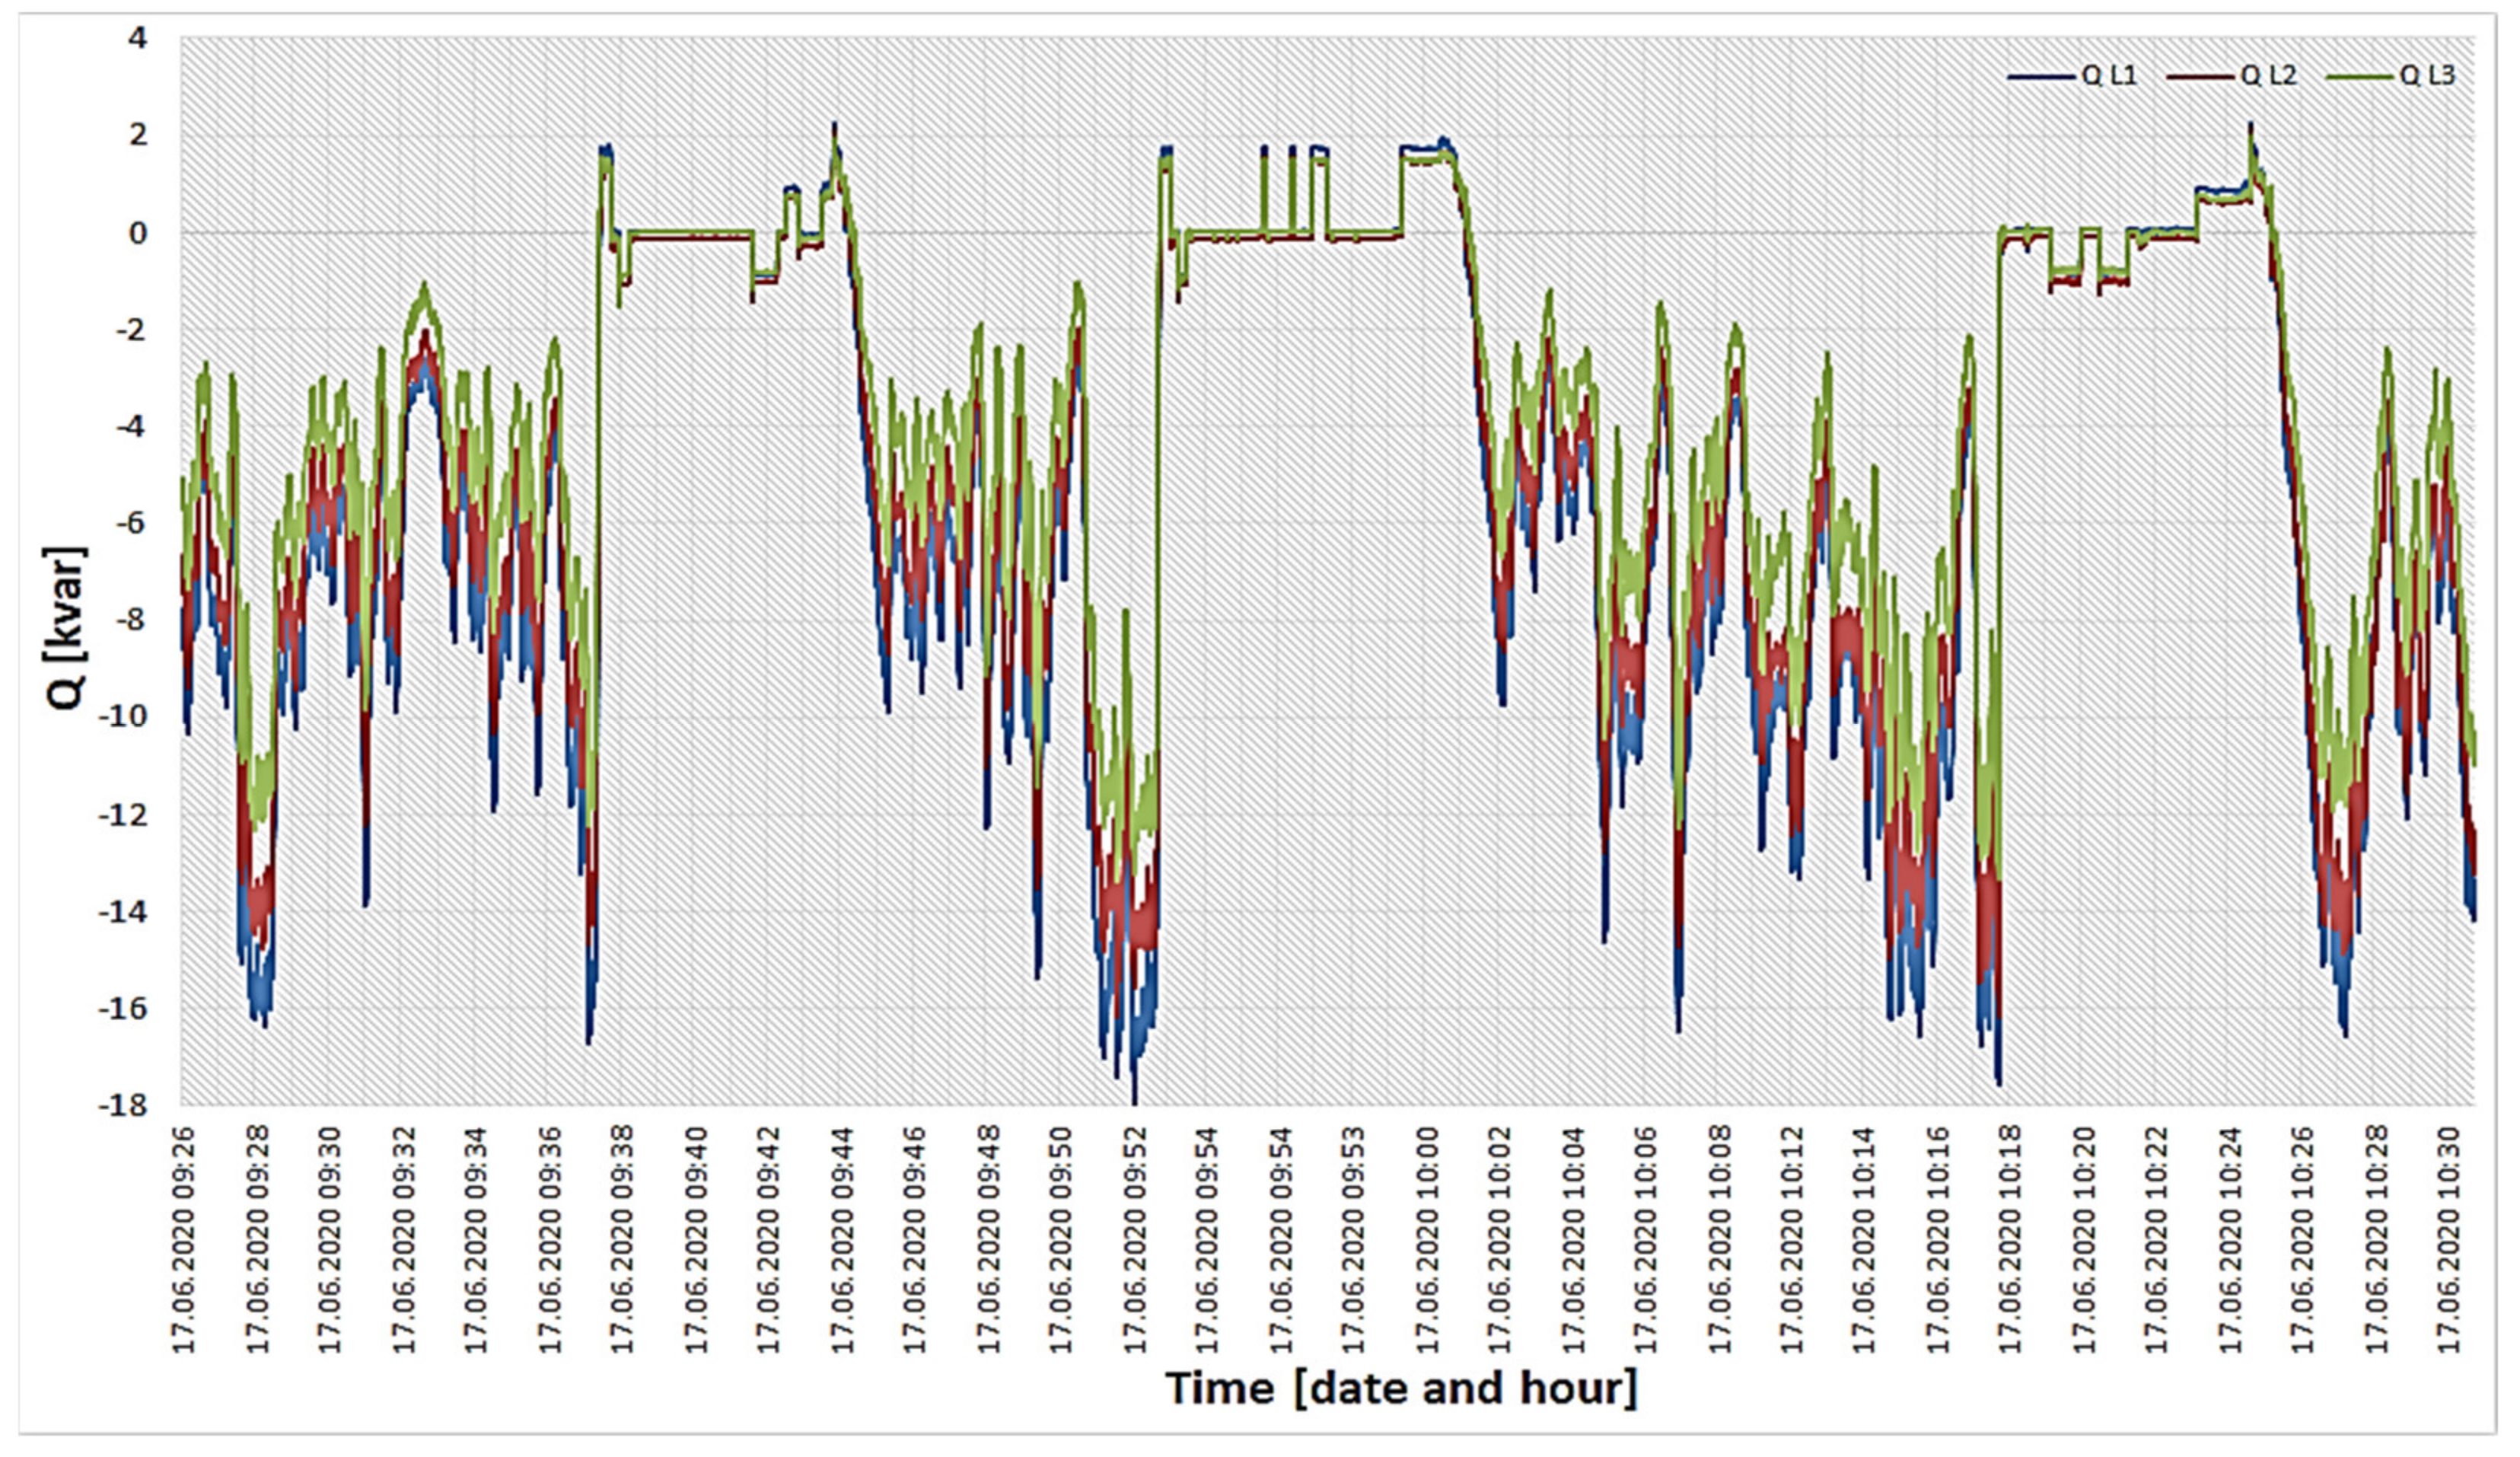
An important parameter from the point of view of the supply line capacity (and thus the availability of ordered power) is the amount of transmitted reactive power. Therefore, the values of reactive power generated by the analyzed power plant were registered (Figure 7). The value of reactive power, similarly to active power, varies in time and assumes the highest values during the rated generation (Figure 8). During the standstill of the power plant, the character of reactive power is variable. During the power plant start-up, the reactive power takes on a capacitive character (shown as positive values in the diagram), mainly due to the numerous electronic devices operating during the start-up. When the power plant reaches a capacity of about 60 kW, the power changes to inductive (presented as negative values in the diagram), which is due to the operation of the synchronous generator. The changes in the importance of reactive power directly impact the values of the power factor occurring in the mains. As seen from the waveform presented in Figure 9, during the operation of the wind turbine, the power factor is close to 0 (the required value <0.4). Significant deviations of its value can only be observed during the power plant start-up, with the sign of the value reflecting the inductive or capacitive nature of the power, as in the reactive power description. With the above in mind, it can be concluded that the power plant does not generate excess reactive power so that its impact on the capacity of the supply line is negligibly small.
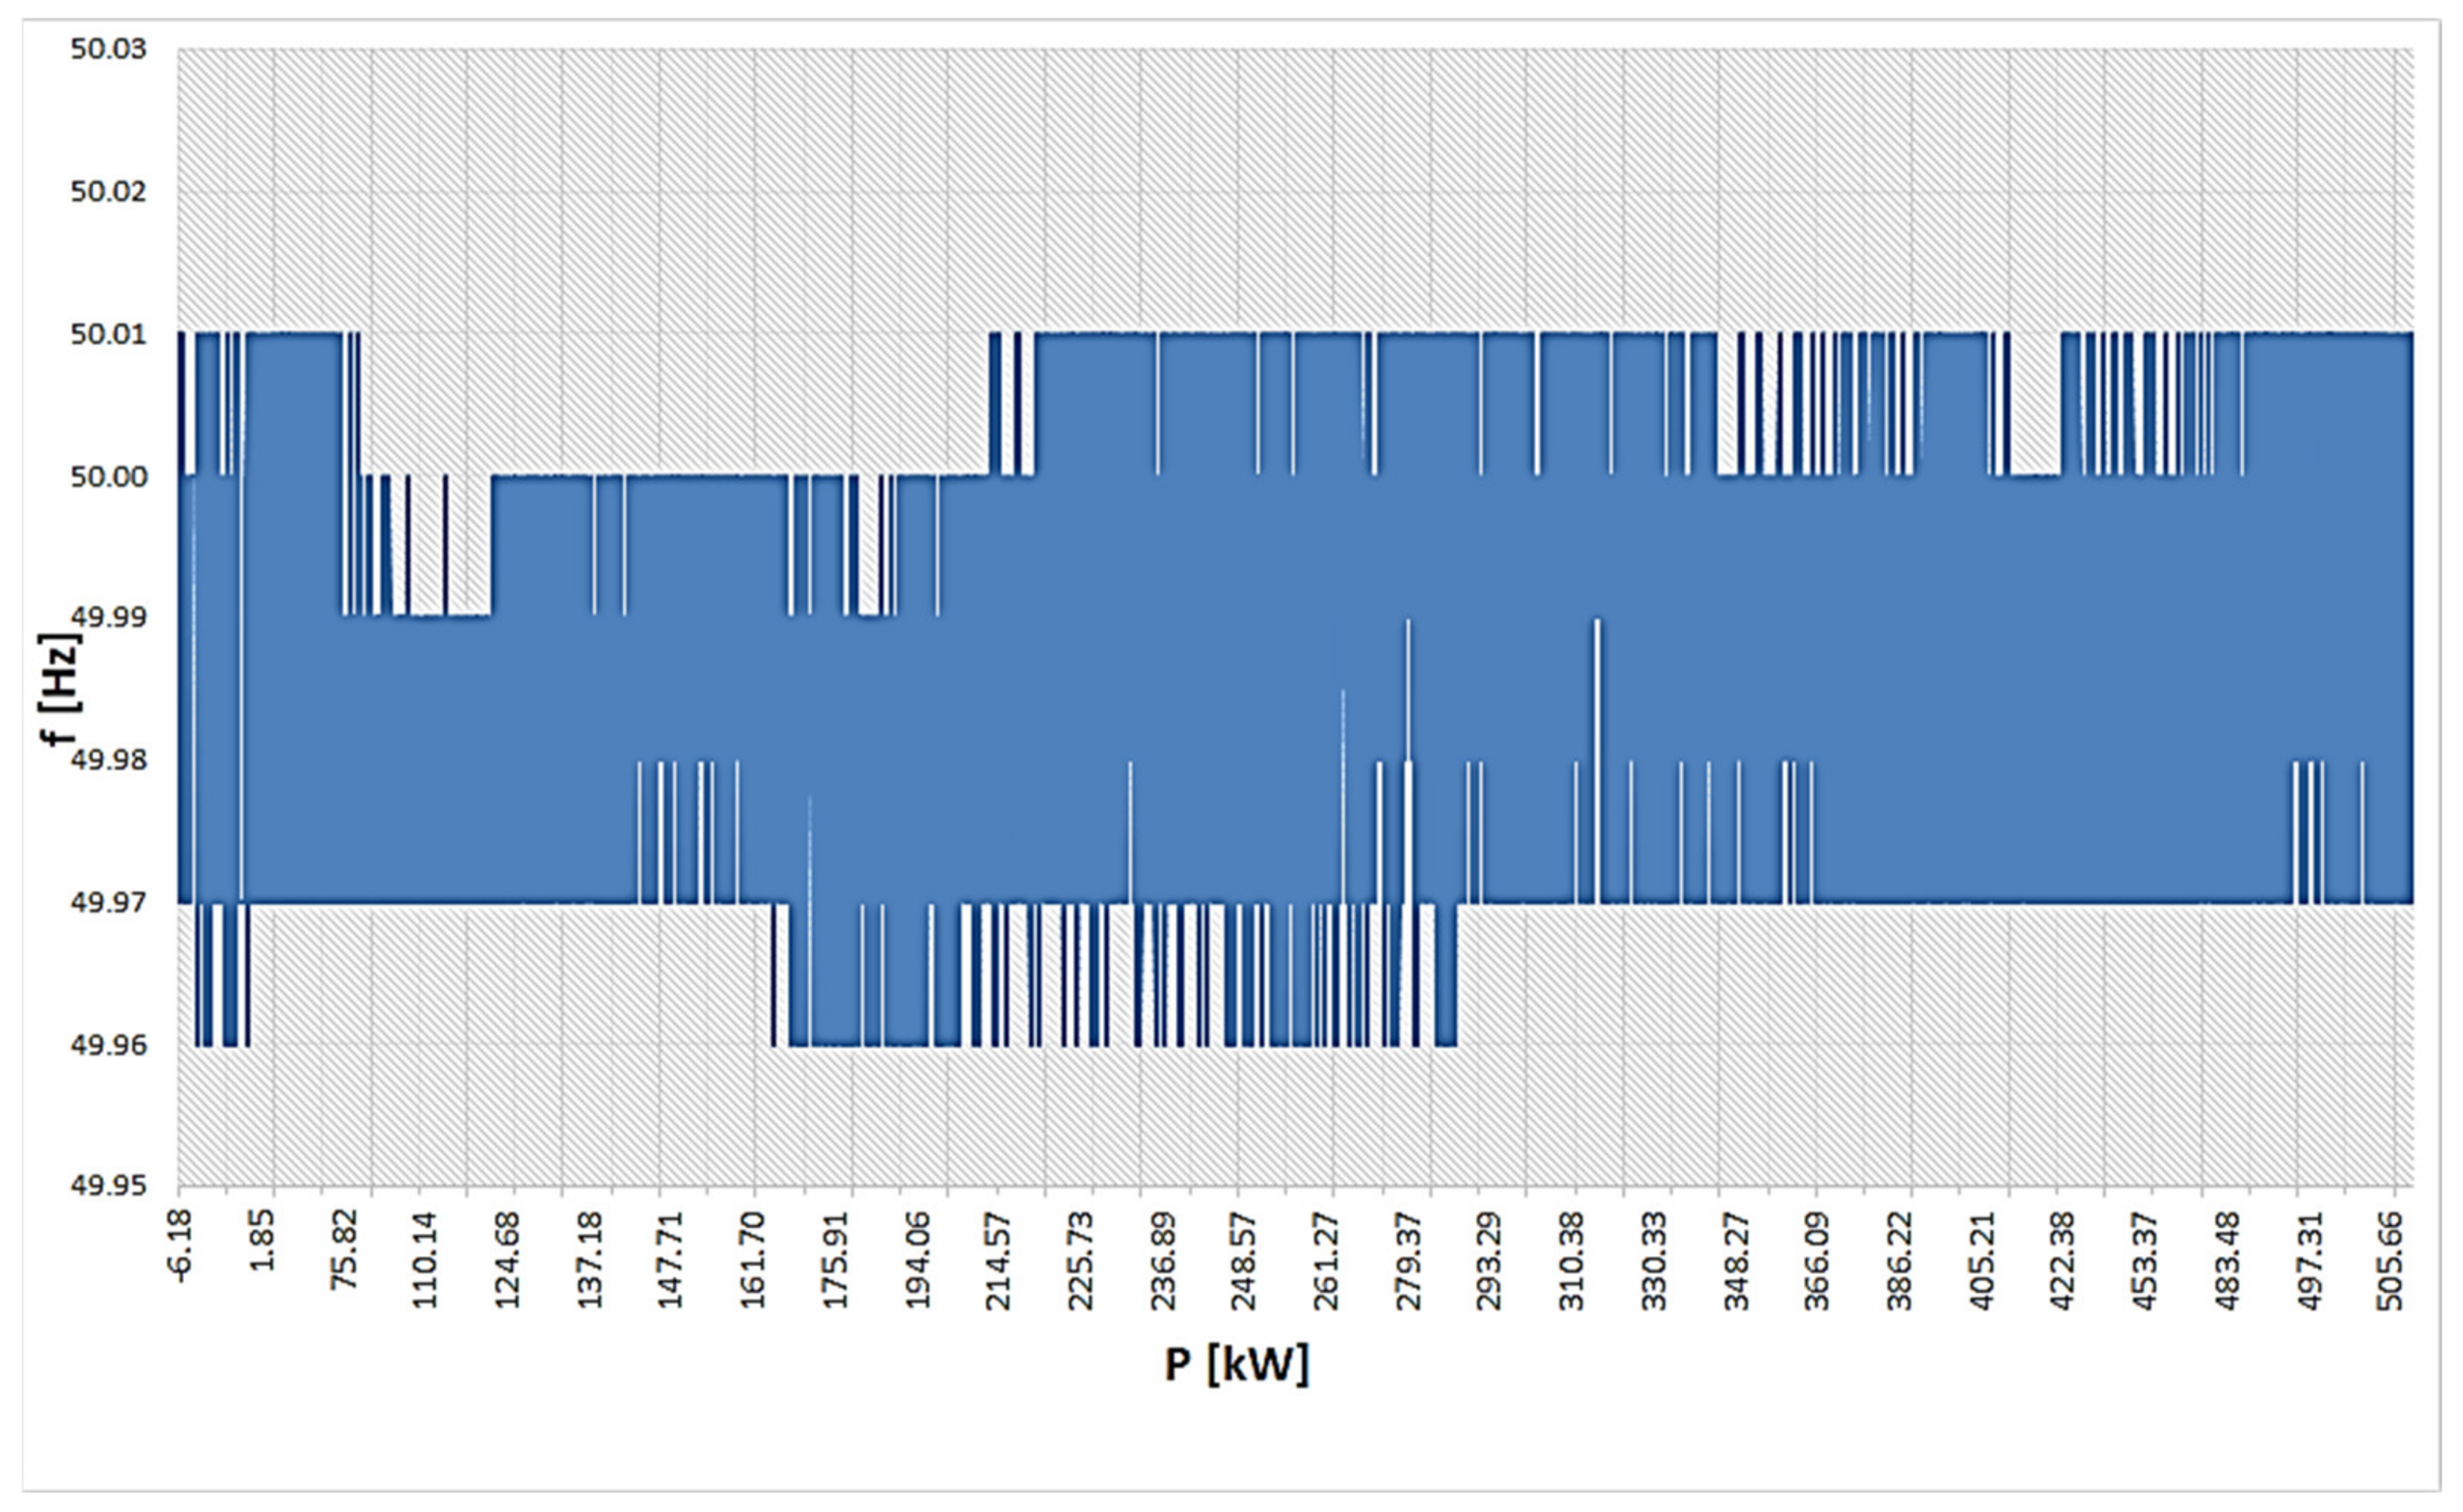
The frequency of the supply voltage is also an essential parameter of the network. Therefore, the verification of the impact of the wind power plant operation on the value of the frequency of the supply voltage to the analyzed farm was conducted. As can be seen from the waveform presented in Figure 10, changes in the power generated at the source do not directly translate into the variability of the frequency value in the network. Therefore, the frequency deviations recorded during the power plant operation do not differ significantly from the deviations occurring when the power plant was not operating. They are also within regulatory limits (50 Hz ± 1%). The analyzed wind turbine has too little power in relation to the short-circuit power of the power system analyzed, so it cannot significantly influence the voltage frequency changes. The observed frequency changes are the result of changes in operating states occurring within the power system.
The recorded variation of the total voltage distortion factor is shown in Figure 11. There is a large variation of THDu during the wind turbine operation, but its stabilization is noticeable when the generated power is close to the rated power of the source. As can be seen from the comparison of the recorded average values of the THD coefficient (Table 2), the operation of the power plant does not significantly affect the deformation of the voltage occurring in the power network, but in most phases, it causes a slight reduction in its value. During operation and at the standstill of the wind turbine, the recorded THDu values are well below the regulatory requirement of 4%.
A detailed comparison of average values of voltage harmonics recorded during the measurements and occurring in the voltage supplying the analyzed farm (expressed as a percentage of the fundamental harmonic) and the increase of these values resulting from the operation of the wind power plant is presented in Table 3. The analysis of the values presented there shows that the operation of the wind power plant influences a quite significant reduction of harmonics of the order 3, 7, 9, and 13 (even by 0.25%), which usually have the highest values in systems supplying consumers. On the other hand, unfortunately, the operation of the power plant contributes to an increase in the values of the other harmonic orders. All recorded values of individual voltage harmonics are lower than the values required by regulations (Table 4). The highest value is assumed by the 5th harmonic (about 2%). It can result from the occurrence of devices with a 6-pulse power supply among the network loads. Switching-mode power supplies are a component of most modern electronic devices. A characteristic feature of these devices is that they draw current from the mains in pulses (not a continuous load). These pulses contain large amounts of the fifth harmonic. However, this harmonic is also within limits specified by the regulations (≤5%).

4. Conclusions

The conducted field research shows that wind turbines operating near farms do not influence the voltage supply parameters. All measured parameters were within limits allowed by the current regulations—Table 5. The registered maximum value of fast voltage changes was about 2% of the rated voltage and was close to the acceptable value (2.5%). Such a change can be interpreted by devices sensitive to voltage fluctuations (such as automatic milking machines) as a voltage collapse, and they switch off. This would confirm the situation observed in the farm analysed.
However, along with an increase in power generated at the source, the voltage value in the power grid increases. In extreme cases, this can lead to exceeding the voltage limits at the customer’s point of connection. Furthermore, the variability of the power generated in the power plant (resulting from the variability of the wind speed) also causes voltage fluctuations. The most dangerous (from the customer’s point of view) are sudden shutdowns of power plants (caused, for example, by a transient ground fault). This is because they cause significant voltage changes in the network, resulting in incorrect operation of sensitive devices, e.g., power electronics (in extreme cases causing their deactivation or damage). These effects increase with the increase of switching on/off generation power. The solution to this problem may be using control systems in the wind power plant, regulating the power gradient in a given time unit. In addition to the dangers of voltage fluctuations, the operation of a wind turbine reduces the contribution of some of the higher voltage harmonics. This may very well affect loads installed on a neighboring farm, especially the power electronics controlling rotating machinery.
Summing up the conducted research, special attention should be paid to the construction of farms in the direct vicinity of wind power plants where consumers sensitive to rapid voltage changes are to be installed. In such cases, it may be necessary to install voltage stabilizers, which is a very costly solution.

Author Contributions

Conceptualization, Z.S.; methodology, Z.S.; software, Z.S. and M.T.; validation, Z.S., M.T. and W.R.; formal analysis, Z.S. and M.T.; investigation, Z.S. and M.T.; resources, Z.S. and M.T.; data curation, Z.S. and M.T. and A.B.; writing—original draft preparation, Z.S., A.B. and W.R.; writing—review and editing, Z.S., A.B. and W.R.; visualization, Z.S. and A.B.; supervision, A.B. and W.R.; project administration, A.B.; funding acquisition, Z.S. and A.B. All authors have read and agreed to the published version of the manuscript.

Funding

This research received no external funding.

Institutional Review Board Statement

Not applicable.

Informed Consent Statement

Not applicable.

Data Availability Statement

Not applicable.

Conflicts of Interest

The authors declare no conflict of interest.

References

  1. Wang, J.; Song, Y.; Liu, F.; Hou, R. Analysis and application of forecasting models in wind power integration: A review of multi-step-ahead wind speed forecasting models. Renew. Sustain. Energy Rev. 2016, 60, 960–981. [Google Scholar] [CrossRef]
  2. Herrería-Alonso, S.; Suárez-González, A.; Rodríguez-Pérez, M.; Rodríguez-Rubio, R.F.; López-García, C. Efficient wind speed forecasting for resource-constrained sensor devices. Sensors 2021, 21, 983. [Google Scholar] [CrossRef]
  3. Taleb, H.M.; Abu Hijleh, B. Optimizing the power generation of a wind farm in low wind speed regions. Sustainability 2021, 13, 5110. [Google Scholar] [CrossRef]
  4. Bokde, N.D.; Tranberg, B.; Andresen, G.B. Short-term CO2 emissions forecasting based on decomposition approaches and its impact on electricity market scheduling. Appl. Energy 2021, 281, 116061. [Google Scholar] [CrossRef]
  5. Bokde, N.; Tranberg, B.; Andresen, G.B. A graphical approach to carbon-efficient spot market scheduling for power-to-X applications. Energy Convers. Manag. 2020, 224, 113461. [Google Scholar] [CrossRef]
  6. García-Sánchez, T.; Mishra, A.K.; Hurtado-Pérez, E.; Puché-Panadero, R.; Fernández-Guillamón, A. A controller for optimum electrical power extraction from a small grid-interconnected wind turbine. Energies 2020, 13, 5809. [Google Scholar] [CrossRef]
  7. Luo, Z.; Sun, Z.; Ma, F.; Qin, Y.; Ma, S. Power optimization for wind turbines based on stacking model and pitch angle adjustment. Energies 2020, 13, 4158. [Google Scholar] [CrossRef]
  8. Peste, F.; Paula, A.; Da Silva, L.P.; Bernardino, J.; Pereira, P.; Mascarenhas, M.; Costa, H.; Vieira, J.; Bastos, C.; Fonseca, C.; et al. How to mitigate impacts of wind farms on bats? A review of potential conservation measures in the European context. Environ. Impact Assess. Rev. 2015, 51, 10–22. [Google Scholar] [CrossRef]
  9. Chen, Z.; Wang, X.; Kang, S. Effect of the coupled pitch-yaw motion on the unsteady aerodynamic performance and structural response of a floating offshore wind turbine. Processes 2021, 9, 290. [Google Scholar] [CrossRef]
  10. Energy Regulatory Office. Installed Capacity [MW], as at 31.12.2020. Available online: https://www.ure.gov.pl/pl/oze/potencjal-krajowy-oze/5753,Moc-zainstalowana-MW.html (accessed on 7 May 2021).
  11. Igliński, B.; Iglińska, A.; Koziński, G.; Skrzatek, M.; Buczkowski, R. Wind energy in Poland-history, current state, surveys, renewable energy sources Act, SWOT analysis. Renew. Sustain. Energy Rev. 2016, 64, 19–33. [Google Scholar] [CrossRef]
  12. PSE Capital Group. Available online: https://www.pse.pl/ (accessed on 20 April 2021).
  13. Wiśniewski, G. Determination of the Energy Potential Polish Regions in terms of Renewable Sources of Energy-Lessons for Regional Operational Programmes for the Period 2014-2020 Programming Evaluation; Ministry of Regional Development: Warsaw, Poland, 2011. [Google Scholar]
  14. Pietrzak, M.B.; Igliński, B.; Kujawski, W.; Iwański, P. Energy transition in Poland-assessment of the renewable energy sector. Energies 2021, 14, 2046. [Google Scholar] [CrossRef]
  15. Central Statistical Office, Renewable Energy in 2016. Available online: https://stat.gov.pl/obszary-tematyczne/srodowisko-energia/energia/energia-ze-zrodel-odnawialnych-w-2016-roku,3,11.html (accessed on 24 June 2021).
  16. Central Statistical Office, Renewable Energy in 2017. Available online: https://stat.gov.pl/obszary-tematyczne/srodowisko-energia/energia/energia-ze-zrodel-odnawialnych-w-2017-roku,10,1.html (accessed on 24 June 2021).
  17. Data from the Marshal’s Office of Podlaskie Voivodeship.
  18. Ministry of Climate and Environment. Energy Policy of Poland until 2024; Ministry of Climate and Environment: Warsaw, Poland, 2021.
  19. Eriksen, P.B.; Ackermann, T.; Abildgaard, H.; Smith, P.; Winter, W.; Garcia, J.R. System operation with high wind penetration. IEEE Power Energy Mag. 2005, 3, 65–74. [Google Scholar] [CrossRef]
  20. Magdy, G.; Shabib, G.; Elbaset, A.A.; Mitani, Y. A Novel coordination scheme of virtual inertia control and digital protection for microgrid dynamic security considering high renewable energy penetration. IET Renew. Power Gener. 2019, 13, 462–474. [Google Scholar] [CrossRef]
  21. Blaabjerg, F.; Yang, Y.; Yang, D.; Wang, X. Distributed power-generation systems and protection. Proc. IEEE 2017, 105, 1311–1331. [Google Scholar] [CrossRef] [Green Version]
  22. Kundur, P. Definition and classification of power system stability IEEE/CIGRE joint task force on stability terms and definitions. IEEE Trans. Power Syst. 2004, 19, 1387–1401. [Google Scholar] [CrossRef]
  23. Zhou, M.; Zhai, J.; Li, G.; Ren, J. Distributed dispatch approach for bulk AC/DC hybrid systems with high wind power penetration. IEEE Trans. Power Syst. 2018, 33, 3325–3336. [Google Scholar] [CrossRef]
  24. Blaabjerg, F.; Teodorescu, R.; Liserre, M.; Timbus, A.V. Overview of control and grid synchronization for distributed power generation systems. IEEE Trans. Ind. Electron. 2006, 53, 1398–1409. [Google Scholar] [CrossRef] [Green Version]
  25. Oliveira, W.D.; Vieira, J.P.; Bezerra, U.H.; Martins, D.A.; Rodrigues, B.D.G. Power system security assessment for multiple contingencies using multiway decision tree. Electr. Power Syst. Res. 2017, 148, 264–272. [Google Scholar] [CrossRef]
  26. Ebrahimzadeh, E.; Blaabjerg, F.; Wang, X.; Bak, C.L.; Lund, T.; Andersen, G.K.; Suárez, C.G.; Berg, J.J. Small Signal Modeling of Wind Farms. In Proceedings of the 2017 IEEE Energy Conversion Congress and Exposition (ECCE), Cincinnati, OH, USA, 1–5 October 2017; pp. 3710–3716. [Google Scholar] [CrossRef]
  27. Shakerighadi, B.; Ebrahimzadeh, E.; Blaabjerg, F.; Leth Bak, C. Large-signal stability modeling for the grid-connected VSC based on the Lyapunov method. Energies 2018, 11, 2533. [Google Scholar] [CrossRef] [Green Version]
  28. Yan, R.; Saha, T.K. Frequency response estimation method for high wind penetration considering wind turbine frequency support functions. IET Renew. Power Gener. 2015, 9, 775–782. [Google Scholar] [CrossRef]
  29. Magdy, G.; Shabib, G.; Elbaset, A.A.; Kerdphol, T.; Qudaih, Y.; Bevrani, H.; Mitani, Y. A novel design of decentralized lfc to enhance frequency stability of Egypt power system including wind farms. Int. J. Energy Convers. 2018, 6, 17–29. [Google Scholar] [CrossRef] [Green Version]
  30. Gonzalez-longatt, F.; Chikuni, E.; Rashayi, E. Effects of the Synthesis Inertia from Wind Power on the Total System Inertia after a Frequency Distrurbance. In Proceedings of the 2013 IEEE International Conference on Industrial Technology (ICIT), Cape Town, South Africa, 25–28 February 2013; pp. 826–832. [Google Scholar]
  31. Zhang, L.; Harnefors, L.; Nee, H.P. Power-synchronization control of grid-connected voltage-source converters. IEEE Trans. Power Syst. 2010, 25, 809–820. [Google Scholar] [CrossRef]
  32. Hu, Q.; Fu, L.; Ma, F.; Ji, F. Large signal synchronizing instability of PLL-based VSC connected to weak AC grid. IEEE Trans. Power Syst. 2019, 34, 3220–3229. [Google Scholar] [CrossRef]
  33. Renedo, J.; Garcı, A.; Rouco, L. Active power control strategies for transient stability enhancement of AC/DC grids with VSC-HVDC multi-terminal systems. IEEE Trans. Power Syst. 2016, 31, 4595–4604. [Google Scholar] [CrossRef]
  34. Lu, Y.; Tomsovic, K. Wide area hierarchical voltage control to improve security margin for systems with high wind penetration. IEEE Trans. Power Syst. 2018, 33, 6218–6228. [Google Scholar] [CrossRef]
  35. Arava, V.N.; Vanfretti, L. Analyzing the static security functions of a power system dynamic security assessment toolbox. Int. J. Electr. Power Energy Syst. 2018, 101, 323–330. [Google Scholar] [CrossRef]
  36. Sanchez, S.; Garces, A.; Bergna-Diaz, G.; Tedeschi, E. Dynamics and stability of meshed multiterminal hvdc networks. IEEE Trans. Power Syst. 2018, 34, 1824–1833. [Google Scholar] [CrossRef] [Green Version]
  37. Suproniuk, M.; Skibko, Z.; Stachno, A. Diagnostics of selected parameters of electricity produced in wind power plants. Electrotech. Rev. 2019, 11, 133–135. [Google Scholar] [CrossRef]
  38. Shakerighadi, B.; Peyghami, S.; Ebrahimzadeh, E.; Blaabjerg, F.; Bak, C.L. Security Analysis of Power Electronic-based Power Systems. In Proceedings of the IECON 2019-45th Annual Conference of the IEEE Industrial Electronics Society, Lisbon, Portugal, 14–17 October 2019; Volume 1, pp. 4933–4937. [Google Scholar] [CrossRef]
  39. Bahrami, S.; Amini, M.H.; Shafie-Khah, M.; Catalao, J.P. A decentralized renewable generation management and demand response in power distribution networks. IEEE Trans. Sustain. Energy 2018, 9, 1783–1797. [Google Scholar] [CrossRef]
  40. Quiroga, G.A.; Kagan, H.; Amasifen, J.C.C.; Almeida, C.F.M.; Kagan, N.; Vicentini, E. Study of the Distributed Generation Impact on Distributed Networks, Focused on Quality of Power. In Proceedings of the 2016 17th International Conference on Harmonics and Quality of Power (ICHQP), Belo Horizonte, Brazil, 16–19 October 2016; pp. 855–860. [Google Scholar] [CrossRef]
  41. Kroposki, B.; Johnson, B.; Zhang, Y.; Gevorgian, V.; Denholm, P.; Hodge, B.-M.; Hannegan, B. Operating electric power systems with extremely high levels of variable renewable energy. IEEE Power Energy Mag. 2017, 15, 61–73. [Google Scholar] [CrossRef]
  42. Distribution Grid Operation and Maintenance Manual; PGE Dystrybucja S.A., Lublin: Lublin, Poland, 2013; (as amended).
  43. Regulation of the Minister of Economy of 4 May 2007 on Detailed Conditions for the Operation of the Power System—Journal of Laws No. 93, Item 623 of 2007. Available online: http://isap.sejm.gov.pl/isap.nsf/DocDetails.xsp?id=wdu20070930623 (accessed on 24 June 2021).
  44. PN-EN 50160: 2010 Parameters of the Supply Voltage in Public Distribution Networks. Available online: https://sklep.pkn.pl/pn-en-50160-2010p.html (accessed on 24 June 2021).
  45. Hołdyński, G.; Skibko, Z. Analysis of Deformations of Currents and Voltages in MV Field Power Grids. Przegląd Elektrotechniczny Nr. 7, July 2011 r. str. 130–135. Available online: https://sigma-not.pl/publikacja-60808-analiza-odkszta%C5%82ce%C5%84-prad%C3%B3w-i-napi%C4%99%C4%87-w-terenowych-sieciach-elektroenergetycznych-%C5%9Bredniego-napi%C4%99cia-przeglad-elektrotechniczny-2011-7.html (accessed on 24 June 2021).
  46. Commission Regulation (EU) 2016/631 of 14 April 2016 Establishing a Network Code, Concerning Requirements for the Connection of Generating Units to the Network. Available online: https://eur-lex.europa.eu/legal-content/PL/TXT/PDF/?uri=CELEX:32016R0631&from=CS (accessed on 24 June 2021).
Figure 1. The percentage share of wind energy in national total electricity production [15,16].
Sustainability 13 07279 g001
Figure 2. Installed capacity by type of renewable energy sources in Podlaskie Province, as of 31 March 2019 [17].
Sustainability 13 07279 g002
Figure 3. Diagram of the analysed network with marked measurement points. AFL—steel-aluminum line, MPP—Main Power Point.
Sustainability 13 07279 g003
Figure 4. The recorded course of the variability of active three-phase power (P) generated in ENERCON E40 power plant.
Sustainability 13 07279 g004
Figure 5. The recorded course of variation of the value of the phase-to-phase voltage (U) supplying the farm.
Sustainability 13 07279 g005
Figure 6. The course of variation of the voltage value (U) as a function of the active power (P) generated in the power plant.
Sustainability 13 07279 g006
Figure 7. The recorded course of the variability of three-phase reactive power (Q) generated by the wind power plant.
Sustainability 13 07279 g007
Figure 8. The course of variation of the reactive power (Q) value as a function of the active power (P) generated in the power plant.
Sustainability 13 07279 g008
Figure 9. The course of variation of the value of the power factor (tgϕ) as a function of the active power (P) generated in the power plant.
Sustainability 13 07279 g009
Figure 10. The course of variation of the voltage frequency value (f) as a function of active power (P) generated in the power plant.
Sustainability 13 07279 g010
Figure 11. The course of variation of the THDu coefficient value as a function of active power (P) generated in the power plant.
Sustainability 13 07279 g011
Table 1. Impact of the wind turbine on-farm supply voltage values.
Measured ValueVoltage
Phase L1-2Phase L2-3Phase L3-1
Voltage Values at the Disconnected Wind Power Plant
[kV][kV][kV]
Average15.01314.97214.932
Minimum14.98514.94514.911
Maximum15.03714.99714.963
Voltage values during wind turbine operation
[kV][kV][kV]
Average15.24315.20715.174
Minimum15.20415.16915.137
Maximum15.27515.24315.210
Voltage variations due to switching on/off of the wind power plant
[%][%][%]
Average1.5081.5491.592
Minimum1.0981.1341.150
Maximum1.8991.9551.966
Table 2. Comparison of average values of THDu coefficient recorded during operation and standstill of a wind power plant.
Recorded ValueTHDuL1THDuL2THDuL3
[%][%][%]
The average value of the total voltage distortion factor during standstill of a wind power plant2.0212.0312.068
The average value of the total voltage distortion factor during wind turbine operation1.9732.0322.050
The average value of the increase of the total voltage distortion factor caused by the operation of the wind power plant-0.0480.001-0.018
Table 3. Comparison of average values of particular voltage harmonics recorded during standstill and operation of the power plant as well as the increase in harmonic values resulting from the operation of the wind power plant.
Government
Harmonic
No Wind Power PlantOperation of a Wind Power PlantVoltage Harmonic Gain Caused by the Operation of a Wind Power Plant
L1L2L3L1L2L3L1L2L3
[%][%][%][%][%][%][%][%][%]
12345678910
20.0200.0190.0140.0140.0150.013−0.0057−0.0038−0.0006
30.2550.3600.4290.1360.1490.190−0.1183−0.2105−0.2395
40.0160.0070.0210.0130.0130.025−0.00260.00620.0036
51.9771.9601.9881.9352.0012.006−0.04220.04100.0172
60.0120.0080.0100.0110.0120.014−0.00120.00420.0044
70.2850.3120.3210.1540.1600.155−0.1308−0.1528−0.1669
80.0030.0050.0040.0060.0070.0060.00240.00240.0021
90.0160.0130.0230.0070.0120.008−0.0088−0.0005−0.0153
100.0020.0020.0020.0060.0060.0060.00380.00360.0032
110.0640.0640.0940.0970.1090.1330.03230.04580.0392
120.0030.0040.0020.0080.0080.0080.00590.00420.0055
130.0640.0920.0890.0300.0380.030−0.0343−0.0536−0.0595
140.0020.0020.0020.0090.0100.0100.00660.00730.0081
150.0200.0190.0070.0260.0200.0130.00590.00100.0062
160.0030.0030.0020.0090.0100.0100.00660.00750.0071
170.0520.0370.0430.0440.0440.046−0.00800.00700.0033
180.0020.0020.0010.0100.0090.0100.00850.00710.0083
190.0100.0100.0110.0300.0200.0220.02050.01000.0107
200.0020.0020.0020.0130.0120.0130.01110.00990.0118
210.0050.0110.0110.0180.0170.0190.01210.00590.0082
220.0030.0030.0030.0150.0150.0160.01240.01190.0131
230.0180.0150.0140.0350.0360.0290.01770.02100.0144
240.0060.0060.0070.0200.0180.0200.01360.01210.0136
250.0150.0180.0230.0200.0230.0200.00590.0044−0.0024
260.0030.0030.0030.0230.0230.0220.02010.02020.0192
270.0080.0140.0120.0280.0290.0260.01950.01510.0139
280.0080.0080.0080.0300.0290.0280.02200.02040.0204
290.0100.0120.0110.0400.0400.0360.03050.02770.0254
300.0050.0040.0050.0340.0330.0330.02980.02830.0288
310.0140.0170.0160.0380.0340.0350.02430.01690.0188
320.0050.0050.0060.0410.0400.0410.03600.03440.0347
330.0080.0100.0110.0490.0440.0410.04040.03450.0294
340.0070.0060.0060.0530.0520.0480.04570.04620.0422
350.0120.0120.0120.0630.0600.0590.05070.04750.0473
360.0080.0070.0070.0680.0670.0600.06050.05950.0534
370.0130.0140.0180.0760.0610.0670.06380.04660.0490
380.0090.0080.0090.0740.0700.0710.06520.06220.0624
390.0150.0130.0160.0740.0730.0730.05890.06070.0577
400.0100.0090.0090.0670.0780.0720.05670.06950.0628
410.0160.0150.0120.0820.0910.0940.06640.07670.0819
420.0080.0080.0090.0620.0750.0740.05380.06700.0657
430.0140.0170.0220.0610.0680.0770.04690.05060.0548
440.0070.0070.0080.0570.0640.0630.05020.05670.0554
450.0120.0080.0110.0580.0670.0620.04650.05910.0512
460.0070.0070.0070.0610.0660.0580.05350.05910.0507
470.0100.0100.0090.0650.0700.0650.05500.06000.0562
480.0060.0060.0060.0610.0630.0550.05480.05690.0489
490.0100.0100.0100.0600.0610.0580.04950.05140.0473
500.0060.0070.0070.0570.0600.0530.05040.05300.0457
Table 4. Permissible voltage harmonics [44,46].
Permissible Voltage Harmonics
U2 ≤ 2%U13 ≤ 3%
U3 ≤ 5%U15 ≤ 0.5%
U4 ≤ 1%U17 ≤ 2%
U5 ≤ 6%U19 ≤ 1.5%
U7 ≤ 5%U21 ≤ 0.5%
U9 ≤ 1.5%U23 ≤ 1.5%
U11 ≤ 3.5%U25 ≤ 1.5%
Even U6...24 ≤ 0.5%
Table 5. A compilation of the values recorded during the tests.
ParameterRequired Values in MV NetworksValues Obtained from Tests on MV NetworksRequirements Met?
YES /NO
Value of voltage variation at the connection point during switching operations≤2.5%max 1.966%
(Table 1)
YES
Individual harmonic contentrise of single harmonics of the voltage 1.5%max 0.0819%
(Table 3)
YES
The value of the voltage distortion factor THDincrease
THDU 4%
max 0.001%
(Table 2)
YES
Publisher’s Note: MDPI stays neutral with regard to jurisdictional claims in published maps and institutional affiliations.